Certified Arborist Exam Prep
1. Exam Readiness and Study Workflow
1.1 Understanding The Certified Arborist Exam Scope and Question Formats
A good exam plan starts with knowing what the test is trying to measure. The Certified Arborist exam typically checks whether you can (1) recognize tree conditions, (2) reason from evidence, and (3) choose safe, appropriate actions. That means the “right answer” is usually the one that best fits the scenario, not the one that sounds most confident.
What the Exam Scope Usually Covers
Expect questions that connect tree biology to real urban outcomes. You’ll see topics like tree anatomy, physiology, identification, pests and diseases, abiotic stress, pruning principles, and basic urban forestry practices. The exam also tests professional judgment: when to investigate further, when to recommend a specific intervention, and when a symptom pattern points to a likely cause.
A useful way to think about scope is as a chain:
- Observation: What do you see in leaves, bark, roots, structure, or the site?
- Interpretation: What does that observation suggest about health, function, or risk?
- Decision: What action matches the likely cause and the constraints?
- Verification: What additional evidence would confirm the diagnosis or refine the recommendation?
If you can move through that chain quickly, you’ll handle most question styles.
How Question Formats Test Your Reasoning
Most questions fall into a few predictable formats.
Single best answer questions ask you to choose one option that most accurately matches the scenario. These are often evidence-heavy: the stem includes symptom details, and the correct choice usually requires you to ignore tempting but incomplete clues.
Scenario-based questions present a short field story: a tree location, recent work, weather or irrigation context, and visible symptoms. The test expects you to connect cause and effect. For example, a pattern of dieback limited to one side of the crown after a nearby construction trench suggests a localized root or water issue rather than a whole-tree pathogen.
Matching or prioritization questions ask you to order steps or pair observations with likely explanations. These reward process thinking. If you’re unsure, choose the option that improves evidence quality first, because better evidence reduces the chance of a wrong intervention.
A Practical Example Walkthrough
Stem: A street maple shows thinning leaves and small, chlorotic new growth. The symptoms are strongest near the sidewalk edge where soil has been compacted by repeated foot traffic. No obvious insect feeding is present.
What to do: Start with observation (chlorosis and reduced vigor), then interpret (likely root zone stress), then decide (recommend assessing soil compaction and root health before assuming a nutrient deficiency or disease).
Common distractor: “Apply fertilizer immediately.” Fertilizer can help some nutrient limitations, but compacted soil often limits root function and water movement, so the first action should focus on the root zone condition.
Mind Map: Exam Scope and Question Logic
A Simple Strategy for Answering Faster Without Guessing
- Underline the evidence in the stem: symptom location, timing, and any site details.
- Eliminate “too broad” answers that ignore key constraints in the scenario.
- Prefer the action that reduces uncertainty first. If you can confirm the cause with a safe, logical check, do that before choosing a treatment.
- Watch for cause-and-effect traps. Symptoms often lag behind the trigger, so don’t assume the most recent event is the cause.
Mini Case Study: Choosing the Best Next Step
Stem: A young ornamental tree has bark splitting near the base after a winter freeze-thaw cycle. The split is fresh, and the cambium appears exposed.
Best reasoning: Fresh bark splitting with exposed tissue points to a wound response issue. The best next step is typically to assess extent and stability, then plan management that supports recovery and prevents further injury. Options that jump straight to unrelated pruning goals miss the immediate wound context.
Date Reference for Study Scheduling
If you’re planning a study session, anchor it to a concrete point such as March 15. Use that date to build a routine: one day for biology concepts, one day for diagnosis practice, and one day for management and safety reasoning. The exam rewards consistency, not last-minute heroics.
1.2 Building a Study Plan Aligned to Core Knowledge Domains
A good study plan matches how the exam tests knowledge: it rarely asks for trivia in isolation. Instead, it expects you to connect tree biology, diagnosis, and urban forestry decisions under time pressure. The easiest way to do that is to build your plan around core knowledge domains, then schedule practice that forces those connections.
Step 1: Map Domains to Exam Thinking
Start by treating each domain as a “question generator.” For example, Tree Anatomy doesn’t just mean naming tissues; it means predicting what symptoms you’d see when water transport is compromised. Tree Health and Compartmentalization doesn’t just mean CODIT; it means choosing the most defensible interpretation of wounding and decay indicators.
Use this domain-to-thinking rule:
- Biology domains explain mechanisms.
- Diagnosis domains interpret symptoms.
- Practice domains translate findings into safe, appropriate actions.
Step 2: Build a Weekly Rhythm That Covers All Domains
A common mistake is studying one domain heavily, then hoping the others “stay fresh.” Instead, rotate through domains in a repeating cycle.
A practical weekly rhythm:
- 2 sessions for Biology (anatomy, physiology)
- 2 sessions for Diagnosis (identification, disease, pests, abiotic disorders)
- 1 session for Risk and Operations (structural evaluation, safety, pruning decisions)
- 1 session for Urban Forestry Practices (planting, soil, irrigation, protection)
Each session follows the same internal structure:
- Concept check (15–20 minutes): write a short explanation in your own words.
- Mechanism-to-symptom (25–30 minutes): pick 2–3 symptom patterns and justify the likely cause.
- Exam-style practice (30–40 minutes): answer questions without notes.
- Error log (10 minutes): record what you missed and why.
Step 3: Use a Domain-Specific Error Log
Your error log should be more specific than “I didn’t know.” Use categories that tell you what to fix:
- Misread scenario: you missed a key site detail.
- Mechanism confusion: you knew the term but not the process.
- Symptom mismatch: you associated the wrong cause with the symptom.
- Decision gap: you understood diagnosis but not the best next action.
Example: If you confuse drought stress with nutrient deficiency, your log should note the symptom distribution you overlooked, such as leaf scorch pattern and timing relative to irrigation history.
Step 4: Schedule Practice with Increasing Integration
Early practice should be domain-focused; later practice should be integrated. Integration means the question forces you to use more than one domain in a single decision.
A simple progression:
- Week 1–2: short sets tied to one domain.
- Week 3–4: mixed sets where diagnosis drives a practice choice.
- Final stretch: timed scenarios that combine risk, safety, and diagnosis.
If you’re short on time, prioritize mixed sets over rereading. Your brain needs to practice choosing, not just recognizing.
Step 5: Add Concrete Examples to Lock in Reasoning
When you study, attach each concept to a “what would I see” example.
- Water transport: If a tree shows wilting during hot afternoons but recovers overnight, your study plan should push you to consider root water uptake limits rather than assuming immediate disease.
- Compartmentalization: If a wound is old and callus has formed around the edges, your reasoning should focus on what that suggests about boundary formation, not whether decay is guaranteed.
- Abiotic injury: If leaf burn appears after a recent landscape chemical application, your plan should train you to connect symptom timing and distribution to likely exposure.
These examples become your mental shortcuts during the exam.
Mind Map: Core Knowledge Domains to Study Actions
Example: Turning a Domain into a Scheduled Task
On a diagnosis-focused day, schedule one task like this:
- Choose a symptom set: “branch dieback with localized cankers and leaf discoloration.”
- Write a 5-sentence justification: likely cause category, supporting evidence, what you would check next, and what action is safest.
- Then answer 10 exam-style questions from that same theme.
This keeps your study plan aligned to how the exam rewards reasoning, not just recall.
Step 6: Confirm Coverage Without Overstudying
At the end of each week, do a quick audit:
- Did you practice at least one integrated scenario?
- Did your error log show at least one fix you can apply next week?
- Did every domain get at least one concept check and one practice set?
If a domain is missing, adjust the next week’s rotation rather than adding random extra sessions. Consistency beats intensity, especially when the exam tests connections.
1.3 Using Reference Materials and Maintaining a Field Ready Notes System
Reference materials are only useful if you can reach the right answer fast, in the right format, under real field conditions. A field ready notes system does that by pairing quick lookup with clear evidence capture, so your conclusions are traceable when you review them later.
Foundational Workflow for Reference Use
Start with a simple rule: identify first, then confirm. In practice, you’ll often notice a symptom pattern before you know the cause. Your notes should record what you saw, where you saw it, and what you checked to rule out alternatives.
Use reference materials in three passes:
- Pass One: Confirm the basics. Verify species, growth habit, and site context. If you can’t identify the tree confidently, write what you can: leaf arrangement, bark texture, twig traits, and any distinguishing features.
- Pass Two: Match symptom patterns. Compare observed symptoms to likely categories such as fungal disease, insect damage, nutrient deficiency, or mechanical injury. Don’t force a single label; note the most plausible options.
- Pass Three: Validate with constraints. Check whether the reference’s typical conditions match your site. For example, a disease described as favoring wet, shaded sites should not be your top pick if the tree is in full sun with consistently dry soil.
A good reference habit is to record the exact entry you used. If your notes say “CODIT” but don’t mention the specific concept or diagram you relied on, you’ll waste time later.
Field Ready Notes System Design
Your notes should be usable even if you lose your memory between the morning walk and the afternoon write-up. Aim for consistency and brevity.
What to Capture Every Time
Capture these items for each tree or observation:
- Tree ID and location: street, park section, or landmark plus side of the street.
- Date and time: use a consistent format, such as 2026-02-15.
- Observer and conditions: wind, recent rain, irrigation status if known.
- Observed symptoms: what you see, not what you assume.
- Evidence: photos, measurements, and where you took them.
- Reference used: the title or code of the guide section, plus the key page or figure.
- Working conclusion: the most likely cause and the top alternative.
- Next check: one action that would reduce uncertainty.
How to Keep Notes Fast
Use a template you can fill in quickly. Keep sentences short and avoid rewriting. If you’re taking photos, label them in your notes with a simple mapping like “Photo 1: leaf underside” so you can find the right image later.
A practical example: you see yellowing leaves on a young street tree. Your notes might record “interveinal chlorosis on lower crown, leaf drop present, soil surface compacted near curb, no visible galls.” Then you write “Reference: nutrient deficiency section, page 42, compared to nitrogen deficiency pattern.” Finally, you add “Next check: probe soil moisture at 6–12 in and inspect for root collar issues.”
Maintaining Reference Integrity
References get messy in the field. Prevent that with a few habits.
- Mark the parts you use. Use tabs or bookmarks for the sections you consult most often: identification traits, symptom categories, and diagnostic decision trees.
- Keep one “current” reference set. If you carry multiple editions, note the edition year in your notes once, then stick to it.
- Record uncertainty. If the reference offers multiple similar symptom matches, write the distinguishing feature you checked.
Mind Map: Reference Use and Notes Capture
Example: One Observation, Three Passes
You’re assessing a maple with dieback.
- Pass One (Basics): Notes record “Tree ID M-17, north side of lot, 2026-02-15 10:40. Species likely Acer rubrum based on opposite branching and bark lenticels.” You add “No obvious cankers visible at eye level.”
- Pass Two (Symptoms): Notes record “Flagging in upper crown, small twigs with blackened tips, leaves show marginal browning.” You write “Reference: fungal dieback symptom section, figure 3.”
- Pass Three (Constraints): Notes record “Site is irrigated weekly; soil drains quickly after rain; recent storm with branch rubbing noted.” You conclude “Most likely: dieback associated with twig infection; alternative: mechanical injury from rubbing.” Next check: “Inspect branch unions for abrasion points and look for fruiting bodies on twigs.”
This structure keeps your work grounded: you’re not just naming a problem, you’re showing how the reference and the field evidence connect.
Example: Quick Template for Field Notes
Tree ID:
Location:
Date Time:
Conditions:

Identification Evidence:
-

Symptoms Observed:
-

Distribution and Severity:
-

Evidence Collected:
- Photo labels:
- Measurements:

Reference Used:
- Guide name/section:
- Page or figure:

Working Conclusion:
- Most likely:
- Top alternative:

Next Check:
-
A field ready notes system is less about writing more and more about writing in a way that survives the next tree, the next question, and the inevitable “wait, what did I see?” moment.
1.4 Practice Strategy for Multiple Choice and Scenario Based Questions
Certified arborist exams often mix straightforward recall with “what would you do next?” scenarios. The goal of practice is not just to pick the right letter; it’s to build a repeatable decision process you can run under time pressure.
A Simple Decision Loop for Every Question
Start with a loop you can apply to both multiple choice and scenarios.
- Identify the task: Is the question asking for diagnosis, risk, pruning choice, safety, or best practice?
- Extract the evidence: Note symptom location, pattern, host species clues, and site conditions. In scenarios, evidence is usually distributed across the stem.
- Eliminate mismatches: Remove options that contradict the evidence (wrong symptom pattern, wrong mechanism, wrong timing).
- Choose the most defensible option: If two answers seem plausible, pick the one that best explains the evidence with the fewest assumptions.
- Sanity check: Confirm the answer aligns with arborist principles like CODIT, compartmentalization, and realistic work constraints.
A practical habit: underline the stem’s “because” details. If you can’t explain why an option fits, it’s probably wrong.
Multiple Choice Practice That Builds Speed Without Guessing
Multiple choice rewards disciplined elimination.
- First pass: Answer only after you’ve identified the task and evidence. Don’t read all options first; you’ll start anchoring too early.
- Second pass: If stuck, eliminate by category. For example, if the stem describes progressive dieback from the top, options describing root rot as the primary cause are weaker.
- Time rule: If you’re still unsure after a short window, choose the best remaining option and mark it for review. Re-reading later often reveals a missed detail.
Example: A question describes yellowing leaves starting at the lower canopy, with compacted soil and poor drainage. Options include nitrogen deficiency, iron chlorosis, drought stress, and root suffocation. The evidence points to root-zone stress; nitrogen deficiency is less consistent with the drainage clue. Iron chlorosis can occur in alkaline soils, but the stem emphasizes compaction and drainage.
Scenario Based Questions That Reward Structured Reasoning
Scenario questions are won by organizing information, not by memorizing long lists.
Use a three-layer scan:
- Layer 1: Tree and site: species, age, location, soil moisture, nearby construction, irrigation.
- Layer 2: Symptoms and pattern: distribution (one branch vs whole canopy), progression, timing, presence of fruiting bodies, bark changes.
- Layer 3: Constraints and goals: safety limits, work access, target outcome (reduce risk, restore health, meet clearance).
Then match the scenario to the most likely decision type.
- If the question asks for diagnosis, prioritize symptom pattern and distribution.
- If it asks for risk, prioritize defects, targets, and likelihood.
- If it asks for pruning, prioritize objectives and correct cut placement.
Mind Map: Practice Workflow and Evidence Handling
Example: Scenario Walkthrough with Clear Reasoning
A scenario states: a young street maple shows branch dieback beginning in one side of the crown. The stem base has no obvious girdling roots, but the sidewalk was recently replaced and the root zone was disturbed. Leaves on affected branches are smaller and appear later than expected.
Task identification: This is likely diagnosis and management recommendation.
Evidence extraction:
- Pattern: localized dieback on one side.
- Timing: delayed leaf-out on affected branches.
- Site event: recent root zone disturbance.
Elimination:
- Options describing whole-canopy decline from a systemic nutrient issue are weaker because the pattern is localized.
- Options focusing on a foliar pathogen spread across the canopy are less consistent with the root-zone disturbance clue.
Best defensible choice: The option that links root-zone disturbance to impaired water and nutrient uptake, producing delayed leaf-out and localized dieback, is the most coherent.
Mind Map: How to Choose Between Two Similar Answers

Practice Routine That Sticks
Do short sets, not marathons.
- Set size: 10–15 questions.
- After each set: write one sentence for every missed question: “I missed because I ignored ___ in the stem.”
- Next set: include at least three questions from the same topic area to reinforce the evidence pattern.
This approach turns practice into a feedback loop: evidence first, elimination second, and a final sanity check so you don’t let a tempting option win on vibes.
1.5 Error Review Methods for Improving Accuracy and Speed
Error review is where study time turns into exam performance. The goal is not to feel bad about mistakes; it’s to convert each wrong answer into a specific, testable correction.
The Error Review Loop
Start with a simple loop you can repeat after every practice set:
- Capture what you chose and why.
- Classify the error type.
- Correct the underlying rule or observation.
- Rehearse the corrected decision in a new mini-question.
- Verify with a short timed check.
A common mistake is to jump from “wrong” to “I’ll remember next time.” That’s vague. Your review should produce a concrete rule you can apply under time pressure.
Classify Errors So You Can Fix Them
Use a small set of categories. If you can’t label an error, you can’t target it.
- Knowledge gap: You didn’t know the concept or definition.
- Misread scenario: You missed a key detail like location, season, or symptom distribution.
- Process error: You knew the concept but used the wrong diagnostic order.
- Confusion pair: Two similar options looked alike (for example, drought stress vs. overwatering patterns).
- Overconfidence: You answered quickly without checking the most diagnostic clue.
When you review, write one sentence that names the category and points to the exact clue you ignored or misapplied.
Build a “Decision Rule” Note
For each error, create a short rule that would have changed your answer. Keep it to one line.
Example decision rules:
- “If symptoms are concentrated on one side after construction, prioritize mechanical injury and root zone disruption over systemic nutrient deficiency.”
- “If dieback follows repeated drought cycles and leaf scorch matches sun exposure, treat water stress as primary before chasing secondary pathogens.”
These rules work because they tie to a scenario feature, not a general feeling.
Use a Two-Pass Review for Speed
A two-pass method improves both accuracy and speed.
Pass One: Untimed diagnosis. Re-read the question, underline the most diagnostic clue, and explain the correct answer in your own words. Don’t time this pass.
Pass Two: Timed re-answers. Cover the explanation and answer again with a timer. Your target is not perfection on the second pass; it’s faster correct recognition of the clue.
If you still miss it on pass two, the issue is usually classification or rule-writing, not “not studying enough.”
Mind Map: Error Review Workflow
Mind Map: Turning Mistakes into Rules
Concrete Examples of Review Entries
Example 1: Misread Scenario
- Your wrong choice: “nutrient deficiency”
- Correct answer: “water stress”
- Category: Misread scenario
- Clue you missed: symptom distribution matches sun exposure
- Decision rule: “When scorch aligns with exposure and timing matches dry periods, prioritize water stress over nutrient deficiency.”
Example 2: Confusion Pair
- Your wrong choice: “bacterial leaf spot”
- Correct answer: “fungal leaf spot”
- Category: Confusion pair
- Distinguishing feature: lesion pattern and spread behavior described in the stem
- Decision rule: “Use the stem’s spread and lesion description to separate bacterial vs fungal patterns before guessing.”
Example 3: Process Error
- Your wrong choice: “insect cause”
- Correct answer: “mechanical injury”
- Category: Process error
- What went wrong: you skipped the site context
- Decision rule: “Start with site and injury context; if the stem points to construction or equipment contact, mechanical injury comes first.”
Track Errors Without Letting Them Take Over
Keep a simple tally by category for the last three sets. If one category dominates, your next practice should target that category with shorter, focused questions rather than repeating everything.
A practical target: after review, you should be able to answer the same question again and explain the diagnostic clue in under 15 seconds. If you can’t, your rule is too general or your clue selection is inconsistent.
A Short Practice Routine After Review
End each review session with three quick tasks:
- Pick one error category and write two decision rules.
- Answer one new question from that category untimed.
- Answer one new question from that category timed.
This keeps the loop tight: capture, classify, correct, rehearse, verify—no wandering, no guessing, and no “I’ll just remember.”
2. Tree Anatomy and Growth Processes
2.1 Root System Structure and Function
A tree’s roots are not just “anchors.” They are a coordinated system that (1) takes up water and minerals, (2) stores carbohydrates, (3) communicates with soil microbes, and (4) provides mechanical stability. In exam scenarios, the key is to connect root structure to what you see aboveground: drought stress, nutrient deficiency patterns, and failure risk.
Foundational Layout of Root Systems
Most urban trees fit one of two broad patterns.
- Taproot systems: A dominant primary root grows downward, with lateral roots branching off. This pattern is common in many species and can help access deeper moisture.
- Fibrous systems: Many roots are similar in size and spread outward near the soil surface. These often respond quickly to surface water and can be sensitive to compaction.
Even within these categories, the root system has repeating parts: primary roots, lateral roots, root tips, and root hairs. Root hairs are the “work gloves” for absorption; they are short-lived and depend on soil moisture and oxygen.
Root Zones and What Each Does
A root tip is a busy construction site. As it grows, different zones perform different jobs.
- Zone of cell division: New cells form near the tip.
- Zone of elongation: Cells stretch, pushing the root forward.
- Zone of maturation: Root hairs develop and absorption begins.
- Older root regions: Mostly transport and support; they are less efficient at taking up water.
A practical way to remember this: the farther from the tip, the less “absorbing” the root becomes and the more “moving and holding” it becomes.
Absorption Mechanics and Soil Constraints
Water moves into roots mainly through osmosis and pressure gradients. For that to work, roots need:
- Moisture in soil pores
- Oxygen to support respiration in root tissues
- Contact between root hairs and soil particles
When soil is compacted, pore spaces shrink. The result is less oxygen and slower water movement. In an exam vignette, compacted areas often correlate with canopy thinning, smaller leaves, and early leaf drop—because the root system can’t supply water fast enough.
Root Hairs and the “Short Window” Problem
Root hairs typically last only weeks. If a tree experiences a dry spell, root hairs can die back, reducing uptake even if the soil later becomes moist. That’s why recovery after drought can be slower than expected.
Transport and Storage: Moving Food and Water
Roots do two major transfers.
- Water and mineral transport upward: Minerals dissolve in water and move with the flow.
- Carbohydrate transport and storage: Roots store sugars and starches, especially in the larger structural roots and in fine roots.
Carbohydrates support new root growth and maintenance. If a tree loses too many leaves (for example, from repeated stress), it may reduce root carbohydrate reserves, which then limits future growth and absorption.
Structural Roots, Stability, and Failure Modes
Mechanical stability depends on both root architecture and soil conditions.
- Structural roots anchor the tree and distribute loads.
- Fine roots contribute to absorption and soil binding but are not the main anchors.
In loose, saturated soils, roots may spread but fail to develop deep anchorage. In hard, compacted soils, roots may be forced to grow laterally near the surface, increasing the chance of instability if the surface layer is disturbed.
Example: Sidewalk Damage Pattern
If a tree’s roots are constrained by a sidewalk edge, you may see lifting or cracking near the root flare line. The exam logic is straightforward: the root system is seeking space, and the path of least resistance often becomes the path of damage.
Root Flare and Interface with the Trunk
The root flare is where structural roots meet the trunk. It matters because it influences:
- Oxygen availability near the transition zone
- Stability by distributing forces
- Disease risk when soil is piled too high
Burying the root flare reduces oxygen and can encourage decay at the interface. In diagnosis questions, look for symptom clusters that match poor oxygen conditions: dieback, weak growth, and sometimes fungal fruiting bodies near the flare.
Mind Map: Root System Structure and Function
Integrated Example: Diagnosing a Drought-Like Decline
A street tree shows wilting during hot afternoons, then partial recovery overnight. Leaves are smaller than last season, and the soil around the trunk is hard and dry on top.
- Hard, compacted surface soil reduces oxygen and limits root hair function.
- Limited uptake causes midday water stress.
- Smaller leaves reflect reduced carbohydrate supply and constrained water delivery.
The best answer in an exam-style question usually ties the symptom pattern to root-zone limitations rather than blaming the leaves alone.
Quick Self-Check for Exam Questions
When you see a scenario, ask three questions:
- Where is the limiting factor—water, oxygen, or space?
- Which root zone is affected—tips and root hairs, or older transport roots?
- What aboveground pattern should follow—wilting timing, leaf size, dieback direction, or stability risk?
2.2 Trunk and Stem Anatomy Including Cambium and Vascular Tissues
A tree’s trunk and stems are not just “wood columns.” They are layered systems that transport water and sugars, store reserves, and rebuild tissues after injury. When you understand the layers, many exam questions stop feeling like trivia and start looking like cause-and-effect.
The Trunk as a Layered System
From the outside inward, the trunk typically shows: bark (protective tissues), a living growth layer (cambium), and inner wood (xylem and related tissues). The outer bark is often shed or replaced over time, while the cambium is the engine that produces new tissues year after year.
A helpful way to picture this is to treat the trunk like a set of concentric “rings” with different jobs. Some layers mainly protect, some mainly transport, and some mainly build.
Bark Tissues and Their Roles
Bark is more than “the outside.” It includes:
- Outer bark: mostly dead or aging tissues that reduce water loss and protect against abrasion.
- Inner bark (phloem region): living tissue that transports sugars made in leaves to roots and other non-leaf tissues.
If you’ve ever seen a girdled tree where bark was removed in a band, the key exam idea is that the phloem region is disrupted. Water may still move for a while, but sugar transport fails, and tissues downstream run out of usable carbohydrates.
Cambium and Secondary Growth
The vascular cambium is a thin, living layer that produces new xylem inward and new phloem outward. This is secondary growth, meaning the trunk thickens over time.
Two exam-relevant details:
- Cambium activity is directional: xylem is added toward the inside; phloem toward the outside.
- Cambium produces rings: each growing season can contribute to ring boundaries, though exact “ring timing” varies by species and climate.
When a tree is wounded, cambium can sometimes form protective tissue around the injury. That’s why clean, properly placed pruning cuts matter: they influence how the tree can compartmentalize and rebuild.
Xylem Wood and Water Transport
Xylem conducts water and dissolved minerals from roots to shoots. In most trees, much of the xylem becomes non-living at maturity, but it remains structurally important.
Within xylem, you’ll often see:
- Sapwood: the outer portion of xylem that is typically more active in water transport.
- Heartwood: the inner portion that is often less involved in transport and more focused on structural support and storage of compounds.
A common diagnostic pattern: if a tree shows dieback in the upper crown, one possibility is that water transport is compromised. The exam usually expects you to connect symptoms to transport failure, not just to “disease exists.”
Phloem and Sugar Transport
Phloem moves sugars from sources (often leaves) to sinks (growing tissues, roots, storage organs). This transport is not simply “upward.” It can move in multiple directions depending on where growth and storage demand are highest.
A practical example: in spring, buds and new leaves become strong sinks, so phloem transport shifts to support growth. In autumn, storage demand increases, so sugars move toward roots and storage tissues.
Vascular Rays and Radial Movement
Vascular rays are horizontal structures that help move materials radially across the trunk. They support storage and help distribute substances between inner and outer regions.
This matters for understanding why some injuries or decay patterns don’t behave like a single straight “pipe problem.” Radial connections can influence how far and how quickly resources or damage effects spread.
How Rings, Growth, and Anatomy Interact
Ring width and wood structure reflect growing conditions. Faster growth can produce wider rings, while drought or stress can narrow them. For exam purposes, the key is not memorizing a single “ring equals one cause” rule, but recognizing that growth conditions influence the anatomy you observe.
Mind Map: Trunk and Stem Anatomy
Example: Interpreting a Girdled Branch
Imagine a tree where a strap was left around the trunk for months. The strap compresses and damages the bark. In an exam scenario, the most likely immediate functional failure is phloem disruption. You’d expect reduced sugar delivery to roots and tissues below the girdle, leading to decline in those areas.
Water transport might continue temporarily because xylem is still present, but the tree can’t run the “energy supply chain.” That distinction is often what separates a correct answer from a confident but wrong one.
Example: Pruning Cut Placement and Cambium
Suppose a pruning cut is made too high, leaving a large stub. The cambium and adjacent tissues have a harder time forming protective tissue across the wound margin. A properly placed cut supports better wound response because it preserves the right tissue boundaries for compartmentalization.
In short: cambium is the growth engine, phloem is the sugar highway, and xylem is the water pipeline. When you see symptoms, the anatomy tells you which “system” is most likely failing.
2.3 Buds Leaves and Seasonal Development Patterns
Trees schedule their growth using internal timing plus external cues. Buds are the planning stage: they contain the tissues that will become leaves, shoots, flowers, or both. Leaves then act as the work crew, capturing light, moving water, and producing sugars that fuel the next round of growth.
Bud Types and What They Become
Buds are not all the same. Terminal buds sit at the end of a shoot and often control the direction of growth. Lateral buds appear along the stem and can form side shoots or leaves. Some species also form mixed buds that can produce both leaves and flowers, which matters for diagnosis because flowering can happen without a strong flush of new shoots.
A practical exam-style habit: when you see a symptom, ask whether it could be tied to a bud’s role. For example, if a tree has delayed leaf-out but still forms normal flowers, the issue may be more about leaf bud development timing than about total bud viability.
Bud Dormancy and Seasonal Triggers
Dormancy is a protective pause. During unfavorable conditions, buds reduce growth activity to avoid damage. Many temperate trees require a period of cold to break dormancy, then need warming to resume development. This two-step logic explains why a mild spell in winter may not produce full leaf-out: the buds still need the dormancy requirement to be satisfied.
Leaf-out timing is also influenced by day length and temperature patterns. Day length tends to be more stable than temperature, so it helps the tree “choose” the season, while temperature helps it “choose” the pace.
Leaf Development from Bud Break to Full Canopy
Bud break begins when cells resume division and expansion. The first visible changes often include swelling and then opening of bud scales. As leaves emerge, they expand rapidly, and their internal plumbing must catch up. New leaves need functional veins to move water and nutrients, and they need time to build the photosynthetic machinery.
A common misconception is that leaves are either “on” or “off.” In reality, young leaves are still maturing. Early in the season, a tree may look sparse even though some leaves are already present but not yet fully expanded.
Seasonal Patterns You Can Observe
Different species show different rhythms, but the underlying sequence is consistent: bud swelling, bud break, leaf expansion, then steady growth. In spring, you may see a flush of new shoots followed by gradual hardening of tissues. In summer, leaves are typically fully expanded and stable. In autumn, leaves change color as nutrient movement shifts and chlorophyll breaks down.
For diagnosis, distribution matters. If only the outer crown leafs out normally while the inner crown lags, consider whether light exposure, water stress, or bud viability differs across the crown.
Stress Clues Embedded in Leaf and Bud Behavior
Buds can fail to develop for several reasons, and the pattern helps narrow the cause. If buds swell but do not open, the problem may be tied to conditions after dormancy release. If buds do not swell at all, the issue may involve bud viability or insufficient dormancy fulfillment.
Leaf size and timing are also informative. Small, delayed leaves can indicate limited resources or impaired water transport. Leaf scorch patterns can reflect water stress during hot periods, while uneven leaf-out can reflect localized root zone problems.
Mind Map: Buds Leaves and Seasonal Development
Example: Interpreting Uneven Leaf-Out in a Residential Street Tree
A street tree shows normal leaf-out on the south side but delayed leaf-out on the north side. The first step is to confirm that buds are alive: look for swelling and scale separation. If north-side buds swell but leaves remain small and slow, water availability and root zone conditions are likely contributors, since the north side receives less sun and may stay cooler and wetter, affecting how quickly buds proceed. If north-side buds show little swelling, bud viability or a deeper dormancy-related issue becomes more likely.
Example: Bud Failure After a Late Cold Snap
After a late cold snap, a tree has leaves that emerge but are distorted and uneven in expansion. Buds may have broken dormancy, then experienced damage during the vulnerable expansion stage. In this scenario, you would expect the timing to be “late but not absent,” because the buds started the process before the cold event.
Example: Flowering Without Strong Leaf Flush
A tree produces flowers normally but leaf-out is weak. This can happen when mixed buds prioritize flowering or when leaf buds are less able to expand due to limited water transport. During inspection, compare the vigor of current-year shoots and check whether the leaf area is reduced across the crown or concentrated in certain branches.
Quick Exam Logic for Bud and Leaf Questions
When a question describes seasonal development, translate it into a sequence: dormancy status, bud viability, bud break timing, and leaf expansion quality. Then match the described pattern to the most likely stage that failed. Trees are consistent planners; your job is to identify which step in the plan went off schedule.
2.4 Tree Architecture and Crown Form Principles
Tree architecture is the “built plan” of a tree: how branches are arranged, how the crown occupies space, and how growth patterns respond to light, space, and stress. Crown form principles help you predict what you’ll see in the field and why it matters for diagnosis, pruning decisions, and risk evaluation.
Crown Form Basics from Structure to Function
A crown is not just a shape; it’s a working system for light capture and mechanical stability. Three foundational ideas guide most exam answers.
First, growth follows available light. When one side receives more light, that side typically develops longer shoots and larger leaves, shifting the crown’s balance.
Second, branch structure reflects how the tree built it over time. Branches originate from buds and grow through repeated cycles of extension and branching, so the crown’s “pattern” often reveals past conditions.
Third, space constraints shape form. Trees in tight planting beds often develop narrower crowns, smaller branch angles, and more frequent pruning-like self-thinning.
Crown Architecture Components You Must Recognize
To describe crown form precisely, use a consistent set of terms.
- Leader and co-dominant stems: Many trees have a main leader; some develop co-dominant stems that compete for height.
- Branch order and distribution: Primary scaffold branches form the framework; laterals fill in the canopy.
- Branch angle and attachment: Narrow angles can increase the chance of included bark and weak attachment.
- Crown width and height ratio: A tall, narrow crown behaves differently in wind than a broad, low crown.
- Live crown ratio: The proportion of the trunk that carries living branches affects both photosynthesis and structural load paths.
A quick field habit: when you can’t explain the crown shape, start by locating the leader, then identify the scaffold branches, then check whether the crown is evenly distributed or biased to one side.
Growth Patterns That Create Common Crown Forms
Crown form is often described by overall silhouette, but the underlying growth pattern is what you should connect to symptoms.
Upright forms usually have strong apical dominance and a clear leader. They often show fewer co-dominant stems, but they can develop long, heavy laterals if pruning or shading altered development.
Rounded forms typically reflect balanced branching and consistent light distribution. They can still have weak attachments if scaffold branches share narrow angles or if included bark formed during early growth.
Spreading forms often develop from reduced apical dominance or from repeated lateral extension. These crowns may have good light capture but can be sensitive to storm loading if scaffold branches are poorly attached.
Weeping or pendulous forms occur when growth habit favors downward extension. The key exam point is that pendulous shoots can hide structural issues at the attachment points because the visual “weight” appears lower than the actual framework.
Light, Space, and Competition Effects
Crown architecture is a record of competition. In crowded conditions, trees often self-prune: lower branches die back, reducing live crown ratio. In open conditions, trees maintain more uniform crown density.
When light is uneven, you may see:
- a thicker crown on the brighter side,
- longer extension growth toward the light,
- asymmetrical branch angles,
- and a trunk that may lean or subtly shift to balance the crown.
These patterns matter because asymmetry changes load distribution. A tree that “looks fine” can still have higher stress on one side if the crown is heavier there.
Advanced Details: Branch Attachment and Mechanical Implications
Branch attachment is where crown form meets risk and pruning.
- Included bark: When two branches grow with narrow angles and opposing bark layers, the union can be weaker. Crown form may show a V-shape that looks symmetrical, yet the attachment can still be compromised.
- Codominance: Co-dominant stems can create multiple load paths. If the stems are close in diameter and both compete, the tree may develop a crown that is wider at the top, increasing wind leverage.
- Epicormic shoots and scaffold changes: If the crown was reduced or shaded, dormant buds may activate along the trunk. These shoots can create new branches that alter crown density and change how forces transfer through the framework.
Mind Map: Crown Form Principles and What They Mean
Example: Interpreting Crown Form in a Field Scenario
A street tree has a crown that is noticeably wider on the east side. The trunk shows a slight lean toward the west, and the east side has longer, more vigorous shoots.
A systematic interpretation:
- Light bias: The east side likely received more light during key growth periods.
- Asymmetrical extension: Longer shoots on the east side increase crown mass and shift the center of load.
- Mechanical consequence: Even if branch attachments look intact from one angle, the windward side may experience higher bending stress.
- Pruning implication: Any pruning plan should consider restoring balance by reducing weight where extension is excessive, while avoiding cuts that create weak new branch attachments.
Example: Codominant Stems and Crown Shape Clues
Two stems rise from the same general height and form a narrow V. The crown looks broad at the top, with dense foliage on both stems.
What to conclude:
- The crown form suggests codominance, not a single leader.
- The narrow V raises the likelihood of included bark at the union.
- The broad top increases wind leverage, so the crown architecture is directly tied to structural evaluation.
Example: Live Crown Ratio and Self-Pruning
A tree in a shaded alley has a bare trunk for several meters, with foliage concentrated near the top.
What to conclude:
- The crown form indicates self-pruning from low light.
- The reduced live crown ratio means less photosynthetic area on the lower trunk and altered load paths.
- When diagnosing decline, you should separate shading-driven branch loss from disease-driven dieback by checking whether the dieback pattern is uniform and consistent with light exposure.
Summary You Can Use Under Exam Pressure
Describe crown form using components, then connect the shape to drivers like light and space, and finally connect those drivers to structural implications like attachment strength and load distribution. If you can do that in a few sentences, you’re already thinking like an arborist, not just a memorizer.
2.5 Growth Rates and How They Affect Management Decisions
Growth rate is the tree’s pace of change: how quickly it adds wood, expands its crown, and recovers from stress. In exam scenarios, you’re rarely asked to memorize a single “fast” or “slow” label. Instead, you’re expected to connect growth rate to what you can safely do—pruning timing, risk expectations, irrigation needs, and how quickly a tree can respond to injury.
Foundational Concepts of Growth Rate
Growth rate has multiple components. Diameter growth reflects cambial activity and wood production. Height growth reflects leader extension and light capture. Crown growth reflects branch extension and leaf area expansion. A tree can be fast in one component and modest in another, especially when light, water, or root space limits one part of the system.
Season matters. Many trees show a burst of growth during favorable conditions, followed by slower periods when temperatures and water availability drop. That seasonal rhythm affects when symptoms appear and when pruning cuts are most likely to be followed by active compartmentalization.
Site constraints also shape growth. Compacted soil, restricted rooting volume, and frequent drought can reduce growth even if the species is naturally vigorous. In other words, growth rate is part biology, part environment.
How Growth Rate Changes Management Priorities
Fast-growing trees often produce more new wood and more crown expansion per year. That can be good for establishing shade quickly, but it also means more targets for wind loading and more opportunities for weak branch attachments to develop before wood strength catches up. Slow-growing trees may be structurally conservative for longer, but they may also recover more slowly after pruning or injury.
Management decisions should match the tree’s “response time.” A tree that grows quickly can often replace lost foliage sooner, which may reduce the long-term impact of selective pruning. A tree that grows slowly may not regain lost canopy quickly, so pruning objectives must be tighter and more conservative.
Interpreting Growth Rate in the Field
You can estimate growth rate without fancy tools. Look for annual shoot length patterns on current-year twigs, compare branch extension across canopy layers, and note how quickly the crown fills available space. On trunks, you can use visible indicators such as the spacing of growth increments where they’re observable, or infer from the size of recent branch scars and the thickness of new growth.
A practical exam habit: separate “growth that is happening” from “growth that is supposed to happen.” If a tree is small for its age class, you should suspect stress or site limits rather than assume it’s inherently slow.
Growth Rate and Tree Health Signals
Growth rate can be a symptom, not just a trait. Reduced growth over multiple seasons may indicate chronic water limitation, root restriction, or persistent disease pressure. Conversely, sudden spurts can occur after a stressor is removed, such as improved irrigation or reduced competition.
Be careful with leaf size and density. A tree may maintain leaf production while slowing wood growth, or it may increase leaf area while still failing to add strong structure. In diagnosis questions, connect growth rate to symptom distribution: if dieback is concentrated in one side of the crown, growth reduction there is often tied to localized root or light issues.
Growth Rate and Pruning Decisions
Pruning changes the balance between roots and shoots. The more vigorously a tree grows, the more it tends to respond by producing new shoots near cut sites. That response can be useful when you’re training structure, but it can also create dense regrowth that increases shading and can mask developing defects.
For fast-growing trees, pruning plans should anticipate regrowth. Selective thinning that reduces targets without creating large, exposed surfaces can help maintain a stable crown. For slow-growing trees, avoid unnecessary cuts because the canopy may not replace quickly, and the tree may rely more on existing structure for stability.
Timing also matters. Pruning during periods when the tree is actively growing supports faster closure of wounds. If the scenario emphasizes cold winters or drought risk, choose the approach that minimizes stress during the least favorable growth window.
Growth Rate and Risk Expectations
Risk evaluation uses likelihood and consequence, and growth rate influences both. Fast growth can increase the size of defects and targets sooner—cavities may enlarge, branches may extend into targets, and leverage increases as crowns expand. Slow growth can delay target expansion, but defects may still progress through decay or structural weakening.
In exam-style scenarios, translate growth rate into “how quickly the situation changes.” If a tree is rapidly expanding toward a driveway, the consequence may rise faster than you’d expect from a slow-growing species. If a tree is barely growing and showing localized dieback, the likelihood of further decline may be tied to ongoing stress rather than to rapid structural change.
Mind Map: Growth Rate to Management Decisions
Example: Choosing a Pruning Approach Based on Growth Rate
A scenario describes two street trees with similar branch angles. Tree A is fast-growing and has filled its allotted space within a few years; Tree B is slow-growing and remains sparse in the same period. Both show minor deadwood.
For Tree A, the goal is to remove deadwood while limiting large regrowth bursts. Use selective thinning to reduce targets and avoid creating big, exposed surfaces that invite dense shoot production. For Tree B, keep pruning minimal and targeted. The tree may not replace foliage quickly, so you prioritize safety and structural necessity over cosmetic cleanup.
Example: Growth Reduction That Points to Site Problems
An exam vignette notes that a normally vigorous species has smaller-than-expected canopy and shorter annual shoots for two consecutive growing seasons. The symptoms are strongest on the side closest to a compacted sidewalk edge.
The correct management reasoning is to treat reduced growth as a diagnostic clue. The localized pattern suggests root restriction or altered water movement rather than a purely genetic slow-growth trait. Your decision should focus on identifying and correcting the site constraint before assuming the tree is “naturally small.”
3. Tree Physiology and Environmental Interactions
3.1 Photosynthesis Transpiration and Water Transport
Trees run on a simple bargain: they trade water for carbon. Photosynthesis captures carbon dioxide, but it requires stomata to open for gas exchange. Opening stomata increases water loss through transpiration, so water transport must keep up. When it doesn’t, leaves close stomata, growth slows, and symptoms show up in the crown.
Photosynthesis the Carbon Side of the Bargain
Photosynthesis happens mainly in leaf cells with chloroplasts. Light energy drives reactions that convert CO₂ and water into sugars, with oxygen as a byproduct. The key exam idea is that CO₂ enters through stomata, while water is supplied from the roots through the xylem. If stomata close during dry or hot conditions, CO₂ uptake drops even if light is available, so sugar production falls.
A useful way to reason through it is to separate three limits:
- Light limit: if light is low, the machinery can’t run fast.
- CO₂ limit: if stomata are closed, CO₂ supply is low.
- Water limit: if water delivery can’t match transpiration, stomata close and photosynthesis slows.
Transpiration the Water Loss That Powers Transport
Transpiration is water vapor leaving leaf surfaces, mostly through stomata. This loss creates a pull that helps move water upward through the xylem. The pull is driven by differences in water potential: water evaporates from mesophyll cells, those cells lose water, and the gradient draws water from neighboring cells and ultimately from the xylem.
Transpiration rate depends on:
- Stomatal conductance: how open stomata are.
- Vapor pressure deficit: how dry the air is compared to leaf surfaces.
- Wind and leaf boundary layer: moving air removes the humid layer near the leaf.
- Temperature: warmer air increases evaporation.
A practical example: on a sunny, windy afternoon, vapor pressure deficit rises. Even if soil moisture is adequate, the tree may need to reduce stomatal opening to avoid water stress. That reduction lowers CO₂ intake, so photosynthesis may peak earlier in the day and then level off.
Water Transport the Xylem Pathway
Water moves from roots to leaves through xylem vessels and tracheids. The cohesion-tension model explains the upward movement: water molecules stick together (cohesion) and the tension created by transpiration pulls the column upward. Tension can be strong, but it has a downside: if the water column breaks, air enters xylem and forms embolisms.
Trees manage this risk through several mechanisms:
- Stomatal regulation reduces transpiration when conditions are harsh.
- Hydraulic architecture distributes flow and can limit the spread of embolism.
- Refilling processes in some species can restore function after embolism, though not instantly.
In exam scenarios, embolism often shows up as reduced leaf water status, wilting during the hottest part of the day, and recovery at night if the root supply is still functioning.
Linking Leaf Gas Exchange to Whole-Tree Water Status
A tree’s water status is reflected in how leaves behave. When water is plentiful, stomata stay open and photosynthesis proceeds. When water becomes limiting, stomata close, transpiration drops, and photosynthesis slows. This is why two trees with the same species can show different symptoms: one may have deeper roots or better soil structure, while the other faces compaction or poor drainage.
Mind Map: Photosynthesis Transpiration and Water Transport
Example: Midday Wilting That Isn’t Always a Disease
Imagine a street tree that looks fine in the morning, wilts at midday, and recovers by evening. The simplest interpretation is a temporary mismatch between transpiration demand and water supply. If the soil is dry near the root flare or the root zone is compacted, the tree can’t deliver water fast enough under high vapor pressure deficit. The stomata close, reducing transpiration and slowing photosynthesis, but the tree may recover when conditions ease.
To connect this to diagnosis, look for supporting clues:
- Pattern: wilting peaks with heat and sun.
- Recovery: leaves regain turgor after temperatures drop.
- Distribution: stress may be worse on one side if irrigation or soil conditions differ.
Example: Stomatal Closure and Reduced Growth
Consider a young tree with adequate watering but frequent leaf scorch during hot, windy periods. If stomata close too often, CO₂ uptake drops. Even if the tree avoids severe wilting, sugar production may be insufficient for normal growth. Over time, you may see smaller leaves, reduced shoot extension, and a thinner crown. The exam takeaway is that water stress can limit carbon gain even when the tree is not visibly collapsing.
Example: Embolism Clues in Field Scenarios
If a tree shows persistent wilting that does not recover overnight, water transport may be compromised. Embolism can contribute, especially after extended drought or when roots are unable to supply water. In such cases, stomata may remain closed, so transpiration is low but photosynthesis is also low. The crown often shows gradual decline rather than quick recovery.
Quick Check Concepts for the Exam
- Stomata control both CO₂ entry and water loss.
- Transpiration drives the tension that pulls water up xylem.
- Water transport failures can involve embolism, leading to sustained water stress.
- Symptoms often reflect the balance between demand (air and light) and supply (root zone and xylem function).
3.2 Respiration and Energy Use in Trees
Trees run on a two-part energy system: they make sugars through photosynthesis, then they use those sugars through respiration to power growth, repair, and daily maintenance. Exam questions often test whether you can connect symptoms to energy shortages, because many stress responses are really “energy management” problems.
Respiration is the process of breaking down carbohydrates to release usable energy (ATP) and produce carbon dioxide and water. In simple terms, sugars are the fuel, oxygen is the “burning” requirement for most efficient respiration, and the tree converts the released energy into work. That work includes building new cells, maintaining membranes, transporting water and nutrients, and running defense responses.
Foundational Energy Budget
A tree’s energy budget has two competing demands: carbon gain and carbon use. Photosynthesis captures energy from light and stores it as carbohydrates. Respiration spends that stored energy continuously, even when the tree is not actively growing. The key exam idea is that respiration is not optional; it is the cost of staying alive.
A helpful way to picture this is a household ledger. Photosynthesis is income, respiration is bills, and growth is discretionary spending. When conditions reduce income (low light, drought-limited stomata), bills still arrive. The tree then shifts priorities: it may reduce growth, reallocate carbohydrates, or slow repair.
Oxygen and the Limits of Efficient Respiration
Most respiration relies on oxygen. When oxygen is plentiful, the tree can extract more energy per unit of carbohydrate. When oxygen is limited, respiration becomes less efficient and can increase stress. Root-zone problems are classic exam territory because roots are the main interface with soil oxygen.
Easy example: imagine a lawn mower that runs fine on dry fuel but sputters when water gets into the tank. In a similar way, waterlogged soil can reduce oxygen availability around roots, forcing less efficient energy extraction. The result is often reduced root function, which then cascades into reduced water uptake and nutrient delivery.
Carbohydrate Use Across Tissues
Carbohydrates are not stored in one place and used everywhere at once. Trees store reserves in tissues such as roots, stems, and living wood, then mobilize them as needed. Respiration occurs in all living cells, but the intensity varies with tissue type and activity.
Young, actively growing tissues typically have higher energy demand because they are building new cell walls and expanding cells. Leaves also have high demand because they support metabolism and transport. Meanwhile, storage tissues may have lower immediate demand but become crucial during stress.
Exam-friendly reasoning: if a tree is defoliated or leaf area is reduced, the tree’s carbohydrate income drops. Even if stored reserves exist, the tree must still pay respiration bills. Over time, reserves can be depleted, and symptoms like dieback or poor recovery become more likely.
Seasonal Patterns and Energy Allocation
Respiration changes with temperature and with the tree’s seasonal growth cycle. Warmer conditions generally increase respiration rates, meaning the tree spends more energy to maintain itself. During periods when growth is slow, the tree still respire but may rely more on stored carbohydrates.
Easy example: in late fall, many trees reduce growth and shift resources toward storage and survival. If a tree experiences an unexpected warm spell followed by cold stress, it may have “spent” more energy than planned, leaving less reserve for coping.
Stress Physiology as Energy Management
Many abiotic stresses reduce energy availability or increase energy costs. Drought limits water transport, which limits stomatal opening and reduces photosynthesis. Heat can increase respiration demand while also impairing photosynthetic efficiency. Mechanical injury can disrupt transport pathways and force repair.
A practical diagnostic mindset: ask whether the tree is paying higher bills, earning less income, or both. For instance, girdling or severe root damage can reduce carbohydrate movement and water supply, leading to localized decline that often reflects where transport is compromised.
Mind Map: Respiration and Energy Use
Example: Connecting Respiration to Symptoms
A street tree shows thinning canopy and small leaves after a period of saturated soil. The likely chain is: waterlogging reduces soil oxygen around roots, root respiration becomes less efficient, water uptake declines, and leaf function weakens. With reduced leaf activity, carbohydrate income drops. Meanwhile, respiration continues, so the tree spends reserves to keep tissues alive. Over time, the canopy thins because the tree cannot afford full maintenance and growth at the same time.
This is the exam logic in one sentence: respiration is the constant energy cost, and stress changes either the cost, the fuel supply, or both.
3.3 Nutrient Uptake and Translocation
Nutrient uptake is the process of getting ions from soil solution into roots, while translocation is how those nutrients move through the tree to reach the right tissues. In exams, the key is to connect “where the nutrient is” with “what the tree is doing” and “what symptoms follow.”
Foundational Pathways from Soil to Root
Most essential nutrients enter roots as dissolved ions. The soil solution is thin and patchy, so roots rely on both contact and chemistry. Root hairs increase contact area, and the rhizosphere—soil immediately around roots—changes pH and releases compounds that influence ion availability.
Two uptake routes matter:
- Passive uptake follows gradients. If an ion is more concentrated outside the root, it can move inward without energy.
- Active uptake uses transport proteins. This is required when the ion concentration inside the root must be higher than outside, or when the ion is scarce.
A simple example: if a tree is in compacted soil, water movement slows. Even if nutrients are present, less water reaches root hairs, so uptake drops. The symptom pattern often looks like nutrient deficiency even though the soil test might not be dramatic.
Root Uptake Mechanisms and Selectivity
Transport proteins in root cell membranes are selective. They can also be “competitive,” meaning one ion can interfere with another. A classic exam-style scenario is high potassium reducing magnesium uptake, or high ammonium affecting calcium and magnesium balance. The tree doesn’t “choose” nutrients randomly; it follows membrane transport rules.
Root uptake also depends on oxygen. Fine roots need oxygen for respiration, which powers active transport. Waterlogged soils reduce oxygen, so uptake of many nutrients declines. That’s why flooding can cause broad yellowing patterns that resemble deficiencies.
Translocation Through Xylem and Phloem
Once inside, nutrients move in two main systems:
- Xylem transport carries water and dissolved minerals upward from roots to shoots. This movement is driven largely by transpiration pull.
- Phloem transport moves sugars and many nutrients to where they are needed, especially to growing tissues and storage sites. Phloem movement depends on source–sink relationships.
This distinction explains why some deficiencies appear first on older leaves and others on new growth.
Mobility and Symptom Patterns
Nutrients differ in how easily they move within the tree. Highly mobile nutrients can be reallocated from older tissues to younger ones when supply is limited. Less mobile nutrients stay where they were deposited, so symptoms show up where uptake first failed.
A practical example set:
- Mobile nutrients: nitrogen and potassium often show symptoms on older leaves first because the tree can move them to new growth.
- Less mobile nutrients: calcium and boron often show symptoms on new leaves, tips, and growing points because they don’t travel well once incorporated.
In diagnosis, you can treat symptom location like a clue about mobility. If the newest leaves are chlorotic while older leaves look relatively normal, think less-mobile nutrient issues or local root problems affecting supply to growing points.
Water Flow, Transpiration, and Nutrient Delivery
Because xylem movement is tied to water movement, nutrient delivery is not just about soil chemistry. It’s also about transpiration rate and root water uptake.
Consider a hot, windy day: transpiration increases, pulling more water through xylem. If roots can supply water, nutrient delivery rises too. If roots are stressed—dry soil, root damage, or poor drainage—transpiration continues but uptake can’t keep up. The result is nutrient “starvation” in the canopy even when soil nutrients exist.
Rhizosphere Interactions and Soil Factors
Nutrient availability in soil depends on pH, organic matter, texture, and moisture. For instance, iron availability decreases in high pH soils, which can lead to chlorosis in young leaves. Phosphorus can become less available when soils bind it to minerals, especially under certain pH and moisture conditions.
A useful exam habit: when you see a deficiency-like symptom, ask whether the limiting factor is availability (nutrient chemistry in soil) or access (water movement and root uptake). The symptom pattern plus site conditions usually points to the more likely bottleneck.
Mind Map: Nutrient Uptake and Translocation
Example: Connecting a Scenario to Mechanism
A street tree shows tip dieback and chlorosis on the newest leaves after a period of construction where the root zone was compacted and frequently driven over. Compaction reduces pore space, lowering oxygen and slowing water movement. Root uptake declines, and because xylem delivery to actively growing tips depends on both water flow and mineral uptake, the newest tissues show symptoms first. The pattern fits a less-mobile nutrient or a delivery failure affecting nutrients needed at the growing points.
Example: Another Scenario with a Different Clue
A mature tree has yellowing on older leaves while new leaves remain greener. If the site is dry and the tree is shedding older foliage, the pattern suggests a mobile nutrient limitation. Under drought, xylem flow can drop when roots can’t supply water, and the tree may reallocate available nutrients to new growth through phloem, leaving older leaves to show deficiency first.
Quick Check for Exam Questions
When you answer a nutrient question, pair three facts:
- Where symptoms appear on the canopy.
- Whether the nutrient is mobile within the tree.
- What site factor limits uptake or delivery such as oxygen, water movement, or soil availability.
That combination turns “deficiency” from a vague label into a mechanistic explanation.
3.4 Stress Physiology Including Drought Heat and Flooding
Trees keep their internal water balance and energy supply within a workable range. Stress happens when the environment pushes those limits, forcing the tree to change how it moves water, manages energy, and protects tissues. For exam questions, the key is to connect symptom patterns to the physiological bottleneck.
Foundational Water Balance
Water moves from soil to roots, through xylem, and out through stomata. Two processes set the pace: transpiration demand (driven by air temperature, wind, and humidity) and water supply (driven by soil moisture and root access). When supply can’t keep up with demand, the tree lowers water loss and risks xylem dysfunction.
A useful mental model is a “supply vs. demand” check. If leaves are losing water faster than roots can replace it, the tree becomes water-limited even if the soil isn’t completely dry.
Drought Stress Physiology
Drought reduces soil water availability and increases the tension needed to pull water upward. As xylem tension rises, tiny air bubbles can form and spread, leading to loss of hydraulic conductivity. The tree responds by closing stomata to reduce transpiration, but that also limits carbon dioxide intake for photosynthesis.
At the leaf level, drought often shows up as reduced leaf expansion first, then wilting, then leaf scorch. Scorch is not just “dryness”; it reflects tissue damage after prolonged water deficit and heat exposure. Some species also shed leaves or reduce growth to conserve resources.
Roots are not passive during drought. They may grow toward remaining moisture, and they can alter fine-root activity to maintain uptake. If drought persists, root respiration and maintenance costs compete with growth, so the tree reallocates energy away from new tissue.
Heat Stress Physiology
Heat stress overlaps with drought but isn’t identical. High temperature increases transpiration demand and can directly affect enzymes and membrane stability. Even with adequate soil moisture, heat can raise leaf temperature and accelerate water loss.
Trees manage heat through transpirational cooling when water is available. If stomata close to prevent water loss, leaf temperature rises, which can further stress photosynthetic machinery. This creates a feedback loop: heat increases demand, stomata closure reduces cooling, and photosynthesis becomes less efficient.
In diagnosis, look for patterns that suggest heat rather than purely drought. For example, heat injury may appear quickly during hot, dry spells, while drought-driven hydraulic failure may show more gradual decline and persistent wilting.
Flooding and Waterlogging Stress Physiology
Flooding reduces oxygen availability in the root zone. Roots still need oxygen for respiration, but waterlogged soils limit gas diffusion. The result is reduced ATP production, impaired nutrient uptake, and a shift toward anaerobic metabolism.
Anaerobic conditions can lead to root damage and reduced water transport capacity. Interestingly, a flooded tree may not wilt immediately because the soil is wet, but it can still become water-stressed internally due to poor root function and xylem impairment.
Common physiological outcomes include leaf yellowing, slowed growth, and eventual dieback of fine roots. Some trees form adaptations like aerenchyma, but many urban plantings lack the conditions needed for strong tolerance.
Integrated Stress Responses
Drought, heat, and flooding converge on three exam-relevant themes: hydraulic function, carbon balance, and tissue protection.
- Hydraulic function: drought and heat threaten xylem transport; flooding threatens root oxygen and uptake.
- Carbon balance: stomatal closure under drought/heat reduces photosynthesis; flooding reduces energy production in roots.
- Tissue protection: trees may compartmentalize damage, adjust growth, and alter leaf behavior to reduce losses.
Mind Map: Stress Physiology Pathways
Example: Interpreting a Scenario
A street tree shows leaf wilting at midday, with leaf scorch on the sun-exposed side. The soil under the mulch ring is dry several inches down. The most consistent physiology is drought-driven water deficit: high transpiration demand exceeds supply, stomata close, photosynthesis drops, and prolonged deficit damages leaf tissue.
Now compare a different scenario: a tree in a low spot shows yellowing and reduced shoot growth after heavy rains, even though the canopy isn’t wilting dramatically. The physiology points to flooding stress: root oxygen limitation reduces respiration and uptake, so the tree can’t support normal growth and leaf function.
Example: Exam-Style Reasoning Steps
- Identify the likely limiting factor: water supply, water demand, or root oxygen.
- Predict the tree’s immediate response: stomatal closure for drought/heat, reduced root function for flooding.
- Link response to symptom timing: rapid midday effects suggest demand-driven stress; persistent decline after wet periods suggests oxygen-driven stress.
- Check for convergence: both drought and heat can reduce carbon gain, while flooding can reduce energy production.
When you can state the limiting factor in one sentence, the rest of the diagnosis usually follows without guessing.
3.5 Phenology And How Seasonal Physiology Guides Diagnosis
Phenology is the timing of recurring biological events—bud break, leaf expansion, flowering, fruit set, leaf drop. For diagnosis, phenology matters because the same symptom can mean different things depending on whether the tree is in active growth, nutrient storage, or dormancy. A leaf spot that appears during rapid leaf expansion is often evaluated differently than the same spot showing up after leaf maturity.
Start with the physiology behind the calendar. During spring, trees shift from stored reserves to active growth. Buds break when internal signals and temperature patterns align, and the vascular system ramps up water movement to support leaf expansion. In summer, photosynthesis and transpiration are high, so water stress shows up quickly as wilting, marginal scorch, or premature leaf drop. In autumn, growth slows and the tree reallocates resources toward roots and storage tissues; symptoms tied to nutrient remobilization and carbohydrate balance become more noticeable. In winter, many pathogens are less active, and some visible changes reflect past damage rather than current infection.
A practical diagnostic workflow uses phenology as a filter before you choose a cause. First, identify the tree’s current stage: is it leafing out, fully leafed, flowering, fruiting, or dropping leaves? Second, compare symptom timing to that stage. If symptoms appear “out of season,” prioritize causes that can override normal development, such as root restriction, girdling, herbicide exposure, or severe drought. Third, map symptom distribution to physiology. Water transport issues often show up in the crown first during hot periods; root zone problems can show up as gradual decline that becomes obvious when demand rises.
Mind Map: Phenology Based Diagnosis
Example: Spring Leafing with “Wrong” Symptoms
A street maple shows delayed bud break and small, chlorotic leaves in early spring. Because spring physiology depends on mobilizing stored carbohydrates and establishing water flow, delayed leaf expansion suggests a constraint before or during the transition to growth. You would check for root zone disruption (recent construction, compacted soil, damaged roots), evaluate for girdling from below-ground or low trunk issues, and look for cankers that may interrupt vascular flow. If the tree leafs out normally on one side but not the other, that pattern often points to localized damage rather than a whole-site soil condition.
Example: Summer Scorch That Matches Demand
In midsummer, a young oak develops leaf scorch and wilting during afternoon heat but recovers by morning. That timing matches peak transpiration demand and indicates a water supply that cannot keep up during the hottest hours. Diagnosis focuses on irrigation adequacy, soil infiltration, and root access. A quick field check is to compare soil moisture near the drip line versus compacted areas; if moisture is lower where compaction exists, the symptom timing supports a root-zone water limitation rather than a foliar disease that would not track daily heat cycles so tightly.
Example: Autumn Leaf Drop with Distribution Clues
In autumn, a row of elms shows early leaf drop only on the windward side. Autumn physiology includes shifting resources and reducing growth, but wind exposure can increase drying and mechanical stress on the crown. If leaf drop is paired with twig dieback or bark injury on that side, mechanical and water stress become more likely than a uniform nutrient deficiency. You would also note whether discoloration patterns are consistent across the canopy or concentrated in specific branches, since branch-level patterns often reflect localized vascular or root constraints.
Example: Winter Structure Versus Active Disease
In winter, you find dead twigs and cankered areas on a flowering crabapple. Dormancy reduces active growth, so you interpret these signs as outcomes from prior seasons rather than current symptom onset. The diagnostic emphasis shifts to identifying the earlier trigger: winter injury, summer drought stress that weakened defenses, or wounds that allowed infection during active periods. You still record current conditions—canker size, bark texture, and any evidence of repeated cracking—but you avoid assuming the tree “caught” the problem in winter.
Phenology-guided diagnosis is essentially timing plus pattern recognition. When you align the tree’s stage with symptom onset and distribution, you narrow the cause list quickly and avoid treating every problem as if it started today.
4. Tree Health and Compartmentalization Concepts
4.1 CODIT Principles and How Trees Respond to Wounding
When a tree is wounded, it does not “heal” like skin. Instead, it manages the problem by limiting spread of decay and other damage. CODIT is the exam-friendly way to describe that strategy: trees compartmentalize injury so the affected area stays smaller than it otherwise would.
The Four Walls of CODIT
Wall 1: Immediate compartmentalization in the xylem. The first barrier forms in the wood just around the wound. Water-conducting tissues are sensitive, so the tree responds by restricting movement through the affected vessels and tracheids. In practice, this means decay organisms that enter the wood face a short, localized path before the tree narrows the route.
Wall 2: Restriction across growth rings. The second barrier is largely associated with the way wood is organized by annual growth. Many decay processes spread more easily along certain directions than across them. By changing how tissues respond across rings, the tree slows lateral movement.
Wall 3: Restriction within the wood rays. Rays are radial pathways that help move materials across the stem. Wall 3 reduces spread along these ray systems, limiting how far decay can travel sideways.
Wall 4: Limiting spread in the direction of least resistance. The fourth wall is the strongest and most visible in the long term. It involves forming barriers that slow vertical movement through the stem. The tree’s response is not a single plug; it’s a layered set of changes that make the “up and down” route harder.
A useful way to remember CODIT is to think of a wound as a door. The tree builds multiple locks: one near the door, others that block travel across and along internal pathways, and a final set that slows movement in the main direction decay would prefer.
What the Tree Actually Does at the Wound
CODIT describes outcomes, but the mechanisms are practical. After wounding, trees often:
- Form woundwood and callus tissue that helps cover exposed surfaces.
- Alter chemistry in nearby tissues, making conditions less favorable for decay organisms.
- Produce compartmentalization zones that separate healthy and affected wood.
- Limit water movement to prevent the wound from becoming a continuous wet corridor.
These actions work best when the wound is small and the tree can quickly establish barriers. That’s why a clean pruning cut generally performs better than a torn, ragged wound.
Wound Type Changes the Outcome
Not all injuries are equal. The tree’s response depends on how much tissue is damaged and what tissues are exposed.
Example: Pruning a small dead branch. A narrow cut exposes less wood and allows the tree to compartmentalize quickly. Over time, the branch base may be surrounded by barrier zones, and the wound area becomes more isolated.
Example: Bark removal from construction damage. When bark is stripped around part of the trunk, the tree loses protective tissues and disrupts transport. The tree can still compartmentalize, but the injury is larger, and the barriers must cover more surface area.
Example: A mower injury at the root flare. Repeated small wounds can add up. Each wound triggers compartmentalization, but the cumulative effect may keep the area chronically stressed and more susceptible to secondary problems.
How CODIT Shows Up in Real Diagnosis
On exams, you’re often asked to infer what the tree is doing from the pattern of damage.
- Localized discoloration near the wound suggests effective early compartmentalization.
- Wider spread along the stem suggests barriers are being overwhelmed or the wound is too large.
- Compartmentalization that follows internal pathways reflects the “wall” concept: spread is not random.
- Callus growth that covers but does not erase the internal injury reminds you that covering is not the same as restoring original wood.
Mind Map: CODIT Response Logic
Quick Exam-Style Reasoning
If a scenario describes a small, clean pruning cut with limited exposed wood, the best answer usually points to rapid compartmentalization and slower decay spread. If the scenario describes extensive bark stripping or torn tissue, the best answer usually emphasizes that the tree can still compartmentalize, but the injury scale makes it harder to keep the damage contained.
CODIT is the framework that turns those scenario details into a consistent explanation: the tree responds by building multiple internal barriers, and the pattern of spread tells you which barriers are doing their job.
4.2 Wound Response and Callus Formation
When a tree is wounded, it does not “seal” the damage like a jar lid. Instead, it builds a layered response that slows spread of decay and restores functional tissues as far as possible. The exam-friendly way to think about it is: the tree first stops bleeding, then walls off the wound, then rebuilds living tissue at the edges.
Foundational Steps in Wound Response
1) Immediate response at the cut or break. Cells near the wound lose normal function and may die, but the surrounding tissue reacts quickly. Many species form a protective barrier by plugging vessels and limiting water movement. This matters because water flow can carry pathogens and also affects how quickly the wound dries.
2) Chemical and structural defenses. The tree increases production of defensive compounds and strengthens cell walls. You can picture it as switching from “growth mode” to “containment mode.” In practice, this is why two wounds of the same size can behave differently: species chemistry and wound conditions change the outcome.
3) Compartmentalization and boundary formation. The tree organizes defenses into boundaries that limit spread. CODIT concepts connect here: the wound response creates zones that slow movement of decay organisms.
Callus Formation: What It Is and What It Isn’t
Callus is new growth of living tissue that forms along the wound margins. It is not a magical patch that covers everything instantly. Callus grows from the edges inward, and its success depends on how much healthy tissue remains at those edges.
Key exam idea: callus forms from living cambium and adjacent tissues, so wounds that remove or damage the cambium ring reduce callus potential. A clean pruning cut often preserves the cambium edge better than a torn break.
How Callus Grows over Time
Callus formation follows a practical sequence:
- Wound edge activation. Cells at the margin re-enter growth and produce new tissue.
- Wound surface stabilization. The wound dries to a degree that supports boundary formation rather than prolonged wetness.
- Edge-to-edge growth. Callus expands laterally, then gradually advances toward the center.
- Closure with internal limitations. Even when the surface looks closed, internal tissues may not be fully restored. Closure is a surface outcome; compartmentalization is the internal strategy.
A helpful mental model for scenarios: if the wound edges are intact and the tree can keep producing callus, closure progresses. If edges are repeatedly re-injured, callus growth stalls and boundaries remain incomplete.
Factors That Influence Callus and Closure
Wound type and quality. A smooth cut tends to create a more stable wound margin than a ragged tear. Torn bark can leave irregular edges where cambium is damaged or missing.
Wound size and depth. Larger wounds require more callus production. Deep wounds that extend into critical tissues can reduce the living edge area.
Species traits. Different trees vary in how quickly they form boundaries and how effectively they compartmentalize.
Season and tree vigor. Trees with better energy reserves can sustain growth at the wound margin. Timing also affects how quickly defensive responses and new tissue formation begin.
Moisture and contamination. Persistent wetness can slow drying and increase the time pathogens have to establish. This is why wound conditions matter even when the cut is “done correctly.”
Mind Map: Wound Response and Callus Formation
Example: Interpreting Two Wounds
Example 1: Pruning cut on a healthy branch. A branch is removed with a controlled cut that preserves a clear branch collar area. The cambium edge remains largely intact, so callus can form along the margin. Over months, you see callus ridges expanding and meeting near the center. Internally, decay risk is still managed by compartmentalization, but the intact edge improves the tree’s ability to limit spread.
Example 2: Storm break with torn bark. A trunk or large limb breaks and leaves ragged edges. Cambium is disrupted along much of the margin, so callus forms only where living tissue remains. Closure may appear slow or uneven, and the wound center can remain structurally vulnerable even after surface covering begins.
Example: Exam-Style Reasoning Checklist
When a scenario asks what the tree will do next, use this order:
- Are the wound edges alive? If cambium is removed, callus potential drops.
- Is the wound margin stable? Clean margins support boundary formation.
- Is the wound likely to stay wet? Prolonged wetness can hinder effective response.
- Is closure expected to be complete? Surface closure does not guarantee internal restoration.
This sequence keeps your answers grounded: wound response is a process of containment and gradual tissue rebuilding, not a single event.
4.3 Decay Development Pathways and Limitations
Decay Development Pathways and Limitations
Decay is not a single event; it’s a sequence of steps that starts with an entry point and ends with a particular pattern of internal change. CODIT explains how trees compartmentalize, but decay pathways explain how fungi still manage to progress—sometimes slowly, sometimes in a hurry, and often not at all.
Foundations of Decay Pathways
Most decay begins when a fungus gains access to living tissues. That access usually requires three ingredients: a wound or opening, compatible moisture and oxygen conditions, and a fungus that can tolerate the tree’s chemistry and defense responses. In practice, exam scenarios often describe a wound plus symptom timing, then ask what internal outcome is most likely.
A key limitation is that trees are not passive. After wounding, the tree forms barriers that restrict spread. The fungus can still grow, but its progress depends on whether it can cross those barriers faster than the tree can reinforce them.
Common Pathway Routes
-
Wound to Sapwood Progression A small wound can allow fungi to colonize sapwood first. Sapwood is generally more active and often more available for early colonization. As the tree continues to defend, the fungus may remain localized, producing a limited pocket rather than a large cavity.
-
Heartwood Colonization Some fungi can establish in heartwood, where conditions differ from sapwood. Heartwood is often less favorable for rapid spread because it may be drier or chemically less supportive. That doesn’t mean “no decay,” but it often changes the speed and extent.
-
Root and Butt Entry Decay at the root collar or butt is common because mechanical injury, soil moisture, and poor aeration can persist. Root-associated decay can also be harder to detect early because external symptoms may lag behind internal change.
-
Branch Stub and Canker-Like Openings Branch failures create openings that can remain biologically “open” for longer than you’d expect. Stub tissue can be a staging area where fungi establish, then gradually expand if moisture stays high.
Limitations That Slow or Stop Decay
Moisture availability is the most practical limiter. Many decay fungi need sustained moisture. If a wound dries quickly, fungal growth often stalls or remains limited.
Tree defense effectiveness matters. Compartmentalization can reduce the fungus’s ability to move through wood. Even when decay is present, the tree may confine it to a boundary region.
Fungal compatibility and competition also limit outcomes. Not every fungus that arrives can colonize successfully. Different organisms may compete, and some decay types are more aggressive than others.
Oxygen and temperature conditions influence growth rates. A wound that stays waterlogged may favor certain fungi, while well-aerated conditions may slow others.
How Pathway and Limitation Shape What You See
External indicators are clues, not direct measurements. For example, a small wound with minimal discoloration can still hide internal decay if moisture remained favorable inside. Conversely, a large wound may show little internal decay if the tree compartmentalized effectively and the interior dried.
A useful exam habit is to connect symptom timing to pathway logic. If symptoms appear soon after a wound, it suggests conditions supported early colonization. If symptoms develop slowly, it may indicate slower spread or a fungus that established but progressed gradually.
Mind Map: Decay Development and Constraints
Example: Small Wound with Limited Decay
A sidewalk edge scrapes the bark on a young street tree. The wound is shallow and dries within a day or two because it’s exposed and not repeatedly wetted. In this pathway, the fungus may arrive, but moisture limitation and effective compartmentalization reduce the chance of extensive internal spread. On inspection, you might see a localized discoloration zone rather than a large cavity.
Example: Root Collar Injury with Persistent Moisture
A tree’s root collar is repeatedly covered by mulch that stays damp and compacted. A mower also nicks the bark near the collar. This creates a pathway where moisture and oxygen conditions inside the wound remain favorable for longer periods. Even if external symptoms are subtle at first, internal decay can expand at the butt end, increasing the likelihood of later structural issues.
Example: Branch Failure Stub and Boundary-Limited Spread
After a storm, a broken branch leaves a stub. If the stub stays wet due to canopy shade and poor airflow, fungi can colonize and expand. If the tree forms strong boundary barriers and the stub interior dries over time, the decay may remain limited to the stub region. The exam takeaway is that the same type of injury can produce different outcomes depending on moisture persistence and compartmentalization strength.
Practical Exam Takeaway
When a scenario describes an injury plus ongoing moisture, assume a higher likelihood of progressive decay. When it describes rapid drying and strong compartmentalization cues, assume decay is more likely to be localized. The “pathway” tells you how decay could spread; the “limitations” tell you how far it actually gets.
4.4 Signs of Tree Health Decline Versus Normal Variation
Tree health signs can look similar to normal variation, especially when you’re comparing different trees, sites, and seasons. The trick is to separate “expected differences” from “patterned change.” Normal variation usually follows predictable rhythms and stays consistent across the tree’s overall structure. Decline tends to show a directional shift: symptoms progress, cluster in specific zones, or appear alongside stressors.
Foundational Baseline What Normal Looks Like
Start with what a healthy tree typically does across time. Leaves and needles follow seasonal timing, and branch dieback—when it occurs—usually remains limited and localized. Bark texture and color can vary by species and age, so “different” is not automatically “wrong.” Even crown density can fluctuate: a tree growing in open light often carries more foliage than the same species in shade.
A practical baseline question for exam-style scenarios is: “Is the symptom distribution consistent with the tree’s normal growth pattern?” For example, a young ornamental may naturally shed older leaves earlier than a mature canopy tree, but the shedding should still match the species’ typical timing.
Symptom Patterns That Signal Decline
Decline signs often show one or more of these patterns: increasing severity, expanding area, and repeat appearance across multiple seasons.
- Progressive canopy thinning: If foliage loss is spreading from the upper crown downward or from one side toward the whole tree, that’s a stronger signal than a one-time sparse flush.
- Repeated branch dieback: Small tips dying in a single year can happen after weather extremes, but repeated dieback in the same zones suggests a continuing limitation such as root stress or chronic disease.
- Abnormal leaf or needle retention: Some trees hold leaves longer than expected when stressed, especially when water uptake is impaired. Compare to nearby trees of the same species and to the tree’s own past behavior.
- Unusual discoloration with a distribution rule: Nutrient issues often show more uniform patterns, while many disease or vascular problems show patchiness, sectoring, or streaking.
Distribution Rules How to Separate Similar Looking Clues
Use location as a diagnostic tool. Normal variation tends to respect structure: older leaves may yellow first, and lower branches may show more wear due to light and airflow. Decline often breaks those rules.
- Top-down versus bottom-up: Water stress frequently shows up in the crown first, but root problems can also cause whole-tree symptoms. If the top is consistently worse, treat it as a priority clue.
- One-side decline: A single sector can indicate localized root damage, soil compaction, construction impact, or a pathogen entering through a wound.
- Patchy spots versus systemic change: Leaf spots that appear in scattered patches can be disease-related, while whole-crown uniform yellowing may point to broader stress like drought, root restriction, or persistent compaction.
Leaf and Needle Signs Normal Versus Concerning
Leaves and needles are where exam questions love to trick you.
- Normal seasonal yellowing: Often begins with older leaves and follows a predictable timeline. It should not steadily worsen year after year.
- Chlorosis with a “why now” pattern: If chlorosis appears suddenly after a construction event, irrigation change, or soil disturbance, it’s more likely decline-related.
- Premature leaf drop: Occasional shedding after heat waves can occur, but repeated early drop across seasons suggests ongoing stress.
- Necrosis and margin burn: Edge browning can be normal in some species under dry conditions, but if it expands inward and repeats, it points to sustained water limitation or root uptake failure.
Bark and Wood Clues the Quiet Evidence
Bark symptoms are often slower to appear, which makes them useful for distinguishing normal variation from decline.
- Normal exfoliation or shedding: Some species shed bark in plates or strips as they mature. The key is that it’s consistent with species behavior.
- Cankers and sunken lesions: Decline-related lesions often have a clear boundary, may ooze sap, and can be associated with localized dieback.
- Epicormic shoots: These can be a normal response after pruning or damage, but a sudden flush across multiple years can indicate chronic stress and repeated attempts to compensate.
Root Zone and Site Signals the “Where” Matters
Many health declines are rooted in the ground, literally.
- Soil compaction indicators: If the decline aligns with foot traffic, equipment routes, or repeated parking near the root flare, water infiltration and oxygen availability can drop.
- Mulch depth problems: Over-mulching can keep the root flare too wet and reduce oxygen exchange. Symptoms may include thinning and dieback, often starting in the crown.
- Irrigation mismatch: A tree that looks fine one season and declines the next after irrigation changes is a classic scenario for exam logic.
Mind Map: Signs That Differentiate Normal Variation from Decline
Example Scenarios Quick Reasoning
Example 1: A street maple shows mild yellowing on older leaves in late summer, but the crown density stays stable and nearby maples show similar timing. This fits normal variation because the pattern is seasonal and consistent.
Example 2: The same maple develops thinning in the upper crown over two consecutive seasons, with repeated early leaf drop and a sector that worsens near a recently compacted sidewalk edge. This points to decline because the symptoms progress, repeat, and cluster where the site changed.
Example 3: A young ornamental holds leaves longer than expected after a single hot week, then returns to normal the next season. That’s more consistent with a temporary stress response than ongoing decline.
Practical Exam Takeaway
When you see a symptom, ask three questions in order: Is it expected for the species and season? Does it follow a distribution rule tied to structure? Is it progressing or repeating? If the answers lean toward “not expected,” “rule-breaking distribution,” and “repeat progression,” you’re looking at health decline rather than normal variation.
4.5 Practical Examples of Interpreting Structural and Health Indicators
A good exam answer usually follows a simple rhythm: identify what you see, connect it to likely mechanisms, then choose the most defensible next interpretation. The examples below use that rhythm so you can practice the same mental steps under time pressure.
Example 1: Crown Dieback with Localized Cracks
You’re told a mature street tree shows thinning in the upper crown and a vertical crack on the trunk at about 1.5 m. Start with distribution. Dieback concentrated on one side suggests a localized problem rather than whole-tree decline. Next, connect the crack to compartmentalization limits. A long, open crack can interrupt normal barrier formation and create a pathway for decay.
What to look for in the scenario: (1) whether the crack is associated with bark loss or exposed wood, (2) whether there are signs of decay such as soft wood or fungal fruiting bodies near the crack, and (3) whether the dieback aligns with the same side as the defect. If the dieback matches the defect side, the most likely interpretation is that the defect is reducing water transport or increasing stress in that portion of the crown.
Exam-style takeaway: structural defects and health symptoms that share the same location are more likely to be causally linked than coincidental.
Example 2: Epicormic Shoots After Wounding
A young-to-mature tree has fresh epicormic shoots along the trunk after recent mechanical injury from equipment. Epicormic growth is often a response to reduced function in the crown or cambium damage. The key is to interpret timing and pattern.
If the shoots appear near the injury zone and the crown shows otherwise normal leaf size and density, the best interpretation is a compensatory response rather than an immediate disease diagnosis. If, however, the shoots are accompanied by progressive branch dieback and cankers, then the injury may have created an entry point for pathogens.
Exam-style takeaway: epicormic shoots can be a “repair attempt,” but paired symptoms determine whether it’s a healthy response or a warning sign.
Example 3: Soil Mound, Root Flare Hidden, and Declining Vigor
A site description notes a soil mound built against the trunk, with the root flare not visible. The tree shows reduced shoot length and smaller leaves. This combination points to root zone oxygen stress and altered water movement.
Interpretation steps: first, confirm the structural indicator—root flare suppression. Second, connect it to physiology—roots in poorly aerated soil can’t function normally, which reduces uptake and leads to crown vigor decline. Third, check for secondary indicators such as bark cracking at the base, fungal growth at the soil line, or collar rot signs.
Exam-style takeaway: when a structural site condition changes the root environment, health decline often follows in a predictable direction.
Example 4: Fungal Fruiting Bodies and the “Where” Question
A report says there are shelf-like fungal structures on a lower limb union. The tree also has a cavity-like defect and some localized thinning. The exam trap is treating fungi as the cause of everything. Instead, use location.
Fruiting bodies indicate an active or established decay organism, but the structural risk depends on where the decay is relative to load paths. A limb union is a common failure zone because it concentrates stress. If the fruiting bodies are at the union and there is evidence of wood loss or weakness, the most defensible interpretation is that decay is compromising structural integrity at that junction.
Exam-style takeaway: fungi tell you decay is present; your job is to map decay to structure and targets.
Example 5: Leaf Spot Pattern and Symptom Distribution
A canopy shows leaf spotting that is worst on the lower, shaded portion. There is no dieback and the tree otherwise maintains normal growth. This pattern suggests a disease or stress factor that favors moisture retention and reduced airflow.
Interpretation steps: (1) distribution by height and light, (2) whether symptoms are spreading over time in the scenario, and (3) whether there are stem lesions or only leaf-level signs. If only leaves are affected and the tree’s structure is stable, the best interpretation is localized foliar impact rather than systemic decline.
Exam-style takeaway: symptom distribution helps separate “cosmetic” leaf issues from structural or vascular problems.
Mind Map: Structural to Health Interpretation Path
Quick Synthesis Practice
If you can answer these three questions from the scenario, you’re usually on track: (1) Where are the symptoms relative to structural features? (2) What mechanism best explains that location and pattern? (3) What evidence in the scenario supports or contradicts that mechanism? Keep it grounded in distribution and load paths, and your interpretations will stay consistent even when the question gets messy.
5. Tree Identification for Diagnosis and Management
5.1 Using Dichotomous Keys and Field Guides Effectively
A dichotomous key is a decision tool: at each step you choose between two contrasting statements, then follow the path that matches the specimen in front of you. A field guide is the companion tool: it helps you confirm what you think you found and explains what to look for next time. Using both together is like using a map and a street sign—one gets you close, the other keeps you from turning down the wrong road.
Foundations: What Makes a Key Work
Start with the specimen in a “diagnostic mindset.” You are not trying to identify everything you notice; you are trying to answer the key’s specific questions in order. That means you should:
- Observe the traits the key asks for, not the traits you personally find interesting.
- Use consistent viewing conditions. If the key distinguishes leaf arrangement, don’t decide based on a single leaf that happens to be turned.
- Separate “uncertain” from “unknown.” If you cannot see a trait, choose the option that best matches what you can verify, then re-check the specimen before moving on.
A good workflow is: observe → choose → verify. If you skip verification, the key can still lead you to a name, but it may be the wrong one.
Step-by-Step Method from First Choice to Final Name
Read the Couplet Before Looking Again
Each couplet usually contains two statements that are meant to be mutually exclusive. Read both options first, then look for the trait that separates them. This prevents the common mistake of “seeing” the first option because you were already thinking about it.
Example: Suppose a key asks whether needles are “in bundles” or “single.” If you only check one twig, you might miss that bundles occur on short shoots while single needles appear elsewhere. Read the couplet, then sample multiple shoots.
Confirm the Trait at the Correct Scale
Keys often switch between macroscopic traits (overall form, bark texture) and microscopic or close-up traits (leaf arrangement, bud shape). If the key asks for bark lenticels, you need to look at the bark surface, not just the trunk color.
Example: A field guide may show “smooth bark” for a species, but the key might rely on whether the bark is “peeling in strips” versus “peeling in flakes.” Those are different textures, and they show up at different distances.
Track Your Path So You Can Back Up
Write down the couplet numbers or the chosen option text. If you later realize you misread a trait, you can return to the last decision point instead of restarting from scratch.
Example: If you choose “opposite leaves” and later discover the leaves are actually “alternate,” you can correct the earlier step and avoid a cascade of wrong choices.
Use the Field Guide to Validate, Not to Replace
Once the key narrows to a small set, use the field guide to check supporting traits: fruit type, twig color, habitat notes, or seasonal features. Validation means you look for agreement across multiple characters, not just one.
Example: A key might get you to a genus based on leaf margin, but the field guide can confirm species by describing the specific fruit shape and the typical arrangement of buds.
Common Pitfalls and How to Avoid Them
- Juvenile versus mature traits: Some trees change leaf shape as they age. If the key uses “leaf lobing” and your specimen is clearly juvenile, note that and look for traits that persist across ages.
- Seasonal mismatch: Flowers and fruits can be absent. If the key includes “presence of samaras” and you don’t have them, you may need to rely on bark, buds, or leaf arrangement instead of forcing a guess.
- Mixed specimens: Urban sites can include sprouts, grafts, or multiple trees near each other. Make sure the trait you’re using belongs to the same individual.
Mind Map: Key Use Strategy
Example: A Practical Walkthrough
Imagine a key asks:
- Leaves are compound or simple.
- If compound, leaflets are opposite or alternate.
- If opposite, leaflet margins are serrated or entire.
You find a twig with compound leaves. Before choosing “compound,” check whether the leaflets are truly attached to a rachis rather than being separate leaves from a different branch. Then you sample two or three leaflets from different positions to decide whether they are opposite or alternate. Finally, you inspect margins closely: serrated margins show consistent tooth-like projections; entire margins look smooth.
Once the key points to a species, you use the field guide to verify at least two additional traits—such as bud shape and fruit type if available, or bark texture if not. If the field guide’s description conflicts with your specimen, you don’t force the name; you return to the last couplet and re-check the trait that could plausibly be misread.
Integrated Takeaway
A dichotomous key is a structured question sequence, and a field guide is a confirmation tool. Your job is to make each decision based on observable traits, record your path, and validate the result with supporting characters. When you do that, identification becomes repeatable—less guesswork, fewer surprises, and a lot fewer “how did I end up here?” moments.
5.2 Leaf Needle and Bark Identification Techniques
Leaf, needle, and bark ID is where exam questions stop being abstract. You’re not memorizing names; you’re matching observable traits to likely species or groups. The trick is to use a repeatable sequence so you don’t get fooled by one “pretty” feature.
Foundational Workflow for Field Identification
Start with the easiest, least variable traits, then move to more specific ones.
- Confirm the leaf type: broadleaf vs needle vs scale-like. If it’s needle-like, note whether needles are single, paired, or in bundles.
- Check arrangement: opposite vs alternate vs whorled for broadleaf; fascicles vs single for needles.
- Inspect surfaces: look for color differences, stomatal bands, or waxy coatings. Many trees advertise their identity on the underside.
- Use bark as a second anchor: bark texture and pattern are often more stable than leaf condition, especially in seasonal stress.
- Record evidence: take short notes on what you saw and where on the plant you saw it (sun side, lower trunk, twig tips).
A practical exam habit: if two traits disagree, treat the less reliable one as a clue to check again. For example, a leaf may be damaged, but bark texture usually remains consistent.
Leaf and Needle Identification Techniques
Broadleaf Basics
For broadleaf trees, arrangement is your first sorting tool.
- Opposite leaves: pairs at the same node. Common in many maples and dogwoods.
- Alternate leaves: one per node, staggered along the twig. Common in oaks and elms.
- Whorled leaves: three or more per node. Less common, but distinctive.
Then check margin (smooth, serrated, lobed) and venation (netted vs parallel). Net venation is typical of most broadleaf trees; parallel venation points you toward a different group.
Needle Basics
Needles are easiest when you classify them by grouping and attachment.
- Single needles: often attached directly to twigs.
- Paired needles: two needles per bundle.
- Fascicles: bundles of multiple needles emerging from a common point.
Next, observe needle length, cross-section shape (flat, round, or angled), and persistence (evergreen vs seasonal drop). Some pines keep needles for years; others shed more readily.
A simple example: if you find needles in tight bundles and the bark is scaly with small plates, you’re likely in a pine-like group. If needles are single and the bark is smooth and peeling in strips, you’re likely in a different conifer group.
Bark Identification Techniques
Bark is not just “rough or smooth.” Think in layers of description.
Texture and Pattern
- Smooth: may be glossy, lenticel-speckled, or peeling in thin sheets.
- Rough: may be furrowed, ridged, or blocky.
- Peeling: flakes, strips, or curls. Peeling bark is often easiest to see on the trunk’s sunlit side.
Color and Lenticels
Color can vary with age and sun exposure, but lenticels—small pores—are useful. Note whether lenticels are prominent, scattered, or absent.
Bark Plates and Ridges
Some trees form plates that lift and separate; others form ridges that run vertically. If you can trace a ridge pattern with your finger, you can usually describe it consistently for an exam.
Bark at Different Heights
Bark changes with age. For ID, compare:
- Lower trunk: often more mature and patterned.
- Upper trunk and branches: may show smoother or different textures.
If the question gives only one view, use that view carefully and avoid assuming the bark is uniform.
Mind Map: Leaf Needle and Bark Identification
Integrated Examples for Exam-Style Scenarios
Example: Needle Grouping and Bark Texture
You’re shown a conifer with needles in bundles and bark that forms small, overlapping scales. The needle grouping narrows the options first; the bark texture then separates close look-alikes. If the needles were single instead of bundled, you’d switch to a different candidate group even if the bark looked similar.
Example: Broadleaf Arrangement and Bark Stability
A broadleaf tree has leaves that appear opposite on the twig. The bark is rough with deep furrows near the base. Even if leaf margins are partially chewed, the opposite arrangement and the consistent bark pattern provide two independent clues. In exam logic, two independent clues beat one dramatic symptom.
Common Mistakes to Avoid
- Over-trusting one trait: leaf condition can be damaged; bark is usually steadier.
- Ignoring arrangement: many wrong answers come from mixing up opposite vs alternate.
- Comparing mismatched heights: bark on branches can mislead if the question expects trunk bark.
- Skipping evidence notes: without a quick description, you can’t justify your choice when the question forces you to compare options.
5.3 Flower Fruit and Twig Traits for Accurate Species Determination
Accurate species ID often comes down to small, consistent details. Flowers, fruits, and twigs are especially useful because they show traits that are easier to compare than bark alone. The trick is to use a repeatable order: confirm the plant’s basic group, then narrow by reproductive structures, then verify with twig traits.
Foundational Approach for Using Reproductive Traits
Start with the simplest question: are you looking at a tree, shrub, or vine? Then note whether the plant is flowering now, has recently flowered, or is in fruiting stage. Many exam scenarios describe “what you see” rather than “what you know,” so your job is to translate observations into likely taxonomic groupings.
Next, separate traits into three evidence types:
- Flower traits: arrangement, symmetry, number of parts, and any distinctive shapes.
- Fruit traits: type of fruit (seed-bearing structure), how it opens or persists, and where it attaches.
- Twig traits: bud shape, leaf scar pattern, lenticels, and hairiness.
Use twig traits as a verification step when flowers or fruits are incomplete.
Flower Traits That Narrow Species Quickly
When flowers are present, look for symmetry and structure. Many trees have either radial symmetry (parts arranged around a center) or bilateral symmetry (a “left-right” pattern). Count the major parts when possible: petals, sepals, stamens, or fused structures. Even if you can’t count precisely, you can often identify whether petals are separate or fused.
Also note flower position. Some species produce flowers along twigs, others in clusters, and others in showy inflorescences. If the scenario mentions “hanging” or “upright” clusters, treat that as a key diagnostic clue.
Example
A specimen shows small, clustered flowers with a strong “bunch” appearance rather than single blooms. The fruit later appears as small drupes. In many common urban trees, that combination points you away from species that typically form dry capsules and toward drupe-formers.
Fruit Traits That Confirm the Match
Fruits come in many forms, but exam questions usually expect you to recognize a few major categories.
- Samara: winged seeds, often paired like a “helicopter” look.
- Drupe: fleshy outer layer with a single stone (think peach-like).
- Pome: fleshy fruit with a core containing seeds.
- Capsule: dry fruit that opens when mature.
- Nut or achene: dry, one-seeded structures.
Pay attention to persistence. Some fruits remain through winter, while others drop soon after maturity. Also note whether fruits are clustered or solitary and whether they attach directly to twigs or hang from longer stems.
Example
You find winged fruits that are paired and attached at a single point. That strongly suggests samaras rather than drupes or capsules. If the twig buds are also consistent with the same group, you can move from “likely” to “confident.”
Twig Traits That Verify When Flowers or Fruits Are Missing
Twigs are the exam’s quiet MVP. Buds and leaf scars often remain when flowers and fruits are gone.
Key twig checks:
- Bud arrangement: alternate or opposite.
- Bud shape: pointed, rounded, or elongated.
- Leaf scar pattern: number and arrangement of bundle scars.
- Lenticels: small pores on bark that can be numerous or sparse.
- Hairiness: smooth versus pubescent twigs.
Example
If fruits are absent, but you see opposite buds and leaf scars with a consistent bundle scar pattern, you can narrow to a smaller set of species. Then use the twig’s lenticel appearance and bud shape to choose the best match.
Mind Map: Flower Fruit and Twig Evidence Workflow
Integrated Identification Example
A scenario describes a tree with small clustered flowers. Later, you observe dry winged fruits that appear in pairs. In winter, the twigs show buds arranged in a consistent pattern and leaf scars that match the same twig architecture.
Your reasoning chain looks like this:
- Flower clustering suggests a group with inflorescences rather than solitary blooms.
- Paired winged fruits identify the fruit category as samara.
- Twig verification confirms the bud and leaf scar pattern aligns with the same likely species group.
When you can connect all three evidence types—flower structure, fruit category, and twig architecture—you reduce the chance of “almost right” answers.
5.4 Common Urban Tree Species and Their Diagnostic Features
Urban tree diagnosis starts with a simple rule: symptoms make sense only when you know the species. Different trees show different “normal” patterns, and exam questions love that distinction. This section focuses on common urban species and the diagnostic features you can use to separate look-alikes, interpret symptom patterns, and avoid common traps.
Foundational Species Clues You Should Always Check
Start with four fast checks before you chase disease or pests.
- Bark texture and lenticels: Is it smooth, scaly, peeling, or deeply furrowed? Are lenticels prominent and corky?
- Leaf arrangement and shape: Opposite or alternate? Simple or compound? Margins smooth, serrated, lobed, or toothed?
- Bud and twig traits: Bud size, placement, and twig hairiness can confirm identity even when leaves are missing.
- Growth form and site fit: Street trees often share planting history, irrigation patterns, and soil compaction levels, which influences symptom distribution.
A quick example: if you see opposite branching with paired leaves on a small street tree, you should immediately consider maples or ash relatives rather than jumping to disease explanations.
Mind Map: Species Identification Workflow
Common Species and What They Look Like When Healthy
Maple Species (Often Norway and Sugar Types)
Maples are frequently planted and frequently misidentified. Look for opposite leaf arrangement and lobed leaves. Norway maple often shows more uniform, dense crown form and can produce samara pairs that hang in clusters. In diagnosis, remember that maples can show leaf scorch during drought stress, but the pattern usually follows water limitation rather than random branch collapse.
Ash Species (Green and White Ash)
Ash leaves are compound with opposite leaflets along a central rachis. Bark can be furrowed with diamond-shaped patterns. In urban settings, ash is a key species because many exam scenarios involve decline patterns that begin in the crown and progress downward. When you see thinning at the top with ash-like foliage, you should treat identity as confirmed before attributing cause.
London Plane Tree
London plane is common in streets and parks. It has large, lobed leaves that can resemble maples at a glance, but the key is the alternate leaf arrangement and the mottled, exfoliating bark that peels in patches. In diagnosis, plane trees can tolerate some stress, yet repeated mechanical injury around the base can still drive chronic decline.
Red Maple and Other Red-Tinged Maples
Red maples often show red leaf stems and can have more variable leaf lobing than some other maples. Bark may be less dramatically patterned than ash but still shows the maple identity through opposite branching and leaf arrangement. If you’re comparing two maples, don’t rely on leaf color alone; use arrangement and bark texture.
Oak Species
Oaks have alternate leaves with lobes and often prominent acorn production. Bark is typically deeply furrowed on mature trees. In diagnosis, oak symptoms often vary by site moisture and by whether the issue is leaf-feeding versus vascular stress. A common exam move is to confuse early leaf loss with disease when it’s actually normal seasonal variation for some oaks.
Diagnostic Features That Tie Species to Symptoms
Species identity helps you predict where damage is likely to show first.
- Ash: crown thinning and dieback patterns are especially meaningful when leaflets confirm ash.
- Maple: drought scorch and nutrient stress can show as leaf edge browning, but the distribution should match water access.
- Plane: bark injuries and repeated trunk wounding can create long-term weakness; symptoms may appear as localized cankers or branch failure.
- Oak: leaf loss and discoloration must be interpreted with leaf habit and seasonal timing in mind.
Example: Sorting Two Similar Street Trees
You’re given a scenario: a small street tree has opposite branching and lobed leaves, but the bark is not deeply furrowed. The correct approach is to treat it as a maple candidate first, then refine with bark texture and twig/bud placement. If instead you see compound leaves with opposite leaflets, you should switch to ash rather than forcing a maple diagnosis. The exam rewards this “identity first” discipline.
Mind Map: Species to Diagnostic Feature Links
Quick Check List for Exam-Style Identification
Before choosing a diagnosis, confirm: leaf arrangement, leaf type (simple vs compound), bark texture, and at least one twig or bud trait. If any one of those conflicts, pause. In real field work and in exam questions, the fastest way to lose points is to treat a symptom as a species trait.
5.5 Documenting Identification Evidence for Exam Style Scenarios
Identification questions on the Certified Arborist exam usually reward two things: (1) you notice the right traits, and (2) you can justify your choice using evidence that matches the scenario. Good documentation is not about writing a novel; it’s about capturing observable facts in a repeatable way.
Evidence First Then Conclusion
Start by separating what you can observe from what you infer. Observations are traits you can point to: leaf arrangement, bark texture, bud shape, fruit type, growth habit, and where the tree is growing. Inferences are your reasoning: “This trait combination fits species X” or “This looks like a disease rather than drought.” In exam scenarios, you want your notes to make the reasoning easy to follow.
A practical habit: write each observation as a short statement with a location cue. Example: “Bark on lower trunk is scaly and ridged; upper trunk is smoother.” That single sentence tells the examiner you’re tracking variation across the tree, which matters for many species and for stress diagnosis.
The Observation Checklist That Prevents Misses
Use a consistent order so you don’t forget key traits when time is tight.
- Site and context: street tree, park edge, wet area, full sun, near pavement, soil disturbance.
- Whole-tree form: canopy shape, branching pattern, typical height.
- Leaves and twigs: arrangement, margin type, venation, twig color and diameter, bud placement.
- Bark and trunk: texture, fissures, lenticels, peeling, color, and where it changes.
- Flowers and fruit: presence, timing cues, shape, and how they attach.
- Roots and base: root flare visibility, girdling roots, exposed roots.
When you document, include “absence” too. “No thorns observed” or “No fruit present despite season cues” can narrow options.
Mind Map: Evidence Capture Workflow
Photo Labeling That Makes Notes Exam-Friendly
If the scenario includes images, treat them like evidence exhibits. Use simple labels that connect your text to the picture.
- Label format:
Photo A - lower trunk bark,Photo B - leaf arrangement,Photo C - fruit attachment. - What to write under each label: one sentence describing the trait you see, plus one sentence about what it suggests.
Example: Photo B - leaf arrangement: opposite pairs with smooth margins. This pattern fits several common urban maples, so bark and bud evidence must confirm.
This approach keeps your notes from becoming a pile of descriptions with no reasoning trail.
Example: Turning Notes into a Justified ID
Scenario: A street tree shows opposite leaves, a smooth gray trunk on the upper stem, and samara-like fruits clustered in pairs.
Good documentation
- “Leaves: opposite arrangement, simple leaves, smooth margins.”
- “Bark: upper trunk smooth gray; lower trunk slightly rough with shallow fissures.”
- “Fruit: paired winged samaras; attached near twig tips.”
- “Site: planted in sidewalk strip, full sun, irrigated during establishment.”
Exam-style conclusion
- “Most consistent with a maple species group based on opposite leaves and paired samaras; bark variation supports a common urban maple rather than an unrelated look-alike.”
Notice what’s missing: no guessing based on one trait alone. The conclusion is anchored to multiple observations.
Example: When Evidence Conflicts
Sometimes two traits point in different directions. Document the conflict instead of forcing a single story.
Scenario: Leaves look like a common elm, but bark is peeling in strips and fruits are not present.
Good documentation
- “Leaf traits suggest elm-like venation and margin.”
- “Bark: peeling strips on trunk; texture differs from typical elm bark in the provided images.”
- “Fruit: none shown; season may limit visibility.”
- “Twig: note whether buds are alternate or opposite if visible.”
Exam-style conclusion
- “Identification is uncertain from leaves alone; bark evidence and missing fruit reduce confidence. Use twig bud placement and any remaining reproductive traits to confirm.”
That last sentence is important: it shows you know what additional evidence would resolve the conflict, without inventing it.
Common Documentation Mistakes
- Vague traits: “bark is rough” without describing texture type or location.
- No location cues: traits can change from base to crown.
- No reasoning link: notes that don’t explain why a trait matters.
- Ignoring absence: missing fruit or thorns can be diagnostic.
Mind Map: Exam-Ready Conclusion Writing

Final Exam Habit
Before you answer, do a quick “evidence check”: can you point to at least two observations in your notes that directly support your choice? If not, revise your documentation or your conclusion. On exam day, that habit is the difference between “sounds right” and “is right.”
6. Plant Pathology for Arborists
6.1 Major Categories of Tree Diseases and How They Spread
Tree diseases are usually grouped by the type of cause and the way the problem moves from one tree or site to another. For exam questions, it helps to think in two layers: (1) what the pathogen is, and (2) what route it uses to travel and infect.
Foundational Categories by Cause
Fungal diseases are the most common category in urban settings. Fungi can live on dead tissue, enter through wounds, or infect living tissue directly. Many fungi spread through spores that travel on air currents, splash during rain, or hitchhike on contaminated tools.
Oomycete diseases are sometimes tested separately because they behave differently from true fungi. They often thrive in wet conditions and can spread through water movement in soil or on surfaces.
Bacterial diseases typically spread through water films and wounds. Many bacteria cannot travel far on their own; instead, they move when rain splashes, insects carry them, or pruning leaves fresh entry points.
Viral and phytoplasma-like disorders spread mainly through living vectors such as insects or through grafting. They usually do not spread by spores, so symptom patterns often show up in patches that match vector activity or planting history.
Nematode-associated diseases involve microscopic roundworms that move through soil. They can damage roots directly or create entry points for other organisms.
Phytopathogenic agents with mixed behavior appear in questions as “disease complexes,” where multiple factors interact. For example, drought stress can weaken a tree, making it more susceptible to fungi that would otherwise be less successful.
How Diseases Spread in Real Life
Most spread routes fall into a few predictable pathways. If you can identify the pathway, you can often narrow the category.
- Airborne spread: spores travel on wind and land on susceptible tissue. This is common for many fungi.
- Waterborne spread: rain splash, irrigation, and standing water move pathogens. This is common for bacteria and oomycetes.
- Soil spread: pathogens persist in soil and infect roots. This is common for root rots, nematodes, and some fungi.
- Vector spread: insects or mites carry pathogens between trees. This is common for viruses and phytoplasma-like disorders, and also for some bacteria.
- Direct contact and wounds: pathogens enter through pruning cuts, storm wounds, or bark injuries. This is common across fungal and bacterial categories.
- Human-mediated spread: contaminated tools, transport of infected plant material, and improper sanitation move pathogens.
Symptom Clues That Point to Spread Routes
Exam scenarios often describe symptom timing and location. Use those details.
- Fast, patchy leaf symptoms after wet weather often suggest water-mediated spread.
- Root-zone decline with gradual canopy thinning suggests soil involvement.
- Localized cankers or dieback around wounds suggests entry through damaged tissue.
- Staggered patterns across a neighborhood can reflect vector movement or planting material history.
Mind Map: Disease Categories and Spread Routes
Example: Matching Category to Spread Clues
Example 1: Wet spring leaf spotting. A street of maples develops leaf spots after repeated rain, and the worst symptoms appear on the lower canopy where leaves stay wet longer. Rain splash and water films fit bacteria or water-loving oomycetes, while many fungi also respond to wetness. The exam move is to look for additional hints like cankers on twigs (often bacterial) versus widespread spore-like leaf patterns (often fungal).
Example 2: Sudden branch dieback after pruning. Several trees show dieback starting at pruning cuts made during a rainy week. The spread route is direct entry through wounds, and tool sanitation becomes a key suspect. Both fungi and bacteria can exploit fresh cuts, so the scenario’s timing and the presence of wet exudate or canker margins can help separate them.
Example 3: Root decline in a specific planting bed. Trees in one soil area show thinning crowns and poor vigor, while nearby trees in better-drained soil remain healthy. Soil spread is the dominant pathway, pointing toward root rots and nematode involvement rather than airborne leaf pathogens.
Example: Integrated Reasoning for Exam Style Scenarios
If a question states that symptoms appear in a line corresponding to where irrigation water runs, and the disease affects leaves and shoots, you should prioritize waterborne spread. If it also notes that symptoms cluster around pruning wounds, you should add wound entry to your reasoning. That combination narrows the likely categories to those that succeed with wet conditions and fresh entry points, rather than relying on airborne spore spread alone.
In short, disease categories tell you what kind of organism you are dealing with, and spread routes tell you how it gets from “there” to “here.” When you connect the two, the diagnosis questions become much more predictable.
6.2 Fungal Diseases Including Cankers Mildews and Root Rots
Fungal diseases are often tested through symptom patterns, host context, and how the disease spreads. The core idea is simple: fungi need a living host or a suitable substrate, plus moisture and time. In urban trees, those needs are frequently met by irrigation overspray, dense canopies that stay wet, wounds from pruning or construction, and soil conditions that stress roots.
Foundational Concepts That Drive Diagnosis
Most tree fungi fall into a few practical roles. Some invade through wounds and cause cankers. Others live on surfaces and cause mildews. Root rots typically start in the soil and move through roots or root collars. In every case, the exam-friendly approach is to connect three things: entry route, symptom location, and the environmental conditions that favor infection.
A useful rule of thumb: if symptoms are mostly on stems and bark, think canker-forming fungi; if symptoms are mostly on leaves and shoots, think mildews; if symptoms are mostly in the root zone or at the base, think root rots. Then confirm with details like lesion shape, growth form, and whether the pattern matches normal stress or a disease process.
Cankers: Bark Lesions with a Job Description
Canker-forming fungi infect bark through wounds, pruning cuts, frost cracks, or mechanical injuries. They then kill tissue under and around the infection point, creating a localized dead area that may expand over time.
Common exam cues include:
- Sunken or discolored bark that may look cracked or rough.
- Margins that are darker or raised, reflecting active tissue change.
- Branch dieback above the lesion when the canker girdles or disrupts transport.
Easy example: A young street tree has a pruning cut made too close to the trunk. Months later, a dark, sunken area forms around the cut, and the branch beyond it yellows and drops leaves early. The symptom location (around a wound) and the progression (dieback above) point toward a canker rather than simple drought stress.
Mildews: Surface Growth and Leaf-Level Patterns
Mildews are fungi that grow on leaf surfaces, shoots, or both. They often appear as powdery or velvety growth, and they can cause leaf distortion, premature leaf drop, or reduced shoot vigor.
Key diagnostic cues:
- Powdery growth on leaves or new shoots, often white to gray.
- Leaf curling or distortion that tracks with heavy infection.
- Timing that matches periods of frequent leaf wetness or humid conditions.
Easy example: In a shaded courtyard, a maple shows gray-white powder on new leaves and some curling at the tips. The rest of the canopy looks relatively normal, and the trunk is unaffected. Because the symptoms are concentrated on foliage and new growth, mildew is a strong fit.
Root Rots: The Base of the Problem
Root rots involve fungi that decay roots and sometimes the root collar. They can reduce water and nutrient uptake, leading to canopy symptoms like thinning, yellowing, and wilting—often even when irrigation seems adequate.
Exam cues that help separate root rots from other issues:
- Decline that starts at the base with crown symptoms following.
- Fungal fruiting bodies near the root collar or on the soil surface.
- Root decay that may be visible when soil is excavated carefully.
Easy example: A tree in a low spot shows gradual canopy thinning and smaller leaves. The soil stays wet after rain, and the base has fungal growth near the collar. The pattern suggests a root rot process rather than a purely foliar disease.
Mind Map: How to Think Through Fungal Disease
Integrated Best Practices That Match Exam Logic
Even though the exam is not a jobsite checklist, the same reasoning shows up in questions. For cankers, focus on preventing new wounds and managing pruning practices so cuts dry quickly and do not create long-lasting infection courts. For mildews, reduce leaf wetness duration by improving spacing and avoiding unnecessary overhead irrigation. For root rots, prioritize drainage and root zone management; stressed roots are easier targets, and repeated wet conditions keep the fungi active.
Case Study: One Tree, Three Clues
A boulevard oak shows three observations: a dark lesion around a recent pruning wound, powdery growth on a few upper leaves, and a general decline that is worse on the side of a poorly drained curb cut.
A systematic interpretation is to treat each clue as a separate layer. The wound-associated bark lesion supports a canker process. The powdery leaf growth supports mildew on foliage. The side-specific decline near the curb cut supports a root zone issue consistent with root rot or related decay. The exam-style takeaway is not to force one disease to explain everything; it is to match each symptom cluster to the most likely fungal role and entry route.
6.3 Bacterial Diseases Including Canker and Leaf Spot Patterns
Bacterial diseases in trees are often diagnosed by pattern, not by a single “smoking gun.” Bacteria typically enter through wounds, natural openings, or damaged tissue, then spread locally through water films and splashing. In exam scenarios, the fastest path to an answer is to connect three things: symptom shape, symptom location, and the likely entry route.
Foundational Concepts You Need for Pattern Recognition
Bacteria are living cells that require moisture for movement and infection. That’s why many bacterial problems show up after wet weather, irrigation, or overhead watering. Once inside, they can cause tissue breakdown that looks like cankers, spots, or blights. The key exam idea: bacterial symptoms often have sharp boundaries and may produce wet-looking lesions early, then turn brown or tan as tissue dies.
Entry routes matter. Wounds from pruning, storms, insects, or mechanical injury provide direct access. Natural openings like stomata can also be routes, especially when leaves stay wet long enough for infection. If symptoms cluster around pruning cuts or branch junctions, think canker. If symptoms are mostly on leaves and spread across the canopy after wet periods, think leaf spot.
Canker Patterns and How They Form
A canker is a localized area of dead or dying bark and underlying tissue. Bacterial cankers often start at an entry point such as a wound, twig dieback, or a previously damaged area. As the bacteria multiply, the cambium and adjacent tissues fail, and the bark may crack, slough, or show sunken lesions.
Look for these exam-friendly features:
- Location: branch tips, trunk wounds, or areas near pruning cuts.
- Shape: elongated or irregular lesions that can expand along the stem.
- Progression: dieback above the lesion is common because water transport is disrupted.
- Bark behavior: cracking, peeling, or oozing may appear depending on species and conditions.
Easy example: A street maple has a pruning cut made two months earlier. After a rainy stretch, the cut area develops a sunken, dark patch that expands and the branch beyond it wilts and dies back. That combination of wound association plus progressive dieback points toward a canker-forming bacterial issue.
Leaf Spot Patterns and How They Spread
Leaf spot symptoms are usually limited to leaf tissue, though severe cases can reduce vigor by repeated defoliation. Bacterial leaf spots commonly appear as small, dark lesions with a somewhat angular or limited outline because veins restrict spread. Lesions can enlarge and merge, especially when leaves remain wet.
Pattern cues:
- Lesion outline: angular spots bounded by leaf veins.
- Distribution: often begins on lower or shaded leaves and expands upward during wet periods.
- Timing: symptoms appear after repeated leaf wetness.
- Secondary effects: premature leaf drop can follow.
Easy example: A row of ornamental crabapple shows small dark spots on leaves after overhead irrigation. The spots look “boxed in” by veins, and the worst area is on the lower canopy where leaves stay wet longest. That’s a classic leaf spot pattern.
Differentiating Bacterial Cankers and Leaf Spots from Look-Alikes
Exams frequently test whether you can separate bacterial patterns from fungal or abiotic ones.
- Bacterial vs fungal leaf spots: bacterial lesions often appear more sharply defined and may show a wet or water-soaked look early. Fungal spots can vary widely, and many have fuzzy growth or distinct spore structures.
- Bacterial vs abiotic leaf injury: nutrient or chemical injury often follows application patterns or uniform exposure zones rather than vein-bounded angular lesions.
- Canker vs simple dieback: dieback can be caused by many stresses, but cankers usually have a localized lesion on the stem with progressive decline above it.
A practical rule: if the symptom is tied to a wound or a specific stem area and expands with dieback, lean canker. If the symptom is mostly on leaves with vein-limited spots after wetness, lean leaf spot.
Integrated Mind Map
Case-Style Example Walkthrough
A homeowner reports that a young birch has a patch of cracked bark on the trunk near a recent mechanical injury. Over the next month, the branch above the injury wilts and sheds leaves. Meanwhile, nearby trees show scattered leaf spots after a week of frequent rain.
The correct approach is to treat these as two pattern sets. The trunk cracking plus dieback above a localized stem lesion fits a canker pattern. The leaf spots after wet weather fit a leaf spot pattern. In an exam, you would select the disease category that matches each symptom set rather than forcing one explanation for everything.
Practical Best Practices for Handling Suspected Bacterial Issues
When bacterial disease is suspected, the goal is to reduce new infections and limit spread during work.
- Sanitize tools between cuts, especially when moving from symptomatic to healthy tissue.
- Prune with intent: remove diseased tissue back to healthy wood when appropriate, and avoid leaving ragged edges that create more entry points.
- Avoid overhead irrigation when possible, since leaf wetness drives infection.
- Manage wounds: protect trunks and branches from mechanical damage during routine maintenance.
These actions align with the biology: fewer entry points, less leaf wetness, and less mechanical transfer means fewer opportunities for bacteria to establish and expand.
6.4 Viral and Phytoplasma Like Disorders and Their Typical Symptoms
Viral and phytoplasma-like disorders are diagnosed by symptom patterns, host context, and how the problem spreads through time. Unlike many fungal diseases, these agents often move systemically, so symptoms can appear in multiple parts of the plant rather than starting as a single, expanding lesion. The exam usually rewards you for noticing distribution, timing, and whether symptoms match normal seasonal changes.
Foundational Concepts for Symptom Reading
Start with the “where” and “when.” Systemic agents tend to cause symptoms that are distributed through the crown, shoots, or vascular system, even if the initial entry point is elsewhere. Timing matters because some symptoms show up after a growth flush, while others become obvious only as leaves mature.
Next, separate symptom type from cause. Leaf discoloration can come from nutrient issues, drought, or herbicide injury, but viral and phytoplasma-like disorders often show consistent patterns such as mosaic mottling, witches’ broom, or persistent decline. A practical habit is to compare affected branches to nearby unaffected branches on the same tree—same light, same watering, different symptoms is a strong clue.
Viral Disorders Typical Symptoms
Viruses commonly produce foliar patterns that look “painted on.” Typical signs include:
- Mosaic and mottling: irregular light and dark patches on leaves, often with a patchy distribution across the canopy.
- Leaf distortion: curling, crinkling, or reduced leaf size, sometimes concentrated on new growth.
- Chlorosis and discoloration: yellowing that does not follow a simple nutrient gradient.
- Stunting and poor vigor: smaller leaves, shorter internodes, and reduced shoot growth.
- Dieback: gradual loss of twigs or branches, especially after repeated growth cycles.
A simple example: a street maple shows mottled leaves on only the upper third of the crown, while the lower branches look normal. If the mottling persists across multiple leaf flushes and new growth continues to show distortion, systemic involvement becomes more likely than a one-time environmental stress.
Phytoplasma-Like Disorders Typical Symptoms
Phytoplasmas are often associated with “growth form” changes more than leaf spotting. Typical signs include:
- Witches’ broom: many short shoots clustered from a single point, creating a dense tuft.
- Phyllody: leaves or leaf-like structures replacing normal flowers or floral parts.
- Proliferation and abnormal branching: excessive shoots with weak growth.
- Yellowing and decline: persistent chlorosis, reduced vigor, and progressive canopy thinning.
- Stunting: overall reduction in growth, sometimes with uneven branch performance.
Example: a young ornamental tree develops dense clusters of shoots near the tips of several branches. The clusters appear after a spring flush, and the affected shoots remain small and crowded through summer. Even if the leaves are otherwise healthy-looking, the broom-like branching pattern is a major diagnostic anchor.
Symptom Distribution Mind Map
Mind Map: Viral and Phytoplasma-Like Symptoms
Integrated Diagnostic Workflow for Exams
- Confirm symptom consistency: Are the symptoms present on new growth and repeated across leaf flushes? Viral and phytoplasma-like disorders often show persistence.
- Assess distribution: Is the problem localized to one branch, or does it show up across multiple branches in a pattern that suggests systemic movement?
- Identify the “signature”: Mosaic mottling points toward viral tendencies; witches’ broom and phyllody point toward phytoplasma-like tendencies.
- Rule out common look-alikes using pattern logic: Nutrient issues often show more uniform gradients; herbicide injury often follows drift patterns; mechanical injury tends to be localized to wounds.
- Document for decision-making: Note which parts of the canopy are affected, whether flowers are abnormal, and whether new shoots show the same pattern.
Case-Style Example for Typical Symptoms
A homeowner reports that a row of shrubs has “yellow leaves” after pruning. On inspection, only certain plants show dense clusters of short shoots at branch tips. Leaves on those clusters are smaller and the overall plant looks weaker, while neighboring plants remain normal. The key exam move is to focus on the growth-form change—witches’ broom—rather than the general yellowing. Yellowing alone could be many things; broom-like branching is the symptom that narrows the likely category.
Quick Symptom-to-Category Mapping
| Typical Symptom Pattern | More Likely Category | What You Should Notice |
|---|---|---|
| Mosaic mottling and leaf distortion | Viral | Irregular patching across leaves, often persistent |
| Witches’ broom and abnormal branching | Phytoplasma-like | Dense shoot clusters from points on branches |
| Phyllody and abnormal floral appearance | Phytoplasma-like | Flowers replaced or altered into leaf-like growth |
| Stunting with repeated decline | Either | Reduced vigor across growth cycles |
Summary Anchors
For the exam, remember two symptom anchors: viruses often show leaf patterning and distortion, while phytoplasma-like disorders often show abnormal growth forms like witches’ broom and phyllody. Then use distribution and persistence to separate systemic disorders from one-off environmental or localized injuries.
6.5 Disease Diagnosis Workflow Using Symptom Patterns and Site Context
A good disease diagnosis is less about guessing and more about building a case. Start by separating what you can observe from what you can infer, then test your inferences against the site conditions. The exam loves this logic: symptoms are clues, but context is the steering wheel.
Step 1: Confirm the Symptom Pattern
Begin with a quick inventory of symptoms across the tree and the site. Note whether the problem is localized or widespread, and whether it follows a pattern.
- Distribution: Is it one branch, one side of the crown, multiple trees in a row, or scattered individuals?
- Progression: Are symptoms new and expanding, or stable and long-standing?
- Morphology: Look for consistent features like leaf spots, cankers, wilting, chlorosis, dieback, or root-related decline.
Example: Several leaves show small, dark spots, but only on the lower canopy. That pattern suggests a disease that benefits from leaf wetness and shade rather than a systemic nutrient issue.
Step 2: Link Symptoms to Likely Entry Points
Next, translate symptoms into where the problem likely started.
- Leaves and shoots often point to foliar pathogens or insect feeding that creates infection courts.
- Cankers and dieback often point to bark or wood infections, wound infections, or stress that predisposes tissues.
- Root flare and soil zone symptoms often point to waterlogging, compaction, or root rots.
Example: A maple shows sunken, dark lesions on twigs that expand into branch dieback. The symptom-to-entry logic favors a pathogen that colonizes young tissues, especially if pruning wounds or winter injury are present.
Step 3: Use Site Context to Narrow the List
Site context reduces false leads. Focus on moisture, soil, exposure, and recent disturbances.
- Moisture regime: irrigation type, drainage, shade, and leaf-wetness duration.
- Soil conditions: compaction, poor drainage, construction impacts, and root restriction.
- Microclimate: wind exposure, canopy density, and proximity to other hosts.
- Recent events: pruning, lightning, grading, herbicide drift, or mechanical injury.
Example: The same leaf spot symptoms appear on trees that are irrigated overhead, while nearby trees with drip irrigation show minimal spotting. Moisture delivery becomes a strong supporting fact.
Step 4: Check for “Look-Alike” Explanations
Many conditions mimic disease. Use targeted observations to separate them.
- Nutrient or water stress: often causes more uniform chlorosis or generalized decline rather than discrete lesions.
- Herbicide injury: can show distorted growth patterns and symptom timing tied to application.
- Mechanical injury: may align with mowers, trunkside impacts, or construction damage.
Example: If chlorosis is patchy but leaf spots are absent, and new growth is distorted after a recent maintenance event, the workflow should shift toward abiotic injury rather than a foliar pathogen.
Step 5: Build a Diagnosis Statement from Evidence
Write your conclusion as a short statement that includes confidence and the evidence behind it. In exam scenarios, you often choose the best answer, not the perfect one.
A useful template:
- Most likely disease category
- Supporting symptom pattern
- Supporting site context
- What would confirm or refute
Step 6: Decide the Next Observation or Action
Even without lab testing, you can refine the case by choosing the next observation.
- Inspect adjacent tissues for transition zones between healthy and affected.
- Look for signs: fruiting bodies, spore masses, ooze, or mycelial growth.
- Check host distribution: are only susceptible species affected?
- Evaluate environmental drivers: wetness, shade, and soil saturation.
Example: If you suspect a canker, look for bark cracking, callus boundaries, and whether the lesion aligns with a wound. If the lesion is random and the tree is uniformly stressed, reconsider the category.
Mind Map: Symptom Patterns and Site Context Workflow
Example: Putting It Together in an Exam-Style Scenario
A street tree shows thinning and dieback in the upper crown. Leaves near the tips are chlorotic, and small twig lesions appear where pruning occurred last season. The site has overhead irrigation and poor drainage in the planting strip.
- Pattern: upper crown dieback with twig lesions suggests bark/wood involvement rather than purely foliar stress.
- Entry logic: pruning wounds provide entry points.
- Context: overhead irrigation and poor drainage support conditions that favor infection and stress predisposition.
- Look-alikes check: generalized nutrient deficiency is less consistent with discrete twig lesions.
The workflow supports a diagnosis leaning toward a wound-associated disease process interacting with site moisture and stress, and the next observation would focus on lesion boundaries, signs on bark, and whether affected branches correlate with pruning sites.
7. Entomology for Urban Tree Health
7.1 Insect Life Cycles and How They Relate to Seasonal Symptoms
Insect problems on trees rarely show up randomly. Most insects follow a life cycle with predictable stages, and each stage tends to leave a different kind of symptom. When you connect the stage to the season, diagnosis gets faster and more accurate—because you’re matching what you see to what the insect is likely doing.
Foundational Concepts You Need First
Most tree insects fall into two broad life-cycle patterns: complete metamorphosis and incomplete metamorphosis.
- Complete metamorphosis has four stages: egg, larva, pupa, adult. The larva is often the feeding stage that causes the most obvious damage.
- Incomplete metamorphosis has three main stages: egg, nymph (immature), adult. Nymphs usually resemble smaller versions of the adult and may feed for longer periods.
A second concept matters just as much: timing. Temperature and day length influence development rates. That’s why the same insect can appear earlier in warm microclimates (south-facing slopes, sheltered walls) and later in cooler ones (shaded sites, low spots).
Seasonal Symptom Logic
Think of seasonal symptoms as a calendar of insect activity.
- Late winter to early spring: Many insects are emerging from overwintering stages. Symptoms often involve early feeding on buds, expanding leaves, or bark.
- Spring to early summer: Eggs hatch and larvae or nymphs feed aggressively. Leaf spots, skeletonization, chewing damage, and gall formation often become obvious.
- Mid to late summer: Adults may be active and laying eggs. You may see new feeding damage, but also signs like exit holes, webbing, or honeydew from sap-feeders.
- Autumn: Feeding may slow, but you can still find late-season larvae, overwintering eggs, or protective structures. Some insects leave behind frass, cast skins, or overwintering shelters.
Mind Map: Life Cycle to Symptom Mapping
Examples That Match Stage to What You See
Example: Chewing larvae on leaves
- If you see skeletonized leaves or ragged chewing edges in late spring, the insect is often in the larval feeding stage. Adults may be present nearby, but the visible damage is usually from larvae that hatched earlier.
Example: Sap-feeding insects and honeydew
- When you notice sticky surfaces and sooty mold developing in early to mid summer, the culprit is often a nymph or adult sap-feeder. Because sap-feeders can produce honeydew continuously while feeding, symptoms can persist even when you don’t see obvious chewing.
Example: Bark borers and timing of exit holes
- If you find fresh-looking exit holes on a trunk or large limb in summer, the adults likely emerged after pupation. The boring damage happened earlier, when larvae were inside the wood. That means the symptom you’re seeing now may reflect activity from the previous season.
Practical Diagnosis Workflow
- Identify the symptom location: buds, leaves, twigs, bark, or roots.
- Estimate the season window: early spring versus mid summer changes the likely stage.
- Look for stage-specific leftovers: frass for borers and chewers, honeydew and cast skins for sap-feeders and some nymphs.
- Decide which life-cycle type fits: if you see a sudden burst of feeding damage followed by a lull, complete metamorphosis is often involved; if damage progresses gradually with similar-looking stages, incomplete metamorphosis is more likely.
When you do this consistently, you stop treating insect symptoms as isolated events. Instead, you treat them as evidence of where the insect is in its life cycle—and that’s the whole trick to making seasonal diagnosis feel less like guesswork and more like pattern recognition.
7.2 Common Feeding Damage Types and What They Indicate
Feeding damage is one of the fastest ways to narrow an insect problem during an exam-style diagnosis. The key is to treat damage like a map: shape, location, and pattern usually point to the mouthpart type, the feeding behavior, and sometimes the life stage.
Start with the basics. Insects typically feed in one of three ways: they chew plant tissue, they pierce and suck sap, or they scrape and remove surface layers. Each method leaves a different “signature,” and those signatures often stay consistent across species within a feeding group.
Chewing Damage
Chewers remove chunks of tissue, so you’ll see holes, missing leaf areas, or chewed twigs. Because the insect must ingest plant material, chewing damage often correlates with more obvious leaf loss.
Common indicators include:
- Leaf skeletonization: tissue removed between veins, leaving a lace-like surface. This often suggests a larval stage that consumes leaf tissue efficiently.
- Shot holes: small holes with a clean edge, usually from repeated feeding on leaves. The pattern can look like the leaf was peppered.
- Defoliation patches: irregular areas where the canopy thins. Patchiness can reflect where the insect is active or where eggs were laid.
Easy example: If you find a young maple with scattered leaf holes and the edges look torn rather than smooth, you’re more likely dealing with a chewing insect than a sap feeder.
Piercing and Sucking Damage
Pierce-and-suck insects remove sap by inserting mouthparts into vascular or near-vascular tissues. Since they’re not chewing through the leaf, the damage often looks like discoloration, stippling, or distortion rather than holes.
Common indicators include:
- Stippling or flecking: tiny pale dots where cells were drained. Under close inspection, the leaf may look “speckled” rather than missing.
- Leaf yellowing and chlorosis: sap loss reduces chlorophyll production, so older leaves may fade first depending on where feeding occurs.
- Leaf curling and distortion: new growth is often targeted because it’s easier to penetrate and supports faster feeding.
- Honeydew and sooty mold: sugary waste can coat leaves and stems, and black mold may grow on it.
Easy example: On a street tree, if you see sticky residue on leaves and black smudges on the underside, the damage points strongly toward sap-feeding insects.
Scraping and Surface Feeding Damage
Some insects feed by scraping the epidermis and removing surface layers. The result is often a roughened, silvery, or bronzed look rather than holes.
Common indicators include:
- Bronzing or silvery patches: the leaf surface loses its normal color and sheen.
- Scarring on young leaves: tender tissue is more affected, so symptoms may concentrate on new flush.
Easy example: If a tree’s newest leaves show a dusty, bronzed appearance while older leaves look mostly normal, surface scraping is a strong candidate.
Gall and Tissue-Manipulation Damage
Not all “feeding damage” is just eating. Some insects and mites cause plants to form abnormal structures that house the feeder. Galls can be thought of as the plant’s response to repeated feeding and chemical signals.
Common indicators include:
- Localized swellings or abnormal growths: round, elongated, or blister-like structures on leaves, twigs, or stems.
- Reduced vigor in affected areas: galled tissue may not expand normally.
Easy example: If you find small, consistent bumps on a specific leaf area across many leaves, the pattern suggests gall formation rather than random chewing.
Root Feeding Damage
Root feeders are harder to spot because symptoms show up indirectly. Aboveground clues often include reduced growth, thinning canopy, or wilting during periods when water should be available.
Common indicators include:
- Decline without obvious leaf spots or holes: the canopy may weaken while foliage looks otherwise “clean.”
- Patchy decline: damage may be localized to where larvae are concentrated in the soil.
Easy example: If a row of trees shows uneven vigor and the weaker ones share the same soil zone, root feeding becomes a more plausible explanation.
Mind Map: Feeding Damage Signatures
Putting It Together for Exam-Style Diagnosis
When you see damage, don’t stop at “what it looks like.” Ask where it occurs (new growth vs older leaves vs stems), whether the leaf tissue is missing or discolored, and whether there are secondary signs like stickiness or mold. Those three questions usually narrow the feeding type quickly, which then helps you choose the most likely insect group in the next step of diagnosis.
7.3 Bark and Wood Borers Including Galleries and Exit Holes
Bark and wood borers are insects whose larvae feed under bark or within wood. On exam questions, the key is to connect three things: where the insect is feeding, what the feeding leaves behind, and what the pattern suggests about the tree’s condition and timing.
Foundational Concepts You Must Match to Symptoms
Bark borers typically attack the inner bark (phloem and cambium region). Wood borers typically feed in sapwood or heartwood. The tree’s response differs: bark borers often leave pitch tubes, bark flaps, or winding galleries just under the bark, while wood borers more often leave frass in tunnels and exit holes on the trunk or branches.
A “gallery” is the tunnel system created by feeding larvae. “Frass” is insect waste that can appear as sawdust-like material, pellets, or packed debris. “Exit holes” are the round openings where adults leave; their size and shape can help narrow the group.
Mind Map: Bark and Wood Borers
Under-Bark Galleries and What They Mean
When you remove a strip of bark, you may see galleries that look like scribbles, winding tracks, or tight, organized patterns. Winding galleries often indicate larvae moving as they feed along the inner bark. Parallel galleries can suggest more uniform feeding direction relative to the tree’s tissues.
Pitch tubes are a classic clue for many bark borers on conifers. They look like small, resinous protrusions at the bark surface. The tree is trying to seal the entry points, so pitch tubes often appear where adults laid eggs or where larvae entered.
Bark flaps are another exam-friendly sign. If you see loosened bark that can lift away in patches, it often means feeding disrupted the living tissues beneath, and the bark lost its support.
Wood Tunnels, Frass, and Exit Holes
Wood borers create tunnels that may be difficult to see unless you cut or probe the wood. The most practical field evidence is frass. If you find sawdust-like material in bark crevices or at the base of an infested area, it suggests larvae are actively feeding in wood.
Exit holes are typically round and consistent in size for a given borer group. A cluster of exit holes on one side of a trunk can indicate a localized infestation, such as where a weakened area allowed entry. On branches, exit holes may be concentrated near pruning wounds or mechanical injuries.
A useful reasoning step for exams: if you see exit holes but no obvious pitch or under-bark galleries, the feeding may have been deeper in wood. If you see under-bark galleries and pitch but few exit holes, the infestation may be earlier in its life cycle or confined to the bark region.
How to Interpret Gallery Shape Without Overthinking
Gallery shape is a clue, not a magic fingerprint. Still, exam questions often expect you to recognize broad patterns.
- Winding galleries under bark: consistent with bark-feeding larvae.
- Tunnels in wood with frass: consistent with wood-feeding larvae.
- Organized, star-like patterns in cross section: can indicate certain borers that radiate feeding paths.
If the question provides a diagram, focus on two features: the feeding zone (under bark versus within wood) and the directionality (winding versus radiating versus parallel).
Example: Matching Evidence to the Likely Borer Type
A street tree shows thinning canopy and bark peeling in strips. When bark is lifted, you find winding galleries in the inner bark and small resin blobs at the entry points. The trunk also has no obvious round exit holes.
Best match: bark borer activity. The reasoning is straightforward: inner bark galleries plus resin at entry points points to under-bark feeding, and the lack of exit holes suggests the adults have not yet emerged or the question is describing an earlier stage.
Example: Exit Holes and Frass on a Branch
A recently pruned branch has multiple small round exit holes clustered near the cut end. You also find packed frass in bark cracks around the branch collar.
Best match: wood borer activity associated with the branch. The reasoning is that exit holes indicate adult emergence, and frass in cracks suggests larvae were feeding within wood rather than only in the inner bark.
Practical Field Checklist for Exams
- Identify feeding zone: under bark or in wood.
- Look for frass type and location.
- Note exit hole presence, size consistency, and clustering.
- Use gallery pattern only after confirming zone.
- Tie it to tree condition: stressed or recently injured trees are more likely to show successful borer establishment.
Mind Map: Evidence-to-Conclusion Links

7.4 Sap Feeders Including Aphids Scale and Their Effects
Sap-feeding insects are built for one job: insert a mouthpart into plant tissue and drink the plant’s fluids. In urban trees, aphids and scale are the most common exam targets because their symptoms are often obvious, their life cycles are predictable, and their effects range from cosmetic to serious.
Foundational Concepts of Sap Feeding
Sap feeders target either phloem or other sap-conducting tissues. When they feed, they remove nutrients and also inject saliva that can interfere with plant function. The plant responds in two main ways: it may produce new growth that looks “fine” at first but becomes a feeding buffet, or it may show localized stress where feeding occurs.
A key exam idea is that symptoms often reflect both feeding and plant byproducts. Many sap feeders excrete honeydew, a sugary waste that encourages sooty mold and attracts ants. So, when you see sticky leaves or black film, you’re not just seeing “mess”—you’re seeing an indirect clue about sap feeding.
Aphids and Their Effects
Aphids are soft-bodied insects that typically cluster on tender shoots, leaf undersides, and new growth. Their feeding causes curling, distortion, and stunted shoots because the plant’s nutrient flow is disrupted where the insects cluster.
What You See
- Leaf curling and puckering: Often starts on new leaves because they’re easier to penetrate.
- Sticky honeydew: Leaves may feel tacky; ants may be present.
- Sooty mold: Black, wipeable-looking growth on honeydew-covered surfaces.
Why It Matters
Aphids can reduce growth by draining resources from actively growing tissues. In heavy infestations, they can also weaken trees during periods when the tree is already managing stress, such as drought or heat.
Easy Example
Imagine a young street maple with fresh spring flush. Two weeks later, the newest leaves are curled and the shoot tips look “bent” and uneven. If you check the underside of the curled leaves and find small clusters, you’re likely looking at aphids. The sticky feel and ants on the trunk add supporting evidence.
Scale Insects and Their Effects
Scale insects are protected by a waxy or shell-like covering. Because of that armor, they’re less mobile and often harder to spot early. Many scales feed on stems, branches, or leaf surfaces, and their feeding can cause yellowing, thinning, and reduced vigor.
What You See
- Small bumps or shells: Often in rows or patches on twigs and branches.
- Chlorosis and leaf drop: Leaves may yellow and fall prematurely.
- Honeydew and sooty mold: Similar indirect signs as aphids.
Why It Matters
Scale feeding is frequently more persistent than aphid outbreaks. Even if the tree doesn’t look “dramatically sick,” repeated feeding can gradually reduce vigor, especially on stressed trees or in shaded, poorly ventilated sites.
Easy Example
A homeowner reports a sidewalk tree with branches that look dull and slightly bare. On closer inspection, you find many small, immobile, tan or gray bumps on the twigs. The bark around them may show soot staining. That pattern fits scale feeding more than mobile insects.
Differentiating Aphids Versus Scale in Exam Scenarios
Use symptom location and insect mobility as your first filters.
- Aphids: Usually on new growth; you can often find clusters of soft-bodied insects.
- Scale: Usually on woody surfaces; you find immobile coverings.
Then confirm with indirect signs.
- Honeydew + sooty mold: Supports sap feeding but doesn’t identify the species.
- Ant activity: Often tracks honeydew.
Mind Map: Sap Feeders and Their Diagnostic Effects
Integrated Field Workflow for Exam-Style Diagnosis
- Start with symptom pattern: Are leaves curled on new growth, or are there bumps on twigs?
- Check for honeydew signs: Look for stickiness, ants, and sooty mold.
- Confirm with direct observation: Aphids should be found as clusters; scale should be found as immobile coverings.
- Assess tree context: If the tree is already stressed, sap feeding effects are more likely to be noticeable.
Example: One Tree, Two Clues
A mature elm shows black sooty patches on leaves and ants on the trunk. On leaf undersides you find aphid clusters, and the newest shoots are slightly distorted. The sooty mold explains the black film, the aphids explain the honeydew source, and the shoot distortion ties the feeding to active growth.
Example: Another Tree, Different Pattern
A small ornamental linden has yellowing leaves and reduced shoot vigor. You find immobile, waxy bumps on twigs, plus soot staining around feeding sites. The location and immobility point to scale, and the persistent feeding explains the gradual decline rather than a sudden outbreak.
Sap feeders are a classic “symptoms plus location plus confirmation” topic. When you treat honeydew and sooty mold as clues to sap feeding rather than the whole story, aphids and scale become much easier to sort correctly under exam pressure.
7.5 Integrated Pest Management Fundamentals for Arborists
Integrated Pest Management (IPM) is a decision process: you identify what’s happening, decide whether intervention is actually needed, choose the least disruptive option that will work, and then verify results. For arborists, the “least disruptive” part matters because trees are long-lived, and many treatments can affect people, pets, beneficial insects, and the tree’s own recovery.
Step 1: Set Goals and Define the Problem
Start by translating symptoms into a pest problem statement. For example: “Honeylocust leaves are stippled and turning yellow in a parking lot row” is more useful than “tree looks bad.” Your goal might be to reduce feeding damage to acceptable levels, protect a target tree, or prevent spread to nearby trees.
A practical threshold approach helps. If a few leaves show minor spotting on a mature tree and the canopy is otherwise normal, you may monitor rather than treat. If the same pattern appears on many trees, or new growth is being heavily damaged, action becomes more reasonable.
Step 2: Identify the Pest and Confirm the Cause
IPM avoids treating “the symptom.” Confirm whether the issue is caused by insects, mites, pathogens, or abiotic stress. Look for consistent evidence: feeding sites, life stages, frass, webbing, galleries, or characteristic leaf stippling patterns.
Easy example: spider mites often cause fine stippling and a dull, dusty look on leaves, especially during hot dry weather. If you see stippling plus tiny moving mites on the underside of leaves, you’ve got a stronger case than if you only see yellowing with no pest evidence.
Step 3: Inventory the Site and Understand the Tree’s Context
Pests don’t exist in a vacuum. Record tree species, age, vigor, irrigation history, soil conditions, and nearby host plants. A stressed tree is more vulnerable, and stressed trees also change the “cost” of treatment because recovery may be slower.
Example: aphids on stressed maples may be more persistent when irrigation is inconsistent. Fixing water stress can reduce honeydew and sooty mold even before any insect control is applied.
Step 4: Monitor and Use Simple Sampling
Monitoring should be repeatable. Choose a few representative trees and specific branches or leaf positions. Check at consistent intervals and note changes in pest numbers, leaf damage, and natural enemies.
A straightforward method: inspect 10 leaves per tree from the upper and lower canopy, then repeat the same pattern next visit. If damage is increasing while pest counts rise, you’re seeing active pressure. If counts drop and beneficial insects are present, you may be watching natural control.
Step 5: Evaluate Management Options
IPM uses a hierarchy, not a single magic product.
- Cultural controls: adjust irrigation, improve soil aeration, correct planting depth, and remove competing stressors.
- Mechanical controls: prune out heavily infested shoots, remove infested material when feasible, and manage debris that shelters pests.
- Biological controls: protect predators and parasitoids by avoiding unnecessary broad-spectrum sprays.
- Chemical controls: use when needed, target the pest, and follow label directions.
Example: if scale insects are concentrated on a few branches, pruning those branches can reduce the pest load without spraying the entire canopy.
Step 6: Choose the Right Intervention and Time It
Timing is often the difference between “works” and “doesn’t.” Many insects have vulnerable stages, such as crawler stages for some scales. If you apply treatment when the pest is protected inside bark or in a less susceptible stage, results are inconsistent.
A neutral rule of thumb for exam scenarios: if the question describes early detection and a specific life stage, the best answer usually involves timing and targeted action rather than general treatment.
Step 7: Apply Responsibly and Minimize Non-Target Impacts
When chemical control is part of the plan, integrate it with the rest of IPM. Use spot treatments when possible, avoid unnecessary applications, and consider how treatment might affect beneficial insects.
Example: if you observe lady beetles and lacewing larvae actively feeding on aphids, a broad-spectrum spray could remove the very helpers that are already reducing the pest.
Step 8: Verify Results and Adjust
After intervention, re-check the same monitoring points. Look for pest reduction, reduced new damage, and recovery of new growth. If pest numbers rebound quickly, revisit identification, timing, and whether the tree’s stressors were addressed.
A simple verification checklist: pest counts down, fresh damage slowing, and natural enemies still present.
Mind Map: IPM Decision Flow for Arborists
Example: Putting IPM into an Exam-Style Scenario
A question describes: “New leaf growth on a young ornamental tree shows curling and sticky residue. Several small insects are clustered near tender shoots. Beneficial insects are also visible on nearby leaves.”
A strong IPM response: confirm the insects on tender shoots, monitor a few shoots for increasing counts and new damage, and prioritize options that reduce pest pressure while protecting beneficials. If the infestation is localized, mechanical removal of heavily infested shoots and targeted treatment timed to the pest’s susceptible stage can be more appropriate than a whole-canopy broad spray. Then verify by checking new growth on the same shoots for reduced curling and reduced sticky residue.
8. Abiotic Disorders and Environmental Stress Diagnosis
8.1 Water Related Disorders Including Drought and Overwatering
Water-related disorders are usually about the same core problem: the tree’s water balance no longer matches what the site provides. The exam loves this framing because it connects physiology to visible symptoms. Start with the basics, then use symptom patterns and site context to separate drought stress from overwatering stress.
Foundational Water Balance Concepts
Trees move water from roots to leaves to replace what evaporates from leaf surfaces. When water supply can’t keep up with demand, stomata close, leaf water potential drops, and growth slows. When water supply is excessive or poorly drained, roots can’t function normally because oxygen availability drops and pathogens gain an advantage.
A quick mental model helps: drought stress is “not enough water,” while overwatering stress is “water present but unusable.” Both can produce leaf wilting, but the timing, distribution, and soil conditions usually differ.
Drought Stress Symptoms and Diagnosis
Drought stress often shows up first in the parts of the tree that lose water fastest: fine twigs and outer crown. Leaves may curl inward, turn dull, and drop earlier than expected. In many species, leaf scorch appears as browning at margins or tips, especially on sun-exposed sides.
Look for clues in the site history. Recent irrigation failures, hot windy weather, compacted soil, or shallow rooting areas can all reduce effective water availability. Soil that dries quickly after watering is a common culprit.
A practical exam-style approach is to ask three questions:
- Is the symptom pattern consistent with water loss from leaves?
- Does the soil or root zone show dryness or poor water holding?
- Is the stress widespread or localized to one side or one part of the crown?
Example: A street tree shows leaf curl and tip scorch only on the south and west sides after a month with limited rainfall. The pattern matches higher evaporative demand and suggests drought stress rather than a uniform pathogen.
Overwatering Stress Symptoms and Diagnosis
Overwatering stress is not just “too much water.” It’s often “too much water plus not enough oxygen.” In poorly drained soils, roots experience low oxygen, which reduces nutrient uptake and weakens defenses.
Symptoms can include wilting that looks similar to drought, but the soil is wet or waterlogged. Leaves may yellow, growth may stall, and the crown may thin over time. In some cases, you’ll see dieback starting in lower or inner crown where waterlogging effects are strongest.
Diagnosis should include checking the root zone, not just the surface. If the soil remains saturated days after irrigation or rainfall, suspect drainage problems or irrigation mismanagement. Also consider planting depth and mulch practices that keep the root flare too wet.
Example: A newly planted tree wilts during warm afternoons, yet the soil under the mulch stays soggy and smells earthy after rain. The afternoon wilting can be misleading, but the wet root zone points to overwatering stress.
Differentiating Drought from Overwatering
Use symptom timing and distribution alongside soil observations.
- Soil condition: drought stress aligns with dry soil; overwatering aligns with saturated or persistently wet soil.
- Leaf behavior: drought often causes leaf curl and marginal scorch; overwatering more often shows yellowing and progressive decline.
- Pattern: drought frequently affects outer crown and sun-exposed areas first; overwatering may show more uniform decline or begin where drainage is worst.
If you only have one clue, soil moisture is usually the tie-breaker. The exam often provides that detail in the scenario.
Management Best Practices for Water Balance
For drought stress, the goal is to restore water availability without creating new problems. Deep, infrequent watering encourages roots to grow into the moist zone. Light, frequent watering can keep the surface wet while the deeper root zone stays dry.
For overwatering stress, the goal is to improve oxygen conditions and stop excess water. Reduce irrigation frequency, correct irrigation schedules, and address drainage constraints. If mulch is piled against the trunk or too deep, remove excess material to keep the root flare from staying constantly wet.
Example: A tree in a lawn area is irrigated daily by a sprinkler system. Leaves yellow and the soil stays wet. The fix is to adjust irrigation to a less frequent schedule and ensure the root flare is visible and not buried under mulch.
Mind Map: Water Related Disorders Including Drought and Overwatering
Case-Style Example Walkthrough
Scenario: A tree shows wilting and leaf yellowing. The soil under mulch is wet two days after irrigation, and the lower crown is thinning.
Reasoning: Wilting plus wet soil points away from drought. Yellowing and thinning in the lower crown fit reduced root oxygen and impaired uptake. The best next step is to adjust irrigation and correct mulch placement, then re-check soil moisture in the root zone before adding more water.
8.2 Soil and Root Zone Issues Including Compaction and Drainage
Healthy trees can’t out-prune bad soil. In exam scenarios, soil and root zone problems usually show up as symptom patterns: slow decline, patchy vigor, dieback that tracks with wet or dry pockets, and roots that can’t do their job. Your job is to connect site conditions to root function, then to the likely management response.
Foundations of Root Zone Function
Roots need three things in the root zone: oxygen, water, and usable nutrients. Oxygen comes from pore space in soil; water moves through pores and is held by soil particles; nutrients arrive with water and are taken up by root surfaces. When soil structure changes, the balance shifts.
A useful way to think about soil is as a mix of solids, water, air, and pore space. If compaction reduces pore space, oxygen drops even if the soil looks “moist enough.” If drainage is poor, water fills pores and oxygen drops again. Either way, roots respond with reduced growth, impaired uptake, and increased susceptibility to stress.
Compaction and Its Root Effects
Compaction happens when traffic, equipment, or repeated footfall compresses soil particles and collapses pore spaces. The surface may look firm and stable, but the root zone can become a low-oxygen environment.
Common exam clues include:
- Symptoms concentrated where equipment or parking occurs.
- Turf or groundcover that stays greener while the tree declines, because roots are the limiting factor.
- Poor root architecture, such as fewer fine roots near the compacted zone.
Root responses are predictable. Fine roots are the first to suffer because they have high oxygen demand and limited ability to penetrate dense soil. As fine roots decline, water uptake becomes inconsistent, so leaves may wilt during warm periods even when the soil is not completely dry.
Compaction Severity Indicators
Look for signs that suggest reduced infiltration and oxygen availability:
- Water pooling after rain.
- Hard crust or resistance when probing the soil.
- Roots that circle or remain shallow, especially near sidewalks or compacted beds.
Drainage and Waterlogging
Drainage problems include slow infiltration, perched water tables, and soils that remain saturated for long periods. In saturated conditions, oxygen diffusion slows dramatically. Roots shift from active growth to survival mode, and decay organisms gain an advantage.
Exam scenarios often describe symptom timing. If decline accelerates after wet seasons or after irrigation changes, drainage becomes a prime suspect. If symptoms are patchy, check for microtopography: slight depressions can create persistent wet pockets.
Distinguishing Wet Stress from Drought Stress
Wet stress can mimic drought stress because roots can’t take up water without oxygen. A practical field approach is to compare soil moisture and symptom distribution:
- If wilting occurs alongside consistently wet soil, suspect waterlogging.
- If wilting aligns with dry, crusted areas and compacted zones, suspect compaction limiting infiltration and root access.
Integrated Diagnosis Workflow
Use a stepwise logic chain: site condition → soil behavior → root function → symptom pattern.
- Map the root zone conditions: identify traffic areas, construction impacts, irrigation patterns, and low spots.
- Observe symptom distribution: is decline uniform or aligned with specific zones?
- Check soil behavior: infiltration and pooling after rain, soil resistance, and visible signs of saturation.
- Confirm with root zone evidence: shallow roots, reduced fine roots, or root flare issues that suggest restricted rooting volume.
- Select the most likely limiting factor: oxygen limitation from compaction or waterlogging, or both.
Mind Map: Soil and Root Zone Issues
Example: Sidewalk Edge Decline
A street tree shows thinning leaves and branch dieback only on the side adjacent to a sidewalk. The soil there is hard and the tree’s roots appear shallow near the curb.
Reasoning: sidewalk construction and maintenance likely compacted the soil and reduced pore space. Fine roots near the compacted zone can’t access oxygen and water reliably. The rest of the root zone may still function, so decline is localized.
Best-practice response: protect the root zone from further traffic, avoid adding more soil over the root flare, and improve rooting conditions through appropriate soil aeration or structural soil approaches where permitted. The goal is to restore pore space and allow roots to expand into a usable volume.
Example: Wet Pocket After Irrigation Change
After a sprinkler schedule change, a cluster of trees develops yellowing and wilting during warm afternoons. Soil checks show persistent dampness in shallow depressions between planting beds.
Reasoning: the irrigation increase likely created waterlogged pockets. Roots in those pockets experience oxygen deprivation, so uptake fails even though the soil is wet. The symptom pattern follows the depressions, not the entire site.
Best-practice response: adjust irrigation to reduce saturation, correct grading if feasible, and ensure water is directed away from low areas. Protecting the root zone from additional compaction during adjustments matters because the two problems often travel together.
8.3 Chemical Injury Including Herbicide and Salt Damage Patterns
Chemical injury shows up when a tree’s normal physiology meets the wrong chemical, in the wrong place, at the wrong time. For exam purposes, the key is pattern recognition: where symptoms appear, how they spread, and what else is happening in the site environment.
Foundational Concepts for Interpreting Chemical Injury
Start with exposure pathways. Herbicides often reach trees through spray drift, root uptake from contaminated soil, or direct contact with foliage and bark. Salt injury typically comes from de-icing salts that move with meltwater, then concentrate as water evaporates or is pulled upward through capillary action.
Next, connect exposure to plant anatomy. Many herbicides interfere with growth processes in actively growing tissues, so symptoms often appear first on new leaves, shoots, or cambial regions. Salt moves with water, so symptoms often track the wetted zone, especially around the root flare and lower trunk.
Finally, separate chemical injury from disease. Chemical injury tends to be more uniform across similarly exposed plants or similarly positioned parts of one tree, while many pathogens create patchy, expanding lesions with distinct margins.
Herbicide Injury Patterns
Herbicide symptoms depend on the chemical class, but the exam-friendly approach is to look for consistent “dose and contact” clues.
1) Spray drift and foliage contact
- Symptoms appear on the side facing the spray source or on the upper canopy where droplets landed.
- Leaves may show distorted growth, chlorosis, or necrotic spotting that follows the distribution of droplets.
- New growth is often the first to look wrong, because it is actively dividing.
2) Root uptake from contaminated soil
- Symptoms are more likely to appear in the whole crown rather than only the sprayed side.
- The timing can be delayed: roots may take up the chemical, and visible effects emerge after growth processes are disrupted.
- Trees may show reduced vigor before obvious leaf discoloration.
3) Bark contact and girdling-like effects
- Direct contact with herbicide applied near the trunk can cause localized dieback.
- The pattern may be a band or patch where the chemical contacted bark, sometimes with callus attempts at healing.
A practical example: a row of young maples near a sidewalk shows leaf distortion only on the side closest to a weed-control truck. The pattern matches drift and contact, not a pathogen, because the symptoms align with exposure direction and appear quickly after application.
Salt Injury Patterns
Salt injury is strongly tied to water movement. Meltwater carries salts into the soil, then salts accumulate where water lingers.
1) Root zone and lower trunk symptoms
- Leaf scorch often begins on older leaves because salts disrupt water uptake and cause dehydration.
- The crown may show thinning or early leaf drop if the root zone remains salty.
- On the trunk, you may see bark stress near the base, especially where splash and meltwater concentrate.
2) Soil surface crust and uneven distribution
- Symptoms can be uneven across the site if snow piles or plowing patterns concentrate salts.
- Trees closest to curb lines, parking edges, or areas with repeated salting often show the earliest effects.
3) “Burn then recover” timing
- Some trees show scorch that later improves as new growth forms, but repeated exposure keeps the stress cycle going.
- In an exam scenario, this matters: if symptoms match a recent winter salting event and correlate with curb proximity, salt injury is a strong candidate.
A practical example: a street tree shows leaf scorch primarily on the lower half of the crown and the most affected leaves are older. The soil around the root flare has a crusty, salty residue after winter. That combination points to salt stress rather than a foliar disease.
Mind Map: Chemical Injury Recognition
Integrated Diagnosis Workflow for Exam Scenarios
- Identify the exposure context: recent weed control, construction herbicide use, or winter de-icing practices.
- Map symptom distribution: one-sided drift pattern versus whole-crown root uptake; lower-crown scorch versus scattered leaf spots.
- Check tissue age: herbicide often hits new growth first, while salt commonly shows scorch on older leaves.
- Compare site positions: curb proximity, snow pile locations, and areas with repeated chemical contact.
- Decide the most likely chemical injury type, then support it with the pattern evidence rather than a single symptom.
Example: Choosing Between Herbicide and Salt Injury
A scenario describes a tree with older leaves showing marginal scorch, strongest near the base, and the soil around the root flare has visible residue after winter. The symptoms are concentrated along the curb line. The best answer is salt injury because the distribution matches meltwater movement and the leaf age pattern aligns with dehydration from impaired water uptake.
Example: Choosing Between Drift and Root Uptake
Another scenario shows distorted new shoots on the side of the canopy facing a recently sprayed area, with minimal symptoms on the opposite side. The most likely cause is herbicide drift and contact because the pattern follows droplet deposition and new growth is affected first.
8.4 Mechanical Injury Including Mowers Trimmers and Construction Impacts
Mechanical injury is damage caused by physical contact—blades, wheels, impacts, or abrasion. In exam scenarios, the key is to connect the type of injury to the likely location, severity, and tree response you would expect to see.
Foundations: What Mechanical Injury Does to Trees
Trees respond to wounds by compartmentalizing and forming barriers, but the response depends on how deep and how wide the damage is. A shallow scrape may dry and seal quickly, while a girdling cut or repeated abrasion can keep exposing living tissue. The exam-friendly way to think about it is: mechanical injury changes the tree’s ability to move water and defend against decay.
Start with three observations you can usually make in the field:
- Where is the injury? Roots, trunk base, scaffold branches, or crown.
- How did it happen? Cutting, crushing, rubbing, or impact.
- How much tissue is affected? Small spot versus continuous band.
Mowers and Trimmers: Common Patterns and Diagnosis
Mowers and string trimmers mainly injure the lower trunk and root flare. The most common pattern is repeated contact that creates a ring of scarring or a series of overlapping cuts.
Typical signs
- Trunk base scarring: irregular, shallow cuts or scrapes around the first few inches above grade.
- Root flare abrasion: damage that follows the contour of the flare where the bark is thinner.
- Bark loss with exposed wood: more severe when trimmer lines strike at an angle.
Easy-to-understand example A young street tree has a smooth, pale trunk with a rough band at the base. The band is about the height of mower deck contact, and it appears year after year. The likely cause is mower contact, not a disease, because the injury is localized to the mowing height and matches equipment geometry.
What to look for in exam questions
- If symptoms are symmetrical around the trunk at mowing height, think mechanical abrasion.
- If dieback is above the wound but not uniformly across the crown, consider disrupted water movement from damaged tissue.
Construction Impacts: Soil Compaction and Physical Damage
Construction injuries often show up as both below-ground and above-ground problems. Even when you see a broken branch, the more serious issue may be root zone damage.
Soil compaction Compaction reduces pore space, limiting oxygen and water movement to roots. Symptoms can include thinning canopy, small leaves, and delayed leaf-out, but the timing varies with season and stress level.
Grade changes and root exposure
- Fill placed against the trunk can bury the root flare, increasing bark decay risk.
- Excavation removing soil can expose roots and reduce stability.
Physical impacts
- Vehicle or equipment strikes can cause trunk wounds, cavities, or cambium damage.
- Material storage near the tree can crush roots and abrade bark.
Easy-to-understand example After sidewalk replacement, a tree’s lower trunk shows a fresh scrape where a skid steer likely contacted it. The canopy later becomes patchy, and the soil around the trunk is hard and dry compared to nearby areas. The combined evidence points to both direct trunk injury and root zone compaction.
Severity Levels and How They Affect Tree Response
Mechanical injuries range from minor to severe. In practice, severity is driven by depth, width, and continuity.
- Minor abrasion: small surface scrapes; bark may callus over.
- Moderate cuts: exposed wood or partial bark removal; compartmentalization barriers form but may be slower.
- Severe girdling: continuous ring of damage; water transport can be interrupted, leading to decline above the wound.
Exam logic If the question describes a continuous band around the trunk, prioritize the possibility of girdling and water transport disruption. If it describes scattered small cuts at one height, prioritize abrasion and localized stress.
Integrated Best Practices for Prevention and Mitigation
Prevention is mostly about controlling contact and protecting the root zone.
For mowing and trimming
- Maintain a mulched or managed buffer around the trunk base so equipment doesn’t contact bark.
- Use height-appropriate trimming and avoid striking the trunk during edging.
- Train crews to treat the root flare as a protected zone, not a “free-for-all” edge.
For construction
- Install physical barriers to keep equipment out of the root zone.
- Define and protect the critical root zone area before work begins.
- Avoid grade changes that bury the root flare or expose roots.
Easy-to-understand example A site plan shows a barrier placed around the tree’s root zone before excavation. After work, the trunk base remains intact, and the soil surface inside the barrier is not churned. The tree may still need monitoring, but the most preventable mechanical injuries were avoided.
Mind Map: Mechanical Injury Diagnosis and Control
Case-Style Example: Choosing the Most Likely Cause
A question describes a tree with a rough, continuous band around the trunk at about 10 inches above grade. The band matches the height where maintenance equipment runs, and there are no leaf spots or fungal fruiting bodies. The most likely cause is mechanical girdling or repeated abrasion from mowing or trimming, because the pattern is continuous, height-specific, and equipment-shaped.
Quick Checklist for Exam Scoring
- Is the injury height-specific and equipment-shaped? (Mowers/trimmers)
- Is there evidence of soil disturbance near the root zone? (Construction)
- Is the damage continuous around the trunk? (Potential girdling)
- Does the symptom pattern fit localized decline above a wound? (Water transport disruption)
- Are the best prevention steps consistent with the cause? (Buffer, barrier, root flare protection)
8.5 Interpreting Symptom Distribution Across the Site
Symptom distribution is the map of where the tree is struggling and why. Instead of treating each leaf spot, dieback patch, or wilting tree as an isolated event, you look for patterns in space, time, and plant-to-plant differences. On the exam, the best answers usually connect the pattern to the most likely cause.
Foundational Pattern Thinking
Start with three questions.
- Is the problem clustered or spread out? Clusters often point to localized factors like irrigation leaks, soil compaction in one area, or a construction injury. Spread-out patterns often point to broader issues like drought, poor planting practices across a site, or a widespread pest pressure.
- Is the pattern uniform across the canopy or concentrated in parts? Uniform canopy symptoms can suggest systemic stress (water or root function). One-sided or edge-focused symptoms often suggest exposure differences such as sun, wind, salt spray, or mechanical damage.
- Does the severity change with micro-site conditions? If trees closer to a sidewalk crack show more decline, the sidewalk zone may be altering soil moisture, oxygen, or root space.
A quick field habit helps: mark a simple grid on your mental map. Then compare trees within the same grid cell. If symptoms match within cells but change between cells, you likely have a site factor.
Symptom Distribution Categories You Can Use Immediately
Linear Patterns
Linear patterns follow a line: a trench, curb, utility corridor, or mowing edge. For example, a row of trees showing leaf scorch only on the side facing a road can reflect salt spray or heat reflection. If dieback starts near a utility cut and progresses along the line, suspect root disruption or altered drainage.
Patchy or Island Patterns
Patchy “islands” often indicate localized soil or moisture conditions. Imagine a lawn area where one section stays wetter due to a sprinkler misalignment. Trees in that patch develop chronic decline, while nearby trees remain normal. In exams, patchy distribution is a strong clue for waterlogging, root rot, or uneven irrigation.
Gradient Patterns
A gradient changes gradually across the site, such as worsening symptoms from the top of a slope to the bottom. This can reflect water movement, soil depth, or nutrient leaching. If trees at the low point show more chlorosis and smaller leaves, the site may be holding water longer or limiting oxygen.
Random Patterns
Random distribution is less helpful for pinpointing a single site cause. It can still happen with pests that move irregularly or with multiple independent stressors. When symptoms are truly random, the exam often expects you to consider disease cycles, insect feeding behavior, or individual tree factors like planting depth.
Linking Distribution to Likely Mechanisms
Once you identify the pattern, connect it to a mechanism.
- Water availability issues often produce canopy-wide or whole-tree symptoms, especially wilting, reduced leaf size, early leaf drop, or dieback from the top.
- Root zone oxygen problems can show up as decline in low spots or areas with compacted soil, with symptoms that persist even when surface conditions look similar.
- Chemical injury commonly shows edge effects or directional patterns, such as leaf burn near sidewalks where de-icing salts accumulate.
- Mechanical injury tends to be localized to the wound location, then expands through secondary effects like decay or girdling.
A useful exam mindset: distribution tells you where the stressor is. Mechanism tells you what the tree would do in response.
Mind Map: Site Symptom Pattern Reasoning
Example: Turning Observations into an Answer
Scenario: In a parking lot, three trees show early leaf drop and thinning crowns. All three are within 10 feet of a storm drain outlet. Trees 30 feet away look normal.
Pattern call: Clustered near a specific site feature.
Mechanism link: The storm drain area likely changes soil moisture and oxygen. Standing or frequently saturated soil can impair root function, leading to canopy-wide decline.
What not to assume: Don’t jump straight to a leaf disease just because leaves dropped. Leaf drop can be a symptom of root stress, and the distribution points to the root zone.
Example: Directional Clues
Scenario: A row of street maples shows scorch only on the south and west sides. The tops remain mostly green.
Pattern call: Edge-focused and directional.
Mechanism link: Directional exposure suggests heat reflection, wind-driven salt spray, or localized chemical contact. If the tops were uniformly affected, water stress would be more likely.
Example: Gradient on a Slope
Scenario: On a hillside, trees near the bottom of the slope show chlorosis and smaller leaves. Trees higher up are healthier.
Pattern call: Gradient.
Mechanism link: Water movement and soil depth differences can create low-oxygen or nutrient-imbalanced conditions at the bottom. The exam expects you to treat the site as the driver, not the individual leaf symptoms.
Practical Field Checklist
Before choosing a cause, confirm:
- The pattern type (cluster, linear, patchy, gradient, random)
- Where symptoms appear on the tree (whole canopy, one side, near wounds)
- Whether severity tracks with micro-site features (pavement, low spots, drainage lines)
When these three align, your diagnosis becomes less guesswork and more reasoning. The tree is telling you where the problem lives; your job is to read the address.
9. Tree Risk Assessment and Structural Evaluation
9.1 Risk Concepts and How They Differ From Hazard
Risk and hazard get mixed up in everyday conversation, which is why exam questions love them. A hazard is the condition that can cause harm. Risk is the chance that the hazard will actually lead to harm, given who is exposed and under what circumstances. Think of it as: hazard is the “what,” risk is the “how likely, how bad, and to whom.”
Core Definitions You Can Use Under Pressure
A hazard might be a dead branch over a sidewalk, a cavity in a trunk, or a root plate heaving near a driveway. The hazard exists whether or not anyone is standing under it.
A risk combines three elements:
- Likelihood that the hazard will cause an event (for example, branch failure).
- Consequence if the event occurs (injury severity, property damage).
- Exposure meaning how often and how many people or assets are in the potential impact zone.
If you want a quick mental check: two trees can have the same hazard, but different risk because exposure and likelihood differ.
Hazard Versus Risk with Concrete Examples
Example 1: Same hazard, different exposure. A small dead limb hangs over a rarely used service alley. The limb is still a hazard, but the risk is lower because fewer people are exposed and the time spent under the limb is limited.
Example 2: Same exposure, different hazard severity. Two branches over the same walkway: one is a pencil-thin dead twig, the other is a thick, decayed limb with included bark and visible cracking. The walkway exposure is the same, but the hazard severity differs, so risk differs.
Example 3: Same hazard severity, different likelihood. A cavity exists in both trees, but one cavity is dry and compartmentalized with minimal decay indicators, while the other shows active decay signs and progressive structural defects. Consequence might be similar, but likelihood changes.
How Arborists Translate Observations into Risk
Risk assessment starts with identifying hazards and then mapping them to potential failure modes. A cavity is not automatically “falling.” It suggests a set of likely failure mechanisms such as reduced load-bearing capacity or localized breakage.
Next, you estimate likelihood using evidence you can see and measure:
- Condition indicators like decay-associated features, cracks, or abnormal growth.
- Tree stability cues such as leaning, root plate disturbance, or soil heave.
- Site factors like wind exposure, traffic patterns, and recent weather.
Then you evaluate consequence by considering what would be hit and how:
- Pedestrians versus vehicles.
- Head-height impact zones versus lower-risk areas.
- Whether the target is hard (car) or soft (person), and the likely injury mechanism.
Finally, you combine these with exposure:
- How often people pass.
- Whether barriers or reroutes reduce time in the impact zone.
- Whether the hazard is directly above the target or offset.
Mind Map: Risk Concepts and Their Relationships
A Systematic Walkthrough from Observation to Risk
- Spot the hazard. You notice a large dead limb with bark loss and a visible crack at the attachment.
- Choose the failure mode. The evidence points to limb detachment rather than gradual shedding.
- Estimate likelihood. A thick limb with decay indicators and a crack increases the probability of failure, especially if the site is wind-exposed.
- Estimate consequence. The limb overhangs a bus stop where people stand at head height.
- Estimate exposure. The bus stop is used frequently, so the time people are under the limb is meaningful.
- Combine the pieces. High likelihood plus high consequence plus frequent exposure produces higher risk than a similar limb over a low-traffic area.
Quick Exam-Style Distinctions
- If the question asks what a hazard is, focus on the condition.
- If it asks what risk is, include likelihood, consequence, and exposure.
- If it asks why two hazards differ in risk, look for differences in exposure or likelihood, not just the visible defect.
Mini Case Study: Same Tree, Different Risk
A mature street tree has a cavity in the trunk. On one side, the cavity is above a parking lane; on the other, it is above a sidewalk separated by a low barrier. The cavity is the hazard in both directions. Risk is higher where exposure is greater and where the barrier does not reduce time in the impact zone. The tree did not change, but the risk did because the exposure and potential targets differ.
9.2 Visual Tree Assessment Methods and What to Look For
A visual tree assessment is a structured look at what you can see now, paired with a disciplined guess about what those observations likely mean. The goal is not to “diagnose everything,” but to sort observations into categories that match how trees fail: loss of structure, loss of function, and loss of stability.
Start with the Scene and the Tree’s Story
Begin with context before you stare at bark. Note the tree’s location relative to targets (sidewalk, vehicles, buildings) and the direction of typical wind. Record site conditions that affect stress and decay, such as soil compaction, irrigation patterns, and nearby construction. Then scan the whole tree from a distance for overall symmetry, canopy density, and obvious defects.
A quick rule: if you can’t explain the tree’s condition using the site and the tree’s form, you’re probably missing a key observation.
Use a Consistent Walk-Up Sequence
A repeatable sequence reduces missed details. One practical order is: base and root flare, trunk and major unions, canopy and branch structure, then back to the base for confirmation.
At the base, look for root flare visibility, soil level changes, and girdling roots. Check for abnormal buttress shape, exposed roots, and signs of chronic moisture such as persistent dark staining or fungal fruiting. Move upward to the trunk for cracks, cankers, cavities, and bark sloughing. In the canopy, look for dead branches, epicormic shoots, weak branch attachments, and unusual leaf size or color.
Identify Defects That Matter for Risk and Health
Not all visible issues are equal. Prioritize observations that connect to failure pathways.
- Structural defects: cracks, cavities, included bark, codominant stems with poor attachment, and branch stubs.
- Decay indicators: fruiting bodies, conks, advanced woodpecker holes, and soft or hollow sounding areas.
- Physiological stress indicators: thinning canopy, chlorosis, small leaves, premature leaf drop, and dieback patterns.
- Mechanical injury indicators: mower damage, trunk wounds, rope scars, and construction impacts.
Example: A tree with scattered dead twigs but otherwise intact structure may be a seasonal issue. A tree with repeated dieback from the same side plus trunk wounds near that side deserves closer attention because the pattern suggests a localized cause.
Read Patterns, Not Single Symptoms
Trees often show clues through distribution. Symmetry matters.
- Localized pattern: one side of the trunk with cankers and branch dieback suggests a targeted problem such as impact, sunscald, or a wound-associated infection.
- Diffuse pattern: widespread thinning across the crown can indicate root zone stress, chronic drought, or soil constraints.
- Bottom-up pattern: progressive decline from the lower crown can align with root dysfunction or shading and competition.
When you see a pattern, ask what mechanism could produce it. If the mechanism doesn’t fit, re-check your observations.
Confirm with Simple Field Checks
Visual assessment becomes stronger when you add low-risk confirmation.
- Bark and cambium clues: note bark texture changes, peeling, and callus ridges around wounds.
- Branch attachment: look for bark inclusions, narrow angles, and signs of movement such as repeated branch breakage.
- Canopy architecture: assess whether the crown is balanced or leaning, and whether the lean matches the root flare condition.
- Sounding and probing: only if your safety and policy allow; treat results as supportive, not definitive.
Mind Map: Visual Assessment Workflow
Example: Turning Observations into a Clear Conclusion
A street maple shows thinning in the upper crown on the east side. At the base, the soil is heaped against the trunk, and a root flare is partially buried. The trunk has a shallow wound at about chest height on the east side, with callus forming around it. In the canopy, several branches on the east side have small dead tips and one larger branch has a visible stub.
A coherent assessment links these observations: buried flare and soil heaping can reduce oxygen at the root zone, while the east-side wound and dieback pattern suggest a localized stress or infection pathway. The stub and dead tips reinforce that the structural side has already experienced branch failure.
Example: When Symptoms Don’t Match the First Guess
A row of trees shows leaf discoloration after a recent irrigation change. One tree also has small conks at the base. The discoloration could be nutrient-related, but the conks point to decay activity. The correct approach is to separate the issues: treat the leaf symptoms as one category and the decay indicators as another, then decide whether they share a common cause such as chronic wetness.
Document What You See with Enough Specificity
Use clear notes tied to location: “trunk, 1.5 m above grade, east side” beats “near the trunk.” Record approximate extent, such as “cavity occupies about one-third of trunk circumference,” and note whether the defect appears active (fresh fruiting, recent callus) or older (weathered wounds). A good visual assessment reads like a map, not a mood.
9.3 Defects Including Cracks Cavities and Decay Associated Indicators
Defects are the exam’s favorite shortcut: they connect tree biology to real-world decisions. In risk assessment, you’re not just spotting “damage,” you’re identifying patterns that suggest how far a problem may have progressed and how it might affect stability or failure.
Foundational Concepts for Defect Interpretation
A defect is a structural change in wood or bark that can alter load paths. Cracks and cavities change geometry; decay changes material properties. The key exam move is to link each visible indicator to a likely internal condition, then judge how confident you can be based on evidence quality.
Start with three questions:
- Where is the defect? Location matters because load and compartment boundaries differ by height and branch attachment.
- What is the defect type? Cracks, cavities, and decay indicators each have different “typical stories.”
- How does the defect relate to targets and likelihood? Even a serious defect may be low risk if it’s far from likely impact zones.
Cracks and Associated Indicators
Cracks are separations in wood or bark. They can be superficial (limited to bark) or deeper (splitting along grain). The most testable crack cues are orientation, length, and whether edges show active separation.
Common crack patterns and what they suggest
- Vertical cracks along the trunk or branch: Often tied to stress, growth strain, or prior injury. If the crack edges remain open and the surrounding bark shows repeated injury, internal separation is more likely.
- Inclined or spiral cracks: Can occur where grain is irregular or where torsional forces acted during growth or storms.
- Wedge-shaped splits at branch unions: Often reflect weak attachment or prior branch failure. Look for discoloration or missing bark at the union.
Easy example A young street tree has a long vertical split on the south side after a winter freeze-thaw cycle. The bark around the split is peeling and the crack edges are still separated. In an exam scenario, you’d treat this as more than cosmetic because ongoing separation increases the chance of internal compartment disruption.
Cavities and Associated Indicators
A cavity is a loss of wood volume, usually from decay or mechanical removal. The exam expects you to treat cavities as “evidence of internal change,” not as the problem by itself.
Cavity cues that matter
- Wall thickness and shape: A shallow cavity with thick remaining walls is different from a deep cavity that approaches the center.
- Cavity depth relative to diameter: Deeper cavities reduce the effective load-bearing cross-section.
- Edges and surrounding bark: Crumbling edges, loose wood, or active moisture staining suggest ongoing deterioration.
- Presence of decay fruiting bodies: These are strong indicators that decay organisms are active.
Easy example A mature oak has a hollow at 6 feet with a smooth, stable rim and no loose wood. The cavity is shallow and the trunk still feels firm. In exam logic, you’d note that the cavity indicates prior damage, but the stability evidence supports a lower likelihood than a deep, crumbly hollow.
Decay Associated Indicators
Decay is the biological breakdown of wood. You rarely see decay directly; you infer it from indicators. The most reliable indicators are those that show biological activity or internal failure risk.
High-confidence indicators
- Fruiting bodies of fungi near the defect.
- Conks or shelf-like growths at the trunk or major unions.
- Mushroom emergence after wet periods at the same location.
Moderate-confidence indicators
- Discoloration that forms a consistent pattern around a wound.
- Soft or punky wood when probed carefully in real work (in exams, this becomes “described firmness vs softness”).
- Cracks that align with the defect zone and show separation.
Low-confidence indicators
- General discoloration without other supporting signs.
- Minor bark loss that could be normal shedding or minor injury.
Easy example A maple has a cavity at a branch union and a small conk appears on the inner wall after rain. The exam answer should treat this as a strong decay indicator, increasing concern about internal strength loss.
Integrating Defects into Risk Logic
To avoid gaps, connect defects to compartmentalization and load paths.
- Cracks can bypass compartment boundaries by opening separation lines.
- Cavities reduce cross-sectional area and may reflect decay progression.
- Decay indicators explain why wood properties may be reduced even if the outside looks “mostly fine.”
Then apply the risk triad:
- Defect severity (depth, extent, evidence strength)
- Target proximity (where failure would matter)
- Likelihood factors (tree condition, recent stressors, and whether the defect appears active)
Mind Map: Defects and Indicators
Example Scenario Walkthrough
A street elm shows a shallow cavity on the trunk at 4 feet. The cavity rim is firm, but there is a vertical crack extending upward from the rim. A small conk is present on the cavity wall.
A strong exam response would:
- Classify the defect set as cavity + crack + decay indicator.
- Use the conk as high-confidence decay evidence.
- Treat the upward crack as a sign of ongoing separation that may connect to internal deterioration.
- Conclude that severity is more than “cosmetic,” even if the cavity is shallow, because the decay indicator and crack alignment increase internal uncertainty.
This is the core pattern: defects are the visible part, and indicators tell you whether the invisible part is likely to be weakening the tree.
9.4 Target and Likelihood Considerations in Risk Scenarios
Risk assessment answers two questions: what could be harmed, and how likely it is to happen. “Target” is the person or property that could be affected. “Likelihood” is the chance that a failure event will occur within the assessment context. In exam scenarios, you’re usually given enough clues to separate these two ideas, even when the tree’s condition is only partly described.
Foundational Concepts for Target
A target can be people, vehicles, buildings, utilities, or anything with value that could be struck. The key is that targets are defined by exposure, not by your feelings about what matters. For example, a sidewalk next to a tree is a target because people occupy it. A fenced area with no regular access is a weaker target because exposure is limited.
Target severity is not the same as likelihood. A high-value target can still have low risk if exposure is rare or the failure probability is low. Conversely, a moderate target can create high risk if exposure is constant and failure likelihood is meaningful.
Foundational Concepts for Likelihood
Likelihood depends on whether the tree is likely to fail in the way described. It’s influenced by:
- Defect presence: cracks, cavities, decay indicators, poor attachment, or significant deadwood.
- Defect extent and location: a small defect in a low-load branch is different from a large defect near the trunk.
- Tree stability and loading: wind exposure, slope, root limitations, and branch leverage.
- Time and context: likelihood is assessed for the scenario’s conditions, such as “during normal weather” versus “during a storm.”
In exam questions, likelihood is often inferred from symptom strength and how directly it relates to the failure mode. If the scenario says “visible decay in a union” and “frequent wind,” likelihood rises because the defect matches the likely failure pathway.
How Target and Likelihood Combine
Most risk frameworks treat risk as a combination of likelihood and consequence. A simple way to reason through exam choices is to rank each factor separately, then look for answers that align with both.
- High likelihood + high consequence: prioritize action.
- High likelihood + low consequence: still consider mitigation, but urgency may be lower.
- Low likelihood + high consequence: manage exposure and monitor; the tree may still warrant attention.
- Low likelihood + low consequence: document and manage routinely.
Mind Map: Target and Likelihood Logic
Example: Branch Failure over a Sidewalk
Scenario: A mature oak has deadwood in the upper crown. The defect is described as “dry, brittle, and extensive,” and the branch is over a sidewalk used by pedestrians all day.
- Target: pedestrians on a frequently used sidewalk. Consequence is potentially high.
- Likelihood: deadwood plus extensive condition suggests a higher chance of branch failure, especially with wind loading.
Exam-style best answer: treat as a higher risk scenario because both factors point upward. Even if the tree is otherwise healthy, the described deadwood and exposure create a clear match between defect and failure mode.
Example: Root Flare Damage Near a Rarely Used Lot
Scenario: A street tree shows minor soil disturbance at the root flare after construction. The area is fenced and only accessed occasionally for maintenance.
- Target: limited exposure. Consequence is reduced because people are not regularly present.
- Likelihood: minor disturbance without strong decay or instability indicators suggests lower likelihood.
Exam-style best answer: lower priority than a similar defect over a busy walkway. The correct reasoning is not “ignore it,” but “the target is weak and the likelihood is not strongly supported by the symptoms given.”
Example: High Consequence Utility Line with Moderate Likelihood
Scenario: A large limb overhangs a utility line. The limb has a visible crack at the attachment, but no clear decay indicators are mentioned. Wind exposure is moderate.
- Target: utility line is high consequence because failure can disrupt service and create hazards.
- Likelihood: a crack increases likelihood, but the absence of decay indicators and moderate wind keeps it from being the highest category.
Exam-style best answer: prioritize mitigation or at least manage exposure, because consequence is high even if likelihood is only moderate.
Practical Exam Checklist for Target and Likelihood
When you see a scenario, do this in order:
- Identify the target and how often it’s occupied.
- Identify the failure mode implied by the defect description.
- Decide whether the defect is structurally relevant to that failure mode.
- Adjust likelihood using extent and loading details.
- Choose the answer that matches both rankings, not just one.
That’s the whole trick: targets tell you who gets hit, and likelihood tells you how often the tree’s problems line up with the way it could fail.
9.5 Practical Example Walkthroughs for Exam Style Risk Questions
Risk questions usually test whether you can connect three ideas: what could fail, how likely it is, and what would be harmed. The trick is to keep your reasoning in that order, even when the scenario tries to distract you with extra details.
Foundational Workflow for Every Scenario
- Identify the target: Who or what could be hit, and where is it located relative to the tree.
- Identify the failure mode: Branch drop, stem failure, root failure, or something else suggested by the defect.
- Estimate likelihood: Based on defect severity, tree condition, and site factors that affect stress.
- Estimate consequence: Based on target value and exposure, not on how dramatic the defect looks.
- Combine into a risk level: Use the exam’s logic, which typically weights likelihood and consequence.
A good habit is to write one sentence per step. If you can’t, you probably don’t have enough evidence yet.
Mind Map: Risk Question Reasoning
Risk Question Reasoning Mind Map
Example 1: Branch Drop with a Clear Target
Scenario: A mature oak over a sidewalk. A large dead branch is attached near a visible crack in the branch collar. The area is used daily.
Step 1: Target: The sidewalk is the target, with frequent exposure.
Step 2: Failure Mode: Branch failure from deadwood and a compromised attachment.
Step 3: Likelihood: Deadwood reduces the branch’s ability to resist load. The crack at the attachment suggests reduced structural integrity. Daily foot traffic doesn’t directly increase likelihood, but it confirms consistent exposure.
Step 4: Consequence: People are the target, and the sidewalk is frequently used, so consequence is high.
Step 5: Risk Level: High consequence plus elevated likelihood usually pushes the risk higher than “routine maintenance” cases.
Exam-style answer logic: If the question asks what to do first, prioritize the defect that can fail onto a frequently used target.
Example 2: Stem Cavity with Low Exposure
Scenario: A street maple has a hollow trunk section at about chest height. The hollow is stable-looking from the outside, and the tree is set back from the parking lane. Few cars pass directly beneath.
Step 1: Target: The parking lane is the main target, but exposure is limited.
Step 2: Failure Mode: Stem failure is the concern, but the scenario emphasizes an external cavity that appears stable.
Step 3: Likelihood: A cavity can indicate internal decay, but the question’s wording matters. “Stable-looking from the outside” suggests the defect may not be actively progressing or may not be severe enough to assume imminent failure.
Step 4: Consequence: Even if a failure would be serious, fewer vehicles passing beneath lowers exposure. Consequence is moderate rather than high.
Step 5: Risk Level: Likelihood may be moderate, consequence may be moderate, so overall risk may land in a lower band than Example 1.
Exam-style answer logic: Don’t let “hollow” automatically mean “highest risk.” The target and exposure details are part of the scoring.
Example 3: Root Zone Stress and Soil Saturation
Scenario: A young elm shows thinning and yellowing leaves after weeks of heavy rain. The tree is near a curb where soil is compacted. A small depression forms around the base after storms.
Step 1: Target: The target is a driveway edge where cars occasionally park.
Step 2: Failure Mode: Root failure is plausible due to compromised root function and saturated, compacted soil.
Step 3: Likelihood: Heavy rain plus compacted soil increases stress on roots and reduces stability. Leaf thinning supports that the tree is under stress, which can correlate with reduced resilience.
Step 4: Consequence: Cars are a target, but exposure is occasional.
Step 5: Risk Level: Likelihood is elevated because the stressors are active and ongoing. Consequence is limited by lower exposure, so risk may be significant but not necessarily the top priority.
Exam-style answer logic: When the scenario includes active stress conditions, likelihood rises even if the defect is not visually dramatic.
Mind Map: Converting Clues into Likelihood and Consequence
Likelihood and Consequence Mind Map
Quick Self-Check Before You Pick an Answer
- Did you name the failure mode before the risk level?
- Did you use target exposure to set consequence?
- Did you treat “defect present” as evidence, not as a conclusion?
If you can answer those three questions, you’re doing the same thinking the exam expects—just with fewer steps and less guesswork.
10. Pruning Principles and Techniques
10.1 Pruning Objectives Including Clearance Health and Structure
Pruning is not a single task; it’s a set of objectives that determine where cuts go, how much to remove, and what to avoid. In exam scenarios, the best answer usually matches the objective to the tree’s biology and the site’s constraints. A good workflow starts with three questions: What problem are we solving? What part of the tree is involved? What outcome should be true after pruning?
Clearance Objectives
Clearance pruning aims to create safe, usable space around the tree without turning the crown into a permanent “lollipop.” Clearance is measured where people and equipment actually pass: sidewalks, drive lanes, streetlights, and overhead utilities. The key is to reduce conflicts while preserving enough foliage to maintain energy production.
A practical rule of thumb is to remove branches that directly cause the clearance issue rather than thinning broadly “to be safe.” For example, if a branch overhangs a walkway by 18 inches, targeting that branch and nearby competitors is more defensible than removing multiple scaffold branches across the crown. The exam often tests whether you recognize that clearance work should be localized and that excessive removal can trigger new weak growth.
Clearance also affects cut selection. If you must reduce a branch’s reach, you typically use a reduction cut that shortens the branch while keeping a reasonable branch structure. Cutting back to random stubs can create decay-prone wounds and weak regrowth.
Health Objectives
Health objectives focus on removing parts that threaten the tree’s function: deadwood, diseased tissue, and structurally compromised branches that fail under normal loading. Deadwood removal is usually straightforward because it doesn’t require guessing what’s “probably fine.” Diseased or damaged wood requires more careful reasoning about symptom patterns and compartmentalization.
For instance, if you see a branch with dieback from a prior injury and the rest of the tree shows normal leaf density, the objective is to remove the compromised portion to reduce stress and potential pathogen spread. You still avoid unnecessary cuts elsewhere. In a typical exam scenario, the correct choice is the one that removes the affected branch while minimizing additional wounds.
Health pruning also includes correcting growth that repeatedly causes injury, such as rubbing branches. Rubbing creates wounds that can become entry points. Removing one of the rubbing branches is often the best health objective because it stops the injury cycle.
Structure Objectives
Structure objectives aim to shape the tree so it can carry loads safely as it matures. This includes selecting and maintaining strong branch architecture, reducing the likelihood of branch failure, and preventing future conflicts between co-dominant leaders.
A common structural issue is included bark at a tight V-crotch. In exam questions, the best answer usually identifies that included bark can limit proper wood formation and increase the chance of splitting. The objective is to reduce the risk by favoring one leader and removing or reducing the competing branch, using cuts that preserve the remaining structure.
Another structural objective is managing codominant stems that are too similar in size. If both leaders grow vigorously, the tree may form a weak union. A reduction or removal strategy should be chosen to shift dominance toward the better-attached branch.
How Objectives Guide Cut Decisions
Objectives determine three cut-related decisions: where to cut, how much to remove, and what to leave.
- Where to cut: Aim for cuts that respect branch structure and avoid leaving stubs. The goal is to remove the target branch while preserving the branch collar area.
- How much to remove: Remove enough to meet the objective, not enough to “fix everything.” Over-pruning can reduce leaf area and increase the chance of vigorous, poorly attached regrowth.
- What to leave: Leave sufficient foliage and maintain a coherent scaffold framework. A tree that looks “tidy” but has lost key scaffolds is often a tree with future problems.
Mind Map: Pruning Objectives
Example: Choosing the Objective in a Scenario
A street tree has branches over a driveway and one codominant leader with a tight V-crotch. The driveway clearance issue is immediate, but the structural defect is a longer-term risk. The integrated objective is to address both without creating new weaknesses: perform localized clearance reduction on the overhanging branch while also correcting the weak union by reducing or removing the less suitable leader. The exam-friendly logic is that you don’t trade one objective for the other; you sequence and limit cuts so each objective is met with the least additional wounding.
Example: When “Tidying Up” Is the Wrong Objective
A homeowner requests pruning “to make it look better,” and the tree has no clearance conflicts, no deadwood, and no rubbing. The correct exam response is that the objective is not defined by safety, health, or structure needs. In practice, unnecessary thinning can reduce leaf area and increase regrowth that may be weaker or more difficult to manage later. The objective should be either clarified or the work limited to legitimate targets.
10.2 Pruning Cuts Including Proper Placement and Avoiding Damage
Foundational Rules That Keep Cuts Useful
A pruning cut is a controlled injury, so placement matters as much as the cut itself. The goal is to remove the target while protecting the surrounding tissues that will form new barriers.
Start with these basics:
- Cut location is defined by the branch collar and branch bark ridge. The collar is the swollen area where the branch connects to the trunk or parent branch.
- Avoid cutting into the collar. If you remove the collar, you remove the tree’s best-built defense zone.
- Avoid leaving a long stub. Stubs dry out and can become a decay entry point.
- Use the right cut type for the branch size and position. A “one-size” cut can cause tearing or bark stripping.
Mind Map: Cut Placement Logic
Proper Cut Placement: The “Just Outside” Standard
For small branches, the correct cut is typically made just outside the branch collar. Imagine the collar as a built-in “repair kit” the tree already prepared. Your job is to remove the branch, not the kit.
A practical way to check placement: look for the transition from branch tissue to parent tissue. The cut should sit in that transition zone, not deep into the parent and not out in the open air where a stub forms.
Avoiding Damage: Tool Control and Cut Sequence
Even with perfect placement, poor technique can damage the parent.
1) Use sharp tools and correct technique. Dull tools crush tissue and create ragged wounds that take longer to seal.
2) Prevent bark stripping on the underside. Bark strips happen when the branch weight pulls fibers away before the cut is complete.
For larger branches, use a three-step approach:
- Undercut a short distance away from the final cut line.
- Make the top cut to remove the branch weight.
- Make the final cut just outside the collar to finish cleanly.
This sequence keeps the parent bark supported until the branch separates. It’s the difference between “clean removal” and “parent tissue gets dragged along for the ride.”
Example: Small Branch Cut on a Trunk
A 1-inch diameter branch grows from the trunk. The arborist identifies the collar swelling at the base. The final cut is made just outside that swelling, leaving no stub. The cut surface is smooth enough that you can see the transition line clearly.
What to watch for in exam-style scenarios:
- If the cut is shown inside the collar, the answer should be “incorrect placement.”
- If the cut leaves a noticeable stub, the answer should be “incorrect placement.”
Example: Large Branch Removal Without Tearing
A 4-inch branch over a walkway shows a clear collar at the attachment. The arborist first makes an undercut on the underside, then completes the top cut so the branch drops without pulling bark from the parent. Finally, the arborist trims back to the correct final cut location just outside the collar.
If a diagram shows bark peeled down the parent, the technique is wrong even if the final cut line looks close. Bark stripping is a parent injury, not just a branch injury.
Common Placement Mistakes and What They Mean
- Collar removed: barrier tissues are damaged; decay can enter more easily.
- Stub left: stub tissue dries and can become a decay pathway.
- Ridge ignored: cutting through the branch bark ridge can widen the wound and slow compartmentalization.
- Tearing at the cut edge: ragged wounds increase the area of exposed tissue.
Quick Decision Checklist for Any Scenario
Before you commit to the cut, confirm:
- The collar is present and not being cut away.
- The final cut is outside the collar, not into the parent.
- The underside will not strip bark, using a multi-step cut if needed.
- The cut edge is clean, not crushed or torn.
Case Study: Choosing the Correct Final Cut Line
A diagram shows a branch attachment with a visible collar and ridge. Two options are offered: one cut line is slightly inside the collar, the other is slightly outside. The correct choice is the cut line just outside the collar because it preserves the tree’s barrier zone while still removing the branch completely.
In exam terms, the “best” answer is the one that minimizes parent injury and avoids creating a stub. The tree’s repair system is already built into the attachment area; pruning should work with it, not against it.
10.3 Crown Reduction and Crown Thinning Decision Criteria
Crown reduction and crown thinning both change how a tree distributes weight and wind load, but they do it differently. Reduction shortens branches to a smaller overall size, while thinning removes selected interior or outer branches to increase light penetration and airflow. The exam usually tests whether you can match the goal to the method and then justify the cut pattern.
Foundational Concepts That Drive the Choice
Start with the tree’s purpose and constraints. If the goal is clearance, reduction is often the better first tool because it directly lowers branch reach. If the goal is improving structure and reducing sail effect without shrinking the tree too much, thinning is usually the better fit.
Next, check the branch-to-target relationship. Reduction cuts must be made to a suitable lateral branch or leader so the remaining growth can take over. Thinning cuts remove entire branches back to their point of origin, which prevents leaving stubs that become decay entry points.
Finally, evaluate the tree’s ability to respond. A tree with limited vigor, extensive dieback, or poor compartmentalization capacity may not tolerate heavy removal. In those cases, the “best” decision is often the one that avoids large reductions and instead targets the most problematic branches.
Decision Criteria for Crown Reduction
Use crown reduction when you need to reduce height or spread, or when branches are too close to targets like buildings, power lines, or traffic routes. The key criteria are:
- Target clearance and measured distances: Decide what must be cleared, then work from the branch level that creates the conflict. If you cannot measure, you cannot justify the cut.
- Cut location and branch hierarchy: Choose a lateral branch large enough to continue growth. A reduction cut that removes the branch’s functional leader can cause weak regrowth or repeated topping-like behavior.
- Amount of reduction: Keep reductions conservative. Large reductions increase stress and can shift the tree into a cycle of repeated pruning.
- Branch condition: Avoid reducing branches that already show advanced decay, severe cracks, or poor attachment. Cutting near compromised tissue can worsen failure risk.
Easy example: A mature street tree has a limb over a driveway that is 18 inches too low. You identify a healthy lateral branch at the correct height and reduce the limb back to that lateral, rather than cutting randomly at a shorter length.
Decision Criteria for Crown Thinning
Use crown thinning when the tree’s overall size is acceptable but the crown is too dense, creating wind resistance, shading, or poor internal structure. The key criteria are:
- Density and distribution: Thinning works best when you remove selected branches to reduce crowding, not when you remove so much that the crown becomes sparse.
- Interior structure: Removing interior branches can improve light and airflow, but you must preserve enough foliage to maintain energy production.
- Removal pattern: Select branches that are weak, crossing, rubbing, or poorly attached. Avoid removing only the outermost tips, which can create an uneven crown.
- Regrowth control: Thinning generally maintains more of the tree’s natural form than reduction, so it’s often preferred when you want predictable structure.
Easy example: A canopy over a sidewalk is dense and blocks visibility. You remove a limited set of interior branches that are crowded or rubbing, keeping the outer framework intact.
Mind Map: Reduction Versus Thinning
Integrated Example Walkthrough
Scenario: A 35-foot ornamental tree has branches rubbing against a fence and a dense crown that makes the interior look unhealthy. The fence is the clearance target, but the crown density is also a problem.
Step 1: Decide the primary goal. Clearance is the immediate hazard, so reduction is the first move for the branches that physically conflict with the fence.
Step 2: Apply reduction correctly. For each conflicting limb, identify a healthy lateral branch at the appropriate height and reduce back to it. Do not cut back to small, weak laterals that cannot take over.
Step 3: Use thinning to address density. After reduction, thin selected interior branches that are crowded, rubbing, or poorly attached. This improves airflow without stripping the crown.
Step 4: Confirm the tree’s condition. If the tree shows extensive stress, reduce the scope further and prioritize the worst conflicts. The exam often expects you to choose the least harmful option that still meets the goal.
Common Exam Traps
- Confusing reduction with topping: Reduction should be to a lateral that can continue growth, not to a random shortened stub.
- Thinning by tip cutting: Thinning removes whole branches at their origin, not just trimming the ends.
- Ignoring tree condition: A plan that removes too much foliage can be “technically correct” in method but wrong in outcome.
- No measurement, no justification: If the scenario provides distances, use them to set the cut level and scope.
When you can state the goal, match it to the method, and justify the cut pattern based on branch condition and tree vigor, you’re doing the same reasoning the exam expects—just with fewer surprises and fewer sawdust confetti moments.
10.4 Training Young Trees Including Branch Selection and Formative Pruning
Training young trees is mostly about choosing the right “future structure” early, then making pruning cuts that support that structure without creating new problems. The exam angle is simple: you’re selecting branches and making cuts that balance growth, light, and long-term stability.
Foundational Goals of Formative Pruning
Formative pruning aims to establish a strong framework while keeping the tree’s growth efficient. For most young street and park trees, that means:
- Selecting a central leader or a dominant leader system when the species naturally supports it.
- Building a scaffold framework with well-spaced, well-attached branches.
- Reducing the chance of weak branch unions that can split later.
- Removing or correcting competing leaders and crossing branches before they become entrenched.
A practical example: imagine a newly planted maple with three similar-height leaders. If you leave all three, the tree may form included bark at the unions. A formative cut that reduces to one dominant leader lowers the odds of future splitting.
Branch Selection Criteria That Actually Matter
Branch selection is not about “prettier crowns.” It’s about attachment quality and spacing.
Dominant Leader Choice
Start by deciding whether the tree should have a central leader. Many species respond well to a single dominant leader, especially when young. Choose the leader that is:
- Most upright and aligned with the trunk.
- Best positioned to avoid rubbing or crowding.
- Not already compromised by damage or severe lean.
If the tree has a strong leader and a weaker competitor, remove or reduce the competitor rather than trying to “train” both into equality.
Scaffold Branch Spacing and Attachment
Scaffold branches should be spaced so that each branch can grow without being shaded or squeezed. Look for:
- Wide angles between scaffold branches and the trunk.
- Branches that attach with a broad base rather than a narrow, tight union.
- Avoidance of tight clusters where multiple branches originate from nearly the same point.
Easy example: two branches that both emerge at the same height and angle will compete for light and can create a crowded knot of unions. Selecting one and removing the other gives the remaining branch room to thicken properly.
Avoiding Weak Unions
Weak unions often show up as included bark, narrow crotches, or branches that rub as they grow. In training, you can prevent many of these outcomes by removing the worst offenders early.
A useful rule of thumb for exam scenarios: if two branches are nearly the same diameter and share a narrow crotch, the union is more likely to be weak. Prefer a branch with a larger diameter hierarchy relative to its neighbor.
Pruning Cuts That Support Structure
Formative pruning uses targeted removals and reductions, not heavy “shaping.” The cut type matters.
Heading Versus Thinning
- Heading cuts shorten a shoot and can increase branching below the cut. Use them carefully because they can create multiple new shoots that compete.
- Thinning removes a branch back to its point of origin or to a selected lateral, reducing crowding while maintaining a more natural growth pattern.
Example: if you remove a competing leader by thinning it back to a lateral origin, you reduce competition without forcing a flush of new shoots at the cut site.
Cut Placement Basics
Make cuts so you don’t damage surrounding tissue and so the branch can compartmentalize the wound. For young trees, avoid leaving long stubs. Also avoid cutting so close that you injure the branch collar area.
Systematic Training Workflow for Young Trees
Use a repeatable sequence. It keeps you from “pruning by vibes,” which is a great way to lose points on an exam.
- Assess the tree form: identify the trunk, leader options, and major scaffold candidates.
- Check for conflicts: competing leaders, crossing branches, rubbing, and tight clusters.
- Select the framework: choose one dominant leader and 3–5 scaffold branches spaced along the trunk.
- Remove the worst conflicts: thin out competing leaders and crossing branches.
- Correct direction: if a branch is too upright or too horizontal, select a lateral to guide growth rather than forcing drastic heading.
- Re-check balance: step back and confirm the crown will develop without immediate crowding.
Mind Map: Training Young Trees
Example: Choosing Leaders and Scaffolds
A 2-year-old street tree has a central trunk with two leaders. Leader A is taller and more upright; Leader B is slightly lower and has a narrow crotch.
- Selection: keep Leader A as the dominant leader.
- Removal: thin Leader B out at its origin to reduce competition.
- Scaffold choice: select three branches on different sides of the trunk, spaced so they don’t crowd at the same height.
- Final check: confirm that no scaffold branch crosses another as they extend.
This approach builds a predictable framework and avoids creating a “two-leader future” that often ends with structural corrections later.
Example: Fixing Crossing Branches Early
A young tree has two branches crossing at mid-crown. One branch is slightly larger and both are close in diameter.
- Selection: keep the branch with better attachment and growth direction.
- Removal: thin out the crossing branch to its origin or to a selected lateral.
- Result: you reduce rubbing and the chance of included bark forming where the branches press against each other.
When you remove the conflict early, you’re not just cleaning up the crown—you’re preventing the tree from investing energy into a structure that will later need major correction.
10.5 Pruning for Specific Conditions Including Deadwood and Storm Damage
Pruning for deadwood and storm damage starts with the same goal: reduce risk and restore functional structure without creating new problems. The key difference is timing and how you interpret the tree’s response. Deadwood work is usually about removing nonfunctional tissue safely. Storm work is about managing wounds, stabilizing structure, and deciding what to leave for the tree to compartmentalize.
Foundational Decision Rules
Begin with a quick triage: identify what is dead, what is broken, and what is merely stressed. Deadwood is typically dry, brittle, and lacks live buds or cambial activity. Storm damage often includes torn bark, embedded wood, and branch attachments that have been stretched or cracked. If you can’t confidently distinguish these categories, treat the area as potentially compromised and plan for conservative cuts.
Next, confirm the target and the cut location. For deadwood, the target is the branch collar or the point where the branch is no longer contributing. For storm damage, the target is the sound attachment zone that allows the tree to seal the wound. In both cases, avoid leaving long stubs and avoid cutting into the trunk flare or damaging the collar.
Mind Map: Deadwood and Storm Pruning Logic
Deadwood Pruning: Systematic Approach
Start by inspecting the branch base, not just the dead portion. A dead branch can be attached to living wood, or it can be a symptom of deeper decline. Look for cankers, sunken areas, or repeated dieback patterns. If the branch base shows signs of decay, plan for a cut that removes the dead portion while minimizing additional injury.
Use a two-step removal on larger limbs to prevent bark tearing. Make an undercut a short distance from the collar, then remove the limb from the top. Finish with a final cut that trims back to the collar. This sequence keeps the bark from ripping down the trunk, which is where trees lose the most sealing ability.
A practical example: a dead lower limb on a street maple has no leaves and no buds. The branch collar is visible and intact. You remove the limb using an undercut and final collar cut. The exam-style reasoning is straightforward: the dead tissue is nonfunctional, the collar is the boundary of compartmentalization, and the cut avoids creating a larger wound than necessary.
Storm Damage Pruning: What Changes
Storm pruning is often about controlling movement. Hanging limbs and cracked attachments can shift during cleanup, turning a manageable job into a dangerous one. Prioritize removal of loose hazards first, then address structural damage.
When bark is torn, the goal is to remove ragged edges back to sound tissue. Do not chase every fiber; instead, make the cut clean enough that the tree can form a boundary. If a branch has partially torn away, staged removal reduces leverage. For heavy limbs, remove in sections so the remaining attachment is not forced to bend.
A practical example: after a wind event, a codominant stem has a split at the V-notch and one side is hanging. You assess whether the attachment is still holding. If it is unstable, you remove the hanging portion in sections, keeping the cut lines within sound boundaries. You then remove the damaged branch back to a location that does not cut into the trunk or leave a long stub. The reasoning is that the tree needs a manageable wound surface and reduced mechanical stress at the damaged junction.
Advanced Details Without the Guesswork
For both deadwood and storm work, avoid pruning that removes live structure unnecessarily. If you must reduce weight, do it with targeted cuts that do not create large, exposed surfaces on the trunk. Also, check the immediate area for secondary hazards like loose bark, embedded wood, or compromised unions.
Finally, document what you removed and where. In exam scenarios, the “best answer” often matches the safest cut geometry and the most conservative boundary selection. If the question describes a collar, cut to the collar. If it describes torn bark at an attachment, clean to sound tissue and remove in a way that prevents further tearing.
Case-Style Mind Map: Cut Selection
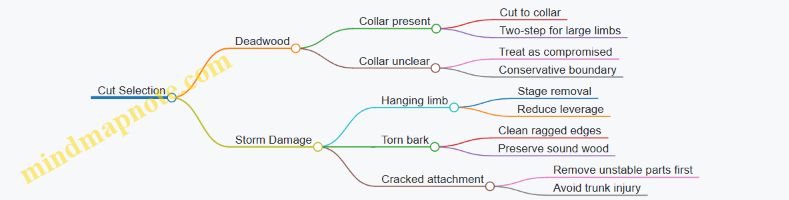
Quick Checklist for Exam-Style Answers
- Identify dead versus damaged versus merely stressed.
- Locate the boundary for compartmentalization, usually the collar or sound attachment zone.
- Use undercut and staged removal to prevent bark tearing.
- Make clean cuts that minimize wound size and avoid trunk injury.
- Prioritize loose hazards during storm cleanup.
That’s the whole logic chain: correct identification, correct boundary, correct cut mechanics, and correct job sequencing.
11. Urban Forestry Practices and Site Management
11.1 Planting Standards Including Root Flare and Backfill Practices
A good planting starts with the root flare, because that’s where the tree transitions from “nursery life” to “urban life.” If the flare is buried, the tree often shifts from normal root growth to stress responses: slower establishment, bark issues, and a higher chance of decay where tissues stay too wet. The goal is simple—place the tree so the root flare sits at or slightly above final grade, then build a backfill that lets roots breathe and spread.
Root Flare Identification and Placement
First, locate the root flare. In many nursery-grown trees, it’s visible as a widening at the base where trunk tissue meets the first major roots. In others, it’s hidden under soil or potting media, so you may need to gently remove loose material until you see the flare. A practical rule for exam-style scenarios: if you can’t clearly see the flare after careful cleaning, assume it’s too deep and adjust.
Next, set planting depth. The root flare should be at grade after planting, not before. That means you account for mulch thickness and any settling of backfill. If the site has compacted soil or a planned soil amendment, measure final grade where the mulch will sit, then place the flare accordingly.
Pit Design and Soil Contact
Dig a hole that is wide, not deep. A common mistake is a deep, narrow hole that forces roots into a confined zone. Instead, create a planting area wide enough to encourage lateral root growth. The bottom should be firm enough to support the tree, but not glazed or over-excavated. If you loosen the bottom too much, the tree can sink later, burying the flare.
Keep the root ball intact. Break up only circling or girdling roots if they’re clearly present and you can correct them without tearing the root ball apart. For bare-root trees, spread roots naturally and avoid bending them sharply.
Backfill Composition and Compaction Control
Backfill should support root growth without creating a hard, water-repellent layer. Use the excavated native soil when it’s suitable, because roots recognize it and it drains in a familiar way. If the native soil is extremely poor, improve it carefully rather than replacing everything. A useful exam logic: the backfill should be similar in texture to the surrounding soil to prevent a “bathtub wall” effect where water pools at the boundary.
Compaction is the next big lever. Light settling is fine; heavy compaction is not. You want air spaces to remain so roots can respire. A simple method is to fill in lifts and water lightly to settle soil around roots, then stop short of packing like you’re building a driveway.
Mulch and Grade Finishing
Mulch protects the root zone and moderates moisture, but it can also cause problems if piled against the trunk. Apply mulch in a ring with a clear gap around the trunk base. The mulch should cover the planting area, not the trunk flare. If mulch is too deep, it can keep the flare wet and encourage bark issues.
Mind Map: Root Flare and Backfill Workflow
Example: Correcting a Too-Deep Plant
A street tree is installed and later shows bark discoloration at the base. During inspection, the flare is found 4 inches below grade. The fix is not “add topsoil and hope.” The correct approach is to remove soil from around the base until the flare is visible, then re-establish a proper mulch ring. If roots have already formed in a buried zone, the tree may still recover, but the planting standard is to stop the ongoing stress.
Example: Backfill That Drains Poorly
A contractor replaces the excavated soil with a heavy clay mix in the planting hole. After rain, water lingers at the boundary between the amended hole and surrounding soil. Roots then experience alternating saturation and oxygen shortage. The standard response is to use backfill that matches the surrounding texture and to avoid creating a sharp drainage contrast.
Example: Compaction During Installation
A crew backfills in one thick layer and tamp-compacts it to “stabilize” the tree. The tree later struggles with leaf drop during warm weeks, even with irrigation. The issue is reduced pore space around roots. The planting standard is to fill in lifts, settle with light watering, and avoid aggressive compaction.
Quick Checklist for Field Decisions
- Can you see the root flare clearly at the time of planting?
- Is the flare at final grade after mulch placement?
- Is the hole wide enough to encourage lateral roots?
- Is backfill texture similar to surrounding soil?
- Is soil settled lightly without hard packing?
- Is mulch kept away from the trunk base?
When these steps are followed, the tree starts with the right physical conditions: oxygen availability, stable grade, and a root flare that stays where it belongs. That’s the boring part that makes the rest of the job possible.
11.2 Mulching and Soil Amendments Including Correct Depth and Placement
Mulch is not decoration; it’s a controlled layer that moderates soil temperature, reduces evaporation, and limits weed competition. For exam scenarios, the key is matching mulch type and placement to the tree’s root zone needs while avoiding conditions that invite rot or girdling roots.
Foundations of Mulch Depth and Placement
Start with depth. Most urban arborist guidance targets about 2 to 4 inches of organic mulch over the root zone. Thinner layers dry out faster and weed pressure rises. Thicker layers can stay too wet, reduce oxygen at the soil surface, and slow the breakdown process that trees rely on for gradual nutrient cycling.
Placement is equally important. Keep mulch pulled back from the trunk so you can see the root flare. A common mistake is piling mulch against the bark; that traps moisture at the stem and can encourage collar rot. Think of the root flare as the tree’s “entry point” to the soil—mulch should cover the area around it, not bury it.
How Mulch Works in the Root Zone
Mulch moderates soil moisture by reducing direct sun and wind exposure. It also buffers temperature swings, which matters because roots are sensitive to rapid changes. As organic mulch breaks down, it contributes to soil structure and microbial activity, but only when oxygen and moisture are balanced. That’s why correct depth and trunk clearance matter: they support decomposition without creating a constantly saturated mat.
Choosing Mulch Type for Common Exam Situations
Organic mulches (wood chips, shredded bark, leaf-based mulches) are typical for urban trees. They vary in texture and decomposition rate. Coarser chips usually last longer and create more air spaces. Finer material can compact more easily, especially if it’s applied too thick.
Avoid using materials that form a dense barrier. For example, a thick layer of fine, uniform particles can reduce oxygen exchange at the soil surface. In diagnosis questions, if you see a consistently wet, dark, compacted mulch bed right against the trunk, the mulch itself becomes part of the problem.
Soil Amendments What They Do and What They Don’t
Soil amendments are not a substitute for proper planting. In many cases, the best “amendment” is correct planting depth, adequate watering, and avoiding compaction. When amendments are used, they should improve the existing soil conditions without creating a layered system.
A frequent exam trap is mixing amendment into the entire backfill volume for every planting. If you create a sharp boundary between amended and native soil, roots can grow along the interface rather than distributing naturally. A safer approach is to incorporate amendments only where appropriate and keep the root zone continuous.
Practical Placement Rules You Can Apply on Site
- Locate the root flare before mulching.
- Apply mulch evenly across the root zone area, typically extending outward beyond the trunk.
- Maintain a mulch-free ring at the trunk so bark stays dry enough to resist decay.
- Keep mulch depth consistent; don’t “top off” repeatedly until it becomes too thick.
- Avoid burying exposed roots deeper than necessary; cover them with a reasonable mulch thickness.
Mind Map: Mulching and Soil Amendments
Example: Correct Mulch Setup for a Newly Planted Tree
A newly planted street tree has a visible root flare and a small basin around the trunk. The crew spreads shredded bark mulch to a uniform 3 inches across the basin and extends it outward to cover the active root zone. They leave a 3 to 6 inch mulch-free gap around the trunk so the flare remains visible. After a week of watering, the mulch surface looks slightly settled but not matted. In an exam scenario, this setup scores well because it balances moisture control with trunk protection.
Example: Diagnosis When Mulch Causes Trouble
A mature tree shows dieback in the lower canopy and the base is surrounded by a thick mulch mound pressed against the trunk. The mulch is dark, saturated after rain, and the bark at the collar looks persistently wet. The likely issue is not “lack of mulch,” but incorrect placement and excessive depth that reduce oxygen and keep moisture against the stem. The corrective action is to remove excess mulch, re-establish trunk clearance, and restore a 2 to 4 inch depth over the root zone.
Example: Soil Amendment Boundary Problem
In a planting bed, the crew mixed compost into the backfill but left the surrounding native soil unchanged. After a season, roots concentrate near the interface where conditions shift, and the outer root zone remains underutilized. The exam takeaway is that amendments should not be used in a way that creates a hard transition. If amendments are applied, they should support a continuous rooting environment rather than a “root highway” along a boundary.
Quick Placement Checklist for Exam-Style Scenarios
- Root flare visible
- Mulch depth 2–4 inches
- Mulch pulled back from trunk
- Even coverage across root zone
- No compacted, dense mulch mat
- Amendments used to improve conditions without layered boundaries
11.3 Irrigation and Establishment Care Including Scheduling Basics
Newly planted trees have two jobs: grow roots and keep leaves supplied with water. Irrigation supports both, but the schedule should be built around soil moisture and root-zone depth—not around a fixed calendar. A good rule for exam-style thinking is simple: water often enough to prevent stress, but not so much that roots sit in oxygen-poor soil.
Foundational Concepts for Scheduling
Start with the root zone. For most landscape trees, the active feeder roots develop in the top 6–18 inches, with the widest portion of the root ball and the first year’s expanding root area being the priority. Irrigation should wet that zone thoroughly, then allow partial drying before the next watering.
Next, match irrigation to soil texture. Sandy soils drain quickly and need shorter, more frequent cycles. Clay soils hold water longer and need longer intervals with less total frequency. If you water clay like it’s sand, you risk chronic saturation and root decline.
Finally, consider evapotranspiration. Wind, heat, and full sun increase water loss. A tree in a hot, exposed site may need more frequent irrigation than the same species in shade, even if both were planted on the same day.
How to Build an Irrigation Schedule
Use a two-step method: baseline frequency, then moisture checks.
- Set an initial baseline for the first weeks after planting. Many exam scenarios assume more frequent watering early, then tapering as roots reestablish.
- Adjust using a simple moisture test. Push a finger or a soil probe into the root zone. If the soil feels dry several inches down, irrigate. If it is still moist, wait.
A practical approach is to water deeply enough to reach the target depth, then reassess. “Deep” means more than wetting the surface. For example, if you only wet the top inch, roots may stay shallow and the tree becomes harder to establish.
Delivery Methods and What They Mean
Drip and soaker systems apply water slowly and reduce runoff. They also encourage moisture to spread outward from the emitter, which helps roots search for water. Sprinklers can be effective for lawns and broad areas, but they often waste water through evaporation and can wet foliage unnecessarily.
For scheduling, delivery method matters because it changes how quickly water moves through the soil. Drip systems typically require longer runtimes per cycle to achieve the same depth.
Example Scheduling Scenarios
Example: Newly Planted Tree in Sandy Soil Assume a small tree planted in a sandy bed. Start with shorter cycles more often, then check moisture at 6–10 inches. If the soil dries quickly at that depth, increase frequency slightly while keeping each watering cycle deep enough to reach the target.
Example: Newly Planted Tree in Clay Soil Assume a small tree planted in heavy clay. Use longer intervals. Water deeply, then wait until the root zone begins to dry at the target depth. If you see standing water or the soil remains wet for days, reduce frequency.
Example: Hot Windy Week After Planting Assume the same soil type as the baseline scenario, but with higher heat and wind. Instead of automatically doubling runtime, first check moisture at depth. If it is drying faster, adjust frequency modestly and keep the total water per cycle sufficient to wet the root zone.
Establishment Care Beyond Watering
Irrigation is only one part of establishment. Mulch helps by reducing evaporation and moderating soil temperature. Keep mulch off the trunk flare to prevent rot and to allow normal bark respiration.
Weed control matters because competing plants steal water from the same root zone. If weeds are dense, the tree may show stress even when irrigation is “on schedule.”
Also watch for signs that the schedule is off. Wilting during the hottest part of the day can be normal, but persistent wilting plus consistently wet soil suggests poor drainage or overwatering. Leaf yellowing with soggy soil can also point to saturation.
Mind Map: Irrigation and Establishment Care Scheduling
Scheduling Basics Summary for Exam Use
Plan irrigation around root-zone depth and soil moisture. Start with a reasonable baseline, then adjust using moisture checks rather than rigid timing. Water deeply enough to reach the target zone, deliver it efficiently, and support the tree with mulch and weed control so the water actually benefits root growth.
11.4 Tree Protection During Construction Including Barriers and Root Zone Rules
Construction work is hard on trees in two main ways: it damages roots underground and it injures stems and crowns above ground. Good protection is mostly about controlling access and limiting grade changes, not about hoping trees “handle it.” The exam-ready approach is to think in zones, then match the protection method to the risk.
Foundational Zones and What They Mean
Start by defining three practical areas.
-
Critical Root Zone: the area under and around the canopy where most fine roots are concentrated. A common rule of thumb is that it extends roughly to the dripline, but the exam often expects you to treat the canopy area as the root protection target.
-
Root Zone Work Zone: the portion of the critical root zone where equipment might need to travel or stage materials. This is where barriers and ground protection matter most.
-
Stem and Crown Protection Zone: the area around the trunk and lower branches where impacts, equipment contact, and improper pruning can occur.
A simple way to remember the logic: if you prevent soil compaction and grade changes, you protect roots; if you prevent physical contact, you protect cambium and buds.
Barriers That Actually Work
Barriers are not decoration. They must stop vehicles and foot traffic from entering the root zone.
Barrier placement: place fencing at or beyond the critical root zone boundary, not at the trunk. If the canopy edge is at the dripline, fencing should generally align with that perimeter.
Barrier type: use rigid fencing or sturdy temporary fencing that can resist accidental contact. For exam scenarios, assume “orange fencing” alone is often insufficient if equipment can reach it.
Access control: provide a designated route for pedestrians and a separate route for equipment. If workers must cross the root zone, the crossing must be planned with ground protection.
Signage and enforcement: label the fenced area as protected root zone and ensure supervisors enforce it. The best barrier fails if someone treats it as a suggestion.
Root Zone Rules That Prevent Common Damage
Root zone protection rules are easiest to apply when you connect each rule to a mechanism.
- No grade changes: avoid adding fill or removing soil within the protected area. Even a small change can alter oxygen and water availability to fine roots.
- No trenching or boring: keep excavation out of the protected zone. If utilities require work, reroute or use methods that avoid the critical root zone.
- No stockpiling: do not store materials, spoil, or topsoil on the root zone. Weight compresses soil and can smother roots.
- No equipment operation: keep tracked and wheeled equipment out of the root zone unless ground protection is engineered for it.
- No tethering: do not tie ropes, chains, or equipment to the trunk or major roots. Movement and abrasion can injure bark and cambium.
Ground Protection for Planned Traffic
Sometimes construction must cross a protected area. In those cases, use ground protection that spreads load and reduces compaction.
A practical exam-friendly method is to use timber mats or geotextile plus mats to distribute weight. The key is that the system must be installed before traffic begins and removed after work ends, so it does not become a permanent soil barrier.
Crown and Trunk Protection Basics
Above ground, the goal is to prevent stem wounds and avoid unnecessary pruning.
- Trunk protection: use padding or protective wraps where contact risk exists, such as near staging areas or where equipment could bump the trunk.
- Branch protection: avoid attaching lines to branches. If clearance is needed, reroute equipment rather than “just trimming a little.”
- No unplanned pruning: if pruning is required for safety, it should be limited, planned, and consistent with proper cut placement. Random cuts during construction are a fast track to decay risk.
Mind Map: Construction Protection Workflow
Example: Parking Lot Expansion with Limited Space
A city project expands a parking lot and must keep a mature street tree. The contractor proposes to stage materials near the trunk “because it’s only for a day.” The correct response is to fence the critical root zone at the dripline, move staging outside the fenced perimeter, and create a designated pedestrian route. If a temporary crossing is unavoidable, install mats before any vehicles enter the root zone and remove them after the crossing is complete.
This scenario tests whether you can translate rules into actions: staging is not “temporary” to roots, and foot traffic can still compact soil.
Example: Utility Line Near a Tree
A utility trench is planned within the protected area. The best practice is to avoid the critical root zone by rerouting the line or using a method that keeps excavation outside the protected boundary. If avoidance is impossible, the protection plan must still prioritize minimizing soil disturbance and preventing compaction, with barriers maintained and work tightly controlled.
The exam logic is consistent: if the plan requires root zone excavation, the protection strategy must change, not just add more fencing.
Quick Checklist for Exam Scenarios
- Barriers placed at or beyond the critical root zone boundary
- No grade change, trenching, stockpiling, or equipment operation in protected area
- Ground protection used only for planned crossings, installed before traffic
- Trunk and crown protected from contact and unauthorized pruning
- Monitoring and enforcement during the work period
11.5 Maintenance Planning Including Inspections And Work Prioritization
Maintenance planning starts with a simple idea: you can’t fix everything at once, so you decide what to inspect, what to record, and what to address first based on risk and tree needs. The goal is not to create a perfect schedule; it’s to create a repeatable process that produces consistent decisions.
Foundations of Inspection Planning
Begin by defining inspection coverage. For a small portfolio, a single route can work; for larger sites, group trees by similar conditions such as street trees, park specimens, and trees near utilities. Then set inspection frequency based on exposure. Trees near sidewalks, playgrounds, or traffic typically need more frequent checks than trees in low-use areas.
Next, standardize what you look for. Use the same categories every time so notes stay comparable across seasons:
- Structural indicators: cracks, included bark, leaning, cavities, deadwood patterns
- Health indicators: dieback, chlorosis, abnormal leaf drop, epicormic shoots
- Site and root zone indicators: soil heaving, compaction, root flare burial, irrigation failures
- Hazard contributors: recent construction, vehicle impacts, vandalism, pruning wounds
A practical habit is to tie each observation to a location and a photo. If the exam asks what you should document, the answer is usually “enough to justify the decision later.”
Inspection Workflow That Produces Action
A good inspection moves through four steps: observe, verify, record, and decide. Observe means scanning from a distance first, then approaching for close checks. Verify means confirming whether a symptom is consistent with the suspected cause. Record means capturing measurements or descriptors you can compare later, like trunk diameter at breast height, percent crown dieback, or the approximate size of a cavity. Decide means assigning a priority and a next action.
When you verify, avoid jumping to conclusions. For example, leaf yellowing could be nutrient deficiency, root stress, or waterlogging. Instead of guessing, check the pattern: is it uniform across the crown or concentrated on one side, and does it match soil conditions or irrigation layout?
Work Prioritization Using Risk and Practicality
Prioritization is easiest when you separate “what is urgent” from “what is important.” Urgent items are those that could cause harm soon. Important items are those that improve long-term tree health but may not require immediate action.
A simple priority ladder works well:
- Immediate attention: active failure indicators such as large cracks with movement, extensive deadwood over targets, or severe root flare damage near a walkway.
- Short-term scheduling: moderate defects that are stable but likely to worsen, such as localized decay indicators or repeated dieback in a high-use area.
- Planned maintenance: routine pruning for clearance, mulching corrections, or irrigation adjustments where no immediate hazard signs exist.
- Monitor: minor issues with no clear risk pathway, documented for reassessment.
Practicality matters too. If two tasks can be done in one mobilization, combine them. For example, if you’re already scheduling a removal of deadwood for clearance, you can also correct a buried root flare with careful soil work—without turning the job into a second trip.
Mind Map: Maintenance Planning Logic
Integrated Examples That Match Real Decisions
Example: Deadwood Over a Sidewalk During an inspection, you notice multiple dead branches in the lower crown over a frequently used path. The priority is immediate attention because the hazard pathway is direct: deadwood plus a target plus frequent exposure. Record the approximate extent of deadwood, note whether the branches are still attached firmly, and photograph from both angles. The next action is to schedule removal or reduction with appropriate safety controls.
Example: Root Flare Burial Near a Curb A tree shows reduced vigor and the trunk flare is buried under compacted soil near the curb. This is not usually an immediate failure risk, but it is a health issue with a clear management pathway. Priority typically lands in planned maintenance or short-term scheduling depending on how close the tree is to a target and whether there are additional structural concerns. The action is to correct soil grade carefully, restore mulch depth, and check irrigation patterns.
Example: Dieback After Irrigation Failure A street tree shows patchy dieback on the side facing a sprinkler zone that has been malfunctioning. The priority is short-term scheduling because the cause is likely ongoing stress. Verify by checking soil moisture differences and observing whether symptoms align with the irrigation layout. Record the affected crown areas and coordinate repair so pruning decisions don’t treat the symptom while the stress continues.
Turning Notes into a Repeatable Plan
At the end of each inspection cycle, compile work items into a list with priority, location, and the specific next action. Keep the language consistent: “inspect again,” “schedule pruning,” “correct soil grade,” or “evaluate for structural risk.” This consistency is what makes the plan useful when the next inspection happens and when multiple crews or supervisors review the same record.
12. Safety Regulations and Professional Field Operations
12.1 Arborist Safety Fundamentals Including PPE and Worksite Setup
Arborist safety starts with a simple idea: most injuries come from predictable failures—poor planning, unclear roles, or equipment used outside its limits. PPE and worksite setup are the “boring” parts that prevent the exciting parts from becoming hospital paperwork.
Core Safety Mindset and Roles
Before any tool turns on, confirm three basics: who is doing the work, who is watching, and what “stop” means. A common setup is a lead worker, a ground assistant, and a spotter if the task involves overhead hazards. The ground assistant manages exclusion zones, tool staging, and communication. The lead worker manages climbing or rigging decisions. If anyone calls a stop, the work pauses until the reason is addressed.
Pre-Job Hazard Scan
Walk the site like you’re looking for reasons to trip, fall, or get hit. Check for:
- Overhead lines and line proximity, including sagging and temporary relocation.
- Uneven ground, holes, roots, and wet surfaces.
- Hidden hazards like dead branches above walkways.
- Traffic patterns if the site is near roads or sidewalks.
A quick rule of thumb: if you can’t explain the hazard in one sentence, you haven’t looked closely enough.
Personal Protective Equipment
PPE is layered. Each layer covers a different failure mode.
Minimum PPE Set for Typical Work
- Head protection: hard hat with appropriate suspension.
- Eye protection: safety glasses for general work; goggles or face shield when cutting or grinding.
- Hearing protection: ear muffs or plugs when using power tools.
- Hand protection: cut-resistant gloves matched to the task.
- Foot protection: safety boots with slip-resistant soles.
- Leg protection: chainsaw chaps when chainsaws are used.
- Fall protection: climbing helmet and a properly fitted harness system.
Fit and Condition Checks
PPE that fits poorly fails quietly. Harness straps should sit correctly on the body, not twisted or riding up. Gloves should not reduce grip to the point that tools slip. Chaps should be intact with no missing panels. If PPE is damaged, replace it before starting.
Worksite Setup and Exclusion Zones
A worksite is a controlled environment, even in a backyard. Setup reduces the chance that someone wanders into the danger area.
Establish Boundaries
- Define a drop zone for falling limbs.
- Define a swing or reach zone for rigging lines.
- Keep bystanders, pets, and non-essential workers outside boundaries.
Use cones, barriers, and visible signage. If the site is near public access, treat it like a temporary work zone, not a casual project.
Tool Staging and Ground Control
Stage tools so they don’t become trip hazards. Keep cords and hoses routed away from walk paths. Store spare fuel and sharp tools securely. The ground assistant should know where everything is and how to respond if something goes wrong.
Communication and Emergency Readiness
Safety improves when communication is structured.
Standard Communication
Agree on clear signals for:
- Starting and stopping tool operation.
- Line tension changes during lowering or rigging.
- Requests for repositioning or additional clearance.
Use short, direct phrases. “Stop” must mean stop everywhere, not just at the branch.
Emergency Plan Basics
Have a plan for first aid and rescue. Identify the nearest access point for emergency responders. Keep a basic first-aid kit accessible and ensure someone is assigned to manage it. If the task involves climbing, confirm that rescue equipment and procedures are understood before work begins.
Mind Map: Safety Fundamentals
Example: Quick PPE and Setup Scenario
A crew is removing a dead limb over a driveway.
- Hazard scan finds a service drop line nearby and a slope with loose gravel.
- The lead worker confirms the ground assistant will manage the exclusion zone and communication.
- PPE checks show the climber’s helmet is secure, eye protection is in place, and chainsaw chaps are worn before cutting.
- The ground assistant sets barriers to keep people out of the drop zone and routes the saw and rope so they don’t cross the walkway.
- Before the cut, the team agrees on a “stop” signal and confirms the emergency plan access route.
The exam-friendly takeaway is straightforward: PPE protects the worker, but the worksite setup protects everyone else—and both depend on planning before the first cut.
12.2 Climbing and Rigging Safety Concepts for Common Operations
Climbing and rigging are where “tree work” becomes “controlled work at height.” The exam expects you to think in systems: planning first, then inspection, then execution, with safety checks repeated at the moment they matter.
Foundational Safety Logic
Start with the goal of every operation: keep the climber stable, keep the load controlled, and keep people out of the danger zone. Stability comes from correct body position and rope setup; load control comes from correct rigging geometry and secure connections; exclusion comes from communication and barriers.
A useful mental model is three questions, asked in order:
- Can I climb safely to the work position?
- Can I control what I’m moving or cutting?
- Can I keep others safe from what might fall or swing?
If you can’t answer “yes” to all three, you change the plan before you change the rope.
Pre-Job Planning and Site Control
Before tying in, confirm access and escape routes. Identify overhead hazards like power lines, dead tops, and unstable limbs. Mark a drop zone that matches the operation type: for limb removal, the zone must cover the swing path, not just the base of the tree.
Communication is not optional. Assign roles for lookout, signal, and tool handling. Use clear, simple commands for start/stop and for “hold” when someone is about to cut or release tension.
Rope and Harness Checks
Treat every rope and harness like it has a memory of past mistakes. Inspect for cuts, glazing, chemical damage, and abrasion at contact points. Verify that knots are dressed and tightened, and that hardware is compatible and properly oriented.
Key checks before climbing:
- Harness fit and leg/waist adjustment so you can move without slipping.
- Attachment points aligned with manufacturer guidance.
- Rope path avoids sharp edges and unnecessary friction.
- Descender and backup devices installed correctly and tested with a controlled load.
Climbing Fundamentals That Prevent Common Failures
Most climbing incidents come from predictable errors: poor positioning, rushing transitions, or ignoring rope angles. Maintain three points of contact during transitions when possible, and keep your work position so you’re not reaching beyond safe body alignment.
Rope angle matters because it affects friction and load distribution. If the rope is too slack, you lose control; if it’s too tight or misrouted, you increase friction and can create side-loading on anchor points.
When moving between positions, keep tension management in mind. A good rule is to avoid “cutting the last connection” before the next connection is ready.
Rigging Fundamentals for Common Limb Removal
Rigging is controlled descent and controlled direction. The rigging system must match the limb’s weight, size, and expected movement after cutting.
Start by estimating the limb’s behavior: will it drop straight, swing, or twist? Then choose a method that limits uncontrolled motion.
Common rigging safety concepts:
- Anchor integrity: anchors must be sound and appropriate for the load.
- Connection security: knots and hardware must be fully seated and locked.
- Tension control: use mechanical advantage when needed, and avoid sudden releases.
- Cut sequencing: plan the cut so the limb is supported before it separates.
Mind Map: Climbing and Rigging Safety Concepts
Example: Limb Removal with Controlled Swing
Imagine removing a medium limb over a walkway. First, confirm the swing path: even if the limb “looks” like it will fall, it can arc when the hinge breaks. Expand the drop zone to cover that arc.
Next, inspect the anchor point and choose a rigging setup that provides direction control. Before the cut, ensure the limb is supported and the line is tensioned so separation won’t cause a sudden drop. Assign a signal: the climber calls “hold” during final adjustments, and the helper confirms the area is clear.
During the cut, keep the sequence simple: support first, then separate, then manage descent. After the limb is down, re-check the system before resetting for the next cut.
Example: Transitioning Positions Without Losing Control
If you must move from one stance to another, plan the movement so the new position is ready before the old one is released. Keep rope tension consistent so you don’t create slack that could shift your anchor load. If you notice unusual rope movement or increased friction, stop and correct the routing rather than continuing.
Verification Loops That Exams Love
Safety checks should happen at three moments:
- Pre-tie: confirm gear and setup before you commit.
- Pre-cut: confirm support, tension, and exclusion before separation.
- Post-adjustment: confirm nothing changed unexpectedly after you reroute or retension.
This approach prevents the classic “it was fine a minute ago” problem, which is exactly when most mistakes show up.
12.3 Equipment Handling Including Chainsaws and Lifting Devices
Equipment handling is where good arboriculture meets boring physics: weight, leverage, friction, and control. The exam expects you to connect safe handling to correct outcomes—clean cuts, stable rigging, and predictable movement—so the key is to treat every tool as a system with inputs, checks, and limits.
Foundations of Equipment Handling
Start with a simple workflow: inspect, plan, stage, verify, then operate. Inspection is not just “look for damage”; it’s checking that the tool matches the job conditions. For a chainsaw, that means chain sharpness, chain tension, bar condition, chain brake function, and correct fuel/oil mix. For lifting devices, it means load rating verification, correct rope or sling selection, and ensuring the connection points are suitable.
Planning is where many mistakes hide. If you plan to cut a limb that will swing, you must plan for where it will go and how you will control it. If you plan to lift a section, you must plan the path and the attachment method so the load doesn’t twist or snag.
Staging means keeping controls accessible and preventing trip hazards. A saw on the ground with the chain brake off is a bad day waiting to happen. A rigging line draped across a walkway is a bad day with better marketing.
Chainsaw Handling Basics
A chainsaw is a cutting tool and a moving hazard. Before starting, confirm the chain brake engages and releases properly, the chain tension allows smooth movement without sag, and the chain is sharp enough to cut without forcing. For exam-style scenarios, “forcing the saw” is a red flag because it increases kickback risk and reduces control.
During operation, maintain stable footing and a balanced stance. Keep the saw positioned so you can control the bar without reaching. When cutting, use deliberate body positioning rather than arm strength; the saw should do the work, not your shoulders.
Kickback prevention is a recurring theme. It’s driven by contact with the upper quadrant of the bar tip and by sudden binding. Practical handling steps include using correct cutting technique, avoiding pinching the bar, and keeping the work area clear so you can retreat without stumbling.
After each cut, manage the saw safely: engage the chain brake, set the saw down in a stable position, and avoid leaving it where it can roll or be bumped.
Lifting Devices Handling Basics
Lifting devices include ropes, slings, pulleys, winches, and mechanical hoists. The core handling principle is that the device is only as safe as the weakest link in the load path. That means you verify the device rating, the condition of the rope or sling, and the integrity of anchors.
Begin with load math in your head. If the device is rated for a maximum load, the actual load must be below that limit with appropriate safety margins. In scenarios, the exam often tests whether you recognize that dynamic loads—like a swinging limb—can exceed static expectations.
Anchor selection matters. A weak or damaged anchor turns a controlled lift into an uncontrolled one. Handling includes checking that anchors are secure, positioned to reduce side-loading, and protected from abrasion where lines contact bark or wood.
Rope management is also handling. Lines should run without twists, be arranged so they don’t snag, and be kept clear of sharp edges. When using pulleys, confirm correct orientation and ensure the pulley is seated so the rope tracks properly.
Integrated Mind Map
Mind Map: Equipment Handling Chainsaws and Lifting Devices
Example: Chainsaw Cut with Swing Control
Scenario: You need to remove a limb that will likely swing toward a sidewalk. The correct handling response is to plan the cut so the limb’s movement is controlled before the final release. That means you position yourself for retreat, keep the saw controlled to avoid binding, and ensure the work area is clear so you can manage the limb’s motion without stepping into the swing zone.
A common wrong answer is “cut it fast and step aside.” Speed doesn’t replace planning. If the limb swings unpredictably, the saw handling may be perfect and the job still fails.
Example: Lifting with Incorrect Load Path
Scenario: A crew uses a lifting line and pulley system, but the anchor is a small, cracked branch stub. Even if the pulley and rope are rated correctly, the anchor becomes the weak link. The correct handling response is to select a stronger anchor point and verify the load path so the forces travel through rated components. The exam often frames this as “what is the unsafe link,” and the answer is the anchor.
Quick Handling Checklist for Exam Scenarios
- Chainsaw: brake works, chain tension correct, chain sharp, technique avoids forcing and kickback conditions.
- Lifting: device and rope/sling ratings verified, anchor integrity checked, load path protected from abrasion and side-loading, movement controlled to avoid dynamic surprises.
Equipment handling is not separate from tree work; it’s the mechanism that makes the tree work predictable. When you can explain the unsafe link in a scenario, you’re thinking like an arborist, not just a test taker.
12.4 Communication and Documentation Including Job Notes and Photo Records
Good communication and clean documentation turn field work into decisions. In arboriculture, that matters because symptoms, defects, and site constraints are often subtle, time-sensitive, and easy to misremember once you’re back in the truck.
Core Communication Principles for Field Teams
Start with shared context. Before you measure anything, confirm the job goal: risk reduction, pruning clearance, diagnosis of decline, or compliance with a permit. Then align on roles: who observes, who records, who photographs, and who communicates with the client or property manager.
Use a simple message structure: what you saw, where you saw it, and what you think it means. For example, “Crown dieback on the west side of the maple, starting around the third lateral from the trunk; likely water stress pattern given the adjacent soil compaction.” Even if the “likely” part changes later, the location and observation stay solid.
When speaking with clients, separate facts from interpretations. Facts include measurements, visible defects, and conditions like irrigation status or recent construction. Interpretations include probable causes and recommended next steps. This separation prevents the classic exam trap: choosing an answer that sounds confident but isn’t supported by the recorded evidence.
Job Notes That Survive the Next Day
Job notes should be fast to write and hard to misunderstand. Use consistent headings and keep entries chronological. A practical template:
- Site and date
- Tree ID or location description
- Weather and recent conditions
- Measurements and observations
- Suspected issues and supporting evidence
- Actions taken and follow-up needs
If you need a date, use one like “2026-02-15” for your example log. The point is consistency, not the calendar.
Write notes so another arborist can reconstruct your reasoning. Instead of “tree looks stressed,” record “leaf scorch on lower canopy, mostly on sun-exposed side; fine root mat visible at disturbed soil edge; irrigation line present but dry during inspection.” That level of detail also helps when exam scenarios ask you to select the best next diagnostic step.
Photo Records That Match the Notes
Photos are evidence, not decoration. Capture the same story your notes tell.
Take establishing shots first: the whole tree in relation to structures, sidewalks, and utilities. Then move to intermediate views: trunk base, major limbs, and the canopy section where symptoms appear. Finally, take close-ups of diagnostic features such as lesions, bark cracks, fungal fruiting bodies, insect exit holes, or pruning wounds.
Use a repeatable order so you don’t forget a key angle. For instance: 1) whole tree, 2) trunk base, 3) symptom area from two sides, 4) defect close-up with a scale reference, 5) any site condition that could explain the issue.
Add identifiers in the photo set. If you label Tree A, include at least one photo where Tree A is clearly visible in the landscape. If you use tags or flags, photograph them in place before you remove them.
Mind Map: Documentation Workflow
Example: Turning Field Observations into a Clear Record
Scenario: A street maple shows thinning in the upper crown and small branch dieback.
Good notes might read: “Tree A, curbside planting strip. 2026-02-15. Dry week; irrigation observed off. Upper crown thinning concentrated on east side. Small branch tips with darkened bark at pruning scars. No obvious borer exit holes at trunk base. Soil surface compacted near sidewalk edge.”
Good photos would include: a whole-tree shot showing the east-side thinning, a trunk-base image showing bark condition, two photos of the dieback area from different sides, and a close-up of the darkened bark at the pruning scar with a ruler or known reference.
If the exam asks what documentation is most useful to support a diagnosis, the best answer is the one that ties symptom location to evidence and rules out look-alikes. For example, photos that show the pruning scar pattern and the distribution of dieback help distinguish recent mechanical injury from a systemic decline.
Advanced Details That Prevent Common Mistakes
Avoid mixing observations from different trees. If multiple trees are involved, record Tree ID in every note entry and ensure at least one photo per tree includes a landscape context view.
Don’t rely on memory for measurements. If you measure trunk diameter, include the method and approximate height of measurement. If you estimate canopy coverage, state what you used as a reference point.
When you change your mind, document why. “Initial thought: drought stress. Updated after finding wet soil at root flare and observing fungal fruiting bodies on lower trunk” is more valuable than deleting earlier lines.
Mind Map: Evidence Quality Checks
Quick Field Routine for Consistency
Before leaving the site, do a two-minute check: can you point to the exact location of the problem using only your notes, and can you find the matching photo without guessing? If the answer is no, fix it while you’re still there. The exam may be paper, but the logic is the same: evidence first, interpretation second.
12.5 Exam Practice Using Integrated Scenarios from Safety to Diagnosis
Integrated scenarios test whether you can move from safe field behavior to accurate diagnosis without skipping steps. The trick is to treat safety, observation, and reasoning as one continuous workflow.
Scenario Setup and First Pass Safety
A crew arrives at a city park where a mature maple shows crown dieback. A pedestrian path runs beneath the canopy, and the ground is uneven from recent utility work.
Start with a quick risk scan before you touch anything: check for overhead hazards, look for recent construction impacts, and confirm escape routes. Then establish a work zone that keeps people out of the fall line and away from the trunk base. In exam questions, this often shows up as “what should you do first?”—the correct answer is usually the one that reduces the chance of injury while you gather usable evidence.
Observation Plan That Produces Diagnostic Evidence
Next, switch from “look around” to “collect clues.” Use a consistent order so you don’t miss key patterns.
- Confirm symptom distribution: Is dieback in one sector or the whole crown? Is it near the top, one side, or scattered?
- Check for structural context: Are there cracks, cavities, or previous pruning wounds near the affected branches?
- Inspect the trunk and root flare: Look for girdling roots, soil mounding, or bark damage.
- Note site conditions: Soil compaction, drainage issues, and irrigation patterns matter because they explain why symptoms appear where they do.
- Record what you see: In exam logic, “documentation” is not paperwork; it’s how you preserve evidence for the next decision.
Mind Map: Integrated Workflow
Scenario Walkthrough with Decision Points
You observe: the dieback is strongest on the south-facing side, with smaller leaves and sparse twigs. The trunk has a shallow cavity near a pruning cut from last year. At the base, soil is piled up against the trunk, and the root flare is partially buried.
A common exam trap is jumping straight to a disease name. Instead, separate possibilities.
- Abiotic stress clues: sector-specific crown decline plus reduced leaf size can fit water or root-zone problems.
- Mechanical or wound clues: the cavity near a pruning cut suggests prior injury, but it doesn’t automatically explain the whole crown pattern.
- Site clues: mounded soil at the trunk base often reduces oxygen availability and can worsen root health, which then shows up in the canopy.
Now rank the likely causes. The best first hypothesis is root-zone stress from improper planting or soil mounding, with secondary decline in the crown. Disease may still be present, but the pattern you’ve collected points to a primary stressor.
Example: Exam-Style Question Logic
Question: “What is the most appropriate next action?”
Best answer logic: conduct a targeted inspection of the root flare and surrounding soil conditions while maintaining the work zone. This is higher value than guessing a pathogen because it tests the primary hypothesis.
Why other options fail:
- Cutting into the cavity without a clear safety and diagnostic purpose risks injury and destroys evidence.
- Spraying or treating without confirming the stressor ignores the symptom distribution you already documented.
Mind Map: Evidence to Diagnosis
Risk Link and Management Constraints
Finally, connect diagnosis to risk. If the cavity is associated with structural weakness, the exam expects you to identify immediate hazards and avoid unnecessary pruning that could increase exposure or worsen defects. In practice, you’d prioritize hazard reduction and correct the root-zone condition, then re-check canopy response over time.
Case-Style Summary in Exam Language
You used safety to control the site, collected symptom distribution and root-zone evidence, separated abiotic stress from biotic possibilities, and selected the next action that tests the leading hypothesis. That’s the integrated skill the exam is measuring: safe observation that leads to defensible reasoning.