Industrial Lubrication Systems and Predictive Maintenance Engineering
1. Fundamentals of Industrial Lubrication Engineering
1.1 Lubrication Functions and Failure Modes in Rotating Equipment
Rotating equipment fails in predictable ways, and lubrication is often the difference between “predictable wear” and “surprise outage.” Lubrication systems exist to control friction, manage heat, protect surfaces, and keep contaminants from turning into abrasive sandpaper. When any of those functions degrade, specific failure modes tend to appear.
Lubrication Functions in Plain Terms
Friction control. A lubricant forms a film between moving surfaces so asperities do not weld and tear. In hydrodynamic bearings, the film is generated by motion and pressure; in boundary lubrication, additives do the heavy lifting when the film is thin.
Load support. The lubricant carries part of the mechanical load. If film thickness drops below what the load and speed require, contact shifts from rolling or sliding with separation to sliding with intermittent contact.
Heat removal. Lubrication transports heat away from bearings, gears, and seals. Even when the lubricant is not the only cooling path, its temperature strongly influences viscosity and additive performance.
Surface protection. Additives reduce wear and corrosion. Anti-wear and extreme-pressure additives form protective layers, while corrosion inhibitors slow oxidation-driven attack.
Contamination control. Clean oil or grease reduces abrasive wear. Filtration, breathers, seals, and proper system design prevent water, dirt, and wear debris from accumulating.
Failure Modes That Map to Lubrication Functions
1) Film breakdown and boundary contact. This occurs when viscosity is too low for the operating conditions, when oil is diluted, or when the system cannot deliver enough lubricant. The result is higher friction, elevated temperatures, and wear patterns that often start at the most loaded region.
2) Starvation. Starvation means the bearing or gear does not receive lubricant at the required rate. Common causes include incorrect oil level, clogged strainers, misaligned pickup tubes, pump issues, or control logic that shuts delivery too early. Starvation often produces localized wear and heat spots.
3) Overgreasing or overfilling. Too much grease can churn, raise temperature, and force grease into seals where it can degrade. In oil systems, overfilling can increase churning losses and aeration.
4) Contamination-driven abrasion. Particles cut through protective films. Water can also accelerate oxidation, changing viscosity and additive depletion. Abrasive wear tends to show as increased wear rates and particle counts that correlate with filter bypass or poor housekeeping.
5) Oxidation and additive depletion. High temperature, oxygen exposure, and water contamination speed oxidation. As viscosity and additive chemistry shift, the lubricant’s ability to maintain film and protect surfaces declines.
6) Aeration and foaming. Air entrainment reduces effective viscosity and film strength. Foaming can also interfere with pump suction and create inconsistent delivery.
7) Seal and containment failures. Leaks allow contamination in and lubricant out. Seal failures can be driven by wrong lubricant compatibility, excessive pressure, misalignment, or thermal cycling.
How to Reason from Symptoms to Causes
A practical approach is to link each symptom to the lubrication function it threatens.
- If friction and temperature rise together, suspect film breakdown, aeration, or starvation.
- If wear accelerates while flow or delivery seems normal, suspect contamination or additive depletion.
- If lubricant level drops or contamination increases, suspect seal failure or breather issues.
A useful mental check is whether the failure mode is primarily “not enough lubricant,” “wrong lubricant condition,” or “lubricant contaminated or escaping.” Most real cases fit one of these buckets.
Mind Map: Lubrication Functions to Failure Modes
Example: Bearing Starvation from a Simple Setup Error
A plant replaces a bearing and forgets to verify the oil level and pickup alignment. The bearing runs at normal speed, but delivery is marginal. After a few weeks, vibration increases and the bearing shows localized wear on the loaded side. Oil analysis later reveals elevated wear metals and a viscosity trend consistent with higher temperature from friction. The fix is not just “add oil,” but correct pickup position, confirm oil level control, and verify delivery under operating conditions.
Example: Grease Overgreasing That Looks Like “Bad Bearings”
A technician increases relubrication rate to “be safe.” The bearing runs hotter, seals weep, and grease migrates into areas where it mixes with dust. Wear accelerates and the failure seems to blame the bearing design. The real issue is churning and seal contamination. Correcting the relubrication interval, using the specified grease, and improving seal condition restores stable temperature and reduces wear.
Example: Contamination Control Failure in a Gearbox
A gearbox uses filtration, but the bypass valve sticks open during a cold start. Fine particles circulate, and the additive package cannot prevent abrasive wear. Over time, wear metals rise and the particle trend correlates with bypass events. Restoring filter integrity and addressing the bypass valve behavior stops the abrasive cycle and stabilizes wear rates.
Lubrication functions are straightforward; failure modes are not random. When you connect symptoms to the function being compromised—film, delivery, heat, chemistry, contamination, or containment—you get a clear path to targeted corrective action.
1.2 Tribology Concepts for Bearings Gears and Sliding Interfaces
Tribology is the study of how surfaces interact when they move. In industrial lubrication, it explains why the same machine can run quietly for years or fail quickly after a small change in oil, contamination, load, or alignment. The core idea is simple: friction and wear are not properties of a lubricant alone; they are outcomes of the contact between surfaces, the lubricant film, and the operating conditions.
Friction and Wear Mechanisms
Friction is the resistance to motion. In lubricated contacts, it comes from several sources: shearing the lubricant film, deformation of surface asperities, and chemical interactions at the interface. Wear is the gradual loss of material, driven by repeated stress and inadequate separation between surfaces.
A practical way to think about wear is to connect it to what the lubricant is doing. When the lubricant film is thick enough, surfaces are separated and wear is low. When the film collapses, asperities contact directly and wear accelerates. This is why viscosity, temperature, and contamination matter even when the lubricant brand is unchanged.
Lubrication Regimes and Film Formation
Lubrication regimes describe how much the surfaces are separated. The main regimes are boundary, mixed, and hydrodynamic or elastohydrodynamic.
- Boundary lubrication occurs when the film is too thin to fully separate surfaces. Additives and surface chemistry carry the load. Wear can still be controlled, but it is sensitive to additive depletion and contamination.
- Mixed lubrication is a partial separation state. Some load is carried by the lubricant film, and some by asperity contact. Wear rate depends strongly on film thickness and surface finish.
- Hydrodynamic lubrication occurs when a full film supports the load, typically in journal bearings at sufficient speed and viscosity.
- Elastohydrodynamic lubrication is common in rolling contacts like rolling element bearings and gear tooth contacts. Here, elastic deformation and high contact pressures create very high local film formation.
Example: A gearbox that runs hotter than usual may not fail immediately, but the oil viscosity drops, film thickness decreases, and mixed lubrication becomes more frequent. The result is often a rise in wear metals and a change in friction behavior before catastrophic damage.
Bearings Tribology
Bearings convert rotational motion into controlled contact stresses. Rolling element bearings rely on elastohydrodynamic lubrication between rolling elements and raceways. The lubricant must survive high pressure, maintain film strength, and resist oxidation.
Key tribology variables for bearings include:
- Load and speed, which influence contact pressure and film thickness.
- Surface finish and hardness, which affect how asperities interact.
- Contamination, especially particles that can act like tiny cutting tools or disrupt the film.
- Alignment and installation, which change load distribution and can concentrate stress.
Example: If a bearing is installed with misalignment, the load shifts toward one edge. Even with correct oil, the local contact conditions can move from stable elastohydrodynamic film to mixed lubrication, increasing pitting risk.
Gear Tribology
Gear teeth operate under sliding and rolling combined. The lubricant must handle shear in the contact zone while protecting against scuffing and wear.
Two practical concepts matter:
- Film thickness under tooth contact depends on viscosity, temperature, and speed.
- Scuffing resistance depends on additive chemistry and the ability to prevent metal-to-metal contact under high temperature spikes.
Example: A gear set that experiences a temporary overload may show no immediate failure, but repeated high-load events can consume anti-scuff additives. Later, normal loads produce higher wear because the lubricant’s protective chemistry is already depleted.
Sliding Interfaces Tribology
Sliding interfaces include bushings, thrust pads, and many linear guides. These contacts often operate in hydrodynamic or mixed lubrication depending on speed, load, and clearance.
For sliding systems, the lubricant film is shaped by geometry and motion. Small changes in clearance, surface roughness, or oil supply can shift the system from stable film to boundary conditions.
Example: A worn bushing increases clearance and can reduce the pressure needed to maintain a film. The machine may still run, but friction rises, temperature increases, and the oil can degrade faster, creating a feedback loop.
Mind Map: Tribology Concepts for Lubricated Contacts
Connecting Tribology to Lubrication Engineering
Tribology turns into engineering decisions through three links: (1) operating conditions determine film regime, (2) lubricant properties and additive chemistry determine how well protection is maintained, and (3) contamination and mechanical factors determine whether the film stays intact.
Example: If oil analysis shows viscosity drop and particle increase, tribology explains why both matter together. Lower viscosity reduces film thickness, while particles increase the chance of asperity contact. The combined effect is more severe than either factor alone, because they push the contact deeper into mixed or boundary lubrication.
1.3 Lubricant Types And Selection Criteria For Industrial Assets
Industrial lubrication is less about picking a “best” oil and more about matching a lubricant to the job: load, speed, temperature, contamination risk, materials, and the way the system delivers oil or grease. A good selection reduces wear, limits oxidation and deposits, and keeps seals and bearings happy.
Lubricant Families and What They’re Built to Do
Mineral Oils
Mineral oils are refined from petroleum and remain common because they balance cost and performance. They work well when temperatures are moderate and contamination is controlled. Their main weakness is oxidation resistance compared with many synthetic options, so they need good filtration and reasonable operating temperatures.
Synthetic Oils
Synthetic oils are engineered for stability. They typically handle wider temperature ranges and resist oxidation better than many mineral oils. They’re often chosen when equipment runs hot, cycles between cold and hot, or operates where oil life must be predictable.
Semi Synthetic Blends
Blends combine mineral base oils with synthetic components. They’re used when you want some temperature and oxidation improvement without moving fully to synthetic. Selection still depends on the additive package and the operating envelope.
Water Based Lubricants
Water based fluids are used where oil containment is difficult or where processes require water compatibility. They demand careful attention to corrosion control and microbial growth. For many industrial assets, they’re niche choices because they complicate contamination management.
Greases
Greases are lubricating oils held in a thickener. They’re selected for applications where oil circulation is impractical or where you need long service intervals. Grease performance depends on thickener type, base oil viscosity, and how the grease behaves under shear and temperature.
Additives and Why Base Oil Isn’t Enough
Base oil provides the “fluidity,” but additives provide the “defense.” Key additive functions include:
- Anti-wear: forms protective films so metal-to-metal contact is reduced during boundary lubrication.
- Extreme pressure: supports higher loads where anti-wear alone may not suffice.
- Corrosion inhibition: reduces rust and promotes seal compatibility.
- Detergency and dispersancy: helps keep contaminants suspended to prevent sludge and varnish.
- Foam control: prevents air entrainment in systems with pumps and splashing.
A practical way to think about it: two oils with the same viscosity can behave very differently if their additive packages target different failure modes.
Selection Criteria That Actually Matter
Operating Temperature Range
Temperature affects viscosity, oxidation rate, and seal behavior. If an asset runs hot, oxidation and deposit formation become the limiting factors; if it runs cold, viscosity can be too high for reliable flow. Selection should match both extremes, not just the average.
Load and Lubrication Regime
High loads and slow speeds push systems toward boundary or mixed lubrication, where anti-wear and extreme pressure performance dominates. Light loads at high speed often remain in hydrodynamic lubrication, where viscosity and film thickness are the main concerns.
Speed and Viscosity Requirements
Viscosity grade must support stable film formation without causing excessive churning losses. For example, a gearbox may require a specific viscosity to protect gears under load, while a high-speed bearing may need a different viscosity to avoid starvation or overheating.
Contamination Risk and System Cleanliness
Contamination changes everything: particles accelerate wear, water can promote corrosion, and fuel dilution can thin oil. If contamination risk is high, you typically need stronger filtration strategy and a lubricant with additive robustness, not just a “better” oil.
Seal and Elastomer Compatibility
Lubricants can swell or shrink seals depending on chemistry. A selection should consider seal material and the lubricant’s additive and base oil type. When compatibility is ignored, leaks become the maintenance plan.
System Design and Delivery Method
Circulating oil systems tolerate different viscosities than grease systems. Grease systems require attention to thickener stability and pumping behavior. Oil systems require attention to filtration, venting, and heat removal.
Maintenance Interval Expectations
If the maintenance plan expects long oil life, the lubricant must resist oxidation and maintain additive effectiveness. If the plan is frequent changes, the selection can focus more on wear protection and compatibility.
Mind Map: Lubricant Types and Selection Criteria
Integrated Examples for Common Industrial Assets
Example: Gearbox with Moderate Temperatures
A gearbox typically needs a gear oil with viscosity suited to load and speed, plus extreme pressure performance for gear teeth. If the gearbox runs warm and oil life is extended, synthetic or a blend with stronger oxidation resistance can reduce varnish and sludge risk. If leaks are present, seal compatibility becomes the first fix before “upgrading” the lubricant.
Example: High-Speed Bearing in a Clean Environment
For a high-speed bearing, the priority is stable viscosity and reliable film formation without overheating. A synthetic base oil may help with temperature stability, but the selection still depends on the additive package’s anti-wear performance and the system’s ability to keep water and particles out.
Example: Grease-Lubricated Conveyor Bearings
Grease selection focuses on thickener stability, base oil viscosity, and how the grease responds to shear and temperature. Overgreasing can cause churning and seal damage, while undergreasing leads to starvation. A grease that matches the operating temperature and is compatible with seals prevents both extremes.
Example: Hydraulic System with Water Ingress Risk
Hydraulic oils must resist water-related corrosion and maintain additive effectiveness. If water contamination is recurring, the lubricant choice should be paired with improved water removal and monitoring, because a corrosion-inhibiting oil is not a substitute for fixing the ingress path.
Practical Selection Workflow
Start with the asset’s lubrication function and failure mode: wear protection, corrosion control, or deposit prevention. Then match lubricant type to temperature range and delivery method, verify viscosity requirements for film formation, and confirm seal compatibility. Finally, align additive needs with contamination risk and maintenance interval so the lubricant’s chemistry supports the maintenance reality rather than fighting it.
1.4 Contamination Control Principles for Water, Dirt, and Particles
Contamination control is the practical bridge between “good lubricant on paper” and “good lubrication in the real world.” Water and dirt enter systems through predictable paths, and particles move through predictable mechanisms. If you control the paths and slow the mechanisms, you reduce wear, extend filter life, and stabilize oil condition.
Why Water and Dirt Matter
Water causes problems in two ways: it changes lubricant behavior and it enables corrosion. In many systems, even small water levels can reduce film strength, promote sludge formation, and accelerate bearing and gear corrosion when oxygen and metal surfaces are present. Dirt and particles primarily cause abrasive wear and accelerate filter loading. The key idea is simple: contamination turns a controlled lubrication film into a mixed regime where metal-to-metal contact becomes more likely.
Contamination Sources and Entry Paths
Start by mapping where contamination can enter. Common sources include:
- Breathing and temperature cycling: Reservoirs “inhale” humid air when temperature drops, then “exhale” it when temperature rises.
- Open fills and maintenance work: Unsealed containers, dirty funnels, and long exposure times during top-ups are frequent culprits.
- Leaking seals and hydraulic components: Internal leaks can carry water or process fluids into the lubricant.
- Inadequate filtration during commissioning: New systems often start with construction debris.
A useful rule of thumb is to treat every opening, every hose connection, and every reservoir vent as a contamination gateway.
Particle Control: Size, Shape, and Transport
Particles are not all equal. Larger particles are more likely to be trapped by filters, while smaller particles can pass through and still cause wear. Shape matters too: sharp particles can be more damaging than rounded ones at the same size.
Transport depends on flow regime and system design. In a gearbox sump, particles settle if flow is low and residence time is high; in a circulating system, particles follow the oil path and concentrate near bearings or control valves. This is why filter placement and bypass behavior matter.
Water Control: Ingress, Emulsification, and Removal
Water enters as free water, dissolved water, or emulsified water. Free water tends to settle; emulsified water is harder to remove because it stays dispersed. Many lubricants can tolerate some water, but tolerance depends on additive chemistry and operating temperature.
Removal strategies depend on how water is present:
- Keep water from entering: better breathers, sealed reservoirs, and controlled filling.
- Separate water when possible: coalescers and water-removal elements for systems designed for it.
- Monitor water trends: oil analysis should include water indicators appropriate to the lubricant type.
Filtration Strategy and Bypass Management
Filtration is not just “install a filter.” It is a system with flow capacity, differential pressure behavior, and maintenance triggers.
- Choose filter rating to match risk: critical bearings and tight clearances need finer control.
- Avoid bypass surprises: if differential pressure rises, bypass can allow unfiltered oil to circulate.
- Use differential pressure indicators as maintenance signals: a rising trend often means the element is loading with particles or water-related sludge.
Example: A plant notices rising wear metals in a gearbox while oil analysis shows stable viscosity. Differential pressure across the kidney loop filter climbs steadily, and bypass events occur during peak load. After replacing the element and improving suction-side cleanliness, wear metals stabilize.
Maintenance Practices That Actually Reduce Contamination
Good contamination control is mostly good habits:
- Use sealed, clean containers for top-ups and minimize time the system is open.
- Label and dedicate sampling bottles to prevent cross-contamination between assets.
- Flush new lines and components before connecting to sensitive equipment.
- Inspect breathers and vents during planned downtime.
Example: During a routine top-up, an operator pours from a partially used drum into a funnel that was stored on a dusty shelf. Within weeks, particle counts rise and filter change intervals shorten. The fix is not a new filter; it is controlled handling and storage.
Mind Map: Contamination Control Logic
Practical Example Workflow for a New Oil Analysis Baseline
- Define the sampling points for reservoir, return line, and critical bearing or gearbox outlet.
- Set initial cleanliness expectations using particle counts and water indicators relevant to the lubricant.
- Record filter differential pressure history and element change dates.
- Compare trends after maintenance such as top-ups or filter replacements.
If particle counts rise immediately after a top-up, the source is usually handling. If water indicators rise after a cold-to-warm cycle, breathing and venting are likely. When both rise together, suspect emulsification from water ingress plus insufficient separation.
Key Takeaways
Water and particles are controlled by preventing entry, managing transport, and ensuring filtration works as designed. The most reliable results come from combining oil analysis trends with operational evidence like differential pressure and maintenance handling records.
1.5 Lubrication System Components and Their Roles in Service
A lubrication system is a controlled delivery and conditioning path for lubricant. In service, its job is not just to “get oil or grease on the machine,” but to maintain the right film, the right cleanliness, and the right delivery rate under changing load, speed, temperature, and contamination exposure.
System Overview from Source to Contact
Most industrial lubrication systems follow the same logical chain:
- Lubricant storage holds the correct product and prevents unnecessary exposure.
- Supply and metering controls how much lubricant reaches the target.
- Distribution routes lubricant to bearings, gears, slides, or hydraulic elements.
- Conditioning removes water and particles or stabilizes temperature.
- Return and containment brings lubricant back to the sump or reservoir and prevents leaks.
- Monitoring and protection detects abnormal conditions early.
A useful way to think about it: if oil analysis is the “diagnostic,” the lubrication system is the “patient’s circulation.” If the circulation is inconsistent, the diagnosis will be noisy.
Storage and Reservoirs
Oil reservoirs and grease reservoirs provide volume for thermal stability and for uninterrupted operation between refills. In oil systems, the reservoir also acts as a settling space where large debris can drop out before the pump. In grease systems, the reservoir must be sealed to limit water ingress and contamination.
Example: A gearbox with a vented reservoir that is not protected can breathe in humid air during temperature swings. Even if the oil is correct, water can accumulate and later show up as viscosity changes and emulsion-like behavior.
Pumps, Feed Lines, and Metering Devices
Pumps move lubricant; their selection depends on viscosity range and required pressure. Feed lines carry lubricant to the distribution points, and their routing affects pressure drop and response time.
For automated systems, metering devices (such as progressive distributors, metering pumps, or metering valves) determine dose per cycle. Metering accuracy matters because under-delivery leads to starvation and over-delivery can overwhelm seals and create churning.
Example: A centralized grease system that uses a worn metering valve may still “deliver grease,” but at a lower rate. Bearings can then run with a thinner film, and wear metals may rise even though the system appears active.
Filters, Strainers, and Offline Conditioning
Filters remove particles that would otherwise accelerate abrasive wear. Strainers protect pumps and sensitive components from larger debris. Some systems include offline filtration (kidney loop) to clean oil continuously without disturbing the main flow.
Example: If a filter element is bypassing due to a blocked media or a stuck differential pressure switch, oil analysis may show elevated particle counts while differential pressure records reveal the bypass event.
Heat Exchangers and Temperature Control
Temperature affects viscosity, oxidation rate, and seal performance. Heat exchangers and cooling circuits keep lubricant within a target band. Even a correct lubricant can fail early if it repeatedly runs too hot.
Example: A hydraulic power unit with a partially blocked cooler can maintain pressure but gradually loses viscosity control. The result is higher internal leakage and faster additive depletion.
Valves, Regulators, and Pressure Protection
Pressure regulators maintain stable delivery. Relief valves protect against overpressure. Check valves prevent backflow that can drain lines and cause inconsistent start-up delivery.
Example: Without a functioning check valve, a centralized oil line may drain back to the reservoir overnight. The next start-up then begins with delayed delivery, which can be critical for bearings that require immediate film formation.
Distribution to the Lubricated Interfaces
Distribution methods depend on the machine type:
- Bearings and gearboxes often use splash, circulation, or jet lubrication.
- Slides and linear guides use wipers, channels, or centralized grease/oil delivery.
- Hydraulics rely on system circulation and filtration.
Example: A jet-lubricated bearing that receives the correct flow but at the wrong location can still fail because the jet must reach the intended film region.
Seals, Breathers, and Containment
Seals prevent lubricant loss and contamination ingress. Breathers manage pressure equalization while limiting water and particle entry. Containment is not optional; it is part of system performance.
Example: A clogged breather can push contaminants past seals during pressure spikes. Oil analysis later shows rising water or fuel dilution, even though the lubricant was initially clean.
Return Paths, Sumps, and Level Control
Return lines and sumps collect lubricant and allow air release. Oil level control ensures pumps do not run dry and that the system maintains proper submergence for cooling and circulation.
Example: A low oil level can cause cavitation in a pump. Cavitation introduces microbubbles that can later correlate with abnormal wear patterns and unstable viscosity readings.
Monitoring, Alarms, and Service Interfaces
Monitoring ties the system to maintenance actions. Common indicators include:
- Differential pressure across filters
- Flow verification for automated systems
- Level and temperature sensors
- Pressure switches for delivery confirmation
These signals should trigger specific actions, not just alarms.
Example: A filter differential pressure alarm should lead to an inspection of bypass status and element condition, followed by a sampling plan to confirm whether particle counts increased.
Mind Map: Lubrication System Components and Their Service Roles
Integrated Example: From Component Fault to Maintenance Evidence
Consider a centralized grease system on a critical conveyor gearbox. A technician notices rising bearing noise during routine checks. Oil analysis is not applicable here, so the evidence comes from system signals and inspection.
- A flow or cycle verification shows reduced delivery time per cycle.
- A metering device is found with worn internal parts.
- The bearing shows early wear consistent with starvation rather than contamination.
Correcting the metering device restores delivery consistency, and subsequent inspections confirm stable bearing condition. The key is that each component’s role in service connects directly to what you can measure and what you can fix.
2. Lubricant Properties and Laboratory Test Methods
2.1 Viscosity and Viscosity Index Selection for Operating Conditions
Viscosity is the lubricant’s resistance to flow, and it largely controls film thickness in bearings, gears, and hydraulic components. Viscosity Index (VI) describes how viscosity changes with temperature: a higher VI means the oil thins less as temperature rises. Selecting the right viscosity grade and VI is less about finding a single “best” number and more about ensuring the oil stays within a workable viscosity window across real operating temperatures.
Mind Map: Viscosity and Viscosity Index Selection
Foundational Concepts That Drive the Choice
Kinematic Viscosity and the “Too Thin / Too Thick” Problem
Kinematic viscosity is commonly expressed in centistokes (cSt) at a reference temperature (often 40°C and 100°C). In service, what matters is the viscosity at the actual oil temperature. If the oil is too thin, the film can collapse under load, increasing wear and friction. If it is too thick, pumps may struggle, flow paths can starve, and seals may experience higher drag.
A practical way to think about it: viscosity is the “thickness” of the oil film, but temperature is the “eraser.” Your job is to choose an oil whose thickness remains adequate after the eraser does its work.
Viscosity Index as Temperature Behavior
VI is a comparative measure of how much viscosity changes with temperature relative to a reference oil. Two oils with the same viscosity grade can behave differently across temperature swings. A higher VI typically helps maintain viscosity closer to the target during warm operation, which is especially useful when equipment runs hot or cooling performance varies.
Systematic Selection Method
Step 1: Establish the Real Operating Temperature Range
Start with the oil temperature you actually see, not the room temperature. For a gearbox, oil temperature rises due to bearing friction and gear churning; for hydraulics, it rises due to pressure drop and throttling. If you only have ambient data, estimate oil temperature using measured heat exchanger performance, duty cycle, and typical load.
Example: A gearbox in a packaging line runs intermittently. During short production runs, oil may not fully reach steady-state temperature, but during long runs it does. You need both the “warm steady” and “cold start” conditions because viscosity requirements differ.
Step 2: Choose a Viscosity Grade That Fits the Film Needs
Most equipment guidance is expressed as a target viscosity range at operating temperature. Use that range to back-calculate the required grade. If the target is, say, 15–22 cSt at operating temperature, then you select an oil grade that lands in that window when the oil reaches its expected temperature.
Example: Suppose the gearbox oil temperature is expected to be 70°C during steady operation. If you choose an oil that is only 10 cSt at 70°C, you’re closer to the “too thin” side. If you choose an oil that is 35 cSt at 70°C, you’re closer to the “too thick” side, which can increase churning losses and reduce flow to critical points.
Step 3: Use VI to Control Viscosity Drift Across Temperature
Once you know the target viscosity at warm operation, VI helps manage what happens when temperatures move. A higher VI reduces thinning at high temperature, which helps maintain film thickness during hot days, high load, or reduced cooling.
But VI also interacts with cold start. If the oil is too viscous when cold, pumps may cavitate or flow may be delayed. That’s why you should consider both ends of the temperature range.
Example: Two oils both meet the warm viscosity target. Oil A has a lower VI, so during cold mornings it becomes significantly thicker. The lubrication system may take longer to reach flow, increasing the time spent in less favorable lubrication regimes.
Step 4: Check Pumpability, Flow, and Leakage Behavior
Even if film thickness looks good, the system must move the oil. Verify that at the lowest expected start temperature, the oil can be pumped and that filters and passages are not overwhelmed. Also consider that higher viscosity can increase leakage in some designs (through higher pressure-driven flow) or increase seal drag in others.
Example: A centralized grease/oil system with small lines may be sensitive to cold viscosity. If the oil is too thick, the metering device may not deliver consistently, leading to uneven lubrication.
Quick Worked Example
Assume a hydraulic unit must maintain stable lubrication at 55°C oil temperature, with a workable viscosity window around 20–30 cSt at that temperature. You test two candidate oils:
- Oil 1: Meets 20–30 cSt at 55°C but drops to near the lower edge when oil reaches 65°C.
- Oil 2: Still stays within 20–30 cSt at 65°C due to higher VI.
If the system sometimes runs hotter during high demand, Oil 2 reduces the risk of operating near the “too thin” boundary. If cold starts are also a concern, you confirm that Oil 2 remains pumpable at the lowest start temperature.
Practical Selection Checklist
- Confirm oil temperature range, including cold start and warm steady operation.
- Select a viscosity grade that places the oil in the target cSt window at warm operating temperature.
- Choose VI to limit viscosity drift when temperatures vary.
- Validate pumpability and flow at the coldest expected conditions.
- Use oil analysis to verify that viscosity trends align with the temperature assumptions.
When these steps are followed, viscosity selection becomes a controlled engineering decision rather than a guess based on a label. The goal is simple: keep the lubricant in the right viscosity neighborhood long enough for the machine to do its job.
2.2 Additive Chemistry and Performance Verification Through Testing
Industrial lubricants are not just base oils with a label. Additives are the part that makes the oil behave like a system: they form protective films, manage oxidation, control corrosion, and keep contaminants from turning into a bigger problem. The trick is that additives only help if the chemistry matches the failure mode and if the lubricant is verified under conditions that resemble real service.
Additive Chemistry Building Blocks
Additive packages usually include several functional groups that work together, not in isolation. A practical way to think about them is by the job they do:
- Oxidation control slows thickening and sludge formation. In practice, oxidation often accelerates with heat and oxygen exposure, so the additive must survive the temperature profile.
- Anti-wear and extreme-pressure agents protect metal surfaces when the oil film thins. They are especially important during start-up, boundary lubrication, and high-load contact.
- Corrosion inhibition reduces rust and metal loss in the presence of water and acids.
- Detergency and dispersancy keep insoluble byproducts suspended so filters and separators can remove them.
- Friction modifiers tune how surfaces slide, which can reduce heat and improve efficiency in some applications.
- Seal and elastomer compatibility is often overlooked. Additives that are fine for steel can still attack seals.
A useful mental model is to map each additive group to a likely failure mechanism. If the failure is primarily contamination-driven, additive chemistry alone cannot fix it; filtration and sampling discipline still matter.
Performance Verification Through Testing
Performance verification is the bridge between chemistry and maintenance decisions. Testing should answer two questions: Does the lubricant meet the required performance? and Is it staying that way in service?
Test Strategy from Bench to Service
A systematic test strategy typically moves from controlled screening to more realistic evaluation:
- Property verification confirms baseline characteristics such as viscosity grade, pour point, and demulsibility.
- Chemical performance tests check additive effectiveness under stress, such as oxidation resistance and anti-wear behavior.
- Contamination tolerance tests evaluate how the lubricant handles water, soot, or fuel dilution.
- Compatibility checks confirm seal and paint compatibility where relevant.
- Field validation compares oil analysis trends and component outcomes against expectations.
This sequence prevents a common failure mode: selecting a lubricant that looks good on paper but fails when it meets the actual contamination and temperature profile.
Key Laboratory Tests and What They Prove
- Oxidation resistance tests (often accelerated) indicate how quickly the oil forms acids and sludge precursors. If oxidation control is weak, viscosity can rise and wear can increase because the oil film becomes less stable.
- Anti-wear performance tests evaluate how well additives protect under controlled contact. The goal is not just low wear numbers; it is consistent protection across the relevant load and temperature range.
- Extreme-pressure tests assess protection at higher loads where boundary lubrication dominates. A lubricant that performs well in anti-wear tests can still fail under extreme-pressure conditions.
- Corrosion tests check metal loss and rust formation in the presence of water and corrosive species. This is where corrosion inhibitors earn their keep.
- Demulsibility and water separation tests measure how quickly water separates and how stable emulsions remain. If water lingers, corrosion and additive depletion become more likely.
Interpreting Results Without Guessing
Testing produces numbers, but decisions require context. The same test result can mean different things depending on baseline oil chemistry and operating severity.
A practical approach is to compare against:
- Specification limits for the lubricant category.
- Baseline performance of the same product batch or formulation.
- Service oil analysis trends such as viscosity shift, oxidation markers, and wear metal trends.
If a test indicates weak oxidation control, you should expect service oil analysis to show faster viscosity increase and higher oxidation-related indicators, especially in hot or aerated systems.
Mind Map: Additive Chemistry and Verification
Example: Selecting Additives for a Gearbox with Water Ingress
Consider a gearbox that shows rising water content and increasing wear metals over time. The base oil viscosity grade might still be correct, but additive performance can be overwhelmed.
A sensible verification plan would include:
- Corrosion and water-handling tests to confirm the corrosion inhibitor package and demulsibility behavior.
- Oxidation resistance checks because water often accelerates oxidation and acid formation.
- Anti-wear evaluation because boundary protection becomes more important when water reduces film stability.
In service, you would then expect oil analysis to show slower growth of oxidation-related indicators and more stable wear metal trends if the additive package matches the water ingress reality.
Example: Verifying Anti-Wear Protection for High-Load Bearings
A plant runs bearings near the edge of the oil film regime during start-up and load spikes. A lubricant that passes a general specification may still underperform.
Verification should focus on:
- Anti-wear performance under boundary conditions to confirm the additive film forms reliably.
- Extreme-pressure capability if load spikes approach the threshold where boundary lubrication dominates.
When the additive package is correct, oil analysis trends typically show steadier wear metal levels during the periods that historically caused spikes, because the protective boundary film is doing its job.
2.3 Water and Fuel Contamination Detection Methods
Water and fuel contamination are common oil-analysis “plot twists” because they can look like wear at first. Water tends to accelerate oxidation and corrosion, while fuel dilutes viscosity and can thin the lubricant film. The goal of detection is not just to label “contaminated,” but to identify the likely source and the urgency.
Foundational Indicators and Why They Matter
Start with the physical effects that contamination causes:
- Water reduces oil’s protective capability and can form emulsions. It often shows up as rising water content, viscosity changes, and increased oxidation products.
- Fuel lowers viscosity and may increase soot-related particles. It can also change volatility behavior, which affects how the oil responds to temperature.
A practical approach is to use multiple signals rather than a single test. One test can be fooled by additives, operating conditions, or sampling issues.
Mind Map: Detection Logic for Water and Fuel
Water Detection Methods
Karl Fischer titration measures water content directly, usually as a mass fraction. It is effective when water is present as dissolved water or loosely held water, but it can be less informative if the sample is heavily emulsified and the method cannot access the water phase consistently. A good workflow is to pair Karl Fischer with a test that indicates emulsion behavior.
Infrared spectroscopy can detect water-related absorption features, especially the O–H region. This is useful for trending because the spectral signature changes as water content changes. It also helps separate “true water” from some additive-related artifacts, since additives typically do not create the same O–H pattern.
Emulsion and separation checks are simple but powerful when done consistently. For example, if a sample shows persistent milky appearance and slow separation under controlled settling, it suggests water is present in an emulsified form. This method is not a precise measurement, but it is a strong confirmation tool when paired with a quantitative test.
Corrosion and acid indicators support the water story. Water-driven corrosion often correlates with increased acidity and changes in wear metal patterns. If you see rising water content alongside higher acid numbers and iron/copper trends, you have a coherent mechanism rather than a random fluctuation.
Fuel Detection Methods
Viscosity and viscosity index shift are the first line because fuel dilution lowers viscosity at operating temperature. The trick is to interpret viscosity changes in context: temperature excursions, shear, and additive depletion can also move viscosity. Fuel dilution often produces a viscosity drop that aligns with other fuel-sensitive indicators.
Flash point testing is a practical indicator of volatility changes. Fuel contamination lowers flash point because lighter hydrocarbons evaporate more readily. Flash point is not a perfect fuel “fingerprint,” but it is a strong screening tool when interpreted alongside viscosity and soot.
Infrared spectroscopy can detect hydrocarbon patterns associated with fuel components. The spectral approach works best when you have a baseline for the specific lubricant grade and when you trend results rather than relying on a single reading.
Gas chromatography can provide more specific evidence by separating and identifying light hydrocarbon fractions. It is more resource-intensive, but it can confirm fuel presence when screening tests are ambiguous.
Soot and particle context matters because fuel contamination often comes with combustion byproducts. If fuel dilution is suspected and soot-related particle counts rise at the same time, the case becomes much stronger.
Example: Diesel Engine Crankcase Oil
A plant monitors crankcase oil on a weekly schedule. One sample shows:
- Viscosity at 40°C lower than baseline
- Flash point reduced
- Soot-related particle counts elevated
The lab runs a fuel-sensitive infrared check and confirms a hydrocarbon signature consistent with light fuel fractions. Karl Fischer water is also performed and shows low water. The maintenance response focuses on the likely fuel ingress path (for example, injector leakage or incomplete combustion conditions) rather than chasing a cooling-system issue.
Example: Hydraulic System with Water Suspected
A hydraulic reservoir sample appears slightly cloudy. The lab results show:
- Karl Fischer water content above the site baseline
- Infrared O–H signature consistent with water
- Acid number trending upward
Because the water is confirmed and the chemistry supports it, the investigation prioritizes water ingress routes such as breathers, seal leakage, or condensation during temperature swings. A retest after corrective actions verifies that water content and acid indicators move back toward baseline.
Practical Sampling Notes That Prevent False Alarms
Water and fuel detection is sensitive to sample handling. Use clean containers, avoid introducing moisture during sampling, and seal promptly to limit evaporation. If samples are taken from warm equipment, allow them to reach a consistent handling temperature before closing the container, since condensation can occur when hot oil meets cooler air. Consistency beats heroics: the best test results come from repeatable sampling discipline.
2.4 Particle Counting and Ferrous Debris Analysis Techniques
Particle counting answers a simple question: how many solid contaminants are in the oil, and how big are they? Ferrous debris analysis answers a related question: how much of that debris is iron-based, which often points to wear from steel components like gears, bearings, and shafts.
Why Particle Size Matters
Particles are not all equally harmful. Larger particles are more likely to cause abrasive wear and to get past clearances, while smaller particles can still accelerate wear by increasing the number of contact events at the surfaces. A useful starting point is to treat the particle distribution as a fingerprint of the system: hydraulic systems often show different size patterns than gearboxes, and ingression events tend to shift the distribution toward larger sizes.
Sampling Discipline for Reliable Counts
Particle counting is sensitive to contamination introduced during sampling. Use clean containers, avoid touching the inside of caps, and follow a consistent sampling method each time. If you collect from a drain, let the flow stabilize so you don’t count stagnant debris that sat in the line. For systems with filters, sample after the filter stage when possible, or at least record the sampling location so trends remain interpretable.
Measurement Methods
Particle counting is typically performed with either optical particle counters or microscopic/automated image analysis.
Optical counters pass a diluted oil stream through a sensing zone and infer particle size from light scattering. This works well for repeatable counting, especially when you have a defined size range and a stable dilution procedure.
Image analysis uses microscopy and software to measure particle dimensions directly. It can provide better discrimination between particle shapes and can help separate soot-like particles from metallic debris, but it is more labor-intensive and requires careful calibration.
Dilution and Counting Limits
Most particle counters require dilution to avoid coincidence, where multiple particles pass the sensor at once and get counted as one. The dilution factor must be documented because it directly affects the reported concentration. Also watch the instrument’s lower detection limit: if your oil is very clean, the count may be dominated by measurement noise rather than real particles.
A practical example: suppose a gearbox oil shows 500 particles/mL in the 5–10 µm range at one sampling event and 1,500 particles/mL at the next. If dilution was consistent and the instrument’s detection limit is well below 5 µm, the threefold increase is meaningful and worth investigating for filter bypass, seal leakage, or abnormal wear.
Converting Counts into Maintenance Meaning
Raw counts are useful, but maintenance decisions improve when you connect counts to system behavior.
- Trend the distribution, not just the total count. A rise in 15–25 µm particles often indicates ingression or filter deterioration more than oxidation products.
- Compare to baseline. Establish a baseline during stable operation. If the baseline varies by load or temperature, stratify your data by operating conditions.
- Pair with filtration indicators. Differential pressure across filters and bypass valve events help explain why particle counts change.
Ferrous Debris Analysis Techniques
Ferrous debris analysis focuses on iron-containing particles, which can be measured by magnetic methods or by spectroscopy-based approaches.
Magnetic patch and ferrography-style methods capture particles onto a surface using magnetic attraction. Ferrous particles collect in a way that can be visually inspected or quantified. This is especially helpful for identifying wear mode patterns, such as larger, plate-like debris associated with sliding wear.
Ferrous particle quantification can also be done using direct-reading instruments that measure magnetic response. These methods are fast and good for routine monitoring, but they still require consistent sampling and cleaning of measurement hardware.
Linking Ferrous Debris to Wear Mechanisms
Ferrous debris is not automatically “bad,” but it becomes actionable when it changes in a way that matches a wear mechanism.
- Sustained increase in ferrous debris with stable particle counts can suggest a wear process rather than contamination ingression.
- Ferrous spikes aligned with particle size growth often indicate a mechanical event like gear tooth damage or bearing distress.
- Ferrous debris without a corresponding viscosity or oxidation shift can point to localized wear rather than broad lubricant breakdown.
Integrated Example Workflow
Consider a hydraulic system with a history of filter-related issues.
- Particle counts show a shift upward in the 10–20 µm range.
- Ferrous debris increases at the same time, suggesting that some of the new particles are metallic.
- Differential pressure across the filter rises, and bypass valve indicators show intermittent bypass.
- Root cause actions focus on filter element integrity and seal condition at the pump inlet.
After corrective work, the next sampling event shows particle counts returning toward baseline and ferrous debris stabilizing, confirming that the system is no longer generating or passing excessive wear debris.
Mind Map: Particle Counting and Ferrous Debris Analysis
Practical Checklist for Each Report
Record the sampling point, dilution factor, size bins, total count, and ferrous debris result. Include the filter differential pressure status at the time of sampling. When you write the maintenance recommendation, tie it to a specific pattern, such as “increase in 10–20 µm particles plus ferrous rise consistent with filter bypass and metallic wear generation.”
2.5 Spectroscopy and Elemental Wear Interpretation for Maintenance Decisions
Spectroscopy in industrial oil analysis usually means measuring how much of each element is present in the oil sample. The goal is not to memorize element lists; it is to connect element patterns to wear mechanisms, contamination sources, and lubricant condition so you can choose the right maintenance action.
How Spectroscopy Measures Wear Signals
Most routine spectroscopy uses optical emission or X-ray fluorescence. Both methods report element concentrations, typically in parts per million (ppm) or similar units. The oil is the transport medium, so the measured elements represent what is suspended or dissolved at the time of sampling. That means sample handling matters: a dirty bottle or a poorly cleaned sampling point can add elements that never came from the machine.
A practical way to think about spectroscopy is “elemental fingerprints.” Iron often points to steel wear, copper to bearing alloys or bushings, aluminum to light-metal components or housings, and silicon to dirt or sealant residues. But the fingerprint only becomes useful when you interpret it alongside trends, oil type, and operating context.
Turning Element Numbers into Maintenance Meaning
Start with three checks before you jump to conclusions.
- Trend direction: Compare the current result to your baseline and recent history. A one-time spike can be sampling contamination or a short event like a filter bypass.
- Magnitude relative to machine type: A gearbox with bronze components may show copper routinely, while a system with no copper-bearing parts should treat copper as suspicious.
- Co-occurrence patterns: Wear rarely involves one element alone. For example, high iron with rising silicon suggests abrasive contamination; iron with copper can indicate mixed wear in bearings.
Element Interpretation Framework
Use a structured mapping from element to likely source, then to likely mechanism.
- Ferrous elements (Fe, sometimes Cr, Ni): Commonly associated with steel wear. In bearings, rising Fe can reflect rolling contact fatigue or spalling debris. In gears, it can reflect scuffing or abnormal load.
- Copper and tin (Cu, Sn): Often linked to bearing shells, thrust washers, or bronze components. If Cu rises without Fe, it can indicate localized wear in a copper-rich part.
- Aluminum (Al): Often appears from aluminum housings, pistons, or bearing cages. In hydraulic systems, Al can also show up when seals or casting material contribute debris.
- Silicon (Si): Frequently indicates dirt ingress or abrasive contamination, especially when Si increases faster than wear metals.
- Lead and silver (Pb, Ag): Can appear in certain bearing materials. Their presence is meaningful only when the asset’s material list supports it.
- Phosphorus, sulfur, zinc (P, S, Zn): These can be additive-related rather than wear-related. If the oil brand and additive package are known, you can separate “still normal” from “changed.”
Example Decision Logic for a Bearing System
Imagine a motor-driven gearbox with a consistent oil grade and sampling interval. Over three months, iron rises from 8 ppm to 22 ppm, copper rises from 2 ppm to 9 ppm, and silicon stays flat around 3 ppm. Viscosity and oxidation indicators are stable.
A reasonable interpretation is mixed wear in a steel-and-copper bearing set rather than dirt ingestion. The maintenance decision should focus on inspection planning: schedule a bearing inspection during the next outage, verify alignment and load conditions, and check for lubrication delivery issues that can accelerate wear even when contamination is controlled.
Now consider a second scenario: iron jumps from 10 ppm to 35 ppm, silicon rises from 4 ppm to 28 ppm, and copper remains near baseline. That pattern points to abrasive contamination. The maintenance action shifts toward contamination control: confirm filter condition, check breathers and seals, and verify that sampling and top-up practices do not introduce dirt.
Mind Map: Element Patterns to Maintenance Actions
Common Pitfalls and How to Avoid Them
A frequent mistake is treating any element increase as immediate component failure. A more reliable approach is to require pattern consistency: wear metals should rise together in a way that matches the machine’s materials and the expected wear mechanism.
Another pitfall is ignoring additive elements. If phosphorus or zinc changes, it may reflect oil dilution, additive depletion, or mixing of oil grades. In that case, spectroscopy alone cannot confirm wear; you use it with viscosity, oxidation, and particle data from the same sample.
Example: Separating Additive Chemistry from Wear
Suppose zinc and phosphorus increase while iron stays flat and copper decreases slightly. If the oil brand is unchanged and the viscosity remains stable, the most likely explanation is additive concentration variation from oil top-up or mixing, not a new wear mechanism. The maintenance decision becomes administrative and procedural: verify top-up source and confirm that the correct oil grade is used at the sampling point.
Practical Maintenance Decision Checklist
Before issuing work orders, confirm these items in order: sampling cleanliness, trend direction, asset material compatibility, element co-occurrence, and whether additive elements are changing. When those checks align, spectroscopy becomes a dependable guide for choosing between inspection, contamination control, and lubrication delivery corrections.
3. Oil Analysis Program Design and Sampling Discipline
3.1 Defining Objectives and Success Criteria for Oil Analysis
Oil analysis works best when it has a job description. Without clear objectives, results become interesting trivia instead of maintenance decisions. With clear objectives, you can decide what to test, how often to sample, what thresholds mean, and what actions follow.
Objectives That Drive Test Selection
Start by stating the objective in operational terms. For example, “reduce bearing failures caused by contamination” is more useful than “monitor wear.” Then translate the objective into measurable questions:
- Is the lubricant losing its ability to protect surfaces? (oxidation, viscosity change, additive depletion)
- Are wear particles increasing in a way that indicates abnormal component stress? (ferrous/non-ferrous wear trends)
- Is contamination entering and persisting? (water, fuel, dirt, seal leakage)
- Are filtration and system hygiene performing as intended? (particle counts, differential pressure correlation)
- Are there early signs of lubrication system malfunction? (starvation, overfeeding, pump issues)
A practical way to keep this grounded is to connect each objective to a failure mode you already know from history. If you have no history, use the equipment manual and maintenance logs to identify the most likely lubrication-related failure modes, then choose tests that directly answer the questions above.
Success Criteria That Turn Results into Actions
Success criteria should define what “good” looks like after you implement oil analysis. Use criteria that can be verified without guesswork.
-
Decision timeliness: The time from sample collection to maintenance action is within a defined window.
- Example: “If water is detected above the alert threshold, the inspection and corrective work order are initiated within 7 calendar days.”
-
Decision quality: Actions taken based on oil analysis reduce repeat failures or prevent escalation.
- Example: “For gearboxes with rising iron trend, the corrective action (filter change, seal inspection, alignment check) is completed before oil condition reaches the stop threshold, and repeat events drop over the next two sampling cycles.”
-
Coverage adequacy: Critical assets receive sampling and testing that match their risk and operating conditions.
- Example: “All pumps feeding critical bearings are included in the program; non-critical assets use a reduced test panel.”
-
Threshold usability: Alert and action limits are specific enough that technicians can interpret results consistently.
- Example: “Viscosity change is evaluated using the same reference baseline and the same temperature correction method across the fleet.”
-
Closed-loop verification: Each alert leads to either a confirmed root cause or a documented reason for no action.
- Example: “Every ‘water present’ result includes a follow-up check of breathers, seals, and reservoir condition, with results recorded in the CMMS.”
Baselines and Thresholds Without Confusion
Success criteria depend on baselines. A baseline is not a single number; it is a range that reflects normal operation.
- Establish a baseline window: Use multiple samples under stable conditions.
- Example: For a new gearbox, collect samples at commissioning, then at consistent intervals for the first 3–4 cycles before setting alert limits.
- Separate normal variability from abnormal change: Define what counts as a meaningful shift.
- Example: “A viscosity decrease of 5% from baseline is an alert only if it coincides with oxidation indicators or particle increases.”
Thresholds should be expressed as alert and action levels, each tied to a specific response.
- Alert level triggers investigation.
- Example: “Particle count above alert prompts filter inspection and sampling confirmation.”
- Action level triggers corrective work.
- Example: “Water above action level triggers reservoir inspection, seal/breather checks, and a controlled oil change decision.”
Mind Map: Objectives to Success Criteria
Example: Turning One Objective into a Test Plan
Objective: “Reduce bearing damage from contamination and lubricant degradation in a set of air compressor gearboxes.”
Success criteria:
- Alert response within 7 days for water or particle spikes.
- Action response within 30 days for confirmed additive depletion or persistent contamination.
- At least 90% of alerts have documented follow-up checks.
Test panel logic:
- Use viscosity and oxidation indicators to confirm lubricant performance.
- Use particle counts and wear metals to detect contamination-driven wear.
- Use water and fuel checks to identify ingress mechanisms.
Sampling discipline:
- Sample from the same location each time.
- Keep handling consistent so results reflect the system, not the sample journey.
When the first alert occurs, the team should be able to answer two questions immediately: “What does this result mean relative to baseline?” and “What will we do next?” If either answer is missing, the objective and success criteria need refinement before expanding the program.
3.2 Sampling Points Selection for Bearings Gearboxes and Hydraulics
Sampling points are where your oil analysis either becomes evidence or becomes guesswork. The goal is simple: collect a sample that represents the fluid the component actually experiences, while keeping sampling repeatable enough that trends mean something.
Core Principles for Choosing Sampling Points
Start with the lubrication path. Bearings, gearboxes, and hydraulics each have a distinct flow pattern, so the “best” sampling location depends on where the oil is in relation to contamination sources and wear-generating interfaces.
-
Represent the component’s exposure. If oil is filtered before it reaches the bearing, sampling after filtration may hide contamination that would otherwise reach the bearing. If oil is filtered after it leaves the bearing, sampling after the filter can show what the filter removed, but it won’t show what entered the bearing zone.
-
Avoid sampling dead zones. Stagnant corners, low-flow sumps, and trapped air pockets can skew results. A good point has consistent flow and mixing.
-
Minimize disturbance. Sampling should not require disassembly or create aeration. For example, opening a valve that dumps oil from a high point can pull in air and create misleading oxidation and water readings.
-
Make it repeatable. Use the same port, same procedure, and same pre-flush rules every time. If technicians can’t reliably reach the point, the program will drift.
Sampling Points for Bearings
Bearings typically see oil in one of three ways: splash, circulation, or grease (handled elsewhere). For oil systems, focus on whether the bearing is fed from a common reservoir or from a dedicated loop.
- Circulating oil bearing housings: Use a drain or sample valve on the return line from the bearing housing to the reservoir or filter skid. This captures what left the bearing zone.
- Pressurized bearing feed systems: If the system has a filter, sample either the feed line before the filter (to see incoming contamination and additive depletion) or the return line after the bearing (to see what the bearing generated). Many plants run both, but at minimum choose one location and stick to it.
Easy example: A motor bearing shows rising iron in trending. If you sample only the reservoir, the iron may be diluted by other loads. Sampling the return line from that bearing housing often reveals the true rate of wear and makes the trend line sharper.
Sampling Points for Gearboxes
Gearboxes are usually oil-sump systems with gear-generated heat, water ingress risks, and contamination from seals and breathers. Sampling points should reflect the oil that has been sheared and mixed by gear action.
- Standard sump sampling: A dedicated sample valve near the mid-sump level is preferred over a bottom drain. Bottom drains can collect settled particles and water, exaggerating contamination.
- Return line sampling for kidney loops: If the gearbox has an offline filtration loop, sample the line returning to the gearbox after filtration. This is useful for filter performance and cleanliness trends, but it does not represent the oil entering the gears.
- Before filtration sampling: If you need to diagnose contamination sources, sample the line before the filter element. This helps separate “dirty incoming oil” from “filter removal effectiveness.”
Easy example: A gearbox has frequent filter plugging. Sampling only the post-filter return may look clean until the filter is already saturated. Sampling pre-filter shows the particle load and helps confirm whether the issue is ingression, seal leakage, or poor filtration sizing.
Sampling Points for Hydraulics
Hydraulic systems have high sensitivity to water, air, and particulate contamination. The sampling point should represent the fluid condition that controls valve and pump tribology.
- Reservoir sampling: Use a dedicated reservoir sample valve located where oil is well mixed, not at the extreme top or bottom. Reservoir sampling is convenient, but it can lag behind what the pump and valves experience.
- Return line sampling: Sampling the return line from the system to the reservoir often captures contamination generated by valves and actuators. This is frequently the most informative point for wear metal and particle trends.
- Pressure line sampling: Pressure line sampling can represent the fluid under the most demanding conditions, but it is harder to do safely and can increase risk of aeration if done poorly. Use it when you need a direct view of what the pump is sending into the system.
Easy example: If valve sticking correlates with rising water content, reservoir sampling might show the water later. Return-line sampling can show water ingress sooner because it captures contamination as it returns from the work circuit.
Practical Selection Workflow
- Identify the lubrication path for the asset type.
- Identify contamination and wear generation zones.
- Choose a sampling point that captures fluid leaving that zone.
- Confirm flow consistency and mixing.
- Verify safety and accessibility.
- Define sampling method rules and pre-flush requirements.
Mind Map: Sampling Point Selection Logic
Example Sampling Point Plans
Example: Bearing with circulation and filtration
- Primary point: return line from bearing housing to filter skid.
- Secondary point (optional): feed line before filter.
- Reasoning: primary point shows what the bearing generated; secondary point helps separate incoming contamination from bearing wear.
Example: Gearbox with kidney loop
- Primary point: mid-sump sample valve.
- Secondary point: pre-filter line during troubleshooting.
- Reasoning: mid-sump supports stable trending; pre-filter clarifies whether plugging is driven by ingression or filtration mismatch.
Example: Hydraulic system with reservoir and return filtration
- Primary point: return line to reservoir.
- Secondary point: mixed reservoir valve for cross-checking.
- Reasoning: return line captures contamination generation; reservoir valve confirms overall cleanliness and water distribution.
Sampling Point Documentation Essentials
Once a point is selected, document the exact port location, line orientation, valve identifiers, and the sampling procedure steps that prevent aeration and dilution. If the sampling point is changed, treat it as a new baseline so the trend doesn’t lie to you.
3.3 Sample Handling Chain of Custody and Contamination Prevention
A good oil analysis program is only as reliable as the sample you collect. The chain of custody is the method for proving that the sample you test is the same material you took from the asset, at the time you claim, and that it stayed uncontaminated from start to finish. Contamination prevention is the set of practical controls that stop outside water, dirt, or metal from sneaking into the sample and confusing the results.
Core Principles for Chain of Custody
Start with identity. Every sample needs a unique identifier that links to the asset, sampling location, lubricant type, and collection time. Use a label that can survive handling and storage, and write the identifier on the sample container before you open any valves or remove any caps.
Next is traceability. Record who collected the sample, who prepared it for shipment, and where it was stored. If your workflow includes a courier handoff, note the handoff time and receiving person or receiving station.
Finally, control the environment. Oil samples are sensitive to water pickup and airborne dust. Keep containers closed except when filling, and avoid placing open containers on shop floors, tool benches, or near compressed air outlets.
Contamination Prevention Controls That Actually Matter
Contamination usually enters through three routes: the sampling point, the container, and the handling steps between them.
Sampling point controls: Before sampling, clean the outside of the fitting or dipstick area so debris does not fall into the opening. If you use a drain valve, purge a small amount into a waste container first, then collect the sample. Purging matters because the first oil can be stagnant and mixed with settled water or sludge.
Container controls: Use containers designed for oil sampling with tight seals. Avoid reusing containers, even if they look clean. If you must use a new container, keep it sealed until the moment of filling. For water-sensitive tests, minimize headspace and ensure the cap is fully seated.
Handling controls: Use gloves if your hands could shed lint or moisture. Keep the sample upright, wipe the outside of the container, and store it in a secondary bag or container to prevent leaks from spreading contamination.
Step-by-Step Workflow with Built-In Checks
- Prepare the kit: Bring pre-labeled containers, gloves, wipes, and a waste container for purging. Confirm the sample identifier matches the work order.
- Verify the sampling location: Confirm the asset tag, lubricant type, and whether the sample is from sump, reservoir, or bearing housing.
- Clean the access point: Wipe around the dipstick tube or drain valve inlet. This reduces the chance of external grit entering the sample.
- Purge if required: For drain valves and sumps, purge to remove stagnant oil. For dipsticks, avoid scraping the tube walls.
- Fill and seal immediately: Fill to the recommended level, cap right away, and keep the container upright.
- Record observations: Note abnormal conditions like visible water, unusual odor, or recent maintenance. These notes help interpret results without guessing.
- Package for transport: Use cushioning and secondary containment. Prevent temperature extremes that can increase condensation risk.
- Log custody events: Record collection time, storage location, and transfer time to the lab or testing workflow.
Mind Map: Sample Handling Chain of Custody and Contamination Prevention
Example: Drain Valve Sampling with Purge and Custody Logging
A gearbox has a drain valve at the bottom of the sump. The collector labels a container with Sample ID GBX-0147-2026-03-12-01 before opening the valve. The outside of the valve is wiped clean, then a small amount of oil is drained into a waste container to purge stagnant material. The collector fills the sample container, caps immediately, wipes the outside, and places it into a sealed bag.
In the work order notes, the collector records: asset tag, sampling location, collection time, and that the first purge oil appeared slightly darker than the collected sample. The custody log records the collector name and the time the sample was handed to the internal staging area. The lab receives the sample and logs the receiving time against the same Sample ID.
Example: Dipstick Sampling Without Tube Scraping
A hydraulic reservoir uses a dipstick. The collector wipes the dipstick handle and the area around the tube opening. The dipstick is inserted and withdrawn smoothly without scraping the tube walls. The sample is collected from the dipstick portion specified by the procedure, then transferred into a pre-labeled container that remains sealed until the moment of filling. The collector records whether the oil level was low and whether any visible water was present at the dipstick tip.
This approach prevents two common errors: adding dust from the tube exterior and mixing oil with residue scraped from the tube walls. The custody log still captures identity and timestamps, so if results look unusual, the interpretation can consider the recorded reservoir condition rather than assuming the sample was mishandled.
3.4 Establishing Baselines and Interpreting Trending Data
A baseline is the “normal” behavior of a specific asset under specific conditions. Trending is how you notice when that normal shifts. The trick is to make the baseline meaningful by tying it to operating context, then to interpret trends using rules that separate real change from measurement noise.
Baseline Foundations That Actually Hold Up
Start by choosing what you will trend. For lubrication systems, common candidates include viscosity at operating temperature, oxidation/nitration indicators, water content, particle counts, wear metals, and filter differential pressure. Pick a small set that maps to the failure modes you care about, then keep the list stable so your trend lines are comparable.
Next, define the operating context. A gearbox running at higher load or temperature will naturally show different oil behavior than one running lightly. Record at least: asset type, lubricant grade, system type (circulating, sump, grease), sampling location, and approximate operating temperature or duty class. If you can’t measure temperature directly, use a proxy such as motor load band or production rate band.
Then establish the baseline window. Use a period where the asset is known to be healthy: no recent seal replacement, no major contamination event, no lubricant change, and no abnormal downtime. A practical approach is to collect multiple samples across the window—enough to capture typical variation. If you only have one sample, you don’t have a baseline; you have a snapshot.
Finally, set acceptance ranges. Instead of a single “good” value, use a band derived from the baseline data. For example, viscosity might be expected to drift slightly due to shear or thermal cycling. Your band should reflect that natural drift so you don’t chase every small wiggle.
Interpreting Trends Without Getting Fooled by Noise
Trending works best when you look at direction and rate, not just absolute values. A viscosity that slowly climbs over several samples can indicate water ingress or fuel contamination, even if each individual result still sits within the baseline band. Conversely, a sudden spike in particles after a maintenance event may be real contamination introduced during work.
Use three layers of interpretation:
- Within-band stability: Values remain inside the baseline band with no consistent direction.
- Band crossing: One or more parameters move outside the band.
- Pattern confirmation: Multiple related indicators change together in a way that matches a plausible mechanism.
A simple example: if water content increases and oxidation indicators rise at the same time, the likely story is accelerated degradation due to moisture. If water increases alone, check for sampling handling issues or a one-time ingress event.
Mind Map: Baseline and Trending Logic
Example: Building a Baseline for a Circulating Gearbox
Assume a gearbox with circulating oil and offline filtration. Over a healthy period, you collect five samples at roughly similar duty. Viscosity at 40°C averages 95 cSt with a baseline band of 90–100 cSt. Water averages 150 ppm with a band of 100–250 ppm. Particle count at a defined ISO code averages at a stable level with a band that reflects normal filter performance.
After a month, the next sample shows viscosity at 108 cSt and water at 600 ppm. That’s a band crossing for both. Now check pattern confirmation: if oxidation indicators also rise and wear metals remain low, the likely mechanism is moisture-driven degradation rather than immediate mechanical failure. The maintenance action should focus on identifying the ingress path (breather, cooler leak, seal seepage) and verifying filtration effectiveness, not on replacing bearings immediately.
Example: Trending Grease with Indirect Indicators
Grease systems often lack the same lab richness as oil, but you can still trend. If you sample grease from a consistent location and track properties such as consistency change, contamination level, and any available wear debris indicators, you can build a baseline band for “normal aging.”
Suppose a bearing shows stable grease consistency for several samples, then consistency drops sharply while contamination indicators rise. That combination suggests dilution or ingress rather than simple thermal softening. The practical next step is to inspect seals and verify that relubrication rates and delivery lines are behaving as intended.
Baseline Maintenance Rules That Keep Data Honest
A baseline is not a museum piece. Update it when the lubricant grade changes, when system hardware is modified, or when sampling points are relocated. If the asset undergoes a repair that could change oil behavior, treat the post-repair period as a new baseline window rather than forcing it into the old band.
When you interpret trends, always correlate with operational events. If a sample follows a filter element change, expect particle counts to drop. If it follows a period of heavy startup and shutdown, expect viscosity and oxidation indicators to show more variation. Trends become reliable when they are interpreted with the asset’s story, not just the chart.
3.5 Reporting Formats and Maintenance Work Order Integration
Oil analysis only helps if the results land in the right place, in the right format, at the right time. This section standardizes how you report findings and how you translate them into maintenance work orders that technicians can execute without guesswork.
Reporting Goals and Audience
A good report serves three audiences with different needs:
- Reliability engineer: wants evidence, trends, and clear decision logic.
- Maintenance planner: wants actionable tasks, parts needs, and timing.
- Technician: wants what to check, how to verify, and what “done” looks like.
To keep everyone aligned, each report should separate observations (what the lab measured) from interpretation (what it likely means) and from actions (what to do next).
Standard Report Structure
Use a consistent layout so repeat readings are easy to compare.
- Asset identification: site, asset ID, component type (bearing, gearbox, hydraulic), lubricant grade, and sampling date.
- Sample integrity notes: sampling method, any deviations, and whether the sample was taken at the correct operating state.
- Test results table: viscosity, water, fuel, TAN/TBN where applicable, particle count, ferrous/non-ferrous wear metals, oxidation/nitration indicators, and any special tests.
- Trend summary: show how key metrics moved versus baseline and prior samples.
- Condition statement: one paragraph that ties the measurements to likely mechanisms.
- Risk and urgency: a simple severity level tied to maintenance decision rules.
- Recommended actions: prioritized list with verification steps.
- Work order mapping: which tasks should be created, and which can be handled as routine checks.
Example: One-Page Condition Summary
- Asset: Gearbox G-12, synthetic 75W-90, sampled 2026-03-12.
- Key results: viscosity +10% from baseline, water 0.18%, iron elevated with increasing trend, particle count elevated with a shift toward larger sizes.
- Condition statement: viscosity increase plus rising iron and coarser particles suggests contamination and wear acceleration, likely from ingress or filter bypass.
- Severity: Medium, because water is present and wear metals are trending upward.
- Recommended actions: inspect filtration differential pressure and bypass status; verify oil level and water removal effectiveness; schedule follow-up sampling after corrective actions.
Work Order Integration Logic
Work orders should not be a copy-paste of lab text. They should be structured tasks with clear acceptance criteria.
Task Types
- Immediate containment: actions that stop further damage (e.g., verify filtration, correct oil level, stop contamination source).
- Investigation: checks to confirm the root cause (e.g., inspect breathers, seals, sample point condition).
- Corrective maintenance: replace filters, clean strainers, repair leaks, adjust lubrication settings.
- Verification: confirm the fix worked (e.g., repeat sampling, check differential pressure stability).
Work Order Fields That Matter
- Trigger: link to the specific report section and metric thresholds.
- Scope: component and system boundaries (gearbox only, not the whole train).
- Materials: filters, seals, oil top-up quantities, and any required flushing media.
- Safety and access: lockout steps, isolation requirements, and access constraints.
- Acceptance criteria: measurable “done” conditions (e.g., differential pressure returns to normal range; water drops below target; viscosity stabilizes).
Mind Map: Reporting to Work Orders
Example: Mapping a Report to CMMS Tasks
Assume the report flags: water above target and iron trending upward.
-
Work Order 1: Filtration and Ingress Checks
- Trigger: water 0.18% and rising iron trend.
- Tasks: check differential pressure indicator; inspect filter housing seals; verify breather function; confirm sample point cleanliness.
- Acceptance: differential pressure within normal range; no evidence of bypass; breather unobstructed.
-
Work Order 2: Corrective Maintenance
- Trigger: confirmation from Work Order 1.
- Tasks: replace filters; repair any detected leak path; perform oil top-up or water removal steps per lubricant specification.
- Acceptance: system restored to specified oil level and condition.
-
Work Order 3: Verification Sampling
- Trigger: completion of corrective maintenance.
- Tasks: collect follow-up sample at the same operating state and sampling point.
- Acceptance: water decreases below target and iron trend flattens versus prior sample.
Practical Reporting Rules That Prevent Confusion
- One severity level per asset per report: technicians should not interpret multiple competing priorities.
- Actions must reference a metric: “inspect filtration” is better when tied to particle count shift or differential pressure behavior.
- Verification is part of the task: if you fix something but never confirm it, the work order is incomplete.
- Keep wording consistent across assets: “Medium” should mean the same decision logic everywhere, not a personal interpretation.
4. Interpreting Oil Analysis Results for Root Cause Actions
4.1 Viscosity Shift And Oxidation Indicators For Lubricant Degradation
Viscosity and oxidation are two of the most practical “early warning” signals in oil analysis because they reflect how the lubricant is changing under heat, oxygen exposure, and contamination. Viscosity shift tells you the lubricant’s flow behavior has moved away from what the equipment expects. Oxidation indicators tell you the lubricant chemistry is being consumed and converted into byproducts that can thicken oil, increase acidity, and harm seals and bearings.
Foundations: What Viscosity Shift Really Means
Viscosity is not a single property; it’s a temperature-dependent behavior. Most industrial oils are graded by how they flow at a reference temperature, and the equipment is designed around that flow. When oil thickens, pumps may struggle, filters can load faster, and heat removal can worsen. When oil thins, film thickness can drop, raising the risk of boundary lubrication at the same load.
A viscosity shift can come from:
- Oxidation and polymerization: oxidation products can increase viscosity.
- Fuel dilution: volatile fuel lowers viscosity.
- Soot and fine particles: can increase apparent viscosity and reduce filterability.
- Water and glycol: can change viscosity and promote corrosion.
A key discipline is to interpret viscosity alongside temperature and other tests. A viscosity number without context is like a speed reading without knowing the road.
Oxidation Pathway: From Oxygen to Byproducts
Oxidation is the lubricant’s chemical aging process. Oxygen reacts with base oil and additives, producing compounds such as acids, sludge precursors, and varnish-forming materials. These byproducts often correlate with:
- Viscosity increase from oxidation products and thickening agents.
- Acid number rise from acidic compounds.
- Increased insolubles that can form deposits.
- Changes in filter differential pressure due to sludge and varnish.
Oxidation is usually accelerated by heat, air ingress, and catalytic contamination (for example, metals). That’s why two machines with the same oil grade can show different oxidation rates.
Mind Map: Viscosity Shift and Oxidation Indicators
How to Read Viscosity Shift Systematically
Start with the baseline. If your oil analysis program has a history, compare the current viscosity to the asset’s own trend, not just a generic limit. Then check whether the shift direction matches other evidence.
Example 1: Viscosity Increase With Rising Insolubles
- Observed: kinematic viscosity at 40°C is trending upward.
- Supporting tests: insolubles or filter plugging tendency is increasing; oxidation-related measures are elevated.
- Likely cause: oxidation and deposit-forming byproducts.
- Practical action: verify cooling performance and air ingress points (breather condition, seal leaks, heat exchanger effectiveness). If the system runs hotter than normal, viscosity will follow.
Example 2: Viscosity Decrease With Fuel-Like Clues
- Observed: viscosity is trending downward.
- Supporting tests: presence of light hydrocarbons or dilution indicators; sometimes flash point reduction.
- Likely cause: fuel dilution or excessive leakage from adjacent systems.
- Practical action: inspect seals, check for abnormal operating conditions that allow mixing, and confirm whether the oil is being contaminated during start-up or transients.
Oxidation Indicators: What to Expect in the Data
Oxidation rarely shows up as a single number. It’s more reliable when you treat it as a pattern:
- Acid number rising suggests chemical aging and corrosion potential.
- Insolubles rising suggests sludge precursors and deposit risk.
- Viscosity increase supports thickening from oxidation byproducts.
If acid number rises but viscosity stays stable, the oil may be early in oxidation or the thickening effect may be masked by dilution. If viscosity rises but acid number is flat, thickening could be driven more by contamination than oxidation.
Example: Turning Numbers into a Maintenance Decision
Scenario: A gearbox shows viscosity at 40°C increasing by a noticeable margin over three sampling intervals.
- Supporting evidence: acid number is also increasing; insolubles are rising; water is low.
- Interpretation: oxidation-driven thickening with deposit risk.
- Evidence-based actions:
- Check heat exchanger and oil cooler differential temperature.
- Inspect breather and verify no excessive air exchange.
- Review operating temperature logs for sustained over-temperature.
- Increase sampling frequency until the trend stabilizes.
- Schedule oil change when the combined evidence indicates the lubricant can no longer maintain protection.
Mind Map: Evidence Linking to Root Cause
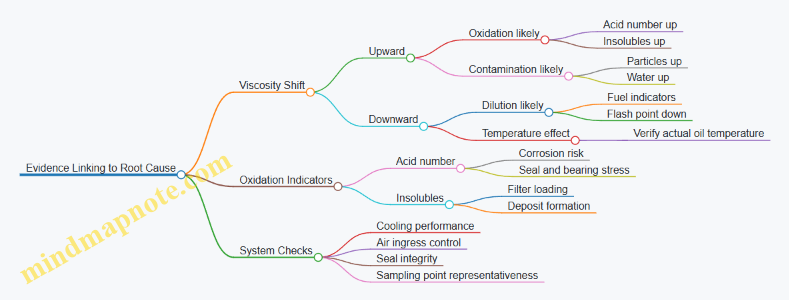
Practical Rules for Avoiding Misreads
- Use direction and trend together: a one-time deviation is less meaningful than a consistent slope.
- Pair viscosity with oxidation and contamination indicators: viscosity alone can be fooled.
- Confirm temperature context: viscosity tests are temperature-referenced, but equipment temperature still affects how fast degradation progresses.
- Treat the oil as part of a system: oxidation is often a symptom of heat and oxygen exposure, not just “old oil.”
When viscosity shift and oxidation indicators move in the same direction, the maintenance decision becomes clearer: focus on the drivers (heat, oxygen ingress, and contamination pathways) and validate with follow-up sampling after corrective actions.
4.2 Wear Metals Patterns and Their Link to Component Health
Wear metals in oil analysis are most useful when you treat them as a pattern, not a single number. The same iron level can mean “normal running” in one asset and “bearing distress” in another, depending on where the metal comes from, how fast it is changing, and what else is happening in the oil.
Foundational Concepts for Interpreting Wear Metals
Wear metals typically enter the oil through three pathways: sliding or rolling contact, corrosion and oxidation byproducts, and additive or seal-related shedding. Oil analysis can’t see the part directly, so you infer the source by combining metal identity with trends and context.
Start with three baseline questions:
- Is the concentration trending up, flat, or down? A rising trend usually indicates an active wear mechanism.
- Is the particle size consistent with the wear type? Large particles often point to mechanical distress; very fine particles can be normal running or corrosive processes.
- Do other indicators agree? For example, rising water and viscosity shift often accompany corrosion-related metal increases.
Mapping Metal Identity to Likely Component Sources
Different components shed different metals because of material selection and coatings. The mapping below is a practical starting point for common industrial equipment.
- Iron (Fe): Often associated with bearings, gears, shafts, and general steel wear. In gearboxes, Fe rising with other gear-related metals suggests gear contact stress.
- Copper (Cu) and Copper Alloys: Common in bronze bushings, thrust bearings, and some bearing shells. If Cu rises while Fe stays modest, the likely source is a copper-containing bearing surface.
- Lead (Pb) and Tin (Sn): Frequently linked to bearing overlays and babbitt-type materials. A Pb/Sn pattern that rises together can indicate overlay wear.
- Aluminum (Al): Can come from pistons, housings, or bearing components. In hydraulic systems, Al can also reflect case wear or casting shedding.
- Silicon (Si): Often indicates dirt ingress or abrasive wear, especially when paired with high particles and increasing Fe.
- Nickel (Ni) and Chromium (Cr): Can be tied to alloy steels and wear-resistant surfaces. When these rise without Fe, consider localized wear in alloyed components.
A useful rule of thumb: the “most likely source” is the one that matches both the metal chemistry and the operating location (bearing vs gear vs hydraulic cylinder) rather than the one with the largest number.
Trend Patterns That Signal Component Health
Wear metal trends become meaningful when you compare them to the asset’s baseline and operating changes.
- Step Change: A sudden increase after a maintenance event often indicates a disturbance (for example, a filter bypass left open, a new component with initial break-in wear, or contamination introduced during service).
- Gradual Climb: A slow rise over multiple sampling intervals often points to progressive wear, misalignment, inadequate lubrication, or filter degradation.
- Cyclic Peaks: Peaks that correlate with load cycles can indicate load-dependent contact stress, such as gear tooth distress under higher torque.
Integrating Wear Metals with Other Oil Indicators
Wear metals rarely act alone. Combine them with:
- Viscosity and oxidation: Rising wear with viscosity increase or oxidation suggests lubricant breakdown and reduced film strength.
- Water and corrosion indicators: If water is elevated and Fe rises with fine particles, corrosion-assisted wear becomes more likely.
- Particle counts and differential pressure: If wear metals rise while filter differential pressure increases, the filter may be losing effectiveness.
- Contamination markers: If Si rises alongside Fe, abrasive contamination is a strong candidate.
Mind Map: Wear Metals to Component Health Reasoning
Example: Bearing Wear vs Contamination
Scenario: A gearbox sample shows Fe rising from 12 ppm to 35 ppm over three intervals. Cu stays near 3 ppm, while Si increases from 8 ppm to 22 ppm. Particle counts also rise, and filter differential pressure trends upward.
Reasoning:
- Fe rising suggests steel contact wear, likely from gears or bearings.
- Si rising with particle counts points to abrasive contamination entering the system.
- The filter pressure trend supports filtration degradation or bypass.
Component health link: The most likely health issue is abrasive wear driven by contamination, not a copper-based bearing failure.
Example: Copper Alloy Bearing Distress
Scenario: A motor bearing housing sample shows Cu rising from 6 ppm to 18 ppm, with Pb and Sn rising modestly together. Fe remains stable, and viscosity is unchanged. Water is low.
Reasoning:
- Cu with Pb/Sn together matches bearing overlay materials.
- Stable Fe suggests gears and steel surfaces are not the primary wear source.
- Low water and stable viscosity reduce the likelihood of corrosion or film breakdown as the main driver.
Component health link: The likely health issue is copper alloy bearing surface wear, consistent with lubrication film instability at that bearing.
Practical Takeaways for Using Wear Metals Patterns
Treat wear metals as a diagnostic chain: identify the likely material source, confirm the trend behavior, and verify with co-indicators. When the chain is consistent, maintenance actions can be targeted—like inspecting the specific bearing location, checking filtration integrity, or reviewing lubrication delivery—rather than chasing a vague “wear” number.
4.3 Particle Size Distribution and Filter Performance Correlation
Particle size distribution (PSD) tells you how big the contamination is, not just how much. Filter performance tells you how effectively the system removes that contamination under real flow and pressure conditions. Correlating the two turns “the oil looks dirty” into “the filter is removing the right sizes—or not.”
Why PSD Matters for Filter Correlation
Filters do not remove particles uniformly. Most filters have a size-dependent capture mechanism: larger particles are trapped more easily, while smaller particles may pass through until they accumulate or until the filter media reaches a different operating state. PSD also helps separate contamination sources. For example, soot-like fine particles often behave differently than sand-sized particles, even if both increase total particle counts.
A practical rule: if PSD shifts toward smaller sizes after filtration, the filter may be passing fine particles while removing coarse ones. If PSD shifts toward larger sizes, the filter may be bypassing or the system may be generating particles downstream (for instance, from wear debris or cavitation).
Building the Baseline PSD Picture
Start with PSD measurements from the same sampling discipline used for the rest of the oil analysis program. Use consistent units and the same measurement method across time. Then define three reference points:
- Inlet PSD to the filter (upstream sample) to represent what the filter sees.
- Outlet PSD (downstream sample) to represent what the filter releases.
- System PSD over time (sump or return line) to see how the whole system evolves.
If you only sample the sump, you can still correlate, but you lose the “filter-specific” view and must infer performance indirectly.
Correlating PSD with Filter Differential Pressure
Differential pressure (ΔP) across the filter is a proxy for how loaded the media is. Correlation works best when you compare PSD changes with ΔP trends:
- Early loading: ΔP rises while outlet PSD may still show strong reduction of larger particles.
- Mid loading: outlet PSD reduction may weaken for certain size bands as the media approaches its effective capacity.
- Near restriction: ΔP may climb quickly; outlet PSD may show breakthrough, especially for the sizes that the media struggles to capture.
A simple example: suppose inlet PSD shows a strong peak at 10–20 µm. After filtration, outlet PSD drops sharply in that band while 2–5 µm remains similar. If ΔP later increases and the 10–20 µm reduction fades, you likely reached a point where the media can no longer capture that band effectively.
Using Size Bands Instead of Single Numbers
PSD reports often include multiple size bins. Correlate filter performance by focusing on bands that match the filter’s intended capture range.
A useful workflow:
- Identify the dominant inlet size band(s).
- Compute a band reduction factor: outlet count in the band divided by inlet count in the band.
- Track that factor against ΔP and service interval.
Band reduction factors that worsen over time indicate declining capture efficiency for that size range.
Mind Map: Particle Size Distribution and Filter Performance Correlation
Example: Inlet and Outlet PSD Comparison
Imagine a gearbox with a return-line filter. Inlet PSD shows high counts in 15–25 µm. Outlet PSD initially shows a strong reduction in that band, while 2–5 µm changes little. Over the next two weeks, ΔP increases steadily. At the end of the interval, outlet PSD in 15–25 µm rises toward inlet levels, while 2–5 µm still changes only slightly.
Interpretation: the filter’s effective capture for the 15–25 µm band is degrading as the media loads. The system is not suddenly “getting dirtier”; rather, the filter is losing its ability to remove the sizes it previously captured.
Example: Detecting Bypass Through PSD Shape
If a bypass valve opens, outlet PSD often resembles inlet PSD more closely across multiple bands, not just the finest fraction. A telltale sign is that the outlet PSD reduction factor worsens abruptly rather than gradually. For instance, if band reduction factors for 10–20 µm and 20–40 µm both collapse near the same ΔP threshold, bypass or a restriction-related flow path is likely.
Practical Correlation Checks That Prevent Misreads
- Sampling location consistency: inlet and outlet must truly be upstream and downstream of the media, not just different points in the sump.
- Flow rate stability: changing flow alters residence time and capture behavior, which can mimic “media aging.”
- Media rating alignment: a filter intended for coarse capture may never reduce fine particles much, even when it is healthy.
When PSD and ΔP agree, you can confidently attribute changes to filter loading. When they disagree, you look for sampling errors, flow changes, or bypass behavior—because filters are picky, and oil analysis is only as good as the measurements behind it.
4.4 Water Ingress Pathways and Corrective Actions
Water in lubricants rarely “arrives by magic.” It enters through predictable pathways, then shows up in oil analysis as rising water content, viscosity changes, and sometimes corrosion-related wear. The goal is to map the pathway, confirm it with evidence, and remove the cause—not just dry the oil and hope.
Water Ingress Pathways
1. Seal and shaft interface leaks Water can migrate past mechanical seals, lip seals, or worn labyrinths when pressure differentials favor ingress. A simple example: a pump runs with a slightly higher suction pressure than the seal chamber pressure during certain operating modes, and water from a wet environment finds the easiest path through the seal.
2. Breathers and reservoir vents Many sumps breathe with temperature changes. When a reservoir cools, it can draw humid air inward. If the breather lacks a desiccant or has a clogged filter, condensation forms inside the housing. Example: a gearbox on a cold morning shows water spikes after start-up, while midday readings stabilize.
3. Inadequate oil level control and wet operating conditions If oil level is too low, components can run near the sump wall where condensation collects. If oil level is too high, it can push oil into areas that are exposed to wash water or condensation. Example: a hydraulic reservoir with frequent overfilling during maintenance ends up with oil contacting a splash zone that stays wet.
4. Cooling system cross-contamination Heat exchangers can fail internally. If a coolant leak occurs, water can enter the oil side through a compromised tube wall or gasket. Example: after a cooling circuit service, oil analysis shows a sudden and persistent water increase paired with a change in conductivity.
5. Condensation from temperature cycling Even without direct leaks, repeated warm-cool cycles create condensation on internal surfaces. This is common in outdoor installations and intermittent duty cycles. Example: a compressor that runs for short shifts accumulates water during off periods when the housing cools.
6. Maintenance and sampling contamination Water can be introduced during oil top-up, filter changes, or sampling if containers are stored in humid areas or if sampling bottles are not sealed properly. Example: two assets sampled on the same day show water increases, but only one has a known seal issue—suggesting sampling handling differences.
Evidence-Based Diagnosis
Start with the pattern: when the water appears, how fast it rises, and whether it correlates with operating modes. Then confirm with at least two signals. For instance, if water content increases while viscosity drops and iron wear rises, suspect corrosion and contamination rather than only condensation.
A practical mind map helps technicians avoid jumping straight to “dry the oil.”
Mind Map: Water Ingress Pathways and Corrective Actions
Corrective Actions That Actually Fix the Cause
A. Correct the pressure and barrier at the seal If seal chamber pressure is lower than the surrounding wet environment, ingress is likely. Adjust barrier pressure, verify gauges, and confirm the seal is installed with correct orientation and runout. Example: after replacing a seal, technicians should check shaft runout and confirm the seal lip is not riding on a damaged sleeve.
B. Restore breather function and stop humid air intake Replace desiccant when saturated, and ensure the vent path is unobstructed. If the breather is missing or incorrectly installed, condensation will keep returning even after oil treatment.
C. Fix reservoir level practices and splash exposure Calibrate sight glasses and enforce a single fill method. If wash-down water reaches the reservoir, add shielding or relocate vents so water cannot be driven inward.
D. Repair cooling cross-contamination before returning to service If a heat exchanger is suspect, isolate the circuits and perform a pressure integrity test. Replace failed tubes or gaskets rather than relying on oil cleanup alone.
E. Remove existing water and prevent recurrence Use offline dehydration or filtration methods appropriate to the lubricant type, then re-test. The key is to treat the oil after the pathway is corrected; otherwise, the same ingress will refill the water content.
Integrated Example Workflow
A gearbox shows water content rising after morning start-up and falling later in the day. First, inspect the breather and verify desiccant condition. Second, check for condensation evidence on the reservoir cap and internal surfaces during a planned stop. Third, verify no cooling cross-contamination exists by checking coolant circuit integrity. After breather restoration and a controlled oil dehydration step, repeat sampling on the next operating cycle. If the pattern changes from “morning spike” to stable readings, the pathway was likely condensation driven by vent performance.
4.5 Contamination Source Identification Using Cross Asset Evidence
Contamination rarely shows up as a single, isolated event. Water, dirt, and wear debris usually travel through shared pathways: maintenance practices, common vendors, similar system designs, or plant-wide air and wash conditions. Cross asset evidence means you compare multiple assets and multiple signals to identify which pathway is most consistent with what you see.
Foundational Logic for Cross Asset Evidence
Start by separating three questions:
- Is contamination real or analytical noise? Confirm the same direction of change across related tests (for example, viscosity trend plus water trend plus particle trend).
- Is it localized or plant-wide? Compare assets that share a pathway (same building, same maintenance crew, same lubricant delivery route, same filter model).
- Is it ingress, internal generation, or both? Use patterns: ingress often spikes water and particles without a matching wear-metal rise; internal generation often shows wear metals and oxidation together.
A practical rule: if two assets show the same contamination signature at the same time window, they likely share a cause. If only one asset shows it, look for asset-specific causes like a seal, a breather, or a damaged suction line.
Building an Evidence Matrix Across Assets
Create a simple evidence matrix for each candidate cause. Use the same sampling interval and test panel across assets so comparisons are meaningful.
- Time alignment: When did the change begin? Compare sample dates and operating hours.
- Contaminant type: Water (free or dissolved), particles (size distribution), and fuel (if applicable).
- System type: Grease, circulating oil, gearbox sump, hydraulic reservoir.
- Shared pathways: Breathers, fill ports, filter housings, kidney loop connections, common storage tanks, common lube techs.
- Operational context: Similar load, speed, and duty cycle reduce false attribution.
Example: If Asset A and Asset B both show a sudden rise in >10 µm particles and water within two sampling intervals, and both use the same breather filter type, breather failure becomes a higher-probability source than a random seal leak.
Mind Map: Cross Asset Evidence Workflow
Using Contamination Signatures to Narrow Causes
Water and particles together often point to ingress. Water alone can indicate condensation or a breather issue. Particles without water can indicate filtration bypass, damaged suction strainers, or poor cleanliness during top-up.
To make this systematic, map each signature to likely mechanisms:
- High particles plus filter bypass indicators: Check differential pressure history and bypass valve behavior. If bypass occurred, debris bypassed filtration.
- Water spike plus unchanged wear metals: Focus on breather, reservoir venting, and fill practices rather than bearing wear.
- Water plus oxidation and viscosity increase: Consider prolonged water exposure leading to additive depletion and oil degradation.
- Fuel contamination plus viscosity shift: Look for tank contamination, shared transfer hoses, or proximity to fuel systems.
Cross Asset Timing and Maintenance Traceability
Cross asset evidence becomes powerful when you connect it to work history. Use a consistent time window, such as the period covering the last two sampling intervals, then check whether any shared maintenance event occurred.
Example: On 2026-03-15, two assets in the same area received oil top-up using the same bulk container. The next samples show higher water and larger particle counts on both assets, while a third asset with a different fill procedure remains stable. The shared bulk container and fill method become the leading source, even if the assets have different bearing types.
Mind Map: Evidence-to-Action Mapping
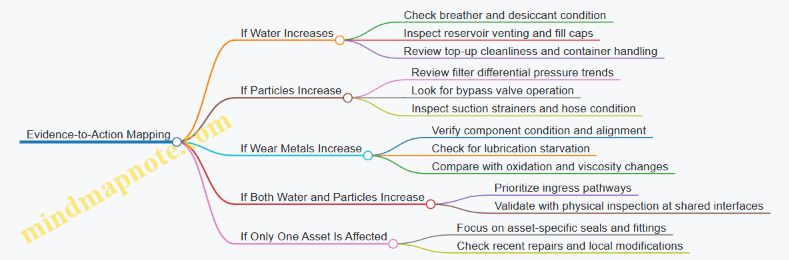
Validation Steps That Prevent Misdiagnosis
Cross asset evidence can point you to a pathway, but you still need physical confirmation. Use a short validation checklist:
- Inspect shared components implicated by the evidence matrix (breathers, filter housings, fill ports).
- Check for bypass behavior using differential pressure records and any bypass indicators.
- Review cleanliness controls: transfer hose caps, container labeling, and whether funnels or pumps were dedicated.
- Confirm with follow-up sampling after corrective action. The goal is not just improvement, but improvement in the expected direction for the expected contaminant.
A good closure looks like this: after replacing breather elements on the affected assets and changing the fill procedure, water and large particle counts drop toward baseline, while wear metals remain stable. That pattern supports the source pathway rather than merely masking the symptom.
Example Synthesis for a Realistic Decision
Suppose three gearbox assets share the same filter model and are serviced by the same team. Oil analysis shows:
- Asset 1: water rises sharply; particles rise; wear metals unchanged.
- Asset 2: water rises sharply; particles rise; wear metals unchanged.
- Asset 3: no water change; particles stable; wear metals stable.
Because Assets 1 and 2 share both the breather configuration and the recent top-up method, while Asset 3 differs in fill procedure, the most consistent source is contamination introduced during top-up or through a shared venting interface. The corrective action should target that pathway first, then verify with the next sample cycle.
5. Reliability Centered Maintenance for Lubrication and Wear Management
5.1 RCM Method Structure for Selecting Maintenance Tasks
Reliability-Centered Maintenance (RCM) starts with a simple question: what must the asset do, what stops it from doing that, and what maintenance actually prevents or detects the stopping condition. The method structure below keeps the logic tight, so you don’t end up maintaining parts that never caused the failures you care about.
Step 1: Define Asset Functions and Performance Standards
RCM begins by stating functions in plain language, not in terms of components. For example, a gearbox function might be “transmit torque to the conveyor at required speed with acceptable efficiency.” Performance standards turn that into measurable acceptance criteria such as vibration limits, temperature limits, or allowable oil contamination levels.
Example: For a circulating oil system, the function is “provide clean, correctly conditioned oil to bearings.” Performance standards could include “oil cleanliness target ISO 4406,” “water below a defined ppm threshold,” and “oil temperature within a band.”
Step 2: Identify Functional Failures
A functional failure is not “bearing wear.” It is “the asset fails to perform the function.” Translate each function into failure statements that describe the observable outcome.
Example: For the oil system function, functional failures include “oil does not maintain cleanliness,” “oil does not maintain viscosity,” and “oil does not reach bearings at required flow.” Each statement points to a different maintenance path.
Step 3: Determine Failure Modes and Effects
Now connect functional failures to failure modes: the mechanisms that cause the functional failure. For lubrication systems, common failure modes include contamination ingress, lubricant oxidation, filtration bypass, seal leakage, pump wear, and starvation due to level or flow issues.
Example: “Oil does not maintain cleanliness” can be caused by “filter element plugging,” “bypass valve stuck open,” or “kidney loop not running.” Each failure mode has different evidence and different maintenance actions.
Step 4: Select the Maintenance Logic for Each Failure Mode
RCM uses a decision logic to choose between preventive tasks, condition monitoring, and run-to-failure where appropriate. The key is to match the task type to how the failure develops.
A practical logic set for lubrication and oil analysis looks like this:
- If a failure has a clear, predictable deterioration pattern and a task can prevent it, choose a preventive task.
- If deterioration is detectable before loss of function, choose condition monitoring with defined triggers.
- If no effective task exists, choose a failure-finding task or accept run-to-failure with risk controls.
Example: If oxidation increases viscosity and reduces additive performance, viscosity trend and oxidation indicators can support condition monitoring. If contamination ingress is intermittent, a failure-finding task might be periodic filter differential pressure checks plus scheduled sampling.
Step 5: Define Task Requirements and Intervals
Every selected task needs three things: method, frequency, and acceptance criteria. Intervals should be justified by how quickly the failure mode evolves and how quickly your evidence changes.
Example: For an automated lubrication system, a task might be “verify metering device output during commissioning and after maintenance,” with a trigger such as “flow rate within tolerance for each outlet.” For oil analysis, a task might be “sample gearbox oil every four weeks,” with triggers like “water exceeds threshold” or “particle count rises above baseline by a defined margin.”
Step 6: Specify Implementation Details and Feedback
RCM doesn’t stop at choosing tasks; it specifies how tasks are executed reliably. Sampling discipline, calibration, and work order integration prevent “paper maintenance” from becoming “surprise maintenance.”
Example: If oil sampling points are poorly labeled, you’ll get inconsistent results and false alarms. A simple fix is to standardize sampling point IDs, use consistent sample containers, and record sample time and operating conditions in the work order.
Step 7: Validate Effectiveness and Close the Loop
Effectiveness means the tasks reduce functional failures or detect them early enough to prevent damage. Validation uses outcomes, not just compliance.
Example: If a gearbox still fails due to contamination despite scheduled sampling, the issue may be sampling location, sampling frequency, filtration performance, or corrective actions not addressing the source. The RCM loop then revisits failure modes and task logic.
Mind Map: RCM Method Structure for Selecting Maintenance Tasks
Example: Applying the Structure to a Bearing Lubrication Failure
A pump station has a function: “maintain bearing lubrication so the pump runs without excessive vibration.” Functional failures include “bearings overheat” and “vibration exceeds limit.” Failure modes might be “grease starvation due to failed metering,” “overgreasing that foams or overheats,” or “contamination introduced during refilling.”
Task selection follows the logic:
- Grease starvation: preventive task with automated lubrication health checks plus condition monitoring triggers based on vibration and temperature.
- Overgreasing: preventive task with verified metering settings and periodic inspection of grease delivery behavior.
- Contamination: condition monitoring using oil or grease contamination indicators plus filtration and refilling procedure controls.
The result is a maintenance plan that targets the mechanisms behind functional failure, with tasks that have defined evidence and clear acceptance criteria.
5.2 Functional Failure Analysis for Lubrication Related Degradation
Functional Failure Analysis (FFA) starts with what the lubrication system must do, then works backward from observed degradation to the specific function that failed. The goal is not to name a component; it is to name the lubrication function that stopped being reliable. That distinction keeps troubleshooting focused and prevents “replace the usual suspect” maintenance.
Step 1: Define Lubrication Functions in Plain Terms
For rotating equipment, lubrication typically provides five core functions:
- Reduce friction by maintaining a stable lubricant film.
- Prevent metal-to-metal contact through film strength and correct viscosity.
- Remove heat by carrying away energy to oil coolers or bearing housings.
- Transport contaminants to filters or settling zones.
- Protect surfaces using additives that resist oxidation, corrosion, and wear.
Example: A gearbox shows rising wear metals and viscosity drop. The lubrication functions most likely affected are film protection and additive performance. That narrows the investigation before anyone touches hardware.
Step 2: Map Degradation Symptoms to Failed Functions
Use a simple mapping mindset: symptoms are evidence; functions are the “why it matters.” Common symptom-to-function links include:
- Viscosity decrease → film thickness reduced → friction and wear protection degraded.
- Viscosity increase → oxidation or soot/water effects → heat removal and film stability degraded.
- High ferrous debris → abnormal wear mechanism → film protection or contamination control degraded.
- Water presence → additive depletion and corrosion risk → surface protection degraded.
- Elevated particles with stable wear → filtration bypass or contamination ingress → contaminant transport degraded.
Example: Oil analysis shows water at low ppm and rising copper. Copper often points to bearing overlay or bushing material. The failed function is surface protection, but the root cause could be seal leakage, condensation, or reservoir breathing.
Step 3: Build a Function-to-Mechanism Chain
Once a function is identified, list plausible mechanisms that break it. Keep the chain tight: function → mechanism → lubrication system element → likely causes.
For film protection, mechanisms include:
- Starvation (not enough oil/grease at the interface)
- Overheating (viscosity too low, film breaks)
- Contamination (particles abrade, water reduces effective film)
- Wrong lubricant (incompatible viscosity grade or grease type)
- Incorrect delivery (pump/level control issues, metering device faults)
Example: A bearing repeatedly shows high wear during start-up. The function is prevent metal-to-metal contact. The mechanism is starvation during transient conditions. The likely element is the delivery control (pump priming, reservoir level, or grease feed timing).
Step 4: Use “What Must Be True” Checks
FFA becomes powerful when each function has measurable truths. For each lubrication function, define what must be true for it to remain healthy.
- Film protection must be true: viscosity within target band, no persistent water, stable particle counts.
- Heat removal must be true: temperature trends stable, cooler performance consistent, no viscosity drift from overheating.
- Contaminant transport must be true: filter differential pressure behavior consistent, no repeated bypass events.
- Surface protection must be true: oxidation indicators not accelerating, corrosion not appearing.
Example: If temperature is stable but oxidation indicators rise, heat removal is probably fine; the failed function is surface protection, likely due to contamination (fuel ingress, water) or additive depletion from extended service.
Step 5: Prioritize by Evidence Strength
Not all functions are equally likely. Rank candidate failed functions using evidence strength from oil analysis, system logs, and operational history.
A practical scoring approach:
- Direct evidence: water detected, viscosity out of range, filter bypass recorded.
- Correlated evidence: wear metals pattern matches a known interface.
- Context evidence: maintenance changes, seal replacements, operating duty shifts.
Example: After a seal replacement, water appears within weeks and wear shifts toward corrosion-related patterns. The failed function is surface protection, and the evidence is direct (water) plus contextual (timing).
Mind Map: Functional Failure Analysis for Lubrication Degradation
Example: Turning a Wear Trend into a Function Decision
A circulating oil system shows increasing particle counts and rising differential pressure. Wear metals remain moderate. The function most clearly failing is transport contaminants because particles are not being removed effectively. The mechanism is likely filter bypass or reduced filtration efficiency. The next checks are not “which bearing is bad,” but “why filtration stopped working”: confirm filter element condition, verify bypass valve behavior, and check for flow restrictions.
Example: Root Cause Without Guessing the Component
A grease-lubricated bearing reports intermittent high vibration. Oil analysis is not available, but grease condition checks show dilution and water contamination. The failed function is surface protection. The mechanism is seal leakage or condensation. The investigation focuses on seal integrity and reservoir breathing conditions, not on replacing the bearing first.
Step 6: Convert Function Findings into Maintenance Actions
FFA outputs should directly drive task selection:
- If film protection fails: verify viscosity grade, delivery rate, and operating temperature control.
- If surface protection fails: address water ingress, additive depletion drivers, and service interval discipline.
- If contaminant transport fails: fix filtration bypass, improve contamination control at fill points, and confirm differential pressure triggers.
Example: When FFA identifies contaminant transport failure, the action plan includes filter inspection and bypass verification plus a contamination control check at sampling and top-up points. That combination prevents the same failure from returning under a different label.
5.3 Task Selection Criteria for On Condition and Time Based Activities
Selecting maintenance tasks is mostly about matching the task to the failure behavior. Lubrication and wear don’t all degrade at the same pace, and they don’t all announce themselves the same way. A good selection process starts with what you can observe, how fast it changes, and what action you can take when you see it.
Foundational Criteria for Choosing Task Types
On-condition tasks are best when the condition signal correlates with the failure mechanism and changes early enough to allow intervention. Time-based tasks are best when the failure mechanism is reasonably predictable and the cost of waiting for a condition signal is higher than the cost of doing the task on schedule.
A practical rule: if you can measure something that moves before the failure becomes irreversible, prefer on-condition. If the measurement is unreliable, too slow to respond, or too expensive to run frequently, time-based tasks often win.
Step 1: Define Failure Mechanisms and Observable Signals
Start by mapping lubrication-related degradation into failure mechanisms such as contamination-driven wear, oxidation and viscosity loss, water ingress, starvation, overgreasing, seal leakage, and filter bypass. For each mechanism, list:
- The observable signal (oil test result, differential pressure, temperature trend, grease delivery evidence, particle count, water content, wear metals).
- The lead time needed to act (how long before the component reaches a damage threshold).
- The action available (change filter, correct contamination source, adjust relubrication rate, repair seal, flush and refill, inspect for damage).
Example: For water ingress, the signal might be rising water content or emulsion indicators. The action might be correcting the ingress path and then verifying dryness and stability with follow-up sampling.
Step 2: Evaluate Signal Quality and Measurement Practicality
Not every measurement is equally useful. Consider:
- Sensitivity: can the test detect meaningful change before damage?
- Specificity: does the signal point to lubrication issues rather than unrelated problems?
- Repeatability: will two samples from the same condition produce similar results?
- Sampling representativeness: does the sampling point reflect the component’s actual environment?
Example: A gearbox sample taken from a drain port that mixes settled debris may show spikes that don’t represent the gear mesh. If the sampling location is inconsistent, on-condition triggers become noisy and time-based intervals may be safer until sampling discipline improves.
Step 3: Set Decision Thresholds and Trigger Logic
On-condition tasks require thresholds that convert measurements into actions. Use three levels:
- Advisory threshold: prompts investigation and verification.
- Action threshold: triggers a defined maintenance task.
- Critical threshold: triggers immediate intervention and inspection.
To keep the logic from turning into guesswork, define the measurement window and the required evidence. For instance, require two consecutive samples above the advisory threshold, or one sample above the action threshold plus a supporting indicator such as rising particle count or increasing differential pressure.
Example: If viscosity drops below the action threshold and oxidation indicators rise at the same time, schedule oil change and inspect for heat-related degradation. If viscosity drops alone, verify sampling accuracy and check for dilution before committing.
Step 4: Choose Time Based Tasks for Coverage and Risk Control
Time-based tasks are not “set and forget.” They provide baseline coverage when signals are delayed or uncertain. Use time-based tasks for:
- Initial commissioning and early-life stabilization.
- Components with limited access to sampling or testing.
- Tasks with strong wear prevention effects even without a condition signal.
Example: Relubrication intervals for bearings may be set initially based on manufacturer guidance and operating conditions, then refined using grease condition checks and bearing temperature trends. The interval is time-based at first, then becomes condition-informed.
Step 5: Combine Both Approaches into a Balanced Task Strategy
The most reliable programs use a hybrid structure: time-based tasks ensure minimum protection, while on-condition tasks refine timing and target interventions.
A common pattern:
- Time-based sampling cadence at a baseline frequency.
- On-condition triggers for targeted actions between scheduled overhauls.
- Time-based inspection of system health items like filter differential pressure indicators, reservoir levels, and lubrication delivery verification.
Example: Kidney loop filtration might run on a schedule, while filter bypass indicators and particle counts determine whether the system needs adjustment or whether the bypass is masking a contamination problem.
Mind Map: Task Selection Criteria
Example: Building a Task Set for a Critical Gearbox
Assume a gearbox with known sensitivity to contamination and heat.
- Time-based tasks: sample oil at a fixed cadence, inspect reservoir level and leaks at set intervals, and verify filter differential pressure indicator function.
- On-condition tasks: if particle count rises with a matching increase in wear metals, schedule filter element change and inspect for source of contamination. If water content increases, correct ingress and repeat sampling after corrective work.
- Decision thresholds: advisory triggers investigation; action triggers maintenance; critical triggers inspection for gear damage.
This approach keeps the program from relying on a single number. It also ensures that when the measurement is ambiguous, the maintenance response stays proportionate and evidence-based.
5.4 Maintenance Effectiveness Verification and Feedback Loops
Maintenance effectiveness for lubrication and oil analysis is not proven by “we did the work.” It’s proven by measurable changes in condition, risk, and repeatability. A good verification loop starts with a clear maintenance target, then checks whether the target moved in the right direction, and finally updates the program so the same mistake does not return wearing a different hat.
Define What “Effective” Means
Begin by translating lubrication goals into observable outcomes. For example:
- Target: Reduce bearing contamination-related wear.
- Evidence: Particle counts trend down and wear metals stabilize after filter and seal fixes.
- Target: Restore lubricant protection.
- Evidence: Viscosity and oxidation indicators return toward baseline after top-up or change-out.
- Target: Stop recurring system faults.
- Evidence: Automated lubrication flow verification passes consistently and alarms drop.
To keep this practical, write each target as a short statement with a metric, a direction, and a time window. If you cannot name the metric, you cannot verify effectiveness.
Choose Verification Methods That Match the Work
Different maintenance actions require different checks. Use a simple mapping between action type and verification evidence:
- Contamination control actions (filter change, bypass correction, water removal)
- Verify with particle trends, differential pressure behavior, and water indicators.
- Lubricant restoration actions (oil change, top-up, grease relubrication)
- Verify with viscosity shift, additive depletion markers, and consistency of operating temperature.
- System hardware actions (seal replacement, line repair, pump/metering adjustment)
- Verify with leak rate observations, automated flow confirmation, and stable oil level.
A useful rule: verify as close as possible to the failure mechanism. If the failure mechanism is contamination ingress, don’t only check that the oil was changed.
Build the Feedback Loop from Data to Decisions
A feedback loop has four steps: measure, interpret, decide, standardize.
- Measure: Use the same sampling points and test methods each time. Consistency beats heroics.
- Interpret: Compare results to baseline and to the maintenance target. Look for “directional success,” not just pass/fail.
- Decide: Choose one of three outcomes:
- Close the action because evidence matches the target.
- Extend the action because evidence improves but not enough.
- Change the root cause because evidence does not move.
- Standardize: Update work instructions, lubrication settings, sampling frequency, and trigger thresholds.
When decisions are documented, the loop becomes a learning system rather than a repeating cycle of “same symptom, new ticket.”
Mind Map of Verification and Feedback
Example Verification Workflow for a Recurring Bearing Wear Issue
Scenario: A gearbox shows rising iron and copper after maintenance, even though oil changes were performed.
- Measure: After the next oil change, sample at the same gearbox drain and compare particle counts and water indicators to baseline.
- Interpret: If wear metals rise while particle counts remain high and water indicators show intermittent spikes, the oil change did not address ingress.
- Decide: Extend the investigation by focusing on seals, breathers, and filter bypass behavior rather than repeating oil changes.
- Standardize: Update the work instruction to include breather inspection, seal condition checks, and a verification step for bypass valve differential pressure.
Verification result: In the following cycle, particle counts drop and wear metals stabilize within the defined time window. The action is closed because evidence matches the target.
Example Verification for Automated Lubrication
Scenario: An automated grease system logs “flow confirmed,” but bearing failures still occur.
- Measure: Verify actual delivery at the bearing location during commissioning and after maintenance. Confirm that line routing and metering device settings match the design.
- Interpret: If flow confirmation is passing at the pump but not at the outlet, the issue is distribution, not pump operation.
- Decide: Change the root cause to line blockage, incorrect nozzle selection, or pressure/viscosity mismatch.
- Standardize: Add an outlet verification step to the acceptance checklist and adjust nozzle selection rules in the lubrication standard.
The loop ends when the checklist changes and the next maintenance event produces evidence consistent with the target.
Keep the Loop Honest with Simple Controls
To prevent “verification theater,” use three controls:
- Single source of truth: One baseline per asset and one set of test methods per program.
- Time-window discipline: Verify within the defined window after maintenance, not months later when the story has changed.
- Action-to-evidence traceability: Every maintenance action should point to the evidence that will confirm it worked.
A loop that can’t be traced is just paperwork with good intentions.
5.5 Documentation Standards for RCM Decisions and Task Logic
RCM documentation should let a different technician understand three things without asking you: what failure you were preventing, why the task was chosen, and how you know the task is still working. If any of those are missing, the paperwork becomes a museum label instead of a maintenance tool.
Core Documentation Artifacts
Start with a single RCM decision record per function and failure mode. Keep it compact, but complete.
- Function statement: What the asset must do, written in operational terms. Example: “Provide stable oil film to gearbox bearings during steady load.”
- Failure mode and functional failure: Describe what goes wrong in terms of loss of function, not symptoms. Example: “Loss of lubrication film strength due to oxidation and viscosity loss.”
- Failure effects and impact: What happens next if nothing is done. Example: “Bearing distress progresses to spalling, causing unplanned shutdown.”
- Task selection logic: The decision path that leads to on-condition, time-based, or redesign. This is where you show reasoning, not just the final choice.
- Task definition: Exactly what to do, how often, and what “pass” looks like. Example: “Sample gearbox oil at the designated port every 4 weeks; test viscosity and water content; trigger work order if viscosity drops beyond the baseline band or water exceeds the defined limit.”
- Evidence and thresholds: The baseline method and the numeric limits used for triggers. Example: “Baseline from first 3 months of stable operation; limits set at mean ± 2 standard deviations for viscosity and at the established water action level.”
- Feedback and closure rules: What to do after the task finds a problem, and how you confirm the fix worked.
A good rule of thumb: if you cannot write the task definition as a checklist, the logic is not yet specific enough.
Task Logic Structure That Stays Consistent
Use a repeatable logic template so every lubrication-related decision reads the same way.
- Trigger: The condition that starts action (test result, inspection finding, or system alarm).
- Decision: What you do when the trigger occurs (investigate, adjust, repair, or replace).
- Verification: How you confirm the action removed the cause and stabilized the condition.
- Reassessment: When you review the task frequency or thresholds (for example, after a confirmed root cause or after a sustained period of stable results).
Example: If oil analysis shows rising water, the trigger is the water limit breach. The decision might be to inspect breathers, seals, and cooler bypass paths. Verification is a follow-up sample showing water returning below limit and stable viscosity trend. Reassessment might include tightening sampling frequency for 2 cycles.
Mind Map: RCM Documentation Flow for Lubrication Decisions
Example: Documenting Oil Analysis Task Logic
Failure mode: “Lubricant oxidation reduces film strength in a circulating system.”
Task selection logic: On-condition monitoring is chosen because oxidation shows measurable changes before catastrophic failure. Time-based replacement is not used as the primary control because operating conditions vary and the system has stable filtration.
Task definition:
- Sampling point: designated return line sample valve.
- Frequency: every 4 weeks.
- Tests: viscosity, oxidation indicator, water content, and particle count.
- Trigger rules: viscosity outside baseline band OR water above action level OR particle count trend increasing for two consecutive cycles.
Verification: After corrective actions (for example, cooler inspection, breathers, or filtration media change), confirm that the next two samples return to stable trends.
Documentation update: If triggers occur due to sampling variability or port contamination, revise the sampling method and re-baseline using corrected data.
Example: Documenting Automated Lubrication Task Logic
Failure mode: “Grease starvation due to metering device malfunction.”
Task selection logic: On-condition monitoring is selected because starvation can be detected through system health signals and periodic verification, while time-based checks alone may miss intermittent faults.
Task definition:
- Trigger: controller reports low flow or pressure deviation beyond tolerance.
- Decision: inspect pump output, check metering device, verify line integrity, and confirm grease delivery at the outlet.
- Verification: record outlet flow confirmation and check that subsequent controller readings return to normal for two cycles.
Work management link: The documentation must map the trigger to a specific work order template so the technician knows what to check first.
Data Quality Rules That Prevent False Decisions
RCM documentation should include simple rules that protect the logic from bad inputs.
- Sampling location rules: Use the same port and orientation each time.
- Handling rules: Seal samples promptly and label clearly.
- Test method rules: Record the method and instrument used so results are comparable.
- Outlier rules: If a sample is compromised (for example, obvious contamination from handling), mark it as invalid and do not trigger actions based on it.
Documentation Standards That Make Audits Boring in a Good Way
A decision record should be traceable from function to failure mode to task to trigger to verification. When someone reviews it, they should be able to point to the exact line that justifies the task frequency and the exact line that defines the action threshold. If you can’t, the logic is not finished.
Finally, keep a change log inside the record. Use entries like “2024-03-12: revised water action level after confirmed breather failure and corrected sampling technique.” That date format is unambiguous and keeps the story straight when multiple people touch the asset.
6. Automated Lubrication System Engineering and Commissioning
6.1 System Architecture for Centralized and Distributed Lubrication
A lubrication system architecture is the blueprint that decides where lubricant is stored, how it is metered, how it reaches each lubrication point, and how the system proves it actually did the job. The architecture also determines what you can troubleshoot quickly when something goes wrong—because “it’s probably fine” is not a maintenance strategy.
Core Architecture Choices
Centralized Lubrication
Centralized systems store lubricant in one or a few bulk reservoirs and distribute it through piping to multiple lubrication points. A typical layout uses a pump or pressure unit, a metering device per circuit, and a network of lines that feed bearings, gears, or other friction points.
When it fits: plants with many similar assets, shared utilities, and technicians who can access a central cabinet more easily than every machine.
Practical example: A packaging line has 40 bearings across 10 conveyors. One central cabinet supplies metered oil to each conveyor gearbox bearing set. When oil delivery drops on Conveyor 7, you can isolate the circuit at the cabinet without climbing into the conveyor frame.
Distributed Lubrication
Distributed systems place lubricant storage and often metering closer to the asset. This can mean per-machine reservoirs, per-skid pump units, or localized grease dispensers that serve only a small set of points.
When it fits: assets with tight layouts, frequent line changes, or environments where long pipe runs increase contamination risk.
Practical example: A mobile hydraulic power unit has 12 grease points. Instead of running long grease lines from a remote cabinet, a compact unit mounts on the skid and feeds the points with short hoses. If a hose is damaged, the fault is localized.
Hybrid Systems
Hybrid architectures combine both ideas: centralized bulk storage with distributed metering modules or localized distribution blocks. This reduces refill frequency while keeping line lengths manageable.
Practical example: A steel mill uses centralized oil tanks for multiple machines, but each machine has its own metering manifold and short delivery lines to bearings. The central tank handles logistics; the machine manifold handles precision.
System Building Blocks
Lubricant Storage and Conditioning
Reservoirs must be sealed enough to limit water and dirt ingress, and they must support stable suction conditions. Conditioning elements can include strainers, breathers with desiccant, and level monitoring.
Easy check: If a reservoir breathes directly to shop air, water can enter during humidity swings. A simple breather with filtration and desiccant often reduces “mystery water” in oil analysis.
Pumping and Pressure Generation
Oil systems typically use gear pumps, vane pumps, or plunger pumps depending on viscosity and required pressure stability. Grease systems often use follower plates, progressive cavity pumps, or cartridge-style units.
Reasoning: Pressure stability matters because metering devices assume a predictable pressure window. If pressure fluctuates, delivery becomes inconsistent even when the pump is “running.”
Metering and Distribution
Metering devices translate system pressure into a controlled lubricant quantity. Common approaches include single-point metering, progressive distributors, and manifold-based metering.
Example: A progressive grease distributor can feed multiple points in sequence. If one outlet clogs, later points may starve. That’s why architecture must include isolation and fault detection, not just hardware.
Delivery Lines and Fittings
Line design affects both reliability and contamination control. Materials, routing, and bend radius influence wear, vibration fatigue, and leak risk. Fittings should be compatible with lubricant chemistry and pressure.
Easy check: If lines run near hot surfaces, grease can thin or oxidize faster, and seals can degrade. Routing away from heat sources reduces both lubricant stress and leak frequency.
Control, Monitoring, and Interlocks
Controls decide when to lubricate and how to respond to faults. Monitoring can include pressure switches, flow indicators, level sensors, and cycle counters. Interlocks prevent lubrication under unsafe conditions, such as when a machine is stopped in a way that could cause pooling or seal damage.
Practical example: If a system uses pressure-based confirmation, a clogged filter can trigger a “low delivery” alarm before bearings run dry. The alarm becomes a maintenance trigger, not a nuisance.
Mind Map: Centralized vs Distributed Lubrication Architecture
Example Architecture Walkthrough
Consider a plant with both oil-lubricated bearings and grease-lubricated couplings.
- Central cabinet holds filtered oil and a grease bulk unit. Each has its own reservoir, breather, and strainer.
- Oil circuits use a pump feeding a manifold. Each machine has a metering block that isolates its bearings from other circuits.
- Grease circuits use progressive distributors per machine skid. Each distributor has a way to isolate and verify delivery at the skid level.
- Monitoring includes pressure confirmation for oil and cycle confirmation for grease, plus alarms for low pressure or abnormal cycle behavior.
- Commissioning verifies flow at each circuit and checks that alarms correlate with real delivery changes, not just electrical signals.
This architecture keeps the “bulk logistics” centralized while preserving the “precision and troubleshooting” benefits of local isolation. It also makes oil analysis and lubrication system health checks easier to connect, because each asset has a clear lubrication boundary.
6.2 Pump Types, Metering Devices, and Control Strategies
A lubrication system is only as good as its ability to deliver the right amount of lubricant to the right place at the right time. Pumps and metering devices handle the “how much,” while control strategies handle the “when” and “how to respond when reality disagrees with the plan.”
Pump Types and Where They Fit
Gear Pumps are common for oil systems because they handle steady flow and tolerate moderate viscosity changes. A practical rule: if your oil stays within a predictable viscosity range, gear pumps usually behave nicely. Example: a gearbox recirculation skid using ISO VG 220 oil can run with consistent delivery as long as temperature swings are controlled.
Vane Pumps offer smoother flow than gear pumps and can be useful where pulsation matters. They can be sensitive to contamination, so filtration discipline still matters. Example: a hydraulic oil lubrication loop with frequent start-stop cycles may benefit from steadier delivery, provided the suction side is well protected.
Progressive Cavity Pumps are typical for grease systems. They meter grease by trapping it in cavities as the rotor turns, which helps deliver consistent amounts even when grease is thick. Example: a centralized grease system feeding multiple bearings can maintain delivery across long lines better than simple displacement approaches.
Diaphragm Pumps can be used for certain oil or dosing applications where precise small volumes are needed. They can be limited by pressure and fluid compatibility. Example: a small dosing unit for make-up oil in a reservoir can use diaphragm pumping to avoid large swings in level.
Metering Devices and Delivery Accuracy
A pump moves lubricant; a metering device decides how much reaches each outlet.
Single-Point Metering uses fixed orifice logic or direct displacement to deliver to one location. It is simple but can be less forgiving when line lengths vary. Example: a short line to a single bearing may work well with a fixed outlet.
Metering Valves provide controlled dosing to multiple points. They often include check features to prevent backflow and can be paired with timers or flow verification. Example: a multi-outlet manifold can dose bearings in a sequence, reducing peak demand on the pump.
Grease Metering Blocks use progressive channels or metering pistons to distribute grease to several outlets. They help keep outlet-to-outlet delivery consistent. Example: a block feeding four bearings can be arranged so each outlet receives the same stroke volume.
Flow Meters and Feedback Orifices add measurement to the system. Even when the control logic is simple, feedback helps catch clogged lines or air ingestion. Example: if a flow meter shows delivery drop during a cycle, the system can flag a blockage before bearings run dry.
Control Strategies for Timing and Response
Control strategies determine cycle timing, sequencing, and what happens when the system deviates from expected behavior.
Time-Based Control runs pumps on a schedule. It is easy to implement but relies on stable operating conditions. Example: a plant might run a grease system every 8 hours during shifts, assuming temperature and load are consistent.
Event-Based Control triggers lubrication based on machine state such as run/stop, speed thresholds, or pressure conditions. Example: start lubrication when a conveyor motor reaches operating speed, not when the operator presses the start button.
Cyclic Sequencing distributes dosing across multiple outlets to avoid overloading the pump and to reduce pressure spikes. Example: instead of dosing all bearings at once, the controller doses bearing groups A, B, C in order.
Feedback-Adjusted Control uses sensor inputs like pressure, level, or flow to correct dosing. Example: if outlet pressure rises above a set limit, the controller can pause and raise an alarm rather than forcing grease through a blockage.
Interlock Logic prevents unsafe operation. Common interlocks include “no lubrication without confirmed pump running,” “no dosing when reservoir level is low,” and “stop dosing if a leak sensor trips.” Example: if a reservoir low-level switch opens, the controller stops cycles and logs the event.
Mind Map: Pump Types, Metering, and Control
Example: Designing a Reliable Oil Dosing Loop
-
Choose a pump that matches viscosity and cleanliness. If the oil is stable and filtration is reliable, a gear pump is a straightforward choice.
-
Select metering that matches distribution needs. For multiple bearings, use metering valves or a manifold with controlled outlets.
-
Pick control logic that matches machine behavior. If the machine runs intermittently, event-based triggering on run state is more accurate than a fixed time schedule.
-
Add response rules. Use pressure or flow feedback to detect blocked lines. If delivery drops below a threshold during a cycle, stop dosing and raise an alarm.
-
Validate with commissioning checks. Confirm pump run status, verify outlet delivery at each cycle, and ensure interlocks behave as intended when reservoir level is simulated low.
When these elements are aligned, the system becomes predictable: pumps provide consistent movement, metering devices translate that movement into correct dosing, and control strategies keep the system safe when conditions change.
6.3 Line Design Hose Tubing and Fitting Selection for Reliability
A lubrication line is a system, not a collection of parts. Reliability depends on how tubing, hose, fittings, valves, and supports behave together under pressure pulses, vibration, temperature swings, and contamination risk. Start with the job the line must do: deliver the right flow to the right point at the right time, without creating new failure modes.
Line Design Foundations for Reliability
First, define the operating envelope. Record maximum working pressure, expected minimum pressure at the farthest outlet, fluid type, ambient temperature, and any heat sources. Then map the line path: length, number of bends, vertical drops, cable trays, and areas exposed to mechanical damage. A line that “fits” physically can still fail if it creates excessive pressure drop or traps air.
Next, compute pressure drop using conservative assumptions. Even if the pump can produce the required pressure at the manifold, the far end may not. Pressure drop rises with longer runs, smaller internal diameters, and roughness from fittings and elbows. A practical rule: treat every fitting as a small restriction and every bend as a potential flow disturbance.
Finally, plan for serviceability. Choose routing and connection styles that allow replacement of a hose section or fitting without dismantling half the machine. Reliability includes the ability to fix things without inventing new workarounds.
Tubing and Hose Selection Criteria
Use tubing when you want dimensional stability and consistent internal diameter. Common choices include rigid metal tubing for high-pressure, high-temperature, and harsh environments. Use polymer tubing when flexibility and corrosion resistance matter, but verify chemical compatibility with the lubricant and any additives.
Use hose when you need movement, vibration tolerance, or easier installation around tight geometry. Hose reliability depends on construction: inner liner material, reinforcement layer, and outer cover. A hose that tolerates pressure but not abrasion will eventually fail where it rubs or gets struck.
Key selection checks:
- Chemical compatibility: confirm the hose liner and seals tolerate the lubricant and any water present.
- Temperature rating: ensure both hose and seals maintain properties across the full ambient range.
- Permeation and swelling: some materials change dimensions or allow slow leakage.
- Minimum bend radius: routing that bends tighter than rated increases internal damage and flow restriction.
Fitting Selection and Connection Reliability
Fittings must match the tubing or hose and the sealing method. The most common reliability issue is a mismatch between connection type and the actual installation conditions.
Use compression fittings for rigid tubing when you can control alignment and torque. Use barbed or push-to-connect fittings only when the hose material and retention design are proven for the application. For threaded connections, use the correct thread standard and sealing approach; over-torquing can deform tubing and create microleaks.
Avoid “seal by hope.” If the system uses O-rings, specify the correct material hardness and cross-section, and ensure the groove and gland dimensions are correct. If the system uses flare or face seals, ensure the mating surfaces are clean and undamaged.
Support, Routing, and Protection
Support spacing prevents sagging and reduces cyclic bending at fittings. Route lines away from sharp edges and pinch points, and protect them where they cross moving components. Use clamps that do not crush tubing; a crushed line can look fine but has a reduced internal diameter and higher pressure drop.
Plan for thermal expansion. Long runs can grow and pull on fittings. Provide gentle loops or expansion allowances so the line moves without stressing connections.
Mind Map: Line Design Inputs to Reliability Outcomes
Example: Choosing Hose Versus Tubing on a Moving Guard
A packaging line includes a guard that moves during maintenance access. The lubrication manifold is fixed, but the outlet point shifts by about 150 mm. Rigid tubing would require frequent disassembly and would stress fittings during movement. A short reinforced hose section is used between the fixed manifold and a moving bracket.
Reliability steps:
- Select hose with a minimum bend radius that matches the installed routing.
- Confirm chemical compatibility with the lubricant and any water exposure.
- Use fittings rated for the hose construction and sealing method.
- Add support clamps so the hose does not rub on the guard frame.
- Verify pressure at the farthest outlet during commissioning to ensure the hose section does not starve the metering point.
Example: Preventing Pressure Drop from “Small” Fittings
A gearbox lubrication loop uses a central pump feeding multiple metering points. The design initially uses the same tubing diameter everywhere, but adds several elbows and tees near the manifold to simplify assembly. During commissioning, one distant metering point delivers less than expected.
The fix is systematic:
- Replace a cluster of tees with a manifold that reduces internal restrictions.
- Reduce unnecessary fittings near the farthest branch.
- Re-check pressure drop calculations using the actual fitting count and equivalent lengths.
The lesson is simple: fittings are not decorative. They are part of the hydraulic budget, and the hydraulic budget is part of reliability.
6.4 Commissioning Procedures Including Flow Verification and Leak Checks
Commissioning turns a lubrication system from “installed” into “reliably delivering the right amount of lubricant to the right places.” The goal is simple: prove flow where it should exist, prove containment where it must not, and document both so maintenance teams can act confidently.
Step 1: Pre-Commissioning Checks
Start with the basics that prevent wasted troubleshooting. Verify lubricant type matches the system specification, including viscosity grade for oil and NLGI grade for grease. Confirm strainers, filters, and relief/bypass components are installed in the correct orientation. Inspect tubing and fittings for damage, loose clamps, and incorrect routing that could trap air or create low points where water collects.
Before energizing pumps, check electrical controls and interlocks. For example, if the system is tied to a machine run signal, confirm the pump start command is actually generated when the machine is running. If the system uses a low-level switch or tank level sensor, verify the sensor wiring and setpoint so the pump does not start dry.
Step 2: System Purging and Air Removal
Air is the enemy of consistent delivery. For centralized oil systems, run the pump at commissioning conditions and observe sight glasses or flow indicators where provided. For grease systems, cycle the metering devices until discharge is uniform at the outlets.
A practical approach is to purge in zones. Start with the shortest branch or the easiest-to-verify outlet, then proceed to longer branches. This reduces the chance that a single blocked line forces you to repeat the entire purge.
Step 3: Flow Verification
Flow verification depends on system type, but the logic is the same: measure delivery at representative points and confirm it matches design intent.
Oil systems:
- Use a calibrated flow meter in the test loop if available, or temporarily install a measurement device at a commissioning port.
- Verify flow at the pump discharge and at the return line if the design includes a return measurement.
- Confirm differential pressure across filters stays within the commissioning range.
Grease systems:
- Verify metering device output by collecting discharged grease into weighed containers for a defined cycle count.
- Compare mass per cycle against the manufacturer’s expected range.
Example: A gearbox with multiple bearing feeds shows uneven discharge during initial cycles. Instead of assuming a bad metering device, verify line length and routing first. A long, elevated run can trap air; cycling the system after re-bleeding the highest point often restores consistent output.
Step 4: Leak Checks and Containment Verification
Leak checks should be systematic, not random. Divide the system into containment zones: tank and suction, pump and discharge, filtration and heat exchanger, distribution lines, and outlets.
Use clean absorbent material or approved inspection wipes at joints and fittings. After running for a short, controlled period, inspect for wetness, residue, or dampness. For oil systems, check around seals, sight glasses, and filter housings. For grease systems, check around outlet fittings and any quick-connect couplings.
Example: A centralized oil system shows a small wet spot near a filter housing. Tightening the housing might stop the leak, but the better commissioning step is to confirm the gasket seating and that the housing was assembled with the correct gasket type and orientation. Wipe-clean the area, run again, and confirm the leak does not return.
Step 5: Functional Verification Under Operating Conditions
Flow and leak checks are not enough if the system behaves differently under real load. Run the system under the machine’s normal operating state used for lubrication delivery. Confirm:
- Pump speed or control signal matches the intended delivery mode.
- Pressure stays stable during steady operation.
- Outlet delivery continues without intermittent starvation.
If the system includes timers, duty cycles, or run-stop logic, verify transitions. For instance, confirm the pump stops when the machine stops if that is the design requirement, and confirm it restarts cleanly without extended air ingestion.
Step 6: Documentation and Acceptance Criteria
Commissioning records should include what was tested, where it was tested, and what “pass” means. Capture:
- Lubricant batch/grade and system fill status.
- Flow verification method, measurement points, cycle counts, and measured values.
- Leak inspection results by zone, including photos if your process uses them.
- Any deviations and corrective actions taken.
Set acceptance criteria before testing. For example, define allowable flow range for oil (based on design and measurement uncertainty) and allowable mass per cycle range for grease metering devices. Define a “no active leak” rule for commissioning; residue that appears only after shutdown should still be investigated if it indicates a seal or fitting issue.
Mind Map: Commissioning Flow Verification and Leak Checks
Example: Commissioning Checklist for a Multi-Outlet Grease System
- Confirm grease grade and fill level.
- Purge by the shortest branch first until discharge is uniform.
- Cycle each metering outlet for a fixed number of cycles and weigh discharge.
- Compare each outlet’s mass per cycle to the defined acceptable range.
- Place inspection wipes at all outlet fittings and couplings.
- Run the machine at normal speed for the lubrication run window.
- Inspect wipes for wetness or residue indicating active leakage.
- Record results by outlet and zone, then correct any out-of-range delivery before acceptance.
6.5 Operational Acceptance Testing and Maintenance Technician Training
Operational acceptance testing confirms the automated lubrication system does what the design says it will do, under real operating conditions. Technician training ensures the system stays correct after commissioning, not just during the first week.
Operational Acceptance Testing Objectives
Acceptance testing should verify five things in order: delivery, control behavior, distribution to the lubrication points, cleanliness and containment, and safe response to faults. A practical way to keep the test focused is to define measurable pass/fail criteria before the first run. For example, “each bearing receives target flow within ±10% for 5 consecutive cycles” is easier to audit than “system seems to work.”
Test Readiness Checklist
Before running the system, confirm the basics are true: correct lubricant type and grade, correct reservoir fill level, correct line routing, and correct electrical and sensor connections. Verify that filters are installed as designed and that any bypass paths are either sealed or intentionally configured. Finally, ensure the lubrication points are accessible for observation, at least during the first acceptance window.
Delivery Verification and Control Behavior
Start with a controlled run at low risk. If the system uses timed cycles, run one full cycle while observing pump start/stop, pressure or flow feedback, and any controller alarms. If the system uses feedback from a running condition signal, confirm the controller logic triggers lubrication only when the asset is in the intended state.
A simple example: a grease central system with progressive metering should show consistent metering device actuation at each outlet. If one outlet lags, the test should identify whether the issue is line restriction, metering device blockage, or a routing error.
Distribution Checks at Lubrication Points
Distribution verification is where many systems pass the pump test but fail the real job. For oil systems, check for stable oil level behavior and confirm that return paths are not blocked. For grease systems, confirm that grease reaches the intended bearing or fitting without excessive purge. Excess purge can be a symptom of misaligned fittings, wrong nozzle adapters, or overpressure.
Use a structured observation method: inspect each lubrication point during the first cycle, then repeat for a second cycle after the system stabilizes. Record what you see in the same order every time so pattern recognition is possible.
Filtration, Contamination Control, and Containment
Acceptance testing should include a contamination and containment sanity check. Confirm that suction strainers are installed, that filter housings are sealed, and that differential pressure indicators behave as expected. For systems with water removal or dehydration features, verify that monitoring points are connected and that alarms are not permanently suppressed.
Containment checks are straightforward: verify no persistent leaks at fittings, no oil carryover into areas that should remain dry, and no grease migration into electrical enclosures.
Fault Simulation and Safe Response
A system that cannot fail safely is not accepted. Simulate common faults in a controlled way: empty reservoir, blocked line indication, sensor signal loss, and pressure/flow out-of-range. Confirm the controller response matches the design intent, such as stopping the pump, raising an alarm, and logging the event.
Example: if the system detects low flow, it should not keep cycling blindly. Instead, it should halt and require technician intervention, because repeated cycling can worsen starvation or force grease into seals.
Maintenance Technician Training Plan
Training should be role-based and tied to the acceptance test evidence. A good sequence is: system overview, normal operation, sampling and inspection routines, troubleshooting, and documentation.
- System overview: technicians learn what each component does—reservoir, pump, metering devices, filters, sensors, controller, and distribution lines—using the actual installed layout.
- Normal operation: technicians practice interpreting controller status screens, understanding what “ready,” “running,” and “alarm” mean, and knowing what actions are required without guessing.
- Inspection routines: technicians learn what to check during rounds, such as line integrity, fitting condition, filter indicator readings, and evidence of overgreasing or undergreasing.
- Troubleshooting: technicians use a decision path that starts with the simplest checks. For instance, if a lubrication point shows no delivery, they verify the outlet connection, then line restriction, then metering device function, then controller command.
- Documentation: technicians learn to record findings in a consistent format so root cause analysis is possible without re-interviewing everyone.
Mind Map: Acceptance Testing and Training Flow
Example Acceptance Test Record Structure
Use a single-page template so results are comparable across assets. Include the system ID, lubricant grade, cycle type, observed delivery at each point, controller status timeline, filter indicator readings, and fault simulations with outcomes.
Example entry: “Cycle 1: pump ran, flow feedback within range, outlet A delivered within target window; outlet B delayed by one cycle; fault simulation: low-flow alarm triggered and pump stopped.” This keeps the story factual and actionable.
Training Verification and Sign-Off
Training should end with demonstration, not just attendance. Require technicians to perform a mock troubleshooting scenario using the installed system layout, interpret the controller response, and complete a documentation entry that matches the acceptance test record format. Sign-off should be tied to competence in the specific system type, such as centralized grease progressive systems versus circulating oil systems.
7. Grease Lubrication Systems and Application Engineering
7.1 Grease Selection for Temperature Load and Speed Requirements
Grease selection starts with a simple question: what temperature and motion will the bearing see, and what failure mode are you trying to prevent? Temperature and speed control how the base oil behaves, how thick the grease film remains, and how quickly the grease ages. Load determines how much film thickness you need under pressure. The goal is to pick a grease that can supply the right oil, at the right rate, without turning the bearing into a slow-motion chemistry experiment.
Temperature Requirements and Grease Aging
Grease temperature is not just the ambient room temperature. It is the bearing metal temperature, which rises with friction, load, and speed. As temperature increases, the base oil tends to thin and separate more easily, and oxidation reactions accelerate. That means a grease that works at 40°C may fail at 80°C even if the bearing is otherwise identical.
A practical approach is to estimate bearing temperature using operating conditions and then apply a safety margin based on duty cycle. For example, a conveyor bearing that runs intermittently may experience short peaks; a continuously loaded fan bearing may reach a steady temperature. Grease selection should match the duty pattern because oil release and oxidation are time-dependent.
Key selection checks:
- Dropping point: ensures the grease does not soften excessively under heat. Use it as a boundary indicator, not as a guarantee of service life.
- Oxidation stability: supports longer life at elevated temperatures.
- Oil separation tendency: helps prevent oil starvation when the grease structure breaks down.
Example: If a gearbox bearing area regularly runs near the upper end of a grease’s temperature capability, choose a grease with stronger oxidation stability and lower oil separation rather than relying on a higher dropping point alone.
Load Requirements and Film Protection
Load affects the required grease film thickness and the ability to withstand contact stress. Under higher loads, the grease must maintain a protective boundary layer and resist wear mechanisms such as scuffing or brinelling.
Grease performance under load is influenced by:
- Thickener type and structure: affects how the grease releases oil and how it resists mechanical breakdown.
- Additive package: extreme pressure and anti-wear chemistry can protect surfaces when the oil film is thin.
- Base oil viscosity: supports elastohydrodynamic film formation at speed.
Example: A high-load slow-speed bearing may benefit more from robust anti-wear and extreme pressure additives than from chasing a very high base oil viscosity, because the oil film may not be thick enough to rely on hydrodynamic separation alone.
Speed Requirements and Oil Supply
Speed controls how quickly the grease is worked and how much oil is supplied to the contact. At higher speeds, grease can be churned, leading to temperature rise, oil separation, and loss of structure. At very low speeds, grease may not distribute oil effectively, increasing the risk of boundary wear.
Selection logic:
- Higher speed: prioritize greases that resist mechanical breakdown and maintain consistent oil release.
- Lower speed: prioritize greases that can supply oil over time without excessive hardening or oxidation.
A useful rule of thumb is to consider both bearing speed and grease churn rate. Two bearings with the same RPM can behave differently if one has higher load, poorer sealing, or more frequent start-stop cycles.
Matching Grease to Operating Envelope
The operating envelope is the combination of temperature, load, and speed. Use it to narrow choices before checking compatibility and system constraints.
Mind Map: Grease Selection Logic
Practical Selection Workflow
- Define the bearing duty: running hours per day, start-stop frequency, and expected peak temperature.
- Estimate bearing temperature: use operating conditions to approximate metal temperature rather than relying on room temperature.
- Set load protection needs: identify whether the application is likely to experience boundary conditions.
- Assess speed and churning risk: higher speed usually means more heat and more mechanical work on the grease.
- Choose base oil and thickener direction: align base oil viscosity and thickener stability with the temperature-speed regime.
- Select additive level: match anti-wear and extreme pressure needs to the load regime.
- Confirm system constraints: NLGI grade, relubrication method, and seal compatibility determine whether the grease can actually reach the contact.
Example: A rolling-element bearing on a packaging line runs at moderate speed but sees frequent stops. The grease must handle boundary periods during downtime and still resist oxidation during repeated warm-up. A grease with stable oxidation performance and reliable oil release during low-motion intervals is a better fit than a grease optimized only for high-speed churning resistance.
Integrated Example: Two Greases, One Bearing
Suppose you have a bearing housing that operates at 70°C average with occasional peaks to 80°C, under medium load, at moderate speed.
- Grease A has a high dropping point but weaker oxidation stability.
- Grease B has strong oxidation stability and good oil separation resistance.
Even if both greases meet the temperature boundary, Grease B is more likely to maintain consistent oil supply over time, reducing the chance of wear during periods when the grease structure has thinned. The selection difference comes from aging behavior, not just from the maximum temperature number.
Quick Checks Before You Commit
- Existing grease compatibility: mixing incompatible thickeners can cause softening or hardening that disrupts oil release.
- NLGI grade fit: too soft can leak; too stiff can starve the contact.
- Relubrication rate realism: the best grease fails if the system cannot deliver it to the bearing.
A good grease choice is the one that survives the actual operating envelope and still reaches the contact reliably. If you can explain why the chosen grease matches temperature, load, and speed in plain terms, you are already doing the hard part.
7.2 Bearing Compatibility and Seal Interaction Considerations
Bearing life is often limited by the boring stuff: the wrong lubricant for the seal, the wrong grease for the bearing, or the right grease delivered at the wrong dose. Compatibility is not a single yes-or-no property; it is the combined behavior of base oil, thickener, additives, and the seal materials under temperature, load, and contamination.
Compatibility Fundamentals for Bearings and Seals
Start with what each part is trying to do. Bearings need a stable lubricant film and controlled friction. Seals need chemical resistance, dimensional stability, and predictable swelling behavior so they keep contact pressure without turning into a soft sponge.
Key compatibility dimensions:
- Thickener and base oil chemistry: Grease thickener type and base oil polarity influence seal swelling and elastomer hardness.
- Additive package: Extreme-pressure and anti-wear additives can change surface chemistry and may accelerate elastomer degradation depending on seal formulation.
- Temperature and pressure: Higher temperature increases diffusion into elastomers and speeds oxidation reactions.
- Water and contaminants: Water can change grease structure and create conditions where seals see both chemical exposure and mechanical abrasion.
A practical rule: if the seal is compatible with the grease, the grease still must be compatible with the bearing’s operating regime. A grease can be seal-friendly yet still starve a bearing at low speed or overheat it at high speed.
Seal Types and What They Need from Lubricants
Different seals “touch” the lubricant differently.
- Contact lip seals rely on a thin lubricant film at the lip. Too little grease leads to dry running; too much can raise churning and temperature.
- Non-contact seals depend more on pressure balance and cleanliness. They can tolerate less lubricant at the interface, but they are less forgiving of contamination that migrates through gaps.
- Mechanical seals in oil systems require stable viscosity and controlled water content to avoid loss of film and seal face damage.
When selecting a grease, check not only the seal material family but also the seal design. A seal with a tight lip geometry may be sensitive to grease consistency and tackiness.
Grease Consistency, Tack, and Delivery Effects
Grease compatibility is partly about chemistry and partly about how the grease behaves when it is pushed through the bearing.
- Consistency (NLGI grade) affects how easily grease migrates to the contact zone. If the grease is too stiff, the bearing may run with insufficient film.
- Tackiness and oil separation affect whether the grease can maintain a film without excessive leakage. Oil separation can be helpful if it supplies base oil to the contact, but excessive separation can starve the bearing and leave the seal area under-lubricated.
- Overgreasing increases churning. That raises temperature, which accelerates oxidation and can soften elastomers.
Example: A conveyor gearbox bearing runs hotter after switching from a softer grease to a stiffer one. The seal still “likes” the grease chemistry, but the bearing sees less base oil at the contact because the grease does not replenish quickly enough. The fix is not just “go back to the old grease”; it is to match grease mobility to the bearing speed and relubrication method.
Seal Interaction Mechanisms to Watch
Compatibility problems usually show up through repeatable mechanisms.
- Elastomer swelling or hardening: Swelling can increase seal lip friction and heat; hardening reduces sealing force.
- Loss of sealing contact: Oil migration away from the lip can thin the film and increase wear.
- Seal lip abrasion: Water and particles can turn the seal lip into a grinding surface.
- Grease channeling: Grease can form preferential paths that bypass the bearing contact zone, leaving the seal area lubricated while the bearing runs short.
Systematic Selection and Verification Workflow
- Identify seal material and design intent: Know whether the seal is contact or non-contact and what it is protecting against.
- Match grease chemistry to seal compatibility: Use the grease formulation family, not just the brand name. Confirm the grease is intended for that seal material family.
- Match grease mobility to bearing duty: Low-speed bearings often need grease that can still supply base oil to the contact zone. High-speed bearings need control of churning and temperature.
- Control water and particle ingress: Even a compatible grease cannot prevent abrasion if water and particles reach the seal lip.
- Verify with operational evidence: Monitor bearing temperature trends, seal leakage patterns, and grease appearance changes after commissioning.
Example: Diagnosing a Seal-Related Lubrication Issue
A packaging line bearing shows early seal leakage after a lubricant change. The grease is reported as compatible with the seal material family, yet leakage increases.
A structured check finds two contributing factors:
- The new grease has higher oil separation under the plant’s temperature range, thinning the film at the lip and increasing leakage.
- The relubrication interval stayed the same, so the bearing churning increased and warmed the elastomer, reducing sealing force.
The corrective actions are targeted: adjust relubrication rate to reduce churning, and select a grease with oil separation behavior aligned to the operating temperature. The seal stops leaking because it regains stable lip contact and film thickness.
Summary of What “Compatible” Means in Practice
Compatibility is achieved when the grease can supply the bearing contact zone while the seal maintains stable geometry and film at the lip under real duty conditions. Chemistry, consistency, and contamination control all matter, and the best outcomes come from matching the lubricant’s behavior to the seal’s mechanical needs.
7.3 Relubrication Interval Determination Using Condition Evidence
Relubrication intervals should be treated like a control system: you start with a baseline, then adjust it using evidence from the asset. The goal is not to “lubricate more,” but to keep the right lubricant film or grease structure in place while avoiding overgreasing, dilution, and contamination.
Foundational Logic for Interval Setting
Begin with three facts that rarely change: (1) lubrication is consumed or displaced by operation, (2) contamination enters through seals, breathers, or maintenance activity, and (3) seals and clearances determine how much lubricant can safely remain. From those facts, you can define an interval as a time window where performance stays inside acceptable limits.
A practical baseline comes from manufacturer guidance plus site conditions. For example, a conveyor bearing in a dusty packaging line may need more frequent grease replenishment than the same bearing in a clean warehouse, even if the speed and load are identical.
Condition Evidence Inputs
Use condition evidence to decide whether to keep the interval, shorten it, or extend it. The most useful signals are those that connect directly to lubrication function.
-
Grease condition and delivery evidence
- What to look for: grease appearance at purge points, evidence of starvation (dryness, heat), and signs of overgreasing (excess purge, seal extrusion).
- Example: If a bearing housing shows frequent seal leakage and the grease outlet is always overflowing, the interval is likely too short or the pump settings are too aggressive.
-
Bearing temperature and friction indicators
- What to look for: stable operating temperature trends, temperature spikes after relubrication, and abnormal gradients between similar assets.
- Example: If temperature rises steadily over weeks and drops sharply right after relubrication, the grease supply is probably being exhausted faster than expected.
-
Contamination indicators
- What to look for: water ingress signs, filter differential pressure trends for oil systems, and particle trends from oil analysis where applicable.
- Example: If grease becomes gritty or discolored after rain events, the interval should be shortened only if the contamination is reaching the bearing faster than the grease can tolerate.
-
Wear evidence from oil analysis or debris monitoring
- What to look for: increasing wear metals or abnormal particle counts that correlate with lubrication changes.
- Example: If wear metals rise after extending the interval, the extension was too far; return to the last interval where wear stayed flat.
Mind Map: Evidence to Interval Decision
Systematic Decision Method
Use a structured loop so interval changes are explainable.
-
Start with a baseline interval Choose an initial interval that matches the manufacturer recommendation and your typical operating conditions. Record the baseline along with the assumptions, such as ambient temperature range and typical duty cycle.
-
Define acceptance limits Set simple limits for what “good” looks like. For grease systems, acceptance can include stable temperature trends and no persistent seal leakage. For oil systems, acceptance can include stable viscosity and low contamination indicators.
-
Collect evidence over a full cycle Monitor at least one complete interval window before changing anything. If you change the interval mid-window, you lose the ability to attribute effects.
-
Apply a decision rule
- Shorten the interval when you see starvation signs, rising temperature trends that correlate with time since last lubrication, or contamination evidence that is clearly worsening.
- Keep the interval when temperature and grease delivery behavior remain stable and wear indicators do not drift.
- Extend the interval only when evidence stays within limits and you can show that grease is not being depleted prematurely.
-
Verify after the change After adjusting the interval, observe the next cycle. If the asset returns to the same stable behavior, the change was appropriate. If not, revert and refine the rule.
Concrete Examples That Tie Evidence to Action
Example: Grease Purge and Seal Leakage A pump bearing shows constant grease extrusion from the seal area. Temperature is slightly elevated and the housing smells “burnt” after long runs. The purge behavior suggests overgreasing, which can increase churning and heat. Reduce the relubrication frequency or the delivered quantity, then verify that temperature stabilizes and seal leakage decreases.
Example: Temperature Trend Between Lubrications A fan bearing has a temperature sensor. Over three intervals, temperature rises gradually and peaks just before the scheduled relubrication. After relubrication, temperature drops and then repeats the pattern. Shorten the interval or increase delivered grease amount in a controlled way, and confirm the temperature gradient flattens.
Example: Contamination Spike After Maintenance After a filter change on an oil system, particle counts drop, but later they rise again and correlate with a longer relubrication interval. In this case, the interval may be too long for the contamination control strategy. Shorten the interval only if wear indicators also begin to drift.
Mind Map: Evidence-Based Interval Loop

Practical Guardrails
Avoid changing multiple variables at once. If you adjust interval and grease type simultaneously, you cannot tell which change fixed the issue. Also, treat “no evidence of failure” as different from “evidence of success.” Stable temperature and clean purge behavior are evidence; silence is not.
Finally, document the interval decision with the specific evidence that drove it. When technicians can point to the observed trend, the interval becomes a controlled parameter rather than a guess.
7.4 Grease Delivery Control and Avoiding Overgreasing Failures
Grease delivery control is the practical art of putting the right amount of lubricant into the right place, at the right time, and then stopping before the system turns into a mess. Overgreasing is not just wasteful; it can push grease past seals, contaminate bearings, and create heat and pressure that shorten component life.
Core Idea of Delivery Control
A lubrication system delivers grease through a metering path. Control means matching delivery rate to bearing demand while respecting seal capacity and purge behavior. If delivery exceeds what can be retained and displaced safely, grease pressure rises, seals run hotter, and contaminants can be carried inward.
A simple way to think about it: the bearing is the “consumer,” the seal is the “gate,” and the grease line is the “plumbing.” Your job is to keep the consumer fed without forcing the gate to leak.
Demand and Capacity
Demand depends on load, speed, temperature, contamination level, and bearing type. Capacity depends on seal design, housing geometry, and how much grease can be expelled without backing up into the bearing.
Example: A slow-turning fan bearing in a dusty environment may need more frequent replenishment than a clean, steady-duty conveyor bearing. But if the fan bearing uses a tight labyrinth seal with limited purge space, the same frequency can overpressurize the housing. The fix is not “less grease everywhere,” but “less grease for that seal and housing combination.”
Metering Devices and Control Logic
Grease metering devices translate a command into a measured dose. Common approaches include fixed-volume injectors, timed pump cycles, and pressure-regulated delivery.
Best practice is to treat the metering device as a measurement instrument, not a black box. Verify output by collecting grease from a test port during commissioning and confirming dose consistency across multiple cycles.
Example: If a central system is set to deliver 10 strokes per cycle, but the pump stroke volume changes with temperature or viscosity, the actual dose can drift. A short verification routine during commissioning and after major maintenance prevents “set-and-forget” dosing errors.
Line Design That Prevents Delivery Surprises
Grease lines should minimize trapped air, avoid sharp restrictions, and keep flow paths predictable. Long runs and uneven routing can cause delayed delivery, where a later cycle pushes grease that was supposed to arrive earlier.
Example: Two bearings share a manifold. Bearing A is closer to the pump and receives grease first. If the manifold has a restriction near Bearing B, grease can accumulate upstream, then suddenly surge when pressure rises. The result looks like “overgreasing” at Bearing B even though the system is configured correctly. The remedy is balancing line lengths, using appropriate fittings, and validating flow distribution.
Seal Behavior and Purge Management
Seals and purge paths determine whether excess grease exits the housing safely. Overgreasing often shows up as grease expelled from seals, grease migration into areas that should stay clean, and elevated bearing temperature.
A practical control method is to define acceptable purge behavior. For example, a small amount of grease appearing at a seal weep hole during scheduled replenishment can be normal. Continuous heavy discharge, grease swelling in the housing, or oil dilution from seal leakage is not.
Example: A gearbox with lip seals may tolerate brief purge during relubrication. If the system is configured to run too long, grease can accumulate in the housing cavity, increasing churning and heat. The bearing then runs hotter even though it has “more lubrication.”
Overgreasing Failure Modes
Overgreasing can cause:
- Seal extrusion and leakage: grease pressure forces seals outward or past the intended barrier.
- Bearing overheating: churning increases friction and temperature.
- Contamination mixing: expelled grease can carry dust back into the seal area.
- Reduced film stability: excessive grease can trap contaminants and disrupt the intended lubricant film behavior.
Example: A bearing that normally shows mild warmth may begin to run noticeably hotter after a relubrication interval change. If you also observe grease buildup around the seal, the temperature rise is often mechanical churning and seal stress, not “insufficient lubrication.”
Control by Measurement and Feedback
Good control uses feedback from both the system and the asset.
- Dose verification: confirm delivered volume or injector output at commissioning and after component replacement.
- Cycle verification: confirm pump cycle timing and that the controller triggers the expected number of cycles.
- Asset observation: track seal purge behavior and bearing temperature trends.
- Oil and grease condition checks: use oil analysis where applicable, and grease inspection when the system design supports it.
Example: If a bearing temperature trend rises after increasing relubrication frequency, reduce frequency first and keep dose per cycle constant. Changing both at once makes it hard to identify whether the issue is dose, timing, or line distribution.
Mind Map: Grease Delivery Control and Overgreasing Prevention
Example: Correcting an Overgreasing Complaint
A maintenance team reports grease “everywhere” around a bearing housing after a relubrication program update. The system was configured to increase frequency to address earlier wear.
Step 1: Confirm delivered dose per cycle at a test point. If dose is correct, proceed.
Step 2: Check purge behavior. If grease discharge is continuous rather than brief during cycles, the housing is retaining too much.
Step 3: Reduce frequency while keeping dose per cycle unchanged. Observe seal discharge and bearing temperature over several cycles.
Step 4: If discharge remains excessive, inspect line distribution for manifold restrictions or blocked injectors that can cause uneven delivery.
Step 5: Document the final settings with the observed purge pattern so future adjustments start from a known baseline.
This approach avoids the common trap of “fixing” overgreasing by cutting grease blindly, which can swing the system from one failure mode to another.
7.5 Case Study: Workflow for Grease System Troubleshooting
A packaging line uses an automated grease system to lubricate bearings on a conveyor drive. After a scheduled shutdown, operators notice rising bearing temperatures on one side of the line. The grease system logs show normal pump cycles, but the bearings are not behaving like they should. The goal is to find whether the issue is supply, delivery, application, or contamination—without guessing.
Step 1: Confirm the Symptom and Scope
Start by verifying the temperature trend with a second measurement method. If the system uses infrared readings, cross-check with a contact probe on the same bearing housing. Then check whether the problem is limited to one bearing, one manifold, or the whole bank. In this case, only bearings fed by Manifold B show elevated temperatures.
Next, confirm the grease system’s operating history for Manifold B during the last run. Look for missed cycles, alarm states, or pressure faults. The log shows cycles occurred, but there were two short “pressure low” flags on the Manifold B pump during the last hour.
Step 2: Establish a Grease Delivery Reality Check
Grease delivery problems can hide behind “pump ran” signals. Perform a controlled inspection at the lowest practical point in the distribution.
- Wipe and inspect the outlet fittings feeding the suspect bearings.
- Trigger a manual grease cycle for Manifold B.
- Observe whether grease appears at each bearing outlet.
In the case, grease appears at the first two outlets after the manifold, but not at the third. That narrows the fault to the branch line, the metering device on that branch, or a blockage downstream.
Step 3: Use a Branch-by-Branch Elimination Method
Remove the branch line at a safe disconnect point and check for grease presence. If the line is empty, the blockage is upstream of the disconnect. If grease is present but not reaching the bearing, the blockage is downstream or the metering device is not functioning.
Here, the branch line to Bearing C contains grease up to the metering device inlet, but no grease exits the bearing connection. That points to the metering device, a check valve stuck closed, or a blockage at the bearing interface.
Step 4: Inspect Metering and Check Valve Behavior
Disassemble only the smallest component set needed to test function.
- Check for hardened grease or contamination at the metering outlet.
- Verify the check valve moves freely and is installed in the correct orientation.
- Confirm the metering device type matches the grease grade and NLGI consistency.
In this case, the metering device shows partial blockage from a small plug of oxidized grease. The plug likely formed because the system sat idle during the shutdown and the grease warmed unevenly, allowing thickened grease to settle in the metering path.
Step 5: Validate Grease Compatibility and System Conditions
Before replacing parts, confirm the grease selection and operating conditions.
- Compare the installed grease grade and base oil type to the system specification.
- Check whether the ambient temperature during shutdown was low enough to increase viscosity.
- Review any filter or strainer elements that could have trapped thickened grease.
The grease grade matches the spec, but the shutdown procedure left the system unheated. During the cold period, the grease likely thickened enough to form a plug at the metering device.
Step 6: Correct the Root Cause and Restore Function
The fix is not just “replace the metering device.”
- Replace the blocked metering device and inspect the adjacent devices for early signs of restriction.
- Flush the branch line using the approved method for the system and grease type.
- Add a procedural control: ensure the system reaches a minimum temperature before resuming automated cycles after long idle periods.
- Confirm the check valve orientation and torque on fittings.
After commissioning, run a manual cycle and confirm grease appearance at all outlets. Then monitor bearing temperatures for the next operating window.
Step 7: Close the Loop with Evidence
Document what changed and what improved.
- Record the specific component found restricted.
- Attach photos or notes from the inspection points.
- Update the lubrication work order with the corrected procedure for post-shutdown start-up.
In this case, Manifold B temperatures returned to baseline within one shift, and the “pressure low” flags stopped.
Mind Map: Grease System Troubleshooting Workflow
Example: Quick Decision Checklist for the Next Similar Fault
- If pump cycles occur but grease is missing at one bearing, treat it as a branch delivery fault.
- If grease reaches the metering inlet but not the bearing outlet, focus on metering restriction or check valve behavior.
- If the system was idle during a cold shutdown, treat thickened grease as a likely contributor and verify start-up conditions.
This workflow keeps the investigation grounded: you measure, narrow, inspect the smallest likely component set, and then confirm the fix with both delivery evidence and bearing response.
8. Oil Lubrication Systems for Bearings and Gearboxes
8.1 Circulating Oil Systems and Filtration Layout Design
A circulating oil system keeps lubricant moving so it can do its job: carry heat away, maintain film strength, and deliver clean oil to bearings and gears. The filtration layout is not an accessory; it is part of the oil’s “delivery route,” and poor layout is a common reason good oil still fails.
Core Layout Logic
Start with the flow path. Oil leaves the reservoir, is conditioned, passes through the protected equipment, and returns to the reservoir. The filtration layout sits on the conditioning side of the loop so contaminants are removed before they reach the most sensitive surfaces.
A practical rule: design for stable flow first, then design for particle removal. Stable flow means the pump can maintain the required rate across operating conditions, and the filter can handle that rate without excessive restriction.
System Components and Their Roles
- Reservoir and Sump Geometry: The reservoir should provide enough volume for thermal buffering and safe pump suction. Baffles reduce vortexing so the pump does not ingest air.
- Pump and Suction Conditions: Choose a pump that can sustain flow at minimum viscosity. Suction piping should be short, with gentle bends, and sized to avoid cavitation.
- Heat Management: If heat exchangers are used, place them where they won’t starve the filter. A common approach is reservoir → pump → heat exchanger → filter → equipment → return.
- Filtration Stage(s): Use one or more stages depending on cleanliness targets and risk tolerance. A coarse stage can protect downstream elements; a fine stage supports wear control.
- Return and Settling: Return oil should enter the reservoir in a way that reduces re-entrainment of settled particles.
Filtration Layout Design Steps
Step 1: Define the Cleanliness Target
Targets come from equipment sensitivity and failure consequences. For example, a gearbox with rolling element bearings typically needs tighter control than a large slow-speed journal bearing. If you already have oil analysis baselines, use them to set a realistic target for particle and water control.
Step 2: Choose Filter Type and Arrangement
- Full-Flow Filtration: All oil passes through the filter element. This is straightforward for controlling contamination but requires careful sizing to avoid restriction.
- Bypass Filtration: Only a portion passes through the filter. This reduces pressure drop and element loading, but it relies on circulation time to achieve cleanliness.
- Two-Stage Strategy: A common integrated approach is a coarse stage for protection plus a fine stage for control.
Step 3: Size for Differential Pressure and Viscosity
Filters load over time, so differential pressure rises. Design so the filter can reach the maintenance trigger without starving the equipment. Viscosity affects pressure drop, so confirm sizing at cold start conditions.
Step 4: Place Valves and Instrumentation Where They Matter
Include differential pressure indicators across the filter element. Add isolation valves so you can service filters without draining the whole system. If bypass is used, ensure bypass flow is monitored or at least bounded by design.
Example Layout for a Typical Gearbox Loop
Assume a gearbox circulating oil system with heat exchanger and filtration.
- Reservoir with baffles and level control
- Pump sized for minimum viscosity at operating temperature
- Heat exchanger to maintain oil temperature
- Full-flow fine filter for wear control
- Differential pressure indicator with a maintenance trigger
- Return piping that discharges below the oil surface to reduce aeration
If differential pressure rises faster than expected, check for incorrect element rating, excessive cold-start restriction, or upstream contamination bypassing the intended path.
Mind Map: Circulating Oil and Filtration Layout
Common Layout Mistakes and What to Fix
- Filter placed after the equipment: This removes contaminants too late; wear surfaces already received the particles.
- Oversized filter without pressure-drop awareness: Large elements can still fail if the system bypasses them unintentionally or if maintenance triggers are ignored.
- Return piping that aerates oil: Air increases oxidation and can disrupt film formation.
- No differential pressure monitoring: Without it, “clean oil” becomes a guess instead of a measured condition.
Integrated Design Check
Before finalizing drawings, verify the loop can meet three conditions simultaneously: required flow to the equipment, acceptable pressure drop across filters at operating and cold-start viscosity, and a return design that does not undo filtration by reintroducing particles or air. When these three are aligned, the filtration layout becomes predictable rather than reactive.
8.2 Sump Design and Oil Level Control for Stable Operation
A sump is more than a container: it is the “buffer” that keeps oil available to pumps, prevents air ingestion, and stabilizes temperature and contamination behavior. Stable operation starts with the geometry and ends with how you control oil level under real conditions like thermal expansion, leakage, and filter loading.
Sump Geometry Fundamentals
Begin with the oil volume you need at the lowest operating level and the highest demand moment. For circulating systems, the pump must stay submerged enough to avoid vortexing and cavitation. A practical rule is to size the sump so the pump inlet remains covered during worst-case conditions, including shutdown coastdown if the system has a drain-back feature.
Next, design for calm flow. Baffles reduce short-circuiting from inlet to outlet and help keep debris away from the pump pickup. Place the inlet so it discharges below the oil surface and away from the pickup. If you must use a top inlet, add a diffuser plate to slow the jet and reduce foaming.
Finally, plan for service. Provide access for inspection, cleaning, and filter changes without forcing technicians to work around hot surfaces or awkward drains. A sump that is hard to clean becomes a sump that quietly accumulates sludge.
Oil Level Control Objectives
Oil level control exists to keep three things true at the same time:
- The pump pickup stays submerged.
- The system avoids excessive oil that increases churning losses and aeration.
- The level remains consistent enough that oil analysis sampling reflects the same fluid condition.
Thermal expansion changes level even when nothing else happens. If the sump is small, a few degrees of temperature change can move the level enough to expose the pickup during transient operation.
Level Control Methods
Use the simplest method that meets your stability needs.
Fixed Level With Sight Indicators works when leakage is minimal and the system is tolerant to small level drift. Add a sight glass or level gauge with clear markings and a defined “operating band.” Tie maintenance actions to leaving the band rather than to a vague “it looks low.”
Makeup Oil With Float or Electronic Level Control suits systems with predictable consumption or where level must be held tightly. A float valve can be reliable, but it needs clean actuation and a stable supply pressure. Electronic level control can reduce overshoot, provided the sensor is protected from splashing and the logic includes time delays to ignore short transients.
Return-to-Sump and Drain-Back Design matters when oil flows back after shutdown. If the system drains quickly, the sump must still keep the pump inlet covered during the critical window. If it drains slowly, you may trap air or heat in the sump. Choose the drain-back behavior intentionally, not by accident.
Preventing Air Ingestion and Foaming
Air ingestion often shows up as noisy pump operation, erratic pressure, and rising dissolved air in oil analysis. Control it with:
- Pickup location: keep the pickup away from the surface and from areas where bubbles collect.
- Vortex suppression: use a suction bell, anti-vortex plate, or pickup shroud.
- Inlet energy reduction: diffuse incoming flow and avoid splashing.
- Venting: ensure the sump can release trapped air without pulling it into the pump.
A quick example: if a gearbox return line discharges directly into the sump, the jet can create a rotating air-water mixture. After adding a diffuser and moving the discharge away from the pickup, the pump inlet stays submerged and pressure fluctuations drop.
Sump Sizing and Operating Band Example
Assume a circulating system where the pump requires a minimum submergence height of 50 mm at the pickup. The sump has a normal operating level at 200 mm above the pickup reference. Thermal expansion and consumption reduce level by 30 mm at the end of the maintenance interval. That leaves 170 mm above the pickup reference, which is comfortably above the 50 mm minimum.
Now consider a smaller sump where the normal operating level is only 90 mm above the pickup reference. With the same 30 mm reduction, the remaining margin is 60 mm. If the system also experiences a short transient where oil level drops another 15 mm due to drain-back, the pickup could partially uncover. The fix is either larger sump volume, better drain-back control, or tighter level control.
Advanced Details That Actually Matter
Baffle Placement and Maintenance: baffles should not trap sludge in dead zones. Provide drain paths and ensure baffles can be inspected.
Drain and Sampling Ports: locate drains at the lowest sump point and sampling ports where oil is representative and not stirred by return flow. Sampling from a turbulent zone gives misleading “fresh” readings.
Filter and Heat Exchanger Effects: as filters load, pressure drop changes flow distribution and can alter return patterns. If return flow changes, the sump inlet behavior changes too, which can affect foaming and level stability.
Mind Map: Sump Design and Oil Level Control
Case-Style Example: Stabilizing a Noisy Pump
A system shows pressure oscillations after warm-up. Inspection finds the return line discharging near the pickup, creating a vortex at the suction bell. The sump is modified by adding a diffuser plate under the return, relocating the pickup slightly away from the discharge zone, and installing a vortex suppression plate. After changes, pump pressure stabilizes and oil analysis shows reduced aeration-related variability, while level control remains within the defined operating band.
Practical Checklist for Stable Sump Operation
- Confirm minimum pickup submergence under worst-case level and transient conditions.
- Ensure inlet flow is diffused and submerged to prevent splashing.
- Use baffles to reduce short-circuiting and protect the pickup zone.
- Define an operating band and tie actions to leaving it.
- Validate that sampling ports represent the bulk oil, not the return turbulence.
- Verify that filter loading does not unintentionally change return patterns and sump behavior.
8.3 Gear Oil Cooling Strategies and Heat Exchanger Selection
Gearboxes turn mechanical energy into heat through sliding, rolling, and churning losses. If the oil temperature rises, viscosity drops, film thickness shrinks, and wear accelerates. Cooling is not just about keeping oil “cool”; it’s about keeping the oil in the viscosity range that your gear design expects, while also avoiding side effects like thermal shock, excessive pressure drop, or poor heat transfer.
Cooling Goals and Operating Targets
Cooling design starts with what you must protect. For most gearboxes, the practical targets are:
- Maintain oil viscosity within the recommended band across normal load and ambient conditions.
- Limit maximum oil temperature to avoid additive depletion and seal hardening.
- Keep temperature gradients reasonable so bearings and housings do not see large differential expansion.
A simple example: a gearbox rated for ISO VG 220 oil at operating temperature. If the oil runs so hot that it behaves like ISO VG 150, the lubricant film may no longer separate gear tooth surfaces reliably. Cooling should be sized to prevent that viscosity drift, not just to reduce temperature by a fixed number.
Heat Transfer Basics That Drive Design
Heat exchangers move heat from hot oil to a cooler medium. The effectiveness depends on:
- Temperature difference between oil and cooling medium (driving force).
- Heat transfer area and overall heat transfer coefficient.
- Flow rates and turbulence, which affect film coefficients on both sides.
- Fouling resistance, especially on the cooling-medium side.
A useful mental model: if the cooling medium temperature is stable but the oil flow is too low, the oil may not give up heat fast enough. If the oil flow is high but the exchanger area is too small, the oil will still exit too warm. Both sides matter.
Cooling Medium Choices and Tradeoffs
Common cooling media include water/glycol, air, and sometimes oil-to-oil arrangements.
- Water or glycol: High heat capacity and typically compact exchangers. Requires attention to corrosion control and leak containment.
- Air: Simple and self-contained, but less effective per unit area. Often used when water is unavailable or when the duty is modest.
- Oil-to-oil: Useful when you already have a stable external oil loop. It can reduce thermal shock to the gearbox oil but adds complexity and additional pressure losses.
Example: If your plant cooling water is intermittently warm, an exchanger sized for “design water temperature” may underperform during those periods. In that case, you either increase area, improve flow control, or choose a different medium.
Heat Exchanger Types and When They Fit
Shell-and-tube: Robust and tolerant of fouling. Often used with water/glycol. They can handle higher pressure differences but may be bulkier.
Plate heat exchangers: High efficiency and compact. They offer good heat transfer but are more sensitive to fouling and require careful gasket selection for the oil and temperatures.
Air coolers: Fin-based radiators with fans. They work well when ambient conditions are acceptable and when maintenance access for fin cleaning is planned.
A practical selection rule: if fouling risk is high on the cooling side, choose a design that tolerates it and plan for cleaning intervals. If space is tight and fouling is controlled, plate exchangers often deliver strong performance.
Sizing Logic from Heat Load to Temperature Control
Sizing begins with gearbox heat generation. Heat load can be estimated from power loss and efficiency, then converted to heat to be removed.
- Determine oil flow rate through the cooler (or design flow if using a bypass).
- Estimate heat load at the highest expected operating condition.
- Select exchanger area and flow arrangement to achieve the required oil outlet temperature.
- Verify pressure drop limits so the oil pump can supply flow without starving bearings.
Example: Suppose the gearbox dissipates 12 kW of heat at peak load. If you circulate 0.5 m³/h of oil, the required temperature rise across the cooler can be estimated using oil specific heat. If the outlet temperature target is strict, you may need either higher flow through the cooler, more exchanger area, or a colder cooling medium.
Flow Arrangement and Bypass Control
Many systems use a thermostat or bypass valve so the cooler doesn’t overcool oil during start-up. Overcooling can be as unhelpful as overheating because viscosity becomes too high, increasing churning losses and potentially stressing seals.
A common approach:
- On cold start, bypass most flow around the exchanger.
- As oil warms, gradually route flow through the exchanger.
- Use a control strategy that avoids hunting, where the valve repeatedly swings and causes unstable temperatures.
Pressure Drop and Pump Margin
Cooling circuits add resistance: piping, filters, valves, and the exchanger itself. If total pressure drop is too high, the oil pump may not deliver the required flow to bearings and gear meshes.
Example: If a cooler adds 0.6 bar drop at design flow and the system already runs near the minimum pressure needed for bearing lubrication, you may need a larger pump, a different exchanger, or reduced restriction elsewhere.
Maintenance Considerations That Affect Real Performance
Heat exchangers lose effectiveness when fouled. Plan for:
- Cleaning access and safe isolation procedures.
- Monitoring differential pressure across the exchanger or strainers.
- Water-side treatment if using water/glycol.
A straightforward indicator: if the oil outlet temperature rises over time at the same operating condition, the exchanger may be fouling or the cooling medium flow may be degrading.
Mind Map: Gear Oil Cooling Strategies and Heat Exchanger Selection
Example: Selecting a Cooler for a Water-Cooled Gearbox
A gearbox runs at peak load with oil outlet temperature drifting upward during summer. The cooling water temperature is higher and the exchanger differential pressure is increasing.
Integrated response:
- Confirm oil flow through the cooler meets design value.
- Check strainers and ensure no partial blockage.
- Inspect and clean the exchanger if differential pressure indicates fouling.
- If water temperature remains high, increase exchanger area or improve water flow control so the cooling medium flow is maintained at peak conditions.
This approach keeps the system within viscosity targets while protecting lubrication pressure, rather than chasing temperature alone.
8.4 Seal Selection and Leak Management for Oil Containment
Oil leaks are rarely just an “oops.” They are usually the visible end of a chain: pressure and temperature create stress, stress changes clearances, clearances change film behavior, and changed film behavior attacks seals. Good seal selection and leak management break that chain early.
Seal Selection Foundations
Start with the job the seal must do. A seal’s main tasks are (1) contain lubricant, (2) block external contaminants, and (3) survive the operating environment without losing sealing force.
-
Fluid compatibility: Confirm the oil type and additive package. Mineral, synthetic, and ester-based oils can swell elastomers differently. A simple example: a gearbox using a synthetic oil may soften a seal that previously worked with mineral oil, leading to weeping after a few months.
-
Temperature range: Use the highest steady temperature and the highest credible transient. Elastomers harden when too cold and lose strength when too hot. If a bearing housing runs hotter during startup, choose a seal material that tolerates that peak, not just normal operation.
-
Pressure and differential pressure: Decide whether the seal sees mostly atmospheric pressure, mild positive pressure, or pressure pulses. A common failure mode is seal lip extrusion when pressure spikes, especially in systems with thermal expansion.
-
Surface speed and shaft finish: Lip seals depend on a stable contact pattern. If shaft surface roughness is high or there is misalignment, the seal lip wears and leakage increases. For example, a seal that was installed on a newly ground shaft can leak after a few weeks if the shaft later develops runout.
-
Contamination risk: If dust or water ingress is likely, consider a seal arrangement that includes a secondary barrier, such as a wiper plus a sealing lip, or a labyrinth plus seal combination.
Seal Types and When They Fit
- Radial lip seals: Good for containing oil on rotating shafts with moderate contamination risk. They are sensitive to installation quality and shaft condition.
- Mechanical face seals: Common in pumps and mixers where leakage must be minimal. They require correct alignment and clean operating conditions.
- Labyrinth seals: Useful where you want to reduce contamination ingress and tolerate some leakage. They work best with controlled clearances.
- O-rings and static seals: Used for housings, covers, and fittings. They are often the source of “slow drips” when flange surfaces are uneven or bolts are not torqued consistently.
A practical rule: if the leak path is static (cover plate, drain plug, sight glass), focus on gasket and surface prep first. If the leak path is dynamic (shaft), focus on lip geometry, shaft finish, and alignment.
Leak Management Strategy
Leak management is not just fixing the symptom. It is controlling the leak path, reducing driving forces, and verifying the result.
- Control driving forces
- Breather and venting: Pressure buildup pushes oil outward. Ensure breathers are sized and positioned so they do not become oil-wetted. Example: a blocked breather can turn normal “sweating” into a steady leak.
- Oil level management: Overfilling increases churning and pressure at the seal lip. Set oil level to the manufacturer’s guidance and verify with a consistent method.
- Reduce mechanical stress
- Alignment and runout: Misalignment increases lip wear. Measure shaft runout and housing alignment during troubleshooting, not only during installation.
- Vibration control: Excess vibration can pump oil past seals by repeatedly changing contact pressure.
- Improve barrier design
- Use wipers with sealing lips when external contaminants are present. A wiper reduces abrasive wear that otherwise shortens seal life.
- Consider double-seal arrangements for critical assets. A double seal can route leakage to a controlled region rather than letting it escape.
Installation and Maintenance Practices
Most seal failures are installation failures wearing a disguise.
- Correct orientation and lip direction: Lip seals must face the oil pressure. Installing them backward can cause immediate leakage.
- Avoid damaging the lip during installation: Use proper tools and protect the lip from sharp edges and threads.
- Surface preparation: Clean shaft grooves, remove burrs, and confirm the seal seat is smooth. A tiny burr can create a permanent leak channel.
- Torque and gasket seating: For static seals, torque in the correct sequence and verify gasket compression. Uneven compression creates microgaps that weep.
Troubleshooting Leak Patterns
Use the leak pattern to narrow the cause.
- Dry outside with occasional wetting: Often venting or thermal expansion. Check breather function and oil level.
- Wet around the shaft lip area: Often lip wear, shaft finish issues, or misalignment.
- Leak at flange edges or around plugs: Often static seal/gasket issues, surface finish, or improper torque.
- Leak that increases after maintenance: Often installation damage or incorrect seal orientation.
Mind Map: Seal Selection and Leak Management
Example: From Symptom to Fix
A gearbox shows oil staining near the shaft seal after weekend downtime. The oil level is correct during weekday checks, but the breather is found oil-wetted and partially blocked. Cleaning the breather and confirming it stays dry during operation stops the leak without changing the seal. The lesson is simple: when the leak correlates with temperature cycles and idle time, venting and pressure buildup often outrank seal material changes.
8.5 Case Study: Workflow for Oil System Performance Recovery
A paper mill had recurring bearing overheating on a gearbox-driven fan. Operators reported “oil looks fine,” but the symptoms kept returning after short maintenance cycles. The recovery workflow below shows how the team moved from evidence to action, then back to verification.
Step 1: Confirm the Symptom with Measurable Evidence
Start by separating “hot bearings” from “hot oil.” The team logged: bearing housing temperature trend, gearbox oil temperature, differential pressure across the filter, and oil level alarms. They also reviewed the last three oil analysis reports and the filter change history.
Example: If bearing temperature rose while oil temperature stayed stable, the likely issue was local delivery (starvation, restriction, or wrong viscosity) rather than bulk overheating.
Step 2: Validate the Oil System Configuration
They verified the as-built configuration against the lubrication diagram: pump type and rotation, suction strainer presence, filter element rating, bypass valve setting, and correct oil grade in the sump. They checked whether any maintenance work had changed hose routing or installed incorrect fittings.
Example: A swapped suction line can pull oil from a low-flow zone, causing intermittent starvation during load peaks.
Step 3: Check Contamination and Lubricant Condition
Oil analysis results were reviewed in context of sampling discipline. The team compared viscosity at operating temperature, oxidation indicators, water content, and wear metals.
Example: Elevated water with stable viscosity often points to condensation or cooling system leakage rather than oil degradation. Elevated wear metals with normal viscosity points to abrasive particles or poor filtration.
They also inspected filter elements for bypass signs and checked differential pressure behavior during operation.
Step 4: Perform a Controlled System Inspection
The inspection focused on the path from sump to bearing: suction screen condition, pump inlet restriction, pump output pressure, filter differential pressure, and flow at the discharge.
Example: If differential pressure was high and flow was low, the filter was either loaded with particles or the bypass valve was stuck closed. If differential pressure was low but bearings were hot, the bypass might be stuck open or the pump might be under-delivering.
Step 5: Restore Flow and Containment Before Changing Lubricant
They avoided “oil changes as a first fix.” Instead, they corrected the delivery path: cleaned the suction strainer, replaced filter elements with the specified rating, and confirmed bypass valve operation.
Example: After replacing elements, they ran the system and confirmed differential pressure returned to normal range within a predictable time window.
Step 6: Correct the Root Cause, Not Just the Symptom
The team found two issues: a partially blocked suction strainer and a bypass valve that had been misadjusted during a prior outage. The misadjustment allowed bypass flow to short-circuit filtration under higher demand.
They corrected the bypass setting, reassembled with verified torque and gasket condition, and ensured the oil grade matched the original spec.
Step 7: Execute a Verification Loop with Clear Acceptance Criteria
Verification used the same measurements from Step 1, but with tighter acceptance criteria. They defined pass/fail thresholds for: bearing temperature rise rate, oil temperature stability, differential pressure range, and oil analysis trends.
Example: Bearings were required to stop exceeding a defined temperature delta above baseline for a full operating cycle, not just during the first hour after restart.
Step 8: Close the Loop with Work Instructions and Feedback
They updated standard work: sampling point labeling, filter change triggers based on differential pressure, and a checklist for bypass valve verification after any filter service.
Example: The checklist included a simple “flow sanity check” during commissioning so technicians could catch under-delivery before it reached bearings.
Mind Map: Oil System Performance Recovery Workflow
Example: Evidence-to-Action Decision Points
- High differential pressure + hot bearings: inspect filter loading and bypass valve stuck-closed.
- Low differential pressure + hot bearings: check bypass stuck-open or pump under-delivery.
- Water present + stable wear metals: focus on water ingress pathway and cooling system integrity.
- High wear metals + poor filtration indicators: prioritize contamination control and verify filter rating and bypass behavior.
By the end of the recovery cycle, bearing temperatures stabilized, differential pressure returned to normal operating behavior, and the next oil analysis showed wear metals trending down with no new water spike. The key win was the workflow itself: measure first, restore delivery before changing oil, then verify with the same metrics that originally exposed the problem.
9. Filtration and Contamination Control Engineering
9.1 Filter Selection Criteria for Particle Capture and Flow Capacity
A filter’s job is simple: catch the right particles, fast enough, without starving the system. The tricky part is that “right” depends on the lubricant, the contamination sources, the component clearances, and the flow path. Selection becomes a set of linked decisions rather than a single catalog choice.
Start with What You Are Protecting
Begin by identifying the most sensitive wear surfaces in the circuit. For example, a gearbox with tight gear mesh clearances typically needs finer control than a large-bore hydraulic line. Then map the likely particle sources: ingested dirt, wear debris from bearings or gears, and byproducts of oxidation. If the contamination is mostly water-related, a particle filter alone will not solve the problem, but it still matters because particles can accelerate wear.
A practical check: if your oil analysis shows rising ferrous debris and the system uses a bypass filter, you may be protecting the wrong stage. The filter must be positioned where it can intercept the particles before they reach the critical interfaces.
Define Target Particle Capture Requirements
Particle capture is not just “micron rating.” Use three ideas together:
- Absolute vs nominal rating: Absolute ratings aim to capture particles at a specified size under defined conditions; nominal ratings are looser and can mislead when comparing brands.
- Efficiency curve: A filter may capture well at one size range and less at another. Look for performance data across sizes, not a single number.
- Contaminant type: Hard particles behave differently than soft agglomerates. If your system has soot or oxidation sludge, the filter media must handle loading without rapid plugging.
Example: A hydraulic system with fine spool valves often benefits from a filter with high efficiency in the sub-10 µm range. If you select a filter that only performs well above 20 µm, you may still see valve sticking even though the filter “has a micron rating.”
Match Flow Capacity to Real Operating Demand
Flow capacity is the filter’s ability to pass oil without excessive restriction. Two values matter:
- Rated flow: the flow the filter can handle at acceptable pressure drop.
- Maximum differential pressure: the limit before bypass occurs or media damage risks increase.
To size correctly, use the system’s normal flow and worst-case flow conditions. Worst-case often means cold start (higher viscosity) and high pump output. If the oil is thicker, pressure drop rises and the filter may bypass earlier than expected.
A simple sizing example: Suppose the system normally circulates 60 L/min but during cold start the viscosity increases enough that pressure drop doubles. If the filter is rated for 60 L/min at normal viscosity, it may reach bypass limits during startup. Choosing a filter with higher rated flow or lower restriction media prevents that.
Control Pressure Drop and Bypass Behavior
Filters are designed with media and housings that create a pressure drop. As the filter loads with particles, pressure drop increases. Bypass can be intentional (to prevent starvation) or accidental (from poor design or clogged media).
Selection steps:
- Choose a filter whose initial pressure drop is low enough to avoid unnecessary energy loss.
- Ensure the loaded pressure drop before maintenance stays below bypass thresholds.
- Verify that bypass flow still provides meaningful protection. A bypass that routes unfiltered oil to critical components defeats the purpose.
If your system uses a bypass valve, treat it as a last-resort safety feature, not a normal operating mode.
Choose Media and Construction for the Lubricant Chemistry
Media selection affects both capture and longevity.
- Depth media (often pleated): good at trapping particles throughout the media thickness, which can extend service life.
- Surface media (often membrane-like): can provide sharp efficiency but may plug faster with heavy loading.
- Compatibility: ensure the media and seals tolerate the lubricant’s additives, temperature, and any water content.
Example: In an oil system with frequent water ingress, a media that tolerates moisture and does not swell excessively can maintain performance longer. If the media swells, the effective pore structure changes and capture efficiency can drop.
Validate with a Simple Sizing Workflow
Use this workflow to connect capture and flow without guesswork.
- Identify critical components and required cleanliness level.
- Determine likely particle size distribution from oil analysis or commissioning data.
- Select candidate filters with efficiency data matching the target size range.
- Calculate or estimate pressure drop at normal and cold-start viscosity.
- Confirm rated flow and bypass behavior under loaded conditions.
- Set maintenance triggers based on differential pressure and oil condition.
Mind Map: Filter Selection Criteria
Example: Two Filters, One System
Consider a circulating oil system feeding both bearings and a heat exchanger. Filter A has a fine micron rating but low rated flow; Filter B has a slightly coarser rating but higher flow capacity and stable pressure drop.
If the system frequently hits cold-start conditions, Filter A may bypass early, sending unfiltered oil to bearings. Filter B may capture fewer particles at the smallest sizes, but it can keep the circuit protected during the most demanding period. In practice, the “better” filter is the one that maintains capture performance when the system actually needs it, not the one with the smallest number on the box.
The selection goal is consistent: achieve the required capture where it matters, while keeping pressure drop and bypass behavior under control across the full operating envelope.
9.2 Bypass Valves Differential Pressure Indicators and Maintenance Triggers
Bypass valves protect filters from starvation when pressure rises, but they also change what the system is actually doing. A differential pressure indicator (DPI) tells you when the filter is approaching bypass, and maintenance triggers tell you what to do before bypass becomes the default mode.
Foundational Concepts for Differential Pressure
A filter adds resistance as it loads with particles. That resistance shows up as a differential pressure across the filter element. When the pressure drop reaches the bypass valve setpoint, the valve opens and flow takes the path of least resistance, reducing filtration effectiveness.
A DPI typically provides either:
- A visual indicator (mechanical flag or window) that changes state when a threshold is exceeded.
- An electrical switch or transmitter that can alarm in a control system.
The key idea is simple: the DPI is not a “filter is bad” signal by itself; it is a “filter is nearing bypass” signal.
How to Interpret Indicator States Without Guessing
Treat indicator readings as a decision input, not a diagnosis.
- Normal state: differential pressure is below the trigger threshold. Filtration is likely active.
- Approaching state: differential pressure is trending upward toward the trigger. This is where you plan work.
- Bypass state: bypass is open. Wear protection is reduced, so you act faster.
If your system has both a DPI and a bypass valve, confirm what the indicator is actually measuring. Some indicators are wired to the filter housing differential pressure; others are tied to a specific port arrangement. A mismatch can cause “false comfort” where the indicator says all is well while bypass is already open.
Maintenance Triggers That Match Operational Reality
Maintenance triggers should be layered so you don’t rely on a single threshold.
Trigger Layer 1: Time and operating conditions
- Use run hours and temperature bands to normalize expectations. A filter at cold start will show higher pressure drop than at steady operating temperature.
- Example: If the system runs at 60°C most of the day, set triggers based on steady-state readings, not the first 10 minutes after start.
Trigger Layer 2: Differential pressure thresholds
- Set a “plan work” threshold below bypass setpoint.
- Set an “act now” threshold at or near bypass opening.
- Example: If bypass opens at 2.0 bar, you might plan work at 1.2–1.5 bar and act now at 1.8–2.0 bar, depending on your filter model and fluid viscosity.
Trigger Layer 3: Evidence from oil analysis and system symptoms
- When DPI triggers occur, check whether oil analysis shows rising particle counts or abnormal wear metals.
- Example: If DPI approaches threshold but particle counts remain stable, the cause may be a temporary event like startup conditions or a short-lived contamination spike.
Mind Map: Differential Pressure Indicators and Triggers
Example Workflows That Stay Practical
Example 1: Approaching Threshold on a Hydraulic System
- DPI shows rising differential pressure and crosses the “plan work” threshold during steady operation.
- Action: open the CMMS work order with a planned filter inspection window.
- Verification: compare with the last 3 weeks of readings at similar temperatures.
- Likely outcome: if the trend is consistent, schedule an element change; if the trend is sudden, investigate upstream contamination sources such as a recent seal replacement or a reservoir cleaning job.
Example 2: Bypass Open During Production
- DPI indicates bypass state while the system is running.
- Action: confirm bypass is actually open by checking the valve position or housing indicator (if available).
- Immediate checks: verify no cavitation, abnormal noise, or flow reduction symptoms.
- Maintenance: replace the filter element and inspect for causes like collapsed media, incorrect element type, or a blocked suction strainer.
- Evidence step: pull an oil sample after corrective action to confirm particle control is restored.
Common Failure Modes in the Indicator Logic
- Threshold set too high: bypass opens before the indicator changes, so you only learn after filtration is already reduced.
- Threshold set too low: you replace elements too early, increasing cost and downtime without improving protection.
- Port mismatch: DPI measures a different pressure than the bypass valve responds to.
- Indicator drift or sticking: mechanical indicators can hang; electrical switches can fail silently.
A good maintenance trigger system prevents these issues by combining correct measurement mapping, sensible thresholds, and evidence-based follow-through.
9.3 Kidney Loop and Offline Filtration System Design
A kidney loop is an offline filtration circuit that continuously or intermittently pulls a small fraction of oil from the main reservoir, filters it, and returns it. The goal is simple: remove particles and water faster than the main system can accumulate them, without stopping production. Think of it as a “slow, steady cleanup crew” that works while the machine keeps running.
Core Design Objectives
Start with three measurable outcomes:
- Particle reduction: lower particle concentration and shift the distribution toward fewer large particles.
- Water reduction: remove free water and reduce conditions that promote emulsions.
- Oil property stability: avoid excessive temperature rise, aeration, or viscosity change caused by the loop itself.
A practical rule is to size the loop so it can process a meaningful fraction of the reservoir volume within the maintenance interval. If the reservoir is 2,000 L and you want a full “turnover” in 24 hours, the loop flow target is about 2,000 L/day, or roughly 83 L/hour.
System Architecture from Suction to Return
A kidney loop typically includes: takeoff connection, pump, pre-filtration if needed, filter housing, differential pressure monitoring, water removal stage if required, return line, and controls.
Key foundational choices:
- Takeoff location: draw from a zone that represents the reservoir’s bulk oil condition. Avoid dead zones where oil is stagnant.
- Return location: discharge in a way that promotes mixing without short-circuiting back to the suction.
- Pump selection: choose a pump that can handle viscosity at operating temperature and tolerate some air entrainment without cavitating.
A common mistake is returning the filtered oil directly into the suction line. The loop then “filters itself” and leaves the rest of the reservoir largely unchanged.
Filtration Stage Selection
Offline filtration can be built with one or more stages depending on contamination type.
- Depth filters (often for robust particle capture): useful when you expect a range of particle sizes and want good dirt-holding capacity.
- Absolute or fine-mesh elements (often for tight particle control): used when you need a specific cleanliness target.
- Water removal: options include coalescing media for free water and specialized separation media for emulsified water.
Design the sequence so the first stage protects the later stages. For example, a coarse pre-filter can extend the life of a fine element by catching larger debris.
Flow Rate, Pressure Drop, and Element Life
Sizing uses three constraints:
- Required flow to meet turnover goals.
- Maximum allowable differential pressure across the filter element.
- Viscosity at operating temperature to ensure the pump can deliver flow without excessive power draw.
Differential pressure is not just a “replace filter” signal. It also indicates whether the element is loading faster than expected, which can point to a contamination source upstream.
A simple example: if the filter housing is rated for a maximum ΔP of 2.5 bar, and your operating ΔP climbs from 0.6 bar to 2.2 bar in a week, you likely need either a larger element, a higher dirt-holding capacity, or improved upstream contamination control.
Piping, Valves, and Contamination Control
Good piping design prevents the loop from becoming a contamination generator.
- Minimize fittings and sharp bends to reduce particle shedding and turbulence.
- Use proper line flushing during commissioning so the loop does not start life with debris.
- Include isolation valves for safe element changes.
- Add strainers where appropriate to protect pumps from large debris.
Keep suction lines short and avoid placing them where they can ingest air. Air ingestion shows up as fluctuating flow, noisy pump operation, and unstable oil condition.
Controls and Monitoring That Actually Help
Controls should match the maintenance intent.
- Differential pressure switch: triggers maintenance action when ΔP reaches a set threshold.
- Flow verification: ensures the loop is actually moving oil, not just “running.”
- Temperature monitoring: prevents overheating from pump losses.
- Water monitoring: if water removal is part of the design, track a water indicator so you know whether the stage is doing its job.
A loop that runs continuously but has no flow verification can quietly fail for weeks. The filter may be clogged, the pump may be cavitating, or a valve may be partially closed.
Mind Map: Kidney Loop Design Elements
Example: Designing a Loop for a Gear Oil Reservoir
Assume a 1,500 L gear oil reservoir. You want a full turnover in 12 hours, so target flow is about 125 L/hour. Choose a filter element with a dirt-holding capacity that supports the expected loading rate; if your ΔP rises quickly, increase element capacity or reduce flow to a level that extends service intervals.
If oil analysis shows recurring water presence, add a coalescing stage before the fine particle element. This prevents water-related loading from consuming the fine media too quickly.
During commissioning, flush the loop lines and confirm stable flow. Then record baseline cleanliness and track ΔP over the first service interval. If the loop reaches the maintenance ΔP threshold far earlier than expected, treat it as a signal to improve upstream contamination control, not just a reason to swap elements sooner.
Design Validation Checklist
- Turnover target met with stable flow.
- ΔP stays within limits for the intended interval.
- No air ingestion signs during operation.
- Return location avoids suction short-circuiting.
- Oil cleanliness trends improve after commissioning.
- Water indicators decrease when water removal is included.
9.4 Water Removal Methods and Monitoring for Effectiveness
Water in lubricants is rarely a single problem. It can arrive as condensation, wash-in from maintenance, or leak-in from seals and coolers. The goal of water removal is not just “drying” the oil; it is restoring stable lubrication conditions and preventing recontamination.
Water Removal Foundations
Start by classifying the water state, because removal methods work differently for each.
- Free water settles or separates. It is usually easiest to remove by draining, settling, or coalescing.
- Emulsified water is dispersed as tiny droplets. It requires separation media or chemical demulsification.
- Dissolved water is present at molecular level. It is harder to remove directly; the practical approach is to stop the water source and use systems that can reduce total moisture.
A simple operational check helps: if the oil shows a rapid change in appearance after agitation, you likely have emulsified water. If water separates quickly in a clear container, you likely have free water.
Removal Methods That Actually Work
Settling and Draining
Settling is the low-tech option for free water. Use it when the system design allows safe isolation and controlled drainage.
Example: A gearbox shows elevated water by Karl Fischer and rising viscosity. After stopping the unit, operators allow the oil to settle in a clean, labeled container. The separated water layer is removed, then the oil is returned only after verification tests confirm moisture reduction.
Settling is not a cure for emulsified water, because droplets may remain suspended.
Coalescing Filtration
Coalescing filters merge small droplets into larger ones that can separate. They are effective for emulsified water when the filter media is compatible with the lubricant and flow conditions.
Example: A hydraulic system repeatedly fails water limits after filter change intervals. A coalescing kidney-loop filter is installed with differential pressure monitoring. After a few hours of circulation, water content drops and stays lower, indicating the media is capturing emulsified droplets rather than just trapping particles.
Centrifugation
Centrifuges separate water based on density differences. They can be powerful for both free and emulsified water, depending on equipment design.
Example: A plant with high condensation loads uses a centrifuge during scheduled downtime. Moisture readings fall quickly after processing, and the oil’s water trend stabilizes afterward, showing the removal step is effective rather than temporary.
Chemical Demulsifiers
Demulsifiers help break emulsions so water can separate. They must be dosed carefully because over-treatment can interfere with additive performance.
Example: A circulating oil system shows persistent emulsified water despite coalescing filtration. A controlled demulsifier dose is applied during a maintenance window, followed by a short circulation period and verification sampling. If wear metals and oxidation indicators remain stable while water drops, the dose is validated.
Vacuum Dehydration and Heat-Assisted Methods
Vacuum dehydration reduces moisture by lowering boiling point. Heat-assisted methods can help, but they must respect lubricant viscosity and additive stability.
Example: A compressor oil with dissolved moisture is treated using vacuum dehydration. Viscosity and additive indicators are checked before and after to ensure the process did not accelerate oxidation or strip key components.
Monitoring for Effectiveness
Monitoring must answer two questions: Did water removal happen? and Did the system stop bringing water back? Use both oil tests and system observations.
Oil Analysis Metrics
Track moisture using a consistent method and sampling discipline.
- Karl Fischer water content for moisture level trends.
- Emulsion indicators such as water separation behavior and test repeatability.
- Viscosity and oxidation indicators to confirm the removal process did not degrade the oil.
- Particle counts and wear metals to ensure filtration or dehydration did not introduce contamination.
Example: After coalescing filtration, water content drops, but viscosity rises sharply and wear metals increase. That pattern suggests the filter is not the only issue; the system may be ingesting contaminants or experiencing thermal stress.
System Health Checks
Water removal is only half the story. Verify the water source is addressed.
- Seal condition and leak paths around bearings, coolers, and heat exchangers.
- Cooling system integrity by checking temperature differentials and signs of cross-contamination.
- Breather and desiccant status on sumps to reduce condensation.
- Maintenance practices such as container cleanliness and transfer procedures.
Example: A gearbox has water removed by draining and coalescing, and moisture drops initially. Two weeks later, water rises again. Inspection finds a failed breather element that allows humid air ingress, explaining the recurring water load.
Mind Map: Water Removal and Monitoring
Integrated Example Workflow
- Confirm water state using test results and separation behavior.
- Select removal method aligned to that state (settling for free water, coalescing/demulsifier for emulsified, vacuum for dissolved).
- Verify immediately after treatment with moisture plus at least one oil health indicator such as viscosity or oxidation.
- Inspect likely ingress points so the next sampling does not simply repeat the same lesson.
- Trend over time to confirm the system is stable, not just temporarily improved.
When these steps are followed, water removal becomes a controlled maintenance action rather than a recurring cleanup exercise. The oil gets drier, the machinery gets happier, and the data stops contradicting the work order.
9.5 Verification Using Oil Analysis and Differential Pressure Records
Verification is the part where you stop trusting assumptions and start trusting evidence. In filtration and contamination control, the two most practical evidence streams are (1) oil analysis results and (2) differential pressure records across filters. When they agree, you can be confident the system is doing what you think it is doing. When they disagree, you have a clear path to find the mismatch.
Foundational Logic for Verification
Start with a simple cause-and-effect chain:
- More particles and water load the filter media.
- Loaded media increases resistance to flow.
- Increased resistance shows up as higher differential pressure (ΔP) across the filter.
- If the filter is effective, downstream oil should show lower particle counts and fewer contamination indicators than upstream.
Oil analysis verifies the contamination outcome. Differential pressure verifies the filtration condition. Together they confirm both “what happened” and “why it happened.”
Differential Pressure Records That Actually Help
Record ΔP in a way that supports decisions, not just dashboards. Use consistent measurement points: across the same filter element type and housing. Capture at least these fields per event or interval:
- Filter identifier and element batch or part number
- Operating mode (running, standby, start-up)
- Flow rate or pump speed setting
- ΔP value and the time window it represents
- Bypass status or bypass indicator state
A common pitfall is comparing ΔP values taken at different flow rates. If flow rises, ΔP rises even when the media is clean. That’s why ΔP must be interpreted alongside flow or pump speed.
Oil Analysis Metrics That Pair with ΔP
Choose oil analysis tests that map to filtration outcomes:
- Particle count and size distribution for upstream and downstream samples
- Ferrous/non-ferrous wear metals to detect whether filtration is preventing abrasive circulation
- Water content and water-related indicators to confirm whether the system is removing or at least not spreading water
- Viscosity and oxidation indicators to ensure the filter change is not masking broader lubricant degradation
For verification, the most useful comparison is not “today vs last month,” but “downstream vs upstream at the same time window.” If you sample upstream and downstream during the same operating condition, the comparison becomes much more meaningful.
Step-by-Step Verification Workflow
-
Establish a Clean-Filter Reference After commissioning or filter change, capture baseline ΔP at known operating conditions. This becomes your reference for “normal resistance.”
-
Define Action Thresholds Set thresholds using baseline behavior and maintenance history. For example, you might treat a sustained ΔP rise above baseline by a fixed margin as a “media loading” indicator, while a short spike during start-up may be normal.
-
Collect Paired Samples Take upstream and downstream oil samples when ΔP is elevated or when it is near baseline. Keep sampling discipline consistent so you’re not comparing different contamination states caused by sampling variability.
-
Compare Outcomes
- If ΔP is high and downstream particle counts are low, the filter is doing its job and the media is simply loaded.
- If ΔP is high and downstream particle counts are also high, the filter may be bypassing, leaking, or the sampling points may be mislocated.
- If ΔP is low but downstream particle counts are high, the filter may be underperforming due to wrong element selection, incorrect flow routing, or bypass stuck open.
-
Verify the Root Cause With Evidence Use the combined evidence to choose the next check: bypass valve function, differential pressure sensor calibration, element integrity, flow direction, or sampling line condition.
Mind Map: Verification Using Oil Analysis and Differential Pressure Records
Example: Kidney Loop Filter with Elevated ΔP
A gearbox kidney loop shows ΔP rising from a clean baseline of 0.2 bar to 0.9 bar over two days. Flow rate is stable at the same pump speed used during baseline.
Paired samples are taken from upstream and downstream lines during the elevated ΔP window. Results show:
- Upstream particle count is high, dominated by 5–15 µm sizes.
- Downstream particle count is much lower, with the same size band reduced by an order of magnitude.
- Water content is unchanged between upstream and downstream.
Interpretation: the filter media is loading (ΔP rise), but filtration is effective for particles. The unchanged water suggests the filter is not a water-removal mechanism in this configuration, so the maintenance action should focus on media replacement timing rather than chasing a water ingress issue.
Example: Elevated ΔP with No Downstream Improvement
In another system, ΔP rises similarly, but downstream particle counts remain nearly the same as upstream. Wear metals also remain elevated.
Because ΔP indicates restriction, but oil analysis shows no filtration benefit, the likely causes shift from “media is dirty” to “media is bypassed or not filtering the intended flow.” The next verification steps are straightforward: check bypass valve position and operation, inspect for housing leaks, confirm correct flow routing, and verify that upstream and downstream sampling points are truly before and after the element.
Verification Output That Supports Work Orders
Close the loop by recording a short verification conclusion tied to evidence:
- “ΔP elevated with effective downstream particle reduction: replace element per schedule.”
- “ΔP elevated with no downstream improvement: investigate bypass/leak/misrouting before replacing elements.”
- “ΔP near baseline with high downstream particles: verify element selection and flow path.”
This keeps maintenance decisions consistent and prevents the classic problem of replacing parts while the real fault stays politely in the corner, waiting for the next “same symptom” call.
10. Reliability Centered Maintenance Task Execution and Work Management
10.1 Maintenance Planning for Lubrication Tasks and Inspections
A lubrication plan is a set of decisions you can execute repeatedly: what to check, how to check it, when to check it, and what to do when results look wrong. The goal is not to “inspect everything,” but to cover the lubrication functions that prevent specific failures such as bearing overheating, gear scuffing, seal leakage, and pump starvation.
1) Start with Lubrication Functions and Failure Targets
Plan from the equipment outward. For each asset, list the lubrication functions it must deliver: correct lubricant type, correct quantity, correct cleanliness, correct delivery rate, and correct film formation. Then map those functions to failure targets.
Example: For a gearbox, the plan should explicitly protect against oil oxidation, water ingress, filter bypass, and abnormal wear. That means your inspection tasks must include checks that can reveal those conditions early, not just “oil level looks okay.”
2) Define Task Types and Their Roles
Use three task types so the plan stays coherent.
- Routine inspections confirm the basics are still true: levels, leaks, temperatures, and indicator states.
- Lubricant condition checks confirm the oil or grease is still doing its job: sampling, test selection, and trending.
- System health checks confirm the delivery and filtration system is functioning: pump operation, flow verification, filter differential pressure, and bypass behavior.
Example: A grease-lubricated bearing might need routine inspection for purge quality and evidence of overgreasing, while the lubrication system health check verifies that the pump is delivering at the programmed rate.
3) Choose Frequencies Using Operating Reality
Frequency should reflect operating severity and consequence, not calendar habit. Consider load, speed, duty cycle, environment, and how quickly lubrication problems become visible.
A practical rule: if a defect can escalate into a functional failure within days, your inspection frequency must be short enough to catch it before the failure mode completes. If the defect typically shows up gradually, you can rely more on trending from oil analysis.
Example: A hydraulic system exposed to frequent washdowns needs tighter leak and water ingress checks than a sealed indoor system.
4) Build Inspection Checklists That Are Actionable
A checklist should produce a decision, not just a record. Each line item should include what to observe, where to observe it, and what outcome triggers action.
Example checklist items for an oil system:
- Oil level at the sight glass or dipstick: action if consistently low or fluctuating beyond normal.
- Filter differential pressure indicator: action if it trends upward or reaches the maintenance threshold.
- Return line condition: action if return is foamy or discolored, suggesting aeration or contamination.
- Leak inspection: action if leaks appear at seals, fittings, or hose connections.
5) Plan Sampling and Handling as Part of Maintenance
Sampling is a maintenance task with its own failure modes: wrong location, wrong method, and sample contamination. Plan sampling points and handling steps so technicians can repeat them without improvising.
Example: For a gearbox, specify the sampling port location relative to flow path, the sample volume, container type, labeling steps, and who verifies the sample ID before it leaves the site.
6) Integrate Work Orders with Evidence and Thresholds
Each inspection result should map to a work order outcome. Define thresholds for “monitor,” “investigate,” and “repair.” Keep the logic consistent across assets so the team doesn’t reinvent decisions every week.
Example: If oil viscosity shifts beyond the defined band and wear metals are rising, the plan should trigger investigation of contamination and oxidation pathways, not just an oil top-up.
7) Mind Map for Lubrication Task Planning
Mind Map: Maintenance Planning for Lubrication Tasks and Inspections
8) Example Planning Workflow for One Asset
Use a repeatable workflow.
- Identify lubrication method and critical components (e.g., gearbox bearings and gear mesh).
- List lubrication functions and failure targets (cleanliness, film strength, water control).
- Select task types and assign frequencies (routine checks weekly, sampling monthly, system health checks per differential pressure trend).
- Write checklist items with thresholds (what counts as normal, what triggers investigation).
- Define work order actions (repair, flush, filter change, seal inspection, or sampling repeat).
- After corrective work, verify the system returns to normal conditions using the same evidence you used to detect the issue.
This approach keeps the plan systematic: it starts with what must be protected, then builds tasks that can actually prove whether protection is happening.
10.2 Condition Based Triggers for Oil Analysis and System Health Checks
Condition based triggers turn “we should look” into “we will look now, with a defined method.” The goal is to catch lubrication problems early, without drowning the team in alarms. Triggers should be tied to measurable signals, a clear action, and a defined decision window.
Trigger Foundations That Keep Decisions Consistent
Start with three building blocks: baseline, limits, and response.
-
Baseline means you know what “normal” looks like for each asset and lubricant type. For example, a gearbox running at steady load may show a slow viscosity drift over months, while a hydraulic system with frequent valve cycling may show faster oxidation.
-
Limits come in layers. Use warning limits to prompt investigation and action limits to require corrective work. A practical example is particle count: a warning level might trigger filter inspection, while an action level triggers sampling repeat and source checks.
-
Response defines what happens next. If water is detected, the response should include checking breathers, verifying seal condition, and confirming whether the next sample should be taken after a short stabilization period.
A useful rule of thumb is to avoid single-metric triggers. One odd result can happen due to sampling handling, so pair signals that support the same story.
Mind Map: Trigger Logic from Signal to Action
Condition Based Triggers Mind Map
Building a Trigger Set That Matches Asset Reality
Different systems fail differently, so triggers should reflect the lubrication path.
Bearings and grease systems: A common trigger is a rise in ferrous wear debris plus a change in grease consistency indicators (often inferred from sampling or related observations). Example: if a bearing shows increasing iron plus rising operating temperature, the response is to inspect for starvation, verify relubrication rate, and check seal integrity.
Circulating oil gearboxes: Viscosity increase can indicate oxidation or soot ingress, while viscosity decrease can indicate fuel dilution. Example: if viscosity drops and copper rises, you might suspect seal leakage or contamination from nearby systems; the follow-up is to check for cross-contamination and verify oil routing.
Hydraulic systems: Water and particle contamination often show up together. Example: if water content increases and differential pressure across filters rises, the response is to inspect breathers and confirm filtration bypass behavior.
System Health Checks That Complement Lab Results
Oil analysis is powerful, but it is not instantaneous. System health checks provide the “right now” context.
- Filter differential pressure: A rising trend suggests loading or bypass. Example: if differential pressure rises while particle counts are stable, the likely issue is filter media restriction rather than new wear.
- Pump pressure and flow: A drop can indicate suction restriction or internal leakage. Example: if flow drops and wear metals rise, starvation becomes a credible root cause.
- Reservoir level and make-up rate: Frequent make-up can indicate leaks or evaporation. Example: if level drops and water increases, check for external ingress rather than assuming simple consumption.
- Temperature and cooling performance: Overheating accelerates oxidation. Example: if oxidation indicators rise and cooling water temperature is high, the trigger response should include cooling system checks.
Decision Windows and Sampling Quality
Triggers should include a decision window so teams don’t chase noise.
- For warning limits, allow a short window for confirmation, such as one additional sample after controlled operating conditions.
- For action limits, require immediate inspection steps, not just another sample.
Sampling quality matters. If a sample is taken after maintenance, during abnormal operation, or with questionable cleanliness, treat it as “informative but not decisive.” Example: a sudden spike in particles right after a filter change can reflect disturbance rather than ongoing wear; the response is to verify sampling location cleanliness and repeat after stabilization.
Example Trigger Workflow for a Single Asset
A gearbox shows a warning level for oxidation and a moderate rise in iron.
- Confirm the baseline: compare to prior months at similar load.
- Check system health: review filter differential pressure and oil temperature logs for the same period.
- Decide: if differential pressure is rising and temperature is elevated, proceed to filter inspection and cooling verification.
- Execute: inspect for bypass behavior, check breather condition, and verify correct oil grade.
- Verify: take a follow-up sample after corrective work and stabilization, then update the baseline if the operating regime changed.
This workflow prevents the classic failure mode: reacting to a lab result without checking whether the lubrication system conditions actually support the diagnosis.
10.3 Integrating Lubrication Data into CMMS and Asset Hierarchies
Oil analysis and lubrication system data only help if they land in the same place where work is planned, approved, and closed. This section explains how to connect lab results, field observations, and automated lubrication events to your CMMS asset structure so technicians see the right information at the right time.
Foundational Alignment Between Assets and Data
Start by making sure the CMMS asset hierarchy matches how lubrication is actually applied. A gearbox may share a lubrication source with other components, and a bearing may be fed by a centralized grease pump. If the hierarchy is wrong, the CMMS will show “correct” numbers for the “wrong” equipment.
Create a mapping rule set that links each data stream to a specific CMMS asset identifier. For example, a sample label like “GBOX-3B-DRIVE” should resolve to the CMMS asset record for that gearbox, not to a generic “Gearbox” class. Then define what the data represents: oil condition, contamination level, system performance, or component health.
A practical rule: every measurement you store should answer one maintenance question. “Is oxidation progressing?” supports lubricant change decisions. “Is water present?” supports seal and ingress investigations. “Did flow drop?” supports pump and metering checks.
Data Model Choices That Prevent Confusion
CMMS fields vary, but the integration pattern is consistent. Use three layers: asset, measurement, and maintenance action.
- Asset layer: stable identifiers, location, lubrication type, and system ownership.
- Measurement layer: test results with units, method, sample date, and interpretation tags.
- Maintenance action layer: work orders, corrective actions, and closure notes.
Store measurements in a way that supports trending. If your CMMS only allows a single “current value,” you can still preserve history by using a structured attachment or a dedicated custom record per sample event. The goal is to keep the time axis intact, because lubrication problems often show up as a pattern rather than a single spike.
Mind Map: CMMS Integration Flow
Thresholds and Interpretation Tags That Technicians Can Use
Raw lab numbers are not maintenance instructions. Convert results into interpretation tags that match your task logic. Keep the tags simple and consistent across asset types.
Example tag set:
- OK: within baseline range.
- Watch: trending toward a known failure mode; schedule inspection.
- Action: likely contamination or degradation; create corrective work.
- Critical: immediate risk; prioritize containment or shutdown steps per your site rules.
To avoid “threshold whack-a-mole,” base tags on your baseline and operating context. A viscosity change on a cold-start-heavy system may look different than on steady-duty equipment. If you store operating hours, temperature band, or duty cycle in the CMMS, you can interpret results more accurately without rewriting thresholds every time conditions shift.
Example: From Sample Result to Work Order
Assume a gearbox sample returns:
- Water: 0.35% (rising)
- Particles: elevated compared to baseline
- Iron: stable but higher than last quarter
Integration steps:
- The sample event is recorded against CMMS asset “GBOX-3B-DRIVE.”
- The system applies interpretation tags: Watch for water and particles, OK for iron.
- A work order is generated for an inspection task: check breather condition, verify seal integrity, and inspect filter differential pressure.
- Technician notes are entered: breather found clogged; filter bypass indicator shows intermittent operation.
- Closure updates the evidence: the work order links to the sample record, and the next sampling interval is adjusted based on the corrected ingress path.
The key is that the CMMS record shows both the “what” (water rising) and the “why it matters” (likely ingress and filtration weakness), without forcing the technician to interpret lab jargon.
Asset Hierarchies That Support Shared Systems
Centralized lubrication systems complicate hierarchy design because multiple assets may draw from one pump, reservoir, or filtration skid. Model shared components as separate CMMS assets and link dependent assets to them.
Example:
- CMMS asset “LUBE-SKID-A” holds pump run-time, reservoir condition, and filter differential pressure.
- Dependent assets “BEARINGS-1,” “BEARINGS-2,” and “BEARINGS-3” reference the skid as their lubrication source.
When a skid alarm triggers, the CMMS can create tasks for the dependent assets automatically. When an oil analysis result is taken from a specific gearbox, it still lands on that gearbox record, but the skid record can capture the system-level context.
Data Quality Rules That Keep the System Trustworthy
Integration fails when data is inconsistent. Use a small set of rules:
- Every measurement must include sample date and units.
- Every interpretation tag must reference the threshold set used.
- Every work order closure must link to the measurement event that triggered it.
A simple audit check helps: pick one asset per month and verify that the latest sample record leads to exactly one appropriate maintenance outcome. If it doesn’t, fix the mapping or the threshold logic, not the technician’s patience.
Mind Map: Technician View and Closure
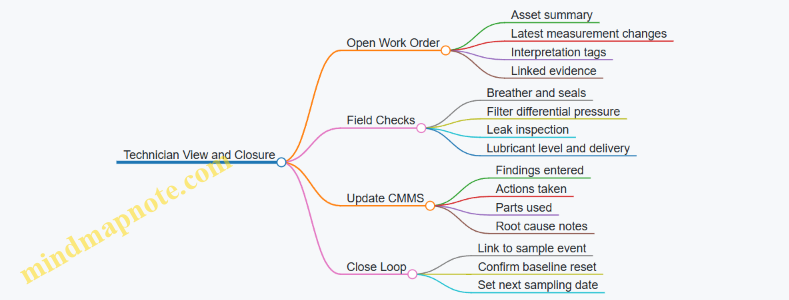
Example: Grease Delivery Event Integration
For automated grease systems, treat delivery events like measurements. If the controller logs “flow confirmation failed” for a bearing station, store that event against the bearing asset record and create an inspection task.
Example outcome:
- Event recorded: “Station 7 flow low”
- CMMS creates task: inspect metering device and check line blockage
- Technician finds partially blocked nozzle
- Closure notes include the nozzle replacement and the next scheduled flow verification
This approach keeps lubrication system reliability from living only in controller logs, where it is easy to miss when planning the next round of work.
Summary of the Integration Logic
Integrating lubrication data into CMMS and asset hierarchies is a three-part discipline: map measurements to the correct asset, convert results into consistent interpretation tags, and connect triggers to work orders with evidence links. When those pieces fit, technicians get actionable context instead of a spreadsheet scavenger hunt.
10.4 Standard Work Instructions for Sampling and Lubricant Handling
A good sampling instruction does two things: it prevents the sample from being “invented” by the process, and it makes the resulting numbers usable for decisions. The work instruction should therefore cover who does what, where the sample comes from, how it is collected, how it is labeled, and how it is stored until analysis.
Purpose and Scope
This instruction applies to oil and grease sampling for bearings, gearboxes, hydraulic systems, and circulating oil loops. It covers routine samples, event-driven samples after maintenance, and verification samples after corrective actions. If a system has both online monitoring and lab sampling, the instruction must state which measurements are taken by which method to avoid duplicate or conflicting data.
Roles and Responsibilities
Assign a sampler role and a reviewer role. The sampler performs collection, labeling, and chain-of-custody documentation. The reviewer validates completeness, checks for obvious contamination risks, and confirms the sample matches the asset and sampling point.
Safety and System Preparation
Before sampling, confirm the system is in a safe state: depressurized where required, locked out when accessing internal ports, and protected from hot surfaces. For oil systems, allow the oil to reach a stable temperature if the procedure requires it, because viscosity and water content can shift with temperature. If the system is running, specify whether the sample is taken during steady operation or after a defined settling period.
Sampling Point Selection and Verification
Use the designated sampling port or thief hatch. If the port is shared with other tasks, clean the exterior around the port to reduce the chance of introducing dirt. For each sampling point, define:
- Expected fluid type and grade
- Expected flow condition (static sump vs. circulating line)
- Whether flushing is required before collection
- Typical sample volume
A simple rule keeps teams consistent: if the sampling point is not the one listed for that asset, the sample is not “wrong,” but it is not comparable, so it must be flagged.
Sampling Method for Oil
- Pre-clean and purge: If the instruction requires purging, discard the first portion to remove stagnant oil from the port. Use a measured discard volume so the purge is repeatable.
- Collect without splashing: Fill the container smoothly to minimize air entrainment and reduce oxidation during handling.
- Avoid headspace contamination: Keep the container cap ready, close immediately after filling, and wipe the outside if it is wet.
- Mixing for representative samples: For systems with stratification risk, specify whether to mix the sump (by circulation or agitation) before sampling.
Example: A gearbox sump sample taken from a port that has sat overnight may show higher water and oxidation than a sample taken after circulation. The instruction should either standardize the timing or standardize the purge volume so the comparison stays fair.
Sampling Method for Grease
Grease sampling needs extra care because it can trap water and debris in pockets.
- Use a clean sampling tool dedicated to that grease type.
- Take grease from the specified location, not from the first visible surface.
- If the instruction requires it, discard the first small amount to remove material that has been exposed to ambient contamination.
- Seal the container tightly and label clearly as grease, not oil.
Example: Overgreased bearings often show grease with mixed consistency. If the instruction always samples from the same side of the bearing housing and uses the same discard step, the lab results become comparable across months.
Container, Labeling, and Chain of Custody
Label immediately at the point of collection. The label must include asset ID, sampling point ID, date, sampler initials, fluid type, and whether the sample is routine or event-driven. Record the operating hours or runtime since last sample, and note any maintenance performed since the last sample.
Chain-of-custody should be a simple checklist that travels with the sample. If multiple people touch the sample, each sign-off should be captured.
Handling, Storage, and Transport
Store samples according to the lab’s requirements for temperature and light exposure. Keep containers upright to prevent leaks and avoid freezing if the lab requires intact water phase behavior. Transport samples promptly and protect them from vibration and temperature swings.
Example: A sample left in a hot vehicle for hours can show viscosity shift and accelerated oxidation. The instruction should therefore specify a maximum transport time and a storage location at the site.
Quality Checks and Common Failure Modes
Include a short section that tells samplers what “bad” looks like:
- Missing label or mismatched asset ID
- Container not sealed or leaking
- Sample taken from an incorrect port
- Evidence of external contamination such as visible dirt or water droplets
When any of these occur, the reviewer should decide whether to reject the sample or accept it with a documented qualifier.
Documentation and Work Order Integration
After collection, complete the sampling record and attach it to the relevant work order or CMMS entry. The instruction should specify which fields are mandatory for the lab request: asset ID, sampling point, fluid type, and any special notes such as filter change, top-up, or system flush.
Mind Map: Sampling and Lubricant Handling Work Instruction
Example: Routine Oil Sample with Purge Requirement
- Confirm the gearbox is running at steady load.
- Clean the sampling port exterior.
- Purge a measured discard volume into a waste container.
- Collect the required volume into a pre-labeled container.
- Seal, wipe exterior, and complete the chain-of-custody checklist.
- Store upright in the designated sample box until transport.
Example: Event-Driven Grease Sample After Relubrication
- Sample from the specified housing location after the relubrication cycle completes.
- Discard the first small amount if the instruction requires it.
- Seal and label as grease with the event flag.
- Record the relubrication date, grease grade used, and approximate quantity added.
- Transport promptly and store per the lab’s grease handling rules.
A consistent instruction turns sampling from a “task” into a measurement system. When the steps are repeatable, the lab results become evidence rather than a guess, and maintenance decisions can be made with fewer surprises.
10.5 Auditing Compliance and Closing the Loop on Findings
Auditing lubrication and oil analysis work is not about catching people doing things wrong. It’s about proving the system is controlled: the right assets get the right tasks, samples are taken the same way every time, results are interpreted consistently, and actions actually reduce the risk of failure. A good audit ends with closed actions, not open-ended “we’ll look into it.”
Audit Scope and Control Points
Start with the control points that determine whether the program works. Typical control points include sampling discipline, chain of custody, test method selection, data interpretation rules, work order creation, and verification of corrective actions.
A practical way to define scope is to list the asset types in your program (bearings, gearboxes, hydraulics, compressors) and map each to the lubrication system type (oil sump, circulating, kidney loop, grease central, automated metering). Then select a small set of representative assets per type for audit sampling. For example, audit one high-load gearbox, one gearbox with frequent filter bypass events, one grease system on a dusty area, and one hydraulic circuit with recurring water alarms.
Evidence Collection That Actually Holds Up
Audits fail when evidence is vague. Use evidence that can be traced from trigger to outcome.
- Sampling evidence: photo of sampling point, sampler ID, date/time, sample container condition, and any deviations.
- Laboratory evidence: test panel used, method identifiers, instrument batch references if available, and any reported anomalies.
- Interpretation evidence: the rule set or decision logic used to classify results, plus the rationale for any exceptions.
- Action evidence: work order number, task description, parts used, lubricant/grease batch IDs, and completion notes.
- Verification evidence: follow-up sampling results or system health metrics taken after the action window.
Example: If a gearbox shows rising water content, the audit should confirm that the action addressed the likely ingress path (breather condition, seal leakage, cooler bypass, or condensation conditions) and that the follow-up sample shows the expected direction of change.
Mind Map: Compliance and Closing the Loop
Severity, Ownership, and Action Types
Not every deviation is equal. Classify findings by impact on safety, environmental risk, and likelihood of equipment damage.
- Corrective actions fix the immediate issue. Example: replace a damaged sampling valve and re-train the sampler on container handling.
- Preventive actions stop recurrence. Example: add a checklist step that verifies sampling valve condition before sampling, and require a supervisor sign-off for the first two samples after maintenance.
Assign ownership to the role that can change the process, not just the role that noticed the problem. If sampling errors repeat, the owner might be the lubrication coordinator or the training lead, not the technician who collected the sample.
Closing the Loop with Verification, Not Hope
A finding is “closed” only when verification evidence supports it. Use a simple verification rule: the follow-up data must show the expected improvement, or the action must be re-scoped with documented rationale.
Example workflow:
- Audit finds inconsistent sampling depth on a bearing housing.
- Corrective action: update the sampling procedure and mark the correct insertion depth.
- Preventive action: add a physical depth stop on the sampling tool and include a photo check in the work instruction.
- Verification: compare the next two samples’ particle counts and water readings against the baseline range for that asset class.
- Closure: if results stabilize and deviations drop, close the finding; if not, reopen with a new root cause focus.
Audit Outputs and Standard Updates
The final deliverable should be structured so it can drive process improvement.
- Finding statement: what happened, where, and how often.
- Evidence summary: which records and observations support it.
- Risk rationale: why it matters for lubrication reliability.
- Action plan: corrective and preventive actions with owners.
- Verification plan: what data will confirm effectiveness.
- Process updates: changes to work instructions, sampling kits, training content, or interpretation rules.
When standards change, update the interpretation logic used in work order triggers. Otherwise, the audit fixes the past but the system keeps repeating the same mistake—like a filter bypass valve that’s “temporarily” stuck open for months.
11. Failure Mode Engineering for Lubrication Related Defects
11.1 Bearing Failures Linked to Starvation Overgreasing and Contamination
Bearings fail when the lubricant film cannot do its job. Three common causes—starvation, overgreasing, and contamination—often show up together, because the same operating conditions that reduce supply also increase the chance that dirt and water get into the bearing. The goal is to connect symptoms to mechanisms, then to practical checks.
Core Mechanisms and What They Look Like
Starvation means the bearing does not receive enough lubricant to maintain a stable film. In oil systems it can be low flow or low level; in grease systems it can be insufficient relubrication, blocked passages, or grease that never reaches the contact. The result is higher friction, localized heat, and accelerated wear. A common clue is uneven wear patterns or early roughness that appears before other components show problems.
Overgreasing sounds like the opposite of starvation, but too much grease can still starve the contact. Excess grease can churn, raise temperature, and push lubricant out of the bearing. It can also force grease past seals, where it mixes with contaminants and becomes abrasive. A common clue is grease leakage, seal damage, or elevated bearing temperature that correlates with relubrication changes.
Contamination introduces particles or water that disrupt the film. Particles act like tiny cutting tools, increasing wear and creating a higher debris load that further accelerates failure. Water reduces film strength and can promote corrosion, especially when seals or breathers allow moisture ingress. A common clue is abnormal wear metals in oil analysis, or in grease systems, hardened grease and visible grit at inspection.
Mind Map: Failure Path from Lubrication Condition to Bearing Damage
Systematic Diagnostic Flow with Easy Examples
-
Confirm the lubrication mode and expected delivery.
- Example: A gearbox uses circulating oil, but the sight glass shows the level near the low mark after shutdown. Restarting without correcting level can starve bearings during ramp-up.
-
Check for starvation indicators before blaming the bearing.
- Example: A grease-lubricated fan bearing is relubricated every 90 days. After a belt replacement increases speed, the same interval may no longer supply enough grease. The bearing runs hotter and develops early surface distress.
-
Check for overgreasing indicators tied to maintenance actions.
- Example: After a technician “tops up” grease because the previous amount looked low, the bearing temperature rises within days and grease exits the seal. The contact may be losing grease due to churning and seal purge.
-
Verify contamination sources using the simplest evidence available.
- Example: During grease filling, the grease gun is stored on a dirty floor. The first few pumps introduce grit. Even if the quantity is correct, abrasive particles accelerate wear.
-
Use wear pattern logic to separate mechanisms.
- Example: If you see pitting with signs of corrosion, contamination and water are likely contributors. If you see smeared or scored surfaces without obvious corrosion, starvation and film breakdown are more likely.
Practical Control Measures That Prevent All Three
For starvation:
- Ensure supply paths are clear and relubrication intervals match actual operating conditions (speed, load, duty cycle). A simple check is to compare grease consumption rate against the planned interval; if consumption drops after a change, supply may be blocked.
For overgreasing:
- Use quantity control rather than “more is better.” If grease is leaking from seals, reduce quantity or frequency and confirm that the bearing still receives fresh lubricant. A useful rule of thumb in practice is to treat seal purge as a warning sign, not a success.
For contamination:
- Control ingress points: keep breathers functioning, protect fill openings, and standardize clean handling. For grease, use clean transfer methods and avoid reusing containers that may have collected dust.
Case Example: Grease-Lubricated Bearing with Rising Temperature
A conveyor bearing shows rising temperature after a maintenance window. The grease gun was used to add extra grease because the previous grease appearance looked “dry.” Inspection finds grease at the seal lip and hardened residue mixed with fine grit. The likely chain is overgreasing causing seal purge, which then carries contaminants into the bearing. The corrective action is to reduce relubrication quantity, clean the grease delivery path, and improve handling cleanliness so the next fill does not introduce particles. After the change, temperature stabilizes and the bearing shows slower wear progression.
Quick Checklist for Work Orders
- Confirm lubricant type and delivery method match the asset specification.
- Verify relubrication interval and quantity against current speed and load.
- Look for seal purge, leakage, and hardened grease residue.
- Check for contamination entry points like breathers and fill procedures.
- Record what changed during the maintenance window so the timeline is usable later.
11.2 Gear Wear Mechanisms and Lubricant Film Strength Requirements
Gear wear is mostly a story about whether the lubricant can keep metal surfaces separated under load. When the film is thick enough, asperities meet less often and wear slows down. When it is too thin, contact shifts toward boundary and mixed lubrication, and wear accelerates.
Gear Contact Basics That Drive Wear
A gear tooth pair experiences sliding and rolling at the same time. The sliding component changes across the tooth profile, which means film thickness and traction conditions vary along the contact path. Under higher load, the contact zone becomes more stressed, and the lubricant must withstand higher pressure and shear.
Two practical consequences follow. First, wear is not uniform across the tooth; it often concentrates where the film is thinnest. Second, the same lubricant can behave differently in different gearboxes because speed, load, temperature, and contamination all change the effective film.
Lubricant Film Strength Requirements
Film strength is the lubricant’s ability to maintain a protective layer under pressure and shear. In practice, you manage it through viscosity selection, viscosity stability, and additive performance.
Viscosity and Viscosity Index. Higher viscosity at operating temperature generally increases film thickness, but too much viscosity raises churning losses and temperature, which can reduce viscosity anyway. A useful rule of thumb is to select a grade that keeps the oil in the intended viscosity range at the measured sump temperature, not just at ambient.
Additive Chemistry for Extreme Pressure. Gear oils include additives that form protective films when surfaces approach each other. These films are not permanent coatings; they are activated during high stress and help prevent scuffing and rapid surface damage.
Shear Stability. If the oil shears down, viscosity drops and film thickness shrinks. This is especially relevant in gearboxes with high shear rates or long service intervals.
Wear Mechanisms Linked to Film Breakdown
When film strength is insufficient, several wear mechanisms show up.
Scuffing. Scuffing is a surface damage mode where localized welding and tearing occur due to extreme contact stress. It often appears as scoring or smeared areas on tooth flanks. A common trigger is a combination of high load, high temperature, and inadequate extreme-pressure protection.
Pitting. Pitting is fatigue-related surface damage driven by repeated stress cycles. If the lubricant film is too thin, microcontacts increase and fatigue cracks initiate more easily. Pitting patterns often correlate with pitch line stress and lubrication conditions.
Abrasive Wear. Particles can act like tiny cutting tools when they enter the contact. Even a strong oil film can be overwhelmed if contamination is high, because particles can prevent full separation and increase local stress.
Micropitting. Micropitting is a smaller-scale precursor to pitting. It can be subtle early on, showing up as roughness that later evolves. It often indicates marginal film conditions, not necessarily catastrophic scuffing.
How to Connect Oil Analysis to Gear Wear
Oil analysis provides evidence, but it needs interpretation tied to gear contact conditions.
Wear Metals and Their Meaning. Iron and steel wear typically indicate gear tooth and bearing contributions. If iron rises alongside copper or bronze, it can suggest mixed wear sources such as bushings or bearings. For gear-focused diagnosis, compare trends to known operating changes like load shifts or temperature changes.
Particle Trends and Filter Behavior. Increasing particle counts with stable viscosity can point to contamination ingress or poor filtration performance. If particles rise while wear metals also rise, the gearbox is likely experiencing more frequent mixed lubrication events.
Viscosity Shift and Oxidation. Viscosity reduction supports the idea of film thinning. Oxidation and additive depletion can reduce both viscosity stability and protective film effectiveness, raising the likelihood of scuffing or fatigue wear.
Mind Map: Gear Wear and Film Strength
Example: Diagnosing Marginal Film Leading to Micropitting
A plant reports rising iron wear and a slight increase in particle counts. Viscosity at test time is lower than the established baseline, and sump temperature has been running higher due to a partially blocked cooler.
A systematic interpretation goes like this:
- Higher temperature reduces viscosity, thinning the film.
- Thinner film increases mixed lubrication at the tooth contact.
- Mixed lubrication raises microcontact frequency, which supports micropitting initiation.
- Particle counts rising suggests either contamination ingress during maintenance or filter bypass behavior, which further worsens mixed contact.
A practical corrective sequence is to restore cooling performance, confirm the correct oil grade and top-up practices, and verify filtration integrity. After changes, trending should show viscosity stabilizing and wear metals slowing.
Example: Scuffing Risk from Additive Depletion
Another gearbox shows sudden scoring on tooth flanks after a period of heavy load. Oil analysis shows viscosity within range but elevated wear metals and signs consistent with additive depletion.
This points to a different failure mode than viscosity-only film loss:
- The oil still has enough viscosity to form a film, but the extreme-pressure protective layer is not performing as intended.
- High load increases contact stress, so the additive film must activate reliably.
The corrective actions focus on confirming oil condition against the expected service interval, checking for wrong oil grade or contamination that can interfere with additive performance, and reviewing operating conditions that push load beyond the design assumptions.
11.3 Seal Failures Linked to Pressure Temperature and Compatibility
Seals fail when the contact conditions stop matching the seal’s design assumptions. In lubrication systems, the three most common drivers are pressure, temperature, and chemical compatibility. Each one changes how the seal material behaves at the sealing interface, and the failure often shows up as a leak that looks “sudden” even though the damage accumulated quietly.
Pressure Effects on Seal Behavior
Pressure affects seals in two ways: it increases the force squeezing the seal against the mating surfaces, and it increases the tendency for fluid to be forced past any micro-paths.
Start with the basics of contact. A lip seal or O-ring relies on controlled deformation to maintain a tight contact patch. If system pressure rises above the seal’s rating, the seal can extrude into clearances. That extrusion creates a permanent shape change, which then reduces contact pressure during normal operation. The leak path grows because the seal no longer returns to its original geometry.
Easy example: A gearbox breather is clogged, so pressure builds during warm-up. The seal sees higher differential pressure than expected. After a few cycles, you notice oil weeping around the shaft. The root cause is not “bad seals,” it’s pressure that exceeded the design envelope.
Pressure also interacts with installation. If a seal is installed with a damaged lip or nicked O-ring, higher pressure will push fluid through the defect faster. The same defect at lower pressure might only cause a slow seep.
Temperature Effects on Seal Behavior
Temperature changes both material properties and clearances. As temperature rises, elastomers soften, which can increase leakage if the seal loses its ability to maintain contact. As temperature drops, elastomers can harden and crack, especially if they experience repeated thermal cycling.
A practical way to think about it: seals must stay within a temperature range where the material remains elastic and chemically stable. Outside that range, the seal’s modulus shifts, so the contact pressure at the interface changes.
Easy example: A hydraulic system runs hotter than normal because filtration is bypassing or a cooler is underperforming. The seal lip becomes less resilient, and the leak rate increases even though shaft speed and alignment are unchanged. When the system cools, the leak may slow, but the seal has already been worn by the altered contact conditions.
Temperature also affects swelling. Some fluids cause elastomers to absorb components, and the swelling rate often increases with temperature. That swelling can tighten the seal against the shaft, but it can also distort the seal shape and stress the sealing lip.
Compatibility Effects on Seal Material and Fluid
Compatibility is the chemical match between the seal elastomer and the lubricant or hydraulic fluid. Compatibility problems show up as swelling, shrinkage, hardening, softening, or surface cracking. The key is that “oil type” is not enough; formulation matters, including additive packages.
Easy example: A plant switches from one hydraulic fluid to another with a different additive system. The seals were fine for months, then begin to leak. The new fluid may be compatible with metal surfaces but still aggressive to the elastomer, causing gradual property loss.
Compatibility failures often begin at the seal’s exposed surfaces. The seal may look intact externally while the elastomer near the interface loses strength. Over time, the lip edge becomes rounded or brittle, and the leak path forms.
Integrated Failure Mechanisms and How They Combine
In real systems, pressure and temperature rarely act alone. Pressure accelerates the consequences of compatibility damage by forcing fluid through weakened regions. Temperature accelerates chemical reactions and changes elastomer modulus.
A common chain looks like this:
- Elevated temperature softens the elastomer.
- The fluid chemistry swells or extracts components.
- The seal loses its designed contact geometry.
- Higher pressure forces fluid past the degraded interface.
This is why two assets with the same seal part number can behave differently: one may run hotter, or one may use a fluid with a different additive balance.
Mind Map: Seal Failures Driven by Pressure Temperature and Compatibility
Example: Turning Observations into a Root Cause
Suppose a pump shows oil leakage at a shaft seal after a maintenance outage. The seal was replaced with the correct part number, yet the leak returns after a week.
Use a systematic check:
- Verify pressure conditions: confirm the breather is clear and no downstream restriction exists.
- Verify temperature: compare operating temperature to the seal’s allowable range and check cooler performance.
- Verify compatibility: confirm the lubricant brand and specification match the seal elastomer requirement, not just the viscosity grade.
- Inspect the seal: look for extrusion marks (pressure), lip rounding or softening (temperature), and surface swelling or cracking (compatibility).
If pressure is high, the seal may extrude even if chemistry is correct. If temperature is high, the seal may lose elasticity and leak even at normal pressure. If compatibility is wrong, the seal may degrade internally while still appearing “new” at installation.
The goal is not to guess which factor is guilty first; it’s to test the assumptions that connect pressure, temperature, and fluid chemistry to the seal’s contact behavior.
11.4 Pump and Metering Failures in Automated Systems
Automated lubrication depends on two quiet heroes: the pump that moves lubricant and the metering device that decides how much gets delivered. When either one misbehaves, the system can look “alive” while quietly starving bearings, overfeeding seals, or sending the wrong lubricant to the wrong place.
Foundations of Pump and Metering Behavior
A pump’s job is to create flow under pressure. Metering’s job is to convert that flow into a repeatable dose. In practice, failures often come from mismatches between what the system is designed to do and what the lubricant, temperature, and contamination are actually doing.
Start with three baseline checks that prevent most confusion:
- Pressure stability: If pressure fluctuates, metering accuracy usually suffers.
- Flow path integrity: Leaks and blocked lines change the delivered quantity.
- Lubricant condition: Viscosity changes with temperature, and water or particles change how components wear.
A simple example: a centralized grease system runs fine during commissioning, then later delivers less grease to far-end points. The pump may still cycle, but line resistance increases as viscosity rises or as a line partially clogs. The metering device then “thinks” it delivered its dose, while the far-end actually receives less.
Common Failure Modes in Pumps
-
Air entrainment and cavitation
- What happens: Air compresses, so the pump moves “nothing” effectively. Cavitation can also damage internal surfaces.
- Why it matters: Dose timing becomes inconsistent, and wear accelerates.
- Example: After a reservoir refill, the suction line is not fully primed. The pump cycles, but the first few cycles deliver poor flow until air clears.
-
Wear and internal leakage
- What happens: Clearances grow, so some lubricant bypasses the intended pressure zone.
- Why it matters: The pump may maintain pressure briefly, then gradually lose effective delivery.
- Example: A piston pump runs for years. Over time, internal leakage increases, so the system still reaches set pressure but the delivered volume per cycle drops.
-
Incorrect pump sizing or control strategy
- What happens: The pump cannot overcome peak line pressure, or the controller stops early.
- Why it matters: Metering devices may receive insufficient flow during the dosing window.
- Example: A system designed for moderate viscosity grease is later used with a higher-viscosity grade. The pump reaches the controller’s pressure limit sooner, cutting off dosing.
-
Contamination-related sticking
- What happens: Particles or degraded additives cause valves, check mechanisms, or plungers to stick.
- Why it matters: Delivery becomes intermittent.
- Example: A filter bypassed during maintenance allows debris into the pump head. One check valve sticks closed, starving one branch while others still work.
Common Failure Modes in Metering Devices
-
Metering drift from temperature and viscosity
- What happens: The device’s effective displacement changes with lubricant viscosity and seal behavior.
- Why it matters: The same cycle command yields different delivered mass.
- Example: A metering pump calibrated at 25°C delivers less at 5°C because flow resistance increases and seals behave differently.
-
Seal degradation and bypass
- What happens: Worn seals allow bypass flow, reducing the actual dose.
- Why it matters: The system may show normal pressure but under-deliver.
- Example: A metering unit near a heat source experiences faster seal aging. It still cycles, but the bearing sees a smaller dose.
-
Blocked outlet or check valve issues
- What happens: A clogged outlet or stuck check valve prevents the metered dose from reaching the target.
- Why it matters: The system can “use up” doses locally, then stop delivering downstream.
- Example: A single fitting is assembled with a damaged ferrule. The line partially blocks, and the metering device repeatedly pushes lubricant into the restriction.
-
Incorrect dosing logic and feedback assumptions
- What happens: Controllers assume flow or pressure feedback that is not actually present or not reliable.
- Why it matters: The system can declare success while delivery is failing.
- Example: A controller uses a pressure switch that trips due to pump discharge pressure, even though the branch line is blocked.
Mind Map: Pump and Metering Failure Logic
Integrated Example: From Symptom to Root Cause
A plant reports that a set of bearings on a long branch line are running hotter. The automated system logs normal pump cycling.
- Compare consumption vs. expected dose: If the reservoir consumption is lower than expected, under-delivery is likely.
- Check pressure behavior during dosing: A pressure trace that reaches the controller limit early suggests the pump cannot maintain flow through line resistance.
- Inspect the branch line and metering unit: A partially blocked outlet or a check valve that sticks can cause the metered dose to fail to reach the bearing.
- Validate lubricant condition: If the lubricant grade was changed or the system runs colder than before, viscosity can increase line resistance and reduce delivered mass.
The fix is usually not “replace everything.” It is targeted: restore filtration integrity, verify priming, confirm metering calibration at the operating temperature, and repair the specific restriction or sticking component.
Practical Diagnostic Checklist
- Confirm priming and absence of air in suction lines.
- Review pressure traces during dosing windows.
- Verify filter differential pressure and whether bypass occurred.
- Compare reservoir consumption to expected total dosing.
- Inspect metering units and check valves on the worst-performing branch.
- Validate lubricant grade and temperature conditions against calibration assumptions.
When pump and metering failures are treated as a system—fluid condition, mechanical delivery, and control logic together—maintenance becomes precise instead of guessy. The pump may be cycling, but the bearing still needs the right dose, at the right time, through the right path.
11.5 Root Cause Documentation Using Evidence Based Investigation Steps
A good root cause write-up is not a story about what you wish happened. It is a structured record of what you observed, what you ruled out, and why the remaining explanation fits the evidence. The goal is to produce a decision-quality document that another technician can follow without guessing.
Step 1: Lock the Problem Statement and Boundaries
Start with a precise statement that includes the asset, system, and failure mode. Example: “Centrifugal pump bearing overheating on Line 3, occurring during steady-state operation after 6–8 weeks.” Add boundaries: time window, operating conditions, and what is not included (for example, “not observed during start-up”). This prevents the investigation from turning into a general “lubrication is bad” complaint.
Step 2: Collect Evidence with Provenance
Evidence must include where it came from and how it was handled. Create a simple evidence log with fields: source, date collected, method, and acceptance criteria. For oil analysis, record sample location, sampling method, and whether the sample was taken at the same operating state each time. For automated lubrication, capture controller logs such as pump run times, fault codes, and dispense counts.
Concrete example: If wear metals spiked, note whether the sample coincided with filter bypass events or a change in oil supplier batch. If the controller shows a “low reservoir” alarm, record the alarm timestamp and compare it to the oil analysis sampling timestamp.
Step 3: Build a Timeline That Connects Events
Make a single chronological timeline that includes maintenance actions, lubrication system changes, filter element replacements, and operating anomalies. A timeline is where many investigations become coherent: you can see whether the failure started after a specific intervention or whether it developed gradually.
Example timeline fragments:
- 2026-03-05: Filter element replaced.
- 2026-03-18: Differential pressure indicator shows repeated high readings.
- 2026-03-22: Oil analysis shows viscosity increase and particle count rise.
- 2026-03-28: Bearing temperature trend crosses alarm threshold.
Step 4: Identify Candidate Causes Using Mechanism Logic
Candidate causes should map to plausible mechanisms. For lubrication-related defects, common mechanisms include starvation, overgreasing, contamination ingress, lubricant degradation, seal leakage, and incorrect lubricant selection.
Use evidence to narrow candidates:
- If particle counts rise while water indicators also rise, contamination ingress is a strong candidate.
- If wear metals increase without a particle surge, consider abnormal lubrication film conditions or misalignment rather than general dirt.
- If automated lubrication logs show reduced dispense frequency, starvation becomes a leading candidate.
Step 5: Test Each Candidate with Focused Checks
Each candidate cause needs at least one check that could confirm or falsify it. Checks should be practical and tied to the mechanism.
Example checks:
- Starvation: verify pump pressure/flow at the metering device, confirm line blockages, and compare dispense counts to expected cycles.
- Contamination ingress: inspect breathers, reservoir seals, and filter bypass behavior; confirm whether water appears after heavy washdown events.
- Degradation: review oxidation indicators and viscosity trend slope; confirm operating temperature and cooling performance.
Step 6: Use Contradiction to Eliminate Weak Explanations
Contradiction is your friend when used carefully. If a candidate cause predicts a specific evidence pattern that is absent, document the mismatch.
Example: If overgreasing is suspected, you would expect evidence such as grease churn, seal extrusion, or elevated churning torque. If none are present and the controller shows correct dispense volume, overgreasing is less likely.
Step 7: Write the Root Cause Statement and Supporting Evidence
A strong root cause statement is specific and mechanism-based. Structure it as: “Because [mechanism], [symptom] occurred, evidenced by [key observations].” Keep it short enough to fit on a work order summary.
Example root cause statement:
“Bearing overheating occurred because the automated lubrication system intermittently delivered reduced grease volume due to a metering device sticking at low reservoir pressure, evidenced by controller dispense counts dropping below expected values and grease delivery verification showing under-dispense during the same period as rising bearing temperature.”
Step 8: Document Contributing Factors and System Gaps
Contributing factors explain why the root cause persisted. System gaps explain why detection was delayed. Examples: sampling frequency too low for early detection, no verification test after commissioning, or missing alarm thresholds for low reservoir pressure.
Step 9: Define Corrective Actions and Verification Criteria
Corrective actions must directly address the mechanism. Verification criteria must be measurable.
Example corrective actions:
- Replace or service the metering device and add a periodic flow verification step.
- Adjust controller alarm thresholds for low reservoir pressure and add an operator alert workflow.
- Update sampling instructions to ensure consistent operating state.
Verification criteria example:
“Within 30 days, dispense counts remain within ±10% of expected values and bearing temperature trend stays below alarm threshold with no recurrence of under-dispense events.”
Step 10: Close the Loop with Evidence of Effect
After actions, record the outcome using the same evidence categories as the investigation. If the problem returns, the documentation should make it clear whether the root cause was wrong or whether the corrective action was incomplete.
Mind Map: Evidence Based Root Cause Documentation Steps
Example: Evidence Log and Decision Notes
Use a compact evidence log so the final write-up stays grounded.
| Evidence Item | Source | Method | Key Result | Decision Use |
|---|---|---|---|---|
| Dispense counts | Controller logs | Automated lubrication audit | Counts dropped 25% during week of overheating | Supports starvation mechanism |
| Particle count | Oil analysis | Particle counting | Particle count increased before temperature alarm | Supports contamination or filter bypass |
| Differential pressure | Filter indicator | Field readings | Repeated high readings with bypass events | Links to contamination pathway |
| Water indicator | Oil analysis | Water detection | Water present after washdown | Identifies ingress trigger |
This format makes it easy to show why the selected root cause fits the evidence better than the alternatives.
12. Practical Implementation Guide for Extending Machinery Lifecycles
12.1 Asset Criticality Ranking for Lubrication and Oil Analysis Coverage
A lubrication and oil analysis program works best when it focuses effort where it matters most. Asset criticality ranking is the method for deciding which machines get tighter sampling, more frequent tests, and faster maintenance response. The goal is not to treat every asset equally; it is to match coverage to risk, consequences, and the likelihood that lubrication or contamination issues will show up in measurable oil changes.
Stepwise Method for Ranking
1) Define the Consequences of Failure
List what “bad” looks like for each asset. Use consistent categories so the ranking stays comparable across departments.
- Safety impact: potential injury from sudden loss of containment, fire risk, or rotating equipment hazards.
- Environmental impact: spills, leaks, or toxic fluid release.
- Production impact: downtime cost, throughput loss, and restart complexity.
- Asset damage cost: likelihood of collateral damage to gears, bearings, seals, or adjacent systems.
- Repair time and availability: whether spares and skilled labor are readily available.
Example: A gearbox driving a continuous conveyor may have high production impact, even if the gearbox itself is not the most expensive component.
2) Estimate Lubrication-Related Failure Likelihood
Not every asset suffers from the same lubrication problems. Score how likely lubrication or contamination issues are based on design and operating conditions.
- Lubrication system type: oil circulation, grease centralized, oil mist, or splash.
- Contamination exposure: water ingress risk, airborne dust, process leaks, or poor sealing.
- Operating severity: speed, load, temperature, start-stop cycles, and duty variability.
- Evidence of past issues: recurring filter bypass events, frequent seal leaks, or repeated bearing failures.
Example: A pump in a wet area with frequent seal weeping deserves higher likelihood scoring than a sealed bearing in a clean enclosure.
3) Determine Detectability Through Oil Analysis
Criticality also depends on whether oil analysis can actually catch the problem early enough.
- Oil sampling feasibility: accessible sampling points, safe sampling procedures, and representative locations.
- Signal strength: whether wear debris and contaminants reliably enter the oil stream.
- Test coverage fit: whether the planned tests can measure the relevant failure mechanisms.
Example: For a gearbox with good circulation and filtration, elemental wear trends and particle counts can be meaningful. For a poorly mixed sump with stagnant zones, the same tests may show delayed or diluted signals.
4) Combine Scores into a Practical Ranking
Use a simple scoring model that produces a clear ordering without pretending precision. A common approach is a weighted score:
- Consequence score (0–5)
- Likelihood score (0–5)
- Detectability score (0–5)
Then compute a single priority value using weights that match your organization’s emphasis. If safety is paramount, increase consequence weight. If sampling access is limited, reduce detectability weight.
Example: An asset with high consequence but low detectability may still be top priority, but it may require improved sampling points or system modifications before relying on oil analysis alone.
Mind Map: Criticality Ranking
Coverage Tiers That Map to Real Work
Define tiers so the ranking directly changes actions. A tier should specify sampling frequency, test panel depth, and response expectations.
-
Tier 1: highest consequence and credible detectability
- More frequent sampling (for example monthly or per operating hours)
- Broader test panel including oxidation, water, particle metrics, and wear trends
- Faster maintenance response when thresholds are crossed
-
Tier 2: moderate consequence or partial detectability
- Sampling less frequent (for example quarterly)
- Focused panel based on dominant failure mechanisms
- Response aligned to trend direction rather than single-point anomalies
-
Tier 3: lower consequence or limited oil relevance
- Minimal sampling (for example semiannual)
- Basic checks that confirm lubricant condition and contamination control
- Emphasis on inspection and system housekeeping rather than heavy lab testing
Example: A low-load auxiliary fan gearbox may land in Tier 3 if downtime is minor and oil analysis signals are weak. A high-load main drive gearbox with reliable sampling points becomes Tier 1.
Practical Example Using a Simple Asset Set
Consider three assets: a main drive gearbox, a hydraulic power unit, and a small grease-lubricated motor bearing.
-
Main drive gearbox
- Consequence: high due to long restart and production loss
- Likelihood: high because of load and temperature cycling
- Detectability: high because oil is circulated and sampling points exist
- Result: Tier 1 with frequent sampling and a wear-plus-contamination panel
-
Hydraulic power unit
- Consequence: medium to high due to system-wide control impacts
- Likelihood: medium because contamination control exists but water ingress is possible
- Detectability: medium because mixing and filtration may delay signals
- Result: Tier 2 with targeted water and particle monitoring plus oxidation checks
-
Grease-lubricated motor bearing
- Consequence: low to medium because downtime is short
- Likelihood: medium because seals and relubrication practices vary
- Detectability: low for oil analysis because there is no bulk oil stream
- Result: Tier 3 where the “coverage” shifts toward grease application discipline and inspection-based evidence
Evidence Trail and Review Cadence
A ranking is only useful if it stays consistent with reality. Keep a short record for each asset: the scores, the chosen tier, the reasoning for detectability, and the planned sampling/test panel. Review the ranking when major changes occur, such as lubricant change, filtration upgrades, seal replacement, or a shift in operating duty.
A good ranking makes the program easier to run: technicians know what to test, lab results have a clear meaning, and maintenance actions have a defined trigger. It also prevents the common failure mode of “testing everything, fixing nothing.”
12.2 Building a Lubrication Standards Library for Oils Greases and Systems
A lubrication standards library is the place where “what good looks like” becomes repeatable. It prevents the classic problem of every site, shift, and contractor reinventing the same decisions with slightly different answers. The library should cover oils, greases, and the systems that deliver them, and it should connect lubricant choice to operating conditions and to what oil analysis and system checks will later confirm.
Define Scope and Ownership
Start by listing the asset types that matter most: bearings, gearboxes, hydraulic systems, compressors, and centralized grease systems. For each type, assign an owner role for standards updates and an approver role for changes that affect reliability. A practical rule is that the standards owner controls content, while operations and maintenance approve changes that affect work instructions.
Example: If a plant uses two grease grades across different bearing temperatures, the library should specify which grade goes where and who approves any deviation.
Standardize Lubricant Specifications
For each oil or grease, record the minimum specification set needed for safe operation. Include base oil type where relevant, viscosity grade or grease NLGI grade, additive performance requirements, and any seal compatibility constraints.
A useful way to keep this systematic is to separate “must meet” from “nice to have.” Must meet items are the ones that protect film strength, oxidation resistance, and contamination tolerance. Nice to have items are optional characteristics such as color or minor performance variations.
Example: For a gearbox oil, “must meet” might include the correct viscosity grade at operating temperature and load-carrying performance. “Nice to have” might include a specific brand’s marketing label, which you should not rely on.
Map Lubricant to Operating Conditions
Standards become meaningful when they connect to conditions. Create a condition-to-lubricant mapping that covers temperature range, load level, speed, start-stop frequency, and contamination exposure.
Example: A grease used on slow, lightly loaded bearings may tolerate lower oxidation resistance than a grease used on high-speed bearings with frequent starts. The library should state this relationship explicitly so technicians understand why intervals differ.
Define System Design and Delivery Rules
Lubrication systems fail in predictable ways: wrong flow, blocked lines, air entrainment, leaks, or incorrect reservoir levels. Your library should define delivery rules for each system type.
Include items such as:
- Centralized grease system: pump type, line routing constraints, purge expectations, and how to verify output at the manifold.
- Circulating oil system: filtration layout, bypass behavior, oil level control method, and acceptable differential pressure ranges.
- Hydraulic system: contamination targets, filter element selection basis, and water control expectations.
Example: If a centralized grease system uses a progressive divider, the library should specify how to confirm that each branch receives flow, not just that the pump runs.
Create Sampling and Testing Standards That Match the Lubricant
Oil analysis is only useful when sampling and test panels match the lubricant and system. Define where samples are taken, how they are labeled, and which tests are required for each lubricant type.
Include:
- Required tests by asset type and lubricant category
- Acceptance thresholds and action triggers
- How to interpret results in context of known system conditions
Example: A grease system may require different evidence than a gearbox oil system. If you only track wear metals from oil analysis, you miss the contamination and delivery issues that greases often reveal through other checks.
Build Work Instructions and Change Control
Standards should translate into work instructions: receiving checks, storage rules, transfer procedures, and cleaning requirements before switching lubricants. Add change control rules so deviations are documented and reviewed.
Example: If a site switches from one oil brand to another with the same viscosity grade, the library should require verification of additive performance equivalence and seal compatibility before the change is accepted.
Use a Consistent Document Template
A consistent template reduces confusion and makes audits easier. Each lubricant and system standard should include: purpose, scope, specification requirements, operating limits, system delivery rules, sampling and testing requirements, and troubleshooting cues.
Mind Map: Lubrication Standards Library Structure
Integrated Example Library Entry
Grease Standard for Slow, High-Load Bearings in Dusty Areas
- Purpose: Maintain film strength under high load while resisting oxidation and contamination effects.
- Specification requirements: NLGI grade selected for temperature range; additive package required for load-carrying performance; seal compatibility verified.
- Condition mapping: Apply within defined temperature limits; use only where dust ingress is controlled by seals and housekeeping.
- System delivery rules: For centralized systems, verify output at each branch and confirm no line blockage after maintenance.
- Sampling and testing: Define checks that align with grease evidence, such as inspection of purge quality and contamination indicators, plus any oil carryover checks where applicable.
- Work instructions: Receiving inspection, storage temperature limits, and rules for avoiding cross-contamination during top-ups.
- Change control: Any grease substitution requires equivalence verification and approval by the standards owner.
This structure keeps the library practical: it tells people what to use, where to use it, how to deliver it, and what evidence to collect when something goes off script.
12.3 Establishing Sampling Frequency and Test Panels by Asset Type
A sampling plan is only as good as its rhythm and its scope. Frequency determines whether you catch changes early; the test panel determines whether you can explain what changed and why. The goal is a repeatable schedule that matches asset risk, operating severity, and how fast the oil can realistically degrade.
Step 1: Classify Assets by Lubrication Risk
Start with an asset list and sort it into tiers based on consequences and lubrication sensitivity.
- Tier A: High consequence failures or fast degradation paths. Examples include main bearings on critical pumps, gearboxes driving conveyors, and hydraulic power units feeding safety functions.
- Tier B: Moderate consequence with stable operating patterns. Examples include secondary gearboxes and general-purpose circulating oil systems.
- Tier C: Low consequence or slow wear environments. Examples include lightly loaded reducers with good filtration and stable temperatures.
A practical rule: if a failure would stop production or cause safety risk, treat it like Tier A even if the asset seems “healthy” today.
Step 2: Map Operating Severity to Sampling Cadence
Oil change rate is driven by heat, load, contamination ingress, and duty cycle. Use these inputs to set a baseline frequency.
- Severe duty (high temperature, frequent starts, heavy load): sample more often.
- Stable duty (steady load, controlled environment): sample less often.
- Known contamination sources (breathers, washdown proximity, poor seals): increase frequency until the source is controlled.
Example cadence starting points:
- Tier A, severe duty: monthly for the first three cycles, then quarterly if trends remain stable.
- Tier B, moderate duty: quarterly, with a switch to monthly if viscosity, water, or particle trends worsen.
- Tier C, stable duty: semiannual, but always sample after any maintenance that disturbs the oil system.
Step 3: Build Test Panels That Match Failure Modes
A test panel should be the minimum set that distinguishes the most likely lubrication-related failure modes for that asset type.
Asset-Type Panels
- Bearings in oil or grease: focus on wear and contamination. Add particle and ferrous wear indicators; include water when seals or washdown exposure exist.
- Gearboxes: emphasize wear patterning and oxidation. Include viscosity, water, particle count or ISO cleanliness, and elemental wear.
- Hydraulics: prioritize contamination control. Include particle count, water, viscosity, and key wear elements; add additive depletion indicators when available.
- Circulating oil systems: treat them like a network. Include filtration performance indicators, water, viscosity, and wear elements at a frequency that matches system residence time.
Panel Size Discipline
If you add tests without changing frequency or sampling quality, you get more numbers and the same decisions. Keep panels consistent so trending is meaningful.
Step 4: Use Baselines and Trigger Rules
Frequency is not static. Establish a baseline during commissioning or after major changes, then adjust using clear triggers.
Common triggers:
- Viscosity shift beyond tolerance: increase sampling frequency and check for temperature excursions or oxidation.
- Water increase: inspect breathers, seals, and heat exchanger performance; sample more often until stable.
- Particle count rise or filter bypass activity: verify filtration health and sampling location.
- Wear metals trend upward: confirm with inspection history and adjust frequency to capture the slope.
Mind Map: Sampling Frequency and Test Panels
Example: One Asset, Two Phases
Consider a Tier A gearbox on a conveyor drive.
Phase 1: Baseline (first 3 cycles)
- Frequency: monthly
- Panel: viscosity, water, particle count or cleanliness, and elemental wear set
- Reasoning: you need enough points to separate normal variability from real change.
Phase 2: Routine with triggers
- Frequency: quarterly
- Panel: same core tests to preserve trend meaning
- Trigger: if water rises or particle count climbs, move back to monthly and add any needed checks for contamination pathways.
Example: Sampling After Maintenance
After replacing seals or flushing a hydraulic circuit, sample sooner than routine.
- Frequency: take one sample immediately after return to service and one at the next scheduled interval.
- Panel: keep the core cleanliness and water tests, plus wear elements to confirm the system is not carrying debris.
This approach keeps the plan systematic: frequency answers “how soon,” and the test panel answers “what to measure so the next action is obvious.”
12.4 Implementing Automated Lubrication With Controls and Verification
Automated lubrication works only when the system delivers the right lubricant, at the right time, to the right place, and the delivery is provable. Start by treating the lubrication circuit like a small production line: design the flow path, control the dose, verify the outcome, and record evidence.
System Foundations and Control Philosophy
Define the lubrication task in measurable terms: target points, lubricant type, required dose per cycle, cycle frequency, and acceptable operating window. For example, a conveyor gearbox may need oil circulation plus periodic grease on a bearing housing, while a packaging line may need grease on pillow blocks every shift. Controls should enforce those rules rather than relying on operator memory.
Use a layered control approach:
- Command layer decides when to lubricate based on time, run hours, or machine state.
- Actuation layer meters lubricant using pumps, valves, or progressive distributors.
- Feedback layer confirms delivery using pressure, flow, level, or switch signals.
- Data layer logs events and faults so maintenance can act without guessing.
Architecture Choices and Practical Design Rules
Choose between centralized and distributed systems based on distance, number of points, and cleanliness requirements. Centralized systems reduce refill effort, but long lines increase pressure drop and make verification harder. Distributed systems shorten line runs and simplify troubleshooting, at the cost of more reservoirs.
Design rules that prevent common failures:
- Keep line lengths consistent within a circuit when possible to reduce dose variation.
- Use tubing rated for lubricant temperature and compatibility to avoid swelling or leaks.
- Route lines away from heat sources and sharp edges; a damaged tube is a silent dose thief.
- Select seals and fittings that match the lubricant and operating pressure.
Control Logic That Matches Real Operation
Time-based control is simple but can lubricate during idle periods. Run-hour control aligns better with wear, especially for intermittent duty. Machine-state control is best when the asset has clear operating modes.
A practical example: for a fan motor with frequent starts, trigger grease delivery after a minimum run time since the last dose, not immediately on power-up. This avoids pushing grease into a bearing that is still settling and reduces the chance of purge losses.
Verification Methods That Actually Prove Delivery
Verification should match the lubrication mechanism.
For oil systems:
- Confirm pump operation and flow using differential pressure or flow switches.
- Monitor oil level and temperature to ensure the system is in its intended viscosity range.
- Use filter differential pressure trends to catch clogged elements that reduce effective delivery.
For grease systems:
- Use pressure monitoring at the metering unit to detect stuck valves or blocked lines.
- For systems with indicators, verify that each outlet cycle completes within a defined time window.
- Add periodic inspection of grease at accessible points to validate that delivery reaches the bearing area.
A simple verification routine for commissioning: run the system for a controlled number of cycles, record pressure or flow signals, and confirm grease presence at a representative sample of points. If the sample passes, you still verify the rest through event logs and fault-free cycle completion.
Mind Map: Controls and Verification Flow
Example: Commissioning a Grease Circuit with Fault Handling
Assume a progressive system feeding 12 points on a gearbox skid. Set the controller to lubricate based on run hours and only when the skid is in normal operation. During commissioning, run 10 cycles and record:
- Cycle completion time for each outlet group.
- Pressure signature at the metering unit.
- Any fault events such as low pressure or timeout.
If the controller reports a timeout for one outlet group, do not immediately assume the bearing is bad. First check for a blocked line, a pinched tube, or a valve that did not shift. Then confirm that the fault threshold is appropriate by repeating a small number of cycles after correction.
Example: Verification for an Oil Circulation Loop
For a circulating oil system, verify flow stability at operating temperature. Start the pump, confirm flow or pressure differential is within the expected range, and ensure the heat exchanger is functioning so viscosity stays in range. During the first week of operation, compare filter differential pressure readings against the baseline so you can distinguish normal buildup from a restriction that would reduce effective delivery.
Evidence and Work Order Integration
Controls are only useful if the evidence reaches maintenance quickly. Log each lubrication event with the trigger type, cycle count, and any fault codes. Link faults to a standard work instruction that starts with the most likely physical causes, then escalates based on what the feedback signals show. This keeps troubleshooting grounded in what the system measured, not what someone remembers.
12.5 End-to-End Example Program From Baseline to Sustained Reliability
This example shows how to build a lubrication and oil-analysis program that actually runs day to day. It starts with baseline facts, turns them into simple rules, and then uses automated lubrication and sampling discipline to keep those rules true.
Step 1: Define Scope and Success Criteria
Pick one asset family first, such as critical gearboxes on a packaging line. Define what “good” means in measurable terms:
- No recurring high wear metal spikes in oil analysis
- Stable viscosity and additive health within defined limits
- No repeat failures caused by starvation, overgreasing, or contamination
Example: For 6 gearboxes, set an initial target of “no more than one abnormal trend event per quarter,” where an event is a confirmed deviation after verification sampling.
Step 2: Establish Baseline with Controlled Sampling
Create a baseline window of 3–4 sampling rounds spaced consistently (for example, every two weeks). Use the same sampling container, labeling, and handling steps each time.
Example baseline outputs for one gearbox:
- Viscosity at 40°C: stable within ±8%
- Water: below detection limit
- Particle count: steady with no sudden jumps
- Wear metals: low and consistent, with iron dominant and no copper rise
If baseline results are noisy, fix sampling first. A “bad” baseline is often a sampling process problem, not a machine problem.
Step 3: Map Lubrication System Inputs to Failure Modes
Translate equipment design into a lubrication cause-and-effect map. For gearboxes, common pathways include contamination ingress, seal leakage, oil oxidation, and incorrect oil level.
Example mapping for one gearbox:
- Seal leak → water and fuel dilution signals → viscosity shift and oxidation changes
- Filter bypass or clogged filter → particle count rise → abrasive wear metals trend
- Wrong oil grade or top-up oil → viscosity and additive imbalance
Step 4: Set Action Limits and Verification Rules
Use two layers of thresholds:
- Alert limit: triggers investigation and verification sampling
- Action limit: triggers corrective work order
Example rules:
- Alert: viscosity shift exceeds 8% or particle count doubles versus baseline average
- Action: water detected twice in two consecutive samples or wear metals exceed baseline by 3× with matching particle rise
Verification prevents knee-jerk repairs. If the second sample returns to normal, the first result is treated as a sampling anomaly.
Step 5: Engineer Automated Lubrication Delivery
For grease-lubricated bearings, configure the automated system so delivery matches bearing needs and seal conditions.
Example commissioning checks:
- Flow verification at each metering point using a measured catch test
- Line purge check to confirm no trapped air pockets
- Leak check around fittings and bearing housings
Then lock in a conservative starting schedule and adjust only after oil/grease condition evidence supports the change.
Step 6: Build the Work Management Loop
Connect findings to actions in the CMMS with clear ownership:
- Technician tasks: sampling, system checks, filter changes, oil top-up corrections
- Reliability engineer tasks: root cause analysis and limit tuning
Example work order logic:
- Alert event → schedule verification sample within 7 days and inspect filter differential pressure
- Action event → stop and correct contamination source, then perform system flush only if evidence supports it
Step 7: Run a Controlled Improvement Cycle
After each quarter, review whether actions reduced abnormal events and whether limits still fit reality.
Example quarter review outcomes:
- Particle alerts dropped after filter bypass issues were corrected
- Water detections stopped after seal installation torque was standardized
- Viscosity alerts became rare after top-up oil grade was corrected and verified
Mind Map: End-to-End Program Flow
Example: One Gearbox Timeline from Baseline to Stabilization
- Week 0: Baseline sampling round 1; record viscosity, water, particle count, wear metals
- Week 2: Round 2; all metrics within baseline ranges
- Week 4: Round 3; particle count alert triggers; verification sample scheduled
- Week 5: Verification confirms elevated particles; differential pressure inspection shows filter bypass
- Week 5: Corrective work order replaces filter element and checks bypass valve seating
- Week 6: Round 4 shows particle count returns to baseline; limits remain unchanged
- End of quarter: review confirms fewer abnormal events across the gearbox set
Step 8: Document the Rules So They Survive Staff Turnover
Write down the “why” behind each rule in plain language: what evidence triggers action, what corrective work is expected, and what proof closes the loop.
Example documentation entries:
- “Water detected twice → inspect seal and top-up source; confirm with next sample after correction.”
- “Particle alerts with stable viscosity → check filtration bypass first; verify with differential pressure records.”
When these rules are consistent, the program becomes repeatable rather than dependent on individual memory. That’s the difference between a report and a system.