Modern Telemetry with OpenTelemetry Semantic Conventions OTLP and Collector Pipelines
1. Foundations of Observability and Telemetry Data Models
1.1 Observability Goals and Telemetry Signals in Practice
Observability is about answering practical questions when something is wrong: What happened? Where did it happen? How did it spread? And what changed? To answer those questions reliably, you need telemetry signals that capture behavior from multiple angles and a way to correlate them.
The Observability Goals That Drive Signal Choice
A useful goal set is small and testable. Start with these three, then add specifics per system.
- Detect problems early enough to act.
- Example: A sudden rise in request latency or error rate.
- Diagnose the cause with minimal guesswork.
- Example: Errors correlate with a specific downstream dependency or a particular endpoint.
- Understand impact and scope.
- Example: Only one region is affected, or only one customer segment sees failures.
Each goal maps to telemetry signals differently. Metrics are best for “how much and how often.” Traces are best for “what path did the request take.” Logs are best for “what did the system say at the moment it noticed something.”
Telemetry Signals in Practice
Metrics: Quantities You Can Trend
Metrics summarize behavior over time. They are ideal for alerting, capacity planning, and spotting regressions.
-
Common metric types
- Counter: monotonically increasing events, like requests received.
- Gauge: current value, like queue depth.
- Histogram: distribution of durations, like request latency.
-
Example
- You track
http.server.durationas a histogram. When the p95 jumps, you know latency increased. When the histogram shifts right, you can see whether the change is broad or limited to slow outliers.
- You track
-
Best practice
- Use consistent label dimensions such as
service.name,http.route, andhttp.status_code. If you invent a new label for every team, queries become archaeology.
- Use consistent label dimensions such as
Traces: The Request Path with Timing
Traces represent a unit of work as a graph of spans. They show causality across services and help you pinpoint where time is spent.
-
Span essentials
- Span kind: client or server clarifies direction.
- Timing: start and end timestamps show where latency accumulates.
- Attributes: endpoint, peer service, and error details provide context.
-
Example
- A trace shows an incoming request to
GET /checkoutspawning a call topayment-service. The slow part is thepayment-servicespan, not the gateway.
- A trace shows an incoming request to
-
Best practice
- Record errors on the span that actually fails. If you only log errors at the edge, traces become a neat diagram of disappointment.
Logs: What Happened at the Moment
Logs are event records. They are useful for detailed explanations, especially when you need exact messages, stack traces, or business context.
-
Example
- When a database query fails, the log includes the SQL error code, the operation name, and a correlation identifier.
-
Best practice
- Keep log fields structured and align them with trace context fields so you can jump from a trace to the relevant log lines.
Mind Map: How Goals Map to Signals
A Concrete Scenario: One Symptom, Three Signals
Imagine a spike in failed checkout requests on 2026-03-25.
- Metrics show the failure rate rising for
http.route=/checkout. - Traces reveal that the gateway is fine, but the
payment-servicespan has increased error status and longer duration. - Logs from
payment-serviceshow the exact failure reason, such as a timeout to an external provider, including the provider error code.
The key is that each signal answers a different part of the question set. Metrics tell you where to look. Traces tell you how the request got there. Logs tell you what the system observed when it failed.
Practical Rules for Signal Integration
- Use the same identity fields across signals
service.nameand route or operation names should match.
- Correlate using trace context
- Ensure logs can be linked to traces via trace identifiers.
- Choose cardinality carefully
- High-cardinality labels in metrics make dashboards slow and alerts noisy.
- Keep signal semantics consistent
- A histogram labeled as latency should measure durations, not arbitrary numbers.
When these rules hold, observability becomes a workflow: measure the symptom, trace the path, and read the explanation—without switching tools or losing context.
1.2 Metrics Logs And Traces Compared With Concrete Use Cases
Metrics, logs, and traces answer different questions, and they do it with different shapes of data. Metrics are about measurement over time, logs are about what happened in a specific moment, and traces are about how work moved through multiple components. A useful way to keep them straight is to map each signal to a question you would ask during an incident.
Metrics: Are We Getting Worse over Time?
Metrics summarize behavior so you can see trends, spikes, and steady-state problems. They are compact and designed for aggregation.
Concrete example: HTTP latency and error rate
- Metric:
http.server.duration(histogram) andhttp.server.errors(counter) - Use it to answer: “Did latency jump after a deployment?”
- Typical dimensions:
service.name,http.route,http.method,status_code
What metrics do well
- Detect regressions quickly with dashboards and alert thresholds.
- Compare environments using the same metric names and labels.
What metrics do not do well
- Explain why a specific request failed.
- Provide a step-by-step story across services.
Logs: What Exactly Did the Application Say?
Logs capture event-like records. They are best when you need detail that doesn’t compress neatly into numeric aggregates.
Concrete example: Request validation failures
- Log fields:
service.name,request_id,user_id(if appropriate),error.type,error.message,http.route - Use it to answer: “Why did this request fail?”
What logs do well
- Show the exact error message, stack trace, or structured context.
- Support investigations where the “why” is in the text or structured fields.
What logs do not do well
- Prove end-to-end causality across services.
- Provide statistically stable trends without careful aggregation.
Traces: How Did One Request Move Through the System?
Traces represent a single end-to-end workflow as a graph of spans. Each span marks a unit of work and records timing and attributes.
Concrete example: A checkout request across services
- Spans:
frontend,cart,payment,inventory,shipping - Use it to answer: “Where did time go, and what dependency caused it?”
What traces do well
- Identify the slow or failing hop in a distributed call chain.
- Correlate causality using trace and span identifiers.
What traces do not do well
- Replace metrics for alerting and long-term trend analysis.
- Provide full statistical coverage if sampling is too aggressive.
Mind Map: Choosing the Right Signal for the Right Question
Integrated Use Case: One Incident, Three Signals
Imagine a service called checkout-api starts returning more 500 errors.
- Metrics first for scope
- You see
http.server.errors{service.name="checkout-api",status_code="500"}rising. - You also check
http.server.durationto see whether latency increased at the same time.
- Logs next for the immediate cause
- You filter logs by
service.name="checkout-api"and the same time window. - You look for
error.typepatterns likeTimeoutErrororDatabaseUnavailable. - You confirm whether the log records include a
trace_idso you can jump to the trace.
- Traces last for the exact path
- Using the
trace_idfrom a representative log entry, you open the trace. - You find the span where the failure occurred, such as
payment-serviceor a database call. - You compare attributes like
http.status_code,rpc.system, ordb.operationto understand what dependency was involved.
This order matters because each step narrows the search space: metrics tell you where to look, logs tell you what failed, and traces tell you where the failure happened in the workflow.
Example: Minimal Field Set That Keeps Signals Connected
A practical baseline is to ensure each signal carries enough shared identity to connect the investigation.
- Metrics:
service.name, route or operation label, and outcome label (likestatus_code). - Logs:
service.name,timestamp,severity,trace_idwhen available, and an error classification field. - Traces:
service.nameas a resource attribute, span kind, and key attributes for the interaction type (HTTP, RPC, messaging).
When these fields are consistent, you can move from an alert to a specific error message and then to the exact dependency hop without guessing.
Mind Map: Investigation Flow from Alert to Root Cause
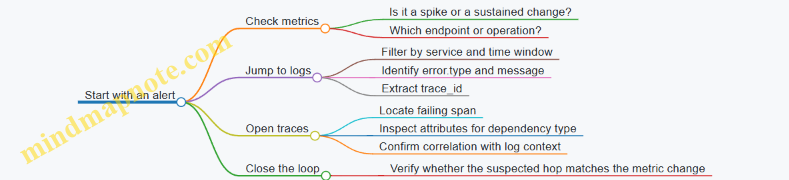
Summary: One System, Three Complementary Views
Metrics tell you what changed. Logs tell you what the application observed and recorded. Traces tell you how a single request traveled and where it spent time or failed. When you design instrumentation and collector pipelines so these views share identifiers and consistent naming, investigations become a straight line instead of a scavenger hunt.
1.3 Distributed Systems Context and Correlation Requirements
Distributed systems need a shared way to describe “what request is this?” and “what work belongs to it?” Without that, metrics become averages of unrelated events, logs become a pile of useful fragments, and traces turn into a set of disconnected timelines.
At the core is context: a small set of identifiers and metadata that travels with the work. Correlation is the discipline of using that context consistently so every signal can be tied back to the same end-to-end flow.
What Correlation Must Achieve
- End-to-end identity: every hop in a request chain must carry the same trace identity so a trace view can stitch spans into a single story.
- Causal structure: parent-child relationships must reflect how work was triggered, not just that it happened around the same time.
- Signal alignment: logs and metrics must include enough context to be filtered or grouped by the same identifiers used in traces.
- Operational debuggability: when something fails, the context must still be present so you can find the failing component and the exact request.
A practical rule: if you can’t answer “which upstream request caused this downstream action?” using your stored telemetry, correlation is incomplete.
Context Propagation Basics
Propagation means copying context from an incoming request into outgoing calls. In practice, this is usually done through protocol metadata (for example, HTTP headers) and then reattached on the receiving side.
Two identifiers matter most:
- Trace identifier: groups all spans belonging to one end-to-end request.
- Span identifier: identifies the current unit of work so the receiver can set the correct parent.
Additionally, some systems carry baggage: small key-value items that are not strictly required for tracing structure but are useful for debugging and routing decisions.
Correlation Requirements by Signal Type
Traces require correct parent-child linkage. If a service starts work without setting the received context as its parent, the trace becomes fragmented.
Logs require that each log record includes trace identifiers (and optionally span identifiers). This lets you pivot from a trace to the relevant log lines.
Metrics require careful thinking: metrics are often aggregated, so you can’t rely on per-request correlation alone. Instead, correlation is typically achieved by attaching stable dimensions (like service name and operation) and, where feasible, including trace identifiers only for sampled requests or high-signal events.
Common Failure Modes and Their Symptoms
- Missing propagation: downstream spans start new traces, producing multiple traces for one user action.
- Wrong parent assignment: traces show odd trees where child spans appear under unrelated parents.
- Context overwritten: middleware replaces context with a new one, causing logs to point to the wrong span.
- Inconsistent resource attributes: the same service appears with different identity attributes, making aggregation and filtering unreliable.
A quick sanity check is to pick one request, follow it across services, and confirm that trace identifiers remain identical end-to-end.
Mind Map: Correlation Requirements
Example: HTTP Request Across Two Services
Service A receives an HTTP request, creates a server span, and then calls Service B.
- On Service A, the outgoing HTTP request must carry the trace context from the server span.
- On Service B, the incoming request must extract that context and create a child span under the correct parent.
If Service B instead starts a new trace, you’ll see two trace identifiers for what should be one request.
Here’s a minimal conceptual flow:
Client -> Service A -> Service B

Service A
- Create server span for incoming request
- Attach trace context to outgoing HTTP headers
- Log with trace id and span id

Service B
- Extract trace context from headers
- Create child span using extracted parent
- Log with same trace id
Example: Correlating Logs with Traces
When Service B logs an error, the log record should include the trace identifier so you can filter logs to the exact trace. If you also include span identifier, you can narrow further to the specific operation.
A useful operational pattern is to log at the point where the decision is made (for example, after a failed dependency call), not only when the exception bubbles up. That keeps the log aligned with the span that actually represents the failing work.
Validation Checklist
- Identifier continuity: trace identifier stays the same across services.
- Tree correctness: child spans attach to the expected parent.
- Log linkage: log records include trace identifiers for the relevant operation.
- Resource stability: service identity attributes are consistent across deployments.
If these four checks pass for a representative request, correlation is doing its job rather than merely existing.
1.4 Data Lifecycle from Instrumentation to Storage and Query
A telemetry system is only as useful as the path from “something happened” to “someone can ask a question and get an answer.” The lifecycle has five practical stages: instrumentation, collection, transformation, storage, and query. Each stage has its own responsibilities, and each one can quietly break the chain.
Instrumentation Produces Semantically Shaped Events
Instrumentation is where meaning first gets attached to raw activity. For traces, that means creating spans with correct span kinds, consistent trace identifiers, and attributes that match semantic conventions. For metrics, it means choosing instrument types (counter, gauge, histogram) and defining dimensions that won’t explode cardinality. For logs, it means emitting structured fields that can line up with trace and span identifiers.
A simple example: an HTTP handler creates a server span, records the route template and status code, and increments a request counter with the same service identity attributes used elsewhere. If the handler also logs an error, the log includes trace_id and span_id so later queries can join “what failed” with “where it failed.”
Collection Receives Telemetry and Preserves Context
The collector’s job is to receive OTLP data reliably and keep the relationships intact. It accepts data from instrumented services, then routes it into signal-specific pipelines. Context preservation matters: trace context must remain consistent across spans, and resource attributes must remain attached to the correct scope.
A common best practice is to separate pipelines by signal type. That keeps metric transformations from accidentally affecting trace attributes, and it prevents log enrichment rules from changing trace sampling decisions.
Transformation Normalizes Data for Consistent Querying
Transformation is where “it works” becomes “it’s queryable.” Typical steps include:
- Resource normalization: ensure every record has the same service identity fields (service.name, service.namespace, service.instance.id) so grouping is stable.
- Attribute normalization: map inconsistent attribute keys into a single convention, such as converting http.status_code variants into one field.
- Filtering: drop noisy spans or logs early when they are clearly unhelpful, but do it with care so you don’t remove the evidence you later need.
- Metric transformation: adjust units, rename labels, or convert histogram buckets only when you can document the meaning.
Example: if one service emits http.method and another emits request.method, a normalization processor can map both into http.method. Without this, dashboards end up with duplicated filters and confusing “missing” data.
Storage Indexes Data for the Questions You Actually Ask
Storage is not just a database; it’s an indexing strategy. Traces are stored so you can retrieve a trace by trace_id, then navigate spans by time and relationships. Metrics are stored so you can aggregate by time windows and dimensions. Logs are stored so you can filter by fields and correlate with trace identifiers.
A practical rule: design storage expectations around access patterns. If you frequently query “requests by route and status,” then those attributes must be present and consistently named at ingestion time. If you frequently query “error logs for a trace,” then trace_id must be indexed in logs.
Query Joins Signals Through Shared Identifiers
Querying is where the lifecycle either feels coherent or falls apart. The key is shared identifiers and consistent semantics.
- Trace-first: start with a trace_id from an alert or user session, then inspect spans and correlated logs.
- Metrics-first: find an anomaly in metrics, then use service identity and time windows to locate relevant traces and logs.
- Logs-first: filter logs by error fields, then jump to trace_id to see the surrounding span context.
If trace_id is missing from logs, the join becomes a manual scavenger hunt. If resource attributes differ between services, grouping by “service.name” yields fragmented results.
Mind Map: the Lifecycle
Example End-to-End Flow
A request hits GET /orders/{id}.
- The service creates a server span with route template and status code, and increments a request counter with method and route dimensions.
- On failure, it emits a log record with error fields plus trace_id and span_id.
- The collector receives OTLP data, normalizes service identity attributes, and ensures attribute keys match semantic conventions.
- Storage indexes traces for trace_id lookup, metrics for aggregation by dimensions, and logs for field filtering and trace correlation.
- A query finds elevated error rate in metrics, then retrieves traces in the same time window for the same service identity, and finally pulls correlated logs using trace_id.
The lifecycle is systematic because each stage enforces a contract: meaning is created in instrumentation, preserved in collection, made consistent in transformation, indexed in storage, and connected in query.
1.5 Common Failure Modes in Telemetry Pipelines and How to Detect Them
Telemetry pipelines fail in predictable ways: data disappears, data arrives but is unusable, or data arrives with the wrong meaning. The goal of this section is to help you spot those problems quickly by matching symptoms to likely causes, then using targeted checks to confirm.
Missing Telemetry After Instrumentation
A common failure mode is “nothing shows up,” even though the application is running. The usual culprits are exporter misconfiguration, sampling that removes everything, or network issues between the app and the collector.
Detection checklist
- Confirm the application exporter is enabled and points to the correct OTLP endpoint.
- Verify transport reachability from the application host to the collector.
- Check sampling settings at the SDK level and any collector-level sampling.
- Look for exporter errors in application logs.
Example:
If your service emits spans but you see zero traces in the backend, start with the collector: if the collector receives nothing, the problem is upstream. If the collector receives spans but the backend shows none, the problem is downstream (exporter, auth, or mapping).
Partial Data Due to Signal Split or Routing Rules
Pipelines often treat metrics, logs, and traces as separate flows. A routing rule that filters one signal can create a confusing “half working” system.
Detection checklist
- Verify each signal has its own pipeline and that receivers are attached to the correct one.
- Confirm processors that filter by attribute are not accidentally excluding a whole signal.
- Check that fan-out exporters are configured for every pipeline that needs them.
Example:
You may see metrics but not logs because a processor expects an attribute that logs don’t have yet. The fix is usually to enrich logs earlier in the pipeline or adjust the filter condition.
Semantic Drift from Inconsistent Attributes
Even when data arrives, it can be semantically wrong. Semantic drift happens when attribute names, units, or required fields vary across services.
Detection checklist
- Validate that resource attributes like service identity are consistent across deployments.
- Check that metric units and label keys match your conventions.
- Compare attribute presence rates across services to find outliers.
Example:
If one service reports http.status_code as a string and another as an integer, queries that assume numeric ordering will behave inconsistently. The collector can normalize types, but you must first detect the mismatch.
Broken Correlation from Missing Context Propagation
Distributed correlation fails when trace context is not propagated across boundaries. The symptom is traces that look like disconnected islands.
Detection checklist
- Inspect incoming requests for trace headers and confirm they are forwarded on outgoing calls.
- Check that messaging systems carry trace context in message metadata.
- Verify that span links or parent-child relationships are formed as expected.
Example:
A request enters Service A and Service B creates a new trace instead of a child span. That typically means the outgoing call from A did not include the trace context headers, or the receiving side is not extracting them.
Backpressure, Batching, and Retry Loops
Performance-related failures can look like data loss. Batching delays can make it appear that telemetry is missing, while retry loops can cause duplicates or bursts.
Detection checklist
- Monitor collector queue sizes and dropped item counters.
- Check batch sizes and timeouts to understand ingestion latency.
- Look for repeated export failures that trigger retries.
Example:
If you see periodic spikes in exported spans and gaps between them, batching and retry timing may be creating a sawtooth pattern. Confirm by correlating collector logs with backend ingestion timestamps.
Time Skew and Out-of-Order Events
When clocks differ, you get confusing timelines. Spans may appear to start after they end, or logs may not align with traces.
Detection checklist
- Ensure hosts use synchronized time.
- Compare event timestamps across signals for the same request.
- Check for ingestion-time versus event-time confusion in your backend.
Example:
A log line that should match a span’s duration appears outside the span window. Often the issue is timestamp source differences rather than missing data.
Data Quality Issues from Over-Filtering or Over-Enrichment
Filters can remove too much, and enrichment can add incorrect fields. Both reduce trust in dashboards.
Detection checklist
- Track how many items each processor drops.
- Validate enrichment logic against a small set of known requests.
- Confirm that enrichment does not overwrite existing correct attributes.
Example:
A processor that sets service.name based on a header might overwrite the real service identity when the header is absent. The result is a “new service” in dashboards that shouldn’t exist.
Mind Map: Failure Modes and Detection Signals
A Practical Triage Flow
Use a short sequence that narrows the problem quickly.
- Confirm receipt: Does the collector receive the signal at all?
- Confirm processing: Do processors drop or transform it unexpectedly?
- Confirm export: Do exporters succeed and authenticate?
- Confirm meaning: Are semantic fields and correlation intact?
Example:
If the collector receives spans but correlation is broken, focus on context propagation and extraction rather than exporter credentials. If the collector receives nothing, focus on endpoint configuration, sampling, and network reachability.
Detection Example with a Minimal Diagnostic Output
When you need a fast sanity check, compare counts at each stage for a single service and time window.
Time window: 2026-03-25T10:00Z to 10:05Z
Service: checkout-api
Received at collector: traces=12,340 metrics=8,900 logs=0
After processors: traces=12,340 metrics=8,900 logs=0
Exported to backend: traces=12,330 metrics=8,880 logs=0
Backend visible: traces=12,330 metrics=8,880 logs=0
If logs are zero from “received at collector,” the issue is upstream instrumentation or OTLP export for logs. If logs are nonzero at the collector but zero in the backend, the issue is exporter configuration or backend ingestion mapping.
2. OpenTelemetry Architecture and Core Concepts
2.1 OpenTelemetry Components and Responsibilities
OpenTelemetry is a set of libraries and a data model that help you produce metrics, logs, and traces in a consistent way. The “components” are the moving parts that turn application events into structured telemetry, then move that telemetry through processing steps until it reaches a backend. Think of it as a pipeline with clearly named roles, so you can reason about where a field is added, transformed, or dropped.
The Core Roles in the OpenTelemetry Stack
- Instrumentation libraries create telemetry from your code. They know how to measure time, count events, and capture context.
- SDKs provide the runtime behavior: buffering, sampling, resource attribution, and the mechanics of creating spans and metric points.
- APIs define what your code calls. APIs are stable entry points; SDKs are the implementation.
- Context propagation carries trace identity across process boundaries so related work stays connected.
- Collector receives telemetry over OTLP, runs processing, and exports to one or more destinations.
- Exporters send telemetry out of the SDK or collector to a backend or another system.
A practical way to remember responsibilities: APIs ask for telemetry, SDKs produce telemetry, collectors refine telemetry, and exporters deliver telemetry.
Mind Map: Responsibilities
How Data Flows End to End
At runtime, your application emits telemetry through the API. The SDK turns that into structured data using the data model rules. For traces, it creates spans and links them using the active context. For metrics, it records measurements and later aggregates them according to the SDK’s configuration. For logs, it attaches fields and can correlate them with trace context when you include identifiers.
When you use a collector, the SDK typically exports via OTLP to the collector. The collector then applies processors such as batching, attribute normalization, and filtering. Finally, exporters deliver the processed payload to the backend.
Example: Traces with Clear Ownership
In a typical service, you want one incoming request to produce a trace with multiple spans. The API call creates a span, the SDK manages its timing and lifecycle, and context propagation ensures child spans join the same trace.
Request arrives
  -> Extract trace context from headers
  -> Start server span (SDK)
  -> Call downstream service
     -> Inject trace context into outgoing headers
     -> Downstream starts client span (SDK)
  -> End spans
Export
  -> OTLP to collector
  -> Collector batches and exports
Example: Metrics and Responsibility Boundaries
Metrics often confuse people because “recording” and “exporting” are separate steps. Your code records measurements (API + instrumentation). The SDK decides how to aggregate them (for example, sum and count over time windows). The exporter or collector then ships aggregated points.
A common best practice is to keep metric labels consistent with semantic conventions. If you vary label keys or formats across services, the backend will treat them as different dimensions, and your dashboards will quietly become less useful.
Example: Logs and Correlation Without Guesswork
Logs are not automatically correlated unless you provide the fields. A reliable pattern is to include trace identifiers in log records at the time you write them, using the active context.
When writing a log line
  - Include trace_id and span_id from active context
  - Include service.name and environment from resource
  - Keep message stable and structured fields separate
Responsibilities You Can Test
You can validate component behavior with small, deterministic checks:
- API/SDK boundary: confirm spans start and end when expected.
- Context propagation: confirm a downstream request receives the same trace identity.
- Collector processing: confirm attribute normalization occurs before export.
- Exporter delivery: confirm payloads arrive and are not dropped due to auth or endpoint mismatch.
A good mental model is that each component has a narrow job. When something is missing in the backend, you can usually trace the problem to one responsibility boundary rather than chasing ghosts across the whole system.
2.2 SDKs Exporters Receivers Processors and Pipelines
OpenTelemetry’s pipeline is easiest to understand as a set of roles that pass telemetry through a sequence of stages. The SDKs create telemetry, the Collector receives it, processors transform it, and exporters deliver it. The “pipeline” is the wiring that connects these roles.
Mind Map: Roles and Flow
SDKs Create Telemetry with Context
SDKs live in your application or runtime. They produce spans, metrics, and logs, and they attach two kinds of metadata that matter later in the Collector: resource attributes (who produced it) and instrumentation scope (what library produced it).
A span is more than a timer. It carries a trace identity, a span identity, a span kind, and attributes describing the operation. When you create a span inside a request handler, you also decide how it relates to the incoming request context. That relationship is what makes distributed correlation work.
Metrics and logs follow the same principle: the SDK emits structured data with consistent keys, not free-form strings. If you keep attribute names stable at the SDK boundary, the Collector can focus on routing and normalization rather than guessing.
Receivers Accept Data and Standardize Entry
In the Collector, receivers are the intake points. The most common setup uses OTLP, where the Collector listens for gRPC or HTTP requests. A receiver’s job is to accept incoming telemetry and convert it into the Collector’s internal format.
Operationally, receivers define where data arrives and what it looks like when it enters the pipeline. If you misconfigure endpoints or protocols, you’ll see “nothing arrived” rather than “arrived but wrong,” which is why receiver configuration is the first place to check.
Processors Transform Data in Ordered Chains
Processors run after reception and before export. They are ordered, so the sequence matters. A typical chain might enrich resource attributes first, then filter noisy data, then batch for efficiency.
Common processor categories:
- Enrichment: add or derive attributes, such as service identity or environment tags.
- Normalization: rename keys, standardize units, or align attribute formats.
- Filtering: drop spans or logs that match rules, reducing cost and clutter.
- Batching and Retry: improve throughput and resilience without changing meaning.
A practical example is attribute normalization. Suppose one service uses http.status_code and another uses status_code. If you normalize early in the pipeline, downstream queries become consistent.
Exporters Deliver Telemetry to Backends
Exporters send telemetry out of the Collector. They handle backend-specific protocol details, authentication, and any required mapping to the backend’s expectations.
An exporter should not be treated as a second chance to fix broken semantics. If you rely on the exporter to “make it work,” you’ll end up with silent inconsistencies. Instead, use processors to ensure the data matches the semantic conventions you intend to follow.
Pipelines Wire Everything Together by Signal
Pipelines define which receivers feed which processor chain and which exporters, typically per signal type. Metrics, logs, and traces usually have separate pipelines because their processing needs differ.
Here is a compact example showing the wiring concept:
receivers:
  otlp:
    protocols:
      grpc:
      http:
processors:
  batch: {}
  attributes:
    actions:
      - key: service.name
        action: update
        value: my-service
exporters:
  otlphttp:
    endpoint: https://backend.example/v1/otlp
service:
  pipelines:
    traces:
      receivers: [otlp]
      processors: [attributes, batch]
      exporters: [otlphttp]
The ordering is explicit: attributes runs before batch. That matters because batching groups items; you want the final attributes included in the batched payload.
Example: One Request, Three Signals, One Correlation Story
Consider an HTTP request handled by your service. The SDK creates a span for the handler, emits metrics for request duration, and records a log event for a notable outcome. Each signal includes resource attributes and shares the trace identity where applicable.
When the Collector receives the data, the traces pipeline can enrich or filter spans, while the metrics and logs pipelines can apply their own normalization rules. The key is that the pipeline design keeps signal-specific logic separate while preserving correlation fields.
Case Study: Why Processor Order Prevents Confusing Results
If you batch before you normalize attributes, you might still “see data,” but queries can show mixed attribute values across batches. By normalizing first, you ensure every exported item already follows the same key scheme. It’s a small ordering choice that prevents a lot of head-scratching later.
2.3 Context Propagation Concepts and Span Relationships
Context propagation is how trace context travels with work as it moves through your system. In OpenTelemetry, that context typically includes a trace identifier and the “current span” identifier, plus flags that affect sampling. The key idea is simple: when code starts new work, it should either create a new span as a child of the current span or continue an existing span when that’s the right model.
What “Context” Means in Practice
A context is a bundle of values associated with the currently executing operation. In OpenTelemetry, the most important values are:
- Trace identifiers: trace id and span id that let you correlate related telemetry.
- Span linkage: the parent-child relationship that determines where the new span sits in the trace graph.
- Sampling decision: whether the trace is recorded, which affects whether spans are created or dropped.
In code, you usually don’t pass these values manually. Instead, the SDK keeps a “current context” that is set when a span becomes active, then read when you create child spans.
Span Relationships You Actually Need
OpenTelemetry uses span relationships to represent how work is structured.
- Parent-child: the common case for synchronous request handling. A child span represents work performed within the parent span’s lifetime.
- Span kind: indicates the role of the span (client, server, producer, consumer, internal). Span kind helps interpret directionality in the trace.
- Links: used when you cannot express a strict parent-child relationship, such as when consuming a message that was produced elsewhere without a direct call stack.
Parent-child relationships are great for “call graph” style flows. Links are great for “correlation without causality” flows, like batch processing where the consumer handles many messages.
The Life Cycle of a Trace Context
A trace context typically enters your system at a boundary, then moves outward.
- Incoming boundary: an HTTP request arrives with headers carrying trace context.
- Server span creation: the server extracts the context and starts a server span as the active span.
- Downstream calls: when the server calls another service, it injects the current context into outgoing headers.
- Continuation: the downstream service extracts the headers and starts its own server span as a child of the upstream span.
If you skip extraction or injection at a boundary, you’ll get broken traces: spans still exist, but the graph won’t connect.
Mind Map: Context Propagation and Span Relationships
Example: HTTP Request with Correct Parent-Child Structure
Imagine Service A receives an HTTP request and calls Service B.
- Service A starts a server span for the incoming request.
- Service A creates a client span for the HTTP call to Service B.
- Service A injects the trace context into the outgoing HTTP headers.
- Service B extracts the headers and starts its own server span.
Result: Service B’s server span becomes a child of Service A’s client span, which is itself a child of Service A’s original server span. That gives you a trace graph that matches the real call chain.
Example: Async Messaging with Links Instead of Parent-Child
Now consider a queue. Service A publishes a message, and Service C later consumes it.
- Publishing creates a producer span and injects trace context into message metadata.
- Consumption extracts context and can create a consumer span.
If the consumer can treat the extracted context as the “current” parent, you get parent-child. If the consumer processes multiple messages together or the metadata is insufficient to define a single parent, you use links to associate the consumer span with one or more producing spans.
Common Mistakes and Their Symptoms
- Creating spans without the active context: child spans appear as separate traces or attach to the wrong parent.
- Extracting but not injecting: downstream services start new traces because they never receive the upstream context.
- Injecting but not extracting: upstream spans exist, but the trace graph stops at the boundary.
- Using parent-child where links fit better: you force a causality model that doesn’t match the system’s structure, which makes analysis misleading.
A Practical Mental Model
Treat propagation as “carrying the current span identity across boundaries.” When you can represent a call stack, use parent-child. When you can only represent correlation, use links. Span kind tells you which direction the work flows, while relationships tell you how the trace graph should be connected.
2.4 Resource Attributes and Instrumentation Scope Semantics
Resource attributes and instrumentation scope semantics are the two knobs that decide how telemetry is grouped, attributed, and interpreted. If you get them right, dashboards become consistent and debugging becomes less of a scavenger hunt. If you get them wrong, everything still arrives, but it arrives in the wrong buckets.
Resource Attributes as the “Where” and “Who”
A resource describes the entity that owns the telemetry. In practice, that usually means the process, service, or deployment environment that produced the data. Resource attributes are attached to telemetry at export time and are intended to be stable for the lifetime of the emitting process.
Common resource attributes include:
service.name: The logical service identifier used for grouping.service.namespaceandservice.instance.id: Optional identifiers that help disambiguate multi-tenant or multi-instance setups.deployment.environment: Values likeproduction,staging, ortest.cloud.*,k8s.*,host.*: Environment-specific metadata such as region, cluster, or node.
A practical rule: use resource attributes for identity and topology, not for per-request details. Per-request details belong on spans, events, metrics data points, or log records.
Example: Stable Identity vs Per-Request Variability
If you attach http.route as a resource attribute, it will explode cardinality because it changes frequently. Instead, put http.route on spans (or on metrics labels if you truly need it), and keep resource attributes focused on stable identity like service.name and deployment.environment.
Instrumentation Scope as the “Which Library”
Instrumentation scope identifies the component that created the telemetry within the process. It is the semantic home for the instrumentation library name and version, and it helps separate telemetry produced by different SDKs or custom instrumentation.
Instrumentation scope is especially useful when:
- You have multiple instrumentation libraries in one service.
- You want to distinguish auto-instrumentation from manual instrumentation.
- You need to track changes when upgrading an instrumentation library.
A useful mental model: resource attributes answer “which service and environment,” while instrumentation scope answers “which instrumentation produced this.”
How Grouping Works in Practice
Backends typically group data using a combination of resource attributes and instrumentation scope. That means your choices affect:
- Which series appear together for metrics.
- How traces are filtered by service.
- How logs are correlated and queried.
To keep grouping predictable, treat resource attributes as your primary partition key and instrumentation scope as your secondary partition key.
Mind Map: Resource and Scope Semantics
Example: Consistent Resource and Scope for a Web Service
Imagine a web service running in Kubernetes. You want every trace and metric to be grouped under the same service identity, while still distinguishing the HTTP auto-instrumentation from a custom database span wrapper.
-
Resource attributes:
service.name = "checkout-api"deployment.environment = "staging"k8s.cluster.name = "cluster-a"k8s.namespace.name = "payments"
-
Instrumentation scope:
- HTTP auto-instrumentation scope:
name = "opentelemetry-instrumentation-http",version = "x.y.z" - Custom DB wrapper scope:
name = "checkout-db-wrapper",version = "1.3.0"
- HTTP auto-instrumentation scope:
Now a query for service.name=checkout-api returns a coherent view, and a breakdown by instrumentation scope helps you verify which part of the system produced a particular span pattern.
Example: Avoiding Cardinality Traps
A common mistake is to place request-specific values into resource attributes. For instance, deployment.environment is stable, but user.id is not. If you put user.id into resource attributes, you create a new resource identity for every user, which makes aggregation and storage expensive.
Instead:
- Put
user.idon spans as an attribute only if you truly need it for debugging. - Prefer a stable grouping key like
user.segmentif you need analytics. - For metrics, use aggregated dimensions that you can tolerate at scale.
Operational Semantics That Matter
When you standardize resource attributes across services, you get consistent service-level dashboards without per-service exceptions. When you standardize instrumentation scope naming and versioning, you can interpret changes in telemetry patterns without guessing which library produced them.
In short: resource attributes define the stable identity of the telemetry producer, and instrumentation scope defines the stable identity of the instrumentation itself. Together, they make vendor-neutral data behave like a well-labeled dataset instead of a pile of events.
2.5 Collector Deployment Patterns for Local and Centralized Processing
Collector placement decides where you pay for CPU, where you enforce consistency, and how quickly you can react to bad telemetry. A good rule: keep instrumentation simple, then use the collector to normalize, filter, and route data.
Local Processing Pattern
In a local pattern, each host or cluster runs an OpenTelemetry Collector near the sources. The collector receives OTLP from instrumented services, performs lightweight processing, and exports to one or more backends.
When it fits
- You want to reduce cross-network traffic by filtering or sampling early.
- You need per-environment resource enrichment close to where service identity is known.
- You want faster feedback loops when a single service misbehaves.
What to do locally
- Add or normalize resource attributes such as
service.name,service.namespace, anddeployment.environment. - Apply basic filtering to drop noisy metrics or logs that you know you will never query.
- Batch and retry to smooth short bursts.
What to avoid locally
- Heavy transformations that require large lookups or complex aggregation rules.
- Central policy enforcement that must be identical across many environments.
Example local pipeline idea
- Receivers: OTLP over gRPC
- Processors: batch, resource detection, attribute normalization
- Exporters: one metrics backend and one trace backend
receivers:
  otlp:
    protocols:
      grpc:
        endpoint: 0.0.0.0:4317
processors:
  batch: {}
  resource: {attributes: []}
exporters:
  otlphttp:
    endpoint: https://backend.example/otlp
service:
  pipelines:
    traces:
      receivers: [otlp]
      processors: [batch]
      exporters: [otlphttp]
Centralized Processing Pattern
In a centralized pattern, instrumented services send OTLP to a shared collector tier. That tier applies consistent processing rules and routes to backends.
When it fits
- You need uniform semantic normalization across many teams.
- You want one place to enforce attribute requirements and naming conventions.
- You prefer simpler service-side configuration.
What to do centrally
- Enforce attribute presence and consistent naming for metrics, spans, and logs.
- Perform transformations that require shared context, such as mapping legacy attributes into semantic conventions.
- Route by tenant, environment, or service group.
What to avoid centrally
- Per-host resource detection that depends on local filesystem or network metadata, unless you can guarantee the same inputs.
- Extremely chatty enrichment that increases payload size before export.
Example centralized pipeline idea
- Receivers: OTLP over HTTP
- Processors: batch, attributes normalization, filtering, routing
- Exporters: multiple backends by signal type
receivers:
  otlp:
    protocols:
      http:
        endpoint: 0.0.0.0:4318
processors:
  batch: {}
  attributes:
    actions:
      - key: service.namespace
        action: upsert
        value: "payments"
exporters:
  logging: {verbosity: detailed}
service:
  pipelines:
    metrics:
      receivers: [otlp]
      processors: [batch, attributes]
      exporters: [logging]
Hybrid Pattern with Two Tiers
A hybrid pattern combines both: local collectors handle buffering and lightweight normalization, while centralized collectors enforce cross-service consistency.
Why it works
- Local collectors reduce the blast radius of network issues by buffering and retrying.
- Central collectors become the policy gate, so dashboards and alerts stay consistent.
Practical division of labor
- Local: batch, basic filtering, minimal resource enrichment.
- Central: semantic normalization, attribute mapping, routing, and final export.
Mind Map: Deployment Choices
Operational Checks That Prevent “It Looks Fine” Failures
- Verify pipeline separation by signal: traces, metrics, and logs should not share processors that assume a specific data shape.
- Confirm resource attribute consistency: check that
service.nameanddeployment.environmentappear on every exported record. - Measure queue behavior: if batching hides drops, you will only notice when dashboards go quiet.
- Test routing rules with sample payloads: a single mis-typed attribute can send all logs to the wrong backend.
Case Study: Choosing a Pattern for a Small Platform
A team runs 12 services across two environments. They want consistent service naming and want to avoid configuring every service with complex routing rules.
- They deploy a local collector per node to handle OTLP ingestion, batch, and basic resource detection.
- They deploy a centralized collector tier to enforce attribute mapping into semantic conventions and to route metrics and traces to different backends.
- They keep local collectors lean so CPU spikes from enrichment do not affect application latency.
The result is predictable dashboards because the centralized tier guarantees consistent attributes, while the local tier keeps ingestion resilient during short network hiccups.
3. OTLP Transport and Encoding for Vendor Neutral Telemetry
3.1 OTLP Protocol Overview for Metrics Logs and Traces
OTLP, short for OpenTelemetry Protocol, is the standard way OpenTelemetry components send telemetry data to a Collector or directly to a backend. It matters because it keeps instrumentation vendor-neutral while still letting you choose transports, security, and processing rules.
What OTLP Sends and How It Is Organized
OTLP carries three signal types: metrics, logs, and traces. Each signal has its own payload shape, but the overall delivery pattern is consistent: the sender batches records, attaches metadata, and transmits them to an OTLP endpoint.
A practical way to think about OTLP is “records in, batches out.” Your application produces individual spans, metric points, and log records. The SDK and/or Collector groups them into batches to reduce overhead and improve throughput.
Transport Options and Their Operational Impact
OTLP commonly uses two transports: gRPC and HTTP.
- gRPC is efficient for high-volume streaming-style workloads. It also supports strong typing for request/response semantics.
- HTTP is often simpler to route through existing HTTP infrastructure and load balancers.
In both cases, you configure an endpoint and credentials (if needed). The payload content is the same conceptually, but the wire format and request patterns differ.
Endpoint Shape and Request Routing
An OTLP endpoint is typically the host and port where the Collector listens. The Collector exposes separate handlers for traces, metrics, and logs, even if you use a single base address.
A common operational best practice is to keep the endpoint stable and route by signal type at the Collector. That way, you can change processing pipelines without redeploying applications.
Payload Structure at a Glance
OTLP requests include:
- Resource information: who produced the telemetry (service name, environment, host identity).
- Instrumentation scope: which library or component created the data.
- Signal-specific records:
- Traces: spans with trace and span identifiers, timing, attributes, events, and status.
- Metrics: metric descriptors plus datapoints with timestamps and values.
- Logs: log records with timestamps, severity, body, and attributes.
This separation is what makes semantic conventions work across signals. Resource attributes provide consistent identity, while signal records carry the details you query.
Batching, Timing, and Backpressure
OTLP senders batch data to reduce per-request overhead. Batching introduces two practical concerns:
- Latency: larger batches can delay visibility.
- Backpressure: if the Collector is slow, buffers fill.
A good rule of thumb is to tune batch size and export interval based on your tolerance for delay and your tolerance for memory growth. The Collector’s queueing and retry behavior also affects end-to-end delivery.
Error Handling and Delivery Semantics
OTLP export is not “fire and forget.” When the Collector rejects a request (for example, due to malformed data or auth failures), the sender receives an error and can retry depending on configuration.
For traces and metrics, partial acceptance can happen at the batch level. That means you should validate that your Collector logs show consistent ingestion rather than only checking that “something arrived.”
Mind Map: OTLP Data Flow and Responsibilities
Example: Minimal OTLP Export Setup Conceptually
Imagine an application exporting all three signals to a Collector. The application SDK produces telemetry, batches it, and sends OTLP requests to the Collector endpoint.
On the Collector side, the OTLP receiver accepts requests, then forwards them into signal-specific pipelines. Those pipelines can normalize attributes, filter noise, and export to your storage.
Even without showing configuration syntax, the key idea is consistent: OTLP is the intake contract; pipelines are the transformation and delivery logic.
Example: Traces Request Content You Should Expect
For a single incoming request in your application, OTLP traces typically include:
- A span representing the server-side handler.
- A span representing downstream work (client calls, database operations, or messaging).
- Shared trace identifiers so the spans correlate in queries.
- Attributes that match semantic conventions, such as HTTP method and route, when applicable.
If you see spans arriving without expected correlation identifiers or missing key attributes, the issue is usually in instrumentation or semantic mapping, not in OTLP itself.
Example: Metrics and Logs Share Resource Identity
Metrics datapoints and log records both reference the same resource identity fields. That consistency is what lets you correlate “what happened” (logs), “how it behaved” (metrics), and “where it happened” (traces) using the same service and environment attributes.
When you design your resource attributes carefully, OTLP becomes a reliable transport layer rather than a source of inconsistency.
3.2 gRPC Versus HTTP Transport Selection and Operational Tradeoffs
Choosing between gRPC and HTTP for OTLP is mostly about how you want the network behavior to feel under load. Both can carry the same telemetry concepts, but they differ in framing, connection usage, error surfaces, and operational knobs.
Core Transport Differences That Matter
gRPC runs over HTTP/2 and uses a binary framing model. That typically means fewer bytes spent on headers and more predictable streaming behavior when many requests are in flight. HTTP/1.1 or HTTP/2 OTLP endpoints can also work, but the “shape” of requests and responses is different: you often see more request/response boundaries and different buffering behavior.
In practice, the biggest operational differences show up in four areas: connection management, payload framing, error handling, and middlebox behavior.
Mind Map: Transport Selection Factors
Connection Management and Concurrency
With gRPC, HTTP/2 multiplexing lets one connection carry many concurrent RPCs. That reduces connection churn and can smooth out bursts when your application exports frequently. The tradeoff is that you need to ensure your load balancer and network path handle HTTP/2 correctly; otherwise you may see intermittent failures that look like “random” export drops.
With HTTP OTLP, you may end up with more frequent new requests, depending on client settings and server behavior. This can be perfectly fine, especially when your exporter batches and sends less often. The operational question becomes: do you prefer fewer long-lived connections (HTTP) or fewer connection setups with multiplexing (gRPC)?
Payload Framing and Backpressure
gRPC’s framing can make it easier for the transport to handle partial progress and streaming patterns. Even when you are not streaming telemetry, the underlying model tends to behave well when the client is producing data continuously.
HTTP payloads are typically sent as discrete bodies. If your exporter batches too aggressively, you can create large request bodies that increase latency and memory pressure. If you batch too conservatively, you increase request count and overhead. Either way, the transport amplifies the consequences of poor batching.
A practical rule: tune batching first, then choose the transport. Transport choice changes the “cost curve,” but batching determines where you sit on it.
Error Handling and Retry Semantics
gRPC surfaces failures via gRPC status codes and often includes richer details about why an RPC failed. HTTP surfaces failures via HTTP status codes and may include different error bodies depending on the server.
Operationally, you want your exporter to treat transient network issues differently from permanent configuration problems. For example:
- If you see timeouts or connection resets, retries can help, but you must cap retry attempts to avoid amplifying load.
- If you see authentication errors or schema/validation failures, retries usually waste time and can flood logs.
Because error surfaces differ, you should verify how your collector reports them. A collector that logs “exporter failed” without the underlying status code makes both transports harder to troubleshoot.
Middlebox Compatibility and Timeouts
Some environments are less comfortable with HTTP/2. Common culprits include older proxies, strict idle timeouts, and load balancers that mishandle multiplexed traffic. When that happens, gRPC can fail in ways that are consistent but non-obvious, such as repeated reconnects.
HTTP often has broader baseline compatibility, especially when HTTP/1.1 is used. The tradeoff is that you may pay more overhead per request and see more sensitivity to client-side timeouts.
If you operate through a corporate proxy, test both transports in the same network path. Don’t compare them in a lab that bypasses the production proxy.
Example: Choosing Based on Export Pattern
Suppose you have a service that exports every 5 seconds with moderate batch sizes.
- If you expect many concurrent requests and want stable connection behavior, gRPC is usually a strong fit because multiplexing reduces overhead during bursts.
- If your environment has strict HTTP/2 constraints or you see frequent reconnects, HTTP can be simpler to operate, especially if batching keeps request sizes reasonable.
Example: Operational Checklist
- Confirm the collector endpoint supports the chosen OTLP transport.
- Verify network path supports HTTP/2 end-to-end if using gRPC.
- Set exporter timeouts to values that match your network latency budget.
- Ensure batching is configured so request bodies stay within safe limits.
- Check collector logs for the actual failure status, not just a generic “failed to export.”
Practical Decision Summary
Pick gRPC when you want efficient multiplexing and you trust the network path to handle HTTP/2 reliably. Pick HTTP when you need maximum compatibility or when your environment’s HTTP/2 handling is uncertain. In both cases, correct batching and clear failure reporting matter more than the transport label.
3.3 Endpoint Configuration and Network Considerations
Endpoint configuration is where “it works on my machine” meets the real world. OTLP endpoints define where telemetry goes, how it’s transported, and what the network will allow. A good setup makes failures obvious, keeps latency predictable, and avoids silent data loss.
Transport Choice and Endpoint Shape
OTLP commonly uses either gRPC or HTTP. The collector and SDKs both accept OTLP endpoints, but the exact URL or host/port fields differ by transport.
- gRPC typically uses a host and port, with the client speaking HTTP/2 under the hood.
- HTTP typically uses a full URL path to the OTLP receiver.
A practical rule: treat the endpoint as a contract. If you change transport, you often change configuration keys, TLS settings, and sometimes proxy behavior.
Host, Port, and Path Details That Matter
For gRPC, you usually specify something like host:port. For HTTP, you specify a URL including the receiver path. If you’re behind a reverse proxy, the path must match what the proxy forwards.
Common pitfalls:
- Wrong port: the collector is listening on one port, but the SDK exports to another.
- Wrong path: HTTP OTLP receivers expect a specific route; a missing or extra segment breaks delivery.
- IPv4 versus IPv6 mismatch: some environments resolve
localhostdifferently than expected.
TLS, Certificates, and Verification Behavior
TLS is not just “turn it on.” You need to decide whether the client verifies the server certificate.
- In production, prefer certificate verification so misrouting doesn’t quietly succeed.
- If you use internal CAs, ensure the client trusts them.
- For local testing, it’s tempting to disable verification; do it only in controlled environments and keep the setting explicit.
When debugging, confirm three things: the scheme (http vs https), the certificate chain, and the hostname used for verification.
Proxies, Load Balancers, and Connection Lifetimes
Network middleboxes can change behavior in ways that look like application bugs.
- HTTP proxies may require explicit configuration for CONNECT or may not support HTTP/2 end-to-end.
- Load balancers can close idle connections; if the exporter keeps a long-lived connection, you may see intermittent failures.
- NAT gateways can run out of ephemeral ports under high telemetry volume.
A simple operational check is to compare exporter error logs with collector receiver logs. If the collector never receives anything, the issue is upstream networking or endpoint addressing.
Timeouts, Retries, and Backpressure
Telemetry should not block the application indefinitely. Exporters typically buffer and retry, but the buffering strategy has limits.
Key knobs:
- Timeout: how long the exporter waits for a response.
- Retry policy: how it behaves after transient failures.
- Queue size: how much data can accumulate before dropping.
A useful mental model: timeouts and retries trade off between delivery and resource usage. If timeouts are too short, you’ll retry aggressively. If they’re too long, you’ll hold resources while the network is unhealthy.
Example Collector Endpoint Configuration
Below is a minimal collector receiver setup for OTLP over both transports. Adjust ports and TLS to match your environment.
receivers:
  otlp:
    protocols:
      grpc:
        endpoint: 0.0.0.0:4317
      http:
        endpoint: 0.0.0.0:4318
If you place the collector behind a load balancer, ensure the LB forwards both ports (or only the one you use) and preserves the protocol.
Example SDK Exporter Endpoint Configuration
This example shows OTLP over HTTP with a full URL. The exact path must match the collector’s OTLP HTTP receiver.
exporters:
  otlphttp:
    endpoint: http://collector.example.internal:4318
    headers:
      x-tenant-id: "acme"
If you switch to HTTPS, update the scheme and ensure certificate trust is configured.
Mind Map: Endpoint and Network Concerns
Practical Debugging Checklist
When telemetry disappears, avoid guessing. Verify reachability first, then protocol correctness, then TLS, then timeouts.
- Confirm the collector is listening on the expected port(s).
- Confirm the SDK endpoint matches transport and path.
- If TLS is enabled, confirm the certificate chain and hostname.
- Check exporter logs for timeout or retry patterns.
- Check collector receiver logs for incoming requests and decoding errors.
A well-configured endpoint turns “mysterious missing data” into a short list of concrete, testable causes.
3.4 Authentication and Secure Transport for OTLP Endpoints
OTLP endpoints are where telemetry leaves your environment, so treat them like a network boundary: authenticate who is allowed to send data, and protect the data in transit. In practice, you’ll combine transport security (usually TLS) with application-level authentication (often tokens or mTLS). The goal is simple: only authorized clients can connect, and intermediaries can’t read or tamper with the payload.
Core Threats and What Each Control Prevents
Start with a quick mapping from problem to control:
- Eavesdropping: Without TLS, anyone on the path can read telemetry payloads. TLS provides confidentiality.
- Impersonation: Without authentication, any host can send fake telemetry. Authentication blocks unauthorized clients.
- Tampering: Without integrity protection, payloads can be modified in transit. TLS integrity prevents this.
- Replay: Some attackers can resend captured traffic. Strong TLS plus short-lived credentials reduces risk.
Secure Transport with TLS
Most OTLP deployments use HTTPS (HTTP/2) or gRPC over TLS. Configure the OTLP exporter to use TLS and validate the server identity.
Key choices:
- Server certificate validation: Prefer system trust stores or explicitly pinned CA certificates. Disabling verification is a common “it works on my machine” trap.
- Hostname matching: Ensure the endpoint hostname matches the certificate subject or SAN.
- Cipher and protocol defaults: Use library defaults unless you have a documented reason to change them.
Example: configuring an OTLP exporter to use TLS with a custom CA.
exporters:
  otlp/secure:
    endpoint: "otel-collector.example.com:4317"
    tls:
      ca_file: "/etc/ssl/certs/ca-bundle.crt"
      insecure: false
If you’re using HTTP OTLP (typically port 4318), the same principles apply: HTTPS with certificate validation.
Authentication Options for OTLP Endpoints
Authentication answers: “Who is allowed to send telemetry?” Common approaches include:
- Bearer tokens: A shared token or per-client token placed in an Authorization header.
- API keys: Similar to bearer tokens but often managed as keys with rotation policies.
- mTLS client certificates: Each client has its own certificate; the server validates it.
Bearer tokens are operationally straightforward, while mTLS is stronger for environments where you want identity tied to certificates rather than secrets.
Bearer Token Authentication with OTLP
When using bearer tokens, ensure the token is stored securely (for example, mounted as a file or injected via a secret manager) and never hard-coded in config files committed to source control.
Example: adding a bearer token to an OTLP exporter.
exporters:
  otlp/secure:
    endpoint: "otel-collector.example.com:4317"
    headers:
      Authorization: "Bearer ${OTLP_TOKEN}"
On the collector side, you must configure an authentication mechanism that checks the Authorization header. The exact configuration depends on the collector’s authentication capabilities and your deployment pattern, but the principle is consistent: reject requests without a valid token before accepting payloads.
mTLS Authentication with Client Certificates
With mTLS, the server verifies the client certificate, and the client verifies the server certificate. This gives you mutual identity and reduces the chance of “token leaked, now anyone can send.”
Example: enabling client certificate authentication from the exporter.
exporters:
  otlp/secure:
    endpoint: "otel-collector.example.com:4317"
    tls:
      ca_file: "/etc/ssl/certs/ca-bundle.crt"
      cert_file: "/etc/otel/client.crt"
      key_file: "/etc/otel/client.key"
      insecure: false
On the collector side, you configure it to require client certificates and validate them against a trusted CA. Also ensure certificate rotation is planned so telemetry doesn’t silently stop when credentials expire.
Authorization Boundaries and Least Privilege
Authentication proves identity; authorization decides what that identity can do. For telemetry, least privilege usually means:
- Allow only the expected services or namespaces to send to a given collector endpoint.
- Restrict access to administrative endpoints separately from OTLP ingestion.
- Keep different environments (dev, staging, prod) on separate credentials and endpoints.
A practical rule: if you can’t explain which service owns a credential, you probably can’t operate it safely.
Mind Map: Authentication and Secure Transport for OTLP
Practical Validation Checklist
Before you trust the pipeline, verify behavior under both success and failure:
- Success path: confirm the exporter connects and data arrives with the expected resource attributes.
- Missing credentials: confirm requests without Authorization or client cert are rejected.
- Wrong credentials: confirm invalid tokens or untrusted client certs are rejected.
- Certificate issues: confirm expired or mismatched certificates fail fast rather than falling back to insecure modes.
A secure OTLP endpoint should fail predictably. When it doesn’t, you’ll usually find either certificate verification disabled, credentials injected incorrectly, or the collector not enforcing the expected auth check.
3.5 Validating OTLP Payloads with Practical Debugging Techniques
Validating OTLP payloads is less about “it sends” and more about “it means what you think it means.” The goal is to confirm three things: the exporter is producing valid OTLP, the collector is accepting it, and the resulting telemetry matches the semantic intent (names, attributes, and relationships).
What to Validate First
Start with the smallest, most observable checkpoints.
- Transport success: the collector receives something at the configured OTLP endpoint.
- Schema validity: the payload is well-formed OTLP for the signal type (metrics, logs, traces).
- Semantic correctness: key fields exist and follow expected naming patterns.
- Correlation correctness: trace and span identifiers line up so downstream queries can join data.
A common mistake is to validate only step 1. You can get “successful export” while still producing empty resource attributes, missing required fields, or mismatched trace context.
A Systematic Debugging Workflow
Step 1: Confirm Signal Routing
Make sure the exporter is targeting the right endpoint and protocol.
- If you use OTLP/gRPC, verify the port and that the collector receiver is configured for gRPC.
- If you use OTLP/HTTP, verify the path and that the receiver is configured for HTTP.
A quick sanity check is to temporarily enable verbose logging on the collector receiver and watch for “received” events tied to the correct signal type.
Step 2: Inspect Payload Shape Without Guessing
When you can’t easily view the raw OTLP, you still can validate shape by checking what the collector forwards.
- Enable debug-level logs for the pipeline components.
- Use a “debug exporter” or a local logging exporter to print processed telemetry.
You’re looking for structural markers:
- Traces: resource attributes, scope/instrumentation scope, spans with span kind, trace id, span id, parent span id when applicable.
- Metrics: resource attributes, metric name, instrument type, data points with timestamps and values.
- Logs: resource attributes, log body, severity, trace id and span id when correlation is expected.
Step 3: Validate Required Fields and Naming Consistency
Semantic conventions are strict enough that small deviations can break dashboards.
Check these categories:
- Resource identity: service name, service namespace (if used), service version, deployment environment.
- Attribute naming: consistent prefixes and stable keys for dimensions.
- Units and types: metric values should be numeric with correct unit expectations.
If you see missing resource attributes, it often means resource detection didn’t run or the exporter didn’t set them.
Step 4: Validate Trace Context and Parentage
For traces, confirm that:
- trace id stays constant across spans in the same request flow.
- parent-child relationships match the expected call graph.
- span kind aligns with client/server roles.
For logs, confirm that trace id and span id are present when your logging instrumentation is configured to correlate.
Mind Map: Validation Checklist
Practical Examples
Example: Detecting a Wrong Endpoint
If your collector receiver is configured for OTLP/HTTP but the exporter is sending OTLP/gRPC, you may still see “export attempts” but no usable telemetry.
- Symptom: debug output shows no spans/metrics/logs.
- Fix: align exporter protocol with collector receiver configuration.
Example: Spotting Missing Resource Attributes
Suppose your backend expects service.name but the debug output shows only generic host attributes.
- Symptom: dashboards show “unknown service” or empty groupings.
- Fix: ensure resource detection is enabled and that the exporter/SDK sets service identity.
Example: Catching Broken Parentage
If you see spans with the same trace id but no parent-child links, it usually means context propagation failed.
- Symptom: traces look like a flat list.
- Fix: verify propagation headers are injected on outgoing requests and extracted on incoming requests.
Minimal Collector Debug Configuration
Use a debug exporter to print what the collector actually forwards.
receivers:
  otlp:
    protocols:
      grpc:
      http:
exporters:
  debug:
    verbosity: detailed
service:
  pipelines:
    traces:
      receivers: [otlp]
      exporters: [debug]
    metrics:
      receivers: [otlp]
      exporters: [debug]
    logs:
      receivers: [otlp]
      exporters: [debug]
This configuration helps you validate structure and correlation at the collector boundary, which is where many “it exported but nothing makes sense” issues become obvious.
What “Good” Looks Like
Good validation results in a consistent story:
- The collector receives the intended signal type.
- The payload contains the expected resource identity and instrumentation scope.
- Traces show correct trace id and parentage.
- Metrics include the expected metric names and dimensions.
- Logs include trace correlation fields when configured.
Once those checks pass, you can trust that any remaining issues are usually backend mapping or query logic rather than OTLP payload correctness.
4. Semantic Conventions for Metrics and Resource Modeling
4.1 Semantic Conventions Principles and Attribute Naming Rules
Semantic conventions are the shared vocabulary that makes telemetry comparable across services, teams, and backends. The goal is simple: when you say “HTTP method” or “service name,” everyone means the same thing, and queries don’t turn into scavenger hunts.
Principle One: Use Meaning Before Convenience
Start with the concept you’re describing, then choose the attribute that represents it. If you invent a custom attribute like http_method_name, you may still be able to query it, but you’ve lost interoperability with dashboards, alerts, and tooling that expect the standard key.
Example:
- Prefer
http.request.method = "GET"overrequest_method = "GET". - Prefer
db.system = "postgresql"overdatabaseType = "postgres".
This rule also affects value choices. For categorical fields, use the expected set of values (for example, standard HTTP methods), rather than free-form strings that differ by team.
Principle Two: Keep Keys Stable and Values Consistent
Attribute keys should not change meaning over time. If you rename service.name to something else, you break historical continuity and make correlation harder.
Example:
- Stable key:
service.namealways identifies the logical service. - Stable value:
service.name = "checkout-api"stays the same even if the deployment changes.
When you must change a value, do it by introducing a new attribute or by versioning at the source, not by silently repurposing the old key.
Principle Three: Model the Right Level of the System
Telemetry attributes often come from different “levels”: process, service, request, and operation. Semantic conventions help you place each attribute at the correct level so aggregation behaves predictably.
Example:
- Put identity at the resource level:
service.name,service.namespace,service.instance.id. - Put request details at the span level:
http.target,http.status_code. - Put database details at the span level:
db.name,db.operation.
If you mix levels, you get confusing results like “average latency per instance” when you meant “per service.”
Principle Four: Prefer Standard Keys for Cross-Signal Correlation
Correlation works best when the same concept uses the same key across traces, metrics, and logs. Even if your backend can correlate by trace IDs, consistent attribute naming improves filtering and grouping.
Example:
- Use
trace_idandspan_idin logs only as needed for correlation, but keep the rest of the context aligned with the same semantic keys used in traces.
Principle Five: Use Attributes to Enable Query Patterns
A good attribute choice supports the queries you actually run. Think in terms of dimensions: what do you group by, filter by, and compare?
Example query patterns to design for:
- “Latency by route”: group by
http.routeand filter byservice.name. - “Errors by dependency”: group by
db.systemanddb.operation. - “Throughput by queue”: group by
messaging.systemandmessaging.destination.
Attribute Naming Rules That Prevent Pain Later
Semantic conventions follow a few practical rules that you can apply even when you’re not sure which exact key to use.
- Use the correct prefix family: keys are organized by concept families like
http.*,db.*,messaging.*,service.*. - Use the expected casing and separators: keys are typically lowercase with dots as separators.
- Choose the most specific attribute available: if you have
http.route, don’t fall back to a generichttp.pathunless the standard expects otherwise. - Avoid mixing synonyms: don’t store the same idea under two keys (for example, both
http.methodandhttp.request.method) unless you have a clear reason. - Don’t overload a key:
http.status_codeshould be an HTTP status code, not an application error code.
Mind Map: Semantic Conventions and Naming Discipline
Example: From Raw Fields to Semantic Attributes
Suppose your application logs include method, path, and status. A semantic mapping turns that into query-friendly telemetry.
- Raw fields:
method = "GET",path = "/v1/orders/123",status = 404 - Semantic attributes:
http.request.method = "GET"http.target = "/v1/orders/123"(orhttp.routeif you have a normalized route)http.status_code = 404
Now a single query can group across services, because the keys mean the same thing everywhere.
Example: A Common Mistake and Its Fix
Mistake:
http.status_code = "NOT_FOUND"(string instead of numeric code)
Fix:
http.status_code = 404
This matters because numeric fields aggregate and filter differently than strings, and backends often apply type-aware processing.
Summary of the Practical Rules
Choose standard keys for standard concepts, keep keys and values stable, model attributes at the correct level, and design naming so your usual queries work without custom logic. If you do that, your telemetry becomes easier to interpret and harder to misread.
4.2 Defining Service Identity with Resource Attributes
Service identity is the part of your telemetry that answers one practical question: “Which service produced this data?” In OpenTelemetry, that answer is carried primarily by resource attributes. If you get this right, dashboards, alerts, and cross-signal correlation become straightforward. If you get it wrong, you’ll spend time reconciling “almost the same” services that differ by a single attribute.
What Resource Attributes Mean in Practice
A resource is a set of key-value attributes attached to telemetry emitted by an SDK. For example, when your application emits spans and metrics, the SDK attaches the same resource identity to both signals (unless you intentionally override it). This consistency matters because queries often group by service identity across metrics, logs, and traces.
A good resource identity is:
- Stable: it should not change per request.
- Descriptive: it should identify the service and its deployment context.
- Low cardinality: avoid per-user or per-request values.
The Minimum Set of Identity Attributes
Start with a small, reliable set. Commonly used attributes include:
service.name: the human-readable service name.service.namespace: an optional grouping for organizations or platforms.service.instance.id: a stable identifier for a specific instance (pod, VM, or process).deployment.environment: values likeproduction,staging, ordevelopment.
A practical rule: if you can’t explain the attribute to an on-call engineer in one sentence, it’s probably not the right attribute for resource identity.
Example Service Identity
Imagine an API service running in Kubernetes. You might set:
service.name = orders-apiservice.namespace = ecommerceservice.instance.id = orders-api-7f9c2a1b(pod name or a stable container id)deployment.environment = production
Now every span, metric, and log record emitted by that process carries the same identity.
Choosing service.name Without Regret
service.name is the anchor for most grouping. Keep it consistent across languages and deployments. If you rename it, you effectively create a new service in your observability backend.
A simple convention works well:
- Use a short, lowercase, hyphenated name like
orders-api. - Keep it aligned with how your team refers to the service.
- Avoid including environment in
service.nameif you already havedeployment.environment.
Using service.namespace for Organizational Grouping
service.namespace helps when you have multiple teams or platforms. For example, you might use ecommerce for the business domain and keep service.name focused on the specific service.
If you don’t have a natural namespace, it’s acceptable to omit it. The key is avoiding a “fake namespace” that forces you to maintain a taxonomy later.
When service.instance.id Matters
service.instance.id is useful when you need to answer questions like:
- Which instance is producing errors?
- Is a rollout causing a subset of pods to misbehave?
However, it can increase cardinality. Use a stable instance identifier, not a random value per process start unless you truly want that behavior.
In Kubernetes, pod names change during rescheduling. That’s okay if you treat instance identity as “this running unit right now.” If you need longer-lived identity, use a deployment-specific identifier plus a stable container id.
Mind Map: Resource Attributes for Service Identity
Advanced Details That Prevent Subtle Bugs
Avoid Per-Request Values in Resource
Resource attributes are attached at the SDK level, so they should not vary per request. If you put request-specific data into resource attributes, you’ll create high-cardinality dimensions and make aggregation expensive.
Instead, use request-specific data as span attributes (for traces) or log fields (for logs). Resource identity should remain the same while the request flows.
Keep Identity Consistent Across Signals
If your metrics and traces are emitted by different SDK instances or different processes, ensure they share the same resource identity configuration. A common failure mode is setting service.name in one place but forgetting it in another, leading to split dashboards.
Example: Resource Identity Configuration Pattern
Below is a conceptual pattern for setting resource attributes. The exact API differs by language, but the idea is consistent: create a resource once, reuse it, and attach it to the telemetry pipeline.
Resource attributes:
- service.name: orders-api
- service.namespace: ecommerce
- deployment.environment: production
- service.instance.id: orders-api-7f9c2a1b

Attach this resource to:
- tracer provider
- meter provider
- logger provider
A Quick Consistency Checklist
Before you ship, verify:
service.nameis identical across services that should be the same.deployment.environmentis present and uses consistent values.service.instance.idis stable enough for your debugging needs.- No request-specific values appear in resource attributes.
When these conditions hold, your observability system can group and correlate telemetry by service identity without surprises. That’s the boring part done correctly, which is exactly what you want.
4.3 Metrics Instrument Types and Aggregation Semantics
Metrics in OpenTelemetry are built from two ideas that work together: an instrument type tells you how values are recorded, and aggregation semantics tell you how those values are combined over time. If you get either wrong, dashboards will look plausible while telling the wrong story.
Instrument Types as Recording Behaviors
Think of an instrument as a contract between your code and the collector/backend.
- Counter records values that only increase. Use it for totals like requests received. The backend aggregates by summing increments.
- UpDownCounter can go up and down. Use it for gauges that represent a changing quantity but still want sum-based aggregation, such as in-flight jobs. The backend sums positive and negative deltas.
- Histogram records a distribution by bucketing observed values. Use it for latencies and payload sizes. The backend aggregates by counting observations per bucket and tracking totals.
- Gauge represents a value at a point in time. Use it for current queue depth or memory usage. The backend aggregates by choosing a strategy such as last value, min/max, or average depending on configuration.
A practical rule: if you can explain the metric as “this never decreases,” start with a Counter. If you can explain it as “this is a current reading,” start with a Gauge. If you can explain it as “this is a sample of a distribution,” start with a Histogram.
Aggregation Semantics as Time-Window Math
Aggregation semantics define what happens between collection intervals. Most backends treat metrics as time series with a temporality and a set of aggregation functions.
- Temporality describes whether the backend expects cumulative values (typical for counters) or values per interval (typical for some gauge-like patterns).
- Bucket boundaries for histograms define how values are grouped. If your buckets are too coarse, p95 becomes a guess. If they’re too fine, you pay with storage and compute.
- Label dimensions determine how series are split. More label combinations means more series, which affects cost and query complexity.
The collector may also apply transformations, but the core semantics still come from the instrument type and the metric’s intended meaning.
Choosing the Right Instrument for Common Scenarios
Requests and Errors
Use a Counter for total requests and a Counter for total errors. Add a label like http.method and http.status_code to slice results.
Example reasoning: a request total should never decrease, even if you restart the process. If you restart, the counter resets; the backend can handle that when it knows the temporality and reset behavior.
In-Flight Work
Use an UpDownCounter for in-flight tasks if you record deltas at state transitions (start increments, finish decrements). This avoids sampling artifacts that happen when you only read “current” values.
Latency Distributions
Use a Histogram for request duration. Record the duration once per request. Choose buckets that match your SLO shape. For example, if most requests are under 200ms but you care about slow tails, include dense buckets in the low hundreds of milliseconds.
Current Queue Depth
Use a Gauge for queue depth if you can read it directly. If you only have events (enqueue/dequeue), you can also model it with an UpDownCounter, but then you’re aggregating deltas rather than reporting a direct measurement.
Mind Map: Instrument Types and Semantics
Example: Mapping Code Intent to Metric Semantics
Suppose you want to track HTTP request duration and total requests.
- Record duration with a Histogram so you can compute percentiles from bucketed counts.
- Record request totals with a Counter so you can compute rates over time.
Metric: http.server.duration
Instrument: Histogram
Record: observe(duration_ms) once per request
Aggregation: bucket counts over time windows

Metric: http.server.request_count
Instrument: Counter
Record: add(1) once per request
Aggregation: sum of increments over time windows
Example: Avoiding Semantic Mismatches
If you record request duration into a Gauge by setting it to the latest observed duration, you lose the distribution. A dashboard might still show a line, but it will represent “last sample,” not “typical latency.” Similarly, if you use a Counter for something that goes down, you’ll either produce negative increments that violate the intended meaning or force awkward workarounds.
Summary of the System
Instrument type answers: what kind of value are you recording? Aggregation semantics answer: how will the system combine those values over time and across label dimensions? When both match the metric’s real-world meaning, queries become straightforward and the numbers stay honest.
4.4 Designing Metric Names and Labels with Consistent Dimensions
Metric names and labels are how you turn raw measurements into something you can query without guessing. The goal is simple: every metric should be identifiable by its name, and every slice of that metric should be describable by a consistent set of dimensions.
Metric Names That Stay Stable
Use a metric name that describes what is being measured, not how it is computed. Prefer a pattern like http.server.duration or db.client.connections where the prefix groups related metrics and the suffix clarifies the unit or meaning.
Keep these rules practical:
- Use a consistent separator style across your system (commonly dots). Mixing styles makes dashboards brittle.
- Avoid embedding high-cardinality values in the name. If you need to distinguish by
user_id, that belongs in a label, not the name. - Choose one unit convention and stick to it. If you use seconds, always use seconds. If you use bytes, always use bytes.
A quick example: http.server.request.duration is better than request_duration_ms_by_endpoint because the name stays about the measurement, while the endpoint detail belongs in labels.
Labels That Form Predictable Dimensions
Labels (also called attributes or dimensions depending on the ecosystem) are the axes you group by. Consistency matters more than cleverness.
A label set should answer: “What are the dimensions that define a meaningful slice of this metric?” For HTTP server metrics, typical dimensions include:
http.methodhttp.routeorhttp.targethttp.status_codeservice.name
Not every metric needs every dimension, but when a dimension exists, it should mean the same thing everywhere. For example, if http.route is a normalized route template in one place, don’t switch to raw paths in another.
Cardinality Control Without Losing Usefulness
High-cardinality labels (like user_id, request_id, or full URLs) explode the number of time series. The result is slower queries and higher storage costs.
A systematic approach:
- List candidate labels you might want to filter by.
- Mark which ones are stable (few values) versus explosive (many values).
- Keep stable dimensions on the metric.
- Move explosive details to logs or traces, where they are naturally tied to a single event.
Example: If you want to investigate a single failing user, don’t add user_id to http.server.errors. Instead, keep http.status_code and http.route on the metric, then use logs or traces to find the specific user.
Designing a Dimension Contract
Treat the label set as a contract between instrumentation and queries.
- Name labels consistently:
http.status_codeshould always be numeric or always be string, but don’t mix. - Use the same normalization strategy: route templates should be consistent across services.
- Document required versus optional labels: required labels are always present; optional labels may be absent for some code paths.
Here’s a concrete pattern for HTTP server request duration:
- Metric:
http.server.duration - Unit: seconds
- Labels:
http.method,http.route,http.status_code
Then your queries become predictable: “Average duration for GET /checkout with 200 responses.” No detective work required.
Mind Map: Metric Names and Label Dimensions
Example: Two Metrics with Different Label Sets
Suppose you instrument both request counts and request durations.
Metric A: Request Count
- Name:
http.server.request.count - Labels:
http.method,http.route,http.status_code
Metric B: Request Duration
- Name:
http.server.request.duration - Labels:
http.method,http.route,http.status_code
Keeping the same label set across both metrics makes it easy to correlate “count spikes” with “latency changes.” If you later add a new label like deployment.environment, you can apply it consistently to both metrics.
Example: Normalization Choices That Prevent Confusing Data
If http.route sometimes contains /users/123 and other times contains /users/{id}, your dashboards will show fragmented series. The fix is to normalize at instrumentation time so http.route always uses the same template style.
A practical rule: if a label value can vary per request, it probably shouldn’t be a metric dimension.
Example: A Label Set Checklist
Before you ship a metric, verify:
- The metric name describes the measurement and unit.
- Each label is a dimension you will actually group by.
- No label values are request-unique.
- The meaning and normalization of each label are consistent across services.
- The label set supports the queries you already know you’ll write.
When these checks pass, your metrics become easy to reason about. When they don’t, you’ll end up with dashboards that look correct but behave like puzzles.
4.5 Example Metric Schemas for HTTP RPC Database and Messaging
This section turns semantic conventions into concrete metric schemas you can model consistently across services. The goal is simple: every metric should answer a predictable question when you look at it later—without needing tribal knowledge.
Metric Schema Building Blocks
A useful schema has five parts:
- Metric identity: name and unit.
- Aggregation intent: sum, count, gauge, histogram.
- Dimensions: the labels you group by.
- Resource context: service and deployment identity.
- Event meaning: what exactly is being measured.
A practical rule: keep dimensions small and stable. If you wouldn’t want to group by it in a dashboard, it probably shouldn’t be a dimension.
Mind Map: Metric Schema Design
HTTP Request Metrics Schema
Use HTTP metrics to answer: “How fast and how often are requests happening, and what outcomes do we see?”
Schema A: Request Latency Histogram
- Metric name:
http.server.duration - Instrument type: histogram
- Unit: milliseconds (or nanoseconds, but be consistent)
- Dimensions:
http.method(GET, POST)http.route(templated route like/orders/{id})http.status_code(200, 404, 500)network.protocol(optional, e.g.,http/1.1,http/2)
- Resource context:
service.nameservice.namespace(if you use it)deployment.environment(e.g.,prod,staging)
Schema B: Request Count Counter
- Metric name:
http.server.request_count - Instrument type: counter
- Unit: 1
- Dimensions: same as latency, but you can omit
network.protocolto reduce cardinality.
Example reasoning: http.route should be templated. If you use raw paths, cardinality explodes and dashboards become slow.
RPC Client and Server Metrics Schema
RPC metrics answer: “What is the behavior of remote calls, and which method is involved?”
Schema C: RPC Duration Histogram
- Metric name:
rpc.client.duration - Instrument type: histogram
- Unit: milliseconds
- Dimensions:
rpc.system(e.g.,grpc)rpc.service(service name in the RPC framework)rpc.method(method name)rpc.grpc.status_codeorrpc.status_codedepending on your stack
Schema D: RPC Request Count Counter
- Metric name:
rpc.client.request_count - Instrument type: counter
- Unit: 1
- Dimensions: same as duration.
Example reasoning: keep rpc.method stable and avoid including request-specific identifiers. If you need those, put them in logs, not metric dimensions.
Database Metrics Schema
Database metrics answer: “How often do queries run, and how long do they take?”
Schema E: Database Query Duration Histogram
- Metric name:
db.client.query.duration - Instrument type: histogram
- Unit: milliseconds
- Dimensions:
db.system(e.g.,postgresql,mysql)db.operation(e.g.,SELECT,INSERT,UPDATE)db.name(optional; include only if it’s low cardinality)
Schema F: Database Query Count Counter
- Metric name:
db.client.query_count - Instrument type: counter
- Unit: 1
- Dimensions: same as duration.
Example reasoning: avoid labeling by full SQL text. If you must distinguish query shapes, use an application-level operation label like db.operation or a precomputed query name.
Messaging Metrics Schema
Messaging metrics answer: “Are messages flowing, and what are the delivery and processing characteristics?”
Schema G: Messaging Consumer Processing Duration Histogram
- Metric name:
messaging.consumer.duration - Instrument type: histogram
- Unit: milliseconds
- Dimensions:
messaging.system(e.g.,kafka,rabbitmq)messaging.destination(topic or queue name)messaging.operation(e.g.,consume,process)messaging.message_type(optional; only if bounded)
Schema H: Messaging Publish and Consume Count Counters
-
Metric name:
messaging.producer.publish_count -
Instrument type: counter
-
Unit: 1
-
Dimensions:
messaging.system,messaging.destination -
Metric name:
messaging.consumer.consume_count -
Instrument type: counter
-
Unit: 1
-
Dimensions:
messaging.system,messaging.destination
Example reasoning: messaging.destination is usually safe because it’s limited by your infrastructure. If you include partition IDs or per-message keys, cardinality will grow without mercy.
Putting It Together with a Consistent Label Set
Across HTTP, RPC, DB, and messaging, you’ll get cleaner dashboards if you standardize resource identity and keep dimensions signal-specific.
Recommended baseline dimensions:
service.namedeployment.environment
Signal-specific dimensions:
- HTTP:
http.method,http.route,http.status_code - RPC:
rpc.system,rpc.service,rpc.method,rpc.status_code - DB:
db.system,db.operation - Messaging:
messaging.system,messaging.destination
This separation makes it easy to compare services while still answering the right question for each telemetry signal.
5. Semantic Conventions for Traces and Span Attributes
5.1 Span Kinds and Their Meaning in Distributed Workflows
Span kinds tell you what role a span plays in a distributed interaction. They are not just labels for humans; they shape how backends interpret relationships between client and server activity, how latency is attributed, and how you reason about causality. In OpenTelemetry, the common span kinds are internal, server, client, producer, and consumer.
Span Kind Foundations
A span represents a unit of work. The kind answers: “Who initiated this work, and who received it?” That question becomes crucial when you stitch traces across services.
- Internal: Work that stays within one process. There is no network boundary or messaging handoff.
- Server: Work that handles an incoming request. The server span is typically created when a request arrives.
- Client: Work that initiates an outgoing request. The client span is typically created before sending.
- Producer: Work that publishes a message to a broker or stream.
- Consumer: Work that processes a received message.
A practical rule: if you can point to a boundary where another component receives something, you’re likely looking at client/server or producer/consumer.
How Span Kinds Affect Trace Reasoning
Consider a request from Service A to Service B. If A creates a client span and B creates a server span, most tracing systems can present them as a pair. That pairing helps you answer questions like “How long did B take after A sent the request?” and “Where did the time go: network, queueing, or handler logic?”
If you mark both sides as internal, the trace still exists, but the backend has fewer hints about interaction semantics. You may still correlate via trace context, yet the UI and analytics lose structure.
Mind Map: Span Kinds and Their Boundaries
Example: HTTP Request Client and Server
Service A calls Service B over HTTP.
- In Service A, create a client span around the HTTP call.
- In Service B, create a server span around the request handler.
When trace context is propagated, the server span becomes a child (or otherwise causally linked) to the client span, depending on your instrumentation and sampling decisions.
A common mistake is to create only an internal span in Service A and rely on Service B’s server span alone. You’ll still see B’s work, but you lose the explicit “request initiated by A” timing.
Example: Messaging Producer and Consumer
Service C publishes an event to a queue.
- In Service C, create a producer span when publishing.
- In Service D, create a consumer span when the message is received and processed.
The message payload or headers carry trace context so that the consumer span can relate to the producer span. This is where span kinds prevent confusion: producer spans explain “time to publish,” while consumer spans explain “time to process.” If you mark both as internal, you blur the handoff and make queueing delays harder to interpret.
Example: Internal Spans Inside a Server Handler
Inside Service B’s server handler, you might do local work like parsing, validation, or database query orchestration.
Those operations are typically internal spans because they do not represent a boundary where another component receives control. You can still create additional spans for outgoing calls (client) or message publishing (producer), which keeps the trace readable and the attribution honest.
Advanced Detail: Choosing the Kind When There Is No Clear Boundary
Sometimes a “call” is not a network request, but it still hands off work to another component. If the handoff is within the same process and you control the execution, internal is usually correct. If another process or system receives the work—via HTTP, RPC, queue, or stream—use the corresponding client/server or producer/consumer kind.
When in doubt, ask what the receiving side would label as its role. The receiving side’s span kind is a strong indicator: a handler that processes an incoming request is server, and a handler that processes a delivered message is consumer.
Quick Checklist
- Outgoing request initiated by your code: client
- Incoming request handled by your code: server
- Publishing to a broker: producer
- Processing a delivered message: consumer
- Local work without a handoff: internal
Correct span kinds make traces easier to interpret because they preserve the shape of interactions, not just the existence of events.
5.2 Trace Context Identifiers and Correlation Behavior
Trace context is the set of identifiers that lets separate telemetry events line up as one story. In OpenTelemetry, the main identifiers are the trace id and span id, plus optional trace flags that describe sampling decisions. Correlation behavior is what you get when those identifiers are propagated correctly and interpreted consistently across services.
Core Identifiers and What They Mean
A trace id identifies the end-to-end request flow across many services. A span id identifies a single operation within that flow, such as “handle HTTP request” or “query database.” A span also carries a parent relationship, which is how you reconstruct a tree of operations.
Correlation depends on two rules:
- Every span belongs to exactly one trace id. If a span has a different trace id, it is a different story.
- Every span (except the root) has a parent span id. If the parent link is missing or wrong, the tree shape breaks even if the trace id matches.
Trace Flags and Sampling Behavior
Trace flags indicate whether the trace is sampled. When sampling is off, you still want correlation identifiers to travel so downstream systems can make consistent decisions. In practice, you may see fewer spans exported, but the identifiers still explain why the trace looks sparse.
A common operational mistake is treating “not exported” as “not correlated.” Correlation is about identifiers; export is about policy. Keep those concepts separate when debugging.
Correlation Across Boundaries
Correlation behavior is easiest to understand by following identifiers across boundaries:
- Inbound request to service: the service extracts trace context from incoming headers, then creates a new span whose parent is the extracted context.
- Outbound call to another service: the service injects the current span context into outgoing headers, so the next service can attach its spans to the same trace.
- Async work via messaging: the producer injects context into message metadata; the consumer extracts it when creating spans for the processing work.
If you miss injection on outbound calls, the next service will start a new trace. If you miss extraction on inbound calls, your spans will have no parent relationship, even if the trace id might still appear.
Mind Map: Trace Context and Correlation
Example: Synchronous HTTP Call Chain
Consider Service A handling an HTTP request and calling Service B.
- Service A receives the request with headers containing a trace id
T1and span contextS0. - Service A creates span
S1for request handling. Its parent isS0, and its trace id isT1. - Service A calls Service B and injects the current context (trace id
T1, span idS1) into outgoing headers. - Service B extracts the context and creates span
S2for its handler. Its parent isS1, and its trace id isT1.
The correlation behavior you should see in a trace view is a single trace with a parent-child chain: S0 -> S1 -> S2.
Example: What Goes Wrong When Propagation Fails
If Service A forgets to inject context into the outgoing call, Service B will extract nothing and start a new trace.
- Service A spans: trace id
T1 - Service B spans: trace id
T2
Even if both services record similar attributes like http.route, the trace graphs will not connect. This is why trace id mismatches are the first thing to check when correlation looks “split.”
Example: Parent Link Breaks Without Trace Id Mismatch
A subtler failure happens when you reuse the trace id but lose the parent relationship. For example, you might create a span in Service B that uses T1 but sets its parent incorrectly (or as root). The result is still one trace, but the tree becomes flat or oddly rooted.
When debugging, verify both:
- Trace id equality across services
- Parent chain correctness for the spans that should be nested
Practical Debugging Checklist
When correlation behavior looks off, use this order:
- Confirm the trace id is identical across the expected services.
- Confirm the parent relationship exists where you expect a child span.
- Check whether sampling flags explain missing spans rather than missing identifiers.
- For async flows, verify that message metadata carries the context and that the consumer extracts it before creating spans.
This approach keeps you grounded in identifiers and relationships, which is where correlation issues actually live.
5.3 Span Attributes for HTTP RPC Database and Messaging
Span attributes are the small, structured facts that make spans searchable, comparable, and explainable. For HTTP, RPC, database calls, and messaging, the goal is consistent attribute keys and values that let you answer questions like “Which endpoint was slow?”, “Which query shape caused the spike?”, or “Which queue hop failed?”. The trick is to treat attributes as a contract: instrumentation should emit them with stable meaning, and collectors should preserve them end to end.
Foundational Rules for Attribute Quality
Start with four practical rules.
- Use semantic keys, not ad-hoc names. If an attribute has a defined meaning in the semantic conventions, prefer it. This keeps dashboards and alerts from turning into a scavenger hunt.
- Choose the right granularity. Put high-cardinality values (like full URLs with query strings) behind safer fields or normalize them. A span attribute can be precise without being explosive.
- Keep types consistent. Numbers should be numbers, booleans should be booleans, and strings should be strings. Mixed types break aggregations.
- Record both identity and outcome. Identity attributes tell you what happened; status and error attributes tell you how it went.
HTTP Span Attributes for Requests and Responses
For HTTP, the most useful attributes describe the request target, method, route, and response outcome.
- Request identity: method, route (or template), and target details.
- Client/server role: span kind distinguishes whether you’re observing an inbound request or an outbound call.
- Outcome: HTTP status code and any error indicator.
A common best practice is to capture route rather than the raw path when your framework can provide it. Route values typically have lower cardinality and remain stable across deployments.
Example span attribute set for an inbound request:
http.method:GEThttp.route:/api/orders/{id}http.target:/api/orders/123(optional, use carefully)http.status_code:200net.peer.name:client.example.com(if available)
Example for an outbound call:
http.method:POSThttp.route:/payments/chargehttp.status_code:503http.flavor:1.1(if your instrumentation exposes it)
RPC Span Attributes for Service-to-Service Calls
RPC attributes mirror HTTP’s identity and outcome, but they focus on procedure calls rather than URLs.
- System and service identity: the RPC system (for example, gRPC), the service name, and the method.
- Peer identity: the remote host or service endpoint.
- Outcome: status code or equivalent error mapping.
If you instrument both client and server sides, ensure the client span and server span agree on the method identity fields. That alignment is what makes cross-service latency analysis actually work.
Example RPC attributes:
rpc.system:grpcrpc.service:CheckoutServicerpc.method:Chargerpc.grpc.status_code:UNAVAILABLEnet.peer.name:checkout.internal
Database Span Attributes for Queries and Commands
Database spans should capture what was executed and how it behaved, without dumping entire SQL strings into every span. The semantic conventions support both query identity and safe query text.
Key ideas:
- Database identity: system, name, and user context when available.
- Statement identity: operation name and a normalized statement or query template.
- Outcome: database system status and error mapping.
A practical approach is to record:
db.system:postgresqldb.name:ordersdb.operation:SELECTdb.sql.table:orders(if your instrumentation can infer it)db.statement:SELECT * FROM orders WHERE id = $1(parameterized form)db.user:app_user(optional)
If you only have raw SQL, consider truncation and parameterization so that spans remain searchable without turning into a log of sensitive data.
Messaging Span Attributes for Queue and Topic Hops
Messaging spans should explain where a message came from, where it went, and what happened to it.
- Messaging system: the broker type (for example, kafka, rabbitmq).
- Destination identity: topic or queue name.
- Message identity: message id when available, and sometimes a correlation key.
- Outcome: publish/consume success and error mapping.
Example producer span attributes:
messaging.system:kafkamessaging.destination:orders.eventsmessaging.destination_kind:topicmessaging.operation:publishmessaging.message_id:evt_9f3a...
Example consumer span attributes:
messaging.system:kafkamessaging.destination:orders.eventsmessaging.destination_kind:topicmessaging.operation:processmessaging.message_id:evt_9f3a...messaging.kafka.consumer.group:order-service
Mind Map: Span Attribute Coverage
Span Attributes Coverage Mind Map
Putting It Together in One Span
A single request often touches multiple systems: an inbound HTTP request triggers an RPC call, which executes a database query, which then publishes a message. The best practice is to keep each span’s attributes focused on its own work, while relying on trace context to connect them.
For example, an inbound GET /api/orders/{id} span might carry HTTP identity and status, while the child database span carries db.* fields and the messaging span carries messaging.* fields. This separation keeps queries readable and prevents attribute collisions.
Finally, verify attribute presence and consistency with a simple checklist: each span should have (1) the semantic “system” identity (HTTP/RPC/db/messaging), (2) a destination or route identity, and (3) an outcome field via span status and any protocol-specific status code.
5.4 Event and Status Modeling for Error and Outcome Reporting
Event and status modeling answers two practical questions: “What happened?” and “How should a user interpret it?” In OpenTelemetry, you typically express these with a combination of span status, span events, and attributes. The goal is to make error analysis possible without forcing every downstream system to guess.
Span Status as the Coarse Outcome
Span status is the coarse-grained outcome of the operation represented by the span. Use it to communicate success versus failure in a way that is consistent across services.
- Status code: Prefer setting status to
OKfor successful operations and to an error code for failures. - Status message: Add a short, human-readable explanation when it helps triage. Keep it stable enough that dashboards and alerts can rely on it.
- When to set status: Set status when the span’s operation completes. If you create intermediate events (like retries), keep status focused on the final outcome.
A common pattern is: record retries as events, then set final status once you know whether the request ultimately succeeded.
Span Events as the Fine-Grained Timeline
Span events are timestamped annotations attached to a span. They are ideal for capturing meaningful moments that are too detailed for status.
Use events for:
- Retry attempts and backoff decisions
- External dependency calls and their outcomes
- Validation failures that still allow the request to continue
- Business-relevant milestones like “payment authorized” or “order persisted”
Use span events carefully:
- Don’t emit an event for every log line. Events should be queryable milestones, not a duplicate of application logging.
- Keep event names consistent and low-cardinality. If you need high-cardinality data, store it as attributes rather than inventing new event names.
Attribute Design for Error and Outcome Reporting
Attributes provide the structured details that make events and status actionable. A good attribute strategy has three layers.
- Outcome attributes: What was the result? Examples include
http.status_code,db.operation, ormessaging.system. - Error attributes: What failed and why? Examples include
error.type,error.code, anderror.message. - Context attributes: Where and under what conditions? Examples include
retry_count,timeout_ms,component, andcustomer_segment.
Keep attribute values consistent across services. If one service uses error.code and another uses failure_reason, you’ll spend time normalizing later.
Event Naming and Attribute Conventions
Event names should be verbs or noun-phrases that describe the moment. Examples:
retry_scheduleddependency_call_starteddependency_call_failedvalidation_failedfallback_used
Attributes on those events should follow a predictable schema. For instance, a dependency_call_failed event should include:
dependency.namedependency.systemdependency.operationerror.typeerror.codeerror.message
This makes it possible to filter for “all dependency failures” without knowing every service’s internal wording.
Systematic Modeling Workflow
A reliable workflow keeps teams aligned:
- Define outcomes: Decide what counts as success versus failure for the span.
- Map failures to status: Set span status based on the final outcome.
- Emit events for milestones: Add events for retries, dependency outcomes, and key decision points.
- Attach attributes for triage: Include error classification and relevant context.
- Validate cardinality: Ensure event names are stable and attribute values don’t explode in uniqueness.
Example: HTTP Request with Retries and Final Failure
Below is a compact example of how status and events work together. The span ends with failure status, while events capture the retry timeline.
Span: GET /checkout
Status: ERROR
Status message: "request failed after retries"

Event: dependency_call_failed
  dependency.system: "http"
  dependency.name: "payment-service"
  dependency.operation: "POST /authorize"
  error.type: "timeout"
  error.code: "DEADLINE_EXCEEDED"
  error.message: "upstream did not respond in time"

Event: retry_scheduled
  retry_count: 1
  backoff_ms: 200

Event: dependency_call_failed
  dependency.system: "http"
  dependency.name: "payment-service"
  dependency.operation: "POST /authorize"
  error.type: "timeout"
  error.code: "DEADLINE_EXCEEDED"
  error.message: "upstream did not respond in time"

Attributes on span:
  http.status_code: 504
  retry_count: 2
  timeout_ms: 500
This structure supports two queries: one for the final outcome (http.status_code and span status) and another for the timeline (dependency_call_failed events and their error codes).
Mind Map: Event and Status Modeling
Example: Business Outcome Without Technical Failure
Not every “bad outcome” is a technical error. Suppose an order is rejected due to insufficient funds. The operation may complete successfully from an infrastructure perspective.
Model it like this:
- Span status:
OKbecause the request was handled. - Span event:
order_rejectedwith attributes likerejection.reasonandrejection.code. - Optional span attributes:
order.state.
This prevents alerting systems from treating business rejections as infrastructure incidents, while still keeping the outcome searchable.
Example: Technical Failure with Partial Success
Sometimes part of a workflow succeeds and part fails. Use events to show what succeeded, then set status based on the overall operation semantics.
For example, a batch job might process 90 items and fail on the rest. Emit events like item_processed for key items (not every single one), then set span status to error if the batch is considered failed. Include attributes such as processed_count and failed_count so triage can happen without scanning every event.
5.5 Example Trace Templates for End-to-End Request Flows
End-to-end request flows are easiest to reason about when you treat a trace as a structured story: one entry span, a chain of causally related spans, and a clear outcome. The templates below are designed to map cleanly to OpenTelemetry span kinds, semantic attributes, and context propagation rules.
Mind Map: End-to-End Trace Template Structure
Template 1: HTTP Request Through Service to Database
Use this when a client calls your service over HTTP and your service queries a database.
Span layout
HTTP SERVERspan: represents the inbound request.DB CLIENTspan: represents the database query.- Optional
INTERNALspan: represents business logic that orchestrates work.
SERVER span attributes (example)
http.method:GEThttp.route:/v1/orders/{orderId}http.target:/v1/orders/123http.status_code:200net.peer.ipandnet.peer.portwhen availableservice.nameandservice.instance.idfrom resource attributes
DB CLIENT span attributes (example)
db.system:postgresqldb.name:ordersdb.operation:SELECTdb.sql.table:orderswhen you can infer it safelydb.statement: include only if your policy allows it; otherwise omit
Outcome and errors
- If the database fails, mark the DB span
ERRORand add an exception event. - Mark the SERVER span
ERRORonly if the request ultimately fails; otherwise keep itOKand record a domain outcome attribute likeevent.outcomeor an application-levelorder.lookupresult.
Example trace flow
- Client sends request with
traceparent. - Your service creates a SERVER span with that trace context.
- Your service starts a DB CLIENT span as a child span.
- The SERVER span ends after the response is written.
Template 2: HTTP Request with Fan-Out to Another Service
Use this when your service calls a downstream HTTP service and you want a single trace to show the full latency breakdown.
Span layout
HTTP SERVERspan (entry)INTERNALspan for orchestration (optional but helpful)HTTP CLIENTspan for the downstream call- Optional
INTERNALspan for response transformation
Propagation details
- The downstream HTTP CLIENT span must inject the current trace context into outgoing headers.
- The downstream service’s SERVER span should become a child of the CLIENT span automatically.
Attribute consistency rules
- Use the same
service.namevalues across services. - For the CLIENT span, set
http.method,http.status_code(when known), and target fields likehttp.urlorhttp.targetdepending on what your instrumentation provides.
Error modeling
- If the downstream returns
500, set the CLIENT span status toERRORand recordhttp.status_code. - Decide whether the SERVER span is
ERRORbased on whether you return a failure to the caller.
Template 3: Messaging Flow from Producer to Consumer
Use this when work is triggered by publishing a message and completed by a consumer.
Span layout
PRODUCERspan: created when publishingCONSUMERspan: created when processing- Optional
INTERNALspans inside the consumer for business logic
Propagation details
- Inject trace context into message headers.
- The consumer extracts context and starts the CONSUMER span with the extracted parent.
Attribute modeling
messaging.system: e.g.,kafkamessaging.destination: topic or queue namemessaging.operation:publishorprocessdepending on your semantic mapping
Error modeling
- If processing fails, mark the CONSUMER span
ERRORand add an exception event. - If you retry, keep the trace consistent by continuing the same trace context for each attempt, or record attempt counts as attributes on the consumer span.
Verification Checklist for Templates
- Parent-child relationships match causality: entry span is root, outbound CLIENT spans are children, and consumer spans link via extracted context.
- Each span has a clear kind:
SERVERfor inbound,CLIENTfor outbound,PRODUCER/CONSUMERfor messaging. - Outcome is unambiguous: status and exception events align with what the caller experiences.
- Semantic attributes are present where they matter: HTTP method and route, DB system and operation, messaging system and destination.
Minimal Example Trace Shape
Trace
- Span A HTTP SERVER GET /v1/orders/{orderId} status=OK
  - Span B INTERNAL orchestrate lookup
    - Span C DB CLIENT SELECT orders status=OK
  - Span D HTTP CLIENT POST /v1/pricing status=OK
This shape is intentionally boring: it’s the kind of structure that stays readable when you add real attributes, real errors, and real latency.
6. Semantic Conventions for Logs and Log Record Enrichment
6.1 Log Record Structure and Field Mapping to Telemetry Concepts
A log record is a single, time-stamped event emitted by an application or component. In OpenTelemetry terms, the goal is not just to “send text,” but to attach structured fields that can be filtered, correlated, and compared across services. Think of a log record as a small packet: it has a body (what happened), a time (when), and metadata (who, where, and how to interpret it).
Core Fields in a Log Record
Start with the minimum set that makes a log useful in practice:
- Timestamp: The moment the event occurred. Use the event time, not the export time, so ordering and latency analysis remain meaningful.
- Severity: A level such as debug, info, warn, error. Severity drives alerting and dashboards, so keep it consistent across services.
- Body: The main message content. Prefer structured bodies (or consistent message templates) so queries don’t rely on brittle string matching.
- Attributes: Key-value pairs that carry context. These are the workhorses for correlation and filtering.
- Trace Context: Optional identifiers that link the log to a trace and span.
A practical rule: if a field changes the meaning of the event, it belongs in attributes. If it only helps humans read the message, it can stay in the body.
Mapping Log Fields to Telemetry Concepts
OpenTelemetry encourages a consistent mental model across signals. Logs map cleanly when you treat them as “events with context,” similar to trace events and metric dimensions.
- Service Identity: Put service name, namespace, and instance-like details in resource attributes. This mirrors how traces and metrics identify the emitting component.
- Event Semantics: Use attributes to represent what the log is about (for example, operation, endpoint, queue name). This parallels span attributes that describe the work.
- Outcome and Error Modeling: Represent outcomes with attributes like
event.outcomeand error details withexception.*fields when available. This keeps error analysis uniform. - Correlation: Attach
trace_idandspan_id(or equivalent trace context fields) so logs can be pulled into the same request view as traces.
Mind Map: Log Structure and Correlation
Example Log Record with Reasoned Field Choices
Imagine an API gateway handling a request and failing to reach an upstream service. A good log record separates concerns:
- Body: A concise message like “Upstream call failed.”
- Severity:
errorbecause the request outcome is degraded or failed. - Attributes:
- Request context:
http.method,http.route,http.status_code. - Upstream context:
net.peer.name,rpc.system,rpc.service. - Error context:
exception.type,exception.message. - Correlation:
trace_idandspan_idso the log appears in the trace timeline.
- Request context:
- Resource attributes:
service.namefor the gateway, plus environment and region.
This structure supports three common queries without guesswork: “show all upstream failures for route X,” “show errors for service Y in region Z,” and “for this trace, show the related logs.”
Practical Field Mapping Checklist
Use this checklist to avoid the two most common problems: missing context and inconsistent naming.
- Put identity in resource attributes: service and deployment details should not be repeated in every log attribute.
- Put event meaning in attributes: route, operation, destination, and outcome belong in attributes.
- Keep severity aligned with outcomes: don’t log an error as info just because the message is informative.
- Attach trace context when available: if you already have a span, link the log to it.
- Avoid attribute sprawl: only add fields that you will filter on or use for correlation.
Example Attribute Set for a Single Failure Event
{
  "timestamp": "2026-03-25T10:15:30.123Z",
  "severity": "error",
  "body": "Upstream call failed",
  "attributes": {
    "http.method": "GET",
    "http.route": "/checkout",
    "http.status_code": 502,
    "rpc.system": "grpc",
    "rpc.service": "payments",
    "rpc.method": "Charge",
    "event.outcome": "failure",
    "exception.type": "Unavailable",
    "exception.message": "upstream timeout",
    "trace_id": "4bf92f3577b34da6a3ce929d0e0e4736",
    "span_id": "00f067aa0ba902b7"
  },
  "resource": {
    "service.name": "api-gateway",
    "deployment.environment": "prod",
    "cloud.region": "us-east-1"
  }
}
The key is consistency: the same attribute names should appear across services for the same concepts, so collectors and backends can treat logs as structured data rather than plain text with opinions.
6.2 Required and Recommended Attributes for Vendor Neutral Logs
Vendor neutral logs work when every record carries enough context to be grouped, filtered, and correlated—without relying on backend-specific field names. OpenTelemetry’s log data model uses a consistent split between resource attributes (who produced the telemetry) and log record attributes (what happened). The goal is simple: make the same log query work across services and backends.
Core Idea: Separate Identity from Event Details
A log record should answer three questions:
- Where did this come from? Use resource attributes.
- What is the event? Use log record attributes.
- How do I connect it to other telemetry? Use correlation fields like trace identifiers.
When you keep this separation, you avoid the common trap of stuffing everything into one namespace and then discovering half your fields are missing in other services.
Required Attributes for Practical Interoperability
In OpenTelemetry, the “required” set is best understood as the minimum fields that make a log record meaningful and queryable.
- Timestamp: The time the event occurred (not the time it was exported). If you only have “now,” you still need to be consistent about what “now” means.
- Severity number and severity text: Severity enables filtering like “show me errors” without parsing message strings.
- Body: The human-readable message or structured payload that describes the event.
- Resource attributes: At minimum, identify the service and environment so logs from different producers don’t collapse into a single undifferentiated blob.
A useful rule of thumb: if you can’t write a query that isolates one service’s error logs in under a minute, your required attributes aren’t doing their job.
Recommended Attributes That Prevent Query Pain
Recommended attributes are where vendor neutrality becomes real. They standardize the dimensions you’ll want later.
- Service identity:
service.nameandservice.namespace(when applicable) plusservice.versionif you deploy multiple versions. - Deployment environment:
deployment.environmentsuch asproduction,staging, ordev. - Host and runtime context:
host.nameandos.typewhen you need to distinguish node-level issues. - Thread or execution context:
process.thread.nameor similar fields when concurrency matters. - Request correlation:
trace_idandspan_idwhen the log is tied to a specific span. - HTTP and RPC details:
http.method,http.target,http.status_code,rpc.system,rpc.service,rpc.methodwhen the event is request-scoped. - Error details:
exception.type,exception.message, andexception.stacktracewhen an error occurs.
These recommendations are not about being thorough for its own sake. They’re about making the same filters and groupings work across services.
Mind Map: Required and Recommended Log Attributes
Example: Request-Scoped Error Log with Correlation
{
  "resource": {
    "service.name": "checkout-api",
    "deployment.environment": "production",
    "service.version": "1.18.3",
    "host.name": "checkout-7f9c2"
  },
  "timestamp": "2026-03-25T10:15:30.123Z",
  "severity": {"number": 17, "text": "ERROR"},
  "body": "Payment authorization failed",
  "attributes": {
    "trace_id": "4bf92f3577b34da6a3ce929d0e0e4736",
    "span_id": "00f067aa0ba902b7",
    "http.method": "POST",
    "http.target": "/v1/checkout",
    "http.status_code": 402,
    "exception.type": "PaymentDeclined",
    "exception.message": "Issuer declined authorization",
    "exception.stacktrace": "..."
  }
}
This record is easy to use because it supports three common queries: “errors by service,” “errors by endpoint,” and “errors tied to a specific trace.”
Example: Background Job Log Without HTTP Fields
{
  "resource": {
    "service.name": "order-processor",
    "deployment.environment": "production",
    "service.version": "2.4.0"
  },
  "timestamp": "2026-03-25T10:16:05.500Z",
  "severity": {"number": 9, "text": "INFO"},
  "body": "Requeued message due to transient database timeout",
  "attributes": {
    "exception.type": "TimeoutError",
    "exception.message": "DB query exceeded 2s",
    "process.thread.name": "worker-3"
  }
}
Notice what’s missing: there’s no http.* because the event isn’t request-scoped. Vendor neutrality isn’t about forcing every field everywhere; it’s about using consistent fields when they apply.
Practical Checklist for Consistent Log Attributes
- Always set timestamp, severity, and body.
- Always set service identity and deployment environment in resource attributes.
- Add trace correlation when the log is produced inside a span.
- Add request context only when the event is tied to HTTP or RPC.
- Add exception fields when you’re reporting an error condition.
When these rules are followed, your logs stay readable to humans and usable to machines—without requiring backend-specific gymnastics.
6.3 Correlating Logs with Traces Using Trace Identifiers
Correlation is the practical bridge between “what happened” (logs) and “how it happened across services” (traces). The goal is simple: every log record emitted during a request should carry the same trace identity used by the trace spans for that request. When you do this consistently, you can start from a log line and jump to the exact distributed execution path.
Core Concepts for Trace-Based Log Correlation
A trace is identified by a trace_id, and a specific span within that trace is identified by a span_id. For log correlation, the minimum useful set is trace_id. Many teams also include span_id so they can pinpoint which step produced the log.
In OpenTelemetry, these identifiers are typically exposed to logging code through the active context. That means your logger doesn’t need to know anything about HTTP headers or messaging protocols; it just needs to read the current context and copy the identifiers into the log record.
Mind Map: Trace Identifiers in Logs
Step-by-Step: From Request to Correlated Log
- A request enters the service (for example, via HTTP). Instrumentation creates a span for the request and stores it in the active context.
- Your code emits logs while the span is active. A log enrichment mechanism reads
trace_id(and optionallyspan_id) from the active context and attaches them to the log record. - The log record is exported through OTLP. The identifiers travel with the log payload.
- The backend indexes the fields so you can query logs by
trace_idand immediately find the matching trace.
This flow matters because it avoids brittle manual wiring. If you rely on the active context, you get correlation “for free” across most code paths.
Example: Logging with Trace and Span Identifiers
Below is a conceptual example showing how a logger can attach identifiers from the current context. The exact APIs differ by language, but the idea is consistent.
function logWithCorrelation(level, message, fields):
  ctx = getActiveContext()
  span = getSpanFromContext(ctx)
  if span is not null:
    fields["trace_id"] = span.traceId
    fields["span_id"] = span.spanId
  fields["service.name"] = getServiceName()
  emitLog(level, message, fields)
If you also include service.name and a stable event.name (or similar field), your log queries become more precise than “trace_id only,” especially when you’re investigating multi-service workflows.
Example: Correlating a Log Line to a Trace
Imagine a log line like this:
message:payment declinedtrace_id:4bf92f3577b34da6a3ce929d0e0e4736span_id:9f2c1b2a3d4e5f60service.name:checkout-api
In the backend, you filter logs by trace_id = 4bf92f3577b34da6a3ce929d0e0e4736. Then you pivot to the trace view for the same trace_id. The span_id helps you land on the span that produced the log, which is usually the request handler span or a child span representing the payment call.
Advanced Details That Prevent “Almost Correlated” Data
1. Ensure context propagation is actually happening. If the incoming request lacks trace context, your service will start a new trace and logs will correlate to that new trace. That’s correct behavior, but it can surprise you if you expected correlation with an upstream trace.
2. Don’t log after the context is gone. If you emit logs in background tasks after the request scope ends, the active context may be empty. In that case, either capture the trace context at the time you schedule the work or explicitly pass the identifiers into the background task.
3. Avoid overwriting identifiers in processors. Collector processors can enrich or transform fields. If a processor accidentally replaces trace_id with a different value, correlation breaks silently. Treat trace_id as a protected join key.
4. Keep field names consistent across signals. Your backend’s correlation features often assume specific field names and formats. Use the same conventions for trace_id and span_id across all services so queries work uniformly.
Mind Map: Query Patterns That Use Trace Identifiers

Practical Checklist for Reliable Correlation
- Every request-scoped log includes
trace_id. - Optional: include
span_idfor precise origin. - Background work captures context before leaving the request scope.
- Collector processors do not modify
trace_idorspan_id. - Backend indexing supports fast filtering by
trace_id.
When these are in place, correlation stops being a scavenger hunt and becomes a deterministic join: one identifier, two views, and a clear path from a single log line to the full distributed execution.
6.4 Designing Log Levels and Message Templates for Queryability
Log levels are not just for humans skimming dashboards; they’re also the first filter most query engines apply. If you treat levels as a consistent contract, you can write queries that stay stable even when teams change.
Log Levels as Query Filters
Start with a simple mapping from intent to level:
- Debug: high-volume details that help reproduce a specific issue. Use it when you can point to a single request or job and explain what extra data you’re adding.
- Info: normal operations that confirm progress. Keep it for milestones, not for every loop iteration.
- Warn: something is off but the system continues. The key is to include enough context to decide whether it’s safe to ignore.
- Error: an operation failed or produced an invalid outcome. Include the failing component, the operation name, and the reason.
- Fatal: the process cannot continue safely. Use sparingly; if you need it often, your error handling strategy is probably too optimistic.
A practical rule: choose the level based on the user-visible impact of the event, not based on how surprising it felt to the developer.
Message Templates That Survive Querying
Message text is often the least structured field, so it must be predictable. Design templates so that the “shape” of the message is stable:
- Start with an action verb that names the operation.
- Include the object being acted on (request, job, user, payment, file).
- Add the outcome in a short phrase.
- Avoid embedding variable data in the middle of the sentence; put identifiers in structured fields.
Example templates:
http.request outcome=success method={method} route={route} status_code={status_code}http.request outcome=error method={method} route={route} status_code={status_code} error_type={error_type}queue.consume outcome=processed queue={queue_name} message_id={message_id}
When you keep the template stable, you can group by message pattern or search for the action verb without missing variants.
Structured Fields That Complement the Message
Use the message for readability and the fields for query power. A good baseline set for application logs:
- service.name and service.instance.id for routing and deduplication.
- trace_id and span_id when available for correlation.
- event.name for the operation name, aligned with your semantic conventions.
- outcome with values like
success,failure,unknown. - error.type and error.message when an error occurs.
- http.method, http.route, http.status_code for request logs.
- messaging.system, messaging.destination, messaging.operation for queue or stream logs.
If you already have these fields, the message can be shorter and still useful.
Consistent Level and Outcome Pairing
To keep queries simple, pair levels with outcomes:
Info + outcome=successfor normal completion.Warn + outcome=unknownfor ambiguous states.Error + outcome=failurefor failed operations.Fatal + outcome=failureonly when the process is unrecoverable.
This pairing lets you write queries like “show all failures” without relying on fragile message text.
Mind Map: Queryable Log Levels and Message Templates
Example: One Operation, Multiple Outcomes
Suppose you log an HTTP request. Keep the action verb and template structure constant, and vary only fields.
Success (Info):
- Level:
info - Message:
http.request outcome=success - Fields:
http.method=GET,http.route=/checkout,http.status_code=200,event.name=http.request
Client error (Warn):
- Level:
warn - Message:
http.request outcome=error - Fields:
http.method=POST,http.route=/checkout,http.status_code=400,error.type=validation_error
Server error (Error):
- Level:
error - Message:
http.request outcome=error - Fields:
http.method=POST,http.route=/checkout,http.status_code=500,error.type=internal_error,error.message=...
Why this works: the message always starts with http.request outcome=..., while the queryable details live in fields. You can filter by level, group by event.name, and drill into http.route without rewriting queries for each new developer’s phrasing.
Example: Avoiding Template Drift
Template drift happens when teams change wording over time. For instance, these messages are hard to aggregate:
checkout completedcheckout donecheckout finished successfully
Instead, standardize on one template:
- Message:
checkout outcome=success - Fields:
event.name=checkout,checkout.order_id={order_id}
The message becomes a stable label, and the fields carry the variability.
Practical Checklist for Implementation
- Pick a level based on user-visible impact.
- Keep message templates stable in verb order and key phrases.
- Put identifiers and variable values in structured fields.
- Use
event.nameandoutcomeas the primary query keys. - Ensure error logs include
error.typeand enough context to act.
When these rules are followed, log queries become predictable, dashboards stop breaking after wording changes, and correlation with traces stays straightforward.
6.5 Example Log Schemas for Application Events and Error Reporting
A log schema is a contract between your application, your collector, and your backend. The goal is simple: every log record should carry enough context to answer “what happened, where, why, and how do I find the related trace?” without forcing you to guess at field meanings.
Core Log Record Fields
Start with a small set of fields that every log record uses, then add signal-specific fields.
- Timestamp: Use the event time, not the time you exported it. If you only have “now,” record that explicitly as the event time.
- Severity: Map your app levels to a consistent set (for example,
DEBUG,INFO,WARN,ERROR). Keep the mapping stable across services. - Body: A short, human-readable message that remains useful even when structured fields are missing.
- Trace correlation: Include
trace_idandspan_idwhen available so queries can jump from logs to traces. - Service identity: Use resource attributes like
service.name,service.namespace, andservice.versionso the backend can group logs by ownership. - Environment: Include
deployment.environment(for example,prod,staging).
Mind Map: Log Schema Components
Example: Application Event Log Schema
Use event logs for meaningful state changes and business actions. Keep them query-friendly by standardizing event.name, event.category, and outcome.
Event log record example
timestamp:2026-03-25T14:22:10.482Zseverity:INFObody:Order payment capturedtrace_id:4bf92f3577b34da6a3ce929d0e0e4736span_id:00f067aa0ba902b7service.name:checkout-apideployment.environment:prodevent.id:evt_9f3a2c1brequest.id:req_7c2d1e9aevent.name:order.payment.capturedevent.category:paymentoutcome:successhttp.status_code:200order.id:ord_102938payment.method:card
Why this works: event.name and outcome let you filter quickly, while trace_id lets you inspect the exact request flow that produced the event.
Example: Error Log Schema
Error logs should separate “what failed” from “how it failed.” That separation makes dashboards and incident triage less messy.
Error log record example
timestamp:2026-03-25T14:22:12.019Zseverity:ERRORbody:Payment capture failed due to provider timeouttrace_id:4bf92f3577b34da6a3ce929d0e0e4736span_id:00f067aa0ba902b7service.name:checkout-apideployment.environment:prodevent.id:evt_9f3a2c1crequest.id:req_7c2d1e9aevent.name:order.payment.capture.failedevent.category:paymentoutcome:failureerror.type:TimeoutErrorerror.code:PAYMENT_PROVIDER_TIMEOUTerror.message:Provider did not respond within 3sexception.module:payments.provider.clientexception.function:capturePaymenthttp.status_code:504is_transient:trueerror.stacktrace:...(include when it’s safe and useful)
Why this works: error.code supports consistent grouping, while exception.module and exception.function help you pinpoint the source without scanning entire stack traces.
Field Mapping Rules That Keep Schemas Consistent
- Use stable keys: Prefer
event.name,event.category,outcome,error.code, anderror.typeacross services. - Avoid mixing message and meaning: Put human text in
body, and put classification in dedicated fields. - Keep correlation fields optional but consistent: If you don’t have a trace, omit
trace_idrather than inventing placeholders. - Limit high-cardinality fields: IDs like
order.idare fine for targeted debugging; avoid dumping every internal identifier into every log line.
Minimal Schema Template
When you want a starting point, use this minimal set and expand only when you have a clear query need.
timestampseveritybodyservice.namedeployment.environmenttrace_id(optional)span_id(optional)event.id(optional but helpful)request.id(optional)event.nameevent.categoryoutcomeerror.type(only for errors)error.code(only for errors)error.message(only for errors)
This approach keeps logs readable in raw form while still being structured enough for reliable filtering, grouping, and correlation.
7. Instrumentation in Application Code with OpenTelemetry SDKs
7.1 Selecting Instrumentation Libraries and Managing Dependencies
Choosing instrumentation libraries is mostly about controlling three things: what gets measured, how it gets wired into your app, and how much dependency friction you can tolerate. If you pick libraries that overlap in responsibilities, you’ll spend time untangling duplicate spans and conflicting configuration. If you pick libraries that are too minimal, you’ll end up writing manual instrumentation for basics like HTTP and database calls.
Start with Your Instrumentation Coverage Map
Before installing anything, list the telemetry sources you need: inbound HTTP, outbound HTTP, RPC, messaging, database drivers, background jobs, and custom business operations. Then map each source to the most direct instrumentation approach.
- Automatic instrumentation: reduces code changes and speeds up initial coverage.
- Manual instrumentation: gives precise control for domain-specific spans and metrics.
- Hybrid: common in real systems, where frameworks handle the boring parts and you instrument the important parts.
A practical rule: use automatic instrumentation for infrastructure boundaries, and manual instrumentation for business-level operations that you can explain in one sentence.
Mind Map: Library Selection and Dependency Management
Pick the Smallest Set of Libraries That Covers Your Boundaries
For each integration point, prefer the library that attaches closest to the framework boundary. For example, if you use a web framework, choose its HTTP instrumentation rather than instrumenting raw sockets. That keeps span timing accurate and reduces the chance you miss edge cases like redirects, streaming responses, or retries.
When multiple libraries can instrument the same boundary, decide who owns it. If both a framework middleware and a separate HTTP client wrapper create spans for the same request, you’ll see nested spans that don’t match reality. The fix is usually to disable one path or configure it to only propagate context without creating new spans.
Manage Versions Like You Mean It
OpenTelemetry components are designed to work together, but they still require careful version alignment. Treat the following as a single compatibility set:
- OpenTelemetry API (the interfaces your code calls)
- OpenTelemetry SDK (the implementation that creates spans and metrics)
- Instrumentation packages (the adapters for frameworks and libraries)
If you mix versions, you can get subtle issues such as missing attributes, metrics not being emitted, or context propagation behaving inconsistently. A simple dependency strategy is to pin versions in one place (for example, a dependency management section in your build tool) and ensure all instrumentation packages use the same SDK major/minor line.
Centralize Providers to Prevent Configuration Drift
A common dependency mistake is letting different libraries create their own tracer or meter providers. That leads to multiple pipelines and confusing results when you try to correlate traces and metrics.
Instead, create the tracer provider and meter provider once, then let instrumentation libraries register with that shared configuration. This also makes it easier to apply consistent settings like sampling, resource attributes, and exporter selection.
Example: Dependency Alignment and Shared Providers
Below is a conceptual setup showing the dependency intent and the “single provider” approach. The exact package names vary by language, but the pattern stays the same.
Goal
- One SDK version set
- One tracer provider
- One meter provider
- Instrumentation libraries attach to the shared providers

Steps
1) Pin OpenTelemetry API and SDK versions together
2) Add only the instrumentation libraries you need
3) Initialize providers once at process startup
4) Enable auto-instrumentation for framework boundaries
5) Add manual spans for business operations
Example: Avoiding Double Instrumentation
If you instrument both inbound HTTP via framework middleware and also instrument the same handler with a generic request wrapper, you may create two spans for one request. The symptom is duplicated duration and repeated HTTP attributes.
A clean approach is:
- Use framework instrumentation for inbound requests.
- Use HTTP client instrumentation for outbound calls.
- Use manual spans only around business actions inside the handler.
Practical Checklist Before You Ship
- No duplicate spans for a single request path.
- Consistent resource identity across all signals.
- Stable metric label sets (avoid high-cardinality labels from request headers unless you have a reason).
- One exporter pipeline per signal type in your app process.
- Version pins applied uniformly across API, SDK, and instrumentation packages.
If you can answer “who owns this boundary” for every major integration point, dependency management becomes straightforward rather than mysterious.
7.2 Manual Instrumentation Patterns for Custom Spans and Metrics
Manual instrumentation is what you do when automatic instrumentation can’t see your intent. The goal is not to add more data; it’s to add the right data at the right boundaries so later queries answer real questions.
Mind Map: Manual Instrumentation Decision Flow
Pattern 1: Create Spans at Meaningful Boundaries
Start with boundaries that match how humans reason about work. A “meaningful boundary” is where you can say, “If this part is slow or failing, I know what to do next.” Typical examples are request handling, a checkout workflow step, or a call to a third-party API.
A practical rule: one span per boundary, not one span per line of code. If you need finer detail, add events inside the span rather than nesting dozens of spans.
Example: Custom Span Around a Business Step
from opentelemetry import trace
from opentelemetry.trace import Status, StatusCode

tracer = trace.get_tracer("shop-service")

def reserve_inventory(client, sku, qty):
    with tracer.start_as_current_span(
        "inventory.reserve",
        attributes={"product.sku": sku, "order.qty": qty}
    ) as span:
        try:
            result = client.reserve(sku=sku, qty=qty)
            span.set_attribute("inventory.result", result.status)
            return result
        except Exception as e:
            span.record_exception(e)
            span.set_status(Status(StatusCode.ERROR, "reserve failed"))
            raise
This span answers: “How long does inventory reservation take, and what outcome did it produce?” The attributes are chosen to support filtering, but you must keep an eye on cardinality. If product.sku has millions of values, consider recording a normalized category instead.
Pattern 2: Use Span Kinds to Describe Relationships
Span kinds clarify intent. Use a server kind when you’re handling an incoming request, and a client kind when you’re making an outgoing call. This matters because downstream analysis can group spans by role.
When you create a custom span for an outgoing dependency, set it up as a client span and ensure the trace context is propagated to the callee. If you don’t, you’ll get timing without causality.
Pattern 3: Add Events for Milestones and Decisions
Events are lightweight markers inside a span. They’re ideal for “what happened” moments that don’t need their own duration.
Use events when:
- You need a timestamped decision (e.g., “policy evaluated to deny”).
- You want to annotate retries (e.g., “retry attempt 2”).
- You need to capture intermediate outcomes without nesting spans.
Example: Events Inside a Span
with tracer.start_as_current_span("checkout.process") as span:
    span.add_event("cart validated")
    if not policy_allows(user_id):
        span.add_event("policy denied", {"reason": "insufficient_credits"})
        span.set_status(Status(StatusCode.ERROR, "denied"))
        return
    span.add_event("payment authorized")
Events should be queryable. Keep event names consistent and attribute keys stable so you can filter reliably.
Pattern 4: Create Metrics for Rates, Latency, and Capacity
Metrics complement spans. Spans show a single trace’s story; metrics show the distribution across many traces.
A good manual metric is tied to a question:
- “How often does this happen?” → counter
- “How long does it take?” → histogram
- “How many are in progress?” → gauge
Example: Histogram for Business Step Duration
from opentelemetry.metrics import get_meter

meter = get_meter("shop-service")
step_duration = meter.create_histogram(
    "inventory.reserve.duration_ms",
    unit="ms",
    description="Duration of inventory reservation"
)

def timed_reserve(client, sku, qty):
    start = time.time()
    try:
        return client.reserve(sku=sku, qty=qty)
    finally:
        ms = (time.time() - start) * 1000
        step_duration.record(ms, attributes={"result": "attempt"})
To avoid misleading data, record the outcome you actually know. For example, record result=success only after success, and result=error in the exception path.
Pattern 5: Control Cardinality and Attribute Scope
Manual instrumentation often fails because attributes explode in number. Cardinality is the count of unique values for a key across time.
Practical constraints:
- Prefer stable identifiers like
service.name,operation, andstatus. - Avoid raw user IDs, full URLs with query strings, and unbounded IDs.
- If you must include an identifier, hash it consistently and keep it for debugging windows.
A simple checklist before shipping:
- Can I group results by this attribute?
- Will it create millions of unique values?
- Is it present on every record or only sometimes?
Pattern 6: Tie Metrics to Spans Without Duplicating Work
You can reuse the same boundary name for both spans and metrics. For example, inventory.reserve as a span name and inventory.reserve.duration_ms as a histogram name. Then align attributes: if the span has inventory.result, the metric should also have result with the same set of values.
This alignment makes dashboards and trace exploration feel like they belong to the same system, even though they’re different data models.
Pattern 7: Validate with Question-Driven Checks
After implementing, test with concrete questions:
- “Show p95 duration for inventory reservation by result.”
- “Find traces where reservation failed and see the exception event.”
- “Confirm that outgoing calls share the same trace ID.”
If you can’t answer these questions with your new instrumentation, adjust boundaries, attributes, or event placement. The best instrumentation is the one that reduces time-to-understanding, not the one that adds the most lines of code.
7.3 Automatic Instrumentation Setup and Coverage Verification
Automatic instrumentation is the fastest way to get useful spans and metrics without rewriting application code. The tradeoff is that you must verify what was actually captured, because “enabled” does not always mean “covered.” This section walks through a systematic setup and a practical verification loop.
Choose the Right Automatic Instrumentation Strategy
Start by mapping your runtime to the supported auto-instrumentation approach. For example, a Java service typically uses a Java agent, while Node.js often relies on environment-based auto-instrumentation. The key idea is to ensure the instrumentation is loaded before your application creates HTTP clients, database pools, or messaging consumers.
A simple checklist:
- Confirm the instrumentation entry point loads at process start.
- Verify it covers the libraries you actually use (not just what you planned to use).
- Ensure it can export to your collector endpoint.
Configure the SDK and Export Path
Even with auto-instrumentation, you still need a working OpenTelemetry SDK configuration. At minimum, you must set:
- Service identity via resource attributes.
- Exporter endpoint for OTLP.
- Sampling behavior so you can see traces while validating.
Example environment variables for an OTLP endpoint (values shown as placeholders):
export OTEL_SERVICE_NAME="orders-api"
export OTEL_EXPORTER_OTLP_ENDPOINT="http://otel-collector:4317"
export OTEL_EXPORTER_OTLP_PROTOCOL="grpc"
export OTEL_TRACES_SAMPLER="parentbased_always_on"
If you run locally, keep the collector reachable from the application container or host network. A common failure mode is “instrumentation works” but exports fail silently due to network or auth mismatch.
Enable Auto-Instrumentation for Your Runtime
Enable the runtime-specific auto-instrumentation mechanism.
Java agent example (conceptual wiring):
- Add the agent to the JVM startup.
- Ensure the agent version matches your OpenTelemetry SDK expectations.
java \
  -javaagent:/path/opentelemetry-javaagent.jar \
  -Dotel.service.name=orders-api \
  -Dotel.exporter.otlp.endpoint=http://otel-collector:4317 \
  -jar app.jar
Node.js example (conceptual wiring):
- Set the auto-instrumentation loader via environment.
- Start the process with the loader enabled.
The exact variables differ by runtime, but the verification steps below stay the same.
Verify Coverage with a Deterministic Test Loop
Coverage verification should be repeatable. Use a small set of requests that exercise each expected integration: HTTP server, outbound HTTP client, database query, and one messaging operation if applicable.
Run the loop:
- Start the service with auto-instrumentation enabled.
- Trigger one request that should create a trace.
- Trigger one request that should create a database span.
- Trigger one request that should create an outbound call span.
- Check the collector logs for export errors.
- Query the backend for expected span names and attributes.
If you can’t query the backend yet, inspect what the collector receives by enabling debug logging temporarily. The goal is to confirm spans exist before you worry about dashboards.
Mind Map for Setup and Verification
Coverage Criteria and What “Good” Looks Like
Define acceptance criteria before you start troubleshooting.
For traces, good coverage means:
- You see a single trace containing spans for each integration you exercised.
- Span kinds match expectations (server for inbound HTTP, client for outbound HTTP).
- Attributes include the essentials for later semantic convention mapping, such as HTTP route or database system.
For metrics, good coverage means:
- You see at least one metric stream tied to the service identity.
- Metric labels/dimensions are consistent across requests.
Common Gaps and Targeted Fixes
When coverage is incomplete, avoid random changes. Use the verification loop to localize the problem.
- No traces at all: check exporter endpoint, protocol (grpc vs http), and sampling.
- Traces exist but missing HTTP spans: confirm the server framework is supported and that the agent/loader starts before the framework initializes.
- Database spans missing: verify the database driver and pooling library are the ones actually used at runtime.
- Attributes missing: ensure resource attributes like service name are set, and confirm you are not filtering attributes in the collector.
A practical rule: fix one variable at a time, then rerun the deterministic test loop. That keeps your coverage verification honest and prevents “it works on my machine” from becoming a permanent feature.
7.4 Capturing Exceptions and Mapping Them to Telemetry Signals
When an error happens, you want three things to be true: the exception is recorded, the request or operation is marked with a meaningful outcome, and the data is consistent across traces and logs. OpenTelemetry gives you the building blocks; your job is to map them coherently.
Start with a Clear Exception Taxonomy
Before writing instrumentation, decide what counts as an “exception” in your code. A practical taxonomy is:
- Expected failures: validation errors, missing resources, timeouts you handle.
- Unexpected failures: programming errors, null dereferences, database driver crashes.
- Infrastructure issues: network partitions, DNS failures, certificate problems.
This taxonomy matters because you’ll map it to span status, events, and log severity differently. For example, a 404 is usually expected; a 500 is unexpected.
Map Exceptions to Trace Signals First
In traces, exceptions are most useful when they attach to the span that represents the operation that failed. The mapping typically includes:
- Span status: set to error when the operation fails.
- Exception event: record the exception type and message.
- Outcome attributes: add HTTP or RPC outcome fields when applicable.
A good rule: if the exception changes the result of the operation, it belongs on the span that produced that result.
Example: HTTP Handler Exception to Span Status and Event
onRequest(req):
  span = tracer.startSpan("http.request")
  try:
    result = handle(req)
    span.setAttribute("http.status_code", result.status)
    span.setStatus(OK)
    return result
  catch e:
    span.recordException(e)
    span.setAttribute("error.type", typeOf(e))
    span.setAttribute("error.message", e.message)
    span.setStatus(ERROR)
    span.setAttribute("http.status_code", 500)
    logError(e, req)
    throw
  finally:
    span.end()
This pattern keeps the trace authoritative: the span shows where the failure occurred and why.
Enrich Logs with the Same Exception Shape
Logs are where you often keep the full stack trace and structured context. To correlate logs with traces, include the trace identifiers and keep the exception fields aligned with what you used in the span.
A consistent log schema helps you query reliably:
exception.typeexception.messageexception.stacktrace(or equivalent)error.severity(or mapped level)trace_idandspan_idservice.nameanddeployment.environment
Example: Structured Log from the Same Catch Block
function logError(e, req):
  ctx = getCurrentTraceContext()
  logger.error({
    "exception.type": typeOf(e),
    "exception.message": e.message,
    "exception.stacktrace": e.stack,
    "error.severity": "ERROR",
    "trace_id": ctx.traceId,
    "span_id": ctx.spanId,
    "http.method": req.method,
    "http.route": req.route
  }, "Request failed")
Now a single query can pull the trace and the log lines that describe the same failure.
Use Events for Multiple Exceptions in One Operation
Sometimes one operation catches multiple exceptions, such as retries or fallback logic. In that case, record each exception as an event on the same span, and add attributes that explain the control flow.
For example:
retry.attempt = 2retry.backoff_ms = 150fallback.used = true
This prevents the common mistake of overwriting the “real” failure with the last caught exception.
Choose Span Status Carefully
Span status is not just a boolean. Use it to represent the operation outcome:
- OK: the operation completed successfully.
- ERROR: the operation failed in a way that affects the result.
- Unset: avoid leaving it unset when you already know the outcome.
If you catch an exception but recover and still return success, you usually should not mark the span as ERROR. Instead, record the exception event with attributes like recovered = true.
Mind Map: Exception Mapping Workflow
Advanced Detail: Avoid Duplicate or Misplaced Exceptions
Two common issues are easy to prevent:
- Duplicate exception events: if you record exceptions in both a library wrapper and the application handler, you’ll see repeated events. Decide one “owner” layer for recording, and let the other layer annotate instead.
- Misplaced exceptions: if you record an exception on a parent span that merely observes the failure, the trace becomes misleading. Attach the exception to the span that actually executed the failing call.
Case Study: Retry with Recovery Then Final Failure
Consider an operation that retries a database call twice, then fails. The trace should show:
- Span status: ERROR (final outcome)
- Exception events: two retry failures plus one final failure event
- Attributes:
retry.attemptfor each event,recoveredfalse for the final one
The logs should mirror the same exception fields and include the trace identifiers, so you can jump from a log line to the exact span and event.
When exception handling is mapped this way, traces explain the “where” and “what outcome,” while logs provide the “how it looked,” and both stay queryable without guesswork.
7.5 Practical Instrumentation Walkthrough for a Sample Service
This walkthrough instruments a small HTTP service that handles requests, calls an internal dependency, and emits a few metrics and logs. The goal is to produce consistent traces, useful metrics, and logs that can be correlated without guessing.
Sample Service Scenario
The service exposes:
GET /orders/{id}returning an order.- It calls an internal dependency
GET /inventory/{sku}. - It records request latency, error counts, and a gauge for in-flight requests.
A practical rule: every signal should share the same service identity and the same trace context when possible.
Mind Map: Instrumentation Plan
Step 1: Set Up Tracing and Context Propagation
Start with a tracer provider and an OTLP exporter. Ensure you use the same propagator for both extraction and injection so the dependency span becomes a child of the server span.
from opentelemetry import trace
from opentelemetry.sdk.resources import Resource
from opentelemetry.sdk.trace import TracerProvider
from opentelemetry.sdk.trace.export import BatchSpanProcessor
from opentelemetry.exporter.otlp.proto.http.trace_exporter import OTLPSpanExporter
from opentelemetry.propagate import set_global_textmap
from opentelemetry.propagators.tracecontext import TraceContextTextMapPropagator

set_global_textmap(TraceContextTextMapPropagator())

resource = Resource.create({"service.name": "orders-service", "service.version": "1.0.0"})
provider = TracerProvider(resource=resource)
provider.add_span_processor(BatchSpanProcessor(OTLPSpanExporter(endpoint="http://localhost:4318/v1/traces")))
trace.set_tracer_provider(provider)
tracer = trace.get_tracer("orders-service")
Step 2: Instrument the HTTP Handler
Create a server span around request handling. Use semantic-friendly attributes: method, route, and status code. When an error occurs, record the exception and set the span status.
from opentelemetry.trace import Status, StatusCode
from opentelemetry.instrumentation.wsgi import OpenTelemetryMiddleware

# If Using a Framework with Auto-Instrumentation, Keep Manual Spans for Custom Work.
# Otherwise, wrap the handler with a span.

def handle_get_order(request, order_id):
    with tracer.start_as_current_span("GET /orders", kind=trace.SpanKind.SERVER) as span:
        span.set_attribute("http.method", "GET")
        span.set_attribute("http.route", "/orders/{id}")
        try:
            order = get_order(order_id)
            span.set_attribute("http.status_code", 200)
            return order
        except Exception as e:
            span.record_exception(e)
            span.set_status(Status(StatusCode.ERROR, "order lookup failed"))
            span.set_attribute("http.status_code", 500)
            raise
Step 3: Instrument the Dependency Call
When calling inventory, create a client span and inject the trace context into outgoing headers. This is where correlation becomes automatic instead of manual.
import requests
from opentelemetry import propagate

def get_inventory(sku):
    headers = {}
    propagate.inject(headers)
    with tracer.start_as_current_span("GET /inventory", kind=trace.SpanKind.CLIENT) as span:
        span.set_attribute("http.method", "GET")
        span.set_attribute("http.route", "/inventory/{sku}")
        resp = requests.get(f"http://inventory-service/inventory/{sku}", headers=headers, timeout=2)
        span.set_attribute("http.status_code", resp.status_code)
        if resp.status_code >= 500:
            span.set_status(Status(StatusCode.ERROR, "inventory server error"))
        return resp.json()
Step 4: Add Metrics with Consistent Dimensions
Use a histogram for request duration, a counter for errors, and a gauge for in-flight requests. Keep dimensions aligned with trace attributes so dashboards and trace sampling decisions make sense.
- Histogram:
http.server.durationwith labelshttp.method,http.route,http.status_code. - Counter:
http.server.errorswith labelshttp.method,http.route. - Gauge:
http.server.in_flightwithout high-cardinality labels.
Step 5: Emit Logs That Correlate to Traces
When logging inside the handler, include trace_id and span_id from the current span. Use structured fields so log queries can filter by route and status.
import logging
from opentelemetry.trace import get_current_span

logger = logging.getLogger("orders")

def log_with_trace(message, **fields):
    span = get_current_span()
    ctx = span.get_span_context()
    logger.info(message, extra={
        **fields,
        "trace_id": format(ctx.trace_id, "032x"),
        "span_id": format(ctx.span_id, "016x"),
    })
Step 6: Validate the Output End to End
Send a request and verify three things:
- A trace exists with a server span and a child client span.
- The server span has
http.route,http.method, andhttp.status_code. - The log record includes the same
trace_idas the server span.
If any of these fail, fix the gap at the source: missing context propagation, missing attributes, or logs emitted outside the active span.
8. Distributed Context Propagation Across Services and Protocols
8.1 Propagation Fundamentals and Trace Context Lifecycles
Propagation is the mechanism that carries trace identity and timing relationships across process boundaries. In OpenTelemetry, this is primarily about moving the right context from an incoming request to outgoing calls, so that spans from different services can be stitched into one coherent trace.
What Trace Context Actually Contains
Trace context is a small set of identifiers and flags that travel with the request. At minimum, it includes a trace identifier (the “which trace” part) and a span identifier (the “which parent” part). It also includes trace flags that indicate whether the trace is sampled. When sampling is disabled, the system still propagates identifiers so decisions remain consistent across hops.
A key lifecycle detail: the context is created when a span is started, then stored in an execution-local place (often thread-local or async context). Propagation reads from that storage when you make an outbound call, and writes into it when you handle an inbound request.
The Inbound Lifecycle from Headers to Current Span
When a service receives a request, it typically extracts trace context from incoming headers. If valid context is present, the service starts a new span as a child of the extracted span. If no context exists, the service starts a new trace and creates a root span.
This is where “current span” matters. The extracted context becomes the parent for the new span, and the new span becomes the current span for the rest of the request handling.
Example:
- Service A receives an external request with no trace headers.
- It starts a root span for the request.
- Service B later receives a request from A that includes trace headers.
- B extracts those headers and starts a span whose parent is A’s span.
The Outbound Lifecycle from Current Span to Headers
When your code makes an outbound call, propagation injects the current trace context into the outgoing request headers. The injected context must represent the span that should be considered the parent of the downstream work.
If you forget to set the current span correctly, injection will either omit context or use the wrong parent. The result is a trace that looks like it has missing links or unexpected branching.
Example:
- Your handler starts a span for “GET /orders”.
- Inside it, you call a database or another service.
- Before the outbound call, the current span is the handler span.
- Injection places that span’s context into headers, so the downstream span becomes its child.
Span Relationships and Why Parentage Is Not Optional
Parentage defines the structure of a trace. A span’s parent is not just a label; it determines how timing and causality are represented. In practice, parentage is what lets you answer questions like “what work led to this slow operation?”
There are also span kinds that influence interpretation. For example, a server span represents work handling an incoming request, while a client span represents making an outbound request. Even when both are present, the parent-child relationship still comes from context propagation.
Mind Map: Trace Context Lifecycle
Trace Context Lifecycle Mind Map
Mind Map: Where Context Lives During Execution
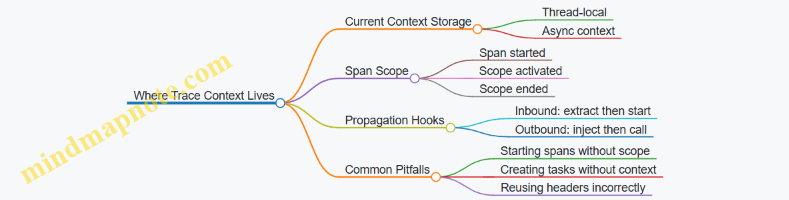
A Minimal End-to-End Example
Below is a conceptual flow that shows the lifecycle without tying it to a specific language runtime.
Inbound request arrives
  -> Extract trace context from headers
  -> Start server span (parent = extracted span)
  -> Activate span as current
  -> Handle business logic
  -> For outbound call
       -> Start client span (child of current)
       -> Inject current context into headers
       -> Send request
  -> End spans
Practical Rules That Prevent Broken Traces
- Always extract before starting the server span.
- Always inject from the span that is current at the moment you make the outbound call.
- Treat scope activation as part of correctness, not convenience—especially in async code.
When these rules hold, the trace becomes a chain of causality rather than a collection of unrelated spans. That’s the whole point of propagation: consistent identity and consistent parentage across boundaries.
8.2 HTTP Header Propagation for Incoming and Outgoing Requests
Distributed tracing only works if every hop agrees on how to carry identity. For HTTP, that agreement is mostly about headers: what you accept on the way in, what you emit on the way out, and how you keep the trace context consistent when requests are retried, redirected, or handled by multiple services.
Core Idea and Header Roles
When an incoming request arrives, the server extracts trace context from specific HTTP headers and uses it to create the “current” span context. When the server calls another service, it injects that current context into outgoing request headers so the downstream server can join the same trace.
A practical way to think about it:
- Incoming headers provide the trace identity and timing relationship.
- Outgoing headers carry that identity forward.
- Local spans wrap the work done at each hop.
Mind Map: HTTP Propagation Flow
HTTP Header Propagation Mind Map
Incoming Request Handling Step by Step
- Read the request headers before creating your server span. If the expected trace headers are present and valid, you treat the extracted context as the parent.
- Create a server span for the request handling. Its parent should be the extracted span context, not a random local span.
- Attach useful HTTP attributes to the span. At minimum, capture the HTTP method and the response status. If you have the route template, record it too; it makes aggregation far easier than relying on raw paths.
- Keep the extracted context in scope for the duration of the request so any nested operations automatically become children of the server span.
A common best practice is to ensure your framework middleware runs early enough that all downstream handlers see the correct context.
Outgoing Request Handling Step by Step
- Create a client span around the outgoing call. This span represents the act of making the request.
- Inject the current span context into the outgoing HTTP headers. The injected context should reflect the client span as the “current” context for the downstream service.
- Send the request and then record response details on the client span, including status code and any error information.
- Preserve context across async boundaries so the injection happens with the intended current span.
A subtle but important detail: injection should happen after you start the client span, so the downstream service links to the correct parent.
Header Names and What They Represent
OpenTelemetry uses a standard set of trace headers for HTTP propagation. Conceptually, they carry:
- Trace identifier: identifies the overall trace across services.
- Span identifier: identifies the parent or current span for relationship building.
- Trace flags: includes sampling-related bits so downstream services can make consistent decisions.
You don’t need to memorize every header name to use the system correctly, but you should treat them as reserved. Overwriting them with unrelated values breaks correlation.
Example: Server Extracts and Creates a Span
Incoming request headers include trace context.
Server middleware extracts context.
Server creates span: kind=server, parent=extracted.
Handler runs with extracted context in scope.
Span records method and status.
Example: Client Span Injects Headers
Handler starts client span for outbound call.
Client span becomes current context.
Injector writes trace headers into outgoing request.
Downstream service extracts headers and creates its server span.
Trace continues with correct parent-child linkage.
Edge Cases That Matter in Real Systems
- Missing headers: treat it as a new trace. Your server span becomes the root.
- Invalid headers: ignore them and start a new trace rather than trying to “repair” malformed values.
- Retries: if you retry the same logical operation, decide whether each attempt should be a separate client span (often clearer) or whether you want to reuse the same span identity (rarely worth the confusion). Either way, keep parent-child relationships consistent within an attempt.
- Redirects: if your HTTP client follows redirects automatically, ensure the propagation happens for each redirected request so the trace doesn’t silently fork.
Practical Checklist for Correct Propagation
- Middleware extracts context before span creation.
- Client spans are started before injection.
- Context is preserved across async execution.
- HTTP attributes include method and status at minimum.
- Reserved trace headers are not overwritten by application code.
When these pieces line up, the trace graph becomes a faithful map of request flow rather than a collection of disconnected spans that merely share a vague resemblance to each other.
8.3 RPC Framework Propagation for Common Client Server Flows
RPC propagation is where trace context stops being “just headers” and becomes part of the request lifecycle: client creates a span, injects context into the RPC metadata, server extracts it, and then continues the trace with a new span. The goal is simple: every hop should share the same trace identity while preserving correct parent-child relationships.
Core Flow for Client Server RPC
Start with two roles: the RPC client and the RPC server. On the client side, you create a span representing the outgoing call. Before the call is sent, you inject the current context into the outgoing metadata. On the server side, you extract that metadata into a context, then start a span for the server handler using the extracted context as the parent.
A practical mental model: the client span is the “request in flight,” and the server span is the “request being handled.” If you get parentage wrong, you’ll see broken trees and confusing latency breakdowns.
Mind Map: RPC Propagation Lifecycle
Metadata Injection and Extraction Rules
RPC frameworks differ in how they store metadata, but the rules stay consistent. You need a carrier abstraction that maps trace context fields into metadata key-value pairs. Common pitfalls include using the wrong metadata container, losing casing, or accidentally overwriting existing metadata.
When extraction fails—because metadata is missing or malformed—the server should start a new trace rather than crashing. That behavior keeps telemetry flowing even when some hops are misconfigured.
Example: Client Injects Context into RPC Metadata
Client:
  currentContext = contextWithActiveSpan()
  span = startSpan(kind=Client, name="rpc call")
  with span in scope:
    metadata = newRpcMetadata()
    inject(currentContext, metadata)  // writes trace fields
    rpcClient.call(method, request, metadata)
  end span with status and duration
Example: Server Extracts Context and Creates Server Span
Server:
  metadata = request.metadata
  extractedContext = extract(metadata) // reads trace fields
  span = startSpan(kind=Server, name="rpc handler", parent=extractedContext)
  with span in scope:
    handle(request)
  end span with status and events
Common Client Server Flows You Should Model
Unary Request Response
This is the most common flow: one request, one response. The client span should cover the full round trip, while the server span should cover handler execution. If you also instrument internal work, those spans should become children of the server span.
Best practice: record the RPC status on both sides. The client can set status based on the RPC result, while the server sets status based on handler outcome.
Streaming RPC
Streaming adds two complications: the “call” lasts longer than a single message, and metadata injection happens once at stream start. The client span should represent the stream lifecycle, and server spans should represent handler phases or per-message processing depending on your instrumentation strategy.
Best practice: keep per-message spans consistent. If you create spans per message, ensure they are parented to the server span created from extracted stream context.
Bidirectional Streaming
Here, both sides send and receive messages over the same stream. The trace context still comes from the initial metadata exchange. After that, you can treat each message handler as a child span of the server’s stream span.
Best practice: avoid mixing message-level spans with stream-level spans in a way that makes durations overlap confusingly. Decide what each span is responsible for, then stick to it.
Span Naming and Attribute Consistency
For RPC, span names should be stable and query-friendly. A common approach is to use the RPC method name (or a normalized form of it) rather than including dynamic request identifiers. Add attributes that help you filter and group: RPC system, service name, method, and peer information.
Resource attributes should identify the service producing the span. That means the client and server services should have different service identity values, even though they share the same trace ID.
Handling Missing or Invalid Context
If the client does not inject metadata, the server extraction yields an empty context. The server then starts a new trace, which is better than dropping the span. To keep troubleshooting practical, record an event on the server span when extraction is missing or invalid, but avoid logging raw metadata values.
Example: Server Records Extraction Outcome
if extractedContext is empty:
  span.addEvent("rpc context missing")
  // continue with new trace
else:
  span.addEvent("rpc context extracted")
Practical Checklist for Correct Parentage
- Client spans must be created with kind Client and injected before the RPC call.
- Server spans must be created with kind Server and extracted before handler execution.
- Parent-child relationships must follow the extracted context, not the server’s local active span.
- Status and outcome must be recorded on both sides using the RPC result.
- Metadata keys must match what your extraction/injection expects, including casing rules.
When these pieces line up, your trace graph becomes a clean chain of request lifecycles rather than a pile of unrelated spans that happen to share a timestamp.
8.4 Messaging Propagation for Queues Topics and Streams
Messaging is where trace context often goes to get lost. Unlike HTTP, there’s no built-in request/response header exchange, so you must explicitly carry identifiers inside message metadata and then reconstruct spans on the consumer side.
Core Idea for Context in Messaging
In OpenTelemetry, you typically want the consumer spans to be children of the producer span that created the message. That means the producer must inject the current trace context into the outgoing message, and the consumer must extract it when the message arrives.
A practical rule: treat the message as the “carrier” and the processing as the “work.” The message itself should carry enough information to correlate producer and consumer activity.
Message Carrier Design
Most messaging systems support message headers or properties. Use them for trace context fields such as trace id and span context. Keep the carrier small and stable so you can route and store messages without surprises.
When designing your message schema, decide what you will always include:
- A stable message key (useful for ordering and debugging)
- A trace context carrier (in headers/properties)
- A minimal set of business fields needed by the consumer
Avoid putting trace context in the message body unless you have no other choice; headers/properties are easier to filter and less likely to interfere with serialization.
Producer Side Injection Workflow
On the producer, you create a span representing the act of publishing. Then you inject the active context into the message metadata.
Example: publishing an order event to a topic.
Start span: publish.order
Set attributes: messaging.system=pubsub, messaging.destination=orders
Inject trace context into message headers/properties
Publish message with headers + body
End span: publish.order
Best practice: include destination attributes consistently so you can group traces by topic/queue in the backend.
Consumer Side Extraction and Span Linking
On the consumer, you extract the trace context from the message metadata. Then you start a consumer span that represents processing the message.
You’ll usually also record message-specific attributes such as:
- messaging.destination
- messaging.operation (send vs receive)
- messaging.message_id if available
- processing outcome via span status and events
Example: consuming an order event from a topic.
Extract trace context from message headers/properties
Start span: process.order with extracted parent
Set attributes: messaging.system, messaging.destination
Process business logic
Record errors as span events or status
End span
If your consumer processes multiple messages in a batch, create spans per message so failures and timings remain attributable.
Handling Acknowledgement, Retries, and Dead Letters
Messaging systems often retry on failure. That can create repeated processing spans for the same message id. To keep correlation useful:
- Use the same message id attribute across attempts
- Record retry count if your system exposes it
- On dead-letter routing, keep the original trace context so the dead-letter handler can still relate back to the producer
A common pitfall: dropping headers during retry or dead-letter publishing. If your retry mechanism republishes messages, ensure it copies the metadata carrier.
Ordering and Partitioning Considerations
When ordering matters, partition keys influence which consumer instance receives messages. Trace context propagation still works the same way, but your attributes should reflect the destination and partitioning fields if available.
This helps you answer questions like: “Are slow traces concentrated in one partition?” without guessing.
Mind Map: Messaging Propagation
Example: Queue with Retry and Dead Letter
Imagine a queue named payments.queue. A producer publishes payment.created messages. The consumer processes them and sometimes fails due to a transient database issue.
- On the first failure, the consumer retries and republishes the message.
- On the final failure, the message is routed to a dead-letter queue.
To keep traces coherent:
- The producer span should be the parent of the first consumer span.
- The retry consumer spans should still use the same extracted trace context.
- The dead-letter handler span should also extract the same context, so you can see the full chain from publish to failure handling.
This approach turns “mysterious retries” into a traceable sequence of spans with consistent identifiers, which is exactly what you want when debugging distributed behavior.
8.5 Testing Propagation with Deterministic Correlation Checks
Propagation bugs are annoying because they often “work” until you try to correlate across services. Deterministic correlation checks make the problem visible by forcing stable identifiers and verifying that the same identifiers appear in the right places across requests.
Core Idea: Make Correlation Measurable
A propagation test should answer three questions:
- Did the incoming request carry a trace context?
- Did the service create child spans with the expected parent-child relationship?
- Did the outgoing request include the same trace context identifiers?
To keep tests deterministic, avoid relying on random trace IDs generated at runtime. Instead, inject a known trace context into the test request and assert that the system preserves it.
Deterministic Setup Strategy
Use a fixed trace context for the test run:
- Trace ID: a known 16-byte value (hex string)
- Span ID: a known 8-byte value
- Trace Flags: set sampling to a known value
Then:
- Send an HTTP request to a “server” handler.
- Inside the handler, start a span and make an outgoing HTTP call to a “client” handler.
- In both handlers, record the trace context and span relationships.
What to Assert
For each request, assert these invariants:
- Trace ID equality: incoming trace ID equals outgoing trace ID.
- Parent-child correctness: the server span’s parent matches the incoming span context.
- Span ID uniqueness: the server span ID differs from the incoming span ID.
- Header round-trip: the outgoing request contains the same trace ID and trace flags.
These assertions catch common mistakes like dropping headers, creating new traces unintentionally, or mis-wiring parent context.
Mind Map: Deterministic Propagation Checks
Example: HTTP Round-Trip with Fixed Trace Context
Below is a minimal test-style sketch showing the shape of assertions. The key is that the test injects known header values and then checks what the server and client handlers observe.
fixedTraceId = "4bf92f3577b34da6a3ce929d0e0e4736"
fixedParentSpanId = "00f067aa0ba902b7"
fixedTraceFlags = "01"  // sampled

headers = {
  "traceparent": "00-" + fixedTraceId + "-" + fixedParentSpanId + "-" + fixedTraceFlags
}

response = httpGet("/server", headers)

assert response.server.traceId == fixedTraceId
assert response.server.parentSpanId == fixedParentSpanId
assert response.server.spanId != fixedParentSpanId

assert response.client.traceId == fixedTraceId
assert response.client.parentSpanId == response.server.spanId
This pattern works because it forces the system to either preserve the trace context or visibly break correlation.
Example: Verifying Header Content at the Boundary
Sometimes the easiest failure is “headers never left the process.” Add a boundary check that inspects the outgoing request headers before they are sent.
capturedOutgoingHeaders = []

clientInstrumentation.onRequest = (req) => {
  capturedOutgoingHeaders.push(req.headers)
}

httpGet("/server", headers)

out = capturedOutgoingHeaders[0]
assert out.traceparent contains fixedTraceId
assert out.traceparent contains fixedTraceFlags
This catches exporter-side confusion too: propagation should be correct before any collector or backend is involved.
Systematic Test Matrix Without Guesswork
Run the same deterministic test across a small matrix of conditions:
- Sampling on vs off: keep trace IDs fixed and verify trace flags propagate.
- Missing incoming headers: assert a new trace is created and parent is absent.
- Malformed header: assert extraction fails safely and a new trace is created.
Each case checks a distinct behavior rather than hoping one test covers everything.
Common Pitfalls and How Deterministic Checks Expose Them
- New trace created unexpectedly: trace ID assertion fails immediately.
- Parent context lost: parentSpanId assertion fails even if trace ID matches.
- Wrong parent: parentSpanId mismatch reveals incorrect context scoping.
- Headers dropped on outgoing calls: boundary header capture shows absence.
Deterministic correlation checks turn these into precise, repeatable failures instead of “it seems missing in the UI.”
9. Collector Pipelines for Metrics Logs and Traces
9.1 Collector Pipeline Anatomy Receivers Processors Exporters
A collector pipeline is a controlled conveyor belt for telemetry. Each stage has a job, and the collector keeps the stages separate so you can reason about what happens to data at each step.
Pipeline Stages and Their Responsibilities
Receivers accept telemetry from clients or other collectors. They define the network surface and the initial decoding rules. If a receiver can’t parse a payload, nothing else in the pipeline gets a chance to help.
Processors transform, filter, enrich, or batch data. They run after decoding and before export, so they can rely on a consistent internal representation of traces, metrics, and logs.
Exporters send the processed telemetry to a destination such as a backend, another collector, or a storage system. Exporters are where delivery semantics show up: retries, timeouts, and how failures are handled.
A useful mental model is: receive to normalize, process to shape, export to deliver.
Mind Map of the Pipeline Flow
How Data Moves Through a Pipeline
Within a single pipeline, processors run in the order they are configured. That order matters. For example, if you filter out spans based on an attribute, do it after the attribute is added; otherwise the filter never matches.
Also note that batching is not just a performance tweak. It changes the timing of when data becomes visible downstream, which affects alerting and dashboards that expect near-real-time updates.
Example Pipeline Configuration Skeleton
Below is a compact example showing the anatomy for traces. The same pattern applies to metrics and logs.
service:
  pipelines:
    traces:
      receivers: [otlp]
      processors: [batch, attributes, tail_sampling]
      exporters: [otlp]

receivers:
  otlp:
    protocols:
      grpc:
      http:

processors:
  batch:
    timeout: 1s
  attributes:
    actions:
      - key: service.name
        action: insert
        value: example-service
  tail_sampling:
    decision_wait: 5s

exporters:
  otlp:
    endpoint: https://backend.example:4317
    tls:
      insecure: false
The key idea is that the pipeline section wires stages together, while each stage section defines behavior.
Practical Examples of Stage Responsibilities
Receiver example: OTLP endpoint hygiene
If you expose OTLP on both gRPC and HTTP, keep the receiver configuration explicit. That prevents accidental protocol mismatches when clients switch libraries.
Processor example: attribute enrichment before filtering
Suppose you want to drop spans from a noisy endpoint. If the endpoint attribute is not present until after enrichment, place enrichment before filtering. Otherwise you’ll drop nothing and wonder why the noise remains.
Exporter example: delivery behavior and failure visibility
When an exporter can’t reach the backend, the collector’s retry and buffering determine whether you lose data or delay it. You should treat exporter configuration as part of your reliability story, not as a final checkbox.
Systematic Debugging Using Stage Boundaries
When telemetry is missing, don’t start by staring at the backend. Instead, test each stage boundary:
- Receiver check: confirm the collector is receiving and decoding the payload.
- Processor check: confirm transformations and filters are applied as intended.
- Exporter check: confirm the destination is reachable and accepts the data.
A simple way to do this is to temporarily add a debug exporter that prints a small sample. If the data appears there but not in the backend, the issue is in export or downstream ingestion.
Mind Map of Common Ordering Pitfalls
Integrated Takeaway
A collector pipeline is easiest to reason about when you treat it as a sequence of contracts: receivers guarantee decoding, processors guarantee shaping, and exporters guarantee delivery attempts. Once you respect those contracts, configuration becomes less guesswork and more engineering.
9.2 Building Separate Pipelines for Each Signal Type
Separate pipelines keep each signal’s processing rules clear, testable, and cheaper to operate. In the OpenTelemetry Collector, a pipeline is a named route from one or more receivers through optional processors to one or more exporters. When you split metrics, logs, and traces, you avoid “one size fits none” transformations and you can tune batching, retry behavior, and attribute normalization per signal.
Why Separate Pipelines Work
A pipeline boundary is a practical contract: everything inside it assumes a specific data model. Metrics processors can safely rewrite metric names or transform aggregation temporality without touching trace spans. Log processors can enrich records with correlation fields without risking span status semantics. Traces can apply sampling or span attribute normalization without accidentally dropping log fields.
A common operational win is isolating backpressure. If your trace backend slows down, you can keep metrics flowing by using different batch sizes and retry settings per pipeline.
Mind Map: Pipeline Separation Strategy
Step-by-Step Pipeline Design
- Start with a shared receiver: Use a single OTLP receiver to accept all signals. This keeps network and authentication configuration in one place.
- Create one pipeline per signal: Define
metrics,logs, andtracespipelines even if they initially look similar. - Add processors only where they make sense: For example, metric transformation belongs in the metrics pipeline; log body parsing belongs in the logs pipeline; span filtering belongs in the traces pipeline.
- Export with signal-specific destinations: Many teams route traces and logs to different backends or different indices.
- Validate per pipeline: Confirm that each pipeline exports the expected fields and that processor errors are visible.
Example Collector Configuration Skeleton
This skeleton shows the separation pattern. It uses one OTLP receiver and three pipelines with different processor sets.
receivers:
  otlp:
    protocols:
      grpc:
      http:

processors:
  batch:
    timeout: 1s
    send_batch_size: 1024

  # Placeholder Processors You Would Tailor per Signal
  metrics_transform: {}
  log_enrich: {}
  trace_filter: {}

exporters:
  otlphttp/metrics:
    endpoint: https://example-metrics
  otlphttp/logs:
    endpoint: https://example-logs
  otlphttp/traces:
    endpoint: https://example-traces

service:
  pipelines:
    metrics:
      receivers: [otlp]
      processors: [metrics_transform, batch]
      exporters: [otlphttp/metrics]

    logs:
      receivers: [otlp]
      processors: [log_enrich, batch]
      exporters: [otlphttp/logs]

    traces:
      receivers: [otlp]
      processors: [trace_filter, batch]
      exporters: [otlphttp/traces]
Concrete Processor Choices That Benefit from Separation
Metrics pipeline: Use metric-specific processors to normalize names and labels. For instance, if your application emits http.server.duration and http.duration_ms, you can map both to a single semantic name and ensure consistent units. This prevents dashboards from splitting by accident.
Logs pipeline: Enrich logs with stable correlation fields. A typical pattern is to ensure every log record includes service.name and a trace identifier field when available. If you parse structured log bodies, do it here so you don’t risk breaking trace attribute expectations.
Traces pipeline: Apply span filtering or attribute cleanup based on span kind and status. For example, you might drop spans that represent internal health checks, while keeping spans that represent external calls. Doing this only in the traces pipeline avoids accidentally removing log events that describe those checks.
Validation Checklist per Pipeline
- Metrics: Confirm metric names and label keys match your semantic conventions and that units are consistent.
- Logs: Confirm the log body and parsed fields are present, and correlation fields appear when trace context exists.
- Traces: Confirm span relationships are intact, and that any filtering doesn’t remove critical parent spans.
A practical test is to send one synthetic request that produces one trace, one log event, and one metric update. Then verify that each pipeline exports exactly the expected count and that the shared resource identity fields match across all three signals.
9.3 Routing and Fan Out Strategies for Multi Destination Delivery
Routing decides where telemetry goes; fan out decides how many places it goes to. In the OpenTelemetry Collector, both happen inside pipelines: routing is typically implemented with processors that inspect attributes, and fan out is implemented by sending the same processed data to multiple exporters.
Core Idea: Route by Attributes, Fan Out by Intent
Start with a simple rule: use resource attributes for “who is this?” and span/log attributes for “what is this?”. For example, route by service.name and deployment.environment, then fan out by signal type.
A practical baseline is:
- Metrics: one primary backend for dashboards, plus an optional secondary for long-term retention.
- Traces: one backend for trace exploration, plus a second backend for compliance sampling.
- Logs: one backend for search, plus an optional sink for alerting pipelines.
This keeps each destination’s strengths aligned with the data it receives, without duplicating everything everywhere.
Mind Map: Routing and Fan Out in Collector Pipelines
Step 1: Separate Pipelines by Signal, Then by Destination
The cleanest structure is one pipeline per signal type, because metrics, logs, and traces often need different sampling and different attribute requirements. Within a signal pipeline, you can still split delivery by destination using filtering processors.
Example intent:
- Traces pipeline exports to
trace-prodfor all services. - Traces pipeline also exports to
trace-complianceonly fordeployment.environment=prod.
Step 2: Use Filtering Processors for Conditional Export
Filtering is how you avoid sending everything to every exporter. A common pattern is:
- Enrich attributes early so filters have stable inputs.
- Apply a filter that keeps or drops data for a specific destination.
- Export the remaining data to that destination.
A simple mental model: “If the filter passes, the exporter sees it.”
Step 3: Keep Attribute Contracts Consistent
Routing logic is only as good as the attributes it relies on. If deployment.environment is missing or inconsistent, routing becomes random. Enrichment processors should standardize values before any routing filters run.
For example, normalize service.namespace and service.name so that service.name is always the application name, not the library name. Then routing rules remain stable across deployments.
Step 4: Fan Out with Multiple Exporters, but Control the Blast Radius
Fan out can be done by listing multiple exporters in a single pipeline. That means every exporter receives the same stream. If one backend is slow or misconfigured, you want to avoid stalling the entire pipeline.
Operationally, you control this by:
- Using batching so transient slowness doesn’t immediately block ingestion.
- Ensuring exporters have independent retry behavior.
- Filtering so only the necessary subset reaches the secondary destination.
Example: Traces Routed by Environment and Fan Out to Two Backends
receivers:
  otlp:
    protocols:
      grpc:
        endpoint: 0.0.0.0:4317

processors:
  attributes/enrich:
    actions:
      - key: deployment.environment
        value: prod
        action: upsert
  filter/prod_only:
    error_mode: ignore
    traces:
      span:
        - attributes:
            - key: deployment.environment
              value: prod
              operator: strict

exporters:
  otlp/trace-prod:
    endpoint: trace-prod.example:4317
  otlp/trace-compliance:
    endpoint: trace-compliance.example:4317

service:
  pipelines:
    traces:
      receivers: [otlp]
      processors: [attributes/enrich]
      exporters: [otlp/trace-prod]

    traces/compliance:
      receivers: [otlp]
      processors: [attributes/enrich, filter/prod_only]
      exporters: [otlp/trace-compliance]
This uses two pipelines for the same signal: one always exports to the primary backend, and the other exports only when the filter passes. The result is fan out with controlled conditions.
Example: Metrics Split by Service Group
For metrics, you might route “payments” services to a backend with stricter retention, while sending everything else to the general backend.
A good rule is to group services by a stable attribute like service.name prefix or service.namespace, then filter based on that group. Avoid filtering on high-cardinality attributes like user.id or session.id, because it creates unpredictable routing and expensive processing.
Validation Checklist for Routing and Fan Out
- Confirm routing attributes exist before filters run.
- Compare exported counts per destination against expected service groups.
- Verify that trace-log correlation fields are present in both destinations when logs are also exported.
- Ensure secondary destinations receive only the intended subset, not the full stream.
When routing and fan out are designed this way, you get predictable delivery, less duplicated work, and fewer “why is this backend empty?” moments.
9.4 Batch Retry and Backpressure Handling in Pipelines
A collector pipeline has two jobs that often fight each other: move telemetry forward quickly, and avoid losing data when downstream systems slow down or fail. Batching helps with throughput, but it also changes failure behavior. When a batch export fails, you need a retry strategy that is predictable, bounded, and friendly to backpressure.
Batch Retry Fundamentals
Batching groups telemetry items into export requests. If an export attempt fails, the collector may retry the same batch. The key design choices are:
- Retryable vs non-retryable errors: network timeouts and temporary backend errors are usually retryable; malformed payloads are not.
- Retry limits: retries must stop, or you risk infinite queue growth.
- Backoff behavior: repeated immediate retries can amplify load on an already struggling backend.
- Idempotency expectations: retries can cause duplicates unless the backend or pipeline provides deduplication semantics.
A practical rule: treat retries as a way to survive transient issues, not as a substitute for correct data modeling.
Backpressure Mechanics
Backpressure is what happens when the pipeline produces faster than it can export. In a collector, backpressure typically shows up as:
- Queue growth between processors and exporters.
- Increased export latency because batches wait longer.
- Potential drops when queues hit capacity.
To handle this systematically, you need to decide what to protect:
- Protect memory by bounding queues.
- Protect latency by limiting batch size and wait time.
- Protect data quality by choosing which signal types can be dropped first.
Mind Map: Batch Retry and Backpressure
Example: Reasoning Through a Failed Export
Imagine a pipeline exporting traces to a backend over OTLP. A batch of 2,000 spans is formed every 5 seconds or when it reaches a size threshold. The exporter sends the batch and receives a timeout.
A good retry strategy does the following:
- Classifies the error as retryable because it looks like a transient network issue.
- Retries with backoff so the backend has time to recover.
- Caps retries so the same batch does not occupy resources forever.
- Preserves ordering only where it matters. For telemetry, strict ordering is rarely required, but consistent correlation fields are.
If the backend later returns a 400-level error indicating invalid attributes, retries should stop. Retrying would just waste capacity while the queue grows.
Example: Backpressure with Bounded Queues
Suppose the exporter slows down due to backend throttling. The collector keeps accepting telemetry from instrumented services, so the internal queue grows. Once the queue hits its limit, the collector must choose between blocking ingestion and dropping.
A common, practical approach is:
- Prefer bounded blocking for a short period to absorb brief slowdowns.
- Drop with a clear policy when the queue remains full.
For example, you might drop the oldest batches first to keep the most recent telemetry. That choice is not perfect, but it prevents the system from spending all resources on stale data.
Example: Collector Configuration Pattern
Below is a conceptual pattern showing how batching, retry, and queue limits are typically expressed. Exact field names vary by collector distribution and version, so treat this as a design template.
exporters:
  otlp:
    endpoint: https://backend.example/v1/otlp
    retry_on_failure:
      enabled: true
      max_elapsed_time: 30s
      initial_interval: 500ms
      max_interval: 5s
    sending_queue:
      enabled: true
      queue_size: 10000
      num_consumers: 2
processors:
  batch:
    timeout: 5s
    send_batch_size: 2000
If you see queue length climbing while exporter errors are retryable, you likely need either a larger queue (if memory allows) or a smaller batch/timeout to reduce per-request work. If exporter errors are non-retryable, the fix is upstream data correctness or credentials, not more retries.
Operational Checks That Prevent Surprises
When batch retry and backpressure are working, you should observe:
- Exporter error counters rising only briefly during transient incidents.
- Queue length returning to baseline after recovery.
- Dropped item counters staying near zero under normal load.
- Stable end-to-end latency without sawtooth patterns that indicate repeated timeouts.
A simple mental model helps: batching increases efficiency, retries increase resilience, and backpressure controls prevent resource exhaustion. The collector is happiest when those three are tuned together rather than independently.
9.5 Example Collector Config for a Multi Service Deployment
A multi-service deployment usually means you want three things at once: consistent identity across services, signal-specific processing, and predictable routing to one or more backends. The OpenTelemetry Collector is a good fit because it separates ingestion (receivers), transformation (processors), and delivery (exporters) into explicit pipeline stages.
Foundational Layout for Multi Service Pipelines
Start by deciding how telemetry enters the collector. A common pattern is a single OTLP endpoint that accepts data from many services, then routes by signal type and service identity.
In practice, you’ll typically:
- Use one OTLP receiver for all services.
- Split pipelines by signal type: traces, metrics, and logs.
- Normalize resource attributes so every service has the same identity fields.
- Apply light filtering early to reduce noise and cost.
- Batch and retry to smooth out backend hiccups.
Mind Map: Multi Service Collector Responsibilities
Example Collector Configuration
Below is a compact but realistic configuration skeleton. It assumes:
- Services send OTLP to the collector.
- You want consistent resource attributes.
- You export all three signals to the same backend.
receivers:
  otlp:
    protocols:
      grpc:
        endpoint: 0.0.0.0:4317
      http:
        endpoint: 0.0.0.0:4318

processors:
  resource:
    attributes:
      - key: service.namespace
        value: "payments"
        action: upsert
      - key: deployment.environment
        value: "prod"
        action: upsert

  transform:
    error_mode: ignore
    log_statements:
      - context: log
        statements:
          - set(attributes["otel.log.severity_text"], attributes["severity_text"]) where attributes["severity_text"] != nil

  batch:
    send_batch_size: 1024
    timeout: 5s

exporters:
  otlp:
    endpoint: backend.example.internal:4317
    tls:
      insecure: false

service:
  pipelines:
    traces:
      receivers: [otlp]
      processors: [resource, batch]
      exporters: [otlp]
    metrics:
      receivers: [otlp]
      processors: [resource, batch]
      exporters: [otlp]
    logs:
      receivers: [otlp]
      processors: [resource, transform, batch]
      exporters: [otlp]
This example shows the core idea: one receiver, three pipelines, and processors reused where they make sense. The transform processor is placed only in the logs pipeline because it’s log-specific.
Attribute Normalization That Actually Helps
Resource normalization is where multi-service setups either stay manageable or turn into a guessing game. If one service uses service.name and another uses a custom key, queries become inconsistent.
A practical approach is to:
- Ensure
service.nameis provided by instrumentation. - Upsert
service.namespaceanddeployment.environmentat the collector when they’re missing. - Keep the collector’s normalization rules simple and deterministic.
In the example, service.namespace is set to payments and deployment.environment to prod. In a real deployment, you might set these based on the incoming network segment or a known deployment label, but the key point is that the collector should enforce a consistent schema.
Routing by Service Identity Without Duplicating Pipelines
If you need different backends per service, you can route using processors that filter or set attributes, then export from signal pipelines to different exporters. The simplest method is to keep one pipeline per signal and use conditional processors.
Here’s a small pattern that drops noisy logs from a specific service while keeping everything else:
processors:
  filter/logs:
    error_mode: ignore
    logs:
      exclude:
        match_type: strict
        attributes:
          - key: service.name
            value: "debug-worker"
Then add filter/logs to the logs pipeline’s processor list before batch. This keeps the configuration readable because the routing logic stays close to the signal it affects.
Operational Checks for a Multi Service Collector
After deploying, verify three things in order:
- The collector receives data from multiple services on the same OTLP endpoint.
- Resource attributes are present and consistent across services.
- Each pipeline exports the expected signal type.
A quick sanity check is to look for a single service’s traces, metrics, and logs sharing the same service.name, service.namespace, and deployment.environment. If those fields don’t line up, the issue is usually instrumentation or resource normalization, not the backend.
Mind Map: Configuration Flow
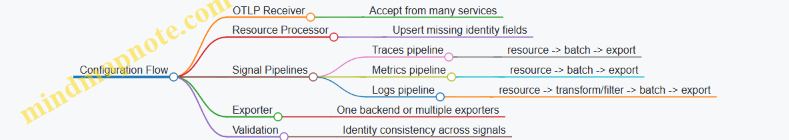
10. Collector Processors for Normalization Filtering and Enrichment
10.1 Attribute Transformation and Normalization Workflows
Attribute transformation and normalization are the quiet workhorses of a collector pipeline. They turn “whatever the instrumenter sent” into “what your backend can consistently understand,” while keeping semantic conventions intact.
Goals and Invariants
Start by stating what must never change:
- Semantic meaning: an attribute’s intent should remain the same even if its value format changes.
- Cardinality discipline: transformations should avoid creating new high-cardinality dimensions accidentally.
- Traceability: if you rewrite values, keep enough context to explain the rewrite during debugging.
A practical invariant is: normalize for consistency, but don’t invent meaning. If a field is missing, prefer adding a default only when the semantic convention allows it.
Mind Map: Attribute Transformation and Normalization
Step 1: Detect and Classify Incoming Attributes
Collectors receive attributes from multiple places: SDK instrumentation, auto-instrumentation, and receiver metadata. The first workflow step is to classify each attribute by where it came from and what it likely represents.
Example: you may see both http.method and a custom method. Detection logic should treat http.method as authoritative when present, and only map method into http.method when http.method is missing.
Step 2: Validate Against Semantic Expectations
Validation is not about being strict for its own sake; it prevents silent data drift.
Common checks:
- Type sanity:
http.status_codeshould be numeric, not a string. - Value shape:
db.systemshould be a known category (for example,mysql,postgresql). - Unit consistency: metric values should match the unit implied by the semantic convention.
Example: if an app reports rpc.grpc.status_code as "OK" instead of a numeric code, normalize it to the expected representation rather than leaving it for dashboards to guess.
Step 3: Rewrite with Minimal Meaning Changes
Rewrite operations typically fall into four buckets.
- Rename and map
- Map legacy names to semantic names.
- Example: map
service_nametoservice.name.
- Convert formats
- Convert timestamps, booleans, or numeric strings.
- Example: convert
"true"totrueforfaas.trigger.type-adjacent flags if you use them.
- Normalize units and scales
- Example: convert milliseconds to seconds for a metric that is defined in seconds.
- Derive carefully
- Derive only when the semantic convention supports the derived attribute.
- Example: derive
network.protocolfromhttp.schemeonly if you can do it deterministically.
A useful pattern is to keep an “evidence” attribute when you derive or rewrite. For instance, add otel.attribute_rewrite_reason with values like mapped_from_service_name.
Step 4: Enrich Service Identity and Correlation Fields
Normalization often includes ensuring consistent identity across signals.
Example: if your logs lack resource attributes, you can enrich them so that service.name, service.namespace, and service.instance.id appear uniformly. This makes cross-signal queries possible without relying on backend-specific join tricks.
For distributed context, ensure derived correlation fields don’t break traceability. If you copy trace identifiers into log attributes for search, keep them aligned with the trace context fields used by your backend.
Step 5: Filter to Control Cardinality and Noise
Filtering is part of normalization, not an afterthought.
Example filters:
- Drop attributes that contain full URLs with query strings when you only need the route template.
- Remove per-request identifiers from metric labels; keep them in traces instead.
A safe rule: if an attribute can vary per request and you plan to attach it to metrics, treat it as suspicious until proven otherwise.
Step 6: Preserve Originals for Debugging
When you rewrite, preserve the original value in a dedicated attribute when it helps troubleshooting.
Example: if you normalize http.status_code from a string, store the original in http.status_code_original for one debugging window, then remove it once you confirm stability.
Example: End-to-End Normalization Scenario
Imagine a service that emits:
service_nameinstead ofservice.namehttp.status_codeas a stringhttp.targetas a full path including query parameters
A coherent workflow:
- Map
service_name→service.name. - Convert
http.status_codefrom string to integer. - Replace
http.targetwith a route-like value (for example,/orders/{id}) and drop the query string. - Add
otel.attribute_rewrite_reasonmarkers for each rewrite.
The result is stable dashboards and predictable filters, without losing the ability to explain what changed when something looks off.
10.2 Filtering Strategies for Noise Reduction and Cost Control
Filtering in the OpenTelemetry Collector is less about “dropping data” and more about deciding what deserves to survive the trip. The goal is to reduce storage and processing cost while keeping the signals that answer real questions: what broke, where it broke, and how often.
Core Principles for Filtering
Start with a simple rule: filter after you have enough context to make a correct decision. If you remove attributes too early, later processors can’t normalize or route reliably.
Use three layers of filtering, in this order:
- Drop entire telemetry items when they are clearly irrelevant.
- Keep the item but reduce detail by removing attributes or events.
- Reduce volume by sampling or aggregating where appropriate.
A practical example: if you only care about HTTP errors for external traffic, you can drop successful health-check requests entirely, keep error spans, and remove verbose request headers from the remaining items.
Mind Map: Filtering Decision Flow
Item-Level Filtering for Clear Irrelevance
Item-level filtering removes telemetry that cannot contribute to your questions. Common targets include:
- Health checks that always succeed.
- Internal noise like debug-only spans.
- Low-value logs such as routine “request received” messages.
A good practice is to filter by stable attributes first, such as service.name, service.namespace, deployment.environment, and http.route or rpc.service. Avoid filtering solely on free-form message text; it’s brittle and often inconsistent.
Example logic for traces:
- Drop spans where
http.routeequals/healthandhttp.status_codeis 200. - Keep spans for
/healthwhen status is not 200, because those are the moments you actually want.
Attribute-Level Pruning to Reduce Payload and Cardinality
Attribute pruning keeps the telemetry item but removes fields that inflate cost or hinder query performance.
Two categories matter most:
- High-cardinality attributes: user IDs, session IDs, request IDs, raw URLs with query strings.
- Large attributes: stack traces, full request/response bodies, oversized exception messages.
A systematic approach:
- Identify attributes that vary per request.
- Decide whether you need them for debugging.
- If you do, keep a bounded version (for example, a truncated hash or a short error code).
- If you don’t, remove them.
Example for logs:
- Keep
error.typeanderror.messageonly whenlog.severityis error. - Remove
http.request.bodyentirely. - Keep
trace_idandspan_idso log-to-trace correlation still works.
Event-Level Pruning for Traces
Traces can include events like “exception” or “message sent.” If you emit many events per span, payload grows quickly.
Filter events based on:
- Event name: keep exceptions, drop repetitive progress events.
- Event count: cap the number of events per span.
- Event attributes: remove large fields from events while keeping the event type.
Example:
- Keep exception events for spans with
status.code= error. - Drop “retry scheduled” events after the first retry, since the fact of retry is usually enough.
Sampling as a Volume Control
Sampling reduces the number of telemetry items exported. Use it when item-level filtering can’t remove enough volume without losing meaning.
For traces, a common pattern is:
- Sample all error traces.
- Sample a smaller fraction of successful traces.
This preserves the ability to investigate failures while controlling cost. For metrics, prefer aggregation and downsampling over sampling when possible, because metrics are already designed to summarize.
Collector Configuration Example
Below is a conceptual Collector pipeline snippet showing the idea of dropping health-check spans and pruning attributes. (Exact processor names depend on your Collector distribution and enabled components.)
processors:
  filter/health:
    traces:
      span:
        - attributes:
            - key: http.route
              value: /health
            - key: http.status_code
              value: 200
          action: drop
  attributes/prune:
    actions:
      - key: http.request.body
        action: delete
      - key: user.id
        action: delete
      - key: url.full
        action: delete
Then apply these processors in the traces pipeline in the order that preserves correlation and routing.
Validation Without Guesswork
After filtering, validate with three checks:
- Error visibility: error rates and latency percentiles should remain stable.
- Correlation integrity: logs and traces should still share
trace_id. - Query sanity: dashboards that rely on specific attributes should still return results.
If a dashboard suddenly goes blank, it usually means you filtered a required attribute or dropped the wrong category of telemetry. Fix the filter criteria first, then re-run the validation checks.
10.3 Resource Detection and Service Identity Enrichment
Resource detection answers a simple question: “Who am I, and where am I running?” In OpenTelemetry, that answer becomes Resource attributes attached to every telemetry item. Service identity enrichment then makes those attributes consistent across processes, hosts, and environments so that metrics, logs, and traces line up without manual cleanup.
Core Concepts and Why They Matter
A Resource is a set of key-value attributes such as service.name, service.namespace, and deployment.environment. When the Collector receives telemetry, it can add or normalize Resource attributes before exporting. This matters because backends typically group and filter by these fields; inconsistent values lead to fragmented dashboards and confusing drill-downs.
A practical rule: treat Resource attributes as “slow-changing identity,” not per-request data. Request-specific details belong in span attributes, log fields, or metric labels.
Mind Map: Resource Detection and Service Identity Enrichment
Stepwise Enrichment Strategy
-
Start with what the SDK already provided. If
service.nameis present from instrumentation, keep it. Overwriting it in the Collector creates hard-to-debug mismatches. -
Detect environment and deployment context. Add
deployment.environment(for exampleproduction,staging,test) and optionallydeployment.environment-adjacent fields likecloud.regionork8s.namespace.namewhen available. -
Attach host or container identity. Use stable identifiers such as
host.nameorcontainer.idonly when they help operations. If you add highly variable identifiers, you can accidentally explode cardinality in dashboards. -
Normalize service identity fields. Ensure
service.namefollows a consistent naming convention across teams and services. If you useservice.namespace, keep it aligned with your org’s boundary (for examplepayments,platform,internal). -
Map platform metadata carefully. Kubernetes metadata is useful for routing and debugging, but it should not replace service identity. For example,
k8s.pod.nameis fine for troubleshooting, whileservice.nameshould remain stable even as pods churn.
Concrete Example: Kubernetes Service Identity
Imagine a Collector running in a cluster. Your application SDK sets only service.name=checkout-api. Without enrichment, you might lack environment and namespace, so traces from checkout-api in different namespaces look like the same service.
A Collector enrichment flow typically results in Resource attributes like:
service.name:checkout-apiservice.namespace:ecommercedeployment.environment:productionk8s.namespace.name:prod-webk8s.cluster.name:cluster-ahost.name:node-12(optional)
Now a backend query can group by service.name and filter by deployment.environment without manual tagging.
Concrete Example: Environment Variables for Non-Kubernetes Hosts
On a VM-based deployment, the SDK might not know the environment. You can set environment variables for the Collector to detect and enrich Resource attributes.
For example, set:
OTEL_RESOURCE_ATTRIBUTES=deployment.environment=staging,service.namespace=internal
If the SDK already provides service.name, the Collector should merge these values, producing a Resource that keeps identity stable while adding the missing environment.
Validation Checks That Prevent Silent Damage
- Presence check: confirm
service.nameexists on exported items. - Type check: ensure attributes are strings where expected; avoid mixing types across services.
- Cardinality check: avoid adding per-request or per-instance identifiers as Resource attributes unless you truly need them.
- Override policy check: verify that explicit SDK-provided identity fields are not replaced by detector outputs.
Minimal Collector Configuration Pattern
Below is a conceptual pattern showing how enrichment is typically composed. Exact detector names vary by Collector build, but the logic stays the same: detect, then enrich, then pass through.
receivers:
  otlp:
    protocols:
      grpc:

processors:
  resource/detect:
    detectors: [env, k8s]
  resource/enrich:
    attributes:
      - key: service.namespace
        from_attribute: k8s.namespace.name
        action: upsert
      - key: deployment.environment
        from_attribute: env.DEPLOY_ENV
        action: upsert

exporters:
  otlp:
    endpoint: https://backend.example

service:
  pipelines:
    traces:
      receivers: [otlp]
      processors: [resource/detect, resource/enrich]
      exporters: [otlp]
The key idea is the merge behavior: detection fills gaps, enrichment normalizes fields, and explicit SDK identity remains the source of truth.
Practical Naming Rules for Service Identity
- Use
service.namefor the logical application component. - Use
service.namespacefor an organizational boundary. - Use
deployment.environmentfor runtime stage. - Keep
host.nameand pod/container identifiers optional and operationally motivated.
When these rules are followed, Resource detection stops being a “configuration chore” and becomes a reliable foundation for consistent metrics, logs, and traces.
10.4 Metric Transformation and Aggregation Adjustments
Metric transformation in the OpenTelemetry Collector is where “what the app emitted” becomes “what the backend can use.” Aggregation adjustments are the part that changes how values are combined over time, which means you must treat them like a contract: clear inputs, predictable outputs, and attributes that stay consistent.
Core Concepts for Safe Transformation
Start by separating three ideas:
- Value transformation changes the numeric meaning without changing the time series identity. Examples include unit conversion, scaling, and clamping.
- Attribute transformation changes labels (resource attributes or data point attributes). Examples include renaming keys, adding defaults, or dropping high-cardinality attributes.
- Aggregation adjustment changes how points are grouped and summarized. Examples include changing temporality, selecting sum vs. last value, or altering the grouping keys.
A practical rule: if you change grouping keys, you are not just transforming—you are changing the shape of the dataset.
Mind Map: Metric Transformation Pipeline
Value Transformation Patterns
Value transforms are usually the lowest risk because they keep the series identity intact. Common examples:
- Unit conversion: convert milliseconds to seconds by scaling by
0.001. If your backend expects seconds, do it early so dashboards don’t carry conversion logic. - Scaling for readability: convert bytes to mebibytes by dividing by
1024 * 1024. This makes thresholds easier to interpret. - Clamping: if a counter-like metric occasionally goes negative due to resets or instrumentation bugs, clamp at zero before aggregation. Clamp only when you can justify the semantics; otherwise you hide real issues.
When you scale, keep the metric name consistent with the unit. A metric named http.server.duration should not silently become seconds without either renaming or ensuring the unit attribute matches the new meaning.
Attribute Transformation Patterns
Attribute changes affect cardinality and query ergonomics.
- Rename keys to match semantic conventions used across services. For example, standardize
http.routevsrouteso grouping works across teams. - Add defaults when an attribute is missing. If
db.systemis absent on some spans-derived metrics, adddb.system=unknownso queries don’t fragment. - Drop or bucket high-cardinality attributes like
user.idor raw URLs. Prefer coarse attributes such ashttp.routeorhttp.targetpatterns.
A good test is to ask: “If I group by this attribute in the backend, will I get a manageable number of series?” If the answer is “probably not,” transform it.
Aggregation Adjustments Without Surprises
Aggregation adjustments are where most “it looks wrong” incidents happen.
Key decisions:
- Grouping keys: which attributes define a time series. If you drop an attribute used in grouping, you merge series and change totals.
- Temporality alignment: counters and gauges behave differently. Counters often require delta-to-rate conversion downstream; if you change temporality upstream, ensure the backend expects that.
- Aggregation method: sum, last, min, max, and percentile-like summaries have different meanings. Don’t swap them unless the metric contract says so.
A systematic approach:
- Identify the instrument type emitted by the SDK.
- Determine the backend’s expected aggregation semantics.
- Apply transformations that preserve meaning first (units, attribute normalization).
- Only then adjust aggregation behavior, and verify with a small set of known series.
Example: Regrouping and Unit Normalization
Suppose you receive a metric http.server.request.duration in milliseconds with attributes service.name, http.route, and http.status_code. You want seconds and consistent route naming.
- Rename
http.routetohttp.routeonly if upstream used a different key; otherwise keep it. - Convert ms to seconds.
- Ensure you group by
service.name,http.route, andhttp.status_codeso the backend query matches existing dashboards.
processors:
  metricstransform:
    transforms:
      - include: http.server.request.duration
        match_type: strict
        action: update
        operations:
          - action: scale
            from: 0.001
          - action: update_label
            label: http.route
            new_label: http.route
This snippet shows the idea: scale values while keeping identity stable. If you also needed to drop http.target to reduce cardinality, do it explicitly and then re-check grouping.
Validation Checklist for Aggregation Changes
Before you ship, validate with three checks:
- Series identity: confirm the set of grouping attributes is unchanged unless you intended to merge.
- Magnitude sanity: compare a few time windows pre/post. Scaling should match exactly; aggregation regrouping should match the new expected totals.
- No silent fragmentation: ensure renamed attributes don’t create both old and new keys in the backend.
If you follow this order—normalize meaning, then adjust aggregation, then validate—you avoid the classic failure mode: “the numbers are different” without knowing whether you changed units, labels, or grouping.
10.5 Log and Trace Enrichment With Consistent Correlation Fields
Consistent correlation fields are what make logs feel like they belong to the same story as traces. The goal is simple: every log record that can be tied to a request should carry the same identifiers, using the same attribute names and formats, regardless of service language, logging library, or collector pipeline.
Correlation Field Foundations
Start with two invariants:
- Trace identity is stable: a log related to a span should include the trace identifier.
- Span identity is optional but useful: when you can, include the span identifier so you can pinpoint the exact step that emitted the log.
In OpenTelemetry, the common correlation fields are:
trace_id: 32 hex charactersspan_id: 16 hex characterstrace_flags: 2 hex characters (often used to reflect sampling)service.nameandservice.instance.id: where the log came from
A practical best practice is to treat these as log schema fields, not “whatever your logger happens to output.” If your logger already emits them, map them into the canonical names during collection.
Mind Map: Correlation Strategy
Enrichment Workflow from Context to Logs
A reliable workflow has four steps.
Step 1: Ensure the Application Has the Right Context
When your code creates or receives a request, it should establish the active span in the execution context. Then, when the logger runs, it can attach trace_id and span_id automatically.
If you do manual instrumentation, keep it boring: create a span, make it current for the duration of the work, and emit logs inside that scope.
Step 2: Normalize Fields at the Collector Boundary
Different libraries may emit different names (for example, traceId vs trace_id) or different formats (uppercase vs lowercase, missing leading zeros). Normalize early in the collector so downstream storage and queries stay consistent.
A good rule: collector normalization beats per-service logging customization. It reduces drift when teams or libraries change.
Step 3: Enrich Missing Fields Deterministically
Sometimes logs arrive without span identifiers. That’s okay. You can still correlate by trace.
When only trace_id is present, keep span_id empty rather than inventing a value. When neither is present, leave both absent and rely on other fields like service.name, http.route, or event.name to narrow searches.
Step 4: Validate before export
Validation prevents “almost correct” data from polluting your indexes. At minimum, check:
trace_idlength is 32 and contains only hex charactersspan_idlength is 16 and contains only hex characters- fields are lowercase (or consistently cased)
Example: Collector Attribute Normalization
Below is a conceptual example of how you might normalize attribute names and enforce lowercase. The exact processor names vary by collector version, but the intent is consistent: map to canonical fields, then validate.
processors:
  transform/logs:
    log_statements:
      - context: log
        statements:
          - set(attributes["trace_id"], attributes["traceId"]) where attributes["trace_id"] == nil and attributes["traceId"] != nil
          - set(attributes["span_id"], attributes["spanId"]) where attributes["span_id"] == nil and attributes["spanId"] != nil
          - set(attributes["trace_id"], lower(attributes["trace_id"])) where attributes["trace_id"] != nil
          - set(attributes["span_id"], lower(attributes["span_id"])) where attributes["span_id"] != nil
If you also need validation, add a filter step that drops logs with malformed identifiers. Dropping is preferable to indexing garbage because correlation queries become misleading.
Example: Querying Logs by Trace
Once fields are consistent, correlation queries become straightforward. A typical workflow is:
- Find a trace in your tracing UI.
- Copy its
trace_id. - Query logs where
trace_idmatches.
To make this work across services, ensure every service uses the same canonical field names and that the collector normalization runs for all log pipelines.
Common Pitfalls and Fixes
- Inconsistent casing: normalize to lowercase in the collector.
- Mixed attribute names: map everything into
trace_idandspan_id. - Partial identifiers: validate lengths; don’t index truncated values.
- Over-enrichment: don’t force
span_idwhen it’s not available; trace-level correlation is still valuable.
Mind Map: Validation Rules
Consistent correlation fields turn logs into a reliable companion to traces. The collector becomes the place where naming, formatting, and validation are standardized, so application teams can focus on emitting meaningful events rather than wrestling with schema drift.
11. Exporters Integration with Backends and Data Validation
11.1 Exporter Selection Criteria for Metrics Logs and Traces
Choosing exporters is where “it works on my machine” becomes “it works in production.” The goal is simple: send each signal to the right place with the right shape, at the right cost, while keeping failures visible.
Start with Signal Specific Requirements
Metrics, logs, and traces have different query patterns and failure tolerance.
- Metrics exporters should preserve aggregation semantics and label cardinality. If you export histograms, confirm the backend understands the chosen temporality and bucket boundaries.
- Log exporters should preserve ordering expectations only where they matter. Most systems treat logs as event streams, so focus on consistent fields for filtering and correlation.
- Trace exporters should preserve trace and span relationships. If sampling is involved, ensure the backend can interpret the sampling decisions you make.
A practical rule: decide what you need to query first, then pick exporters that can represent those queries without lossy transformations.
Match Backend Capabilities to OpenTelemetry Data Model
Exporters are not just “transport.” They also map data into backend-specific expectations.
- Semantic conventions compatibility: confirm the backend accepts standard attribute keys and resource fields. If it doesn’t, you may need processor-based normalization before export.
- Data type support: verify support for metrics instrument types (counter gauge histogram summary if applicable), log severity fields, and trace span events/status.
- Context handling: ensure the backend can correlate traces with logs using trace identifiers and that your log exporter includes the trace context fields you rely on.
Evaluate Transport and Delivery Semantics
Transport affects latency, reliability, and operational burden.
- Protocol choice: gRPC is often efficient for high throughput; HTTP can be simpler to route through existing infrastructure. Pick based on your network constraints and operational tooling.
- Batching behavior: exporters typically batch to reduce overhead. Confirm batch size and flush interval defaults align with your latency needs.
- Retry and backoff: look for configurable retry behavior. Retries should not create unbounded queue growth.
Control Cardinality and Cost Before Export
Exporter choice can’t fix bad label design, but it can amplify it.
- For metrics, ensure label sets are stable and bounded. If you export per-user or per-session identifiers, you will likely pay for it twice: ingestion cost and query pain.
- For logs, avoid embedding high-cardinality fields as top-level attributes unless you truly filter on them.
Use processors to drop or transform fields before export when the backend charges per unique series or index entry.
Security and Compliance Requirements
Telemetry often crosses trust boundaries.
- Authentication: choose exporters that support the auth method your environment uses (tokens, mTLS, or other mechanisms).
- Encryption: ensure transport is encrypted end to end.
- Field redaction: if you must remove sensitive fields, do it in the pipeline before export so the backend never sees them.
Operational Observability of the Export Path
If exports fail silently, you lose the ability to debug.
- Prefer exporters that expose internal metrics about queue length, dropped items, retry counts, and export errors.
- Ensure logs and traces include enough context to diagnose failures, such as which exporter endpoint rejected data.
Mind Map: Exporter Selection Criteria
Example: Choosing Exporters for a Multi-Signal Backend
Assume you have one backend that supports all three signals, but with different ingestion endpoints.
- Traces: choose a trace exporter that preserves span events and status, and confirm it accepts standard trace identifiers.
- Metrics: choose a metrics exporter that supports histogram temporality and label sets. If your backend expects a specific temporality, align it via configuration or transformation.
- Logs: choose a log exporter that maps severity consistently and includes trace context fields so you can filter logs by request.
If the backend’s log endpoint indexes certain fields more aggressively, treat that as a design constraint: keep log attributes stable and avoid high-cardinality fields.
Example: When You Split Export Paths
Sometimes one backend is great at traces, another is better at metrics.
- Export traces to a system optimized for span search and dependency views.
- Export metrics to a system optimized for time series aggregation.
- Export logs to a system optimized for text search and structured filtering.
In this setup, use processors to ensure each pipeline produces the fields that each backend actually uses, rather than exporting everything everywhere.
Practical Checklist Before You Commit
- Can the backend represent your metrics instrument types and histogram semantics?
- Do logs include the trace correlation fields you plan to query?
- Are semantic convention attribute keys preserved or normalized?
- Are batching, retry, and queue limits configured to match your latency and reliability goals?
- Is auth and encryption configured, and are sensitive fields removed before export?
- Do you have exporter internal metrics and error visibility to detect drops early?
A good exporter choice is less about “which one is popular” and more about “which one preserves meaning end to end without turning operational issues into silent data loss.”
11.2 Configuring Exporters with Authentication and Indexing Options
Exporters are the last mile of your telemetry pipeline. They decide where data goes, how it is authenticated, and how it is shaped for storage systems. The trick is to configure these choices so they match both your security posture and your backend’s expectations, without accidentally breaking semantic conventions or flooding indexes.
Authentication Fundamentals That Don’t Surprise You
Most OTLP-capable backends accept one of these patterns:
- Bearer token for API access control. You typically set an
Authorization: Bearer <token>header. - Basic authentication for simpler deployments. You set
Authorization: Basic <base64(user:pass)>. - mTLS when you want certificate-based identity and transport-level trust.
A practical best practice is to keep credentials out of config files that are shared broadly. Use environment variables for tokens and passwords, and ensure your runtime can rotate them without code changes.
Example: setting a bearer token for an OTLP exporter
exporters:
  otlphttp:
    endpoint: https://telemetry.example.com/v1/otlp
    headers:
      Authorization: "Bearer ${TELEMETRY_TOKEN}"
If your backend requires a specific path or expects OTLP over gRPC instead of HTTP, keep the endpoint format consistent with the exporter type. A common failure mode is “it connects but nothing shows up,” caused by a mismatch between transport and endpoint.
Indexing Options That Control Cost and Queryability
Backends that store telemetry often build indexes based on fields. Indexing too much makes ingestion slower and storage more expensive; indexing too little makes queries frustrating. Your goal is to index fields that you filter on frequently and keep high-cardinality fields out of indexes when possible.
For OpenTelemetry data, the fields that most often become index candidates are:
- Resource attributes such as
service.name,service.namespace,deployment.environment, andcloud.region. - Trace and span attributes such as
http.method,http.route,db.system, andmessaging.system. - Log attributes such as
severity_textand any structured fields you add.
A systematic approach is to decide which attributes are “query dimensions” and which are “payload details.” Query dimensions should be stable and low-to-moderate cardinality. Payload details can be stored but not indexed.
How Exporter Configuration Maps to Backend Indexing
Even though indexing is usually enforced by the backend, exporter configuration influences what arrives and how it is labeled. Two practical levers matter:
- Which attributes you send: if you omit an attribute at the source, it cannot be indexed later.
- How you normalize attribute names and values: inconsistent values create cardinality explosions.
That’s why semantic conventions matter here. If service.name is consistently set and http.route is used instead of ad-hoc route strings, your indexing strategy becomes predictable.
Mind Map: Authentication and Indexing in Exporter Configuration
Example: Combining Authentication with Attribute Discipline
This example shows an OTLP HTTP exporter with bearer auth, paired with a processor that limits noisy attributes before export.
processors:
  attributes:
    actions:
      - key: http.user_agent
        action: delete
      - key: user.id
        action: delete

exporters:
  otlphttp:
    endpoint: https://telemetry.example.com/v1/otlp
    headers:
      Authorization: "Bearer ${TELEMETRY_TOKEN}"
Deleting http.user_agent and user.id is not about hiding useful information; it’s about preventing high-cardinality fields from turning into index bloat. You can still keep them in logs if your backend supports non-indexed storage for log fields, but for metrics and traces, indexing every unique value is rarely worth it.
Example: Indexing-Friendly Resource Attributes
If your backend indexes resource attributes, ensure they are present and consistent. A typical pattern is to set environment and service identity once, then reuse them across all signals.
processors:
  resource:
    attributes:
      - key: service.namespace
        value: payments
        action: upsert
      - key: deployment.environment
        value: production
        action: upsert
This keeps your queries stable: “show all production payments services” becomes a simple filter instead of a fragile pattern match.
Validation Checklist for Exporter Authentication and Indexing
- Confirm the exporter transport matches the endpoint (OTLP HTTP vs OTLP gRPC).
- Verify authentication headers are actually set at runtime.
- Ensure semantic conventions are followed for identity and protocol attributes.
- Remove or normalize high-cardinality attributes before export.
- Use a small set of known queries to confirm the fields you expect are indexed and filterable.
When these pieces line up, your backend stops being a black box and becomes a predictable destination for telemetry that is both secure and queryable.
11.3 Ensuring Semantic Convention Compliance Before Export
Semantic conventions are the shared vocabulary that makes telemetry portable. Export-time compliance checks prevent “almost right” data from turning into confusing dashboards and broken correlations later. The goal is simple: confirm that the attributes, metric names, and span or log fields you emit match the expected shapes and meanings.
Start with a Compliance Checklist That Matches Your Signal
Before you touch configuration, decide what “compliant” means for each signal type.
- Metrics: metric name, unit, instrument type, and required resource attributes.
- Traces: span kind, HTTP and RPC attributes, status and event modeling, and consistent trace identifiers.
- Logs: log record fields, severity mapping, and correlation identifiers.
A practical approach is to treat compliance as three layers: identity, operation, and outcome.
- Identity answers “what service and what component?” via resource attributes.
- Operation answers “what did it do?” via semantic attributes.
- Outcome answers “how did it go?” via status, error flags, and outcome-related fields.
Validate Resource Attributes First Because Everything Joins on Them
Most backends group by service identity. If resource attributes are inconsistent, everything downstream looks like different services.
Check that each telemetry item includes a stable set such as:
service.nameservice.namespace(if you use it)service.instance.id(if you need instance-level breakdown)deployment.environment(dev, staging, prod)
Example: if one service emits service.name="checkout" and another emits service.name="Checkout Service", your trace graphs will fragment even if spans are otherwise correct.
Enforce Operation Attribute Shapes for Each Common Interaction
Semantic conventions define attribute keys and expected value types. Enforce them at the boundary where you still have context.
For HTTP server spans, verify:
http.methodis present and is a valid verb stringhttp.routeis present when you can determine iturl.pathis present only when it is safe and useful for your privacy ruleshttp.status_codeis an integer
For messaging, verify:
messaging.systemmatches the broker typemessaging.destinationandmessaging.destination_kindare consistentmessaging.operationmatches the action (publish, consume, process)
For database spans, verify:
db.systemis set (for examplemysql,postgresql)db.operationmatches the action (query, exec)db.nameis present when it is not sensitive
Confirm Outcome Modeling So Errors Look the Same Everywhere
Outcome fields are where “it kind of failed” becomes “it failed differently.”
For traces:
- Ensure span status is set consistently for error cases.
- Ensure error events include the relevant exception attributes when you have them.
For logs:
- Ensure severity is mapped consistently so
ERRORlogs are actually queryable as errors. - Ensure correlation identifiers are present when you expect log-to-trace linking.
Use a Mind Map to Keep the Checks Non-Overlapping
Mind Map: Semantic Compliance Before Export
Add Deterministic Checks in the Collector Pipeline
Compliance is easiest when you can reproduce it. Put validation close to export, after enrichment processors have run, but before exporters send data.
A common pattern is:
- Enrich resource attributes.
- Normalize attribute keys and types.
- Validate required keys per signal.
- Either fix, drop, or annotate invalid records.
Example validator logic in pseudocode:
for each telemetry_item:
  ensure resource identity keys exist
  ensure operation keys exist for detected interaction type
  ensure outcome fields match error conditions
  if missing required keys:
    either drop item or add validation_error attribute
  if attribute types mismatch:
    normalize type or drop offending attribute
Catch Cardinality Problems That Break Compliance in Practice
Even when keys are correct, high-cardinality values can make compliance checks meaningless because you can’t query results reliably.
Examples:
- Using full URLs with query strings as
url.pathcan explode cardinality. - Emitting
http.routeinconsistently causes split aggregations.
Prefer stable route templates and controlled dimensions. If you must include variable parts, keep them in fields that you can filter safely.
Verify with Small, Targeted Queries Against Real Exported Data
Compliance checks should end with evidence. Use a short set of queries that confirm:
- Services group correctly by
service.nameand environment. - HTTP spans have consistent
http.method,http.status_code, and route fields. - Logs correlate to traces using the expected identifiers.
If a query returns fewer results than expected, treat it as a compliance signal, not a backend mystery. The fastest fix is usually to correct the attribute shape at the source or in the collector enrichment stage.
Practical Example: One Request, Three Signals
For a single incoming HTTP request, ensure:
- Trace: server span includes HTTP method, route, status, and status modeling.
- Metrics: request duration and request count use consistent metric names and dimensions tied to the same service identity.
- Logs: the log record includes severity and correlation identifiers that match the trace.
When these three agree on identity, operation, and outcome, your dashboards stop being guesswork and start being reliable.
11.4 End-to-End Validation with Sample Queries and Dashboards
Validation is easiest when you treat telemetry like a contract: instrumentation produces fields, the collector transforms them, and the backend stores them in a queryable shape. The goal of this section is to prove that contract end to end for metrics, logs, and traces—using repeatable sample traffic and a small set of queries that should always return results.
Validation Scope and Success Criteria
Start by defining what “good” means for each signal.
- Metrics: the expected time series exist, labels match semantic conventions, and aggregations behave as intended.
- Traces: spans are linked into traces with correct span kinds, status, and key attributes.
- Logs: log records include the right resource identity and correlation fields, and queries can join logs to traces.
A practical success checklist:
- A single request generates one trace with a predictable span tree.
- The same request produces at least one log enriched with trace identifiers.
- The same request increments at least one metric with consistent service and endpoint attributes.
- Queries return results within the expected ingestion delay window.
Mind Map: the Validation Flow
Sample Traffic and Deterministic Identifiers
Use a test request that includes a stable correlation value so you can find it quickly. For example, set a header like x-test-id: otel-validate-2026-03-15 and ensure your instrumentation copies it into spans and logs as an attribute.
In code, the important part is not the header itself; it’s that the same value appears in:
- a trace attribute (e.g.,
http.request.header.x_test_idor a normalized attribute), - a log attribute (e.g.,
test.id), - and optionally a metric label (use sparingly to avoid high cardinality).
Metrics Queries and Dashboard Panels
Validate metrics with two queries: one for existence and one for shape.
Existence query: confirm the time series appears for the service and endpoint.
- Filter by resource attributes such as
service.nameandservice.namespace. - Filter by semantic endpoint attributes such as
http.routeorhttp.targetandhttp.method.
Shape query: confirm the aggregation matches expectations.
- If you instrument request duration as a histogram, verify bucket counts increase after the test request.
- If you instrument a counter, verify the counter increases by exactly one (or by the number of requests you sent).
Dashboard suggestion:
- Service Metrics Overview: request count, error count, and latency (p50/p95) for one service.
- Endpoint Breakdown: a table or bar chart by
http.routeandhttp.method. - Cardinality Guardrail: a panel that shows top label keys by distinct values so you can spot accidental label explosions.
Trace Queries and Span Completeness Checks
Trace validation should confirm both structure and semantics.
Completeness check:
- Search for traces containing the test id attribute.
- Verify the trace has a root span with the expected span kind (commonly server for incoming requests).
- Verify child spans exist for outgoing calls and internal work.
Semantic check:
- For HTTP server spans, confirm attributes like
http.method,http.route,http.status_code, andurl.schemeare present. - For errors, confirm span status is set consistently with your instrumentation rules.
Dashboard suggestion:
- Trace Waterfall Drill-Down: show the trace tree for the latest test id.
- Span Attribute Coverage: a panel that counts spans missing key attributes (for example, missing
http.routeon server spans).
Log Queries and Correlation to Traces
Logs are validated by correlation, not just by presence.
Correlation query:
- Filter logs by
service.nameand the test id. - Ensure each matching log includes trace identifiers (commonly
trace_idandspan_idor equivalent fields). - Confirm that clicking from a log to its trace lands on the expected span.
Message and field structure check:
- Verify that the log message template is consistent enough to group similar events.
- Verify that structured fields used for filtering (like
event.name,severity, orerror.type) are mapped to stable backend fields.
Dashboard suggestion:
- Correlated Log Stream: logs filtered to the current test id with columns for severity, event name, and trace id.
- Error Log Panel: count of error-level logs by endpoint route.
A Minimal Query Set That Proves the Contract
Use a small set of queries that you can run after any instrumentation or collector change.
- Metrics: time series exists for
service.name+http.route+http.method. - Metrics: request duration histogram or latency summary shows increased values after the test request.
- Traces: trace found by test id with expected span kinds and HTTP attributes.
- Logs: log found by test id with trace id present.
- Cross-check: log trace id matches one of the spans in the trace.
Example Dashboard Layout
A practical layout keeps the operator from hunting.
- Top row: service identity, last ingestion time, and a “test id present” indicator.
- Middle row: metrics panels for request count and latency.
- Right side: trace waterfall for the latest test id.
- Bottom row: correlated logs table filtered to the same test id.
When these panels all update together after a single test request, you’ve validated the full path from semantic attributes to stored fields to queryable results.
11.5 Troubleshooting Missing Data and Attribute Mismatches
Missing telemetry usually comes from one of three places: the signal never got created, it got created but got dropped or rejected, or it arrived but doesn’t match the shape your backend expects. The fastest way to avoid guessing is to trace one request end-to-end and compare what you think should be present with what you actually receive.
Start with a Single Request Trace
Pick a single user request and follow it through instrumentation, propagation, collector processing, and export. Record these checkpoints:
- Trace identifiers: trace_id and span_id should remain consistent across services.
- Resource identity: service.name, service.namespace, and service.instance.id should be stable for the same logical service.
- Signal-specific fields: HTTP attributes for request spans, metric labels for the same operation, and log correlation fields.
If you can’t correlate, you can’t debug. When correlation fails, fix propagation first, then return to attribute mismatches.
Mind Map: Root Cause Categories
Missing Data and Attribute Mismatches Mind Map
Confirm the Signal Is Being Created
For traces, verify that spans exist before they leave the process. Common culprits:
- Sampling: if you expect every request but sampling is probabilistic, you’ll see gaps. Check the configured sampler and confirm it matches your expectation.
- Instrumentation coverage: automatic instrumentation may not cover your framework path. If you use manual spans, ensure they are started and ended in the correct scope.
For metrics, missing data often looks like “everything is there but nothing moves.” Check:
- Instrument type: counters only increase; gauges can be steady; histograms require bucket configuration.
- Aggregation temporality: if your backend expects cumulative but you export delta, you’ll see confusing values.
For logs, ensure the logger integration is actually emitting records and that the log pipeline is enabled in the collector.
Validate Context Propagation Before Attributes
Attribute mismatches frequently appear after propagation issues, because correlation fields are derived from context.
- HTTP: confirm incoming requests carry trace context headers and outgoing requests forward them.
- Messaging: confirm the producer injects trace context into message headers and the consumer extracts it.
A practical check: if trace_id changes between services for the same user request, treat attribute mismatches as secondary symptoms.
Inspect Collector Pipeline Routing
Collector misrouting is a classic “it worked yesterday” problem. Verify:
- The receiver is enabled for the signal you’re debugging.
- The pipeline that includes your processors also includes the exporter.
- You didn’t accidentally send traces to a metrics pipeline or vice versa.
When processors are involved, look for filters that drop items based on attribute presence. For example, a filter that keeps only spans with http.route will remove spans where the route attribute is missing due to framework differences.
Compare Resource Attributes with Backend Expectations
Resource attributes define the “who” of telemetry. If service identity differs, your backend may store data under different entities.
- Ensure service.name is consistent across deployments.
- Avoid changing service.instance.id too frequently; it can fragment time series.
- Confirm service.namespace usage is consistent if you use it.
A mismatch example: one service exports service.name as “checkout-api” while another exports “checkout api” (space vs hyphen). You’ll get two separate entities and think data is missing.
Check Attribute Naming and Type Consistency
Semantic conventions help, but mismatches still happen when:
- Attributes are renamed during normalization.
- Custom attributes use different keys than expected.
- Types differ, such as treating a numeric field as a string.
Example: you expect http.status_code as an integer, but a custom mapping sets it as a string. Some backends will accept the record but won’t index the field the way your queries assume.
Use Targeted Debugging Outputs
Turn on collector-side diagnostics for the specific pipeline and signal. The goal is to see the exact payload after processors, not just what the application emitted. Compare:
- Before processors: do the attributes exist?
- After processors: did any processor rename, delete, or filter them?
- Before export: do the resource and span/log fields still match your expectations?
Minimal Checklist for Fast Resolution
- Pick one request and confirm trace_id continuity.
- Confirm the signal is created locally and not sampled away.
- Confirm propagation headers or message headers are injected and extracted.
- Confirm the collector pipeline routes the signal to the right exporter.
- Confirm processors are not filtering out missing attributes.
- Confirm resource identity is stable and consistent.
- Confirm attribute keys and types match what your backend queries.
Example: Missing HTTP Route Attribute
Symptom: spans arrive, but dashboards show “unknown route.”
- Likely cause: http.route is not set by your instrumentation path.
- Collector check: a processor might be dropping spans without http.route.
- Fix: ensure the instrumentation captures route templates, or adjust the processor filter to keep spans even when http.route is absent.
Example: Logs Uncorrelated with Traces
Symptom: logs show up, but trace_id is empty.
- Likely cause: log enrichment isn’t reading the active context.
- Propagation check: confirm the incoming request extracted trace context.
- Collector check: confirm the log processor that maps trace context fields is enabled in the logs pipeline.
When you follow the checklist in order, you avoid the common trap of “fixing attributes” while the real issue is that the context never made it into the process in the first place.
12. End-to-End Reference Implementation and Operational Playbooks
12.1 Reference Architecture for a Vendor Neutral Observability Stack
A vendor-neutral observability stack is easiest to reason about when you treat it as three layers: instrumentation, transport, and processing/storage. Each layer has clear responsibilities, so you can swap backends without rewriting application code.
Layer 1: Instrumentation and Signal Shaping
Your application emits telemetry using OpenTelemetry SDKs. The goal is not to “make dashboards,” but to produce consistent signal structure:
- Resource identity: service.name, service.version, deployment.environment, and host metadata when appropriate.
- Metric semantics: instrument names and attribute keys that match semantic conventions so aggregations stay consistent.
- Trace structure: span kinds, status, and attributes that let you reconstruct request flows.
- Log correlation: trace_id and span_id fields (or equivalent mapping) so logs line up with traces.
A practical rule: decide what you want to ask later, then ensure the emitted attributes can answer it. For example, if you will need to filter by HTTP route and method, capture http.route and http.method as attributes on spans and as fields on logs.
Layer 2: Transport with OTLP
OTLP is the wire format that keeps the stack vendor-neutral. The application exports to a collector endpoint using OTLP over gRPC or HTTP.
Operationally, you want predictable behavior under load:
- Use batching in the SDK or rely on collector batching, but avoid double batching.
- Configure timeouts and retry policies so transient network issues don’t create gaps.
- Ensure authentication and TLS are handled at the transport boundary, not scattered through application code.
Layer 3: Collector Pipelines Processing and Routing
The collector is where you normalize, filter, and route. Think of it as a set of pipelines, one per signal type, with shared processors where it makes sense.
A systematic pipeline design:
- Receivers accept OTLP from applications.
- Processors enrich and standardize attributes, drop noisy fields, and enforce consistent resource metadata.
- Exporters send to one or more backends.
This is also where you handle multi-destination delivery. For example, you might export traces to a trace backend and metrics to a metrics backend, while logs go to a log store. The collector keeps the application unaware of those choices.
Mind Map: Reference Architecture
Example: Minimal Collector Pipeline Shape
This example shows the structure, not every production knob.
receivers:
  otlp:
    protocols:
      grpc:
      http:

processors:
  batch: {}

exporters:
  otlphttp:
    endpoint: https://backend.example/otlp
    tls:
      insecure: false

service:
  pipelines:
    traces:
      receivers: [otlp]
      processors: [batch]
      exporters: [otlphttp]
    metrics:
      receivers: [otlp]
      processors: [batch]
      exporters: [otlphttp]
    logs:
      receivers: [otlp]
      processors: [batch]
      exporters: [otlphttp]
Example: Attribute Normalization for Consistent Queries
Suppose different teams emit http.route differently, sometimes as /users/{id} and sometimes as /users/* . A processor can normalize to a single convention so queries don’t become a scavenger hunt.
A good normalization target is the semantic convention attribute key itself, not a custom field. Keep the transformation deterministic: map known patterns to one canonical form, and drop or tag unexpected values so you can spot instrumentation drift.
Integrated Data Quality Checks
A vendor-neutral stack still needs quality gates. In practice, you validate at three points:
- Before export: ensure required semantic attributes exist for the signal type you care about.
- At the collector boundary: verify resource identity consistency across services and environments.
- At query time: confirm that trace-to-log correlation works by checking trace_id alignment for a known request.
If you implement these checks, the architecture stays stable even when backends change, because the contract is defined by OpenTelemetry semantic conventions and OTLP transport behavior, not by any single storage system.
12.2 Step-by-Step Setup from Instrumentation to Collector to Backend
This walkthrough builds a working path for metrics, logs, and traces using OpenTelemetry instrumentation, an OTLP-capable collector, and a backend that accepts OTLP. The goal is simple: every request should produce correlated telemetry, and every attribute should be consistent enough to query without guesswork.
Step 1: Choose a Minimal Service Identity
Start by deciding what identifies your service across all signals. Use resource attributes so the collector and backend can group data reliably.
Practical example
service.name:checkout-apiservice.namespace:shopservice.version:1.7.3deployment.environment:prod
Keep these values stable. If you change them frequently, dashboards become a scavenger hunt.
Step 2: Instrument Traces with Semantic Attributes
Instrument the request lifecycle so spans carry the right span kind, HTTP attributes, and status.
Practical example
- Create a server span for incoming HTTP requests.
- Add attributes like
http.method,http.route,http.status_code. - Record errors by setting span status and adding an event with the exception message.
Step 3: Instrument Metrics with Consistent Dimensions
Create metrics that answer operational questions: latency, request rate, and error rate. Use consistent label keys so aggregations behave predictably.
Practical example
- Histogram:
http.server.durationwith labelshttp.methodandhttp.route - Counter:
http.server.request.countwith labelshttp.method,http.status_code
If you use route templates (like /v1/orders/{id}) instead of raw paths, you avoid exploding cardinality.
Step 4: Emit Logs with Trace Correlation Fields
Logs should be queryable on their own, but also linkable to traces. Ensure each log record includes the trace and span identifiers when available.
Practical example
- When handling a request, include
trace_idandspan_idin log fields. - Add
log.severityand a structured message likeevent=payment_authorized.
Step 5: Configure OTLP Export from the Application
Export all three signals to the collector using OTLP. Keep transport and endpoint consistent across signals to reduce debugging time.
Practical example
- OTLP endpoint:
http://collector:4318(HTTP) orhttp://collector:4317(gRPC) - Use the same
service.nameresource attributes for every signal.
Step 6: Deploy the Collector with Separate Signal Pipelines
The collector is where you normalize, batch, and route. Use distinct pipelines so one signal’s processing doesn’t accidentally affect another.
Mind Map: End-to-End Setup Flow
Step 7: Add Processors for Quality, Not Just Transport
Processors should improve data quality: normalize attribute names, drop noisy fields, and ensure resource attributes exist.
Practical example
- Normalize
http.routeto a template form. - Drop high-cardinality labels like
user.idfrom metrics. - Enrich missing
deployment.environmentusing environment variables.
Step 8: Validate with a Small, Deterministic Test
Before you trust dashboards, run a controlled request and verify correlation.
Practical example
1. Call GET /v1/orders/123 once.
2. Confirm one trace exists with a server span.
3. Confirm the span has http.route and http.status_code.
4. Confirm metrics show one increment for the matching labels.
5. Confirm logs include the same trace_id.
Step 9: Use a Collector Configuration That Is Easy to Reason About
Keep the configuration readable: one receiver, clear processors, and explicit exporters per signal.
Example: Collector Pipeline Skeleton
receivers:
  otlp:
    protocols:
      http:
        endpoint: 0.0.0.0:4318
      grpc:
        endpoint: 0.0.0.0:4317
processors:
  batch: {}
  resource: { attributes: [] }
exporters:
  otlphttp:
    endpoint: http://backend:8080
service:
  pipelines:
    traces:
      receivers: [otlp]
      processors: [batch, resource]
      exporters: [otlphttp]
    metrics:
      receivers: [otlp]
      processors: [batch, resource]
      exporters: [otlphttp]
    logs:
      receivers: [otlp]
      processors: [batch, resource]
      exporters: [otlphttp]
Step 10: Confirm Backend Ingestion and Queryability
Finally, verify that the backend indexes the fields you rely on. A common failure is that the backend stores data but doesn’t index the exact attribute keys you query.
Practical example
- Query by
service.name=checkout-api. - Filter traces by
http.status_code=500. - Join logs to traces using
trace_id. - Check that metric labels match the expected keys.
When these checks pass, you have a pipeline that is not just “sending data,” but producing consistent, correlated telemetry you can actually use.
12.3 Operational Runbooks for Collector Health and Telemetry Quality
A collector is a traffic controller, not a magic box. The runbooks below treat “health” as measurable behavior: inputs arrive, processing succeeds, outputs are delivered, and data quality matches the semantic expectations.
Mind Map: Collector Health and Telemetry Quality
Step 1: Establish What “Healthy” Means
Start with a checklist that maps to symptoms you can observe. For liveness, verify the collector process is running and its OTLP receiver endpoints respond. For readiness, confirm each pipeline can accept data and that exporters can establish connections. For throughput, compare incoming sample counts to exported counts over the same interval; a persistent gap usually means buffering, drops, or exporter failures.
A practical habit: record a baseline during normal operation. For example, note typical export latency and typical batch flush frequency. When something changes, you’ll know whether you’re seeing a one-off hiccup or a sustained degradation.
Step 2: Use Collector Self-Metrics as the Primary Signal
Collector self-metrics should drive the first triage decision. Focus on four categories.
-
Receiver health: metrics that indicate accepted requests and decode errors. If decode errors rise, check payload format and transport settings before touching pipelines.
-
Processor and pipeline health: metrics that show processing errors, dropped items, or time spent in processors. If time grows, look for expensive transformations or overly broad attribute enrichment.
-
Exporter health: metrics for send failures, retry counts, and queue lengths. If retries climb while queue length grows, you likely have a downstream connectivity or authentication issue.
-
Resource usage: CPU, memory, and goroutine counts. If memory grows steadily, suspect unbounded buffering or large payloads.
Step 3: Triage by Symptom, Not by Guess
When telemetry quality is wrong, you need to decide whether the problem is structural (missing fields), semantic (wrong attribute names), or correlation (IDs don’t line up).
-
Symptom: Missing traces or partial spans
- Check exporter errors first. If exports fail, you’ll see gaps.
- Then validate context propagation: confirm trace IDs are present on incoming requests and that spans are linked correctly.
-
Symptom: Metrics exist but dashboards look empty
- Validate semantic conventions for metric names and label keys. A common failure is inconsistent label naming across services, which makes queries miss.
- Check whether metric transformations are dropping dimensions.
-
Symptom: Logs arrive but can’t be correlated
- Verify log enrichment includes trace identifiers consistently.
- Confirm that the collector is not overwriting existing correlation fields with defaults.
Step 4: Validate Data Quality with Deterministic Checks
Runbooks should include repeatable checks that don’t depend on a human eyeballing a dashboard.
Example: Attribute completeness check
- For each service, ensure resource attributes include
service.nameandservice.namespacewhen your conventions require it. - For each HTTP span, ensure
http.method,http.route, andhttp.status_codeare present when the instrumentation supports them.
Example: Correlation integrity check
- Pick one known request path.
- Confirm that the trace ID appears in the trace spans and in the related log records.
- If logs show a different trace ID, inspect propagation headers and any processor that modifies attributes.
Step 5: Operational Actions That Keep Pipelines Stable
When issues appear, the goal is to reduce blast radius.
- If queues grow: reduce batch sizes or temporarily lower exporter concurrency so the system sheds load predictably rather than timing out.
- If retries spike: verify exporter endpoint reachability and credentials, then confirm TLS settings match expectations.
- If processor errors rise: narrow the failing processor scope by checking which transformation step emits invalid attributes.
Step 6: Record Incidents with a Consistent Template
Use a short incident record so future you can answer “what changed?” quickly.
- Date: 2026-03-25
- Affected pipelines: metrics, logs, traces
- First observed symptom: e.g., export failures, missing correlation
- Evidence: self-metrics snapshots and relevant error logs
- Immediate mitigation: e.g., restart collector, adjust exporter config, disable a processor
- Root cause: e.g., authentication mismatch, attribute normalization bug
- Verification: confirm exports resume and quality checks pass
Step 7: Keep Runbooks Honest with a Weekly Drill
A drill is not a performance review. It’s a way to ensure the runbook matches reality.
Example drill
- Intentionally block the exporter endpoint for 10 minutes in a controlled environment.
- Confirm that retries behave as expected and that queues do not grow without bound.
- After restoring connectivity, verify that exported counts recover and that correlation checks still pass.
This approach turns “we think it’s fine” into “we know what happens when it isn’t.”
12.4 Security Controls for Telemetry Transport and Access
Telemetry security has two jobs: keep data confidential in transit and ensure only the right systems can send or receive it. With OpenTelemetry and OTLP, you typically control security at three layers: transport (how bytes move), identity (who is allowed), and authorization (what they are allowed to do). The collector is the natural enforcement point because it centralizes ingestion, normalization, and export.
Threat Model for Telemetry Pipelines
Start by mapping where telemetry can be attacked. Common risks include interception of OTLP traffic, impersonation of a client that sends fake spans or metrics, and unauthorized access to the collector’s endpoints. Also consider integrity issues: a misconfigured endpoint might accept plaintext or accept requests without verifying the sender.
A practical way to reason about this is to list assets and entry points.
- Assets: OTLP endpoints, collector pipelines, exported data stores, and any secrets used for authentication.
- Entry points: OTLP receiver ports, health endpoints, metrics endpoints for the collector itself, and any admin interfaces.
- Trust boundaries: application hosts to collector, collector to backend, and collector to any intermediate network components.
Transport Security for OTLP
Use TLS for OTLP whenever the network is not fully trusted. TLS provides confidentiality and server authentication, which prevents casual snooping and reduces the chance of sending telemetry to the wrong place.
Key operational choices:
- Prefer gRPC over HTTP when your environment already standardizes on gRPC security patterns, because it tends to be consistent with existing service-to-service setups.
- Enforce TLS versions and cipher policies at the load balancer or directly in the collector’s listener configuration.
- Validate certificates with a proper trust chain. Self-signed certificates are fine for internal labs, but production should use a managed trust chain so you don’t end up “trusting everything” out of convenience.
Example: If your collector is behind a reverse proxy, terminate TLS at the proxy and re-encrypt to the collector if the network segment is not strictly controlled. If you terminate only once, ensure the internal hop is still protected by network policy.
Authentication for Telemetry Senders
Authentication answers “who is sending telemetry?” Common approaches include mTLS and token-based schemes.
- mTLS: Each application instance presents a client certificate. The collector verifies it and maps it to an identity. This is strong because it ties identity to cryptographic material.
- Token-based: The application sends an API key or bearer token. The collector validates it and associates it with an identity.
Best practice: bind identities to service ownership. For example, map certificate subjects or token claims to a specific service name and environment, then reject mismatches. This prevents a client from claiming it is “payments-api” when it is actually “batch-worker.”
Authorization for Collector Endpoints
Authentication alone does not say what the sender can do. Authorization should restrict:
- Which OTLP endpoints a sender can call.
- Which pipelines or resource scopes it can write to.
- Which attributes it is allowed to set if you enforce attribute allowlists.
A simple policy model is “identity → allowed resource attributes.” For instance, an identity for service A can only emit resource attributes with service.name = “service-a” and environment = “prod”. Even if the sender includes extra attributes, the collector can drop or normalize them.
Protecting Collector Operational Interfaces
Collectors often expose additional endpoints such as health checks and internal metrics. Treat these as separate surfaces.
- Restrict access to health endpoints to the monitoring network.
- Restrict collector metrics endpoints to trusted scrapers.
- Avoid exposing admin endpoints publicly.
If you run the collector in Kubernetes, use network policies so only the application namespace can reach the OTLP receiver, and only the monitoring namespace can reach the collector’s metrics.
Mind Map: Security Controls
Example: Identity Bound Ingestion Policy
Assume you use mTLS. You can enforce that only clients with a certificate subject mapped to a service can write telemetry for that service.
Example policy logic:
- Identity: client certificate maps to service-a-prod.
- Allowed resource attributes: service.name = service-a, deployment.environment = prod.
- Collector behavior: if the request includes different values, drop the request or rewrite attributes to the allowed values.
This turns “security” into something testable: you can send a request with the wrong service.name and confirm it is rejected or corrected.
Example: Token-Based OTLP Ingestion
With bearer tokens, you typically validate the token at the collector edge (often via a proxy) and forward only authenticated traffic.
Example behavior:
- Collector receives OTLP only from the proxy network.
- Proxy validates the token and injects identity metadata.
- Collector uses that identity to authorize which pipelines accept the data.
This avoids spreading token validation logic across every collector instance.
Practical Checklist for Implementation
- Require TLS on OTLP receivers.
- Choose mTLS or tokens and document how identities map to services.
- Enforce authorization at the collector boundary, not after data is already accepted.
- Restrict health and metrics endpoints with network policy.
- Store secrets in a dedicated secret mechanism and ensure they are not logged.
- Test with negative cases: wrong identity, wrong service scope, and plaintext attempts.
Security controls are easiest to maintain when they are measurable. If you can write a test that proves a bad sender cannot submit telemetry for the wrong service, you’ve turned policy into a system property rather than a hope.
12.5 Performance Considerations for High Throughput Telemetry Workloads
High throughput telemetry is mostly a math problem with a few engineering traps. The goal is to keep end-to-end latency predictable while controlling CPU, memory, network, and backend ingestion costs. The best starting point is to measure where time and bytes go: instrumentation overhead, collector processing time, export payload size, and backend write amplification.
Establish a Throughput Budget and Measurement Plan
Define budgets per signal and per stage. For example, decide an upper bound for collector CPU per core and an upper bound for exported payload size per second. Then instrument the collector itself: track receiver throughput, processor durations, queue sizes, and exporter send errors. On the application side, measure span creation cost and metric aggregation overhead under realistic traffic.
A practical rule: if you can’t explain why the collector is busy, you can’t fix it. Start by correlating spikes in CPU or memory with changes in incoming volume, attribute cardinality, or exporter backpressure.
Control Cardinality at the Source and in the Collector
Cardinality is the silent performance killer. High-cardinality attributes (like user IDs, full URLs with query strings, or session tokens) explode the number of unique time series and increase trace storage and indexing work.
In metrics, prefer stable dimensions such as route templates, HTTP method, and status code. In traces, keep span attributes focused on what you filter by during debugging. If you need the raw value, store it in logs with sampling or in a limited set of spans.
Example: instead of http.target containing /search?q=..., record http.route as /search and keep the query in logs only when it matters.
Tune Batching and Queues for Predictable Latency
Batching reduces overhead per request, but large batches can increase latency and memory usage. In the collector, batching typically happens in processors or exporter settings. Choose batch sizes that balance serialization cost against network efficiency.
Queues protect the pipeline when an exporter slows down. If the queue is too small, you drop data early; if it’s too large, you risk memory pressure and long delays. A good workflow is to set queue capacity, then observe how often it fills during normal load and during controlled exporter throttling.
Reduce Unnecessary Work in Processors
Processors can be expensive when they repeatedly scan and transform large payloads. Normalize only what you need for consistent querying. Avoid doing the same attribute mapping in multiple places.
A common pattern is: filter first, then enrich, then transform. Filtering early reduces the number of items that later processors must touch. Enrichment should be deterministic and cheap; if it requires lookups, cache results.
Keep OTLP Payloads Lean
OTLP payload size affects network time and backend ingestion. Minimize repeated attributes by using consistent resource attributes and instrumentation scope fields. Avoid attaching large bodies or verbose exception strings to every span.
For logs, keep message templates structured and store large details only when the log level indicates it will be queried. For traces, record events sparingly and prefer span status and a small set of attributes for outcome.
Use Sampling with Intent and Verify Its Effect
Sampling reduces volume, but it can also remove the very traces you need. Use sampling rules aligned with operational questions: for example, sample all errors at a higher rate than successful requests.
Verification matters. After enabling sampling, confirm that error traces remain well represented and that latency distributions still look reasonable. Also confirm that trace-to-log correlation still works for sampled traces.
Example Collector Pipeline Configuration
Below is a compact example showing ordering: filter early, batch before export, and keep queue settings explicit.
receivers:
  otlp:
    protocols:
      grpc:
        endpoint: 0.0.0.0:4317

processors:
  filter/low_value:
    traces:
      span_attributes:
        - key: "http.route"
          values: ["/health"]
  batch:
    timeout: 1s
    send_batch_size: 1024
  memory_limiter:
    limit_mib: 512
    spike_limit_mib: 64

exporters:
  otlphttp:
    endpoint: https://backend.example/v1/otlp

service:
  pipelines:
    traces:
      receivers: [otlp]
      processors: [filter/low_value, memory_limiter, batch]
      exporters: [otlphttp]
Mind Map: Performance Levers for High Throughput Telemetry
A Simple Stress Test That Produces Actionable Results
Run a controlled load test that varies one factor at a time: request rate, attribute cardinality, and exporter latency. First, hold cardinality constant and increase request rate until you see queue growth or exporter errors. Next, keep request rate fixed and increase cardinality by adding a synthetic high-cardinality attribute; watch metric series counts and collector CPU. Finally, introduce exporter delay and confirm that queues absorb it without unbounded memory growth.
The outcome should be a set of concrete settings: batch size, queue capacity, memory limits, and sampling rules. If the only result is “it got slower,” the test didn’t isolate the cause.