Performance Marketing Strategy Attribution Modeling and Revenue Scaling
1. Introduction to Performance Marketing and Attribution Modeling
1.1 Understanding Performance Marketing: Definition and Scope
Performance marketing is a results-driven digital marketing approach where advertisers pay only when specific actions are completed, such as clicks, leads, or sales. Unlike traditional marketing that focuses on brand awareness or impressions, performance marketing emphasizes measurable outcomes and ROI.
Definition:
Performance marketing is a strategic framework that aligns marketing spend directly with business results by tracking and optimizing campaigns based on real-time data and specific performance metrics.
Scope:
- Channels: Includes paid search, social media advertising, affiliate marketing, influencer partnerships, email marketing, and programmatic advertising.
- Metrics: Click-through rates (CTR), cost per acquisition (CPA), return on ad spend (ROAS), conversion rates, customer lifetime value (CLV).
- Goals: Lead generation, sales, app installs, subscriptions, or any other quantifiable user action.
Mind Map: Core Components of Performance Marketing
Mind Map: Performance Marketing vs Traditional Marketing
Example 1: E-Commerce Brand Using Performance Marketing
An online fashion retailer runs Facebook and Google Ads campaigns targeting specific demographics. They track purchases directly attributed to these ads and only pay for clicks or conversions. By analyzing CPA and ROAS, they optimize their ad spend towards the highest-performing segments, increasing revenue while controlling costs.
Example 2: SaaS Company Driving Trial Signups
A SaaS company uses LinkedIn Ads and content syndication to drive free trial signups. They measure success by the number of qualified leads generated and the cost per lead. Using performance marketing principles, they adjust targeting and messaging based on conversion data to maximize trial signups and eventual paid subscriptions.
Why Performance Marketing Matters for Senior Marketers and Growth Managers
- Enables precise budget allocation based on real-time data.
- Facilitates continuous campaign optimization.
- Provides clear visibility into channel effectiveness.
- Supports scalable revenue growth through data-backed decisions.
By understanding the definition and scope of performance marketing, senior marketers and growth managers can better design strategies that are accountable, measurable, and aligned with business objectives.
1.2 The Role of Attribution Modeling in Performance Marketing
Attribution modeling plays a pivotal role in performance marketing by providing a structured way to assign credit to various marketing touchpoints that contribute to a conversion or sale. Without attribution modeling, marketers would struggle to understand which channels, campaigns, or interactions are truly driving revenue, leading to inefficient budget allocation and missed growth opportunities.
What is Attribution Modeling?
Attribution modeling is the process of identifying and assigning value to each touchpoint in a customer’s journey that leads to a desired outcome, such as a purchase, signup, or lead.
Why Attribution Modeling Matters in Performance Marketing
- Optimizes Budget Allocation: Helps marketers invest in channels and campaigns that deliver the highest ROI.
- Improves Campaign Performance: By understanding which touchpoints influence conversions, marketers can refine messaging and targeting.
- Enhances Customer Journey Understanding: Reveals how customers interact with multiple channels before converting.
- Supports Data-Driven Decision Making: Moves marketing from guesswork to evidence-based strategies.
Mind Map: Role of Attribution Modeling in Performance Marketing
Example 1: E-commerce Brand Optimizing Ad Spend
An e-commerce company was running ads across social media, search engines, and email campaigns. Initially, they used last-touch attribution, which credited only the final click before purchase. This led them to heavily invest in paid search ads.
However, after implementing a multi-touch attribution model, they discovered that social media ads played a crucial role in awareness and engagement early in the funnel, while email nurtured leads before the final purchase.
Result: By reallocating budget to support social media and email campaigns alongside search ads, the company increased overall conversion rates by 25% and reduced cost per acquisition by 15%.
Example 2: SaaS Company Aligning Attribution with Trial Signups
A SaaS company wanted to understand which marketing efforts were driving free trial signups. Using a first-touch attribution model, they focused on content marketing and SEO to attract initial visitors.
However, they realized that many users engaged with retargeting ads and webinars before signing up. By shifting to a data-driven multi-touch attribution model, they could better capture the influence of these mid-funnel activities.
Result: The company optimized their marketing mix, increasing trial signups by 30% and improving the quality of leads passed to sales.
How Attribution Modeling Supports Revenue Scaling
Attribution modeling enables marketers to identify high-impact channels and touchpoints, allowing for smarter scaling of campaigns. By understanding the true drivers of revenue, businesses can:
- Prioritize channels with proven ROI
- Reduce spend on underperforming tactics
- Personalize messaging based on customer journey insights
- Forecast revenue more accurately
Summary
Attribution modeling is a cornerstone of performance marketing, providing clarity on how different marketing efforts contribute to conversions and revenue. By leveraging attribution insights, senior marketers and growth managers can make informed decisions that drive sustainable revenue growth.
1.3 Common Attribution Models: Overview and Use Cases
Attribution modeling is the process of assigning credit to various marketing touchpoints that contribute to a conversion or sale. Understanding the common attribution models helps senior marketers and growth managers allocate budgets effectively and optimize campaigns for maximum revenue impact.
Overview of Common Attribution Models
Here is a mind map summarizing the key attribution models and their characteristics:
Detailed Explanation and Examples
1. First-Touch Attribution
- Definition: All credit goes to the first marketing touchpoint that introduced the customer to your brand.
- Example: A prospect clicks a Facebook ad for the first time and later converts via email. The Facebook ad gets 100% credit.
- Use Case: Useful when measuring the effectiveness of awareness campaigns.
2. Last-Touch Attribution
- Definition: All credit is assigned to the last touchpoint before conversion.
- Example: A user discovers a product via organic search but converts after clicking a retargeting ad. The retargeting ad gets full credit.
- Use Case: Common in direct response marketing where the final action is critical.
3. Linear Attribution
- Definition: Credit is evenly distributed across all touchpoints in the customer journey.
- Example: A customer interacts with an email, a paid search ad, and a webinar before purchasing. Each touchpoint receives equal credit.
- Use Case: When every interaction is considered equally important.
4. Time Decay Attribution
- Definition: Touchpoints closer to conversion get more credit; earlier ones get less.
- Example: A user clicks a display ad 10 days before purchase and a paid search ad 1 day before. The paid search ad gets more credit.
- Use Case: When recent interactions are more influential in driving conversions.
5. Position-Based (U-Shaped) Attribution
- Definition: Assigns 40% credit each to the first and last touchpoints, with the remaining 20% spread across middle interactions.
- Example: A lead is generated from a webinar (first touch), nurtured via email (middle touches), and closes after a sales call (last touch). The webinar and sales call get the majority credit.
- Use Case: When both lead generation and closing activities are critical.
6. Data-Driven (Algorithmic) Attribution
- Definition: Uses machine learning algorithms to analyze historical data and assign credit based on actual contribution.
- Example: A SaaS company uses Google Attribution 360 to analyze multi-channel touchpoints and discovers that social ads assist more conversions than previously thought.
- Use Case: Best for organizations with enough data and resources to implement advanced models.
Mind Map: Use Cases by Attribution Model
Practical Example: E-Commerce Brand
An e-commerce company runs campaigns across Facebook Ads, Google Search, Email Marketing, and Affiliate Channels. They want to understand which channels contribute most to sales.
- Using First-Touch, Facebook Ads get all credit for introducing new customers.
- Using Last-Touch, Email Marketing gets credit for closing sales.
- Using Linear, all channels share credit equally.
- Using Time Decay, Email and Affiliate channels closer to purchase get more credit.
- Using Position-Based, Facebook Ads and Email Marketing get the majority of credit.
- Using Data-Driven, the company discovers Affiliate channels assist more conversions than previously attributed.
This insight helps the company optimize budget allocation and improve campaign messaging.
Summary
Choosing the right attribution model depends on your business goals, sales cycle complexity, and data availability. Senior marketers and growth managers should consider testing multiple models to find the best fit and continuously refine attribution strategies to scale revenue effectively.
1.4 Why Accurate Attribution Matters for Revenue Growth
Accurate attribution is the cornerstone of effective performance marketing and revenue growth. It enables marketers and growth managers to understand which marketing efforts are truly driving conversions and revenue, allowing for smarter budget allocation, optimized campaigns, and ultimately, higher returns on investment (ROI).
The Importance of Accurate Attribution
- Informed Decision-Making: Without accurate attribution, decisions are based on assumptions or incomplete data, which can lead to misallocated budgets and missed opportunities.
- Optimized Marketing Spend: Knowing which channels and touchpoints contribute most to revenue helps focus spend on high-impact areas.
- Improved Customer Journey Understanding: Attribution sheds light on how customers interact with multiple touchpoints before converting, enabling better personalization and targeting.
- Alignment Across Teams: Accurate attribution fosters alignment between marketing, sales, and revenue operations by providing a shared understanding of what drives revenue.
Mind Map: Why Accurate Attribution Matters for Revenue Growth
Example: SaaS Company Improving Revenue with Accurate Attribution
A SaaS company initially used last-touch attribution, crediting only the final click before signup. This led them to heavily invest in paid search ads. However, after implementing a multi-touch attribution model, they discovered that content marketing and email nurturing played significant roles earlier in the funnel.
By reallocating budget to these channels, the company improved lead quality and increased overall revenue by 25% within 6 months.
Mind Map: SaaS Company Attribution Insights
Example: E-commerce Brand Avoiding Wasted Spend
An e-commerce brand was spending heavily on social media ads because last-touch attribution showed high conversion rates there. However, after implementing data-driven attribution, they found that paid search and email campaigns were the true drivers of purchase decisions.
They reduced social media ad spend by 30% and increased investment in paid search and email, resulting in a 15% lift in revenue and a 20% improvement in ROAS.
Mind Map: E-commerce Attribution Optimization
Key Takeaways
- Accurate attribution provides clarity on which marketing efforts truly drive revenue.
- It enables smarter budget allocation and campaign optimization.
- Understanding the full customer journey helps tailor marketing strategies for better engagement.
- Cross-functional alignment improves when all teams operate with the same revenue insights.
By prioritizing accurate attribution, senior marketers and growth managers can unlock sustainable revenue growth and maximize the impact of their performance marketing strategies.
1.5 Best Practice: Aligning Marketing Goals with Attribution Strategies
In performance marketing, one of the most critical best practices is ensuring that your attribution strategy is tightly aligned with your overarching marketing goals. Without this alignment, attribution data can become misleading or irrelevant, leading to suboptimal budget allocation and missed revenue opportunities.
Why Alignment Matters
Marketing goals define what success looks like for your campaigns — whether it’s driving trial signups, increasing product demos, or boosting customer retention. Attribution models, on the other hand, assign credit to touchpoints along the customer journey. If the attribution model doesn’t reflect the goal’s nature, the insights you gain will not effectively inform your strategy.
For example, a SaaS company focused on increasing free trial signups needs to understand which channels and touchpoints contribute most to initiating trials, not just final purchases.
Case Example: SaaS Company Aligning Multi-Touch Attribution with Trial Signups
Scenario: A SaaS company offers a free 14-day trial to attract new users. Their marketing team wants to optimize campaigns to increase trial signups rather than just paying customers.
Challenge: Using a last-touch attribution model, the company noticed paid search was credited for most conversions. However, internal analysis showed many users first discovered the product through content marketing or social ads before searching for the brand.
Solution: They implemented a multi-touch attribution model that assigns fractional credit to all significant touchpoints leading to a trial signup. This approach revealed the importance of early-stage channels like blog posts and social media in driving awareness and trial interest.
Outcome: Budget was reallocated to scale content marketing and social campaigns, resulting in a 25% increase in trial signups over the next quarter.
Mind Map: Aligning Marketing Goals with Attribution Strategies
Additional Examples
Example 1: E-commerce Brand Focusing on First-Time Purchases
- Goal: Increase first-time buyers
- Attribution Strategy: First-touch attribution to credit initial discovery channels like influencer marketing or display ads
- Result: Increased investment in influencer partnerships that led to higher first-time purchase rates
Example 2: B2B Company Driving Demo Requests
- Goal: Maximize demo requests from qualified leads
- Attribution Strategy: Multi-touch attribution with weighted credit on middle and bottom funnel interactions such as webinars and email nurturing
- Result: Improved targeting and nurturing strategies, increasing demo requests by 30%
Key Takeaways
- Always start with clearly defined marketing goals.
- Select an attribution model that reflects the complexity and length of your customer journey.
- Use multi-touch attribution to capture the full impact of all marketing efforts, especially for SaaS trial signups.
- Continuously analyze and optimize campaigns based on attribution insights.
- Integrate qualitative insights (e.g., customer feedback) to complement quantitative attribution data.
Aligning your marketing goals with the right attribution strategy ensures that your performance marketing efforts are measured accurately and optimized effectively, ultimately driving scalable revenue growth.
2. Deep Dive into Attribution Models
2.1 First-Touch Attribution: Benefits and Limitations
What is First-Touch Attribution?
First-touch attribution is a marketing measurement model that assigns 100% of the credit for a conversion or sale to the very first interaction a customer has with your brand. This model helps marketers understand which channels or campaigns are most effective at generating initial awareness and attracting potential customers.
Benefits of First-Touch Attribution
- Simplicity and Clarity: Easy to implement and understand, making it accessible for teams new to attribution modeling.
- Focus on Awareness Channels: Highlights the channels that drive initial interest, helping allocate budget to top-of-funnel activities.
- Quick Insights for Early-Stage Funnels: Useful for businesses with longer sales cycles to identify where prospects first engage.
Limitations of First-Touch Attribution
- Ignores Later Touchpoints: Does not account for the influence of subsequent interactions that may be critical in the decision-making process.
- Overvalues Awareness Channels: Can lead to over-investment in channels that generate leads but don’t necessarily convert.
- Not Ideal for Complex Customer Journeys: Less effective for multi-channel, multi-touchpoint sales processes.
Mind Map: First-Touch Attribution Overview
Example: E-commerce Brand Measuring First Interaction Impact
Scenario: An e-commerce company selling outdoor gear wants to understand which marketing channels are most effective at attracting new visitors who eventually make a purchase.
Implementation: They use first-touch attribution to assign full credit for each sale to the channel where the customer first engaged, such as:
- Paid Social Ads
- Organic Search
- Email Newsletter Signup
- Referral Links
Findings:
- Paid Social Ads drive 40% of first touches leading to purchases.
- Organic Search accounts for 35%.
- Email Newsletter and Referrals make up the remaining 25%.
Actionable Insight: The brand decides to increase investment in paid social campaigns to boost initial awareness and attract more potential buyers.
Mind Map: E-commerce Example Breakdown
Best Practices When Using First-Touch Attribution
- Use it in conjunction with other attribution models to get a holistic view.
- Regularly validate findings with customer journey analysis.
- Be cautious about over-allocating budget solely based on first-touch data.
- Combine with qualitative insights, such as customer interviews, to understand the full path to purchase.
Summary
First-touch attribution offers a straightforward way to identify which channels spark initial interest in your brand. While it provides valuable insights for top-of-funnel marketing efforts, it should be balanced with other models to avoid misallocating resources and to capture the full complexity of customer journeys.
2.2 Last-Touch Attribution: When and How to Use It
What is Last-Touch Attribution?
Last-touch attribution is a marketing attribution model that assigns 100% of the credit for a conversion to the last marketing touchpoint or interaction a customer had before completing a desired action, such as a purchase or signup.
When to Use Last-Touch Attribution
- Short Sales Cycles: When the customer journey is brief and straightforward.
- Clear Conversion Point: When the final interaction is highly indicative of the conversion.
- Simplicity Needed: When teams require a simple, easy-to-understand attribution model.
- Budget Allocation for Bottom Funnel: To optimize channels that close sales.
Limitations of Last-Touch Attribution
- Ignores earlier touchpoints that may have influenced the customer.
- Can undervalue upper-funnel channels like brand awareness or content marketing.
- May lead to over-investment in channels that drive last clicks but not overall growth.
How to Implement Last-Touch Attribution
- Identify the Conversion Event: Define what counts as a conversion (e.g., purchase, lead form submission).
- Track Customer Touchpoints: Use tracking tools (UTM parameters, cookies, CRM data) to record all interactions.
- Assign Credit: Attribute 100% of the conversion credit to the last recorded touchpoint.
- Analyze Channel Performance: Evaluate which channels or campaigns are driving the last clicks.
- Optimize Campaigns: Allocate budget and resources to channels with the highest last-touch conversions.
Mind Map: Last-Touch Attribution Overview
Example: Retail Campaign Focusing on Last Click Conversions
Scenario: A retail company runs a multi-channel campaign including email marketing, paid search ads, social media ads, and display advertising. The goal is to drive online sales.
Customer Journey Example:
- Day 1: Customer clicks on a Facebook ad (awareness).
- Day 3: Customer opens an email promotion (consideration).
- Day 5: Customer clicks a Google Search ad and completes a purchase.
Last-Touch Attribution Result:
- 100% of the credit for the sale is assigned to the Google Search ad.
Insights:
- Paid search is driving the final conversion.
- Email and Facebook ads are assisting but receive no direct credit.
Action:
- Increase budget on paid search campaigns to maximize conversions.
- Consider additional analysis to understand the assisting role of other channels.
Mind Map: Retail Campaign Last-Touch Attribution Example
Best Practices for Using Last-Touch Attribution in Retail Campaigns
- Combine with Multi-Touch Analysis: Use last-touch for quick insights but complement with multi-touch models to understand full customer journey.
- Use Incrementality Testing: Validate that last-click channels truly drive incremental sales.
- Segment by Customer Type: New vs. returning customers may have different attribution needs.
- Regularly Review Attribution Model: Adjust as customer behaviors and marketing mix evolve.
Additional Example: Email Campaign Optimization
A retail brand notices that last-touch attribution credits 70% of conversions to email campaigns. By analyzing timing and frequency, they optimize send times and personalize content, resulting in a 15% lift in last-click conversions.
Summary
Last-touch attribution is a straightforward and useful model for understanding which marketing touchpoint directly precedes a conversion. While it has limitations, when used appropriately—especially in retail campaigns with clear conversion paths—it provides actionable insights for budget allocation and campaign optimization.
2.3 Multi-Touch Attribution: Types and Implementation
Multi-touch attribution (MTA) is a sophisticated approach that assigns credit to multiple marketing touchpoints along the customer journey rather than attributing success to just the first or last interaction. This method provides a more holistic view of how various channels and campaigns contribute to conversions and revenue.
Why Multi-Touch Attribution?
- Captures the complexity of modern buyer journeys.
- Helps marketers understand the combined impact of different channels.
- Enables better budget allocation by recognizing all contributors.
Types of Multi-Touch Attribution Models
-
Linear Attribution
- Distributes equal credit to every touchpoint.
- Simple and fair when all interactions are considered equally important.
-
Time Decay Attribution
- Gives more credit to touchpoints closer to the conversion.
- Useful when recent interactions are more influential.
-
U-Shaped (Position-Based) Attribution
- Assigns 40% credit each to first and last touchpoints.
- Remaining 20% is spread across middle interactions.
- Emphasizes the importance of lead generation and closing.
-
W-Shaped Attribution
- Gives 30% credit each to first touch, lead conversion, and last touch.
- Remaining 10% divided among other touchpoints.
- Ideal for B2B funnels with defined lead stages.
-
Custom or Algorithmic Attribution
- Uses data-driven methods and machine learning to assign credit.
- Adapts to unique business contexts and customer behaviors.
Implementation Steps for Multi-Touch Attribution
-
Map the B2B Marketing Funnel
- Awareness: Initial brand exposure (e.g., display ads, social media).
- Consideration: Engagement and nurturing (e.g., webinars, email campaigns).
- Decision: Conversion activities (e.g., demos, sales calls).
-
Identify Touchpoints and Data Sources
- CRM systems, marketing automation platforms, web analytics.
-
Choose the Attribution Model
- Select based on business goals and funnel complexity.
-
Assign Weights to Touchpoints
- For example, in a W-shaped model:
- First touch (brand awareness): 30%
- Lead creation (form fill, webinar sign-up): 30%
- Last touch (demo request, sales call): 30%
- Other touches (email opens, content downloads): 10%
- For example, in a W-shaped model:
-
Integrate and Analyze Data
- Use tools like Google Analytics 360, HubSpot, or custom BI solutions.
-
Optimize Campaigns Based on Insights
- Reallocate budget to high-impact channels.
- Refine messaging and timing.
Example: B2B Marketing Funnel with Weighted Touchpoints
Consider a B2B SaaS company using a W-shaped multi-touch attribution model.
- Touchpoints:
- First Touch: Paid LinkedIn ad (30%)
- Lead Creation: Webinar registration (30%)
- Last Touch: Sales demo request (30%)
- Other Touches: Email nurture sequence, blog downloads (10%)
Scenario: A prospect first clicks a LinkedIn ad, later signs up for a webinar, engages with nurture emails, downloads a whitepaper, and finally requests a demo.
Attribution Credit Distribution:
- LinkedIn ad: 30%
- Webinar registration: 30%
- Demo request: 30%
- Email and whitepaper engagement: 10%
This distribution helps the marketing team understand the importance of each stage and justify investments in awareness campaigns, lead nurturing, and sales enablement.
Mind Map: Multi-Touch Attribution Overview
Mind Map: B2B Marketing Funnel Touchpoints
Best Practices for Multi-Touch Attribution in B2B
- Align Attribution Model with Sales Cycle: Longer sales cycles benefit from models like W-shaped that emphasize lead creation.
- Use CRM Data for Accurate Lead Tracking: Integrate marketing and sales data to capture all touchpoints.
- Test and Iterate: Regularly review attribution results and adjust weights or models as needed.
- Educate Stakeholders: Ensure marketing, sales, and finance teams understand attribution insights.
By implementing a weighted multi-touch attribution model tailored to the B2B funnel, senior marketers and growth managers can more precisely measure marketing impact, optimize spend, and ultimately scale revenue more effectively.
2.4 Algorithmic and Data-Driven Attribution Models Explained
Algorithmic and data-driven attribution models represent the cutting edge of marketing analytics, moving beyond traditional rule-based approaches to leverage data science and machine learning. These models analyze vast amounts of customer interaction data to assign credit to marketing touchpoints based on their actual contribution to conversions and revenue.
What is Algorithmic Attribution?
Algorithmic attribution uses statistical and machine learning techniques to determine the impact of each marketing touchpoint on the customer journey. Unlike fixed models (first-touch, last-touch), algorithmic models dynamically learn from data patterns, providing a nuanced and accurate picture of channel effectiveness.
Key Characteristics:
- Data-driven: Relies on historical conversion data.
- Dynamic: Adapts as new data flows in.
- Granular: Can evaluate complex customer journeys with multiple touchpoints.
How Algorithmic Attribution Works
- Data Collection: Gather detailed user interaction data across channels (clicks, impressions, visits).
- Feature Engineering: Define touchpoints, time decay, sequence, and other variables.
- Model Training: Use regression, Markov chains, Shapley values, or machine learning algorithms to estimate each touchpoint’s contribution.
- Attribution Assignment: Allocate conversion credit proportionally based on model output.
Common Algorithmic Attribution Techniques
- Markov Chains: Models the probability of moving from one touchpoint to another, estimating removal effects.
- Shapley Value: A game theory approach that fairly distributes credit among all contributors.
- Regression Models: Statistical models that quantify the relationship between touchpoints and conversions.
- Machine Learning Models: Use algorithms like random forests or gradient boosting to predict conversion likelihood and assign credit.
Mind Map: Algorithmic Attribution Overview
Example: Using Markov Chains for Attribution
A B2C e-commerce company wants to understand how their channels contribute to sales. They track user paths like:
- Email > Paid Search > Direct > Purchase
- Social > Paid Search > Purchase
Using Markov Chains, they calculate the removal effect of each channel. For example, removing Paid Search reduces conversions by 30%, indicating its strong influence. This insight helps them allocate budget more effectively.
Mind Map: Markov Chain Attribution Example
Example: Shapley Value Attribution in SaaS
A SaaS company uses Shapley values to fairly distribute credit among touchpoints like webinars, blog visits, and paid ads. For a customer who attended a webinar, read a blog post, and clicked a paid ad before signing up, the Shapley value method calculates the average marginal contribution of each touchpoint across all possible sequences, ensuring no channel is over- or under-valued.
Mind Map: Shapley Value Attribution
Benefits of Algorithmic and Data-Driven Attribution
- Improved Accuracy: Reflects real customer behavior rather than assumptions.
- Better Budget Allocation: Identifies true ROI of channels.
- Adaptability: Models update as marketing strategies and customer behaviors evolve.
- Supports Complex Journeys: Handles multiple touchpoints and cross-device interactions.
Best Practice: Combining Algorithmic Attribution with Business Context
While algorithmic models provide powerful insights, integrating qualitative business knowledge ensures practical application. For example, a growth manager might use algorithmic attribution results alongside customer feedback and sales team input to refine campaign strategies.
Summary
Algorithmic and data-driven attribution models empower senior marketers and growth managers to move beyond simplistic attribution rules. By leveraging advanced analytics, these models provide a transparent, fair, and actionable view of marketing performance, enabling smarter revenue scaling decisions.
2.5 Best Practice: Combining Qualitative and Quantitative Data for Attribution Accuracy
Attribution modeling traditionally relies heavily on quantitative data — clicks, impressions, conversions, and other measurable touchpoints. However, to truly understand the customer journey and improve attribution accuracy, integrating qualitative data such as customer feedback, surveys, and interviews is essential. This blended approach offers a more holistic view of marketing effectiveness.
Why Combine Qualitative and Quantitative Data?
- Fill Data Gaps: Quantitative data may miss nuances like customer intent or emotional triggers.
- Validate Insights: Qualitative feedback can confirm or challenge assumptions derived from numbers.
- Uncover Hidden Touchpoints: Customers may reveal offline or indirect influences not tracked digitally.
- Improve Model Accuracy: Integrating both data types reduces attribution bias and enhances decision-making.
Example: Using Customer Surveys Alongside Data-Driven Models
Imagine a SaaS company using a multi-touch attribution model to allocate credit across paid search, email campaigns, and social media ads. The quantitative data shows paid search as the dominant channel driving conversions. However, customer surveys reveal that many users first heard about the product through word-of-mouth or industry events — touchpoints not captured in digital tracking.
By incorporating survey insights, the company adjusts its attribution model to account for these offline influences, leading to more balanced budget allocation and better marketing ROI.
Mind Map: Combining Data Types for Attribution Accuracy
How to Implement This Best Practice
-
Design Customer Surveys Focused on Attribution:
- Ask questions about how customers first heard about your brand.
- Include queries on which marketing messages influenced their decision.
- Example question: “Which of the following influenced your decision to try our product? (Select all that apply)”
-
Collect Qualitative Feedback Regularly:
- Use post-purchase surveys, NPS questionnaires, or in-app feedback tools.
- Conduct periodic interviews or focus groups for deeper insights.
-
Align Survey Data with Quantitative Metrics:
- Map survey responses to corresponding digital touchpoints.
- Identify discrepancies or missing channels in your attribution data.
-
Adjust Attribution Models Accordingly:
- Incorporate offline or indirect channels revealed by qualitative data.
- Use weighted attribution to reflect the influence of these additional touchpoints.
-
Continuously Monitor and Refine:
- Regularly update surveys and data collection methods.
- Iterate on attribution models based on new insights.
Additional Examples
-
E-commerce Brand: Quantitative data shows email campaigns driving conversions, but customer interviews reveal that product reviews and influencer recommendations were key decision factors. The brand adds influencer touchpoints into their attribution model.
-
B2B Company: Data-driven attribution credits paid ads heavily, but focus groups highlight the importance of trade shows and webinars. These offline channels are integrated into the revenue attribution framework.
Mind Map: Implementation Workflow
By combining qualitative insights with quantitative data, senior marketers and growth managers can enhance attribution accuracy, leading to smarter budget allocation, improved campaign performance, and ultimately, greater revenue growth.
3. Setting Up Attribution Modeling for Your Marketing Channels
3.1 Mapping Customer Journeys Across Channels
Mapping customer journeys across channels is a foundational step in understanding how your audience interacts with your brand at every touchpoint. This process helps marketers visualize the path customers take from awareness to conversion and beyond, enabling more accurate attribution and optimized marketing strategies.
Why Map Customer Journeys?
- Identify Key Touchpoints: Understand where customers engage with your brand.
- Highlight Channel Influence: See how different channels contribute to conversions.
- Spot Gaps and Friction: Detect drop-off points or areas needing improvement.
- Enable Personalization: Tailor messaging based on journey stages.
Step-by-Step Guide to Mapping Customer Journeys Across Channels
-
Define Your Customer Personas:
- Understand demographics, behaviors, and preferences.
- Example: A growth manager at a SaaS company segments users into “Trial Users,” “Power Users,” and “Churn Risks.”
-
List All Marketing Channels:
- Include paid search, social media, email, organic search, direct traffic, referrals, offline channels, etc.
- Example: An e-commerce brand tracks Facebook Ads, Google Ads, email newsletters, influencer partnerships, and in-store events.
-
Identify Touchpoints Within Each Channel:
- Website visits, ad clicks, content downloads, webinar attendance, customer service interactions.
- Example: For an online education platform, touchpoints include YouTube video views, blog reads, free trial signups, and live chat queries.
-
Map the Sequence and Frequency of Touchpoints:
- Understand typical customer paths and repeat interactions.
- Example: A retail customer might first see a social ad, then visit the website multiple times before purchasing.
-
Capture Customer Intent and Emotions at Each Stage:
- Awareness, consideration, decision, retention, advocacy.
- Example: A B2B buyer researching solutions feels uncertainty during the consideration phase, requiring educational content.
-
Visualize the Journey:
- Use diagrams or mind maps to represent paths.
Mind Map: Basic Customer Journey Across Channels
Example: Mapping a Multi-Channel Journey for an E-Commerce Brand
- Persona: Millennial shopper interested in sustainable fashion.
- Channels & Touchpoints:
- Instagram Ad (Awareness)
- Website Visit (Consideration)
- Email Newsletter (Consideration)
- Retargeting Facebook Ad (Decision)
- Purchase (Decision)
- Post-purchase Email (Retention)
- Social Media Share (Advocacy)
Best Practice: Use Data to Validate and Refine Your Journey Maps
- Leverage analytics tools (Google Analytics, Mixpanel) to track actual user paths.
- Conduct customer interviews and surveys to understand motivations.
- Continuously update journey maps based on new data and market changes.
Example: SaaS Company Journey Mapping with Data Integration
- Channels: Paid Search, Organic Blog, Email Drip Campaign, Demo Request, Customer Success Check-ins.
- Data Insights: Analytics reveal most users first engage via organic blog posts, then enter email drip campaigns, and finally request demos.
Summary
Mapping customer journeys across channels is essential for senior marketers and growth managers to visualize how customers interact with their brand. By combining qualitative insights with quantitative data, you can create accurate, actionable journey maps that inform attribution modeling and revenue scaling strategies.
3.2 Integrating CRM and Marketing Automation Tools for Data Collection
Integrating Customer Relationship Management (CRM) systems with Marketing Automation platforms is a critical step in building a robust data foundation for attribution modeling and performance marketing. This integration ensures seamless data flow, enabling marketers to capture, analyze, and act on customer interactions across the entire buyer journey.
Why Integrate CRM and Marketing Automation?
- Unified Customer View: Combining sales and marketing data provides a 360-degree perspective of the customer.
- Improved Data Accuracy: Reduces data silos and discrepancies between teams.
- Enhanced Attribution: Enables tracking of leads from first touch through conversion and revenue.
- Automated Workflows: Streamlines lead nurturing and scoring based on real-time data.
Key Integration Components
Best Practices for Integration
-
Define Clear Data Mapping:
- Map fields between CRM and marketing automation tools to ensure consistency.
- Example: Map “Lead Source” in CRM to “Campaign Source” in marketing automation.
-
Set Up Bi-Directional Sync:
- Ensure data flows both ways to keep records updated.
- Example: When a lead converts in marketing automation, update CRM status to “Qualified Lead”.
-
Implement Lead Scoring Models:
- Use behavioral and demographic data from both systems.
- Example: Assign points for email opens (marketing automation) and demo requests (CRM).
-
Automate Lead Routing:
- Automatically assign leads to sales reps based on criteria.
- Example: Leads from enterprise accounts routed to senior sales reps.
-
Regularly Audit Data Quality:
- Schedule periodic checks for duplicates and inconsistencies.
Example: Integrating HubSpot CRM with Marketo
-
Scenario: A B2B SaaS company wants to track leads from initial website visit through to closed-won deals.
-
Steps:
- Sync contact and company data between HubSpot and Marketo.
- Use UTM parameters captured in Marketo forms to populate lead source fields in HubSpot.
- Set up workflows in Marketo to nurture leads and update lifecycle stages in HubSpot.
- Sales team updates deal stages in HubSpot, which triggers marketing automation campaigns for upsell.
-
Outcome:
- Attribution reports accurately reflect multi-touch points.
- Sales and marketing teams have aligned data, improving collaboration.
Mind Map: Integration Workflow Example
Tips for Senior Marketers and Growth Managers
- Choose tools with native integrations or robust APIs to simplify setup.
- Collaborate closely with sales and IT teams to align data definitions.
- Monitor integration health with dashboards and alerts.
- Use integration data to fuel personalization and segmentation strategies.
By effectively integrating CRM and marketing automation tools, organizations can create a seamless data ecosystem that powers accurate attribution modeling and drives revenue scaling through informed decision-making.
3.3 Ensuring Data Quality and Consistency for Attribution
In performance marketing, the accuracy of attribution models hinges critically on the quality and consistency of the underlying data. Poor data quality can lead to misleading insights, misallocated budgets, and ultimately, lost revenue opportunities. This section explores best practices to ensure your data is reliable, consistent, and actionable.
Why Data Quality Matters in Attribution
- Attribution models rely on tracking user interactions across multiple touchpoints.
- Incomplete, inconsistent, or inaccurate data skews attribution results.
- High-quality data enables confident decision-making and precise budget allocation.
Key Dimensions of Data Quality for Attribution
Best Practices to Ensure Data Quality and Consistency
-
Implement Robust Tracking Standards
- Use consistent UTM parameters across campaigns.
- Standardize naming conventions for campaigns, sources, mediums, and content.
- Example: A travel brand uses
utm_source=facebook,utm_medium=paid_social, and campaign names likesummer2024_launchconsistently across all ads.
-
Centralize Data Collection and Integration
- Integrate CRM, marketing automation, ad platforms, and web analytics into a unified data warehouse.
- Example: A SaaS company consolidates Google Analytics, Salesforce, and Facebook Ads data into BigQuery to maintain a single source of truth.
-
Regular Data Audits and Validation
- Schedule weekly audits to identify missing or inconsistent data.
- Use automated scripts to flag anomalies like missing UTM tags or duplicate entries.
- Example: An e-commerce brand runs a script that alerts the marketing team if any campaign URLs lack UTM parameters.
-
Leverage Data Governance Policies
- Define roles and responsibilities for data entry, validation, and maintenance.
- Establish guidelines for data updates and corrections.
- Example: A subscription service assigns a data steward responsible for ensuring all campaign data adheres to standards before reporting.
-
Use Tracking Technologies Effectively
- Deploy tracking pixels and server-side tracking to reduce data loss.
- Implement cross-device tracking to unify user journeys.
- Example: A fintech startup uses Facebook Pixel combined with server-side events to capture conversions even with browser restrictions.
-
Train Teams on Data Best Practices
- Educate marketing and sales teams on the importance of data accuracy.
- Provide clear documentation and templates for campaign setup.
- Example: Growth managers conduct monthly workshops to align teams on tagging protocols.
Mind Map: Steps to Ensure Data Quality for Attribution
Example: Travel Brand Ensuring Data Quality
A travel brand running multi-channel campaigns noticed discrepancies in conversion data between Facebook Ads and Google Analytics. After investigation, they found inconsistent UTM parameters and missing tags on some landing pages.
Actions Taken:
- Standardized UTM parameters across all campaigns.
- Created a centralized spreadsheet with approved campaign names and tags.
- Implemented automated checks that flagged URLs missing UTM tags before launch.
- Trained the marketing team on the importance of tagging consistency.
Outcome:
- Improved attribution accuracy.
- Clearer insights into channel performance.
- More efficient budget allocation leading to a 15% increase in ROAS over the next quarter.
Example: SaaS Company Data Integration for Attribution
A SaaS company struggled to connect marketing touchpoints with sales outcomes due to siloed data in Google Analytics, Salesforce, and email marketing platforms.
Actions Taken:
- Built an ETL pipeline to ingest data from all platforms into a BigQuery data warehouse.
- Created unified user identifiers to track leads from first touch to closed deal.
- Automated data validation scripts to ensure completeness and accuracy.
Outcome:
- Enabled multi-touch attribution modeling with reliable data.
- Increased visibility into customer journeys.
- Supported data-driven decisions that scaled revenue by 20% year-over-year.
Summary
Ensuring data quality and consistency is foundational for effective attribution modeling. By implementing standardized tracking, centralizing data, performing regular audits, enforcing governance, leveraging technology, and training teams, organizations can unlock accurate insights that drive smarter marketing investments and revenue growth.
3.4 Best Practice: Using UTM Parameters and Tracking Pixels Effectively
In performance marketing, accurate tracking is the cornerstone of effective attribution modeling. Two fundamental tools marketers rely on are UTM parameters and tracking pixels. When used correctly, they provide granular insights into campaign performance across multiple channels, enabling data-driven decisions that fuel revenue growth.
What are UTM Parameters?
UTM (Urchin Tracking Module) parameters are tags added to URLs that help track the source, medium, campaign, and other attributes of traffic coming to your website.
Core UTM parameters:
utm_source: Identifies the traffic source (e.g., facebook, newsletter)utm_medium: Identifies the marketing medium (e.g., cpc, email)utm_campaign: Identifies the campaign name or promotionutm_term: Tracks paid search keywordsutm_content: Differentiates similar content or links within the same ad
What are Tracking Pixels?
Tracking pixels are tiny, invisible images embedded in emails or web pages that trigger when a user opens or visits, sending data back to analytics platforms. They help track user behavior, conversions, and retargeting.
Why Use UTM Parameters and Tracking Pixels Together?
- UTM parameters provide detailed source and campaign-level data.
- Tracking pixels capture user engagement and conversion events.
Together, they create a comprehensive picture of the customer journey.
Example: Multi-Channel Campaign Tracking for a Travel Brand
Imagine a travel brand launching a summer promotion across multiple channels: Facebook Ads, Email Newsletter, Google Search Ads, and Influencer Partnerships.
Step 1: Define UTM Parameters for Each Channel
| Channel | utm_source | utm_medium | utm_campaign | utm_content |
|---|---|---|---|---|
| Facebook Ads | cpc | summer_promo_24 | video_ad_1 | |
| Email Newsletter | newsletter | summer_promo_24 | header_link | |
| Google Search Ads | cpc | summer_promo_24 | branded_keyword | |
| Influencer Posts | influencer | social | summer_promo_24 | influencer_john_doe |
Step 2: Embed Tracking Pixels
- Place Facebook Pixel on the website to track conversions from Facebook Ads.
- Use Google Ads conversion tracking pixel for search ads.
- Add email open and click tracking pixels in newsletters.
- Request influencers to embed tracking pixels or use unique affiliate links.
Mind Map: UTM Parameters Setup
Mind Map: Tracking Pixel Integration
Best Practices for Using UTM Parameters and Tracking Pixels
-
Standardize Naming Conventions:
- Use consistent, lowercase, and hyphenated terms to avoid data fragmentation.
- Example: Use
summer_promo_24instead ofSummerPromo24orsummerPromo.
-
Keep UTM Parameters Descriptive but Concise:
- Make it easy to identify the campaign and channel at a glance.
-
Test URLs Before Launch:
- Verify UTM-tagged URLs load correctly and tracking pixels fire as expected.
-
Use URL Builders:
- Tools like Google’s Campaign URL Builder help avoid manual errors.
-
Leverage Analytics Platforms:
- Ensure your analytics tool (Google Analytics, Adobe Analytics) is configured to capture and report on UTM parameters and pixel data.
-
Monitor and Audit Regularly:
- Periodically check for broken links, missing parameters, or pixel firing issues.
Example Scenario: Interpreting Data
After launching the campaign, the travel brand notices:
- Facebook Ads (utm_source=facebook, utm_medium=cpc) have a high click-through rate but lower conversion.
- Email Newsletter (utm_source=newsletter, utm_medium=email) has fewer clicks but higher conversion rate.
Using this data, the marketing team decides to optimize Facebook creatives and increase email send frequency, reallocating budget accordingly.
Summary
Using UTM parameters combined with tracking pixels enables senior marketers and growth managers to:
- Attribute conversions accurately across multiple channels.
- Understand user behavior and engagement.
- Optimize campaigns based on granular data.
This integrated approach is essential for scaling revenue effectively in a multi-channel marketing environment.
3.5 Case Study: Attribution Setup for Omnichannel Retailer
Background
An omnichannel retailer, “StyleHub,” operates both online and offline stores, including a website, mobile app, social media channels, email marketing, and physical retail locations. Their goal was to understand how different marketing touchpoints contribute to sales across channels and optimize marketing spend accordingly.
Challenges
- Multiple customer touchpoints across digital and physical channels.
- Difficulty in tracking customer journeys that start online and convert offline (or vice versa).
- Data silos between CRM, POS (Point of Sale), and digital marketing platforms.
- Need for a unified attribution model that reflects true marketing impact.
Attribution Setup Approach
Step 1: Mapping Customer Journey
- Identified key touchpoints: Paid Search, Paid Social, Email, Website Visits, Mobile App Engagement, In-Store Visits, and POS Transactions.
- Tracked online-to-offline conversions using loyalty program data and unique coupon codes.
Step 2: Data Integration
- Integrated CRM, POS system, Google Analytics, Facebook Ads Manager, and email marketing platform.
- Used a Customer Data Platform (CDP) to unify customer profiles and track cross-channel interactions.
Step 3: Choosing Attribution Model
- Implemented a multi-touch attribution model weighted by channel influence and time decay.
- Incorporated offline sales data by linking loyalty card usage and coupon redemptions.
Step 4: Tracking Implementation
- Used UTM parameters on digital campaigns.
- Deployed tracking pixels on website and app.
- Issued unique promo codes for offline redemption tied to specific campaigns.
Step 5: Validation and Testing
- Conducted incrementality tests by pausing certain campaigns and measuring sales impact.
- Surveyed customers post-purchase to confirm touchpoints.
Mind Map: Omnichannel Attribution Setup
Example: Tracking Online-to-Offline Conversion
- A customer clicks a Facebook ad with UTM parameters.
- They visit the website and sign up for the loyalty program.
- Later, they visit a physical store and redeem a unique promo code linked to that Facebook campaign.
- The POS system records the sale and associates it with the loyalty ID.
- Attribution model credits both the Facebook ad (first touch) and the in-store visit (last touch) with weighted contribution.
Results
- StyleHub identified that email marketing and paid social drove the highest influence on offline sales.
- Optimized marketing budget by increasing spend on high-impact channels.
- Improved customer lifetime value by personalizing campaigns based on unified customer profiles.
- Enhanced reporting accuracy, enabling better forecasting and revenue scaling.
Key Takeaways
- Integrating offline and online data is critical for omnichannel attribution.
- Multi-touch models with weighted contributions better reflect complex customer journeys.
- Unique promo codes and loyalty programs are effective tools for linking offline sales to digital campaigns.
- Validation through incrementality testing and surveys ensures attribution accuracy.
This case study demonstrates how an omnichannel retailer can successfully set up an attribution model that captures the full spectrum of customer interactions, enabling smarter marketing decisions and revenue growth.
4. Leveraging Attribution Insights to Optimize Campaign Performance
4.1 Identifying High-Performing Channels and Touchpoints
In performance marketing, pinpointing which channels and touchpoints deliver the most value is critical for optimizing budget allocation and maximizing ROI. This section explores methodologies, practical frameworks, and real-world examples to help senior marketers and growth managers identify high-performing channels and touchpoints effectively.
Understanding Channels vs. Touchpoints
- Channels refer to the platforms or mediums where marketing messages are delivered (e.g., Paid Search, Social Media, Email, Affiliate Marketing).
- Touchpoints are the individual interactions a customer has with your brand within or across channels (e.g., clicking an ad, opening an email, visiting a landing page).
Step 1: Collect Comprehensive Data Across Channels
To identify high performers, start by gathering granular data from all marketing channels. This includes:
- Impressions
- Clicks
- Conversions
- Revenue generated
- Engagement metrics (time on site, bounce rate)
Example: A SaaS company collects data from Google Ads, Facebook Ads, LinkedIn campaigns, and email marketing platforms to build a unified dataset.
Step 2: Use Attribution Models to Assign Credit
Apply attribution models (e.g., multi-touch, data-driven) to understand how each channel and touchpoint contributes to conversions.
Example: Using a linear multi-touch attribution model, a B2B company discovers that LinkedIn ads contribute 30% of the conversion credit, while email campaigns contribute 50%, and paid search 20%.
Step 3: Analyze Channel and Touchpoint Performance Metrics
Key metrics to evaluate:
- Cost per Acquisition (CPA): How much it costs to acquire a customer per channel.
- Return on Ad Spend (ROAS): Revenue generated per dollar spent.
- Conversion Rate: Percentage of users converting per channel/touchpoint.
- Customer Lifetime Value (CLV): Long-term revenue potential from customers acquired via each channel.
Mind Map: Identifying High-Performing Channels and Touchpoints
Step 4: Segment by Customer Journey Stage
Different channels and touchpoints may perform better at various stages:
- Awareness: Display ads, social media
- Consideration: Retargeting, email nurturing
- Decision: Paid search, direct outreach
Example: An e-commerce brand finds that Instagram ads drive awareness effectively, but Google Shopping campaigns deliver higher conversion rates at the decision stage.
Step 5: Use Visualization Tools for Insights
Leverage dashboards and visualization tools (e.g., Tableau, Looker, Google Data Studio) to map performance across channels and touchpoints.
Example: A growth manager uses a dashboard to compare ROAS across Facebook, Google Ads, and email campaigns, identifying Facebook as the highest ROAS channel.
Best Practice: Regularly Conduct Incrementality Tests
Running controlled experiments (e.g., holdout groups) helps validate whether a channel or touchpoint truly drives incremental revenue.
Example: A fintech startup runs an A/B test by pausing paid social ads for a week and observes a 20% drop in conversions, confirming the channel’s high performance.
Summary
Identifying high-performing channels and touchpoints requires a combination of comprehensive data collection, appropriate attribution modeling, and deep analysis of key performance metrics. Segmenting by customer journey stages and validating findings with incrementality tests ensures marketing efforts are focused on areas that truly drive revenue growth.
By applying these practices, senior marketers and growth managers can optimize their performance marketing strategies to scale revenue effectively.
4.2 Budget Allocation Based on Attribution Data
Effective budget allocation is a cornerstone of maximizing ROI in performance marketing. Attribution data provides a clear lens into which channels and touchpoints are driving conversions and revenue, enabling marketers to allocate budgets more strategically and confidently.
Why Use Attribution Data for Budget Allocation?
- Data-Driven Decisions: Move beyond gut feelings to decisions backed by real performance data.
- Optimize Spend: Invest more in channels and campaigns that demonstrate higher contribution to revenue.
- Reduce Waste: Identify underperforming channels to reduce or reallocate spend.
- Improve ROI: Maximize return on ad spend (ROAS) by focusing on impactful touchpoints.
Mind Map: Budget Allocation Using Attribution Data
Step-by-Step Approach to Budget Allocation
-
Collect and Analyze Attribution Data:
- Use your chosen attribution model (e.g., multi-touch) to understand channel contributions.
- Example: A B2B SaaS company finds that LinkedIn ads contribute 40% of multi-touch conversions, while Google Ads contribute 35%, and email campaigns 25%.
-
Calculate Key Metrics per Channel:
- Determine CPA, ROAS, and CLV for each channel.
- Example: LinkedIn ads have a CPA of $120 and ROAS of 5x; Google Ads CPA is $100 with ROAS 4x; email campaigns have CPA $50 but ROAS 3x.
-
Prioritize Channels Based on Business Goals:
- If immediate revenue is the goal, prioritize channels with higher ROAS.
- If customer retention is key, consider CLV impact.
-
Allocate Budgets Accordingly:
- Increase spend on LinkedIn and Google Ads due to higher ROAS.
- Maintain or optimize email campaigns for nurturing.
-
Implement Dynamic Budgeting:
- Use real-time data to shift budgets weekly or monthly.
- Example: If LinkedIn performance dips, temporarily shift budget to Google Ads.
-
Test and Iterate:
- Run A/B tests on budget changes to validate assumptions.
Mind Map: Example Budget Allocation Workflow
Example: Travel Brand Multi-Channel Budget Allocation
Scenario: A travel company runs campaigns across Facebook Ads, Google Search, and Email Marketing.
- Attribution data shows:
- Facebook Ads: 30% contribution, CPA $80, ROAS 6x
- Google Search: 50% contribution, CPA $100, ROAS 5x
- Email Marketing: 20% contribution, CPA $40, ROAS 4x
Budget Allocation Strategy:
- Increase Facebook Ads budget by 20% to capitalize on high ROAS and lower CPA.
- Maintain Google Search budget but optimize keywords to reduce CPA.
- Keep email marketing budget steady focusing on retention and upsell.
Result: After 3 months, overall ROAS improved by 15%, and CPA decreased by 10%.
Best Practices for Budget Allocation Based on Attribution Data
- Use Multi-Touch Attribution: Avoid relying solely on first or last touch to get a holistic view.
- Incorporate Incrementality Testing: Validate that budget increases actually drive incremental revenue.
- Segment by Audience: Allocate budgets differently for new vs. returning customers.
- Leverage Automation: Use tools for real-time budget adjustments based on performance.
- Align with Business Objectives: Ensure budget shifts support broader company goals, not just short-term wins.
Summary
Budget allocation informed by attribution data empowers senior marketers and growth managers to optimize spend, reduce waste, and scale revenue effectively. By combining clear data insights with continuous testing and dynamic adjustments, marketing budgets become powerful levers for growth.
4.3 Experimentation and A/B Testing Guided by Attribution Insights
Experimentation and A/B testing are critical components of optimizing performance marketing campaigns. When guided by attribution insights, these methodologies become even more powerful, enabling marketers to make data-driven decisions that directly impact revenue growth.
Why Use Attribution Insights for Experimentation?
Attribution models provide clarity on which marketing touchpoints and channels contribute most effectively to conversions and revenue. Leveraging these insights to design experiments ensures that your tests focus on variables that truly influence customer behavior, rather than relying on assumptions.
Benefits:
- Prioritize testing on high-impact channels/touchpoints
- Understand the incremental value of each marketing element
- Reduce wasted spend on ineffective tactics
- Improve ROI by optimizing proven drivers
Key Steps to Experimentation Guided by Attribution
- Analyze Attribution Data: Identify top-performing channels, creatives, or touchpoints.
- Formulate Hypotheses: Based on attribution insights, hypothesize what changes could improve performance.
- Design A/B Tests: Create controlled experiments to test these hypotheses.
- Run Experiments: Implement tests with proper segmentation and tracking.
- Evaluate Results: Use attribution data to measure impact on conversions and revenue.
- Iterate and Scale: Apply learnings to optimize campaigns and scale winning variants.
Mind Map: Experimentation Process Guided by Attribution Insights
Example 1: Optimizing Paid Social Campaigns
Scenario: A B2C e-commerce company uses multi-touch attribution and discovers that Instagram ads contribute significantly to early funnel engagement but have lower last-touch conversion rates.
Hypothesis: Enhancing Instagram ad creatives with stronger call-to-actions (CTAs) will increase downstream conversions.
Experiment: A/B test two versions of Instagram ads:
- Variant A: Current creative
- Variant B: New creative with enhanced CTA
Attribution-Guided Evaluation: Using multi-touch attribution, the team measures not only last-click conversions but also the influence of Instagram ads on assisted conversions.
Outcome: Variant B shows a 15% increase in assisted conversions and a 10% lift in overall revenue attributed to Instagram touchpoints.
Mind Map: Instagram Ad A/B Test
Example 2: Email Marketing Subject Line Testing
Scenario: A SaaS company’s attribution model reveals that email campaigns are critical in the middle of the funnel but have inconsistent open rates.
Hypothesis: Personalizing subject lines based on user behavior will improve engagement and increase trial signups.
Experiment: A/B test two subject line strategies:
- Variant A: Generic subject line
- Variant B: Personalized subject line referencing recent product activity
Attribution-Guided Evaluation: The team tracks how email opens influence downstream conversion events using first-touch and multi-touch attribution.
Outcome: Variant B increases email opens by 20% and contributes to a 12% increase in trial signups attributed to email touchpoints.
Mind Map: Email Subject Line A/B Test
Best Practices for Experimentation Using Attribution Insights
- Use Multi-Touch Attribution: Avoid relying solely on last-click to understand the full customer journey impact.
- Segment Tests by Channel: Attribution data can reveal different behaviors across channels; tailor experiments accordingly.
- Ensure Proper Tracking: Accurate UTM parameters and event tracking are essential to link experiment variants to attribution data.
- Test Incrementally: Start with small tests to validate hypotheses before scaling.
- Incorporate Incrementality Testing: Validate that observed lifts are caused by your marketing efforts, not external factors.
- Document Learnings: Maintain a knowledge base of test results linked to attribution insights for continuous improvement.
Summary
Experimentation and A/B testing, when informed by robust attribution modeling, empower marketers to optimize campaigns with precision. By focusing on the touchpoints and channels that truly drive revenue, marketers can design smarter tests, allocate budgets more effectively, and ultimately scale revenue with confidence.
4.4 Best Practice: Dynamic Budget Reallocation in Real-Time (Example: Paid Social vs. Paid Search Optimization)
In today’s fast-paced digital marketing environment, the ability to dynamically reallocate budgets in real-time based on performance data is a game-changer. This best practice enables marketers to maximize ROI by shifting spend toward the highest-performing channels and campaigns as insights emerge.
Why Dynamic Budget Reallocation Matters
- Maximize Efficiency: Avoid wasting budget on underperforming channels.
- React to Market Changes: Quickly adapt to shifts in consumer behavior or competitive activity.
- Improve ROI: Allocate spend where it drives the most conversions and revenue.
Core Components of Dynamic Budget Reallocation
Step-by-Step Process
- Set Up Real-Time Tracking: Use marketing analytics platforms that provide live data on paid social and paid search campaigns.
- Define Performance Metrics: Common KPIs include CPA, ROAS (Return on Ad Spend), CTR (Click-Through Rate), and conversion volume.
- Establish Thresholds: Determine performance thresholds that trigger budget shifts (e.g., if paid social CPA exceeds $50, reduce spend by 20%).
- Automate Budget Adjustments: Leverage tools like Google Ads scripts, Facebook Automated Rules, or third-party platforms to automate reallocations.
- Monitor and Iterate: Continuously monitor results and refine thresholds and rules.
Example: Paid Social vs. Paid Search Optimization
A mid-sized e-commerce company runs concurrent paid social (Facebook, Instagram) and paid search (Google Ads) campaigns. Initially, the budget is split 50/50.
- After one week, real-time attribution data shows:
- Paid social CPA: $60
- Paid search CPA: $35
- Paid search ROAS: 5x
- Paid social ROAS: 2.5x
Using dynamic budget reallocation:
- The system automatically reduces paid social budget by 30%.
- The saved budget is reallocated to paid search campaigns.
- Within days, the overall ROAS improves by 20%.
Mind Map: Example Workflow for Paid Social vs. Paid Search Reallocation
Tips for Successful Implementation
- Integrate Attribution Models: Use multi-touch attribution to understand the true contribution of each channel before reallocating budgets.
- Avoid Overreacting: Set minimum time windows before reallocations to prevent knee-jerk reactions to short-term fluctuations.
- Test and Learn: Run controlled experiments (A/B tests) to validate that reallocations improve performance.
- Cross-Channel Synergy: Consider that some channels assist others; reducing spend on one may impact overall funnel effectiveness.
Additional Example: Seasonal Campaign Adjustment
During a holiday season, paid search performance surges due to high purchase intent, while paid social engagement drops. Dynamic budget reallocation automatically shifts 40% of paid social budget to paid search, capitalizing on seasonal demand and increasing total revenue by 15% compared to the previous year.
By implementing dynamic budget reallocation, senior marketers and growth managers can ensure their performance marketing spend is always optimized for maximum impact, driving sustained revenue growth with agility and precision.
4.5 Case Study: Improving ROAS with Attribution-Driven Decisions
Overview
This case study explores how a mid-sized e-commerce company improved its Return on Ad Spend (ROAS) by leveraging attribution modeling to make data-driven marketing decisions. By shifting from a last-click attribution model to a multi-touch attribution approach, the company optimized budget allocation across channels and touchpoints, resulting in a 35% increase in ROAS within six months.
Background
- Company: TrendyGear, an online retailer specializing in outdoor apparel and accessories.
- Challenge: Despite increasing ad spend, ROAS was stagnating. Marketing teams relied heavily on last-click attribution, which undervalued upper-funnel channels like display and social awareness campaigns.
- Goal: Improve ROAS by better understanding the true contribution of each marketing touchpoint.
Step 1: Audit Existing Attribution Model
- Current Model: Last-click attribution.
- Issues Identified:
- Overinvestment in paid search due to last-click bias.
- Underinvestment in display and social channels that drove awareness.
- Lack of visibility into multi-channel customer journeys.
Step 2: Implement Multi-Touch Attribution (MTA)
- Model Chosen: Time-decay multi-touch attribution to give more credit to recent touchpoints but still recognize earlier interactions.
- Data Sources Integrated:
- Google Analytics
- CRM data
- Paid media platforms (Facebook Ads, Google Ads)
Step 3: Analyze Attribution Data
- Insights Gained:
- Display ads contributed significantly to early-stage engagement.
- Paid search was effective for closing but less so for initial interest.
- Email marketing played a crucial role in nurturing leads.
Step 4: Optimize Budget Allocation
- Actions Taken:
- Increased budget for display and social awareness campaigns by 25%.
- Maintained paid search spend but refined keyword targeting.
- Enhanced email marketing automation to capitalize on nurturing insights.
Step 5: Monitor and Iterate
- Results after 6 months:
- ROAS improved by 35%.
- Customer acquisition cost (CAC) decreased by 15%.
- Higher engagement rates in upper-funnel channels.
Mind Maps
Mind Map 1: Attribution Model Transition
Mind Map 2: Data Sources for Attribution
Mind Map 3: Budget Optimization Strategy
Examples
Example 1: Display Ads Contribution
- Before MTA: Display ads attributed 5% of conversions.
- After MTA: Display ads credited with 20% of conversions as an early touchpoint.
- Result: Budget increased, leading to higher awareness and more qualified leads.
Example 2: Email Marketing Role
- Attribution revealed email campaigns contributed to 15% of conversions through nurturing.
- Action: Automated personalized email sequences were implemented, increasing conversion rates by 10%.
Example 3: Paid Search Refinement
- Keyword analysis showed some high-cost keywords had low contribution.
- Action: Paused underperforming keywords and focused on high-intent terms.
- Result: Improved cost efficiency and conversion quality.
Key Takeaways
- Multi-touch attribution provides a more accurate picture of marketing impact.
- Data integration from multiple sources is critical for effective attribution.
- Attribution-driven budget reallocation can significantly improve ROAS.
- Continuous monitoring and iteration ensure sustained performance gains.
This case study demonstrates the power of attribution modeling in uncovering hidden value in marketing channels and driving smarter investment decisions that scale revenue effectively.
5. Revenue Operations and Attribution: Bridging Marketing and Sales
5.1 Understanding Revenue Operations and Its Impact on Marketing Analytics
Revenue Operations (RevOps) is a strategic approach that aligns marketing, sales, and customer success teams to drive predictable revenue growth through streamlined processes, unified data, and technology integration. It breaks down traditional silos and fosters collaboration to optimize the entire customer lifecycle—from lead generation to retention.
What is Revenue Operations?
- Definition: Revenue Operations is the orchestration of people, processes, and technology across revenue-generating teams to maximize efficiency and revenue growth.
- Core Functions: Data management, process optimization, technology stack integration, and performance measurement.
Why Revenue Operations Matters for Marketing Analytics
Marketing analytics traditionally focuses on channel performance, campaign ROI, and lead generation metrics. However, without RevOps, these insights often remain isolated, limiting their impact on overall revenue growth. RevOps bridges this gap by:
- Providing a holistic view of the customer journey across departments.
- Ensuring data consistency and integrity across marketing, sales, and customer success platforms.
- Enabling attribution models that connect marketing efforts directly to revenue outcomes.
- Facilitating cross-functional collaboration to act on insights quickly.
Mind Map: Revenue Operations Overview
Impact of Revenue Operations on Marketing Analytics
-
Unified Data Infrastructure
- Example: A SaaS company integrates Salesforce CRM with HubSpot Marketing Automation and Gainsight for customer success, creating a single source of truth.
- Benefit: Marketing analytics can now track leads from first touch through renewal, improving attribution accuracy.
-
Improved Attribution Models
- Example: By collaborating with sales, marketing adjusts multi-touch attribution weights to reflect the influence of sales demos and follow-ups.
- Benefit: Marketing teams better understand which campaigns truly drive closed revenue.
-
Faster Decision-Making and Optimization
- Example: Weekly RevOps meetings review pipeline velocity and campaign performance, enabling quick budget reallocations.
- Benefit: Marketing campaigns become more agile and revenue-focused.
-
Enhanced Forecasting and Reporting
- Example: Revenue Operations builds dashboards combining marketing leads, sales pipeline, and customer churn data.
- Benefit: Senior marketers gain a clear picture of revenue impact and can forecast growth more reliably.
Mind Map: RevOps Impact on Marketing Analytics
Real-World Example: Subscription Software Company
Challenge: Marketing was generating many leads, but sales conversion rates were low and revenue growth was stagnant. Attribution models showed inconsistent results due to disconnected data sources.
RevOps Solution:
- Integrated marketing and sales data into a unified CRM.
- Established a shared attribution model reflecting both marketing touchpoints and sales activities.
- Created joint KPIs and dashboards for marketing and sales teams.
Outcome:
- Marketing campaigns were optimized based on revenue impact rather than lead volume.
- Sales teams prioritized leads with higher marketing engagement scores.
- Revenue grew by 25% over six months with improved pipeline visibility.
Summary
Revenue Operations is essential for senior marketers and growth managers aiming to leverage marketing analytics for true revenue impact. By aligning teams, unifying data, and optimizing processes, RevOps transforms marketing analytics from isolated metrics into actionable insights that drive scalable revenue growth.
5.2 Aligning Attribution Models with Sales Funnel Metrics
Aligning attribution models with sales funnel metrics is critical for senior marketers and growth managers aiming to connect marketing efforts directly to revenue outcomes. By integrating attribution insights with the stages of the sales funnel, organizations can better understand which marketing touchpoints drive prospects through each funnel stage, optimize resource allocation, and ultimately accelerate revenue growth.
Understanding the Sales Funnel and Its Metrics
The sales funnel typically consists of the following stages, each with associated metrics:
- Awareness: Impressions, Reach, Website Visits
- Interest: Click-Through Rate (CTR), Engagement, Time on Site
- Consideration: Leads Generated, Marketing Qualified Leads (MQLs), Demo Requests
- Intent: Sales Qualified Leads (SQLs), Proposal Requests
- Evaluation: Negotiations, Trial Usage
- Purchase: Closed Deals, Revenue
Each stage has unique KPIs that reflect prospect movement and engagement.
Why Align Attribution Models with Sales Funnel Metrics?
- Improved Visibility: Understand which marketing channels and touchpoints influence each funnel stage.
- Optimized Budgeting: Allocate spend towards channels that effectively move leads down the funnel.
- Enhanced Collaboration: Bridge marketing and sales teams with shared metrics and goals.
- Revenue Impact: Directly link marketing activities to revenue outcomes.
Mind Map: Aligning Attribution Models with Sales Funnel Metrics
Practical Example: B2B SaaS Company
Scenario: A SaaS company wants to understand how their marketing efforts contribute to moving prospects through the funnel from awareness to purchase.
-
Step 1: Implement a multi-touch attribution model that assigns credit to all touchpoints but weights them differently based on funnel stage.
-
Step 2: Map marketing touchpoints to funnel metrics:
- Social media ads and blog posts (Awareness)
- Email drip campaigns (Interest)
- Webinars and demo requests (Consideration)
- Sales calls and proposal emails (Intent)
- Closing discounts and onboarding (Purchase)
-
Step 3: Analyze attribution data alongside funnel metrics:
- Discover that social media ads generate 40% of first touches but only 10% of MQLs.
- Email campaigns have a high engagement rate and contribute 35% of MQLs.
- Webinars and demos drive 50% of SQLs.
- Sales outreach closes 70% of deals.
-
Step 4: Optimize budget by increasing spend on email campaigns and webinars, while refining social media targeting to improve lead quality.
Mind Map: Example Attribution-Funnel Alignment for B2B SaaS
Best Practice: Integrate CRM and Marketing Automation Data
To effectively align attribution with funnel metrics, integrate your CRM system with marketing automation platforms. This allows:
- Tracking of lead progression through funnel stages.
- Attribution data to be enriched with sales activity and outcomes.
- Creation of unified dashboards combining marketing touchpoints and sales metrics.
Example: Using Salesforce CRM integrated with HubSpot Marketing Automation to track MQL to SQL conversion and attribute marketing touchpoints accordingly.
Summary
Aligning attribution models with sales funnel metrics empowers senior marketers and growth managers to:
- Gain granular insights into how marketing drives funnel progression.
- Make data-driven decisions to optimize campaigns and budgets.
- Foster alignment between marketing and sales teams.
- Ultimately, scale revenue by focusing on the most impactful marketing activities at each funnel stage.
This alignment is a foundational step in building a performance marketing strategy that is both accountable and growth-oriented.
5.3 Tracking Revenue Impact Across Customer Lifecycle
Tracking revenue impact across the customer lifecycle is essential for understanding how marketing efforts contribute to business growth at every stage—from initial awareness to long-term retention. By mapping revenue attribution to each phase of the customer journey, senior marketers and growth managers can optimize spend, improve customer experience, and ultimately scale revenue more effectively.
Understanding the Customer Lifecycle Stages
The customer lifecycle typically includes the following stages:
- Awareness: Potential customers discover your brand or product.
- Consideration: Prospects evaluate your offerings against competitors.
- Conversion: Prospects become paying customers.
- Retention: Customers continue to engage and make repeat purchases.
- Advocacy: Loyal customers promote your brand to others.
Why Track Revenue Impact Across These Stages?
- Holistic View: Understand how marketing channels influence revenue beyond just the point of sale.
- Optimized Budgeting: Allocate budgets to channels and tactics that drive value at each lifecycle stage.
- Improved Customer Experience: Tailor messaging and offers based on lifecycle stage to increase lifetime value (LTV).
Mind Map: Revenue Impact Across Customer Lifecycle
Tracking Techniques and Metrics at Each Stage
| Lifecycle Stage | Key Metrics | Tracking Techniques | Example Scenario |
|---|---|---|---|
| Awareness | Impressions, Reach, CTR | Brand lift studies, UTM parameters, social listening | A travel brand runs display ads to increase awareness, tracking impressions and CTR to gauge interest. |
| Consideration | Engagement rate, Time on site, Lead form submissions | Retargeting pixels, email open/click rates | An e-commerce company uses retargeting ads and email sequences to nurture visitors who browsed products but didn’t purchase. |
| Conversion | Conversion rate, Cost per acquisition (CPA), Revenue | CRM integration, purchase tracking, attribution models | A SaaS company tracks trial signups and upgrades to paid plans, attributing revenue to paid search campaigns. |
| Retention | Repeat purchase rate, Churn rate, Customer lifetime value (CLV) | Loyalty program data, subscription analytics | A subscription box service monitors renewal rates and CLV to optimize retention campaigns. |
| Advocacy | Referral rate, Net promoter score (NPS), Social shares | Referral program tracking, surveys, social media analytics | A fintech startup measures referral conversions and NPS to assess advocacy-driven revenue. |
Example: Tracking Revenue Impact in a Subscription Business
Scenario: A subscription-based meal delivery service wants to understand how its marketing efforts impact revenue throughout the customer lifecycle.
- Awareness: They run social media ads targeting health-conscious consumers, tracking impressions and engagement.
- Consideration: Prospects receive email drip campaigns with testimonials and discount offers, tracked via email analytics.
- Conversion: The company tracks new subscriptions via CRM and attributes them to specific campaigns using multi-touch attribution.
- Retention: They monitor subscription renewals and send personalized offers based on customer preferences.
- Advocacy: Referral programs incentivize customers to invite friends, with referral conversions tracked in the system.
By integrating data from marketing platforms, CRM, and subscription management software, the company maps revenue back to each lifecycle stage, identifying that retention campaigns yield the highest ROI, prompting increased investment in personalized offers.
Mind Map: Data Sources for Tracking Revenue Impact
Best Practice: Integrate Cross-Functional Data for Full Lifecycle Attribution
To accurately track revenue impact, integrate data across marketing, sales, and customer success teams. This unified view enables:
- Attribution of revenue to marketing touchpoints beyond the last click.
- Identification of bottlenecks or drop-off points in the lifecycle.
- Data-driven decisions to optimize campaigns for maximum revenue impact.
Summary
Tracking revenue impact across the customer lifecycle empowers marketers and growth managers to:
- Understand the true value of each marketing channel and tactic.
- Optimize spend and messaging for every stage.
- Drive sustainable revenue growth by focusing on customer retention and advocacy.
This comprehensive approach ensures marketing efforts are aligned with revenue goals and customer experience, creating a virtuous cycle of growth.
5.4 Best Practice: Cross-Departmental Collaboration for Unified Reporting
In today’s fast-paced subscription business environment, aligning marketing and sales teams through unified reporting is crucial for maximizing revenue and improving customer experience. Cross-departmental collaboration ensures that both teams speak the same language, share consistent data, and work toward common goals.
Why Cross-Departmental Collaboration Matters
- Eliminates Silos: Marketing and sales often operate in silos, leading to misaligned KPIs and duplicated efforts.
- Improves Data Accuracy: Unified reporting reduces discrepancies in lead and revenue attribution.
- Accelerates Decision-Making: Shared insights enable faster optimization of campaigns and sales strategies.
- Enhances Customer Journey Understanding: Both teams get a holistic view of customer touchpoints and lifecycle stages.
Key Components of Unified Reporting in a Subscription Business
Steps to Achieve Marketing and Sales Alignment
-
Define Shared Goals and KPIs
- Example: Both teams agree on MQL to SQL conversion rate and subscription revenue targets.
-
Integrate Data Systems
- Connect CRM (e.g., Salesforce) with marketing automation (e.g., HubSpot) to ensure seamless data flow.
-
Develop Unified Dashboards
- Use BI tools like Tableau or Looker to create dashboards accessible to both teams.
-
Establish Regular Communication Cadence
- Weekly sync meetings to review pipeline status, campaign performance, and attribution insights.
-
Implement Closed-Loop Reporting
- Track leads from first marketing touch through sales conversion and subscription renewal.
Example: Marketing and Sales Alignment in a Subscription Business
Scenario: A SaaS company offering a project management tool wants to improve its subscription revenue by aligning marketing and sales reporting.
- Shared Goal: Increase MQL to paying subscriber conversion by 15% in 6 months.
- Unified KPIs: MQL count, SQL count, demo requests, subscription sign-ups, churn rate.
- Data Integration: Marketing automation platform tracks campaign engagement and passes leads to CRM.
- Unified Dashboard: Shows funnel metrics, campaign ROI, and revenue attribution.
- Outcome: Sales provides feedback on lead quality, marketing adjusts targeting, resulting in a 20% increase in conversions.
Mind Map: Unified Reporting Workflow Example
Tips for Successful Collaboration
- Create a Shared Glossary: Define terms like MQL, SQL, churn, and CLV to avoid confusion.
- Use Attribution Models Together: Agree on multi-touch attribution to fairly credit marketing and sales efforts.
- Leverage Revenue Operations Role: A dedicated RevOps team can bridge gaps and manage data consistency.
- Celebrate Joint Wins: Recognize successes that result from collaboration to build team morale.
Cross-departmental collaboration for unified reporting is not just a technical integration but a cultural shift. When marketing and sales teams align their data, goals, and communication, subscription businesses can unlock powerful insights that drive sustainable revenue growth.
5.5 Case Study: Revenue Operations Enhancing Attribution Accuracy
Overview
This case study explores how a mid-sized B2B SaaS company leveraged Revenue Operations (RevOps) to significantly enhance the accuracy of their marketing attribution models, resulting in improved marketing ROI and better alignment between marketing and sales teams.
Background
The company was struggling with inconsistent attribution data, leading to misallocated budgets and unclear insights into which marketing efforts truly drove revenue. Their marketing and sales teams operated in silos, with fragmented data sources and limited visibility into the full customer journey.
RevOps Approach to Enhancing Attribution Accuracy
Key Objectives:
- Unify marketing, sales, and customer data into a single source of truth.
- Implement a multi-touch attribution model aligned with the sales funnel.
- Improve data quality and tracking consistency.
- Foster cross-functional collaboration to interpret and act on attribution insights.
Mind Map: Revenue Operations Enhancing Attribution Accuracy
Step 1: Data Integration and Centralization
The RevOps team started by integrating disparate data sources:
- CRM Consolidation: Migrated all sales data into Salesforce.
- Marketing Automation Sync: Connected HubSpot marketing data with Salesforce to track leads through the funnel.
- Data Warehouse Setup: Established a Snowflake data warehouse to centralize and clean data for analysis.
Example: Before integration, marketing tracked leads separately from sales outcomes. Post-integration, the company could trace each lead from first touch to closed deal.
Step 2: Attribution Model Implementation
The team chose a custom multi-touch attribution model that assigned weights based on the stage of the funnel:
- Early touches (awareness campaigns) received 20% weight.
- Mid-funnel touches (product demos, webinars) received 50% weight.
- Last touches (free trial signups, pricing page visits) received 30% weight.
Example: A lead who first engaged via a blog post (early touch), attended a webinar (mid touch), and then signed up for a trial (last touch) had revenue credit distributed accordingly, providing a nuanced view of channel effectiveness.
Step 3: Data Quality and Tracking Enhancements
To ensure accuracy, RevOps standardized tracking:
- Enforced consistent use of UTM parameters across campaigns.
- Automated daily data audits to identify missing or inconsistent data.
- Implemented error correction workflows to fix data issues promptly.
Example: A campaign that previously had 15% of leads missing source data was reduced to under 2% missing data after these improvements.
Step 4: Cross-Functional Collaboration
Regular weekly meetings between marketing, sales, and RevOps ensured alignment:
- Shared dashboards in Tableau provided real-time attribution insights.
- Teams jointly defined KPIs tied to revenue impact.
- Feedback loops allowed continuous refinement of attribution models.
Example: Sales team input helped adjust touchpoint weights to better reflect deal-closing activities.
Results and Impact
- Attribution Accuracy: Improved by 40%, as validated by incremental revenue analysis.
- Budget Optimization: Marketing reallocated 25% of budget to higher-performing channels identified through improved attribution.
- Revenue Growth: Achieved a 15% increase in marketing-influenced revenue within six months.
- Team Alignment: Enhanced collaboration reduced friction and improved campaign responsiveness.
Summary Mind Map: Outcomes
Key Takeaways for Senior Marketers and Growth Managers
- Invest in RevOps: Centralizing data and processes is critical for attribution accuracy.
- Customize Attribution Models: Tailor weights to your sales funnel for better insights.
- Ensure Data Quality: Standardize tracking and audit data regularly.
- Foster Collaboration: Break down silos to align marketing and sales around revenue goals.
- Leverage Technology: Use integrated CRM, marketing automation, and BI tools to enable data-driven decisions.
This case study demonstrates how Revenue Operations can be a powerful enabler in refining attribution models, ultimately driving smarter budget decisions and scalable revenue growth.
6. Advanced Attribution Techniques and Technologies
6.1 Machine Learning and AI in Attribution Modeling
Machine Learning (ML) and Artificial Intelligence (AI) are revolutionizing attribution modeling by enabling marketers to analyze complex customer journeys and assign credit more accurately than traditional rule-based models. These technologies leverage vast amounts of data to uncover hidden patterns, predict outcomes, and optimize marketing spend dynamically.
What is Machine Learning and AI in Attribution?
- Machine Learning: Algorithms that learn from historical data to make predictions or decisions without explicit programming.
- Artificial Intelligence: Broader concept including ML, enabling machines to simulate human intelligence, such as reasoning and problem-solving.
In attribution modeling, ML and AI analyze multi-touchpoint data to determine the true contribution of each marketing channel or interaction toward conversion.
Why Use ML and AI for Attribution?
- Handle complex, non-linear customer journeys with multiple touchpoints.
- Adapt to changing consumer behaviors and marketing environments.
- Provide data-driven, unbiased attribution instead of relying on fixed rules.
- Enable real-time optimization of marketing campaigns.
Mind Map: Core Components of ML/AI Attribution Modeling
Common Machine Learning Models Used in Attribution
-
Markov Chain Models
- Model the probability of moving from one touchpoint to another.
- Example: An online retailer uses Markov chains to identify that email campaigns often lead to conversions after social media engagement.
-
Shapley Value Models
- Borrowed from cooperative game theory, fairly distributing credit among touchpoints.
- Example: A SaaS company uses Shapley values to quantify the contribution of webinars, paid ads, and organic search in driving signups.
-
Gradient Boosting Machines (GBM) and Random Forests
- Predict conversion likelihood based on touchpoint features.
- Example: A fintech startup trains a GBM to predict which combination of ads and emails most likely leads to loan applications.
-
Neural Networks
- Capture complex, non-linear relationships in customer journeys.
- Example: An e-commerce platform uses deep learning to model multi-device customer behavior for better attribution.
Example: Applying ML Attribution in a B2C E-commerce Campaign
Scenario: A fashion retailer runs campaigns across paid search, social media, email, and affiliate channels. Traditional last-touch attribution credits only the final channel before purchase, skewing budget allocation.
ML Approach:
- Collect multi-channel interaction data for each customer.
- Engineer features such as time between touchpoints, channel sequence, and customer demographics.
- Train a Markov Chain model to estimate the removal effect of each channel on conversion probability.
- Results show that social media and email nurture stages contribute significantly, though not last-touch.
Outcome:
- The retailer reallocates budget to nurture channels, increasing overall conversion rate by 15%.
Best Practices for Implementing ML/AI Attribution
- Start with clean, integrated data: ML models require high-quality, comprehensive datasets.
- Experiment with multiple models: No one-size-fits-all; test Markov, Shapley, and tree-based models.
- Validate with incrementality tests: Use controlled experiments to confirm model insights.
- Combine ML insights with business context: Interpret results with domain knowledge.
- Iterate and update models regularly: Consumer behavior evolves, so should your models.
Mind Map: Steps to Implement ML/AI Attribution
Final Thought
Machine Learning and AI bring a powerful edge to attribution modeling, enabling senior marketers and growth managers to unlock deeper insights and scale revenue more effectively. By embracing these technologies with best practices and continuous validation, organizations can move beyond simplistic attribution and drive truly data-driven marketing strategies.
6.2 Predictive Analytics for Revenue Forecasting
Predictive analytics leverages historical data, statistical algorithms, and machine learning techniques to forecast future outcomes. In the context of revenue forecasting, it enables marketers and revenue operations teams to anticipate sales trends, optimize budget allocation, and make data-driven decisions that drive growth.
Why Predictive Analytics Matters for Revenue Forecasting
- Improved Accuracy: Moves beyond simple trend analysis by incorporating multiple variables and complex patterns.
- Proactive Decision-Making: Enables teams to anticipate market shifts and adjust strategies before revenue dips occur.
- Resource Optimization: Helps allocate marketing spend to channels and campaigns with the highest predicted returns.
Core Components of Predictive Analytics for Revenue Forecasting
Predictive Analytics Mind Map
Example: Predictive Analytics in Action for a SaaS Company
Scenario: A SaaS company wants to forecast monthly recurring revenue (MRR) to better plan marketing spend and sales targets.
Steps:
- Data Collection: Gather historical MRR data, marketing channel spend, lead volume, and customer churn rates.
- Feature Engineering: Create features such as average deal size, lead-to-customer conversion rate, and seasonality indicators.
- Model Selection: Use a Gradient Boosting model to capture nonlinear relationships between marketing activities and revenue.
- Validation: Evaluate model accuracy using RMSE and adjust hyperparameters.
- Forecasting: Generate monthly revenue forecasts for the next 6 months.
- Action: Allocate more budget to channels predicted to drive higher revenue and adjust sales targets accordingly.
Mind Map: SaaS Revenue Forecasting Workflow
Best Practices for Implementing Predictive Analytics in Revenue Forecasting
- Start with Quality Data: Garbage in, garbage out. Ensure data is clean, consistent, and comprehensive.
- Incorporate Multiple Data Sources: Combine marketing, sales, customer, and external data for holistic insights.
- Choose the Right Model: Match model complexity to data availability and business needs.
- Regularly Retrain Models: Markets and customer behaviors change; models must evolve accordingly.
- Collaborate Across Teams: Revenue forecasting benefits from input across marketing, sales, finance, and operations.
Example: Retailer Using Time Series Forecasting for Seasonal Revenue
A retail company uses historical sales data combined with promotional calendar events to forecast revenue spikes during holidays. They apply ARIMA time series models to predict revenue and adjust inventory and marketing campaigns accordingly, resulting in a 15% increase in holiday season revenue.
Summary
Predictive analytics empowers senior marketers and growth managers to forecast revenue with greater precision, enabling smarter budget decisions and scalable growth strategies. By integrating advanced modeling techniques and cross-functional data, organizations can transform raw data into actionable revenue forecasts that drive performance marketing success.
6.3 Multi-Device and Cross-Platform Attribution Challenges
In today’s digital landscape, consumers interact with brands across multiple devices and platforms before converting. This complexity poses significant challenges for marketers aiming to accurately attribute performance marketing efforts and understand the true customer journey. In this section, we explore the key challenges of multi-device and cross-platform attribution, supported by practical examples and mind maps to visualize these complexities.
Key Challenges in Multi-Device and Cross-Platform Attribution
- Fragmented User Identity: Users often engage via different devices (mobile, desktop, tablet) and platforms (social media, search engines, email), making it difficult to unify interactions under a single user profile.
- Cross-Device Tracking Limitations: Privacy restrictions, cookie deletion, and device switching hinder the ability to track users consistently.
- Platform Silos: Each platform (e.g., Facebook Ads, Google Ads, LinkedIn) has its own attribution system, which may not integrate seamlessly, leading to inconsistent data.
- Data Integration Complexity: Combining data from multiple sources requires robust data infrastructure and reconciliation methods.
- Attribution Model Misalignment: Different platforms may use different default attribution models, complicating cross-channel performance comparisons.
Mind Map: Multi-Device and Cross-Platform Attribution Challenges
Example 1: Fragmented User Journey Across Devices
A user discovers a product via a Facebook ad on their smartphone during their commute. Later, they research the product on their desktop at home using Google Search. Finally, they receive a promotional email on their tablet and make a purchase. Without cross-device tracking, these interactions might be recorded as three separate users, attributing the conversion only to the last touchpoint (email), thus undervaluing the initial Facebook and Google touchpoints.
Mind Map: Example User Journey Across Devices
Example 2: Platform Silos Leading to Conflicting Attribution
A growth manager runs campaigns on both Google Ads and LinkedIn Ads. Google Ads uses a last-click attribution model with a 30-day window, while LinkedIn defaults to a first-touch model with a 7-day window. When analyzing performance, Google Ads reports higher conversion credit for search ads, while LinkedIn credits itself for initial awareness. Without harmonizing these models, budget allocation decisions may be skewed.
Best Practice: Implementing Unified Measurement Frameworks
- Use a Customer Data Platform (CDP) or data warehouse to centralize user data.
- Employ deterministic matching (e.g., logged-in user IDs) to unify user identities across devices.
- Leverage probabilistic matching techniques where deterministic data is unavailable.
- Standardize attribution models across platforms or use a custom multi-touch attribution model.
- Regularly audit and reconcile platform reports to identify discrepancies.
Mind Map: Best Practice for Overcoming Attribution Challenges
Example 3: Using Google Analytics 4 (GA4) for Cross-Platform Attribution
GA4 offers enhanced cross-device tracking by leveraging user IDs and machine learning to fill gaps where user identity is unknown. A growth manager at a SaaS company implemented GA4 to track users from mobile app interactions through to desktop website conversions. By integrating app and web data, they gained a holistic view of the customer journey, enabling more accurate attribution and better budget allocation.
Summary
Multi-device and cross-platform attribution challenges require a strategic approach combining technology, data integration, and standardized attribution models. By understanding these challenges and applying best practices, senior marketers and growth managers can unlock more accurate insights, optimize campaigns effectively, and ultimately scale revenue with confidence.
6.4 Best Practice: Leveraging Cloud-Based Analytics Platforms (Example: Using Google BigQuery and Looker for Attribution Insights)
In the evolving landscape of performance marketing, leveraging cloud-based analytics platforms has become a best practice for marketers aiming to gain deep, actionable attribution insights. Platforms like Google BigQuery and Looker empower marketing and revenue operations teams to process vast amounts of data efficiently, unify disparate data sources, and visualize complex attribution models with ease.
Why Use Cloud-Based Analytics Platforms for Attribution?
- Scalability: Handle large datasets from multiple channels without performance degradation.
- Integration: Seamlessly connect with various marketing tools, CRMs, and data sources.
- Real-Time Analysis: Access up-to-date data to make timely marketing decisions.
- Advanced Analytics: Utilize SQL queries, machine learning integrations, and custom modeling.
- Collaboration: Share dashboards and reports easily across teams.
Example Scenario: Using Google BigQuery and Looker for Attribution Insights
Imagine a mid-sized e-commerce company running campaigns across paid search, social media, email marketing, and affiliate channels. They want to implement a multi-touch attribution model to understand how each channel contributes to conversions and revenue.
Step 1: Data Collection and Storage in BigQuery
- Import raw event data from Google Ads, Facebook Ads, email platforms, and website analytics into BigQuery.
- Use scheduled data pipelines (e.g., via Google Cloud Dataflow or third-party ETL tools) to keep data fresh.
Step 2: Data Transformation and Attribution Modeling
- Write SQL queries in BigQuery to:
- Clean and normalize data.
- Identify user sessions and touchpoints.
- Apply a weighted multi-touch attribution model (e.g., linear or time-decay).
Step 3: Visualization and Reporting in Looker
- Connect Looker to BigQuery as the data source.
- Build custom dashboards showing:
- Channel contribution to conversions.
- Revenue attributed per channel.
- Trends over time.
- Enable filters for date ranges, campaigns, and customer segments.
Mind Map: Leveraging Cloud-Based Analytics Platforms for Attribution
Practical Tips and Best Practices
-
Design a Robust Data Schema: Organize your data in BigQuery with clear tables for raw events, user profiles, and attribution results to simplify querying.
-
Automate Data Pipelines: Use tools like Google Cloud Composer or third-party ETL platforms to automate data ingestion and transformation, ensuring data freshness.
-
Leverage LookML Modeling: In Looker, use LookML to create reusable data models that encapsulate attribution logic, making dashboards easier to maintain.
-
Implement Access Controls: Secure sensitive marketing and customer data by configuring user permissions in both BigQuery and Looker.
-
Iterate Attribution Models: Use BigQuery’s flexibility to test different attribution models (e.g., first-touch, last-touch, linear, algorithmic) and compare results.
Additional Example: Campaign Optimization Using Attribution Insights
After setting up BigQuery and Looker:
- The marketing team discovers that social media contributes to 40% of assisted conversions but only 20% of last-click conversions.
- They decide to increase budget allocation to social media for upper-funnel awareness campaigns.
- Using Looker dashboards, they monitor the impact weekly and adjust bids dynamically.
This data-driven approach leads to a 15% increase in overall revenue within three months.
Summary
Leveraging cloud-based analytics platforms like Google BigQuery and Looker enables senior marketers and growth managers to:
- Centralize and unify marketing data from multiple sources.
- Build sophisticated attribution models with SQL and data transformations.
- Visualize and share actionable insights through interactive dashboards.
- Make informed decisions that scale revenue efficiently.
Adopting these technologies is a critical step toward a mature, data-driven performance marketing strategy.
6.5 Case Study: Implementing AI-Driven Attribution in a Fintech Startup
Background
Fintech startups operate in a highly competitive environment where customer acquisition costs are high and marketing budgets are often limited. Our case study focuses on “FinEdge,” a fast-growing fintech startup specializing in personal finance management apps. FinEdge sought to optimize their marketing spend and improve revenue attribution accuracy by implementing an AI-driven attribution model.
Challenges Faced
- Complex Customer Journeys: Users interacted with multiple channels including social media ads, email campaigns, referral programs, and organic search before converting.
- Data Silos: Marketing data was scattered across platforms like Google Ads, Facebook Ads, CRM, and email marketing tools.
- Attribution Accuracy: Traditional last-touch attribution was over-crediting paid search, undervaluing upper-funnel channels.
- Limited Resources: Small marketing team needed scalable, automated solutions.
Objectives
- Implement an AI-driven multi-touch attribution model to accurately assign credit across all touchpoints.
- Integrate data sources for a unified view.
- Use attribution insights to optimize budget allocation and increase customer acquisition ROI.
Implementation Steps
Mind Map: AI-Driven Attribution Implementation at FinEdge
AI-Driven Attribution Model Explained
FinEdge used a supervised machine learning model that analyzed the sequence and timing of customer interactions to assign fractional credit to each touchpoint. The model considered:
- Channel type (paid social, paid search, email, referral)
- Time decay (recent interactions weighted more heavily)
- Interaction order
- Conversion probability uplift per touchpoint
Example: A user who clicked a Facebook ad, then received an email, and finally converted via paid search would have conversion credit split across all three, weighted by their influence.
Example Attribution Output
| Touchpoint | Credit Assigned |
|---|---|
| Facebook Ad | 40% |
| Email Campaign | 25% |
| Paid Search | 35% |
This contrasted with the previous last-touch model that assigned 100% credit to Paid Search.
Results and Impact
- Improved Budget Allocation: FinEdge shifted 30% of their budget from paid search to Facebook and email campaigns, increasing overall conversions by 18%.
- Increased ROI: Customer acquisition cost (CAC) decreased by 12%.
- Enhanced Team Efficiency: Automated reporting freed up 20% of marketing analysts’ time.
- Cross-Functional Alignment: Sales and marketing teams used shared dashboards to track revenue impact.
Lessons Learned & Best Practices
Mind Map: Key Takeaways from FinEdge AI Attribution
Final Thoughts
The FinEdge case study exemplifies how AI-driven attribution can transform marketing analytics in fintech startups by providing nuanced insights into customer journeys and enabling smarter revenue scaling decisions. Senior marketers and growth managers can replicate this approach by prioritizing data integration, leveraging machine learning models, and fostering collaboration across revenue operations teams.
7. Scaling Revenue Through Performance Marketing
7.1 Identifying Scalable Marketing Channels Using Attribution Data
Identifying scalable marketing channels is a critical step for senior marketers and growth managers aiming to maximize revenue growth efficiently. Attribution data provides a granular view of how different channels contribute to conversions and revenue, enabling data-driven decisions on where to invest and scale.
Understanding Scalability in Marketing Channels
Scalability refers to the ability of a marketing channel to increase output (leads, conversions, revenue) without a proportional increase in cost or loss of efficiency. Not all channels scale equally — some saturate quickly, others require heavy manual effort, and some have diminishing returns.
Attribution data helps identify channels that consistently deliver high return on ad spend (ROAS) and contribute meaningfully across the customer journey.
Using Attribution Data to Evaluate Channels
Attribution models (first-touch, last-touch, multi-touch, algorithmic) assign credit to marketing touchpoints differently. Leveraging these models allows marketers to:
- Understand which channels initiate interest (top of funnel).
- Identify channels that close sales (bottom of funnel).
- Recognize channels that assist or nurture leads (middle of funnel).
By analyzing these insights, marketers can pinpoint channels with strong performance and potential for scaling.
Mind Map: Key Steps to Identify Scalable Channels Using Attribution Data
Example 1: E-commerce Brand Using Multi-Touch Attribution to Scale Paid Social
An e-commerce company used a multi-touch attribution model to analyze their marketing channels. They found that paid social ads were often the first touchpoint, introducing new customers to the brand, while paid search was typically the last touchpoint driving conversions.
By attributing partial credit to paid social, they realized its true value in the funnel was underestimated by last-touch models. They increased investment in paid social campaigns targeting lookalike audiences and optimized creatives based on engagement data.
Result: Paid social ROAS improved by 30%, and total revenue from this channel scaled by 50% over six months.
Mind Map: Example 1 Channel Attribution Insights
Example 2: SaaS Company Leveraging Attribution to Identify High-Value Channels
A SaaS company used algorithmic attribution to understand which channels contributed most to free trial signups and eventual paid conversions. They discovered that content marketing and webinars played a significant assist role, while paid search and LinkedIn ads were more direct conversion drivers.
By reallocating budget to increase webinar frequency and content production, while optimizing paid ads for conversion, they scaled their lead pipeline without increasing CAC.
Mind Map: Example 2 Channel Roles and Scaling
Best Practices for Identifying Scalable Channels
- Use multi-touch or algorithmic attribution to capture the full customer journey.
- Combine quantitative attribution data with qualitative insights (e.g., customer feedback).
- Segment attribution analysis by customer cohorts to identify channel effectiveness by audience.
- Continuously test channel scalability with incremental budget increases.
- Monitor diminishing returns and saturation points closely.
By systematically leveraging attribution data, senior marketers and growth managers can confidently identify and scale marketing channels that drive sustainable revenue growth.
7.2 Automating Campaign Optimization for Growth
Automation in campaign optimization is a game-changer for scaling performance marketing efforts efficiently. By leveraging automation, marketers can reduce manual tasks, respond faster to data insights, and continuously improve campaign outcomes at scale.
Why Automate Campaign Optimization?
- Speed: Automation enables real-time adjustments to campaigns based on performance data.
- Consistency: Removes human error and bias from decision-making processes.
- Scalability: Manage multiple campaigns and channels simultaneously without proportional increases in resources.
- Data-Driven: Uses algorithms and rules to optimize based on actual performance metrics.
Key Components of Campaign Automation
Popular Automation Techniques
-
Rule-Based Automation:
- Example: Automatically increasing bids by 10% on keywords with a conversion rate above 5%.
- Use Case: An e-commerce brand sets rules in Google Ads to pause underperforming ads and increase spend on top performers daily.
-
AI and Machine Learning Optimization:
- Example: Facebook’s Campaign Budget Optimization (CBO) automatically distributes budget across ad sets to maximize results.
- Use Case: A SaaS company uses AI-driven platforms like Adext or Albert to optimize multi-channel campaigns, improving lead generation by 30%.
-
Dynamic Creative Optimization (DCO):
- Example: Automatically tailoring ad creatives based on user behavior and demographics.
- Use Case: A travel company uses DCO to show personalized destination ads, increasing CTR by 25%.
-
Automated A/B Testing:
- Example: Running multiple creative or landing page variants and automatically scaling the best performers.
- Use Case: A subscription service uses tools like Optimizely integrated with marketing automation to optimize signup flows.
Example: Automating Campaign Optimization for a Retail Brand
A retail brand running multi-channel campaigns implemented automation to optimize their paid social and search ads.
- Step 1: Integrated Google Ads and Facebook Ads data into a centralized dashboard.
- Step 2: Set up rule-based triggers to pause ads with CPA above target and increase budget on ads with CPA below target.
- Step 3: Leveraged AI-powered bid management tools to adjust bids in real-time based on competitor activity and user engagement.
- Step 4: Used dynamic creative optimization to rotate ad creatives based on audience segments.
Result: Within 3 months, the brand saw a 20% increase in ROAS and reduced manual campaign management time by 50%.
Best Practices for Automating Campaign Optimization
Mind Map: Automation Workflow Example
Summary
Automating campaign optimization empowers senior marketers and growth managers to scale their marketing efforts efficiently while maintaining control and strategic oversight. By combining rule-based logic, AI-powered tools, and continuous monitoring, organizations can drive sustained revenue growth with less manual effort.
Actionable Tip: Start by identifying one high-impact campaign to automate using simple rules, then gradually incorporate AI and dynamic creative optimization as your confidence and data maturity grow.
7.3 Personalization and Segmentation Strategies to Maximize Revenue
In performance marketing, personalization and segmentation are powerful levers to drive higher engagement, conversion rates, and ultimately revenue. By tailoring marketing messages and offers to specific audience segments, marketers can create more relevant experiences that resonate with customers’ unique needs and behaviors.
Why Personalization and Segmentation Matter
- Improved Customer Experience: Personalized content feels more relevant and valuable.
- Higher Conversion Rates: Targeted messaging increases the likelihood of action.
- Better ROI: Marketing spend is optimized by focusing on high-potential segments.
- Increased Customer Loyalty: Relevant interactions foster long-term relationships.
Key Segmentation Strategies
-
Demographic Segmentation
- Age, gender, income, education level
- Example: A fitness brand sending different workout plans to men and women.
-
Behavioral Segmentation
- Purchase history, website interactions, engagement levels
- Example: An e-commerce site targeting repeat buyers with loyalty discounts.
-
Geographic Segmentation
- Location, climate, urban vs rural
- Example: A restaurant chain promoting seasonal menus by region.
-
Psychographic Segmentation
- Interests, values, lifestyle
- Example: A travel company offering adventure packages to thrill-seekers.
-
Technographic Segmentation
- Device usage, software preferences
- Example: A SaaS company customizing onboarding flows based on user device.
Personalization Tactics
- Dynamic Content: Website or email content that changes based on user data.
- Product Recommendations: Suggesting relevant products based on browsing or purchase history.
- Personalized Offers: Discounts or promotions tailored to segment preferences.
- Triggered Messaging: Automated emails or notifications based on user actions.
Mind Map: Segmentation and Personalization Framework
Example 1: E-Commerce Brand Boosting Revenue Through Behavioral Segmentation
An online fashion retailer segmented its customers based on purchase frequency and average order value. They created three segments:
- High-Value Repeat Buyers: Received exclusive early access to new collections.
- Occasional Buyers: Targeted with personalized discounts on categories browsed.
- First-Time Buyers: Sent welcome series with style guides and incentives.
This segmentation and tailored messaging increased repeat purchases by 25% and overall revenue by 18% within three months.
Example 2: SaaS Company Using Technographic Segmentation for Onboarding
A SaaS company noticed users on mobile devices had lower activation rates. They segmented users by device type and personalized onboarding emails:
- Mobile users received shorter, mobile-optimized tutorials.
- Desktop users got detailed walkthroughs with advanced tips.
This personalization increased mobile user activation by 30%, contributing to higher subscription revenue.
Best Practices for Implementing Personalization and Segmentation
- Leverage Data Sources: Combine CRM, website analytics, and third-party data for richer segments.
- Test and Iterate: Use A/B testing to refine personalized content and offers.
- Respect Privacy: Ensure compliance with data regulations and be transparent with users.
- Automate Where Possible: Use marketing automation platforms to scale personalized campaigns.
Mind Map: Best Practices for Personalization
By strategically applying segmentation and personalization, senior marketers and growth managers can unlock new revenue streams and maximize the impact of their performance marketing efforts.
7.4 Best Practice: Using Attribution to Drive Customer Lifetime Value (CLV) Focused Campaigns
Customer Lifetime Value (CLV) is a critical metric for performance marketers and growth managers, especially in subscription-based businesses where retention and recurring revenue are key. Leveraging attribution modeling to optimize campaigns with a CLV focus allows marketers to allocate budget and efforts toward channels and touchpoints that not only drive acquisition but also maximize long-term revenue.
Why Focus on CLV in Attribution?
- Traditional attribution models often emphasize immediate conversions.
- CLV-focused attribution shifts the lens to long-term value generated by customers.
- Helps identify marketing activities that contribute to retention, upsells, and cross-sells.
Mind Map: Attribution to Drive CLV-Focused Campaigns
Step-by-Step Example: Subscription Service Optimizing Retention Campaigns
Scenario: A subscription-based streaming service wants to improve customer retention and increase CLV by optimizing their marketing campaigns using attribution insights.
-
Data Integration:
- Collect touchpoint data from acquisition channels (paid search, social ads, email).
- Integrate subscription renewal and engagement data from CRM.
-
Attribution Model Selection:
- Use a multi-touch attribution model with time-decay weighting to emphasize recent touchpoints leading to renewals.
-
Analysis:
- Identify which channels and campaigns contribute most to customers who renew multiple times.
- Example finding: Email campaigns triggered post-trial have a high impact on 2nd and 3rd renewal rates.
-
Campaign Adjustment:
- Increase budget and creative focus on email nurture sequences.
- Personalize messaging based on user behavior (e.g., binge-watching patterns).
-
Measurement:
- Track CLV segmented by acquisition channel and retention campaign.
- Monitor uplift in renewal rates and average revenue per user (ARPU).
-
Iterate:
- Use A/B testing on messaging and timing.
- Refine attribution model with new data.
Mind Map: Campaign Optimization Based on CLV Attribution Insights
Additional Examples
-
Example 1: A meal-kit subscription company finds that customers acquired via influencer partnerships have a higher 6-month CLV. Attribution data helps them increase investment in influencer campaigns and tailor retention emails to this segment.
-
Example 2: A SaaS subscription service uses algorithmic attribution to discover that webinar attendance correlates strongly with higher CLV. They increase webinar frequency and add targeted follow-up campaigns.
Key Takeaways
- Attribution models must incorporate long-term revenue metrics like CLV to guide marketing strategy effectively.
- Multi-touch and time-decay models help highlight touchpoints influencing retention and upsell.
- Integrating CRM and subscription data is essential for accurate CLV measurement.
- Personalization and targeted retention campaigns driven by attribution insights can significantly boost revenue.
- Continuous testing and model refinement ensure sustained campaign performance improvements.
By embedding CLV into your attribution strategy, senior marketers and growth managers can make smarter decisions that not only acquire customers but also nurture them for sustained revenue growth.
7.5 Case Study: Scaling Revenue in a Competitive Market with Data-Driven Marketing
Overview
In highly competitive markets, scaling revenue requires more than just increasing ad spend. It demands a strategic, data-driven approach that leverages attribution insights to optimize marketing efforts, identify growth opportunities, and maximize return on investment (ROI). This case study explores how a mid-sized e-commerce company successfully scaled revenue by integrating advanced attribution modeling with performance marketing strategies.
Company Background
- Industry: E-commerce (Fashion & Accessories)
- Market: Highly saturated with multiple direct competitors
- Goal: Increase revenue by 40% within 12 months while maintaining or improving ROAS (Return on Ad Spend)
Challenges
- Multiple marketing channels with unclear contribution to conversions
- Difficulty in allocating budget efficiently across paid search, social, and influencer marketing
- Limited visibility into customer journey touchpoints
- High customer acquisition costs due to competition
Approach: Data-Driven Marketing with Attribution Modeling
Step 1: Implement Multi-Touch Attribution Model
- Moved from last-touch to a weighted multi-touch attribution model to better understand channel contributions.
- Integrated CRM, Google Analytics, and ad platform data to create a unified view.
Step 2: Map Customer Journeys
- Identified common paths leading to purchase, including:
- Social media engagement → website visit → email nurture → purchase
- Paid search click → product page visit → retargeting ad → purchase
Step 3: Optimize Budget Allocation
- Used attribution data to reallocate budget toward high-impact channels and touchpoints.
- Reduced spend on underperforming influencer campaigns; increased investment in paid search and retargeting.
Step 4: Personalize Campaigns Based on Segmentation
- Segmented customers by behavior and purchase history.
- Created personalized ad creatives and offers for high-value segments.
Step 5: Continuous Testing and Iteration
- Ran A/B tests on messaging and channel mix.
- Monitored attribution reports weekly to adjust strategies dynamically.
Mind Map: Data-Driven Revenue Scaling Strategy
Results
- Revenue Growth: Achieved 45% increase in revenue within 12 months, surpassing the initial goal.
- ROAS Improvement: Improved ROAS by 25% through better budget allocation.
- Customer Acquisition Cost: Reduced CAC by 15% by focusing on high-performing channels.
- Customer Retention: Increased repeat purchase rate by 10% via personalized campaigns.
Key Takeaways and Best Practices
- Leverage Multi-Touch Attribution: Understanding all touchpoints helps allocate budget more effectively.
- Integrate Data Sources: Combining CRM, web analytics, and ad data provides a holistic view.
- Map Customer Journeys: Visualizing paths to purchase uncovers optimization opportunities.
- Personalize Marketing Efforts: Tailored messaging boosts engagement and retention.
- Test and Iterate Continuously: Agile adjustments based on data keep campaigns optimized.
Additional Example: Dynamic Budget Reallocation
- Initially, 40% of budget was on influencer marketing with low conversion impact.
- Attribution data revealed paid search and retargeting drove 70% of revenue.
- Budget shifted to increase paid search by 30% and retargeting by 20%, reducing influencer spend.
- Resulted in 20% uplift in conversions within 3 months.
Mind Map: Budget Reallocation Process
Conclusion
This case study demonstrates that in competitive markets, scaling revenue is achievable by adopting a data-driven marketing strategy centered on robust attribution modeling. By gaining clarity on channel performance, optimizing budget allocation, and personalizing campaigns, marketers can significantly improve revenue outcomes while maintaining efficiency and agility.
8. Measuring and Reporting Success
8.1 Key Performance Indicators (KPIs) for Attribution and Revenue Growth
In performance marketing and revenue operations, selecting the right KPIs is critical to accurately measure the effectiveness of your attribution models and the impact on revenue growth. KPIs provide actionable insights that help senior marketers and growth managers optimize campaigns, allocate budgets efficiently, and scale revenue sustainably.
Core KPIs for Attribution and Revenue Growth
- Conversion Rate: Percentage of users who complete a desired action (purchase, signup).
- Return on Ad Spend (ROAS): Revenue generated for every dollar spent on advertising.
- Customer Acquisition Cost (CAC): Total cost to acquire a new customer.
- Customer Lifetime Value (CLV or LTV): Predicted net profit attributed to the entire future relationship with a customer.
- Attribution Model Accuracy: Degree to which the chosen attribution model reflects true customer journey impact.
- Multi-Touch Attribution Metrics: Contribution percentages of each touchpoint.
- Incrementality: Additional conversions or revenue generated due to marketing efforts.
- Revenue Growth Rate: Percentage increase in revenue over a specific period.
Mind Map: KPIs for Attribution and Revenue Growth
Detailed Explanation and Examples
Conversion Rate
- Definition: The ratio of users who take a desired action to the total number of users.
- Example: An online retailer runs a Facebook ad campaign and sees 10,000 clicks leading to 500 purchases. Conversion rate = 500 / 10,000 = 5%.
- Best Practice: Track conversion rates per channel and per touchpoint to understand which interactions drive the most conversions.
Return on Ad Spend (ROAS)
- Definition: Revenue generated divided by advertising spend.
- Example: A SaaS company spends $20,000 on Google Ads and generates $100,000 in revenue from those ads. ROAS = $100,000 / $20,000 = 5.
- Best Practice: Use multi-touch attribution to assign revenue accurately across channels for precise ROAS calculation.
Customer Acquisition Cost (CAC)
- Definition: Total marketing and sales cost divided by the number of new customers acquired.
- Example: If a subscription service spends $50,000 on marketing and sales and acquires 500 customers, CAC = $50,000 / 500 = $100.
- Best Practice: Break down CAC by channel to identify the most cost-effective acquisition sources.
Customer Lifetime Value (CLV)
- Definition: The total revenue expected from a customer over their entire relationship with the company.
- Example: An e-commerce brand calculates that an average customer spends $200 annually and stays for 3 years, so CLV = $600.
- Best Practice: Use attribution data to optimize campaigns that target high-CLV customer segments.
Attribution Model Accuracy
- Definition: How well the attribution model reflects the true influence of each marketing touchpoint.
- Example: Comparing last-touch attribution results with multi-touch or algorithmic models to identify discrepancies.
- Best Practice: Regularly validate models with incrementality tests and customer feedback.
Incrementality
- Definition: The lift in conversions or revenue directly caused by marketing efforts beyond what would have happened organically.
- Example: Running a controlled experiment where one group sees an ad and another does not, measuring the difference in conversions.
- Best Practice: Use incrementality testing to validate attribution assumptions and avoid over-crediting channels.
Revenue Growth Rate
- Definition: The percentage increase in revenue over a defined period.
- Example: A company’s revenue grows from $1M to $1.2M in a quarter, growth rate = (1.2M - 1M) / 1M = 20%.
- Best Practice: Link revenue growth directly to marketing initiatives using attribution insights.
Mind Map: Example Attribution KPIs in Practice
Summary
Tracking the right KPIs is essential for understanding how marketing efforts translate into revenue. Senior marketers and growth managers should leverage a mix of conversion, financial, and attribution-specific KPIs to gain a holistic view of performance. Using clear examples and mind maps helps teams align on measurement strategies and drive data-driven decisions that scale revenue effectively.
8.2 Building Custom Dashboards for Stakeholders
Creating custom dashboards tailored to your stakeholders’ needs is essential for effective communication and decision-making in performance marketing and revenue operations. A well-designed dashboard consolidates complex attribution and revenue data into clear, actionable insights, enabling senior marketers and growth managers to quickly grasp campaign performance and identify growth opportunities.
Key Principles for Building Effective Dashboards
- Audience-Centric Design: Understand the specific needs and technical proficiency of your stakeholders (e.g., executives want high-level KPIs, analysts want granular data).
- Clarity and Simplicity: Avoid clutter; use visual hierarchy and intuitive charts.
- Real-Time or Near Real-Time Data: Ensure data freshness to enable timely decisions.
- Actionable Metrics: Focus on metrics that drive decisions, such as ROI, ROAS, customer acquisition cost (CAC), and lifetime value (LTV).
- Customization and Interactivity: Allow filtering by channel, campaign, time period, or customer segment.
Mind Map: Dashboard Design Considerations
Example: Dashboard Layout for Senior Marketers
| Section | Description | Visualization Type |
|---|---|---|
| Executive Summary | High-level KPIs: Total Revenue, ROAS, CAC | KPI Cards, Line Chart |
| Channel Performance | Revenue and conversions by channel | Bar Chart, Pie Chart |
| Attribution Insights | Multi-touch attribution impact across campaigns | Stacked Bar Chart |
| Campaign Trends | Performance trends over time | Line Chart |
| Customer Segmentation | Revenue and engagement by customer segments | Heatmap, Table |
Mind Map: Example Dashboard Components
Tools and Technologies
- Google Data Studio: Free, integrates well with Google Analytics, Ads, and BigQuery.
- Tableau: Powerful for complex visualizations and large datasets.
- Looker: Great for embedded analytics and customized reports.
- Power BI: Microsoft’s solution, strong for integration with Office 365 and Azure.
Best Practice Example: Travel Brand Multi-Channel Dashboard
A travel company built a custom dashboard integrating CRM, Google Ads, and Facebook Ads data to track multi-touch attribution and revenue impact. They included:
- Filters for campaign type (brand vs. performance)
- Visualization of customer journeys showing touchpoints leading to bookings
- Real-time ROAS updates enabling budget shifts between paid search and social
This dashboard empowered the marketing team to increase overall ROAS by 25% within 3 months by reallocating budget to the highest-performing channels identified through the dashboard.
Tips for Implementation
- Start with stakeholder interviews to identify key questions the dashboard should answer.
- Prototype with simple tools or spreadsheets before investing in complex BI platforms.
- Use consistent naming conventions and definitions to avoid confusion.
- Schedule regular reviews and updates to keep the dashboard aligned with evolving business goals.
By building custom dashboards that are intuitive, focused, and actionable, senior marketers and growth managers can harness attribution data to drive smarter marketing investments and scale revenue effectively.
8.3 Communicating Attribution Insights to Non-Technical Teams
Effectively communicating attribution insights to non-technical teams is crucial for ensuring alignment, driving informed decision-making, and maximizing the impact of marketing efforts across the organization. Senior marketers and growth managers often face the challenge of translating complex data and models into clear, actionable narratives that resonate with stakeholders such as sales teams, executives, and customer success managers.
Key Principles for Communication
- Simplicity: Avoid jargon and technical terms. Use plain language.
- Relevance: Tailor insights to the audience’s goals and concerns.
- Visualization: Use charts, graphs, and mind maps to illustrate points.
- Storytelling: Frame data within a narrative that highlights impact and next steps.
- Actionability: Focus on what the team can do with the insights.
Mind Map: Communicating Attribution Insights
Example 1: Explaining Multi-Touch Attribution to Sales Team
Scenario: Sales reps are unclear why marketing attributes revenue to multiple touchpoints rather than just the last interaction.
Approach:
- Use a simple analogy: “Think of a relay race where multiple runners pass the baton. Each runner contributes to the final win. Similarly, multiple marketing touchpoints contribute to closing a deal.”
- Show a funnel diagram highlighting how leads interact with social ads, emails, and webinars before converting.
- Present a bar chart showing revenue contribution percentages from each channel.
- Emphasize how understanding this helps sales prioritize leads nurtured through multiple channels.
Mind Map: Multi-Touch Attribution Explanation
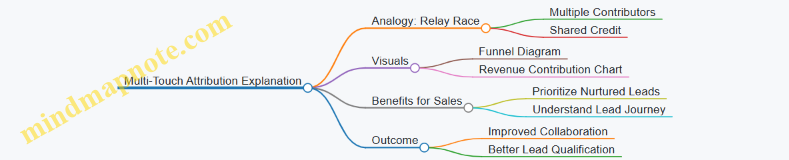
Example 2: Presenting Attribution-Driven Budget Recommendations to Executives
Scenario: Executives want to understand why budget is shifting from paid search to paid social.
Approach:
- Start with a high-level summary: “Our data shows paid social contributes 40% more to multi-touch revenue than paid search.”
- Use a pie chart comparing revenue attribution by channel.
- Highlight ROI and cost-per-acquisition (CPA) differences in a simple table.
- Tell a story about a recent campaign where reallocating budget increased overall revenue by 15%.
- End with clear recommendations and expected impact.
Mind Map: Budget Recommendation Communication
Tips for Creating Effective Visuals
- Use consistent colors to represent channels or metrics.
- Keep charts uncluttered; focus on key data points.
- Use annotations to highlight important insights.
- Incorporate interactive dashboards when possible for deeper exploration.
Final Thought
Communicating attribution insights is not just about sharing data—it’s about empowering teams to act confidently on marketing intelligence. By combining simplicity, storytelling, and visualization, senior marketers and growth managers can bridge the gap between complex analytics and everyday business decisions, fostering a culture of data-driven growth.
8.4 Best Practice: Storytelling with Data for Executive Buy-In (Example: Presenting Attribution Impact to C-suite)
Securing executive buy-in is critical for scaling performance marketing initiatives and driving revenue growth. Storytelling with data transforms complex attribution analytics into compelling narratives that resonate with C-suite leaders, enabling informed decision-making and strategic alignment.
Why Storytelling Matters for Executives
- Executives prioritize strategic impact and ROI over granular data.
- Data storytelling bridges the gap between analytics and business outcomes.
- Clear narratives help executives grasp attribution’s role in revenue growth.
Key Elements of Effective Data Storytelling
- Context: Frame the problem or opportunity clearly.
- Insight: Highlight key attribution findings that matter.
- Impact: Quantify how marketing efforts influence revenue.
- Action: Recommend next steps based on data.
Mind Map: Components of Data Storytelling for Executive Buy-In
Example Scenario: Presenting Attribution Impact to the C-suite
Company: SaaS provider aiming to increase trial signups and subscription revenue.
Objective: Demonstrate how multi-touch attribution informs budget shifts to maximize revenue.
Step 1: Set the Context
- “Our goal this quarter is to increase trial signups by 20%, focusing on channels that drive qualified leads.”
Step 2: Share Attribution Insights
- “Multi-touch attribution reveals that while paid search drives the most trial signups (40%), paid social influences 30% of conversions earlier in the funnel, nurturing leads effectively.”
Step 3: Quantify Revenue Impact
- “By reallocating 15% of the paid search budget to paid social, we project a 12% increase in overall trial signups, translating to an estimated $500K incremental ARR.”
Step 4: Recommend Actions
- “We recommend piloting this budget shift in Q3, coupled with enhanced tracking to measure incremental lift.”
Step 5: Visualize Data
- Use a simple funnel chart showing touchpoint contributions.
- Include a bar graph comparing current vs. projected trial signups by channel.
Mind Map: Presentation Flow for C-suite Attribution Impact
Tips for Effective Storytelling with Attribution Data
- Simplify complex data: Use clear, jargon-free language.
- Focus on what matters: Highlight metrics tied to revenue and growth.
- Use visuals wisely: Choose charts that tell the story at a glance (e.g., funnel charts, stacked bar graphs).
- Tell a story: Start with a challenge, present evidence, and conclude with a solution.
- Prepare for questions: Anticipate executive concerns about data accuracy and assumptions.
Additional Example: Retail Brand Attribution Presentation
- Context: Omnichannel retailer wants to justify increased spend on email marketing.
- Insight: Attribution shows email drives 25% of repeat purchases, often overlooked in last-touch models.
- Impact: Incremental revenue from email campaigns grew 18% YoY.
- Action: Propose expanding email personalization and automation.
- Visualization: Line chart showing repeat purchase growth correlated with email campaigns.
By weaving attribution insights into a narrative that aligns with executive priorities, senior marketers and growth managers can secure the support needed to optimize marketing investments and scale revenue effectively.
8.5 Case Study: Reporting Frameworks That Drive Continuous Improvement
Introduction
In performance marketing and revenue operations, reporting frameworks are essential tools that provide clarity, enable data-driven decision-making, and foster continuous improvement. This case study explores how a mid-sized SaaS company implemented a robust reporting framework to enhance attribution insights, optimize campaigns, and ultimately scale revenue.
Background
The company was facing challenges with fragmented data sources, inconsistent reporting formats, and difficulty communicating attribution insights across teams. Their marketing and sales teams struggled to align on performance metrics, which slowed down optimization cycles.
Objectives
- Establish a unified reporting framework integrating marketing attribution and revenue data.
- Create dashboards tailored for different stakeholders (executives, marketers, sales).
- Enable continuous feedback loops to improve campaign performance.
- Improve transparency and collaboration between marketing and sales.
Implementation Steps
Define Key Metrics and KPIs
The team collaborated to identify the most critical KPIs that reflect both marketing performance and revenue impact:
- Multi-touch attribution revenue contribution
- Customer Acquisition Cost (CAC)
- Return on Ad Spend (ROAS)
- Lead-to-Customer Conversion Rate
- Customer Lifetime Value (CLV)
Data Integration
They integrated CRM data (HubSpot), marketing automation (Marketo), and ad platforms (Google Ads, Facebook Ads) into a centralized data warehouse using ETL tools.
Dashboard Development
Using Looker, they built customized dashboards:
- Executive Dashboard: High-level revenue impact, CAC trends, and channel performance.
- Marketing Dashboard: Detailed attribution breakdowns, campaign performance, and A/B test results.
- Sales Dashboard: Lead quality metrics, pipeline velocity, and conversion rates.
Establish Reporting Cadence
Weekly and monthly reports were automated and shared with relevant teams. Quarterly deep-dive sessions were scheduled to review trends and adjust strategies.
Feedback and Iteration
Feedback loops were established where teams could suggest new metrics or report formats, ensuring the framework evolved with business needs.
Mind Map: Reporting Framework Components
Example: Marketing Dashboard Snapshot
| Metric | Current Period | Previous Period | % Change |
|---|---|---|---|
| Multi-Touch Attribution Rev | $1,200,000 | $1,000,000 | +20% |
| CAC | $150 | $170 | -11.8% |
| ROAS | 5.0x | 4.2x | +19% |
| Lead-to-Customer Conversion | 12% | 10% | +20% |
This dashboard enabled marketers to quickly identify that their optimized channel mix improved ROAS and reduced CAC.
Continuous Improvement in Action
- A/B Testing Integration: The framework incorporated A/B test results directly into dashboards, allowing teams to correlate test outcomes with revenue impact.
- Real-Time Alerts: Automated alerts were set up to notify teams when KPIs deviated significantly, enabling rapid response.
- Cross-Functional Collaboration: Regular meetings fostered alignment, ensuring marketing campaigns were closely tied to sales pipeline health.
Mind Map: Continuous Improvement Cycle
Outcome
Within six months, the company observed:
- 25% increase in marketing-driven revenue
- 15% reduction in CAC
- Improved alignment between marketing and sales teams
- Faster decision-making cycles
The reporting framework became the backbone for strategic planning and operational excellence.
Key Takeaways
- A well-structured reporting framework bridges data silos and aligns teams.
- Tailored dashboards for different stakeholders improve communication and focus.
- Continuous feedback loops ensure the framework evolves with business needs.
- Integrating attribution data with revenue metrics drives smarter marketing investments.
Final Thought
For senior marketers and growth managers, investing time and resources into building a comprehensive reporting framework is critical. It not only illuminates the path to revenue scaling but also fosters a culture of continuous improvement and data-driven success.
9. Overcoming Common Challenges in Attribution and Revenue Scaling
9.1 Handling Data Silos and Integration Issues
In the realm of performance marketing and revenue operations, data silos and integration challenges are among the most common obstacles that senior marketers and growth managers face. Data silos occur when information is isolated within different departments, platforms, or tools, preventing a unified view of customer journeys and marketing performance. Integration issues arise when disparate systems cannot communicate effectively, leading to incomplete or inconsistent data.
Why Data Silos and Integration Issues Matter
- Fragmented Customer Insights: Without integrated data, understanding the full customer journey becomes impossible.
- Inefficient Decision Making: Marketing decisions based on partial data can lead to misallocated budgets and missed opportunities.
- Reporting Challenges: Consolidated reporting is difficult, making it hard to measure true campaign ROI.
Mind Map: Causes of Data Silos and Integration Issues
Best Practices to Handle Data Silos and Integration Issues
Conduct a Data Audit and Map Your Data Sources
- Identify all platforms and tools used across marketing, sales, and revenue operations.
- Document what data each system collects and how it is stored.
Example: A B2B SaaS company discovered their CRM, email marketing platform, and web analytics tool were not integrated. By mapping data flows, they identified gaps in lead tracking.
Establish a Centralized Data Warehouse or Data Lake
- Use cloud-based solutions like Google BigQuery, Snowflake, or AWS Redshift to consolidate data.
- Centralization allows for unified querying and reporting.
Example: An e-commerce retailer integrated their Shopify sales data, Google Ads spend, and Facebook Ads performance into a Snowflake data warehouse, enabling cross-channel attribution.
Implement Data Integration Tools and Middleware
- Use ETL (Extract, Transform, Load) or ELT tools such as Fivetran, Stitch, or Zapier to automate data flows.
- Ensure data is cleaned and standardized during integration.
Example: A fintech startup automated data syncing between their CRM and marketing automation platform using Fivetran, reducing manual errors.
Define and Enforce Data Governance Policies
- Create standards for data entry, naming conventions, and update frequency.
- Assign data stewards responsible for data quality.
Example: A subscription service implemented strict UTM parameter guidelines to ensure consistent campaign tracking.
Foster Cross-Functional Collaboration
- Encourage regular meetings between marketing, sales, and analytics teams.
- Share dashboards and insights openly to break down silos.
Example: A global enterprise set up a Revenue Operations Council to align data strategies across departments.
Mind Map: Steps to Break Down Data Silos
Example Scenario: Overcoming Data Silos in a Multichannel Retailer
Challenge: A retailer used separate platforms for in-store POS data, online sales, email marketing, and paid ads. Each team reported metrics independently, leading to conflicting insights.
Solution:
- Conducted a comprehensive data audit.
- Built a centralized data warehouse integrating all sales and marketing data.
- Automated data ingestion with Stitch.
- Established a data governance committee.
- Created unified dashboards accessible to all teams.
Outcome: The retailer gained a holistic view of customer behavior, optimized marketing spend across channels, and increased revenue by 15% within six months.
Summary
Handling data silos and integration issues requires a strategic combination of technology, process improvements, and organizational alignment. By auditing data sources, centralizing storage, automating integration, enforcing governance, and fostering collaboration, senior marketers and growth managers can unlock the full potential of their performance marketing and revenue operations data.
9.2 Dealing with Attribution Bias and Incomplete Data
Attribution bias and incomplete data are two of the most significant challenges senior marketers and growth managers face when relying on attribution models to guide performance marketing strategies. Understanding these issues and implementing best practices to mitigate their impact is crucial for accurate measurement and revenue scaling.
What is Attribution Bias?
Attribution bias occurs when the credit for a conversion is disproportionately assigned to certain touchpoints over others, leading to skewed insights and suboptimal marketing decisions.
Common Types of Attribution Bias:
- Position Bias: Overvaluing the first or last touchpoint.
- Channel Bias: Favoring certain channels due to better tracking or visibility.
- Time Decay Bias: Ignoring the influence of earlier touchpoints.
What Causes Incomplete Data?
Incomplete data arises when some touchpoints or customer interactions are not tracked or recorded, often due to technical limitations, privacy restrictions, or fragmented data sources.
Common Causes:
- Ad blockers preventing tracking pixels.
- Cross-device user behavior not linked.
- Offline interactions missing from digital attribution.
- Data silos between marketing and sales systems.
Mind Map: Attribution Bias and Incomplete Data Causes & Effects
Best Practices to Mitigate Attribution Bias and Incomplete Data
Use Multi-Touch and Data-Driven Attribution Models
Multi-touch models distribute credit across multiple touchpoints, reducing the risk of position bias. Data-driven models use machine learning to assign credit based on actual impact.
Example: A B2B SaaS company moved from last-touch attribution to a data-driven model, revealing that early educational webinars significantly influenced conversions, which were previously undervalued.
Implement Incrementality Testing
Incrementality testing (or lift testing) involves running controlled experiments to measure the true impact of marketing activities beyond what attribution models show.
Example: An e-commerce brand ran a holdout test by pausing paid social ads for a segment and observed a drop in conversions, confirming the channel’s incremental value despite low attribution credit.
Integrate Cross-Device and Offline Data
Use tools and strategies to unify user data across devices and include offline interactions.
Example: A retail chain integrated point-of-sale data with digital campaigns, revealing that online ads influenced in-store purchases, which were previously untracked.
Regularly Audit and Clean Data
Ensure data quality by auditing tracking setups, fixing broken pixels, and reconciling data across platforms.
Example: A travel company discovered discrepancies between CRM and ad platform data due to missing UTM parameters, which once fixed, improved attribution accuracy.
Leverage First-Party Data and Privacy-Compliant Tracking
With increasing privacy regulations, relying on first-party data and consent-based tracking helps maintain data completeness.
Example: A subscription service enhanced its email and onsite tracking with first-party cookies, improving attribution despite third-party cookie restrictions.
Mind Map: Strategies to Address Attribution Bias & Incomplete Data
Practical Example: Overcoming Attribution Bias in a Growth Campaign
A fintech startup initially relied on last-touch attribution, attributing 80% of conversions to paid search. However, their multi-touch data-driven model revealed that content marketing and email nurture campaigns played a significant role earlier in the funnel. They ran incrementality tests by pausing paid search ads for a week and noted a smaller-than-expected drop in conversions, confirming over-attribution to paid search. By reallocating budget towards content and email, they improved overall conversion rates and customer acquisition costs.
Summary
Dealing with attribution bias and incomplete data requires a combination of sophisticated attribution models, experimental validation, comprehensive data integration, and rigorous data hygiene. Senior marketers and growth managers who proactively address these challenges can unlock more accurate insights, optimize budgets effectively, and ultimately scale revenue with confidence.
9.3 Managing Privacy Regulations and Data Compliance
In today’s data-driven marketing landscape, managing privacy regulations and ensuring data compliance is not just a legal necessity but a strategic imperative. Performance marketers and revenue operations leaders must navigate complex regulatory frameworks while maintaining effective attribution models and scaling revenue.
Understanding Key Privacy Regulations
- GDPR (General Data Protection Regulation): Applies to EU citizens’ data, emphasizing consent, data minimization, and the right to be forgotten.
- CCPA (California Consumer Privacy Act): Grants California residents rights to know, delete, and opt-out of the sale of their personal data.
- Other Regional Laws: Includes Brazil’s LGPD, Canada’s PIPEDA, and evolving US state laws.
Mind Map: Core Privacy Regulations and Their Marketing Implications
Challenges in Attribution Due to Privacy Regulations
- Reduced Data Granularity: Cookie restrictions and tracking prevention limit user-level data.
- Consent Management Complexity: Users opting out reduce available data for attribution.
- Cross-Device Tracking Limitations: Privacy rules restrict linking user behavior across devices.
Best Practices for Compliance and Effective Attribution
-
Implement Transparent Consent Management Platforms (CMPs)
- Example: A SaaS company uses a CMP that clearly informs users about tracking and obtains granular consent, ensuring compliance with GDPR.
-
Shift to First-Party Data Collection
- Example: An e-commerce brand enhances its CRM by collecting email and behavioral data directly through site interactions, reducing reliance on third-party cookies.
-
Adopt Privacy-Centric Attribution Models
- Example: Using aggregated data models that respect user privacy but still provide actionable insights.
-
Regularly Audit Data Practices
- Example: A marketing team schedules quarterly audits to ensure all data collection and processing aligns with current regulations.
-
Leverage Incrementality Testing
- Example: Running controlled experiments to measure campaign impact without relying solely on user-level tracking.
Mind Map: Compliance Best Practices for Marketers
Example: Managing Privacy in a Multi-Channel Campaign
A retail brand running paid social, search, and email campaigns faced challenges with attribution accuracy after implementing GDPR-compliant consent management. By:
- Integrating a CMP that captured explicit consent,
- Switching to server-side tracking to reduce cookie dependency,
- Using aggregated conversion data,
They maintained attribution integrity while respecting user privacy, leading to a 15% improvement in campaign ROI despite reduced data granularity.
Summary
Managing privacy regulations and data compliance requires a proactive, transparent approach that balances legal obligations with marketing effectiveness. By adopting privacy-first data strategies, leveraging compliant attribution models, and continuously monitoring data practices, senior marketers and growth managers can sustain revenue growth while building customer trust.
9.4 Best Practice: Implementing Incrementality Testing to Validate Attribution Models (Example: Controlled Experiments in Paid Media)
Incrementality testing is a critical best practice to validate and refine your attribution models. It helps marketers understand the true causal impact of their marketing efforts, distinguishing between conversions that would have happened anyway and those directly driven by campaigns.
What is Incrementality Testing?
Incrementality testing measures the additional value generated by a marketing activity beyond what would have occurred without it. Unlike traditional attribution models that assign credit based on touchpoints, incrementality testing uses controlled experiments to isolate the effect of a campaign.
Why Incrementality Testing Matters
- Validates Attribution Accuracy: Helps confirm whether your attribution model reflects reality.
- Optimizes Budget Allocation: Identifies which campaigns truly drive incremental revenue.
- Improves ROI: Prevents over-investment in channels that appear effective but aren’t truly incremental.
Step-by-Step Guide to Implement Incrementality Testing in Paid Media
Define the Objective
Clearly state what you want to measure. For example, “Determine the incremental conversions driven by Facebook Ads in Q3.”
Identify Test and Control Groups
- Test Group: Audience exposed to the paid media campaign.
- Control Group: Similar audience not exposed to the campaign.
Example: For a paid search campaign, you might exclude a random 10% of your target audience from seeing ads to serve as the control.
Select Metrics
Choose relevant KPIs such as:
- Conversions
- Revenue
- Customer Acquisition Cost (CAC)
Run the Campaign
Launch the paid media campaign targeting the test group while ensuring the control group remains unexposed.
Collect Data
Gather performance data from both groups over the test period.
Analyze Results
Calculate the difference in conversions or revenue between test and control groups to determine incrementality.
Example calculation:
Optimize Based on Insights
- Increase budget for campaigns showing high incrementality.
- Reconsider or pause campaigns with low or no incremental impact.
- Refine attribution models to better reflect true performance.
Real-World Example: Controlled Experiment for Paid Social Ads
Scenario: A retail brand wants to validate the effectiveness of their paid social ads driving online sales.
Approach:
- Randomly split the target audience into two groups.
- Expose the test group to paid social ads.
- Exclude the control group from seeing these ads.
- Track purchases over 30 days.
Results:
- Test Group Sales: $150,000
- Control Group Sales: $100,000
- Incremental Revenue: $50,000
Action:
- Increase investment in paid social ads.
- Adjust attribution model to assign higher credit to paid social touchpoints.
Common Challenges and Solutions
Summary
Incrementality testing is a powerful tool for senior marketers and growth managers to validate their attribution models and make data-driven decisions that truly scale revenue. By running controlled experiments, you gain clarity on which paid media efforts genuinely move the needle, enabling smarter budget allocation and improved marketing ROI.
9.5 Case Study: Resolving Attribution Challenges in a Global Enterprise
Background
A global consumer electronics company faced significant challenges in accurately attributing marketing performance across its diverse international markets. With multiple product lines, numerous marketing channels, and regional teams operating independently, the company struggled with data silos, inconsistent tracking, and conflicting performance reports. This led to inefficient budget allocation and missed revenue opportunities.
Key Attribution Challenges
Step 1: Centralizing Data Infrastructure
The enterprise invested in a centralized data warehouse solution using cloud technology (Google BigQuery) to unify data from CRM, ad platforms, and regional databases. This eliminated silos and created a single source of truth.
Example:
- Before: Marketing and sales teams in Europe and Asia used separate CRMs and reporting tools.
- After: All data pipelines fed into a unified warehouse with standardized schemas.
Step 2: Standardizing Tracking Protocols
The company implemented strict guidelines for UTM parameters and pixel deployment across all channels and regions.
Best Practice Example:
- Created a global UTM parameter naming convention document.
- Conducted training sessions with regional marketing teams.
- Used tag management systems (Google Tag Manager) to ensure consistent pixel firing.
Step 3: Implementing a Multi-Touch Attribution Model
To address conflicting reports, the company adopted a data-driven multi-touch attribution model that weighted touchpoints based on their contribution to conversions.
Example:
- Used historical conversion data to assign fractional credit to first touch, assist touch, and last touch.
- Integrated algorithmic attribution tools to dynamically update weights.
Step 4: Addressing Privacy and Compliance
The enterprise ensured all tracking and data collection complied with GDPR and CCPA by:
- Anonymizing user data where possible.
- Implementing consent management platforms.
- Regular audits and updates to privacy policies.
Step 5: Cross-Device and Offline Attribution
To capture the full customer journey, the company:
- Leveraged deterministic matching via logged-in user IDs across devices.
- Integrated point-of-sale data to attribute in-store purchases back to digital campaigns.
Example:
- A customer clicked a paid search ad on mobile, then purchased in-store. The system credited both touchpoints appropriately.
Results and Impact

- Marketing teams could confidently reallocate budgets to high-performing channels.
- Sales and marketing alignment improved through shared dashboards and reporting.
- The company saw a 15% increase in marketing-attributed revenue within 6 months.
Lessons Learned
- Centralized Data is Critical: Without unified data, attribution models cannot be accurate.
- Standardization Enables Scale: Consistent tracking protocols reduce errors and discrepancies.
- Privacy Must Be Proactive: Compliance is essential to maintain customer trust and avoid penalties.
- Cross-Device Attribution is a Must: Modern customer journeys span multiple devices and offline touchpoints.
- Collaboration Drives Success: Breaking down silos between regions and departments accelerates insights and action.
Summary
This global enterprise’s journey highlights how resolving attribution challenges requires a holistic approach combining technology, process standardization, compliance, and cross-functional collaboration. By implementing these best practices, senior marketers and growth managers can unlock more accurate insights, optimize spend, and ultimately scale revenue effectively across complex, multinational environments.
10. Future Trends in Performance Marketing and Attribution
10.1 The Rise of Privacy-First Attribution Models
As digital privacy regulations tighten and consumer awareness around data privacy increases, marketers and revenue operations leaders face new challenges in accurately attributing marketing performance without compromising user privacy. Privacy-first attribution models are emerging as essential frameworks that balance effective marketing measurement with compliance and respect for user data.
What Are Privacy-First Attribution Models?
Privacy-first attribution models are designed to minimize reliance on personally identifiable information (PII) and third-party cookies, instead leveraging aggregated, anonymized, or first-party data to assign credit to marketing touchpoints. These models prioritize user consent and data protection while still providing actionable insights.
Why the Shift Toward Privacy-First Models?
- Regulatory Pressure: Laws like GDPR (Europe), CCPA/CPRA (California), and others globally impose strict rules on data collection and usage.
- Browser Changes: Safari’s Intelligent Tracking Prevention (ITP) and Firefox’s Enhanced Tracking Protection limit third-party cookie tracking.
- Consumer Expectations: Increasing demand for transparency and control over personal data.
Mind Map: Drivers of Privacy-First Attribution Models
Key Approaches in Privacy-First Attribution
-
First-Party Data Utilization
- Collecting data directly from users via owned channels (website, app, CRM).
- Example: A subscription service uses its login data and on-site behavior to track user journeys without third-party cookies.
-
Aggregated and Modeled Data
- Using aggregated data sets and statistical modeling to estimate attribution without individual-level tracking.
- Example: Google’s Privacy Sandbox proposals use aggregated event measurement to attribute conversions.
-
Consent-Based Tracking
- Implementing explicit user consent mechanisms and respecting opt-outs.
- Example: An e-commerce brand uses a consent management platform (CMP) to ensure compliant data collection.
-
Incrementality Testing
- Running controlled experiments (e.g., holdout groups) to measure true marketing impact without relying on granular user data.
- Example: A fintech company runs A/B tests to isolate paid search impact on conversions.
Mind Map: Privacy-First Attribution Approaches

Example: Implementing Privacy-First Attribution in a Retail Brand
Scenario: A retail brand historically relied on third-party cookies for last-click attribution but faced declining data accuracy due to browser restrictions and privacy regulations.
Solution:
- Shifted to first-party data by enhancing their loyalty program and requiring login for purchases.
- Integrated CRM data with website analytics to map customer journeys.
- Adopted aggregated conversion modeling to estimate channel contributions.
- Used incrementality testing on paid social campaigns to validate impact.
Outcome:
- Improved attribution accuracy despite reduced third-party data.
- Increased customer trust through transparent data practices.
- Scaled marketing spend confidently with better ROI insights.
Best Practices for Senior Marketers and Growth Managers
- Prioritize First-Party Data Collection: Invest in owned channels and CRM systems to gather rich, consented user data.
- Leverage Aggregated and Modeled Attribution: Use privacy-compliant analytics tools that support aggregated data processing.
- Implement Robust Consent Management: Ensure all tracking respects user privacy choices.
- Adopt Incrementality Testing: Complement attribution models with experiments to validate marketing impact.
- Stay Updated on Privacy Regulations: Continuously monitor legal changes to adapt strategies proactively.
Mind Map: Best Practices for Privacy-First Attribution
Summary
Privacy-first attribution models represent the future of performance marketing measurement. By embracing first-party data, aggregated modeling, consent-based tracking, and incrementality testing, marketers can maintain attribution accuracy and scale revenue while respecting consumer privacy and complying with evolving regulations.
This approach not only safeguards brand reputation but also builds stronger, trust-based relationships with customers—an essential foundation for sustainable growth in the privacy-conscious digital landscape.
10.2 The Impact of AI and Automation on Revenue Operations
Artificial Intelligence (AI) and automation are transforming Revenue Operations (RevOps) by streamlining processes, enhancing data accuracy, and enabling smarter decision-making. For Senior Marketers and Growth Managers, understanding how AI and automation integrate into RevOps is crucial for scaling revenue efficiently and maintaining a competitive edge.
How AI and Automation Influence Revenue Operations
Enhanced Data Management and Integration
AI-powered tools automate the cleansing and integration of data from multiple sources (CRM, marketing platforms, sales tools), ensuring a single source of truth. This reduces manual errors and accelerates data availability for analysis.
Example: A B2B SaaS company uses AI-driven data connectors to automatically sync customer data between Salesforce and Marketo, eliminating manual imports and ensuring marketing campaigns are based on up-to-date customer profiles.
Predictive Analytics for Smarter Forecasting
AI models analyze historical data to predict future sales trends, customer behavior, and revenue outcomes. This empowers RevOps teams to allocate resources more effectively and anticipate market shifts.
Example: An e-commerce retailer leverages AI-based lead scoring to prioritize prospects most likely to convert, increasing sales efficiency by 30%.
Process Automation for Operational Efficiency
Automation reduces repetitive tasks such as lead routing, campaign deployment, and report generation, freeing teams to focus on strategic initiatives.
Example: A subscription service automates lead assignment based on territory and deal size using AI-driven rules, reducing response time and improving conversion rates.
Personalization at Scale
AI enables hyper-personalized marketing by dynamically adjusting content and offers based on customer behavior and preferences, boosting engagement and revenue.
Example: A fintech startup uses AI to segment users by spending habits and automatically delivers tailored email campaigns, resulting in a 25% lift in upsell revenue.
Improved Cross-Functional Collaboration
Automation tools facilitate seamless communication between marketing, sales, and customer success teams by providing unified dashboards and automated notifications.
Example: A global enterprise implements AI-powered alerts that notify sales reps when a high-value lead engages with marketing content, enabling timely follow-ups.
Best Practice: Integrating AI and Automation into RevOps
- Start Small: Pilot AI tools on specific processes like lead scoring or reporting.
- Ensure Data Quality: AI effectiveness depends on clean, comprehensive data.
- Cross-Functional Alignment: Collaborate across teams to define goals and workflows.
- Continuous Monitoring: Regularly evaluate AI model performance and adjust as needed.
Summary
AI and automation are pivotal in evolving Revenue Operations by enhancing data accuracy, enabling predictive insights, automating repetitive tasks, personalizing customer experiences, and fostering collaboration. Senior Marketers and Growth Managers who leverage these technologies can drive more efficient revenue scaling and maintain a data-driven growth culture.
10.3 Emerging Channels and Their Attribution Complexities
As the digital marketing landscape evolves, new channels continuously emerge, offering fresh opportunities but also introducing unique challenges for attribution modeling. Understanding these emerging channels and their attribution complexities is critical for senior marketers and growth managers aiming to maintain accurate performance measurement and optimize revenue scaling.
Key Emerging Channels
- Connected TV (CTV) and Over-The-Top (OTT) Advertising
- Influencer and Creator Marketing
- Voice Search and Smart Speakers
- Augmented Reality (AR) and Virtual Reality (VR) Experiences
- In-App Advertising and Mobile Gaming
- Social Commerce and Shoppable Content
Attribution Complexities Across Emerging Channels
Connected TV (CTV) and OTT Advertising
Complexities:
- CTV ads often lack traditional click metrics, making last-click attribution impossible.
- Cross-device user journeys are common, as users may see an ad on TV but convert on mobile or desktop.
- Conversion data can be delayed due to offline purchase behaviors or delayed reporting.
Best Practice Example: A retail brand running CTV campaigns integrates probabilistic matching and device graph data to connect TV ad exposure with online conversions. They use incrementality testing by turning CTV campaigns on/off in select markets to measure lift.
Influencer and Creator Marketing
Complexities:
- Influencer impact is often multi-touch and spans multiple platforms (Instagram, YouTube, TikTok).
- Offline word-of-mouth and online promotions blend, complicating direct attribution.
- Tracking relies heavily on affiliate links, promo codes, or custom landing pages, which may underreport true influence.
Best Practice Example: A beauty brand uses a multi-touch attribution model that assigns fractional credit to influencer touchpoints based on engagement metrics (likes, shares, comments) combined with tracked promo code redemptions.
Voice Search and Smart Speakers
Complexities:
- Voice interactions lack visual cues and clicks, making traditional tracking difficult.
- Attribution requires integration with voice assistant platforms and linking voice commands to downstream conversions.
- Multi-channel journeys may start with voice but complete on other devices.
Best Practice Example: A food delivery service tracks voice orders via smart speakers and attributes revenue by linking voice command data with CRM purchase records, using time-window based attribution to connect voice interactions with app orders.
Augmented Reality (AR) and Virtual Reality (VR) Experiences
Complexities:
- Measuring engagement is complex due to immersive, multi-sensory interactions.
- Standard analytics tools often lack AR/VR-specific metrics.
- Attribution must consider both digital and physical world touchpoints.
Best Practice Example: An automotive brand uses AR apps to let customers visualize cars in their driveway. They track app engagement duration and interaction points, then correlate these with dealership visits and sales using a multi-touch attribution model.
In-App Advertising and Mobile Gaming
Complexities:
- User journeys are fragmented across multiple apps and devices.
- Privacy changes (e.g., Apple’s IDFA restrictions) limit deterministic tracking.
- Attribution must rely on probabilistic models and aggregated data.
Best Practice Example: A gaming company uses SKAdNetwork for iOS campaigns and combines it with probabilistic attribution on Android, optimizing ad spend based on in-app purchase data and retention metrics.
Social Commerce and Shoppable Content
Complexities:
- Users discover products via social feeds but may convert on brand sites or marketplaces.
- User-generated content and peer recommendations add layers of indirect influence.
- Multi-platform journeys complicate attribution paths.
Best Practice Example: A fashion retailer tracks shoppable Instagram posts using UTM parameters and integrates social platform insights with CRM data, applying a multi-touch attribution model that credits discovery and engagement touchpoints proportionally.
Summary Mind Map
Final Thoughts
Emerging channels require marketers to rethink traditional attribution approaches. Leveraging a combination of multi-touch models, probabilistic data, incrementality testing, and cross-device integration is essential. By embracing these complexities with tailored best practices and technology, senior marketers and growth managers can unlock new revenue streams and maintain a competitive edge.
10.4 Best Practice: Preparing Your Marketing Stack for Future Innovations (Example: Integrating First-Party Data Strategies)
As privacy regulations tighten and third-party cookies phase out, future-proofing your marketing stack by integrating robust first-party data strategies is essential. This approach not only ensures compliance but also empowers marketers with richer, more reliable insights to drive performance marketing and revenue scaling.
Why First-Party Data Integration Matters
- Ownership & Control: You own the data, reducing dependency on external providers.
- Accuracy & Relevance: Directly collected data reflects real customer behavior.
- Privacy Compliance: Easier to manage consent and comply with GDPR, CCPA, and other regulations.
- Enhanced Personalization: Enables tailored customer experiences based on authentic interactions.
Key Components of a Future-Ready Marketing Stack with First-Party Data
Step 1: Audit Your Current Data Sources
- Identify all existing first-party data touchpoints (e.g., website, app, CRM, email).
- Evaluate data quality, completeness, and update frequency.
- Example: A retail brand discovers fragmented customer profiles across e-commerce and in-store systems.
Step 2: Centralize Data with a Customer Data Platform (CDP)
- Consolidate disparate data into a unified customer profile.
- Enable real-time data updates and segmentation.
- Example: A subscription service uses a CDP to merge website behavior with subscription status, enabling precise targeting.
Step 3: Implement Robust Consent and Privacy Management
- Integrate consent management platforms (CMPs) to capture and respect user preferences.
- Maintain audit trails for compliance.
- Example: A fintech company implements granular consent options on its app, ensuring transparency.
Step 4: Enhance Attribution Models Using First-Party Data
- Use enriched customer data to improve multi-touch attribution accuracy.
- Incorporate offline and online touchpoints.
- Example: A B2B SaaS firm integrates CRM pipeline data with digital campaign data to better attribute revenue.
Step 5: Activate Data for Personalized Campaigns and Automation
- Leverage first-party data to power dynamic content, email personalization, and retargeting.
- Automate workflows based on customer behaviors and lifecycle stages.
- Example: An e-commerce brand triggers cart abandonment emails with personalized product recommendations.
Example: Integrating First-Party Data Strategy at “GreenLeaf Apparel”
Background: GreenLeaf Apparel, a mid-sized sustainable fashion retailer, faced challenges with fragmented customer data across its website, physical stores, and email marketing.
Actions Taken:
- Implemented a CDP to unify customer profiles from online and offline sources.
- Deployed a CMP to manage consent and ensure compliance.
- Enhanced attribution by linking in-store purchases with digital campaigns.
- Used first-party data to personalize email campaigns and social ads.
Results:
- 25% increase in email open rates due to better segmentation.
- 15% uplift in ROAS by reallocating budget to high-performing channels identified through improved attribution.
- Strengthened customer trust through transparent data practices.
Summary Checklist for Preparing Your Marketing Stack
- Audit all first-party data sources and assess quality.
- Choose and implement a CDP for data unification.
- Integrate consent management tools for privacy compliance.
- Enhance attribution models with enriched first-party data.
- Activate data via personalization and automation platforms.
- Continuously monitor, test, and optimize data flows and campaigns.
By proactively integrating first-party data strategies into your marketing stack, you position your organization to adapt seamlessly to evolving privacy landscapes and unlock powerful insights that drive sustainable revenue growth.
10.5 Case Study: Early Adoption of Next-Gen Attribution in a Growth-Stage Company
Overview
This case study explores how a growth-stage SaaS company, “TechScale Solutions,” successfully implemented next-generation attribution modeling to optimize their marketing spend, improve customer acquisition, and scale revenue efficiently. By adopting privacy-first, AI-driven attribution models and integrating first-party data strategies, TechScale gained a competitive edge in a crowded market.
Company Background
- Industry: SaaS (B2B)
- Stage: Growth-stage (Series B funding)
- Annual Revenue: $25M
- Marketing Channels: Paid search, paid social, content marketing, email marketing, webinars
Challenges Faced
- Increasing difficulty tracking multi-device customer journeys due to cookie restrictions and privacy regulations.
- Attribution models were siloed and relied heavily on last-touch, causing misallocation of budget.
- Limited integration between marketing and sales data, causing revenue impact to be unclear.
Objectives
- Implement a privacy-first, AI-powered attribution model.
- Integrate first-party data and CRM insights for a unified view.
- Use attribution insights to scale high-performing channels and improve ROI.
Implementation Steps
Mind Map: Next-Gen Attribution Implementation at TechScale Solutions
Step 1: Data Integration and Privacy Compliance
- Consolidated first-party data from CRM, website analytics, and email platforms into Snowflake.
- Implemented consent management tools to ensure GDPR and CCPA compliance.
- Example: When a lead signs up for a webinar, their engagement data is linked to their CRM profile, enabling a full journey view.
Step 2: AI-Powered Attribution Modeling
- Developed a custom machine learning model that assigns fractional credit to touchpoints based on their influence on conversion probability.
- Model accounts for cross-device behavior by matching user identifiers and anonymized signals.
- Example: A prospect who first interacted via paid social, then engaged with content marketing, and finally converted through email receives proportional attribution credit.
Step 3: Cross-Functional Collaboration
- Revenue operations team coordinated between marketing and sales to align attribution data with pipeline and revenue metrics.
- Weekly syncs ensured data accuracy and actionable insights.
- Example: Sales team feedback helped refine the model by identifying key touchpoints that marketing data alone missed.
Step 4: Incrementality Testing
- Launched controlled experiments by pausing specific channels in select regions to measure true incremental impact.
- Validated AI model predictions against real-world results.
- Example: Pausing paid search in one region showed a 15% drop in conversions, confirming its high incremental value.
Results
- 30% increase in marketing ROI within 6 months due to optimized budget allocation.
- 20% uplift in customer acquisition by focusing on high-impact channels identified by the AI model.
- Improved cross-device attribution accuracy led to better understanding of multi-touch journeys.
- Enhanced collaboration between marketing, sales, and revenue operations improved pipeline velocity.
Lessons Learned & Best Practices
Mind Map: Lessons Learned from TechScale’s Next-Gen Attribution

- Start with clean, privacy-compliant first-party data to build a reliable foundation.
- Use AI to move beyond simplistic attribution models and capture complex customer journeys.
- Foster collaboration across teams to ensure attribution insights translate into revenue impact.
- Validate models regularly with incrementality testing to avoid over-attribution.
Final Example: Attribution-Driven Campaign Optimization
TechScale identified that webinar engagement had a higher influence on conversions than previously credited. By reallocating budget to promote webinars via paid social and email nurture sequences, they increased qualified leads by 25% and reduced cost per acquisition by 18%.
Summary
TechScale Solutions’ early adoption of next-gen attribution modeling empowered them to navigate privacy challenges, gain accurate insights into multi-touch customer journeys, and scale revenue effectively. This case exemplifies how growth-stage companies can leverage AI, first-party data, and cross-functional collaboration to stay ahead in performance marketing.
11. Conclusion and Actionable Takeaways
11.1 Recap of Key Attribution Models and Their Applications
Performance marketing thrives on understanding which marketing efforts truly drive conversions and revenue. Attribution modeling is the backbone of this understanding, enabling marketers to assign credit to different touchpoints in the customer journey. Below is a comprehensive recap of the key attribution models, their applications, and illustrative examples to solidify your grasp.
Mind Map: Overview of Attribution Models
First-Touch Attribution
- Application: Ideal for campaigns focused on brand awareness and lead generation.
- Example: A travel company runs a blog content campaign to attract new visitors. Using first-touch attribution, they identify that organic search and blog posts are the primary drivers of new leads.
Last-Touch Attribution
- Application: Useful when the goal is to optimize channels that close deals or drive immediate conversions.
- Example: An online retailer notices that last-click Google Ads generate the majority of sales, so they allocate more budget there.
Multi-Touch Attribution
-
Linear Model: Treats all touchpoints equally, providing a balanced view.
- Example: A B2B software firm uses linear attribution to understand the collective impact of email nurture campaigns, webinars, and paid ads.
-
Time Decay Model: Prioritizes recent interactions, acknowledging their stronger influence.
- Example: A subscription box service uses time decay to emphasize retargeting ads that occur closer to the purchase date.
-
Position-Based Model: Highlights the importance of both the first and last touchpoints.
- Example: A financial services company credits the initial educational webinar and the final sales call heavily.
Algorithmic/Data-Driven Attribution
- Application: Best for organizations with rich datasets and complex customer journeys.
- Example: A fintech startup leverages machine learning algorithms to analyze thousands of touchpoints, discovering that a combination of influencer marketing and referral programs drives the highest lifetime value customers.
Mind Map: Choosing the Right Attribution Model
Practical Example: SaaS Company Attribution Recap
- Scenario: SaaS company wants to optimize marketing spend across channels.
- Approach: Starts with last-touch attribution to identify top converting channels.
- Insight: Paid search drives most conversions, but first-touch attribution reveals organic content is key for lead generation.
- Action: Implements a position-based model to balance credit, leading to increased investment in content marketing and paid search.
Summary Table: Attribution Models and Use Cases
| Attribution Model | Description | Best Use Case | Example Industry |
|---|---|---|---|
| First-Touch | 100% credit to first interaction | Brand awareness campaigns | SaaS, Travel |
| Last-Touch | 100% credit to last interaction | Conversion-focused campaigns | E-commerce, Retail |
| Linear (Multi-Touch) | Equal credit to all touchpoints | Balanced channel evaluation | B2B, Subscription Services |
| Time Decay (Multi-Touch) | More credit to recent touchpoints | Funnels with time-sensitive actions | Subscription Boxes |
| Position-Based | 40% credit to first & last, rest distributed | Emphasizing start & end of journey | Financial Services |
| Algorithmic/Data-Driven | Machine learning based credit assignment | Complex journeys with rich data | Fintech, Large Enterprises |
By mastering these attribution models and understanding their applications, senior marketers and growth managers can make data-driven decisions that optimize budget allocation, improve campaign performance, and ultimately scale revenue effectively.
11.2 Strategic Steps to Implement and Scale Attribution-Driven Marketing
Implementing and scaling attribution-driven marketing is a critical step for senior marketers and growth managers aiming to maximize ROI and sustainably grow revenue. This section breaks down a strategic, step-by-step approach enriched with practical examples and mind maps to guide you through the process.
Step 1: Define Clear Marketing and Business Objectives
Before diving into attribution, clarify what success looks like for your organization.
- Align marketing goals with overall business KPIs (e.g., revenue growth, customer acquisition, retention).
- Identify key conversion events (e.g., trial signups, purchases, demo requests).
Example: A SaaS company sets a goal to increase free trial signups by 30% in the next quarter, focusing on multi-channel lead generation.
Step 2: Map the Customer Journey and Touchpoints
Understand every interaction your customers have with your brand across channels.
- Document all marketing channels (paid search, social, email, organic, offline).
- Identify key touchpoints and their role in the funnel stages (awareness, consideration, decision).
Example: An e-commerce brand maps the journey from Facebook ads (awareness) to email nurturing (consideration) to retargeting ads (decision).
Step 3: Choose the Right Attribution Model(s)
Select attribution models that best fit your business complexity and data availability.
- Start simple (e.g., first-touch or last-touch) if data is limited.
- Progress to multi-touch or algorithmic models as data maturity grows.
Example: A B2B company uses a weighted multi-touch model to credit both early educational content and final demo requests.
Step 4: Implement Robust Tracking and Data Collection
Ensure accurate and consistent data capture across all channels.
- Use UTM parameters, tracking pixels, and CRM integrations.
- Validate data quality regularly to avoid gaps or duplication.
Example: A travel brand implements UTM tagging on all digital campaigns and integrates Google Analytics with Salesforce to track leads through to bookings.
Step 5: Analyze Attribution Data to Identify High-Impact Channels
Leverage attribution insights to understand which channels and touchpoints drive conversions and revenue.
- Use dashboards to visualize performance.
- Look for patterns in customer behavior and channel synergy.
Example: Paid social and email nurture campaigns show high combined impact on conversions, prompting increased budget allocation.
Step 6: Optimize Campaigns and Budget Allocation Based on Attribution
Adjust marketing spend and tactics dynamically based on attribution insights.
- Reallocate budget from underperforming channels to high-impact ones.
- Test new creatives or offers on top-performing channels.
Example: A retail brand shifts 20% of its paid search budget to display ads after attribution data reveals better assisted conversions from display.
Step 7: Scale Successful Strategies with Automation and Personalization
Use marketing automation tools to scale campaigns efficiently.
- Implement personalized messaging based on customer segments and touchpoints.
- Automate bidding and budget adjustments using attribution data.
Example: A subscription service uses dynamic email content tailored to user behavior and attribution insights to boost retention.
Step 8: Foster Cross-Functional Collaboration and Continuous Improvement
Ensure marketing, sales, and revenue operations teams share attribution insights and align on goals.
- Establish regular reporting cadences.
- Iterate on attribution models and data collection as business evolves.
Example: Marketing and sales teams hold monthly meetings to review attribution reports and adjust lead qualification criteria.
Summary Table of Strategic Steps with Examples
| Step | Action | Example |
|---|---|---|
| 1 | Define Objectives | SaaS company targets 30% trial signup increase |
| 2 | Map Customer Journey | E-commerce maps Facebook ads to retargeting funnel |
| 3 | Choose Attribution Model | B2B uses weighted multi-touch model |
| 4 | Implement Tracking | Travel brand uses UTM + CRM integration |
| 5 | Analyze Data | Identify paid social + email synergy |
| 6 | Optimize Budget | Retail shifts budget from paid search to display |
| 7 | Scale with Automation | Subscription service personalizes emails |
| 8 | Collaborate & Improve | Monthly marketing-sales attribution reviews |
By following these strategic steps, senior marketers and growth managers can systematically implement and scale attribution-driven marketing programs that not only measure impact accurately but also drive sustained revenue growth.
11.3 Building a Culture of Data-Driven Decision Making
Creating a culture where data drives every marketing and revenue operation decision is essential for sustained growth and competitive advantage. For Senior Marketers and Growth Managers, fostering this mindset requires intentional strategies, clear communication, and practical tools that empower teams to leverage data confidently.
Why Build a Data-Driven Culture?
- Improved Decision Quality: Data reduces guesswork and biases.
- Faster Iterations: Teams can quickly test, learn, and optimize.
- Cross-Functional Alignment: Shared data insights unify marketing, sales, and revenue operations.
Key Components of a Data-Driven Culture
Practical Steps to Foster Data-Driven Decision Making
-
Leadership Buy-In and Role Modeling
- Leaders must actively use data in their decisions.
- Example: A CMO regularly shares campaign attribution reports in weekly meetings, highlighting data-driven wins and learnings.
-
Invest in Data Literacy
- Conduct workshops to teach team members how to interpret attribution models and analytics.
- Example: A Growth Manager hosts monthly “Data Deep Dive” sessions where teams analyze recent campaign performance together.
-
Ensure Data Accessibility and Transparency
- Provide intuitive dashboards that display real-time marketing and revenue metrics.
- Example: Using Looker dashboards customized for different roles, enabling marketers and sales reps to see relevant attribution data.
-
Encourage Experimentation and Learning
- Promote A/B testing and incremental experiments backed by attribution insights.
- Example: A Senior Marketer runs controlled paid media experiments to validate attribution assumptions and shares results openly.
-
Align Incentives with Data-Driven Outcomes
- Tie team goals and bonuses to measurable KPIs derived from attribution models.
- Example: Sales and marketing teams share revenue targets influenced by multi-touch attribution data.
-
Regular Cross-Functional Data Reviews
- Schedule recurring meetings where marketing, sales, and revenue ops teams discuss attribution findings and adjust strategies.
- Example: A monthly “Revenue Ops Sync” meeting reviews pipeline attribution and identifies optimization opportunities.
Mind Map: Steps to Build Data-Driven Culture
Example: Building Data-Driven Culture at a SaaS Company
Context: The marketing team struggled to connect campaign efforts to revenue impact due to fragmented data and limited analytics skills.
Actions Taken:
- Leadership mandated weekly data review meetings.
- Invested in training sessions focused on multi-touch attribution understanding.
- Rolled out a centralized dashboard integrating CRM and marketing automation data.
- Introduced incremental testing to validate attribution models.
- Aligned team bonuses with pipeline influenced by marketing.
Outcome:
- Marketing decisions became more strategic and measurable.
- Revenue growth accelerated by 15% within 6 months.
- Cross-team collaboration improved, reducing silos.
Summary
Building a culture of data-driven decision making is not a one-time project but an ongoing commitment. By empowering teams with knowledge, tools, and leadership support, Senior Marketers and Growth Managers can ensure that attribution insights translate into actionable strategies that scale revenue effectively.
11.4 Best Practice: Continuous Learning and Adaptation in Performance Marketing
In the fast-evolving landscape of performance marketing, continuous learning and adaptation are critical to maintaining competitive advantage and driving sustained revenue growth. This best practice emphasizes the importance of iterative improvement, data-driven decision making, and fostering a culture that embraces change.
Why Continuous Learning Matters
- Market Dynamics Change Rapidly: Consumer behavior, platform algorithms, and competitive landscapes evolve constantly.
- Data Insights Evolve: New data streams and analytics tools provide deeper insights over time.
- Campaign Effectiveness Varies: What works today may not work tomorrow; adaptation ensures relevance.
Core Components of Continuous Learning and Adaptation
Practical Steps to Implement Continuous Learning
-
Establish Regular Performance Review Cadences
- Weekly or bi-weekly meetings to analyze campaign data and attribution insights.
- Example: A growth team reviews multi-touch attribution reports every Friday to identify shifts in channel performance.
-
Integrate Experimentation as a Core Practice
- Run A/B tests on creatives, targeting, and bidding strategies.
- Use incrementality testing to validate attribution assumptions.
- Example: An e-commerce brand tests two different retargeting ad sequences to see which drives higher incremental revenue.
-
Create Feedback Loops Across Teams
- Marketing, sales, and revenue operations share insights and challenges.
- Customer success teams provide qualitative feedback to inform attribution adjustments.
- Example: A SaaS company holds monthly cross-departmental syncs to align on attribution findings and customer journey insights.
-
Invest in Continuous Skill Development
- Encourage team members to attend webinars, certifications, and conferences.
- Stay updated on emerging attribution technologies and methodologies.
- Example: Growth managers participate in quarterly workshops on AI-driven attribution modeling.
-
Adopt Agile and Iterative Processes
- Use sprint cycles to plan, execute, and review marketing experiments.
- Leverage automation tools to quickly adjust campaigns based on real-time data.
- Example: A digital marketing team uses agile boards to track campaign tests and pivots weekly.
Mind Map: Continuous Learning Workflow in Performance Marketing
Example: How a Growth Manager Applied Continuous Learning
Scenario: A growth manager at a subscription-based fitness app noticed a decline in paid social channel performance.
Actions Taken:
- Conducted a deep dive into attribution data to confirm the drop was not due to last-touch bias.
- Ran A/B tests on new creative formats and targeting segments.
- Collaborated with sales and customer success to gather feedback on user onboarding issues.
- Adjusted the attribution model to better account for mid-funnel touchpoints.
- Reallocated budget dynamically between paid social and search based on test results.
- Hosted weekly review sessions to monitor impact and iterate quickly.
Outcome:
- Improved ROAS by 25% over two months.
- Increased customer lifetime value by tailoring campaigns based on updated attribution insights.
- Fostered a culture of data-driven agility within the marketing team.
Summary
Continuous learning and adaptation in performance marketing is not a one-time effort but an ongoing process that integrates data analysis, experimentation, collaboration, and skill development. By embedding these practices into daily workflows, senior marketers and growth managers can ensure their strategies remain effective, scalable, and aligned with evolving business goals.
11.5 Final Example: Roadmap for Senior Marketers and Growth Managers to Drive Revenue Growth
Driving sustainable revenue growth requires a strategic, data-driven approach that integrates attribution modeling with performance marketing and revenue operations. Below is a detailed roadmap designed specifically for Senior Marketers and Growth Managers, combining best practices, actionable steps, and illustrative examples.
Roadmap to Revenue Growth
Step 1: Define Clear Objectives and Align Teams
Example: A SaaS company sets a goal to increase trial-to-paid conversion by 20% in 6 months. Marketing and sales teams align on attribution models that track touchpoints influencing trial signups and demos.
- Establish SMART goals (Specific, Measurable, Achievable, Relevant, Time-bound).
- Align marketing KPIs with sales funnel metrics (e.g., MQLs, SQLs, revenue).
- Use collaborative workshops to ensure shared understanding.
Step 2: Implement Robust Attribution Modeling
Example: The SaaS company adopts a multi-touch attribution model weighted by engagement level (e.g., webinar attendance > email open).
- Map customer journeys across channels.
- Integrate CRM, marketing automation, and analytics platforms.
- Validate attribution models with incrementality tests.
Step 3: Optimize Campaign Execution Based on Attribution Insights
Example: Data reveals paid social drives initial awareness, while paid search closes conversions. Budget is reallocated dynamically to maximize ROAS.
- Continuously analyze channel performance.
- Run A/B tests to refine messaging and creatives.
- Automate budget shifts using real-time data.
Step 4: Measure Revenue Impact and Scale
Example: The company tracks Customer Lifetime Value (CLV) by segment and uses attribution data to tailor retention campaigns, increasing revenue per customer.
- Track key revenue metrics (e.g., CLV, churn rate).
- Build dashboards for stakeholders with clear visualizations.
- Use predictive analytics to forecast growth opportunities.
Step 5: Foster a Data-Driven Culture and Continuous Learning
Example: Regular cross-functional meetings review attribution insights and campaign results, encouraging iterative improvements.
- Promote transparency and data sharing.
- Invest in training on analytics tools and attribution concepts.
- Encourage experimentation and agile marketing approaches.
Integrated Example: SaaS Growth Manager’s Quarterly Plan
| Quarter | Focus Area | Action Items | Expected Outcome |
|---|---|---|---|
| Q1 | Attribution Setup | Implement multi-touch attribution; integrate CRM and marketing data | Accurate channel performance insights |
| Q2 | Campaign Optimization | Reallocate budget based on attribution; run A/B tests on messaging | Improved conversion rates and ROAS |
| Q3 | Revenue Measurement & Scaling | Track CLV by segment; personalize retention campaigns | Increased customer retention and revenue growth |
| Q4 | Culture & Collaboration | Host cross-team review sessions; train teams on new analytics tools | Enhanced data-driven decision making |
Final Thoughts
By following this roadmap, Senior Marketers and Growth Managers can systematically leverage attribution modeling to inform strategy, optimize execution, and ultimately scale revenue. The integration of data, technology, and cross-functional collaboration forms the backbone of sustainable growth in performance marketing.
For further reading, revisit chapters on multi-touch attribution, revenue operations alignment, and advanced analytics techniques to deepen your understanding and application.