Sustainable Aquafeed and Alternative Protein Crop Engineering
1. Foundations of Low-Impact Aquafeed Systems
1.1 Defining Low-Impact Fisheries Nutrition and Feed Performance Targets
Low-impact fisheries nutrition starts with two kinds of targets that must agree with each other: (1) performance targets that keep fish growing and healthy, and (2) impact targets that reduce resource use and waste. If you only set one side, you get a feed that either performs poorly or performs “fine” while quietly shifting the burden elsewhere.
Step 1: Define the System Boundary Before Choosing Targets
Start by writing down what your feed system includes. A practical boundary is “from ingredient sourcing through feed manufacturing to fish culture outputs.” Then decide what you will measure directly and what you will estimate. For example, you may not measure every upstream farm input, but you can measure finished feed composition, pellet water stability, and on-farm waste indicators.
Example: A farm switching to algae meal fermentation protein might track finished feed protein, pellet durability, and feed conversion ratio (FCR). It may also track nitrogen in feces proxies via settling solids, rather than trying to measure every upstream nitrogen flow.
Step 2: Translate “Low-Impact” Into Measurable Impact Categories
Use a small set of impact categories that connect to nutrition and feeding behavior.
- Nitrogen and phosphorus losses: Driven by digestibility, amino acid balance, and feeding rate.
- Water use and solids generation: Influenced by pellet water stability and feed particle behavior.
- Energy and processing intensity: Affected by drying, milling, fermentation, and pellet conditioning.
- Ingredient risk and variability: Managed through quality acceptance criteria and batch testing.
Example: If your pellets soften quickly, more nutrients leak into water before digestion. That increases solids and nutrient loss even if the formulation looks good on paper.
Step 3: Set Performance Targets That Prevent “Impact-Only” Mistakes
Performance targets should be specific enough to guide formulation and manufacturing decisions.
- Growth and survival: Weight gain and survival rate by life stage.
- Feed conversion ratio: FCR and, when possible, protein efficiency ratio.
- Digestibility proxies: Apparent digestibility coefficients or practical indicators like fecal consistency and settling speed.
- Health and stress indicators: Gut condition, behavior, and mortality patterns.
Example: A feed with excellent protein content but poor amino acid balance may show worse FCR and higher waste. That waste then worsens nitrogen loss, so the “impact” problem is actually a nutrition problem.
Step 4: Connect Targets to Formulation Levers
Targets become useful when you can point to the knobs you can turn.
- Amino acid balance: Reduces excess nitrogen excretion.
- Digestibility and processing: Improves nutrient availability.
- Lipid and energy matching: Prevents fish from over-consuming feed to meet energy needs.
- Pellet water stability and binder choice: Reduces nutrient leaching.
- Feeding regimen: Prevents overfeeding and uneven consumption.
Example: If nitrogen loss is high, check whether the formulation has excess crude protein, whether amino acids are limiting, and whether pellet leaching is high. Fixing only one lever often disappoints.
Step 5: Choose Practical Target Values and Acceptance Thresholds
You do not need perfect numbers on day one, but you do need thresholds that trigger action.
- Minimum performance floor: e.g., FCR not worse than a defined margin versus the current feed.
- Maximum impact ceiling: e.g., solids generation not exceeding a set range per unit biomass produced.
- Quality gates: e.g., fermented ingredient safety and consistency criteria before inclusion.
Example: If a batch fails pellet durability or shows unusual fermentation pH drift, you hold it even if the lab protein number looks fine.
Mind Map: Low-Impact Nutrition Targets
Integrated Example: Turning Targets Into a Decision
Suppose your farm observes higher settling solids after switching to a new algae meal fermentation ingredient. You test three linked hypotheses.
- Nutrition mismatch: Amino acids may be limiting, causing higher feed intake for the same growth.
- Digestibility issue: Fermentation may have improved protein quality, but processing could have reduced digestibility.
- Physical loss: Pellet water stability may be lower due to binder changes or conditioning differences.
You confirm by checking FCR trends, fecal consistency, and pellet durability. If FCR worsens and feces are loose, you adjust formulation and processing. If FCR is stable but solids rise, you focus on pellet water stability and binder/conditioning settings.
A Simple Target Statement You Can Write Today
“Maintain growth and survival at or above baseline while keeping FCR within a defined margin, and reduce nutrient and solids losses by improving digestibility, amino acid balance, and pellet water stability, verified through batch quality gates and on-farm waste proxies.”
This statement forces the nutrition and impact sides to move together, which is the whole point of low-impact feed targets.
1.2 Mapping Nutrient Pathways from Feed Ingredients to Fish Health
Fish health is not a single outcome of “protein in, growth out.” It’s the result of a chain: ingredient composition → digestion and absorption → metabolism → immune and tissue responses → measurable performance. Mapping nutrient pathways means you track that chain with enough detail to explain why a feed works for one batch, species, or farm, and fails for another.
Step 1: Start with Ingredient-Level Nutrient Profiles
Every pathway begins with what the ingredient actually contains. Proximate analysis gives protein, lipid, moisture, and ash, but fish care about finer details: amino acid balance, digestible energy, fatty acid profile, and mineral forms. Two ingredients with the same crude protein can behave differently because one has more heat-damaged proteins or different amino acid availability.
Practical example: If algae meal and fermented algae protein both show 45% crude protein, but one has higher lysine availability after processing, you may see better growth or lower feed conversion in the lysine-limited life stage. The pathway mapping starts by recording which nutrient is likely to be limiting.
Step 2: Translate Composition Into Digestibility and Release
Nutrients must be released from the ingredient matrix and survive processing. Digestibility is influenced by particle size, heat exposure, fiber and anti-nutritional factors, and protein structure. For lipids, oxidation state matters because damaged fats can reduce palatability and impair gut function.
Practical example: A pellet that disintegrates quickly releases nutrients before the fish can digest them, increasing nutrient loss to water and leaving the fish with less usable energy. In pathway terms, the “absorption step” fails even if the ingredient profile is correct.
Step 3: Track Absorption and Gut Function
Once nutrients are released, they interact with the gut environment. The gut lining, mucus layer, and microbial community determine how efficiently nutrients cross into the body. Poorly digested proteins can increase microbial fermentation, shifting gut pH and potentially stressing the intestinal barrier.
Practical example: If plant proteins replace fishmeal without adjusting processing or inclusion, you may observe more mucus, altered fecal consistency, or reduced feed intake. These are not just symptoms; they are evidence that the pathway from “protein ingestion” to “gut absorption” is disrupted.
Step 4: Connect Metabolism to Tissue and Immune Outcomes
Absorbed nutrients are used for maintenance, growth, and immune function. Protein is not only building material; it also supports immune responses. Energy balance matters because excess protein used for energy can increase nitrogenous waste. Lipids influence cell membranes and inflammatory signaling, while minerals support enzyme systems and osmoregulation.
Practical example: If a formulation is energy-poor, fish may catabolize more amino acids for energy. You can see this as higher ammonia output and a weaker growth response even when crude protein is adequate.
Step 5: Link to Water Quality and Waste Pathways
Nutrient pathways include what leaves the fish. Nitrogen and phosphorus excretion depend on digestibility, retention efficiency, and whether nutrients are in the right form. Mapping these waste pathways helps connect feed changes to water outcomes like ammonia, nitrite risk, and phosphate load.
Practical example: Fermented ingredients can sometimes improve nitrogen retention by improving protein availability. If retention improves, you often see lower nitrogenous waste for the same growth target, which reduces stress on biofilters.
Step 6: Use Measurements to Validate Each Link
A pathway map is only useful if you can test it. Use a small set of measurements that correspond to each step: ingredient assays (composition), feed assays (stability, oxidation, particle size), gut or fecal indicators (consistency, digestibility proxies), performance metrics (growth, feed conversion), and water metrics (ammonia, phosphate).
Practical example: When a new algae meal batch is introduced, compare digestibility proxies and early growth over a short window. If performance drops but water quality remains stable, the issue may be nutrient availability rather than excretion.
Mind Map: Nutrient Pathway Map from Ingredient to Fish Health
Example: Mapping a Protein Change in an Algae-Based Feed
Suppose you replace part of a plant protein blend with fermented algae protein. Your pathway map predicts several possible links:
- Ingredient step: fermented product may have improved amino acid availability.
- Digestibility step: processing may alter protein structure and reduce anti-nutritional effects.
- Gut step: better digestibility can reduce fermentation load and stabilize gut conditions.
- Metabolism step: improved energy balance can reduce amino acid catabolism.
- Waste step: higher retention can lower ammonia and phosphate output.
To confirm, you compare early feed intake, fecal consistency, growth rate, feed conversion, and water ammonia trends across matched tanks. If growth improves but ammonia rises, the pathway likely improved growth allocation but not retention; if both improve, multiple links are working together.
Step 7: Keep the Map Practical and Species-Specific
Different species digest differently. Herbivorous or omnivorous fish may tolerate certain fiber levels, while carnivorous species often show sharper responses to amino acid availability and lipid quality. Life stage also changes priorities: juveniles typically need more precise nutrient balance for tissue building, while adults may show stronger responses to energy and mineral adequacy.
A good nutrient pathway map is therefore not a generic diagram. It’s a structured checklist tailored to the species, ingredient set, processing method, and the measurements you can realistically collect on your farm.
1.3 Understanding Feed Formulation Constraints for Different Species and Life Stages
Feed formulation constraints are the “physics” of aquafeeds: you can’t choose ingredients freely and still expect the same performance. Constraints come from the animal’s biology, the ingredient’s chemistry, and the manufacturing process. When you treat these constraints as a system, formulation becomes less like guessing and more like engineering.
Species Constraints That Shape Formulation
Different species digest and use nutrients differently. Carnivorous fish such as salmonids generally rely more on dietary protein and specific amino acids, while omnivorous species like tilapia can use a wider range of carbohydrate sources and may tolerate higher plant-protein inclusion. Herbivorous species require careful attention to fiber and fermentable fractions because gut transit and microbial fermentation change how nutrients become available.
A practical way to handle species constraints is to start with a nutrient “must-have list” and a “don’t-break-these” list. Must-haves include essential amino acids, essential fatty acids, and key minerals. Don’t-break-these include limits on anti-nutritional factors, palatability issues, and ingredients that can destabilize pellets or increase leaching.
Example: If you formulate for shrimp, you often need to prioritize water-stable pellets and fast nutrient availability because feeding behavior and pellet contact time are different from many finfish. The same protein source that works in a floating feed may underperform in a sinking, short-contact scenario.
Life Stage Constraints That Change the Rules
Life stage matters because the digestive tract and metabolic priorities shift as animals grow. Early stages typically have smaller digestive capacity, higher relative demand for digestible protein, and less tolerance for ingredient variability. As juveniles and adults mature, they can handle broader nutrient ranges and may use energy more flexibly.
A common formulation trap is using a grow-out recipe for fry. Even if the crude protein percentage matches, the fry may experience lower digestibility, slower gastric processing, or reduced ability to handle certain fiber or mineral forms. That shows up as poorer growth, higher feed conversion ratio, or inconsistent survival.
Example: For larvae, you may need finer particle size and higher-quality protein fractions because the animal’s feeding and digestion are limited. For juveniles, you can often increase inclusion of moderately processed plant proteins, but you still need to watch amino acid balance.
Ingredient Constraints That Interact with Biology
Ingredient constraints include digestibility, amino acid profile, lipid quality, and functional behavior in water. Plant proteins often have different amino acid ratios than fishmeal, so formulation must correct for limiting amino acids rather than only matching total protein. Fermented or otherwise processed proteins can improve functional properties such as solubility and reduce certain compounds that interfere with digestion.
Minerals and vitamins also behave differently depending on ingredient matrix. For instance, mineral bioavailability can drop when minerals bind strongly to fiber or anti-nutritional compounds. This is why “same mineral inclusion” does not guarantee “same mineral availability.”
Example: Two feeds with identical calcium and phosphorus levels can perform differently if one uses a mineral form that is less available in the presence of certain plant components.
Manufacturing Constraints That Feed Back Into Formulation
Pellet quality is not cosmetic; it determines how much nutrient the animal actually receives. Conditioning temperature, extrusion or not, binder choice, and drying conditions affect starch gelatinization, protein denaturation, and water stability. If pellets disintegrate quickly, the effective nutrient delivery drops even when the lab analysis looks perfect.
Particle size and density matter too. Fine particles can increase leaching and reduce pellet integrity, while overly large particles can reduce ingestion. The “right” formulation is therefore tied to the target feed type: crumble, sinking pellet, floating pellet, or extruded feed.
Example: If you increase plant protein that increases water absorption, you may need to adjust binder level or processing parameters to maintain water stability. Otherwise, the feed may look fine at manufacture but underperform in the tank.
A Systematic Constraint Workflow
- Define the target animal profile: species, life stage, and feeding behavior (floating vs sinking, contact time).
- Set nutrient targets by biology: essential amino acids, essential fatty acids, digestible protein fraction, and mineral availability.
- Apply ingredient constraints: digestibility, anti-nutritional factors, functional properties, and variability tolerance.
- Translate into manufacturing constraints: pellet stability, particle size distribution, binder compatibility, and processing limits.
- Close the loop with checks: water stability, leaching behavior, and basic quality tests before full performance trials.
Mind Map: Feed Formulation Constraints
Example: Constraint Mapping for a Single Recipe Decision
Suppose you want to replace part of a high-quality protein source with fermented algae-derived protein for a juvenile fish feed. The constraint map looks like this: the species requires specific amino acids, the life stage needs high digestibility and consistent particle handling, the ingredient must deliver functional solubility without introducing problematic compounds, and the manufacturing process must keep pellets stable long enough for ingestion. If water stability drops after the substitution, the constraint is not “the protein is wrong,” but “the formulation-manufacturing interaction needs adjustment,” such as binder tuning or processing parameter changes.
When you treat constraints as connected rather than separate, formulation decisions become traceable. You can explain why a change helps, why it fails, and what to adjust next—without relying on luck or vague “it should work” reasoning.
1.4 Baseline Environmental Metrics for Feed Ingredients and Finished Feeds
Baseline environmental metrics are the “before” picture. They let you compare ingredients and finished feeds on the same footing, spot hotspots, and avoid trading one problem for another (for example, lower carbon but higher water stress). The goal is not perfection; it is consistent measurement that supports practical decisions.
What Counts as a Baseline
A baseline is a set of metrics measured or calculated for each ingredient and for the final feed product. For ingredients, you typically capture impacts from raw material production through processing steps up to the point of delivery to the feed mill. For finished feeds, you add manufacturing steps such as mixing conditioning extrusion drying and packaging. If you skip a step, you must document the boundary so comparisons remain honest.
Core Metrics and Why They Matter
Start with a small set of metrics that cover major environmental dimensions:
- Greenhouse Gas Emissions: Usually reported as kg CO₂e per kg of ingredient or feed. This helps you compare climate impact across supply chains.
- Energy Use: Often tracked as MJ per kg. It is useful when electricity and heat sources differ between facilities.
- Water Use and Water Stress: Report total water withdrawal and, when possible, water stress characterization. This matters because “same liters” can mean very different local impacts.
- Land Use: Relevant for crop proteins and oilseed meals. It helps connect feed choices to agricultural footprint.
- Nutrient Loading Potential: For aquafeeds, focus on nitrogen and phosphorus release potential tied to digestibility and formulation. This links feed composition to water quality outcomes.
- Waste and Byproduct Handling: Track mass of residues and how they are treated (reused, landfilled, incinerated). This prevents hidden disposal from being ignored.
A practical rule: if a metric cannot be connected to a controllable decision (ingredient choice processing parameter or formulation), it becomes “nice to know” rather than “useful to manage.”
System Boundaries and Functional Units
Choose a functional unit that matches how feed is used. For ingredient comparisons, use kg of ingredient delivered. For finished feeds, use kg of feed delivered and, when available, kg of fish biomass produced or kg of feed per unit growth. The boundary should specify:
- Upstream: cultivation or biomass production, harvesting, transport to processing.
- Processing: drying milling extraction fermentation and any solvent or heat steps.
- Downstream: feed manufacturing and packaging.
- Use phase: only include nutrient loading if you have a defensible method to estimate it.
Data Quality Tiers and How to Keep Them Consistent
Environmental metrics are only as good as the data. Use a tiered approach:
- Tier 1: measured energy and mass balances from your facility.
- Tier 2: supplier-specific data for ingredient production.
- Tier 3: generic databases and literature averages.
When you mix tiers, record which inputs are Tier 1, 2, or 3. This makes it easier to improve the baseline later without rewriting everything.
Mind Map: Baseline Metrics Workflow
Example: Comparing Two Protein Ingredients
Imagine Ingredient A is a crop meal and Ingredient B is algae meal that is dried and milled.
- For Ingredient A, land use and fertilizer-related emissions often dominate. Water use may be moderate but can be high in stressed regions.
- For Ingredient B, energy for drying and any fermentation or extraction steps can dominate climate impact, while land use may be lower.
A baseline comparison should show both results side by side, not just the lowest CO₂e. If Ingredient B has higher energy use but lower nutrient loading potential in fish due to better digestibility, the finished feed baseline may still be favorable.
Example: Finished Feed Nutrient Loading Potential
Finished feed baselines should connect formulation to expected waste. If two diets have the same protein but different digestibility, the one with higher digestibility generally reduces nitrogen and phosphorus released to the water. A baseline method can estimate nutrient release using ingredient digestibility proxies and then apply a consistent conversion to N and P loading potential per kg feed.
Reporting Format That Keeps Decisions Clear
For each ingredient and finished feed, report a compact table of metrics per functional unit, plus a short “boundary statement” listing what is included and what is excluded. This prevents misunderstandings like comparing an ingredient cradle-to-gate result with a finished feed cradle-to-farm result.
Minimum Baseline Package for a First Pass
If you need a starting point, use:
- kg CO₂e per kg ingredient and per kg finished feed
- MJ per kg ingredient and per kg finished feed
- Water withdrawal and water stress characterization per kg
- Nutrient loading potential per kg finished feed
- Waste treatment summary per kg finished feed
This set is small enough to build quickly, yet broad enough to catch the common tradeoffs that show up when you change protein sources or processing steps.
1.5 Practical Feed Quality Checks for Raw Materials and Finished Pellets
Quality checks work best when they follow a simple logic: verify identity and safety first, then verify performance-related properties, then confirm the finished product behaves the way the formulation expects. Think of it as a three-stage filter—no shortcuts, but no mystery either.
Raw Material Intake Checks That Prevent Expensive Surprises
Start with checks that catch the most common “wrong ingredient” problems early.
Identity and consistency
- Confirm supplier lot, ingredient name, and intended grade.
- Compare incoming nutrient specs with your formulation assumptions. If algae meal protein is consistently lower than expected, your feed will underperform even if everything else is perfect.
Moisture and storage stability
- Measure moisture on arrival. High moisture increases microbial risk and can cause clumping that later ruins mixing.
- Example: If fermented algae protein arrives at 12% moisture instead of 8%, expect more variability in pellet moisture uptake and potentially higher odor intensity.
Physical integrity
- Inspect for unusual color, odor, insect activity, or visible mold.
- Sieve or screen for excessive fines or agglomerates. Fines can change dosing accuracy and pellet durability.
Safety screening
- Run basic microbiological checks for fermented ingredients and any material with elevated moisture.
- Screen for contaminants relevant to your supply chain, such as heavy metals and residues, using your established acceptance limits.
Ingredient Sampling and Testing That Actually Represents the Lot
A test is only as good as its sample.
- Use a consistent sampling plan across the lot, not a few convenient bags.
- Mix the composite sample thoroughly before sub-sampling.
- Record sample mass, sampling method, and storage conditions so results can be interpreted later.
Example sampling workflow
- Take multiple increments from different bag positions.
- Combine into a composite sample.
- Split into analysis portions for moisture, proximate, and safety tests.
- Retain a sealed archive portion for re-tests.
Performance-Linked Tests for Raw Materials
These checks connect ingredient properties to feed behavior.
Proximate and protein quality
- Measure protein content and basic composition.
- For algae-derived proteins, also track solubility or dispersibility proxies if you have them. Lower solubility often shows up as poorer digestibility and higher waste.
Particle size and mixing behavior
- Determine particle size distribution for dry powders.
- Example: If crop protein flour is much coarser than algae meal, the mixer may not distribute it evenly, creating micro-zones of high protein that fish may not digest efficiently.
Water activity or equivalent indicators
- Use an indicator that matches your lab capability. The goal is to estimate microbial risk and storage stability.
Finished Pellet Checks That Confirm Manufacturing Worked
Finished pellets must meet both physical requirements and functional expectations.
Water stability and leaching
- Test pellet integrity after immersion under conditions matching your feeding environment.
- Example: If pellets disintegrate quickly, fish may receive less protein than intended, and nutrient-rich fines can increase water quality issues.
Pellet durability and handling strength
- Measure durability or a proxy such as breakage rate during handling.
- If durability is low, you may see higher fines in the tank, which changes feeding behavior and waste.
Moisture and internal conditioning
- Measure pellet moisture. Too high can promote spoilage; too low can increase brittleness.
- Confirm conditioning and drying targets match your process logs.
Uniformity and dosing accuracy
- Sample pellets from different locations in the batch and check marker-based uniformity if available.
- Example: If one silo is fed earlier in the run, ingredient segregation can cause a drift in pellet composition.
Sensory and odor screening
- Record odor and appearance consistently. Fermented ingredients can be acceptable with a mild characteristic note, but strong sour or rancid odors usually indicate process or storage issues.
Acceptance Criteria and Release Decisions
Define acceptance criteria before production, not after a problem.
- Use pass/fail thresholds for safety tests.
- Use action thresholds for performance-linked properties, such as moisture, durability, and water stability.
- If a batch fails a critical test, do not “fix it later” by adjusting feeding; the product itself must be corrected or rejected.
Mind Map: Feed Quality Checks Flow
Example: Integrated Check Sequence for an Algae Fermentation Batch
- On arrival: verify lot identity, measure moisture, inspect for clumping or odor.
- Before formulation: confirm protein content and a dispersibility proxy if available.
- During manufacturing: log conditioning parameters and verify mixer performance.
- After pelleting: test water stability and durability, then measure pellet moisture.
- Release: approve only if safety screening passes and performance-linked tests meet action thresholds.
This sequence keeps the “why” traceable: if pellets fail water stability, you can check whether ingredient moisture, particle size, or binder behavior is the likely driver—without guessing.
2. Nutritional Requirements for Aquaculture Species and Life Stages
2.1 Protein Requirements and Amino Acid Profiles for Common Culture Species
Protein is the main “building material” for growth, but it’s also the most expensive part of most aquafeeds. The practical goal is not simply “more protein,” but the right amino acid balance at the right digestibility, so fish use protein for tissue rather than burning it for energy.
Protein as a Growth Budget
Protein requirement is usually expressed as a percentage of diet, yet the real driver is how much usable amino acid the fish can absorb and use. Two diets with the same crude protein can perform differently if one has poorer digestibility or an amino acid pattern that forces the fish to deaminate excess amino acids.
A useful mental model is a budget with three lines: (1) essential amino acids that must be supplied, (2) nonessential amino acids that can be synthesized, and (3) energy that prevents protein from being wasted. If energy is too low, fish may catabolize amino acids even when the diet contains adequate crude protein.
Essential Amino Acids and Species Differences
Most cultured fish require the same core set of essential amino acids, but the exact balance matters. Carnivorous species (like many marine fish) generally have higher requirements for certain essential amino acids than omnivorous species (like many tilapias). Omnivores can often tolerate more plant ingredients because they can better use carbohydrates and may have different digestive physiology.
Amino acid profiles are typically discussed in two ways:
- Absolute requirement: grams of each essential amino acid per kilogram of diet.
- Relative balance: ratios among essential amino acids, which matter when formulating with multiple protein sources.
Life Stage Matters More Than People Expect
Juveniles usually need higher dietary protein and amino acid density than adults because they are building tissue rapidly and have less mature digestive systems. As fish grow, maintenance needs rise relative to growth, and the diet can often shift toward slightly lower protein density while keeping amino acid balance adequate.
A simple example: if two feeds both contain 40% crude protein, but one is designed for juveniles with higher lysine and methionine availability, it can outperform the other even if the crude protein number looks identical.
How Amino Acid Profiles Are Measured and Interpreted
Ingredient amino acid composition is measured by lab methods, but what matters for formulation is digestible amino acids. Digestibility depends on processing, anti-nutritional factors, and the fish’s ability to digest different protein sources.
When you see amino acid tables, treat them as starting points. A practical workflow is:
- Choose target essential amino acids for the species and life stage.
- Estimate digestibility by ingredient type and processing.
- Formulate to meet targets with a safety margin for variability.
- Verify with feed quality checks and, when possible, performance data.
Mind Map: Protein and Amino Acid Targets
Common Culture Species: Practical Targeting Logic
Below is a formulation logic that helps translate species biology into amino acid targets. Exact numeric requirements vary by strain, temperature, and feed type, so the emphasis is on how to set priorities.
- Marine carnivorous fish: prioritize essential amino acids that are often limiting in plant-heavy blends. Lysine and methionine frequently become bottlenecks when replacing fishmeal.
- Freshwater omnivorous fish: balance essential amino acids while leveraging better carbohydrate utilization. They may tolerate lower protein density than strict carnivores if energy is adequate.
- Tilapia and other omnivores: often respond well to diets that maintain essential amino acid balance rather than chasing very high crude protein.
- Shrimp and other crustaceans: generally require careful attention to amino acid availability and feed stability, because protein utilization is tightly linked to how quickly feed is consumed and how well nutrients remain in water.
Example: Spotting a Likely Limiting Amino Acid
Suppose you formulate a diet where crude protein is correct, but growth is slower than expected. A common cause is that one essential amino acid is under-supplied relative to the others.
Example scenario:
- Diet A and Diet B both contain 38% crude protein.
- Diet A uses a plant protein blend with lower digestible lysine.
- Fish show reduced growth and higher feed intake.
A practical fix is not to raise crude protein blindly. Instead, adjust the ingredient mix or processing to raise digestible lysine (and check methionine as a frequent companion constraint). Then re-check pellet quality and feeding rate, because poor water stability can mimic “nutrient deficiency” by reducing actual intake.
Quality Checks That Support Amino Acid Targets
Amino acid targets only help if the feed delivers them. Two checks are especially useful:
- Pellet water stability: if pellets disintegrate quickly, fish may not ingest the intended nutrient profile.
- Protein quality indicators: processing intensity can reduce amino acid availability, even when lab crude protein remains unchanged.
When protein and amino acid targets are set thoughtfully, you get a feed that performs consistently across batches—because the fish are getting what they can actually use, not just what the label claims.
2.2 Lipid Requirements Including Essential Fatty Acids and Energy Density
Lipid in aquafeeds is doing two jobs at once: it supplies energy and it provides specific fatty acids that fish cannot make in sufficient amounts. When lipid is too low, growth often slows because energy intake drops. When lipid is poorly chosen, fish may grow but show subtle health issues, including weak stress tolerance and abnormal tissue composition.
Core Lipid Roles in Fish Nutrition
Fish use dietary lipids to meet energy needs more efficiently than they can rely on carbohydrates alone. Lipids also carry fat-soluble compounds and influence how other nutrients are absorbed. A practical way to think about lipid requirements is to separate them into three targets: total energy from fat, essential fatty acid coverage, and lipid quality affecting digestibility and tissue deposition.
Essential Fatty Acids and Why They Matter
Many cultured species require omega-3 and omega-6 fatty acids, with omega-3 often being the most critical for membrane function and normal physiology. The key idea is that essential fatty acids must be present in the diet in usable forms, not just in theory.
A simple example: if a feed relies heavily on low-quality plant oils with limited omega-3 content, fish may still consume enough total fat to survive, but their tissues may show reduced omega-3 incorporation. That can show up as poorer performance under feeding stress or during periods of higher metabolic demand.
Energy Density and Feed Formulation Logic
Energy density is the amount of usable energy per unit feed. Lipid typically raises energy density because it is more energy-dense than protein or carbohydrate. Higher energy density can reduce feed intake needed to meet energy needs, which can help manage waste in some systems.
However, energy density is not a free lunch. If lipid is increased without balancing amino acids, protein can become relatively insufficient, and growth can plateau. If lipid is increased without maintaining emulsification and pellet quality, water stability can drop and leaching can increase.
Balancing Total Lipid with Essential Fatty Acid Coverage
A good formulation approach is to treat essential fatty acids as constraints first, then adjust total lipid to hit energy targets. For example, if you need a minimum omega-3 level, you choose an oil or lipid blend that meets that requirement. After that, you can fine-tune total lipid to reach the desired energy density.
Digestibility and Lipid Quality
Not all lipids are digested equally. Free fatty acids, triglycerides, and phospholipids behave differently in the gut. Oxidized oils can reduce palatability and may impair performance even when the fatty acid profile looks correct on paper.
A practical check is to compare performance across feeds that have similar crude fat but different oil handling histories. If one feed shows lower feed intake or higher waste, lipid quality is a likely culprit.
Practical Mind Map
Lipid Requirements Mind Map
Example: Two Feeds with Similar Crude Fat
Feed A contains the same crude fat percentage as Feed B, but Feed A includes a lipid blend that better covers omega-3 needs. In a feeding trial, both feeds might initially support survival. Over time, Feed A typically shows better growth consistency because essential fatty acids support normal physiology and membrane maintenance, while Feed B may show slower gains or higher variability.
Example: Energy Density Adjustment Without Breaking Protein Balance
Suppose a grow-out diet is underperforming because fish are not meeting energy needs. You increase lipid slightly to raise energy density. If you also reduce protein too much to keep cost constant, growth can stall because amino acids become limiting. The fix is to adjust lipid for energy while keeping amino acid supply aligned with species and life stage needs.
Example: Preventing Leaching Losses
If you raise lipid to increase energy density but pellet water stability is weak, more lipid can leach into the water before fish consume it. That reduces effective energy intake and can increase organic load. Improving binder selection, conditioning parameters, and pellet durability can restore performance without changing the nutritional targets.
Quick Takeaways
- Essential fatty acids are requirement-driven, not optional.
- Energy density is adjustable, but it must not undermine amino acid balance.
- Lipid quality and digestibility determine whether the fatty acids you add actually get used.
- Pellet stability matters because leaching turns “formulated fat” into “lost fat.”
2.3 Carbohydrates Fiber and Digestibility Considerations in Aquafeeds
Carbohydrates, Fiber, And Digestibility Considerations in Aquafeeds
Carbohydrates in aquafeeds mainly show up as starches, sugars, and structural carbohydrates (often grouped as fiber). In fish and shrimp diets, carbohydrates are not automatically “bad,” but they are not free either: they compete with protein for digestion capacity, influence pellet water stability, and affect gut conditions through how quickly they are broken down.
Carbohydrates: Roles and Limits
Starch is the most common carbohydrate source. Its usefulness depends on how fast it gelatinizes during processing and how readily it is digested in the target species. A practical way to think about it is timing: if starch is digested quickly, it can support energy needs; if it reaches the hindgut largely undigested, it can increase microbial activity and shift waste characteristics.
Sugars and readily fermentable carbohydrates behave differently. They can raise energy availability early, but they also tend to increase gut fermentation when included at high levels or when the feed is poorly processed. For example, a diet with a moderate amount of a soluble carbohydrate can improve feed intake, while the same carbohydrate at higher inclusion may increase fecal softness and raise the load of dissolved organics in the water.
Fiber: What It Is and Why It Matters
Fiber is not one ingredient; it is a set of plant structures such as cellulose, hemicellulose, and lignin. Fiber can be beneficial in small amounts by improving pellet handling and providing some gut “texture,” but it usually reduces digestibility because fish digestive enzymes have limited ability to break down many fiber components.
The key is to separate “functional fiber” from “indigestible bulk.” Functional fiber can help with pellet durability and reduce dust, while indigestible fiber mainly increases fecal volume and can lower nutrient absorption. A simple example: two feeds with the same crude protein can perform differently if one uses a high-fiber crop meal. The high-fiber feed may show similar growth initially, but later it can worsen feed conversion because less of the protein and energy is absorbed.
Digestibility: The Chain from Ingredient to Gut
Digestibility is influenced by three linked stages: ingredient composition, processing effects, and gut environment.
- Ingredient composition sets the baseline. Starch type matters, and fiber composition matters even more. Two meals with the same crude fiber percentage can behave differently if one has more lignified material.
- Processing effects change how nutrients become accessible. Extrusion and conditioning can gelatinize starch, which generally improves starch digestibility. However, excessive heat or poor moisture control can also damage proteins and reduce overall performance.
- Gut environment determines what happens after ingestion. Faster carbohydrate digestion can reduce protein catabolism for energy, but excessive fermentable carbohydrates can increase microbial activity and alter gut pH.
A useful operational check is to observe feces and water quality together. If a feed increases fecal stringiness or fine particulate loss, it often signals incomplete digestion or weak pellet integrity, both of which can be connected to carbohydrate and fiber behavior.
Practical Formulation Considerations
When formulating, treat carbohydrate and fiber as variables that interact with protein and lipid.
- Balance energy sources: If carbohydrates are increased without adjusting protein, the diet may still perform well, but only if starch is digestible and processing is consistent.
- Control fiber level and type: Keep fiber within species-appropriate ranges and prefer ingredients with predictable fiber composition.
- Match processing to ingredient behavior: Starch-rich ingredients usually benefit from processing that promotes gelatinization. High-fiber ingredients may require extra attention to particle size and pellet durability.
Example: Suppose you replace part of a low-fiber grain meal with a higher-fiber crop meal. You can compensate by reducing inclusion slightly, increasing digestible energy from lipids, and adjusting pellet conditioning to reduce leaching. Then verify with digestibility proxies and water stability observations rather than assuming the swap is neutral.
Measuring and Interpreting Digestibility
Digestibility is not just a lab number. It shows up in feed conversion, waste output, and sometimes gut histology.
- Starch digestibility proxies: Monitor how much carbohydrate-derived material appears in feces and how quickly pellets disintegrate.
- Fiber impact: Track fecal volume and settling behavior. More fiber often means more solids, which can be managed by improving pellet integrity and reducing indigestible fractions.
- Species differences: Herbivorous and omnivorous species generally tolerate more carbohydrate than strict carnivores, but even within a species, life stage and temperature can change digestion capacity.
Mind Map: Carbohydrates, Fiber, and Digestibility
Example: Diagnosing a Carbohydrate-Fiber Problem
A grow-out trial shows worse feed conversion and higher suspended solids after switching to a new plant meal. Pellet durability tests show normal hardness, but pellets disintegrate faster in water. The new meal has higher fiber and a starch fraction that gelatinizes less under the current conditioning profile. The fix is not just “lower fiber.” It is to reduce the high-fiber ingredient inclusion, adjust conditioning moisture and temperature to improve starch gelatinization, and confirm that fecal solids decrease alongside water clarity.
In short, carbohydrates and fiber shape digestibility through processing accessibility and gut outcomes. When you treat them as linked variables—rather than separate ingredient categories—you get feeds that waste less and perform more consistently.
2.4 Mineral and Vitamin Requirements Including Trace Elements and Chelation
Minerals and vitamins are the “small stuff” that quietly determines whether aquafeed nutrients actually get used. Fish need them for enzyme function, oxygen transport, bone formation, nerve signaling, and immune defense. The tricky part is that minerals interact with each other and with feed ingredients, so the same inclusion rate can behave differently across formulations.
Core Mineral Roles and How Requirements Are Set
Start with the big categories: macro-minerals (like calcium and phosphorus) and trace minerals (like iron, zinc, and selenium). Requirements are typically expressed as percent of diet for macro-minerals and as mg/kg for trace minerals, then adjusted for species, life stage, and water conditions. For example, a juvenile fish often has higher relative mineral needs because growth is fast and tissue turnover is high.
A practical way to set targets is to treat minerals as two linked systems: (1) structural minerals that build tissues and (2) functional minerals that support metabolism. Calcium and phosphorus are structural; iron and zinc are functional. If you only balance structural minerals, you can still see poor growth or weak stress tolerance because functional minerals are missing or poorly absorbed.
Trace Elements and Chelation Basics
Trace minerals can be present in feed as inorganic salts or as chelated forms. Chelation means a ligand binds the mineral ion, forming a complex that is more stable in the digestive tract. That stability can improve absorption and reduce antagonism from other dietary components.
Chelation matters because mineral ions are reactive. In the gut, they can bind to phytate, compete with each other, or precipitate with compounds like phosphates. A chelated mineral is less likely to get “stuck” or neutralized before it can be absorbed.
A simple example: if a plant-heavy ingredient contributes phytate, zinc and iron may become less available. Using a chelated zinc source can help maintain zinc availability without raising total zinc to excessive levels.
Antagonists and Synergies in Mineral Nutrition
Minerals rarely act alone. Common antagonists include:
- Calcium–Phosphorus balance: too much calcium relative to available phosphorus can reduce phosphorus utilization.
- Iron–Copper–Zinc competition: high levels of one trace mineral can suppress uptake of others.
- Phytate binding: especially relevant when plant proteins are a major ingredient.
Synergies also exist. For instance, adequate vitamin status can support mineral utilization indirectly by maintaining enzyme systems and gut integrity. That’s why mineral formulation should be coordinated with vitamin inclusion rather than treated as a separate spreadsheet exercise.
Vitamin Requirements and Their Mineral Connections
Vitamins are organic compounds required in small amounts, but they influence mineral handling. Vitamin A supports epithelial integrity, which affects absorption surfaces. Vitamin D is tightly connected to calcium and phosphorus metabolism, because it regulates calcium transport and bone mineralization.
B vitamins and vitamin C support energy metabolism and collagen formation, which can influence tissue repair and stress resilience. While vitamins do not “chelate” minerals, they can change how well the fish can use minerals once they are absorbed.
Chelation Selection and Practical Formulation Checks
Chelated minerals are not all identical. Key practical checks include:
- Chelate type and stability: some complexes are designed to resist digestive conditions better than others.
- Bioavailability evidence: ingredient specifications should indicate the intended chelated form.
- Compatibility with binders and processing: mineral complexes can be affected by heat and formulation pH.
A formulation example: suppose you are increasing plant protein to reduce reliance on fishmeal. You may notice that growth slows even when total zinc and iron are within target ranges. A likely cause is reduced mineral availability from phytate and competition. Chelating one or more trace minerals can restore performance without pushing total mineral levels upward.
Mind Map: Mineral and Vitamin Requirements with Chelation
Example: Diagnosing Mineral Imbalance in a Plant-Heavy Diet
Imagine a feed reformulation that increases soybean meal and reduces fishmeal. Total phosphorus and zinc are adjusted to match label targets. After a few weeks, fish show slower growth and slightly poorer feed conversion.
A systematic check would look at:
- Phosphorus form and availability: plant phosphorus is often less available.
- Phytate impact: phytate can bind zinc and iron, lowering absorption.
- Calcium–phosphorus ratio: if calcium was increased for pellet quality or formulation convenience, phosphorus utilization may drop.
- Vitamin D adequacy: if vitamin D is low, calcium-phosphorus handling can suffer.
If zinc and iron availability are the issue, chelated zinc and iron can be used to improve mineral uptake without simply raising total inclusion. If phosphorus availability is the issue, you would address phosphorus digestibility directly rather than compensating with more total phosphorus.
Practical Takeaway for Integrated Mineral and Vitamin Formulation
Treat minerals and vitamins as a coordinated system: balance structural minerals, protect trace mineral availability with chelation when antagonists are present, and ensure vitamin D and gut-support vitamins are consistent with the mineral plan. When you do that, you reduce the odds that “on paper” nutrient targets turn into “in practice” underperformance.
2.5 Feeding Regimens and How They Affect Feed Conversion and Waste
Feeding regimen means more than “how much feed.” It covers timing, feeding frequency, rationing method, and how quickly fish can access pellets. Those choices determine how much of the nutrient budget becomes growth versus what ends up as uneaten feed and dissolved waste.
Core Concepts That Link Feeding to Feed Conversion
Feed conversion ratio (FCR) improves when fish consume a higher fraction of offered nutrients and convert them efficiently. Waste rises when feed is offered faster than fish can eat, when pellets break down before reaching the gut, or when feeding does not match appetite and digestion capacity.
Start with a simple mental model:
- Intake depends on fish behavior, pellet buoyancy/sinking rate, and water mixing.
- Digestion depends on temperature, gut transit time, and feed particle size.
- Excretion depends on how much nutrient is absorbed versus passed through.
If intake is low, FCR worsens even if the feed is nutritionally perfect. If digestion is slow relative to feeding schedule, fish may eat but still excrete more nitrogen and phosphorus.
Mind Map: Feeding Regimen Drivers
Timing and Frequency: Matching Appetite to Digestion
Fish appetite typically tracks water temperature and activity. A regimen that ignores temperature often creates a predictable pattern: fish eat less than expected, and the “extra” feed becomes waste.
Practical approach:
- Feed at consistent times so fish learn the routine.
- Adjust daily ration when temperature changes meaningfully.
- Use smaller, more frequent meals when fish are less active or when pellets are prone to dispersing quickly.
Example: In a tank where pellets sink and settle fast, feeding once daily can lead to a pile at the bottom. If fish cannot reach it before it softens, fines increase and intake drops. Switching to two or three feedings spreads consumption over time and reduces bottom accumulation.
Rationing Methods: Fixed Percent vs Demand-Based
A fixed ration (for example, a percent of biomass per day) is easy to run, but it assumes biomass and appetite stay stable. In practice, biomass changes, and appetite shifts with temperature, oxygen, and fish size distribution.
Demand-based rationing uses observable signals: feeding response, pellet disappearance rate, and behavior. The goal is to offer feed that is consumed within a target window.
Example: If pellets disappear in 10–15 minutes during normal conditions but take 30 minutes after a temperature drop, the regimen should reduce ration immediately. Otherwise, the extra pellets inflate FCR and increase waste load.
Pellet Behavior and Water Mixing: Where Waste Starts
Even with correct ration size, pellet physics can sabotage intake.
Key failure modes:
- Pellet breakage creates fines that drift away before fish can capture them.
- Wrong buoyancy/sinking rate means pellets stay in the wrong zone.
- Insufficient mixing leaves feed concentrated in one area, favoring dominant fish.
Example: In a raceway, strong current may carry pellets downstream faster than fish can intercept them. A regimen that increases feeding frequency without addressing pellet sinking rate can still fail because fish never get a fair chance to eat.
Measuring Waste: From “Looks Uneaten” to Actionable Indicators
Waste is not only what you see. Dissolved waste depends on how much nutrient is absorbed and how quickly fish process it.
Use a layered check:
- Uneaten feed assessment: observe pellet disappearance and bottom accumulation.
- Fecal indicators: look for changes in fecal stringiness and settling patterns.
- Water quality trends: track nitrogen and phosphorus indicators alongside feeding changes.
Example: If FCR worsens while pellet disappearance time stays normal, the issue may be digestion or feed quality rather than ration size. If FCR worsens and pellets linger, the issue is likely intake and pellet behavior.
Advanced Details: Life Stage and Size Uniformity
Young fish often have narrower feeding windows and higher sensitivity to pellet size and digestibility. Size variation within a tank can also distort outcomes: larger fish eat first, leaving smaller fish underfed.
Example: With mixed sizes, a single ration can satisfy fast-feeding individuals while smaller fish get less. More frequent feedings can help smaller fish catch up, but only if pellets remain accessible in the feeding zone.
A Simple Regimen Workflow
Use this step-by-step routine to connect regimen decisions to measurable outcomes.
Example:
1. Set a starting daily ration based on biomass and temperature.
2. Feed 2–3 times per day to reduce pellet accumulation.
3. Observe pellet disappearance time after each feeding.
4. If pellets persist beyond the target window, reduce ration next feeding.
5. Update biomass after routine sampling and adjust ration accordingly.
6. Track FCR and water quality indicators to confirm the cause.
A good regimen is consistent enough to be measurable, flexible enough to respond to appetite and pellet behavior, and disciplined about using observations to correct the next feeding. When those pieces line up, waste drops without sacrificing growth.
3. Algae Meal as a Protein Ingredient for Aquafeeds
3.1 Selecting Algae Biomass Types for Protein Content and Functional Properties
Choosing an algae biomass for aquafeed starts with two questions: how much usable protein it contains, and how that protein behaves in water and during digestion. “Protein content” is only half the story; “functional properties” determine whether the protein stays available long enough to be eaten and whether it supports growth without creating unnecessary waste.
Step 1: Classify Algae by Protein Potential and Cell Structure
Algae are often grouped by their pigments and cell characteristics, which strongly influence protein yield and processing behavior.
- Microalgae (single-celled): typically higher protein per unit dry mass than many macroalgae. Their small cells can be easier to mill uniformly, which helps consistency in feed formulations.
- Macroalgae (seaweeds): can be protein-rich in some species, but they also bring higher levels of structural carbohydrates and minerals. Those components can be useful, but they may require more careful formulation to avoid reducing digestible protein fraction.
A practical rule: if your goal is a protein ingredient with predictable milling and mixing, microalgae usually offer fewer surprises. If your goal includes additional functional polysaccharides, macroalgae may contribute more “built-in” functionality, but you’ll need tighter quality control.
Step 2: Compare Protein Content Using More Than One Metric
Protein percentage on a label or lab report is a starting point, not a finish line. Two biomasses can share similar crude protein values but differ in amino acid balance and in how much of that protein becomes available after processing.
Use a small set of metrics:
- Crude protein (dry basis) to estimate inclusion feasibility.
- Amino acid profile to check whether essential amino acids match the target species.
- Protein solubility or dispersibility as a proxy for how quickly protein interacts with water and feed binders.
Example: Suppose two microalgae meals both test at ~45% crude protein. If one meal’s protein disperses poorly, it may increase pellet leaching and reduce effective intake. The “lower” protein meal might perform better if it disperses well and matches amino acid needs.
Step 3: Evaluate Functional Properties That Matter in Aquafeeds
Functional properties determine whether protein stays in the pellet, mixes evenly, and supports digestion.
Key functions to assess:
- Water stability and leaching behavior: Protein that dissolves too quickly can leave the pellet before fish consume it, especially in fast-flow systems.
- Emulsification and fat binding: Algae proteins can help hold lipids in place, improving energy utilization and reducing rancidity exposure.
- Particle size and surface area: Finer meals can improve mixing but may increase dust and change pellet durability.
- Digestibility proxies: Even without full in vivo trials, solubility and processing sensitivity can indicate how much protein will be available.
A simple bench check: mix a measured amount of algae meal into water, observe settling and cloudiness over time, and compare how quickly the mixture clears. Faster clearing often suggests more aggregation, which can correlate with poorer dispersibility in feed.
Step 4: Account for Pigments, Lipids, and Anti-Nutritional Factors
Algae composition varies with growth conditions, which affects pigments and lipids.
- Pigments can be beneficial at low levels but may alter color and palatability. They can also interfere with certain analytical methods, so plan testing accordingly.
- Lipids influence energy density and oxidation risk. If the biomass is lipid-rich, storage conditions become part of “functional performance.”
- Anti-nutritional factors may include compounds that reduce digestibility or irritate the gut. The practical approach is not to guess; it’s to test and then adjust processing or inclusion rates.
Example: If a biomass contains higher levels of compounds that reduce digestibility, fermentation or targeted processing may be needed. Even then, you still start with a biomass that has a reasonable protein baseline.
Step 5: Match Biomass Choice to Your Processing Route
Your downstream plan—drying, milling, extraction, or fermentation—changes what “best” means.
- If you will ferment algae meal, prioritize biomass that can be consistently milled and that has manageable baseline safety and contaminant profiles.
- If you will use whole or minimally processed meal, prioritize dispersibility, pellet compatibility, and stable amino acid availability.
A good selection process includes a small pilot: mill the candidate biomass to your target particle size, run a short water stability test with a representative binder system, and then check whether the protein fraction behaves consistently.
Mind Map: Biomass Selection Logic
Example: Two Candidate Biomasses with Different Tradeoffs
Consider two microalgae meals, A and B.
- Meal A: higher crude protein, but it aggregates quickly in water and shows higher pellet leaching in a binder test.
- Meal B: slightly lower crude protein, but it disperses more evenly and improves pellet water stability.
If your fish species and feeding method rely on pellet integrity in water, Meal B may deliver better effective protein intake even with the lower crude protein number. The selection decision becomes a functional one, not just a chemistry one.
Step 6: Lock Selection Criteria Into a Simple Acceptance Checklist
To avoid “best on paper” choices, define acceptance criteria before you buy or scale up.
- Minimum crude protein threshold
- Minimum essential amino acid coverage for the target species
- Dispersibility or settling behavior target
- Water stability and leaching test outcome
- Lipid oxidation risk controls for storage
- Safety and contaminant screening results
A biomass that passes these checks is not automatically perfect, but it is predictable—predictability is what lets formulation and fermentation work without constant firefighting.
3.2 Processing Algae Biomass Into Meal Including Drying Grinding and Storage
Processing algae biomass into a stable aquafeed ingredient is mostly about controlling three things: water, particle size, and time. If you get those right, the rest of the formulation work becomes easier and more predictable.
Core Inputs and What They Control
Start with the biomass you have. Algae harvested as wet paste behaves differently from biomass already partially dried. High moisture increases microbial risk and makes drying energy-hungry, while high ash or residual salts can affect grinding performance and pellet water stability later.
A practical way to think about the workflow is: drying reduces water activity, grinding standardizes particle size, and storage prevents quality drift. Each step should leave you with measurable targets rather than “it looks dry enough.”
Drying Fundamentals for Meal Stability
Drying aims to lower water activity so spoilage organisms can’t grow. In practice, you also want to avoid excessive heat that can reduce protein functionality and darken the meal.
Drying Methods and Selection Logic
- Low-temperature drying with longer residence time: gentler on proteins, often used when you can manage space and time.
- Thermal drying with higher temperatures: faster, but requires tighter control to avoid scorching.
- Belt or tray drying: good for consistent airflow and manageable batch sizes.
- Drum drying: can produce uniform powders, but requires careful handling of stickiness and cleaning.
Selection is not just about speed. If your biomass contains more bound water or has a higher lipid fraction, it may require different airflow and temperature profiles to reach the same final moisture.
Drying Targets and Simple Checks
Use targets that match your downstream use. For aquafeed meal, you typically want a moisture level low enough to prevent clumping and microbial growth during storage. Instead of relying on appearance, use:
- Moisture measurement (oven method or moisture analyzer) for each batch.
- Bulk density and flowability as quick indicators of over- or under-drying.
- Color and odor checks to catch overheating or contamination.
A useful operational habit is to record drying conditions alongside final moisture. When you later troubleshoot pellet leaching or digestibility differences, those records become your fastest explanation.
Grinding for Consistent Formulation
Grinding turns dried biomass into a meal with predictable surface area. Particle size affects mixing uniformity, digestibility proxies, and pellet durability.
Choosing a Grinding Strategy
- Coarse grind first, then fine grind: reduces heat buildup and helps avoid smearing.
- Cryogenic or chilled grinding: useful when the biomass is prone to gumming or when you need tight particle size control.
- Screen selection: determines the final distribution; too fine can increase dust and segregation during handling.
If your meal contains higher ash or mineral content, grinding can wear equipment faster. Plan for maintenance intervals and monitor motor load to avoid inconsistent output.
Controlling Heat and Dust
Grinding generates frictional heat. Excess heat can worsen protein functionality and increase oxidation risk, especially if lipids remain. Keep an eye on:
- Temperature rise at the mill or in the collected meal.
- Dust collection efficiency to maintain safe and consistent material flow.
- Sieving to remove oversized particles that would otherwise create mixing gradients.
Practical Example
Suppose you dry algae to a stable moisture level, then grind through a screen that yields a moderate particle size distribution. When you later formulate, you can expect more consistent mixing with binders because the meal behaves similarly batch to batch. If instead you grind too fine, you may see faster water uptake in the pellet and higher fines loss during handling.
Storage That Prevents Quality Drift
Storage is where good processing gets tested. Even well-dried meal can degrade if it absorbs moisture, oxidizes, or picks up contaminants.
Packaging and Environment
- Moisture barriers: use packaging that limits water vapor ingress.
- Temperature control: cooler storage slows oxidation and reduces condensation risk.
- Ventilation and airflow management: prevents localized hot spots and uneven drying.
Anti-Caking and Handling Practices
Caking happens when residual moisture and fine particles interact. To reduce it:
- Keep meal dry during transfer and bagging.
- Avoid long delays between grinding and packaging.
- Use first-in-first-out rotation so older batches don’t sit through multiple humidity cycles.
Storage Monitoring
Set a routine that matches your risk level. At minimum, track:
- Moisture at receipt and periodically during storage.
- Odor and color drift as early warning signs.
- Bulk flow behavior to detect caking before it becomes a mixing problem.
Mind Map: Drying Grinding Storage Workflow
Integrated Example Workflow
A typical batch workflow looks like this: harvest algae paste, dewater to a manageable starting moisture, dry to a measured moisture target, cool before bagging to avoid condensation, grind with a controlled screen and temperature management, sieve to remove oversize, then package in moisture-barrier bags and store in a cool, dry area with FIFO rotation. Each step is verified with a quick check so you can connect processing choices to later feed performance.
3.3 Protein Extraction Options and Their Effects on Solubility and Digestibility
Protein extraction is the part where you trade “how much protein you get” against “how usable that protein is.” Solubility and digestibility are linked but not identical: solubility affects how easily enzymes and gut fluids can contact proteins, while digestibility also depends on how the protein structure survives processing.
Foundational Concepts for Extraction Choices
Start with three practical targets. First, maximize recovery of the protein fraction from algae biomass or other feedstock. Second, preserve protein structure enough for enzymes to access cleavage sites. Third, avoid co-extracting compounds that interfere with digestion or reduce palatability.
Solubility is often improved by reducing particle size, removing cell-wall barriers, and breaking protein aggregates. Digestibility is improved when proteins are not excessively denatured into forms that resist enzyme access, and when anti-nutritional factors are reduced.
A simple way to think about it: extraction is like preparing ingredients for cooking. If you chop too aggressively, you may release flavor compounds but also change texture. If you extract too gently, you may keep the protein locked behind tough walls.
Mechanical Disruption and Its Limits
Mechanical extraction uses milling, homogenization, or pressing to increase surface area and release proteins. It tends to preserve native-like protein structure better than harsh chemical steps, which can support digestibility. However, mechanical methods alone often leave proteins trapped in cell walls or membranes, limiting recovery and sometimes leaving solubility modest.
Easy example: compare two batches of dried algae meal. Batch A is milled to a finer particle size before extraction; Batch B is only coarsely ground. Batch A typically shows higher solubility because enzymes can reach proteins faster, even if the protein chemistry is unchanged.
Solvent and Buffer Extraction for Higher Solubility
Solvent or buffer extraction uses pH and ionic strength to solubilize proteins. Alkaline extraction can increase solubility by disrupting protein-protein interactions and cell components. Acidic or neutral buffers can be gentler, sometimes improving digestibility by reducing extreme denaturation.
Key trade-off: stronger conditions often raise solubility and recovery but can increase denaturation, which may reduce digestibility if proteins become too aggregated after neutralization.
Easy example: an alkaline extraction followed by careful pH adjustment can yield a protein concentrate with good solubility. If the pH adjustment is abrupt or poorly controlled, proteins may precipitate into larger aggregates, lowering solubility and slowing enzyme access.
Isoelectric Precipitation and Concentration Effects
Isoelectric precipitation concentrates proteins by bringing them near their isoelectric point, where net charge is minimal and proteins aggregate. This can boost protein concentration, but it often reduces solubility because the aggregated proteins are less dispersible.
Digestibility can still be acceptable if the proteins are later re-dispersed in feed matrices and if anti-nutritional co-factors are removed. But if the concentrate remains poorly soluble, enzymes may struggle to contact proteins during digestion.
Easy example: a protein concentrate made by isoelectric precipitation may show high protein percentage on paper, yet lower in vitro digestibility than a more soluble extract. The “paper protein” is real; the “accessible protein” is the limiting factor.
Enzymatic Extraction for Improved Accessibility
Enzymatic extraction uses proteases or cell-wall degrading enzymes to release proteins and partially hydrolyze them. Mild hydrolysis can increase solubility and improve digestibility because enzymes and gut enzymes share similar cleavage logic.
The caution is degree of hydrolysis. Too little hydrolysis may not improve accessibility much. Too much hydrolysis can create small peptides that may be rapidly absorbed but can also alter flavor and reduce pellet stability when used in feed.
Easy example: if you run a short enzymatic treatment, you may see a jump in solubility with minimal changes in peptide profile. Extending the reaction further can increase solubility again, but you may also observe more bitterness and reduced water stability in pellets.
Thermal and Combined Treatments
Thermal steps can help denature proteins, reduce microbial load, and improve extraction efficiency when paired with pH or enzymes. The effect on digestibility is mixed: moderate denaturation can unfold proteins and expose cleavage sites, while excessive heat can cause irreversible aggregation.
Combined extraction is common: mechanical disruption plus buffer extraction, or enzymatic treatment plus mild thermal conditioning. The goal is to use each step for what it does best—release, solubilize, and then protect accessibility.
Easy example: a brief heat step before buffer extraction can improve recovery. But if the heat is too long, the extracted protein may become less soluble after pH adjustment due to aggregation.
Extraction Output Types and How They Behave in Feed
Different extraction routes produce different “protein forms” that behave differently in aquafeeds.
- Protein-rich soluble fractions tend to support faster enzyme contact and often show higher in vitro digestibility.
- Protein concentrates may have good digestibility if re-dispersible, but solubility can limit performance.
- Hydrolysates usually show high digestibility due to pre-cleavage, but they can affect palatability and processing behavior.
Mind Map of Extraction Options and Their Effects
Practical Selection Workflow for Algae Meal
- Start with a solubility screen using a mild buffer at small scale to see how much protein is already accessible.
- Choose the mildest method that meets recovery needs; if recovery is low, add mechanical disruption before escalating pH strength.
- If solubility is the bottleneck, consider enzymatic assistance with controlled reaction time.
- If concentration is required, use precipitation carefully and verify re-dispersion behavior in a feed-relevant matrix.
- Confirm with digestibility proxies such as in vitro digestibility or enzyme accessibility tests, not only protein percentage.
Easy example: a facility aiming to use algae meal fermentation protein in pellets can run three micro-batches—mechanical-only, buffer-only, and buffer-plus-short enzymatic step—then compare solubility and in vitro digestibility. The best option is the one that improves accessibility without creating aggregates that refuse to disperse once the pellet hits water.
3.4 Anti-Nutritional Factors Pigments and Flavor Compounds in Algae Meal
Algae meal can be nutritious, but it also carries compounds that affect palatability, digestion, and safety. Think of this section as a map from “what’s in the meal” to “what it does in the fish,” then to “how you manage it” during processing and formulation.
What Counts as Anti-Nutritional Factors
Anti-nutritional factors are not automatically “bad”; they are simply compounds that reduce nutrient availability or interfere with normal digestion. In algae meals, the most common issues are cell-wall barriers, indigestible fractions, and bioactive molecules that can irritate the gut or bind nutrients. A practical way to spot them is to compare expected protein digestibility with what you observe in small feeding tests; if growth lags while feed intake stays normal, digestion is likely the bottleneck.
Pigments and Their Dual Role
Pigments such as chlorophylls and carotenoids can be beneficial antioxidants, but they also influence color, odor, and sometimes digestibility. Chlorophyll-related compounds may contribute to a green-brown tint that can affect feed acceptance in some species. Carotenoids are generally more stable, yet their presence can correlate with higher lipid fractions, which changes pellet texture and water stability. The key is to treat pigments as part of the ingredient’s “functional package,” not as isolated molecules.
Flavor Compounds and Palatability
Flavor compounds in algae meal often come from residual lipids, fermentation byproducts, or incomplete drying. Fish may respond with reduced feed intake, which then looks like “poor nutrition” even when amino acids are adequate. A simple operational check is to compare pellet odor intensity across batches and relate it to intake in a short adaptation period. If intake drops immediately after switching batches, you likely have a flavor or drying-related issue rather than a formulation math problem.
Systematic Management Workflow
Start with ingredient characterization, then choose processing controls, then verify with feed-level checks.
- Characterize the meal: record moisture, crude protein, crude lipid, ash, and basic odor/color notes. If you can, add measures that reflect digestibility risk such as fiber-like fractions or cell-wall indicators.
- Identify likely drivers: high moisture and lipid oxidation often correlate with stronger odors; high indigestible fractions correlate with lower digestibility.
- Apply targeted processing: adjust drying conditions, consider mild heat treatments to reduce cell-wall barriers, and control oxygen exposure during storage.
- Formulate with guardrails: use inclusion levels that match your species’ tolerance, and balance with more digestible protein sources when needed.
- Verify with practical tests: run short digestibility or performance checks and track feed intake and fecal consistency.
Mind Map: Compounds to Controls
Example: Diagnosing a Digestibility Drop
A tilapia feed trial uses the same formulation except algae meal inclusion rises from 8% to 12%. Growth slows, but feed intake is unchanged. The most likely explanation is that the higher inclusion increases indigestible fractions or cell-wall barriers beyond what the fish can handle. The fix is not to “remove all algae,” but to reduce inclusion back to a digestibility-safe range and pair with a processing step that improves protein availability, such as more thorough drying and a barrier-reducing pre-treatment before milling.
Example: Odor-Driven Intake Loss
A batch of algae meal smells more strongly after storage in a warm warehouse. When pellets are fed, fish take fewer bites and show slower growth within the first week. Since the amino acid profile is unchanged, the likely driver is flavor or oxidation-related compounds. The corrective action is to tighten storage controls: lower moisture, reduce headspace oxygen exposure, and standardize batch drying so odor intensity stays within the same band.
Example: Pigment-Linked Pellet Handling Issues
A carotenoid-rich algae meal increases pellet color intensity and slightly softens pellets during water exposure. This often happens when pigments correlate with higher lipid fractions that affect binder behavior. The practical response is to adjust binder level or pellet conditioning parameters while keeping nutrient targets constant, then confirm water stability with a simple leaching test.
Practical Acceptance Criteria for Batches
Use consistent batch logs for odor, color, and moisture, and set internal thresholds for “same ingredient, same sensory band.” When a batch deviates, treat it as a processing or storage issue first, then reassess inclusion rate and digestibility expectations. This keeps anti-nutritional factors, pigments, and flavor compounds from turning into surprise variables in your feed performance.
3.5 Practical Inclusion Levels and Formulation Adjustments Using Bench Trials
Bench trials turn “it should work” into “it does work under our constraints.” The goal is to find inclusion levels for algae meal and fermentation protein that meet nutrient targets, avoid negative palatability or digestibility surprises, and keep pellet quality stable. The process is systematic: start with a baseline, test a small set of inclusion levels, measure a few high-signal outcomes, then adjust formulation knobs.
Step 1: Set a Baseline and Define What “Good” Means
Begin with a reference formula that already performs acceptably in your system. Define measurable acceptance criteria before you mix anything. For inclusion-level work, three outcomes usually carry the most information:
- Nutrient delivery: crude protein, key amino acids, and energy proxies in the finished ingredient blend.
- Feed handling: pellet durability and water stability, because inclusion changes can alter binder behavior.
- Biological response proxies: digestibility indicators (e.g., in vitro digestibility or digestibility proxies) and palatability cues (e.g., feed intake in short tank tests).
A simple rule: if a trial fails on handling, you stop there. If handling passes but biological proxies fail, you adjust protein quality or anti-nutritional burden.
Step 2: Choose Inclusion Levels That Reveal a Trend
Use a small ladder rather than a single point. For example, test 0%, 2.5%, 5%, and 7.5% inclusion of algae meal (or fermented algae protein) on a dry-matter basis. The exact numbers depend on your baseline protein source and species needs, but the logic stays the same: include a low point near your current practice, a mid point that likely fits nutrient targets, and a high point that stresses the system.
Keep other variables controlled. If you raise algae inclusion, you must lower something else to maintain equal total protein and energy. Otherwise you cannot tell whether the ingredient itself or the nutrient shift caused the result.
Step 3: Build Formulation Adjustments Around Constraints
When inclusion changes, you typically need to adjust one or more of these knobs:
- Amino acid balance: fermented proteins can shift amino acid availability. If lysine or methionine becomes limiting, supplement with the same type of amino acid source across all treatments.
- Energy and lipid balance: algae ingredients may differ in lipid fraction. If energy changes, adjust with a consistent energy source so feed conversion differences don’t get blamed on protein.
- Minerals and micronutrients: algae meal can carry minerals that displace other mineral premixes. Recalculate total levels and keep trace minerals within your target range.
- Fiber and ash effects: higher ash or fiber can reduce digestibility proxies and affect pellet water stability. If ash rises, compensate by reducing mineral-rich fractions elsewhere.
A practical example: suppose your baseline uses fishmeal and soybean meal. You replace part of fishmeal with fermented algae protein. You keep total protein constant, but you notice pellet water stability drops at 7.5% inclusion. That suggests binder interaction changes, not just nutrient delivery. You then adjust binder level or conditioning moisture while keeping the protein blend constant.
Step 4: Run a Bench-Scale Workflow That Mimics Production
Bench trials should resemble production steps, not just mixing. Use the same grinding fineness, conditioning temperature range, and drying approach as your plant can support. If you cannot match everything, match the steps most likely to affect protein functionality and pellet integrity.
Measure outcomes with quick turnaround tests:
- Water stability: compare pellet disintegration after a fixed time in water.
- Durability: use a simple tumbling or drop-based durability check.
- Digestibility proxy: run an in vitro assay or a standardized enzymatic digestibility test.
- Palatability check: in a short feeding window, record feed intake rate and uneaten fraction.
Step 5: Interpret Results and Pick the Inclusion Level
Look for patterns, not single-number wins. A common outcome is that digestibility improves up to a point, then plateaus or declines due to ash, residual anti-nutritional compounds, or altered pellet structure.
Use a decision logic like this:
- If handling fails at a high inclusion, cap inclusion below the failure point and focus on binder or processing adjustments.
- If digestibility proxy declines while handling stays acceptable, adjust protein quality inputs (e.g., fermentation intensity or post-processing) or reduce inclusion.
- If palatability drops at higher inclusion, check odor, particle size, and residual compounds; then re-balance formulation so the ingredient doesn’t displace attractants or fats.
Mind Map: Bench Trial Logic for Inclusion Levels
Example: Choosing Between 5% and 7.5% Fermented Algae Protein
Assume four treatments: 0%, 2.5%, 5%, 7.5% fermented algae protein, with protein and energy held constant. Results show:
- Water stability: 0–5% pass; 7.5% disintegrates faster.
- Digestibility proxy: improves from 0% to 5%, then slightly declines at 7.5%.
- Palatability: similar intake at 0–5%, lower uneaten fraction at 7.5%.
Decision: choose 5% as the working inclusion. Then run a second bench mini-trial at 7.5% only if you want to test whether binder or conditioning moisture can recover pellet stability without reintroducing digestibility loss.
Step 6: Document the “Adjustment Recipe” So It Repeats
For each inclusion level, record the exact formulation changes: what ingredient was reduced, what amino acid supplement was used (if any), binder level, and conditioning moisture. This turns bench learning into repeatable practice rather than a one-off experiment.
A good bench trial ends with a short, practical summary: inclusion level chosen, the reason it passed, and the specific knobs that must be held constant when you scale up.
4. Fermentation Protein Production from Algae Meal
4.1 Fermentation Goals for Improving Protein Quality and Reducing Unwanted Compounds
Fermentation is not just “adding microbes.” It is a controlled set of biochemical goals that change what the protein ingredient contains, how it behaves in water, and how the fish digest it. A useful way to plan fermentation is to start with measurable targets, then choose process conditions that reliably move the ingredient toward those targets.
Protein Quality Goals That Can Be Measured
1) Increase usable protein fraction. Raw algae meal often contains proteins that are less accessible due to cell-wall structure, pigments, or bound complexes. Fermentation aims to convert some of that material into forms that are easier to break down during digestion. A practical target is higher soluble protein in a simple extraction test, paired with improved amino acid availability in digestibility proxies.
2) Improve amino acid balance and retention. Microbes can synthesize amino acids, but they can also consume them if the process is poorly balanced. The goal is to enrich limiting amino acids without creating large losses. A practical approach is to track amino acid profiles before and after fermentation and to monitor nitrogen balance indicators such as total nitrogen and ammonia trends.
3) Reduce protein damage from harsh handling. Heat and oxygen exposure can denature proteins and oxidize lipids, which then affects palatability and digestibility. Fermentation goals include keeping conditions stable enough to avoid unnecessary oxidation. Operators can track odor changes, color shifts, and lipid oxidation proxies alongside protein measures.
Unwanted Compounds Goals That Keep Fish Performance Stable
1) Lower anti-nutritional factors and pigment-related issues. Some algae components can interfere with digestion or cause off-flavors. Fermentation can reduce certain compounds through microbial metabolism and enzymatic breakdown. The goal is not “remove everything,” but reduce the specific compounds that correlate with poor feed acceptance or gut irritation. Simple screening can include pigment-related color metrics and targeted assays for known problematic fractions.
2) Control biogenic amines and excessive ammonia. If fermentation goes off-track, microbes may produce compounds that stress fish or reduce feed intake. The goal is to keep ammonia and biogenic amines within acceptable ranges. A practical workflow is to sample at set time points and record pH, ammonia, and odor intensity so corrective actions can happen before the batch is wasted.
3) Reduce microbial risk while preserving digestibility. Fermented ingredients must be safe, meaning pathogen reduction and stable storage behavior. The goal is to reach conditions that suppress harmful microbes without over-processing that destroys protein quality. Safety targets can include microbial counts and the ability to pass a short storage challenge without rapid spoilage.
Mind Map: Fermentation Goals and Their Levers
How Goals Translate Into Process Choices
Microbial selection matches the goal. If the priority is breaking down cell-wall barriers to improve solubility, choose strains known for producing relevant enzymes. If the priority is lowering specific unwanted compounds, select strains with metabolic pathways that convert those compounds into less problematic forms.
Substrate preparation sets the starting line. Grinding increases surface area and improves contact between microbes and proteins. Moisture level affects diffusion and microbial activity; too dry slows fermentation, too wet can encourage unwanted microbial growth. A simple example: two batches with the same inoculum but different particle sizes can show different soluble protein gains because the microbes cannot access the protein fraction at the same rate.
pH and temperature steer both quality and safety. Many fermentation systems aim for a controlled pH trajectory that suppresses unwanted microbes while allowing the target microbes to work. Temperature affects enzyme kinetics and also influences how quickly off-path reactions occur. Example: if pH drops too slowly, ammonia can accumulate; if it drops too fast, protein breakdown may stall early, leaving solubility gains smaller than expected.
Aeration strategy prevents “helpful” from becoming “harmful.” Some steps benefit from limited oxygen for microbial growth, while excessive oxygen can increase oxidation of lipids and indirectly harm protein quality. Example: a batch with higher aeration may show faster early pH change but worse odor and lower protein functionality later due to oxidation.
Time is a quality lever, not a waiting room. Fermentation often improves protein accessibility up to a point, then unwanted compounds can rise. The goal is to stop when quality targets are met and before byproducts accumulate. Operators can use time-point sampling to identify the “sweet spot” for each substrate lot.
Example: A Goal-Driven Fermentation Plan for Algae Meal
Start with a baseline algae meal test for soluble protein, total nitrogen, and a quick pigment/color metric. Set targets: higher soluble protein, stable amino acid retention, and controlled ammonia. Choose a microbial strain aligned with protein accessibility and anti-compound reduction. Prepare the substrate by consistent grinding and moisture adjustment. Run fermentation with controlled pH and temperature, using sampling to track ammonia and odor. Stop the batch when soluble protein and byproduct indicators meet criteria, then apply post-handling that limits oxidation and supports storage stability.
When goals are explicit and measured, fermentation becomes a repeatable process. The microbes do the chemistry, but the operator controls the conditions that decide whether the chemistry improves digestibility or creates problems.
4.2 Microbial Strains and Selection Criteria for Protein Enrichment and Safety
Protein enrichment by fermentation is a controlled biological upgrade: you choose microbes that reliably convert the substrate into a higher-quality protein fraction while keeping safety risks under control. Strain selection starts with what the microbe must do, then moves to what it must not do.
Define Functional Goals for Protein Enrichment
Begin by translating “better protein” into measurable functions. A practical goal set includes: (1) increased crude protein percentage through biomass growth or protein concentration, (2) improved protein quality via amino acid availability, (3) reduced anti-nutritional factors that interfere with digestion, and (4) stable flavor and odor so the ingredient remains usable in feed formulations.
A simple example: if algae meal contains heat-stable pigments and fiber-like fractions that reduce palatability, you might prioritize strains that can reduce pigment intensity and partially break down cell-wall components. Another example: if the substrate has a high proportion of soluble nitrogen but poor protein functionality, you might prioritize strains that promote protein aggregation into forms that bind water and mix well in feed.
Define Safety Goals and Risk Boundaries
Safety criteria are not optional add-ons; they are part of the selection logic. For aquafeed ingredients, you want strains that do not produce harmful metabolites, do not carry transferable antibiotic resistance genes, and do not create conditions that encourage contamination by undesirable microbes.
A concrete way to set boundaries is to require: (1) absence of known mycotoxin production pathways for fungal candidates, (2) no production of biogenic amines at relevant fermentation conditions, (3) low risk of spore persistence that complicates sanitation, and (4) compatibility with your facility’s sanitation and sampling plan.
Screening Pipeline from Candidate to Working Strain
Use a staged approach so you don’t waste time on strains that fail early.
-
In vitro suitability checks: confirm growth on your substrate, tolerance to moisture and pH range, and ability to reach target activity within your planned fermentation window.
-
Small-batch fermentation trials: run replicated batches at your intended temperature and aeration. Track pH trajectory, ammonia levels, and odor changes. The goal is predictable performance, not maximum speed.
-
Protein quality verification: measure crude protein, soluble protein fraction, and basic digestibility proxies. If you have access to amino acid profiling, use it to confirm that enrichment is not just “more nitrogen,” but more usable protein.
-
Safety verification: test for microbial contaminants, check for toxin-related markers where applicable, and verify that fermentation does not increase hazardous compounds.
A practical example: two strains both reduce pH, but only one reduces ammonia accumulation and yields a consistent soluble protein fraction across batches. That difference matters because ammonia can stress fish and increase nitrogenous waste.
Selection Criteria That Actually Predict Fermentation Outcomes
Use criteria that connect directly to fermentation behavior.
Substrate compatibility: The strain must metabolize the substrate’s available carbon and nitrogen forms. Algae meal can be tricky because cell-wall fractions and pigments may slow access to nutrients.
Process robustness: Strains should tolerate minor deviations in moisture, temperature, and initial pH. Robustness reduces batch-to-batch variability.
Competitive performance: In mixed microbial environments, the selected strain should establish dominance quickly enough to suppress contaminants.
Metabolite profile: You want a metabolite pattern that supports protein enrichment without generating off-odors, excessive acids, or nitrogen losses.
Safety genetics and history: Prefer strains with documented safe use in food or feed contexts and with genetic profiles that reduce the likelihood of harmful metabolite production.
Practical Strain Types and How They Fit the Job
Different microbial groups tend to excel at different steps.
- Lactic acid bacteria often help with rapid acidification and can improve microbial stability, which supports safety by limiting contaminant growth.
- Yeasts can contribute to biomass increase and may improve aroma and mixing properties, but they require careful monitoring for unwanted metabolites.
- Bacteria with proteolytic activity can improve protein availability, yet they must be screened to avoid excessive breakdown that leads to ammonia buildup.
A simple example workflow: start with a lactic acid bacteria strain for fast pH control, then pair it with a proteolytic partner only if small-batch trials show improved soluble protein without ammonia spikes.
Mind Map of Strain Selection Logic
Mind Map: Microbial Strains and Selection Criteria
Example Decision Table for Two Candidate Strains
| Criterion | Strain A | Strain B |
|---|---|---|
| Growth on algae meal | Strong | Moderate |
| pH drop within 12 hours | Yes | Yes |
| Ammonia accumulation | Low | High |
| Soluble protein increase | Consistent | Variable |
| Off-odor risk | Low | Medium |
| Safety screening outcome | Pass | Conditional pending metabolite checks |
In this example, Strain A becomes the working strain because it meets both enrichment and safety behavior. Strain B might still be useful later, but only after targeted metabolite checks and tighter process control.
Final Selection Outputs and How They Get Used
Once a strain is selected, document the acceptance criteria that link fermentation performance to safety and protein quality. Your batch release plan should include at minimum: pH and time-to-acidification targets, ammonia limits, contaminant monitoring results, and a basic protein functionality check. This turns strain selection from a one-time choice into a repeatable system—less guesswork, fewer surprises, and a fermentation that behaves the same way on batch two as it did on batch one.
4.3 Substrate Preparation Including Particle Size Moisture and Pre-Treatments
Substrate preparation is where fermentation either behaves or misbehaves. The goal is simple: make the algae meal (or blended substrate) consistent enough that microbes can reliably access nutrients, while keeping safety and handling practical.
Core Inputs and What They Control
Start by separating three variables that you can measure and adjust.
- Particle size controls surface area and how quickly microbes reach proteins and carbohydrates.
- Moisture controls oxygen transfer, mixing, and whether the process stays in a workable solid or slurry regime.
- Pre-treatments control solubility and reduce compounds that slow microbial activity.
A useful rule of thumb: if you cannot describe your substrate in terms of particle size distribution, moisture range, and pre-treatment type, you cannot reproduce results.
Particle Size Preparation
Particle size is not just about “finer is better.” Too fine can cause clumping, poor aeration, and harder downstream drying.
- Measure first: use a sieve stack or a simple particle size analyzer. Record the fraction retained on each sieve.
- Target a workable range: for many algae meal fermentations, a moderate grind improves access without creating a dust cloud and packing issues.
- Control consistency: if you blend batches, grind after blending or standardize the grind step across all incoming lots.
Easy example: If Batch A ferments faster than Batch B, check whether Batch B has a higher proportion of coarse particles. Even if protein content is identical, coarse particles reduce contact between microbes and substrate.
Moisture Conditioning
Moisture determines whether the fermentation behaves like a well-mixed system or a damp pile.
- Choose the regime: solid-state fermentation uses lower water activity; slurry fermentation uses higher moisture and better mixing.
- Condition moisture uniformly: add water in portions while mixing, then allow a short equilibration period so moisture migrates rather than forming wet pockets.
- Avoid extremes:
- Too low moisture slows microbial metabolism.
- Too high moisture reduces oxygen availability and can promote unwanted microbial growth.
Easy example: Suppose you add water to hit a target moisture percentage, but you do it all at once. You may get local over-wet zones that go anaerobic early, while dry zones remain underutilized. Split water addition and mix thoroughly.
Pre-Treatments and Their Purpose
Pre-treatments should have a clear job: improve accessibility, reduce inhibitors, or stabilize handling.
Mechanical and Thermal Pre-Treatments
- Mechanical: milling or controlled mixing reduces particle size and improves wetting.
- Thermal: mild heat can reduce microbial load and denature some proteins, improving subsequent enzymatic or microbial processing.
Easy example: If your substrate arrives with variable microbial counts, a mild thermal step can reduce batch-to-batch variability. Keep it mild enough to avoid excessive protein damage that later reduces digestibility.
Chemical and Enzymatic Pre-Treatments
- pH adjustment can help solubilize proteins and reduce certain inhibitory effects.
- Enzymatic pre-treatment can partially hydrolyze proteins, creating peptides and amino acids that microbes can use faster.
Easy example: If fermentation stalls after an initial growth phase, a short enzymatic pre-step can increase the pool of readily available nitrogen sources.
Detergent-Free Wetting and De-Agglomeration
Algae meal can clump due to lipids and fine particles. Use wetting and mixing strategies that do not introduce residues that complicate downstream feed safety.
Easy example: If you see “dry islands” in a moisture-adjusted batch, increase mixing intensity and use staged water addition. Visual inspection is surprisingly informative when paired with moisture measurements.
Integrated Workflow from Receipt to Fermentation
A systematic workflow reduces surprises.
- Receipt and sampling: take representative samples for moisture and particle size.
- Standardize particle size: mill to your target distribution and record sieve results.
- Moisture conditioning: add water in portions with mixing, then equilibrate.
- Apply pre-treatment: choose one or two steps with a defined purpose, and document parameters.
- In-process checks: verify moisture again after equilibration and confirm that the substrate is uniform.
- Start fermentation promptly: delays can change moisture distribution and microbial activity.
Mind Map: Substrate Preparation Levers
Practical Example: Two Batches, One Fix
Batch A ferments smoothly; Batch B shows slower protein conversion.
- Observation: Batch B has a higher coarse fraction and slightly higher moisture variability.
- Action: re-mill Batch B to match Batch A’s particle distribution, then re-condition moisture with staged addition and longer equilibration.
- Result: fermentation rate aligns because microbes now access substrate surfaces consistently and oxygen transfer remains stable.
Quality Checks That Matter Most
Before fermentation begins, confirm three things: particle size distribution is within your target range, moisture is uniform and within the chosen regime, and pre-treatment parameters match the documented recipe. If any one of these is off, treat it as a likely cause rather than a mystery.
4.4 Fermentation Process Parameters Including Temperature pH Aeration and Time
Fermentation turns algae meal into a more useful protein ingredient by steering microbes to build, reshape, or release nitrogen-rich compounds. The trick is that microbes respond to the same four levers every time: temperature, pH, aeration (oxygen and mixing), and time. Treat these as an interlocking system, not independent knobs.
Temperature
Temperature controls the speed of microbial metabolism and the balance between protein enrichment and unwanted byproducts.
- Start with a target range, not a single number. Many fermentations run best in a moderate band where growth is steady and heat stress is avoided. For example, if your process uses a mesophilic culture, you might hold 28–32°C rather than chasing 35°C “because faster is better.”
- Use a practical control method. A jacketed tank or recirculating water bath helps keep temperature stable. If you only have ambient control, expect drift and compensate by adjusting time rather than repeatedly changing temperature.
- Watch for symptoms. Rapid pH drop, strong off-odors, or sudden viscosity changes often indicate temperature is pushing metabolism beyond what your formulation can tolerate.
Example: In a pilot batch, raising temperature from 30°C to 34°C shortened the time to reach the desired pH, but increased ammonia-like odor and reduced protein solubility. Returning to 30–31°C restored solubility even though the run took longer.
pH
pH shapes which microbes dominate and how nitrogen is transformed. It also affects protein solubility and the activity of enzymes that may be produced during fermentation.
- Choose a pH strategy. Some processes begin at a slightly acidic pH to suppress contaminants; others allow a controlled drift toward the target. Either way, define the starting pH and the acceptable range during the run.
- Control buffering and dosing. If you adjust pH with acid or base, account for the buffering capacity of algae meal. A small addition can have a big effect if the slurry is low in buffering salts.
- Measure frequently early, less later. pH changes fastest at the beginning. Taking readings at short intervals early prevents overshooting.
Example: A batch started at pH 6.0 and was allowed to drift. When pH dropped below 4.5 too early, the fermentation produced a sour smell and lower digestibility proxies. Tightening the start pH to 5.5 and monitoring every few hours kept pH within the intended window.
Aeration
Aeration determines whether microbes operate in oxygen-rich conditions or shift toward oxygen-limited metabolism. Oxygen also affects mixing, heat transfer, and the removal of volatile compounds.
- Define oxygen intent. If your goal is protein enrichment via aerobic growth, you need consistent oxygen transfer. If your goal relies on fermentation pathways that tolerate low oxygen, you still need enough mixing to prevent dead zones.
- Use mixing to fix the “same tank, different reality” problem. Even with the same airflow, poor mixing can create gradients in pH and substrate concentration.
- Avoid foam surprises. Aeration can increase foam, which can trap oxygen and complicate sampling. Antifoam should be selected carefully because it can interfere with downstream processing.
Example: Two tanks received the same airflow rate. The tank with better impeller design maintained steadier pH and produced a more uniform protein solubility profile across samples.
Time
Time is the final lever that converts “conditions” into “outcomes.” Longer is not automatically better; after a point, microbes may consume the very nitrogen compounds you want to preserve.
- Use a stopping rule. Define measurable endpoints such as pH stability, ammonia level trends, odor threshold, or a solubility test on a quick sample.
- Plan sampling points. For instance, sample at 0, 6, 12, 18, and 24 hours in a pilot run to map how your chosen endpoints evolve.
- Separate fermentation time from holding time. If you ferment and then hold warm before drying, you may continue reactions that change protein functionality.
Example: A process that targeted a 24-hour fermentation was extended to 30 hours “to be safe.” The extra time increased free amino nitrogen but reduced water stability of the final ingredient, likely due to further breakdown and changes in protein structure.
Integrated Control Workflow
A systematic approach prevents parameter whiplash.
- Prepare the slurry with consistent moisture and particle size so oxygen and heat transfer are predictable.
- Set temperature and starting pH using pre-calibrated probes.
- Start aeration and mixing at a defined intensity, then keep it steady.
- Sample early and adjust only within limits. If pH is drifting too fast, correct starting conditions next batch rather than repeatedly changing mid-run.
- Stop using endpoints, not clocks alone. Confirm that the ingredient meets your acceptance criteria for solubility and safety.
Mind Map: Fermentation Process Parameters
Practical Parameter Checklist
- Temperature is stable within your defined band.
- Starting pH is set based on buffering behavior.
- Aeration and mixing prevent gradients.
- Time is governed by endpoints and verified with quick tests.
- Post-fermentation holding is controlled to avoid unintended reactions.
4.5 Post-Fermentation Handling Including Inactivation Drying and Quality Testing
Fermentation changes algae meal into a protein-enriched ingredient, but the work is not finished when the fermentation tank stops. The goal of post-fermentation handling is simple: stop microbial activity at the right moment, stabilize the material for storage and transport, and verify that the ingredient is safe and consistent enough to enter feed formulation.
Core Principles for Stopping Fermentation
First, define what “done” means for your process. Many producers use a combination of time, pH, and odor profile, but the most reliable approach is to set a target range for fermentation endpoints (for example, a stable pH window and no further drop in soluble nitrogen). Stopping too early can leave incomplete protein enrichment; stopping too late can increase off-odors and reduce functional properties.
Second, choose an inactivation method that matches your downstream needs. Heat inactivation is common because it is effective and easy to standardize. However, excessive heat can reduce solubility and damage amino acids. That is why inactivation is treated like a controlled step, not a “boil until it smells right” hobby project.
Inactivation Methods and Practical Choices
Heat inactivation is typically done by raising the temperature to a validated level and holding it for a defined time. A practical way to manage variability is to measure the temperature at the coldest point in the vessel using a calibrated probe, then hold until that point reaches the target.
If your process uses acidification, you may already have partial microbial suppression. Still, you should not assume that low pH alone equals safety. Inactivation is the step that provides a clear, measurable barrier.
After inactivation, cool the material promptly to prevent continued reactions. Cooling also helps protect equipment and makes drying more predictable.
Drying Strategy for Stability and Feed Function
Drying is where many batches quietly lose value. The aim is to reduce water activity enough to slow spoilage while preserving protein functionality needed for aquafeed performance.
Two drying approaches are common: spray drying and belt or tray drying. Spray drying tends to produce a fine, uniform powder that mixes easily, while belt or tray drying can be more accessible for smaller facilities. Regardless of method, monitor inlet and outlet temperatures, because protein damage often correlates with excessive heat exposure.
A useful operational check is to track bulk density and flow behavior after drying. If the powder becomes overly dense or clumps, it may indicate overheating or moisture gradients. Those issues can later show up as poor mixing uniformity in feed manufacturing.
Quality Testing That Actually Guides Decisions
Quality testing should be tied to acceptance criteria, not just reporting. A practical testing set includes:
- Microbiological safety: confirm that inactivation achieved the intended reduction. Use a defined sampling plan so results represent the whole batch.
- Moisture and water activity: verify stability for storage. Moisture targets should align with your packaging and expected storage duration.
- Protein and nitrogen indicators: confirm enrichment and batch-to-batch consistency. If protein is high but solubility is low, you may have damaged functionality during drying.
- pH and odor: quick indicators of process control. Odor is not a “vibes” test; it is a structured check that flags deviations requiring deeper analysis.
- Functional proxies: solubility or dispersibility tests help predict how the ingredient will behave in formulation.
When results fail, use a decision tree. For example, if microbiology fails, the batch should not proceed to feed blending. If moisture is high, you can often re-dry, but only if the material has not already exceeded limits for heat exposure.
Mind Map: Post-Fermentation Handling Workflow
Example: A Controlled Inactivation and Drying Run
A facility targets an endpoint pH range and stops fermentation when pH stabilizes for a set period. The batch is heated to a validated temperature and held until the cold-point probe confirms it. After cooling, the material is dried with monitored inlet and outlet temperatures. The powder is then tested for moisture, water activity, protein content, and a solubility proxy.
If moisture is above the limit but microbiology is acceptable, the batch is re-dried while tracking temperature exposure to avoid further functionality loss. If solubility is low despite acceptable moisture, the batch is still rejected for feed blending because it will likely increase waste and reduce performance.
Mind Map: Quality Testing Decision Logic
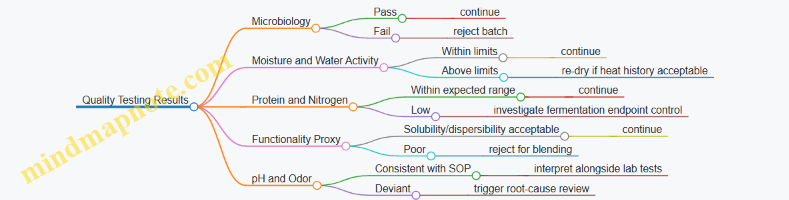
Example: Sampling That Prevents “Good Batch, Bad Result”
If you sample only the top layer of a tank, you may miss areas with different heat exposure or moisture content. A better approach is to collect multiple increments across the batch, combine them into a composite sample, and label it with the batch ID and sampling time. This reduces false alarms and makes troubleshooting more accurate.
Operational Notes for Consistency
Keep records of endpoint measurements, inactivation temperature at the cold point, cooling time, drying temperature profile, and test results. Consistency is not about perfection; it is about repeatable control so that when something changes, you can explain why.
Finally, treat post-fermentation handling as part of the ingredient’s “specification,” not a separate housekeeping step. When inactivation, drying, and testing are aligned, the ingredient enters feed formulation with predictable performance and stable storage behavior.
5. Circular Feed Infrastructure for Ingredient Flow and Waste Reduction
5.1 Designing Ingredient Supply Chains for Consistent Quality and Traceability
Consistent aquafeed quality starts before an ingredient ever reaches the mill. A supply chain is the system that turns “we sourced it” into “we can explain what it is, where it came from, and how it behaved in our process.” Traceability is not paperwork for its own sake; it is the fastest way to find the cause when performance or safety shifts.
Foundational Design Principles
Begin with a simple question: which ingredients can most affect fish performance or feed safety? For algae meal, fermented algae protein, and crop proteins, the usual high-impact variables are protein quality, moisture and storage stability, microbial load, and contaminant levels. Once you rank ingredients by risk, you can decide how strict the chain must be.
Next, define what “consistent quality” means in measurable terms. For each critical ingredient, specify acceptance targets such as protein range, moisture maximum, particle size window, and limits for contaminants relevant to your region and sourcing. Then decide which tests confirm those targets at receipt and which tests confirm them after processing.
Finally, design for traceability at the batch level. If your fermentation or blending creates a new material identity, you need a clear mapping from incoming lots to outgoing lots.
Supply Chain Map from Farm to Feed Batch
A practical supply chain has five layers: sourcing, logistics, receiving, processing handoff, and finished feed release. Each layer needs its own controls.
- Sourcing controls: Require ingredient specifications in writing and align them with your formulation needs. For example, if your formulation depends on amino acid balance, ask suppliers to provide recent amino acid profiles or at least a validated proxy such as digestibility indicators.
- Logistics controls: Control time and temperature exposure. A simple example: if algae biomass is shipped wet, define maximum transit time and temperature range, and require sealed transport to reduce contamination and moisture drift.
- Receiving controls: Use sampling plans that match ingredient variability. If a supplier’s moisture varies by pallet, a single grab sample is a coin toss. Use composite sampling across the lot.
- Processing handoff controls: Record lot numbers through milling, fermentation, drying, and blending. If fermentation changes microbial status and protein functionality, treat the fermented output as a new lot with its own test results.
- Finished feed release controls: Link the final pellet batch to the ingredient lots used. If a batch fails water stability or safety checks, you can immediately isolate affected lots.
Traceability Workflow That Actually Works
Use a lot identity scheme that survives real-world chaos. A good scheme includes supplier ID, ingredient type, production date, and a unique lot code. When you blend, create a new lot code for the blend and store the bill of materials that lists every contributing lot and inclusion rate.
Example workflow: algae meal arrives as Lot A1. It is milled into Lot A1-M. It is fermented into Lot A1-F. It is blended with crop protein into Lot B7. Finished pellets are produced as Lot P7. If P7 underperforms, you can trace back to A1-F and check fermentation parameters and test results tied to that lot.
Quality Control Points with Simple Examples
- Moisture and storage stability: If algae meal exceeds your moisture limit at receipt, it can spoil before milling. Example control: quarantine the lot, dry to target moisture where feasible, then retest before release.
- Microbial load: Fermented ingredients can be safe when produced correctly, but contamination can occur during handling. Example control: require post-fermentation inactivation or drying steps to be recorded and verify with microbial tests on the fermented lot.
- Particle size: Milling affects mixing uniformity and digestibility. Example control: set a particle size range and verify with sieve analysis at receipt and after milling.
- Contaminants: Heavy metals and other contaminants depend on sourcing. Example control: require certificates of analysis for each lot and confirm with periodic independent testing at your facility.
Mind Map: Ingredient Supply Chain Controls
Mind Map: Traceability Data Elements
Practical Implementation Checklist
Start with a one-page “ingredient passport” template for each critical ingredient. It should list required data fields, acceptance targets, sampling method, and the exact decision rule for quarantine or release. Then run a pilot on one ingredient stream end-to-end, from receipt through finished pellets, and verify that every outgoing batch can be traced back to the contributing lots without guessing.
5.2 Using Byproducts and Co-Products in Feed Formulation Without Diluting Performance
Byproducts and co-products can replace part of conventional ingredients, but they can also bring variability: different nutrient profiles, higher ash, altered amino acid availability, or inconsistent moisture and microbial load. The goal is not to “use whatever is available”; it is to use it in a way that preserves performance targets like growth rate, feed conversion ratio, and stable water quality.
Start with Clear Performance Targets
Before any substitution, define what “not diluting performance” means for your system. For example, if you are formulating for tilapia fingerlings, you might set targets for crude protein, digestible energy, essential amino acids, and pellet water stability. Then translate those targets into formulation constraints so every ingredient change has a measurable effect.
A practical rule: if an ingredient change cannot be tied to a nutrient or functional property in your formulation model, it belongs in a trial batch, not in routine production.
Build a Nutrient and Function Profile for Each Byproduct
Treat each byproduct like a new ingredient, even if it comes from a familiar process. Minimum useful measurements include proximate composition, amino acid profile (or a validated proxy), lipid level, ash, fiber, and moisture. For fermented or wet byproducts, also measure pH and microbial indicators.
Function matters as much as nutrition. A high-ash co-product may reduce energy density and pellet quality. A protein-rich byproduct with low solubility may lower digestibility unless you adjust processing or inclusion rate.
Use a Substitution Ladder Instead of One Big Swap
A substitution ladder keeps performance stable while you learn. Start with partial replacement of a single ingredient class, then expand.
- Nutrient-matched substitution: Replace on crude protein and amino acid basis.
- Function-matched substitution: Replace on solubility, emulsification, or binding behavior.
- Process-matched substitution: Replace while keeping conditioning and drying parameters compatible.
Example: If you are replacing soybean meal with a protein-rich oilseed press cake, you may match protein first, then check pellet durability and digestibility. If pellets crumble, you adjust binders or particle size rather than increasing inclusion to “make up” for losses.
Manage Variability with Incoming Controls
Byproducts often vary by batch. Use acceptance criteria that reflect both nutrition and safety.
- Moisture and storage: Wet co-products can spoil quickly. Set a moisture threshold and require rapid processing or controlled storage.
- pH and microbial load: For fermented streams, confirm consistent pH and microbial safety before inclusion.
- Ash and contaminants: High ash can inflate “protein by percentage” while lowering actual nutrient density.
A simple workflow: sample every incoming lot, run a fast proximate test, and only release lots that meet your nutrition and safety thresholds for the intended inclusion range.
Formulate with Inclusion Caps and “Adjustment Ingredients”
To prevent dilution, use inclusion caps based on known limitations.
- Ash or fiber caps: Limit ingredients that raise ash or fiber beyond what your species can handle.
- Energy caps: If a byproduct is low in digestible energy, compensate with a controlled energy source rather than increasing inclusion.
- Amino acid balancing: If lysine or methionine is limiting, add a targeted supplement or adjust the blend.
Adjustment ingredients are not a workaround; they are part of the formulation logic. For instance, if a co-product has lower lysine availability, you can correct the amino acid profile while keeping total inclusion stable.
Keep Water Stability and Leaching Under Control
Aquafeeds live in water long enough to matter. Byproducts can change pellet structure and surface composition, increasing leaching.
Example: A co-product with higher soluble fractions may increase nitrogen loss into the water. If you observe increased leaching, you can respond by:
- increasing binder level within tested limits,
- adjusting conditioning time/temperature to improve matrix formation,
- reducing particle size for better compaction, or
- lowering inclusion and compensating with a more stable protein source.
Mind Map: Byproduct Use Without Performance Dilution
Example: Oilseed Press Cake with Variable Protein
A mill produces an oilseed press cake that sometimes runs higher ash and lower lysine. In the formulation model, you set an inclusion cap driven by ash and digestibility. You then balance lysine with a targeted supplement and adjust energy with a stable lipid source.
In production, you release only lots that meet ash and moisture thresholds. During routine batches, you monitor pellet durability and leaching. If leaching increases, you do not raise inclusion; you first correct binder level and conditioning parameters, then re-check nutrient availability.
Example: Wet Fermented Co-Product as a Protein Stream
A wet fermented co-product can be attractive because fermentation can improve protein quality, but moisture and microbial safety are the limiting factors. You standardize the fermentation pH range and require rapid processing after receipt.
In formulation, you treat it as a protein stream with a measured solubility profile. You keep inclusion within a cap that preserves pellet structure, then compensate for any energy shortfall with a controlled lipid source. The performance check includes both growth metrics and water quality indicators tied to nitrogen release.
Using byproducts well is mostly bookkeeping plus testing: measure what matters, substitute in controlled steps, and adjust processing so the feed behaves the same in water as it does on paper.
5.3 Managing Water Residues and Solids From Processing Into Usable Feed Inputs
Water residues and solids are not “waste” so much as a mixed stream with changing composition. The goal is to (1) separate what can be used, (2) stabilize what would spoil, and (3) keep the final feed consistent. A practical approach starts with understanding where the residues come from, then builds a handling sequence that matches their chemistry and particle size.
Where Residues Come from and Why They Matter
Processing steps such as algae harvesting, washing, dewatering, fermentation, and cleaning generate three common streams: (a) clarified water, (b) fine suspended solids, and (c) wet cake or sludge. Each stream carries different risks.
Clarified water often contains dissolved nutrients, salts, and residual organics. Fine suspended solids can include proteins, lipids, and cell debris that settle slowly. Wet cake typically holds the highest solids and the most oxygen-demanding material, which can drive odor and microbial growth if left untreated.
A simple rule helps operators: the more water you keep with the solids, the more you must manage biology. The more you remove water, the more you must manage handling and uniformity.
Build a Stream Map Before You Build Equipment
Start by labeling streams by origin and expected properties. Use a short checklist for each stream: solids content (roughly), smell and color, pH, and whether it is likely to contain fermentation microbes or cleaning chemicals.
Example: After algae centrifugation, you might collect (1) a high-solids wet cake and (2) a lighter fraction that still looks cloudy. If the cloudy fraction is returned to fermentation as a dilution water, you must confirm it does not carry cleaning residues from upstream washing.
Separation Strategy from Coarse Solids to Fine Suspensions
Separation is usually staged.
- Coarse capture: Screens or settling tanks remove large particles that would clog downstream equipment.
- Dewatering: Centrifuges, belt presses, or screw presses reduce water content of the wet cake.
- Polishing: Filters or clarifiers reduce fine suspended solids in the water fraction.
The “best” method depends on particle size and how quickly the stream spoils. Fine suspensions are harder to recover without adding energy or time, so the process should aim for a balance between recovery and stability.
Stabilization Pathways That Keep Inputs Usable
Once separated, residues need stabilization so they can be stored and later dosed into feed.
- For wet cake: Use rapid dewatering and short holding times. If longer storage is required, consider acidification or controlled fermentation to reduce spoilage risk.
- For clarified water: Store cold when possible and limit time. If it contains recoverable nutrients, dose it into fermentation or formulation only after verifying pH and residual inhibitors.
- For fine solids: Drying can work, but it must be controlled to avoid overheating proteins and to prevent clumping that harms mixing.
Example: If fermentation uses algae meal fermentation protein, the water fraction from dewatering can be used as part of the fermentation liquid phase. Before doing this, test pH and check for residual detergents from cleaning cycles.
Turning Solids Into Feed Inputs Without Breaking Formulation
Recovered solids must be treated like ingredients, not like “extra water with particles.” That means measuring composition and controlling variability.
Key measurements include moisture, crude protein, ash, and basic mineral load. For fermented inputs, also check microbial safety indicators and odor stability.
Then integrate solids through controlled dosing:
- Batch blending: Combine recovered solids with a carrier (for example, dry meal) to achieve a predictable inclusion rate.
- Pellet compatibility: Ensure the solids do not increase leaching beyond acceptable limits by adjusting binders and conditioning.
Example: If wet cake is too variable, dry it to a consistent moisture target and mill it to match the particle size distribution of the base meal. That reduces segregation during mixing.
Quality Control Checks That Prevent Hidden Problems
Residues can carry surprises: salt buildup, cleaning residues, or high microbial loads. A lean quality plan catches issues early.
- Incoming residue tests: pH, conductivity or salinity proxy, moisture, and a quick protein/ash estimate.
- Process checks: record holding time and temperature for each stream.
- Finished feed checks: water stability, leaching behavior, and basic safety indicators.
Example: If conductivity spikes after a cleaning cycle, divert that stream to a dedicated holding tank rather than blending it into fermentation water.
Mind Map of a Practical Residue Management Workflow
Mind Map: Managing Water Residues and Solids
Example Workflow for a Circular Feed Batch
A facility runs algae meal fermentation protein production and pellet manufacturing.
- After harvesting: Centrifuge to collect wet cake and a cloudy water fraction.
- Polish the cloudy fraction: Use filtration to reduce fine solids.
- Stabilize wet cake: Dewater further and hold briefly in labeled tanks.
- Use clarified water carefully: Dose into fermentation liquid phase only after pH and conductivity checks confirm no cleaning residue carryover.
- Dry and mill recovered solids if needed: If the wet cake is too variable, dry to a consistent moisture and mill to match the base meal.
- Blend and pelletize: Adjust binder and conditioning to maintain water stability, then verify leaching behavior.
This workflow keeps recovery practical while treating residues as controlled inputs, not as an afterthought.
5.4 Facility Layout for Receiving Storage Milling Fermentation and Feed Manufacturing
A good layout treats material like a traveler with a passport: it enters, gets identified, moves through processing steps, and leaves as finished feed—without backtracking or mixing with the wrong batch. The goal is simple: reduce cross-contamination, shorten travel time, and make quality checks easy to perform at the right moment.
Layout Principles That Prevent Mix-Ups
Start with a one-way flow. Receiving should feed directly into storage, then milling, then fermentation (if used), then manufacturing, then packaging and dispatch. Any “shortcut” that allows material to bypass a check station is a shortcut to inconsistent feed.
Separate zones by risk. Raw algae meal, crop proteins, and fermented intermediates should not share the same air handling or the same transfer paths. If you cannot fully separate, at least separate by time: schedule cleaning and dedicate tools to each material class.
Design for sampling. Every step needs a place where a sampler can take representative samples without standing in a puddle of product or blocking a forklift lane. A small sampling platform near each transfer point saves time and improves consistency.
Receiving Area and Identity Control
Receiving is where most “mystery ingredients” begin. Place a weighbridge or accurate scale near a covered unloading bay. Immediately after unloading, route material to a quarantine holding area labeled by batch ID.
A practical flow is: unload → weigh → visual inspection → sample → quarantine storage. Visual inspection is not just for dirt; it checks for clumping, off-odors, unusual color, or packaging damage that could indicate moisture uptake.
Keep a dedicated tool set for sampling and cleaning in receiving. If the same scoop touches fermented material and then raw material, you have created a contamination pathway.
Storage Layout for Dry Ingredients and Fermentation Inputs
Use storage that matches material behavior. Dry ingredients that are prone to moisture absorption should be in sealed silos or lined bins with desiccated air or tight covers. Ingredients with different particle sizes should not be stored in the same bin unless you can clean thoroughly.
Position milling feed hoppers close to the milling room to reduce transfer distance and dust generation. Dust is not only a housekeeping issue; it also affects ingredient loss and can create cross-batch carryover.
For fermentation inputs, create a staging bay where only pre-approved lots can wait. This bay should be physically distinct from general dry storage so operators do not “just grab whatever is closest.”
Milling Room Placement and Dust Management
Milling should sit between storage and fermentation or manufacturing, with a clear path for conveying ground material. Put metal detection and sieving after milling and before any transfer to fermentation tanks or feed mixers.
Dust control should be built into the layout: local extraction at milling points, sealed conveyors where feasible, and a defined cleaning route. If you can’t seal everything, then at least ensure the floor slopes toward collection points rather than toward drains that spread residue.
A simple rule: if dust can settle on a surface, it can later fall into the wrong batch. Therefore, keep fermentation tank tops, sampling points, and mixer inlets away from open dust sources.
Fermentation Area for Algae Meal Protein Enrichment
Fermentation needs two things: controlled conditions and controlled movement. Place fermentation tanks in a dedicated room or zone with clear separation between “clean” transfer lines and “dirty” return lines.
Include a small pre-fermentation preparation station near tank inlets for measuring pH, temperature, and inoculum additions. This station should have a separate sink and cleaning tools to avoid contaminating the tank area with residual raw material.
Provide a post-fermentation handling path: inactivation or stabilization → draining or pressing (if used) → drying or dewatering → intermediate storage. Each sub-step should have a labeled container system so operators do not mix partially processed batches.
Feed Manufacturing and Packaging Flow
Manufacturing should follow a “mixing last” logic. Ingredient handling and weighing should occur upstream, with the mixer and pellet line downstream. Place the weigh room so it is not exposed to heavy dust from milling discharge.
After mixing, route directly to pelletizing or extrusion. If you have multiple feed types, use physical segregation: dedicated bins, color-coded transfer hoses, and a cleaning station between recipes.
Packaging should be the final barrier. Keep packaging materials in a dry, sealed storage area and stage them near the packaging line. Finished feed should move to finished goods storage without passing through raw ingredient zones.
Cleaning, Maintenance, and Traffic Patterns
Cleaning routes should be planned like production routes. Define where hoses, brushes, and wash-down tools live, and ensure they are accessible without crossing raw-to-fermented paths.
Maintenance access matters too. If a technician must open a panel in the fermentation zone and then walk through raw storage, you have created a contamination risk. Provide a maintenance corridor or schedule maintenance so traffic is controlled.
Forklift and foot traffic should follow marked lanes. If people can cut across product flow, they will—usually when they are in a hurry and the batch clock is running.
Mind Map: Facility Layout Flow and Control Points
Example: One-Way Flow with Quarantine and Sampling
A facility receives three algae meal lots on the same day. Lot A is approved after sampling, Lot B is held for moisture recheck, and Lot C is rejected for packaging damage. The layout supports this by routing Lot A to milling immediately, Lot B to quarantine storage with its own bin label, and Lot C to a separate hold area.
When Lot A is milled, the ground material is conveyed to fermentation staging only after passing sieving and metal detection. Lot B never enters the fermentation zone because the staging bay is physically distinct and only accepts approved batch IDs. After fermentation, the post-processed intermediate is stored in labeled containers that match the batch ID, so manufacturing can pull the correct intermediate without guessing.
The result is not just orderliness. It is fewer “unknowns,” faster troubleshooting when something goes wrong, and a layout that makes correct behavior the easiest behavior.
5.5 Practical Documentation and Batch Records for Circular Feed Operations
Circular feed operations work when information flows as reliably as ingredients. Batch records are the system that proves what happened, when it happened, and why the result is acceptable—without forcing operators to remember everything in their heads.
Core Purpose of Batch Records
A good batch record answers five questions: which inputs were used, what was done to them, what the process settings were, what tests were performed, and what decision was made. In circular systems, this also includes where each input came from and how it was handled before it reached the feed plant.
A practical rule: every record entry should either (1) enable traceability, (2) support quality decisions, or (3) prevent repeat mistakes. If an entry does none of those, it usually becomes paperwork noise.
Batch Record Structure from Receipt to Release
Start with a batch header that identifies the product and the production window. Then link each step to a specific batch identifier so you can reconstruct the chain even if something goes wrong.
- Batch Header: product name, target species and life stage, batch ID, production date, operator(s), and equipment line.
- Ingredient Receipt Log: supplier or internal source, lot numbers, arrival condition notes, and storage location. For circular inputs, include the upstream process reference (for example, “fermentation tank lot F-104” or “press cake batch P-22”).
- Pre-Processing Notes: milling screen size, moisture adjustments, blending order, and any deviations from the standard recipe.
- Process Parameters: mixing time, conditioning temperature and time, extrusion or pellet press settings, dryer temperature profile, and target pellet moisture.
- In-Process Checks: sample IDs, observations (for example, unusual odor, clumping, color shift), and quick tests such as water activity or pellet durability checks.
- Laboratory Results: proximate analysis, amino acid spot checks when relevant, microbial safety results for fermented ingredients, and contaminant screening outcomes.
- Release Decision: pass/fail criteria, who approved the batch, and any restrictions (for example, “released for grow-out only” if a parameter is borderline).
- Disposition of Nonconforming Material: rework instructions, hold status, or disposal record.
Traceability That Actually Works
Traceability fails when lot numbers are inconsistent. Use a single lot naming convention across the circular chain. For example, algae meal might be “AL-2026-03-17-01,” fermentation protein “FP-2026-03-17-01,” and final feed “AF-2026-05-31-01.” If your plant uses different formats, map them in the record so an auditor (or a tired operator) can follow the trail.
For circular inputs, record the “handoff conditions.” A simple example: if wet residues are transferred to drying, note the transfer time, temperature at transfer, and whether the residue was mixed or settled. Those details explain many downstream quality outcomes.
Deviation Handling Without Chaos
When a deviation occurs, document it immediately and keep the record factual. Include: what changed, when it was noticed, the measured impact (for example, pellet moisture 2% above target), and the decision rationale (for example, “held until durability test passed”).
A helpful practice is to attach a deviation form to the batch record with a short checklist: ingredient lot affected, process step affected, tests repeated, and final disposition.
Mind Map: Batch Record Workflow
Example Batch Record Entries
Example: Ingredient Receipt Log
- Batch ID: AF-2026-05-31-01
- Ingredient: Fermented algae protein
- Incoming lot: FP-2026-03-17-01
- Upstream reference: Fermentation tank F-104
- Arrival condition: sealed bags, no visible moisture, odor normal
- Storage: Room 2, rack B, bin 14
Example: Deviation and Decision
- Step: Conditioning
- Deviation: conditioning time reduced from 45 s to 38 s due to sensor calibration
- In-process impact: pellet moisture increased by 1.8%
- Actions: repeated durability test and water activity check
- Result: durability passed, water activity within limit
- Decision: released with note for monitoring next batch
Practical Tips for Record Quality
Keep entries short but specific. Use sample IDs that appear on both the physical sample label and the lab result sheet. If a field is not applicable, mark it as “N/A” rather than leaving it blank. Blank fields invite guesswork, and guesswork is expensive.
Finally, store records so they can be retrieved by batch ID in under a minute. If the system requires hunting through folders, it will eventually fail at the worst possible moment.
6. Alternative Protein Crop Engineering for Feed Use
6.1 Crop Selection Criteria for Protein Yield Digestibility and Agronomic Fit
Selecting a crop for aquafeed protein is not just about how much protein it contains. You’re choosing a whole package: yield under real field conditions, protein that can be digested by fish, and a production system that reliably delivers ingredient quality. A good crop choice makes formulation easier, reduces batch-to-batch variation, and prevents unpleasant surprises during processing.
Protein Yield That Survives Real Farming
Start with protein yield per hectare, not percent protein. A crop with 35% protein but low biomass can lose to a crop with 25% protein and high biomass. For example, if Crop A produces 2.0 tons of dry matter per hectare at 35% protein, protein yield is 0.70 tons/ha. If Crop B produces 3.0 tons at 25% protein, protein yield is 0.75 tons/ha. That small difference matters when you scale to feed volumes.
Next, check stability. Protein concentration often shifts with nitrogen availability, drought stress, and harvest timing. A crop that swings from 20% to 35% protein complicates formulation because you end up adjusting inclusion rates more often. Practical best practice is to request multi-season data from growers or pilot plots, then track both mean and variability.
Digestibility That Matches Fish Biology
Digestibility depends on protein structure and the presence of compounds that interfere with digestion. In plant crops, fiber, storage proteins, and anti-nutritional factors can reduce digestibility even when crude protein looks high.
Use a two-step screening mindset:
- Estimate digestibility potential from ingredient composition.
- Confirm with small-scale digestibility or performance tests.
For instance, a legume meal may have higher protein and better amino acid balance than a cereal, but it can also carry higher levels of anti-nutritional compounds. A cereal may be easier to process and more consistent, but its protein fraction can be less digestible. The selection goal is not “highest protein,” but “protein that fish can actually use.”
Agronomic Fit That Protects Ingredient Consistency
Agronomic fit covers climate, soil, water, pest pressure, and harvest logistics. If a crop requires irrigation that isn’t reliably available, you’ll see protein yield and composition drift. If harvest is delayed due to labor or equipment constraints, you’ll often get more variability in moisture, particle size, and storage stability.
A practical way to evaluate agronomic fit is to score each crop on:
- Yield reliability across seasons
- Ability to hit a consistent harvest window
- Compatibility with existing rotations
- Ease of drying and storage at the point of purchase
Example: If you can only dry to safe moisture levels using a specific facility, choose crops whose harvest moisture and drying behavior match that capacity. Otherwise, you’ll spend your time managing spoilage risk instead of improving feed performance.
Ingredient Quality Inputs from the Field
Crop selection also determines how clean and uniform your ingredient can be. Consider:
- Seed size uniformity, which affects milling performance
- Hull content, which influences fiber and water stability in pellets
- Weed seed contamination risk, which affects downstream safety and consistency
A simple operational check is to ask for representative samples from multiple lots and compare basic properties like particle size distribution after milling and basic proximate composition. If the ingredient behaves unpredictably at the start, it will behave unpredictably in the feed.
Mind Map: Crop Selection Criteria
Example: Comparing Two Candidate Crops
Suppose you’re choosing between a legume and a cereal for a protein concentrate stream.
- Legume candidate: higher protein percent, but higher variability when nitrogen is inconsistent and more anti-nutritional compounds when harvested late.
- Cereal candidate: lower protein percent, but more consistent harvest timing and easier drying, with fewer processing surprises.
A systematic approach is to compare protein yield per hectare, then estimate digestibility risk based on composition, and finally check whether your supply chain can deliver consistent lots. If the legume’s variability forces frequent formulation changes, the cereal may be the better “feed ingredient” even if its crude protein is lower.
Practical Selection Checklist
- Can you quantify protein yield per hectare across at least two seasons?
- Do you have evidence of digestibility potential for your target fish species and life stage?
- Does the crop fit your harvest window and drying capacity?
- Are lot-to-lot composition and milling behavior reasonably consistent?
- Will the ingredient reduce formulation and processing adjustments rather than increase them?
A crop that scores well on these points gives you a calmer formulation process and a more predictable feed outcome. In aquafeed, predictability is a feature, not a luxury.
6.2 Breeding and Trait Targets for Improved Amino Acid Balance and Seed Quality
Breeding for aquafeed-relevant crops starts with a simple constraint: the seed must deliver the right amino acids in the right proportions, and it must do so consistently across environments. “Improved amino acid balance” means more than higher protein; it means better alignment with fish amino acid requirements and fewer formulation headaches caused by variability.
Foundational Trait Targets
Begin by separating traits into three buckets.
- Amino Acid Composition
- Target higher levels of limiting amino acids for the crop’s typical profile. For many oilseed meals, lysine and methionine are frequent bottlenecks.
- Aim for a stable amino acid pattern across lots, because feed formulation tolerates small differences but not wide swings.
- Protein Quality and Digestibility
- Seed proteins differ in how easily they break down during digestion. Breeding can shift the mix of storage proteins toward forms that are more digestible.
- Reduce protein fractions that bind strongly to anti-nutritional compounds or resist processing.
- Seed Quality and Processing Suitability
- Oilseed meals depend on seed traits that affect crushing efficiency, meal yield, and residual anti-nutritional factors.
- Seed size, hull proportion, and moisture at harvest influence storage stability and downstream processing.
A practical way to keep this systematic is to define a “feed-relevant scorecard” before crossing plants: amino acid targets, digestibility proxies, and seed traits that affect meal consistency.
Trait Measurement That Breeding Can Actually Use
Breeding programs need measurements that are fast enough to screen many lines.
- Seed protein and amino acid profiling: Use near-infrared spectroscopy for early screening, then confirm with lab amino acid analysis on a subset.
- Digestibility proxies: Track protein solubility in relevant buffers and measure enzyme digestibility on representative samples.
- Seed physical traits: Record thousand-kernel weight, hull percentage, and moisture content at harvest.
- Anti-nutritional factor indicators: For crops where these matter, measure the relevant compounds directly so selection doesn’t accidentally boost protein while worsening processing.
A useful rule: if a trait can’t be measured on enough individuals to guide selection, it becomes a “nice-to-have” rather than a breeding target.
Mind Map: Trait Targets and Selection Logic
Advanced Details Without the Guesswork
Balancing Trade-Offs
Selection often creates trade-offs. For example, pushing protein upward can change oil content, seed hardness, or hull proportion. If you only select for one number, you can end up with a seed that tests well in the lab but performs poorly in meal production.
To manage this, use a weighted selection index that includes:
- amino acid targets (composition and stability),
- digestibility proxy,
- seed physical traits that affect processing,
- and anti-nutritional factor constraints.
Using Crosses to Fix the Right Combination
Amino acid traits are typically polygenic, so individual plants rarely carry the full set of favorable alleles. Breeding crosses should be designed to combine:
- a parent with strong amino acid composition,
- a parent with good digestibility proxy,
- and a parent with seed traits that improve meal consistency.
A concrete example: if one line has high lysine but poor seed uniformity, and another has uniform seeds but a lower methionine fraction, crossing them and selecting in early generations for both seed uniformity and lysine levels can reduce the number of generations spent chasing the same problem twice.
Example: A Simple Selection Scorecard
Use a scorecard that turns targets into decisions.
- Protein content: minimum threshold to avoid “high amino acid but low protein” lines.
- Lysine index: relative to a baseline reference line.
- Methionine index: relative to baseline.
- Solubility proxy: minimum buffer solubility after milling.
- Hull percentage: maximum to support predictable meal yield.
- Anti-nutritional factor: maximum acceptable level.
Then apply selection in two stages:
- early screening using NIR and quick physical measures,
- confirmation using amino acid profiling and digestibility proxy tests.
This staged approach prevents the program from spending time confirming lines that fail basic seed quality, while still catching lines that look average on protein alone but improve digestibility.
Seed Quality Targets That Protect Consistency
Seed quality is not a side quest. Moisture at harvest affects storage stability and microbial risk, which in turn affects protein integrity and meal odor. Hull proportion affects milling behavior and the fraction of meal that ends up in the final particle size distribution.
A practical example: two lines with similar amino acid profiles can produce different meal performance if one has higher hull percentage. The higher-hull line may yield more low-solubility fractions, forcing formulation to compensate with processing adjustments.
Mind Map: Selection Workflow
Putting It Together
A breeding program that targets amino acid balance and seed quality should treat them as connected variables: seed traits determine processing behavior, processing behavior shapes digestibility, and digestibility shapes how the amino acid profile shows up in the fish. When selection is guided by a scorecard and measured in stages, you get lines that are not just “better on paper,” but also easier to formulate and more consistent in real feed production.
6.3 Agronomic Practices for Consistent Protein Content Including Fertility and Irrigation
Consistent protein content starts before planting. Protein percentage is shaped by genetics, but agronomy decides how much of that genetic potential the crop actually expresses. Two levers dominate: nitrogen availability and water management. Get them wrong and you can end up with a crop that looks healthy while protein quietly drifts.
Core Idea: Protein Is a Nitrogen-And-Water Balance
Nitrogen drives amino acid synthesis, while water controls growth rate and nutrient transport. When nitrogen is plentiful and water is stable, plants build protein rather than just more leaves. When nitrogen is limited or water swings, plants often prioritize survival and rapid leaf expansion, which can dilute protein concentration.
Soil Testing and Baseline Targets
Begin with a soil test that includes at least pH, organic matter, nitrate or ammonium where available, and key cations. Use the results to set targets for pH and nutrient sufficiency before you schedule fertilizer. A simple rule: if pH is off, fertilizer efficiency drops and protein variability increases. For example, if pH is low and you apply nitrogen, the crop may still grow well but protein can remain inconsistent because nutrient uptake is uneven across the field.
Fertility Strategy for Stable Protein
A practical fertility plan uses split applications rather than one big dose. Splitting reduces the risk that nitrogen is lost before the crop can use it, and it matches nitrogen supply to crop demand.
- Pre-plant starter: Apply a modest amount to support early establishment. Example: if you plan a total nitrogen rate for the season, reserve most of it for later growth stages.
- Vegetative split: Apply during active leaf and stem development. This is when nitrogen demand rises and protein formation begins to track more closely with nitrogen availability.
- Pre-harvest adjustment: Use a smaller final application only if crop signals and soil conditions support it. Example: if leaf color is already pale and the crop is lagging, a late correction can help protein, but if the crop is already lush, extra nitrogen may increase biomass more than protein.
To keep protein consistent across blocks, use management zones. Divide fields by soil type, slope, and prior yield. Then apply fertilizer by zone rather than treating the whole field as one uniform container.
Fertility Signals You Can Actually Observe
You do not need lab equipment to catch many problems early.
- Leaf color and uniformity: Uneven color often indicates uneven nitrogen or water distribution.
- Growth rate: If plants race ahead after fertilization, protein can dilute. If growth stalls, nitrogen may be limiting.
- Stand density: Thin stands can concentrate nitrogen per plant but reduce total protein yield; thick stands can dilute protein if nitrogen cannot keep up.
A useful practice is to sample a few representative spots for quick tissue nitrogen or chlorophyll readings and compare them to your target range. If you see a consistent gap, adjust the next split application.
Irrigation Scheduling That Supports Protein
Irrigation should reduce stress, not just add water. Protein concentration is sensitive to drought stress during key growth phases.
- Avoid long dry spells: Drought slows nutrient uptake and can shift metabolism toward survival.
- Avoid waterlogging: Excess water can reduce root oxygen, limiting nitrogen uptake and increasing variability.
- Use stage-based thresholds: Set irrigation triggers by crop stage rather than calendar dates.
Example: In a field with drip irrigation, you can maintain steadier soil moisture than in furrow systems. If you switch from furrow to drip, protein variability often improves because nitrogen uptake becomes more uniform.
Matching Irrigation to Fertilizer Timing
Nitrogen and irrigation should work together. If you apply nitrogen and then delay irrigation, the fertilizer may remain in the soil surface layer where uptake is limited. If you irrigate heavily right after application, nitrogen can move beyond the root zone.
A simple operational approach is to irrigate lightly enough to move nitrogen into the active root zone, then continue with stage-appropriate moisture maintenance. For instance, after a split application, use a short irrigation event to incorporate and distribute nitrogen, followed by smaller follow-up irrigations.
Mind Map: Fertility and Irrigation for Protein Consistency
Worked Example: One Field, Two Outcomes
Consider two blocks with the same crop variety and planting date.
- Block A uses split nitrogen and irrigation triggers based on soil moisture. Leaf color stays relatively uniform, and protein percentage at harvest varies little between sampling points.
- Block B applies nitrogen in one dose and irrigates on a fixed schedule. After the first irrigation, plants grow quickly and then experience a mid-season dry period. At harvest, biomass is high but protein percentage is lower and more variable.
The difference is not just “more water” or “more fertilizer.” It is the timing alignment between nitrogen availability, root uptake, and plant growth rate.
Practical Checklist for Operators
Before the season: confirm soil test interpretation, define management zones, and calibrate equipment. During the season: track leaf uniformity and growth stage, and adjust irrigation triggers to prevent both drought and waterlogging. After each split: verify that the field received the intended rate and that moisture conditions support nitrogen movement into the root zone. When these steps are consistent, protein content becomes a controllable outcome rather than a surprise.
6.4 Post-Harvest Handling Including Drying Cleaning and Storage Stability
Post-harvest handling decides whether your protein ingredient shows up as a consistent feed component or as a variable problem. The goal is simple: remove excess water, remove unwanted material, and keep the ingredient chemically and microbiologically stable until it reaches formulation.
Core Principles for Stable Protein Ingredients
Start with three constraints. First, drying must reach a moisture level that slows microbial growth and reduces enzyme activity. Second, cleaning must remove dust, hull fragments, and foreign matter that can carry microbes or bind moisture. Third, storage must control oxygen, temperature, and pests so oxidation and spoilage reactions do not creep in.
A practical way to think about it is “water first, then dirt, then time.” If you store wet or dirty material, the rest of the process becomes a bandage.
Drying Fundamentals and Practical Targets
Drying is not just “make it dry.” It is “make it dry enough, without damaging protein functionality.” For many crop proteins and algae-derived meals, the operational target is typically in the low single-digit to low-teens moisture range by weight, depending on ingredient and packaging. Use your own lab’s moisture method and set acceptance criteria for each ingredient stream.
Temperature matters because high heat can increase protein denaturation and lipid oxidation. A common best practice is staged drying: remove bulk moisture with gentle airflow first, then finish with controlled conditions. For example, if you have wet biomass from processing, you can pre-dry on a perforated tray with moderate airflow before moving to a final dryer. This reduces the time the material spends at the highest temperature.
Equally important is uniformity. If one portion dries faster than another, you create pockets of higher moisture that become microbial hotspots. Mix or spread material to avoid thick layers, and monitor moisture at multiple points rather than trusting a single sensor reading.
Cleaning and Sorting to Reduce Hidden Variability
Cleaning removes more than visible debris. Fine dust can increase water uptake during storage, and hull fragments can dilute protein concentration and change digestibility. Foreign material can also introduce off-odors that persist through milling.
A systematic cleaning workflow often includes screening, aspiration, and magnetic separation where appropriate. For a concrete example, consider a batch of crop seed protein meal that contains small stones. Screening removes large particles, aspiration removes light dust, and a magnet catches metal fragments. After cleaning, re-check moisture and particle size distribution because cleaning can change how the material packs and how it dries.
If you are handling algae meal or fermented residues, pay attention to clumping. Clumps can trap moisture and create uneven drying. A simple fix is to break up material before drying and to use sieves that match your downstream milling plan.
Storage Stability and Failure Modes
Storage stability is about controlling reactions that happen slowly but relentlessly. The main failure modes are moisture regain, lipid oxidation, and microbial regrowth.
Moisture regain happens when dried material is exposed to humid air. Use sealed containers or liners, and minimize time between drying and packaging. If you must transfer material, do it quickly and in a controlled environment.
Lipid oxidation is driven by oxygen and heat. Even if moisture is low, oxygen can still oxidize fats, leading to rancid odor and reduced palatability. For ingredients with higher lipid content, consider oxygen-barrier packaging and keep storage temperatures moderate.
Microbial regrowth is less likely at low moisture, but not impossible if you have contamination or if moisture rises during storage. That is why storage acceptance should include periodic checks.
Mind Map: Post-Harvest Handling Workflow
Example: From Wet Biomass to Stored Meal
Imagine you receive wet biomass from a fermentation step. First, you pre-dry to reduce bulk water, spreading the material thin to prevent wet pockets. Next, you run a final drying stage with controlled airflow and confirm moisture at more than one location. Then you clean the dried material by screening to remove oversized particles and aspiration to remove fine dust. Finally, you package in sealed bags with liners and store in labeled bins.
To keep the process honest, you sample the packaged meal for moisture and check odor after packaging. If moisture is above your acceptance criterion, you do not “hope it will be fine.” You re-dry or adjust the packaging process so the next batch does not repeat the same failure.
Example: Diagnosing a Storage Problem
Suppose a batch develops a musty odor after several weeks. The most common causes are moisture regain or contamination during handling. Start by checking the packaging integrity and storage humidity exposure. Then review drying logs for uniformity and whether moisture was measured at multiple points. If the batch was cleaned poorly, dust and fine particles may have increased water uptake, so cleaning records and sieve performance become the next place to look.
A good workflow ends with a clear disposition decision: release only batches that meet moisture and sensory acceptance, and hold or reprocess the rest with documented corrective actions.
Practical Checklist for Operators
- Dry to ingredient-specific moisture acceptance using staged, uniform drying.
- Clean to remove dust, hull fragments, and foreign matter; confirm particle size after cleaning.
- Package quickly after drying; use sealed containers or liners.
- Store with temperature and humidity control appropriate to the ingredient.
- Perform periodic checks for moisture and odor, and keep batch records complete.
When these steps are consistent, storage becomes predictable rather than mysterious. The ingredient may not look different, but it behaves differently in the feed—less spoilage risk, more consistent formulation, and fewer unpleasant surprises at the mill.
6.5 Practical Processing Routes for Crop Proteins Into Feed Ingredients
Crop proteins rarely enter a feed plant as a single, ready-to-use ingredient. They arrive as flours, meals, concentrates, or isolates, each with different solubility, particle size, and “how cooperative” they are in a pellet. The practical goal is to convert raw crop protein into feed ingredients that (1) blend consistently, (2) disperse in water during feeding, (3) support digestion, and (4) stay stable during storage.
Start with Protein Form and Target Function
Processing routes should be chosen based on the protein’s starting form and the target function in the final diet.
- If you start with meal (soybean meal, rapeseed meal, pea meal), the route often focuses on improving consistency and reducing anti-nutritional factors.
- If you start with concentrate or isolate, the route often focuses on functional properties such as solubility, emulsification, and water stability.
A simple way to decide is to ask: will the ingredient be used mainly for protein supply, or also for water stability and binder performance? For example, a high-solubility protein can improve early digestion but may leach faster from pellets; a more dispersible but less soluble protein can improve pellet integrity.
Route A: Mechanical Conditioning and Fractionation
Mechanical routes are the lowest “chemical drama” option. They use milling, sieving, and sometimes air classification to adjust particle size and remove hulls.
Core steps
- Drying to a stable moisture level.
- Milling to a controlled particle size distribution.
- Sieving or air classification to separate protein-rich fractions from fiber-rich fractions.
- Blending fractions to hit a consistent protein level.
Easy example
- If a pea meal batch has high fiber variability, fractionation can reduce the fiber-rich fraction. The result is a more predictable amino acid profile and less pellet softening caused by excess fine fiber.
What to watch
- Very fine powders can increase dust and reduce flowability, so you may need anti-caking or granulation before mixing.
Route B: Thermal Processing to Improve Digestibility
Heat treatment is widely used to reduce anti-nutritional factors and improve digestibility. The key is matching temperature and time to the crop.
Core steps
- Controlled conditioning (moisture and temperature).
- Short residence heating.
- Rapid cooling and moisture normalization.
- Storage with moisture control.
Easy example
- Soybean meal often benefits from proper heat exposure to reduce trypsin inhibitors. Underheating leaves inhibitors; overheating can reduce lysine availability. A practical approach is to verify with a simple digestibility proxy and adjust the next batch’s conditioning.
What to watch
- Heat damage can show up as reduced protein functionality in water and poorer performance in feeding trials.
Route C: Solvent or Aqueous Extraction to Make Concentrates or Isolates
Extraction routes aim to separate protein from fiber, starch, and some anti-nutritional compounds.
Common variants
- Aqueous extraction and precipitation: protein is solubilized, then recovered by pH adjustment.
- Solvent extraction: used mainly for oil removal first, then protein concentration.
Easy example
- If rapeseed meal has high fiber, an extraction route can produce a concentrate with lower fiber. In a diet, that can reduce the amount of binder needed to maintain pellet shape because less fiber means less water uptake.
What to watch
- Extraction changes mineral content and can alter buffering capacity, which affects pellet conditioning and water stability.
Route D: Enzymatic Hydrolysis for Dispersibility and Digestibility
Enzymatic processing breaks proteins into smaller peptides and improves dispersibility.
Core steps
- Adjust pH and temperature for enzyme activity.
- Control degree of hydrolysis using time and mixing.
- Inactivate enzymes.
- Dry to a stable powder or granule.
Easy example
- For early life stages, a partial hydrolysate can improve acceptance and reduce feed refusal caused by slow digestion. The trick is to avoid over-hydrolysis that can increase leaching and reduce pellet integrity.
What to watch
- Hydrolysates can be hygroscopic. Packaging and storage humidity matter as much as the hydrolysis step.
Route E: Fermentation-Assisted Protein Conditioning
Even when the main fermentation is not the crop protein itself, fermentation can be used to pre-condition crop proteins before blending.
Core steps
- Mix crop protein with a controlled moisture level.
- Inoculate with a selected microbial culture.
- Maintain conditions that reduce undesirable compounds.
- Dry or stabilize for feed mixing.
Easy example
- A short fermentation of a plant protein can reduce certain anti-nutritional factors and improve odor profile, which helps consistent feed intake when diets include multiple alternative ingredients.
What to watch
- Fermentation must be controlled to avoid excessive microbial growth and to ensure predictable nutrient composition.
Route Selection Mind Map
Mind Map: Processing Routes for Crop Proteins into Feed Ingredients
Practical Integration Into Feed Manufacturing
A processing route is only “successful” when it behaves well in the feed plant. After processing, ingredients should be evaluated for flowability, mixing uniformity, and water behavior during conditioning.
Example workflow
- A plant protein concentrate is produced via extraction, then milled to a consistent particle size.
- During feed formulation, the ingredient is tested for water stability in a small pellet trial.
- If pellets soften too quickly, the fix is usually not to abandon the ingredient, but to adjust inclusion level, binder system, and conditioning moisture—because the processing route determined the ingredient’s baseline water interaction.
Decision Checklist for Choosing a Route
Use this checklist to keep route selection systematic:
- Does the starting material have high fiber or variable protein? Choose mechanical fractionation and blending.
- Are anti-nutritional factors a known issue? Choose thermal processing or fermentation-assisted conditioning.
- Do you need improved solubility for early feeding? Choose enzymatic hydrolysis or controlled extraction.
- Do you need pellet water stability? Choose processing that supports controlled dispersibility, then confirm with pellet leaching tests.
The best route is the one that produces an ingredient with predictable behavior in mixing, conditioning, and feeding—because aquafeed performance is a chain, and each link starts with how the protein was processed.
7. Engineering Processing to Improve Protein Functionality
7.1 Solubility Dispersibility and Emulsification Targets for Feed Performance
Why These Targets Matter
Solubility, dispersibility, and emulsification describe how proteins and other feed components behave once they meet water. In aquafeeds, that behavior affects three practical outcomes: (1) how quickly nutrients become available, (2) how much material stays suspended long enough to be eaten, and (3) how stable the feed matrix is against leaching. A protein that dissolves slowly can still work, but it must match the fish’s feeding time and the pellet’s water stability. A protein that disperses well can reduce “clouding” losses and improve consistency between batches.
Mind Map: Solubility Dispersibility and Emulsification Targets
Foundational Concepts You Can Use at Bench Scale
Start by choosing the water conditions that resemble the feed’s real environment. For aquafeeds, that usually means a pH range typical of culture water and a salinity or ionic strength that matches the farm. Then decide which target you need most.
- If your main goal is rapid nutrient availability for early digestion, prioritize solubility at the relevant pH.
- If your main goal is uniform mixing and minimal clumping in the pellet and in the water column, prioritize dispersibility.
- If your main goal is keeping lipids evenly distributed and reducing fat separation, prioritize emulsification.
A useful rule of thumb: solubility is about “dissolving,” dispersibility is about “breaking apart,” and emulsification is about “holding oil droplets apart.” They overlap, but they are not interchangeable.
Practical Target Ranges and How to Set Them
Instead of chasing universal numbers, set targets relative to your baseline ingredient and your intended feed type.
- Solubility target: define a minimum solubility index at your chosen pH and ionic strength. For example, if your current algae meal ingredient shows moderate solubility, you can set a target of “equal or higher” at the same test conditions, then verify that pellet leaching decreases.
- Dispersibility target: set a maximum acceptable sedimentation time or a minimum turbidity stability in a standardized slurry. If a new fermented protein disperses faster, it should reduce visible clumps during mixing and improve pellet uniformity.
- Emulsification target: set a minimum emulsion stability after a fixed time at room temperature and a maximum droplet size distribution shift after mixing. If emulsions break quickly, you will often see lipid separation in pellets or increased surface oil.
Example: Matching Targets to a Pellet That Leaches
Suppose you formulate a floating or slow-sinking pellet where water stability is critical. You test three protein inputs: A (high solubility), B (high dispersibility), and C (high emulsification).
- Ingredient A dissolves readily, but the pellet still leaches protein quickly. That suggests the matrix is not holding water-soluble fractions long enough, so you adjust binders or conditioning to improve water stability.
- Ingredient B disperses well, reducing clumps during mixing, and you observe more uniform pellet density. Leaching improves slightly, but lipid separation remains.
- Ingredient C forms stable emulsions, and after pellet soaking you see less surface oil and fewer fat droplets. That indicates emulsification is helping the lipid phase stay integrated with the pellet structure.
The takeaway is systematic: each target explains a different failure mode, so you fix the right bottleneck instead of changing everything at once.
Example: Fermented Protein with Better Dispersibility
A fermented algae protein may show improved dispersibility because fermentation can change particle surface properties and reduce aggregation. In practice, you can see this as a slurry that stays uniform rather than settling into a layer. If that improved dispersibility also increases measured solubility at your test pH, you often get better mixing and more consistent nutrient availability. If solubility does not improve, you still benefit from reduced clumping and more even distribution in the pellet.
Advanced Details Without the Guesswork
- pH relative to isoelectric behavior: proteins near their isoelectric point tend to aggregate, which lowers solubility and can reduce emulsification stability. Test at the pH you expect in the water phase during soaking.
- Ionic strength and divalent ions: salts can either screen charges and promote aggregation or stabilize dispersions depending on protein chemistry. Keep ionic conditions consistent across comparisons.
- Processing history: heat and shear can increase aggregation or expose surface groups. That changes all three targets, so record conditioning temperature and residence time when you compare batches.
- Particle size: finer powders often disperse better, but too much fineness can increase dust and affect mixing behavior. Set dispersibility targets alongside practical handling constraints.
A Simple Decision Checklist
- If pellets crumble or show heavy protein loss after soaking, check solubility at your test pH and evaluate binder performance.
- If mixing is uneven or pellets show streaks, check dispersibility and particle size distribution.
- If lipids separate or pellets show oily surfaces, check emulsification stability and droplet size behavior.
These targets are not abstract lab trophies. They are practical levers that connect ingredient behavior to what the fish actually experiences in the water.
7.2 Thermal Mechanical and Chemical Processing Options for Protein Modification
Protein modification aims to improve functional behavior in aquafeeds—solubility, emulsification, water stability, and digestibility—while keeping safety and nutrient value intact. Think of it as changing how proteins behave in water and during digestion, not just changing their chemistry.
Foundational Concepts for Protein Function
Proteins show different performance depending on their structure. Thermal processing can partially unfold proteins, exposing reactive groups and improving solubility for some ingredients. Mechanical processing changes particle size and surface area, which affects hydration and mixing. Chemical processing can alter bonds or add/remove functional groups, but it also risks damaging amino acids if conditions are harsh.
A practical way to choose a method is to start with the problem you see: poor pellet water stability, weak emulsification in wet mixing, low dispersibility, or inconsistent digestibility. Then match the mechanism to the symptom.
Thermal Processing Options and What They Do
Thermal options include dry heat, steam cooking, and wet-heat pasteurization. Gentle heat can improve dispersibility by unfolding proteins and reducing some aggregation. Excess heat can cause excessive denaturation and aggregation, lowering solubility and increasing leaching from pellets.
Example: If a plant protein blend forms clumps during conditioning, a short steam treatment can increase hydration and reduce clumping. In contrast, if the same blend turns into a rubbery mass after drying, the heat load was likely too high, and the proteins aggregated.
Key control points are temperature profile, residence time, and moisture. Moisture matters because it governs heat transfer and protein mobility. A common best practice is to run small bench trials that vary one factor at a time, then measure solubility index and pellet leaching.
Mechanical Processing Options and What They Do
Mechanical processing includes milling, extrusion, high-shear mixing, and homogenization. Milling reduces particle size, increasing surface area and improving hydration. Extrusion combines shear and heat, often improving dispersibility and inactivating some microbes.
However, mechanical intensity can also increase oxidation and generate fine dust that segregates in formulation. Dust is not just an aesthetic issue; it can change dosing accuracy and water uptake behavior.
Example: Two batches of the same ingredient differ only in grind size. The finer batch disperses faster but produces more fines in the pellet die, reducing durability. The fix is not “finer is better,” but “finer until performance improves and durability stops improving.”
Chemical Processing Options and What They Do
Chemical processing can include enzymatic hydrolysis, alkaline solubilization followed by neutralization, acid precipitation, and controlled deamidation or crosslinking approaches. Enzymatic hydrolysis breaks peptide bonds, producing peptides that often dissolve better and can improve digestibility proxies.
Alkaline solubilization can remove some non-protein components and increase solubility, but neutralization must be controlled to avoid re-aggregation. Acid precipitation can concentrate proteins, yet it may increase brittleness and reduce emulsifying capacity if the protein structure collapses.
Example: If fermented algae protein shows good amino acid content but weak emulsification in feed, mild enzymatic hydrolysis can increase peptide solubility and improve dispersion in the binder phase. If hydrolysis is too aggressive, the ingredient may become overly soluble and leach faster from pellets.
Chemical methods also require attention to residuals. Neutralization steps must be thorough, and any processing aids should be compatible with feed safety requirements.
Integrated Selection Logic for Real Formulations
A good workflow links processing choices to measurable targets. Start with ingredient baseline tests, apply one processing change, then verify functional outcomes relevant to aquafeeds.
Example: For water-stable pellets, you might prioritize thermal conditioning plus binder optimization, then confirm reduced leaching. For digestibility, you might prioritize mild enzymatic hydrolysis and confirm improved digestibility proxies.
Mind Map: Thermal Mechanical and Chemical Processing Pathways
Practical Bench Trial Design Without Guesswork
Use a small matrix that keeps variables manageable. For instance, test two thermal levels, two grind sizes, and one mild hydrolysis condition, then evaluate solubility, emulsion stability, and leaching on the same formulation base. This prevents the common mistake of optimizing processing for one metric while breaking another.
Example: A batch that looks more soluble may still leach more. If leaching increases, you can compensate by adjusting binder level, pellet moisture during conditioning, or hydrolysis severity rather than abandoning the ingredient.
Common Failure Modes and How to Interpret Them
If solubility improves but emulsification worsens, the protein may be too denatured or the peptide profile may not support interfacial film formation. If pellet durability drops, mechanical fines or excessive unfolding may reduce structural integrity. If safety results fail, the processing intensity may be insufficient or uneven, suggesting poor mixing or inconsistent residence time.
A simple rule: interpret results as signals about structure and water behavior, then adjust the processing lever that most directly controls that behavior.
7.3 Enzyme-Assisted Processing for Digestibility Improvement
Digestibility is where “good ingredients” become “good feed.” Enzyme-assisted processing improves how proteins and other nutrients are broken down before fish ever see them, reducing the work the gut must do and lowering the amount of undigested material that ends up as waste.
Core Concept and What Enzymes Actually Do
Enzymes are catalysts that speed up specific reactions. In aquafeed processing, the goal is not to “pre-digest everything,” but to target the parts that limit digestion. For example, plant proteins often contain structures that resist proteases, and some carbohydrates can increase viscosity or reduce nutrient availability. Enzymes help by:
- Partially hydrolyzing proteins into smaller peptides and amino acids.
- Reducing viscosity by breaking down certain non-starch polysaccharides.
- Improving protein functionality so pellets hold together and release nutrients more predictably.
A practical way to think about it: enzymes are like a careful kitchen knife, not a demolition crew. They should cut enough to help digestion, without turning the ingredient into a slurry that behaves badly in manufacturing.
Choosing the Right Enzyme System
Start with the ingredient problem, not the enzyme name. Common targets include:
- Protease activity for protein hydrolysis and improved peptide availability.
- Carbohydrase activity for fiber and non-starch polysaccharides that can interfere with nutrient uptake.
- Phytase when phosphorus availability is constrained by mineral binding.
A simple screening approach is to run small bench trials with one variable at a time: enzyme type, dose, and incubation conditions. Measure outcomes that matter for feed use: soluble protein fraction, viscosity (for relevant ingredients), and pellet water stability.
Process Foundations Before Adding Enzymes
Enzymes work only when conditions match their preferences.
- Moisture and mixing: Enzymes need water to function. If the substrate is too dry, activity drops. If mixing is poor, you get uneven treatment.
- pH control: Many proteases have an optimal pH range. Adjusting pH with food-grade buffers or process water can improve consistency.
- Temperature management: Enzymes have temperature optima. Too cool slows the reaction; too hot can denature the enzyme.
- Particle size: Smaller particles increase surface area and reaction rate, but they can also affect pellet durability and handling.
A common best practice is to pre-condition the ingredient to the target moisture, then add enzyme while maintaining mixing long enough to reach uniform distribution.
Stepwise Workflow for Enzyme-Assisted Treatment
A systematic workflow keeps results repeatable.
- Define the target: protein digestibility improvement, viscosity reduction, or phosphorus availability.
- Prepare a bench batch: use the same ingredient lot and particle size as production.
- Set conditions: choose pH, temperature, and incubation time based on enzyme label guidance and bench results.
- Run a short incubation: aim for partial hydrolysis rather than extensive breakdown.
- Inactivate or stabilize: depending on the process, you may inactivate enzymes by heat or proceed directly to the next manufacturing step.
- Check functional outcomes: confirm soluble protein increase, acceptable odor, and pellet performance.
Mind Map: Enzyme-Assisted Processing for Digestibility Improvement
Enzyme-Assisted Processing Mind Map
Example: Protease Treatment of Plant Protein Blend
Suppose you formulate a feed where plant protein is replacing fishmeal. You suspect digestion is limited by protein structure and that pellets may leach more than expected.
A bench trial could proceed like this:
- Use the same plant-protein blend intended for the batch.
- Adjust moisture to a level that allows mixing without turning it into a paste.
- Set pH to the protease working range.
- Incubate at the protease temperature optimum for a short window.
- Stop the reaction by moving to the next processing step (or by heat inactivation if that fits your workflow).
What you look for:
- Soluble protein fraction increases, indicating partial hydrolysis.
- Pellet water stability remains acceptable, meaning you did not overdo the breakdown.
- In a feeding trial, feed conversion improves and fecal solids decrease.
If soluble protein rises but pellets crumble, the enzyme dose or incubation time is likely too high. Reduce dose first, then time, before changing pH or temperature.
Example: Carbohydrase Treatment for Viscosity Control
In feeds containing higher levels of certain plant ingredients, viscosity can rise in the gut and reduce nutrient diffusion.
A practical approach is to:
- Treat the ingredient blend with a carbohydrase under conditions that match its optimal pH and temperature.
- Keep incubation short to avoid excessive breakdown that could harm pellet integrity.
- Verify that viscosity-related performance improves using a simple viscosity proxy test on treated versus untreated slurry.
If viscosity drops but feed intake falls, check for changes in odor or texture from over-treatment. Often, the fix is simply shortening incubation.
Quality Checks That Tie Processing to Outcomes
Enzyme-assisted processing should be validated with measurements that connect to feed use:
- Soluble protein or peptide indicators to confirm partial hydrolysis.
- Functional tests such as water stability and leaching behavior.
- Microbial and safety checks to ensure that incubation conditions do not create an unsafe environment.
When these checks are consistent across batches, the enzyme step becomes a controlled lever rather than a hopeful experiment.
7.4 Reducing Anti-Nutritional Factors in Plant Proteins With Practical Methods
Plant proteins often carry compounds that interfere with digestion, nutrient absorption, or palatability. The goal is not to “remove everything,” but to reduce the specific anti-nutritional factors that matter for your ingredient and your target species, while keeping protein quality and cost under control.
Core Anti-Nutritional Factors and What They Do
Start by matching the problem to the mechanism:
- Trypsin inhibitors (common in legumes) slow protein digestion by blocking digestive enzymes. Fish may show slower growth and poorer feed conversion when these are high.
- Phytate binds minerals like phosphorus, iron, and zinc, reducing their availability. Even if the feed contains the minerals, phytate can keep them unavailable.
- Tannins and phenolics can reduce protein digestibility and sometimes bind to proteins, making them harder to break down.
- Glycosides and other heat-labile compounds may cause off-flavors or stress depending on species sensitivity.
- Non-starch polysaccharides increase viscosity or reduce effective nutrient contact with the gut surface, especially in some plant-heavy formulations.
A practical approach is to test the ingredient (or use supplier specs) for the likely factor set, then choose methods that target those factors.
Mind Map: Anti-Nutritional Factor Reduction Path
Practical Methods, from Simple to More Targeted
1) Physical Processing That Reduces the Load
Begin with the ingredient’s “where the problem lives.” In many legumes, anti-nutritional compounds concentrate in hulls or outer fractions.
- Dehulling and fractionation: Removing hull-rich fractions can reduce tannins and some phenolics. A simple example is comparing two batches of the same legume: one milled whole and one dehulled. If the dehulled meal shows better protein digestibility in a small bench trial, you’ve confirmed the distribution.
- Particle size control: Too-fine grinding can increase leaching of soluble inhibitors into water during feed making, while too-coarse particles reduce digestion. A practical target is to match particle size to your pellet process so the ingredient disperses without excessive leaching.
2) Thermal Processing with Measured Targets
Heat is effective for many enzyme inhibitors, but “more heat” is not always better because it can damage amino acids and reduce solubility.
- Controlled moist-heat treatment: Moist heat typically inactivates trypsin inhibitors more reliably than dry heat at the same temperature. Example: treat legume meal at a fixed moisture level and time, then measure trypsin inhibitor activity or use a digestibility proxy. If digestibility improves up to a point and then declines, you’ve found the sweet spot.
- Avoid overprocessing: Watch for signs of protein denaturation that reduce dispersibility. In practice, you can compare pellet water stability and dispersibility between under- and over-treated batches.
3) Water Washing and Mild Extraction for Phenolics
Phenolics and tannins are often water-soluble or can be reduced by washing.
- Water washing: A straightforward example is washing legume meal with controlled water-to-solid ratio, then drying. You should expect reduced astringency and improved digestibility, but also some loss of soluble proteins.
- Balance yield and quality: If washing reduces anti-nutritional factors but drops protein recovery too much, you can compensate by blending a partially washed batch with a less-processed batch.
4) Enzymatic Treatments for Phytate and Digestibility
Enzymes can target specific compounds without heavy thermal damage.
- Phytase treatment: Phytase breaks down phytate, improving mineral availability. Example: treat a portion of plant meal with phytase under conditions that keep the enzyme active, then dry and incorporate into a formulation. You can verify improvement by measuring phosphorus availability proxies or by observing improved growth in a controlled feeding trial.
- Protease-assisted partial hydrolysis: Partial hydrolysis can improve solubility and reduce the effective size of proteins that bind to phenolics. Example: hydrolyze briefly, then stop the reaction and dry. The goal is improved dispersibility, not turning everything into low-value peptides.
5) Fermentation to Reduce Multiple Factors at Once
Fermentation can lower pH, activate endogenous enzymes, and introduce microbial enzymes that degrade inhibitors.
- Lactic acid fermentation: Useful for reducing certain phenolics and improving flavor. Example: ferment a plant meal slurry, then dry. Compare treated vs untreated meal for pellet odor and digestibility.
- Solid-state fermentation: Often effective for reducing enzyme inhibitors and improving functional properties. Example: ferment under controlled moisture and temperature, then test for inhibitor activity and protein solubility.
Fermentation works best when you control moisture, time, and temperature tightly; otherwise, you get inconsistent results.
Integrated Quality Checks That Prevent “Fixing One Thing and Breaking Another”
Use a small set of checks that map to the method:
- Enzyme inhibitor activity after thermal or fermentation steps.
- Phytate proxies or phosphorus availability after phytase or fermentation.
- Protein dispersibility and pellet water stability after any heat, washing, or hydrolysis.
- Sensory checks for off-odors or bitterness that can reduce feed intake.
A simple workflow is to run a bench comparison: untreated meal, physically processed meal, thermally treated meal, and one enzymatic or fermentation option. Then choose the method that improves digestibility and functional performance with the smallest negative impact on yield.
Example Workflow for a Legume-Based Ingredient
- Dehull or fractionate to reduce hull-associated phenolics.
- Moist-heat treat the remaining meal to inactivate trypsin inhibitors.
- Apply phytase to a portion if phytate is high, then blend back to maintain cost.
- Dry and test dispersibility, pellet leaching, and a digestibility proxy.
This sequence targets the major inhibitor classes in a way that keeps protein functionality usable for aquafeed manufacturing.
7.5 Quality Control Tests for Protein Function Including Water Binding and Gelation
Protein function in aquafeeds is not just about “how much protein” is present. It’s about what the protein does when water, heat, and shear show up during conditioning and pellet drying. Two practical behaviors matter here: water binding (how strongly proteins hold water) and gelation (how proteins form a network that resists breakdown). These tests help you predict pellet water stability, texture, and consistency across ingredient lots.
Core Concepts You Can Measure
Water binding is usually expressed as water-holding capacity or related indices. In simple terms, higher water binding can reduce pellet crumbling and slow leaching. Gelation is the formation of a protein network upon heating and cooling, which can be evaluated by gel strength, gel formation temperature, or rheological behavior.
A useful mental model is “water first, then structure.” Proteins hydrate during mixing and conditioning; later, heat drives unfolding and interactions that create a gel-like matrix. If either step fails—poor hydration, weak interactions, or excessive denaturation—you’ll see poor pellet integrity.
Sampling and Test Readiness
Start with a consistent sampling plan. For each ingredient lot, take representative samples from multiple bags or bins, then homogenize. For fermented algae protein, include both the fermented ingredient and any post-processing step (drying or blending), because processing can shift solubility and water behavior.
Before running tests, standardize moisture basis and particle size where possible. If one sample is much finer, it may hydrate faster and appear “better” even if chemistry is unchanged. Keep test conditions aligned with your manufacturing reality: similar pH range, similar ionic strength, and comparable heating profiles.
Water Binding Tests
Water-Holding Capacity by Centrifugation
This is a straightforward screening test. Mix a known mass of protein sample with excess water, allow hydration for a fixed time, then centrifuge and measure how much water remains bound.
Example: If Sample A retains 2.4 g water per g dry sample and Sample B retains 1.6 g/g, Sample A is more water-binding under the test conditions. In pellet terms, Sample A often supports better water stability, but you still need gelation checks to confirm structure formation.
Key controls:
- Use the same hydration time for every sample.
- Run blanks for non-protein solids if your ingredient has high ash.
- Report results on a dry-matter basis.
Swelling and Dispersibility in Controlled Water
Swelling indicates how much volume increases upon hydration, while dispersibility indicates how readily the material breaks apart. These are useful for fermented proteins that may behave differently than raw meals.
Example: Two samples may show similar water-holding capacity, but one disperses into fine particles. That sample may leach faster from pellets even if it holds water internally.
Gelation Tests
Heat-Induced Gel Strength by Simple Compression
Prepare a protein slurry at a defined concentration, heat using a controlled profile, cool, then measure gel strength with a texture analyzer or a consistent compression method.
Example: A fermented protein blend that forms a firm gel at moderate heating may support pellet integrity without excessive conditioning. A blend that only gels at high temperature may require harsher processing, increasing the risk of off-odors or nutrient damage.
Gelation Temperature Window by Differential Heating
Instead of only measuring final strength, track when gelation begins and ends. This helps you connect ingredient behavior to your conditioning step.
Example: If gelation starts around the conditioning temperature for your process, you can expect faster network formation and improved water stability. If gelation starts far above your process temperature, the pellet may rely more on binders than on protein network formation.
Integrated Quality Control Workflow
Run tests in a sequence that mirrors manufacturing: hydration behavior first, then structure formation.
- Confirm sample consistency (moisture basis, particle size, pH/ionic conditions).
- Measure water binding (water-holding capacity and swelling/dispersibility).
- Measure gelation (gel strength and gelation temperature window).
- Connect results to pellet outcomes using a small internal correlation set (for example, water stability index and pellet durability).
Example workflow: If a new algae fermentation batch shows higher water-holding capacity but lower gel strength, you may see pellets that hydrate without forming a strong matrix. The fix is often formulation or processing adjustment, such as changing protein concentration in the blend, selecting a complementary binder, or tuning conditioning moisture.
Mind Map: Protein Water Binding and Gelation Quality Control
Practical Acceptance Criteria and Decision Rules
Acceptance criteria should be ingredient- and process-specific, but you can use decision rules that are easy to apply.
- Rule 1: If water-holding capacity drops beyond your control limits, treat the batch as higher leaching risk.
- Rule 2: If gel strength drops while water binding stays stable, suspect disrupted protein interactions from processing or blending.
- Rule 3: If gelation temperature shifts upward, expect weaker performance at your current conditioning profile.
Example: Suppose fermented algae protein from one lot shows similar water-holding capacity to the standard, but gel strength is 20% lower and gelation starts later. You can respond by adjusting conditioning moisture or blend ratio with a complementary protein/binder system, then re-test to confirm the network forms within the process window.
Common Failure Modes and What They Look Like
- Over-hydration without structure: pellets soften quickly in water tests.
- Insufficient hydration: pellets may crack during drying or show uneven surface integrity.
- Excessive denaturation: gel strength can fall even if water binding remains high.
- Particle size drift: results vary even when chemistry is unchanged.
These tests are most valuable when you treat them as a linked system. Water binding tells you how proteins behave during hydration; gelation tells you whether they build a stable matrix under heat. Together, they provide a practical, measurable bridge from ingredient chemistry to pellet performance.
8. Formulation and Manufacturing of Low-Impact Aquafeeds
8.1 Building Formulation Models Using Nutrient Constraints and Cost Boundaries
A formulation model is a structured way to answer one question: “What mix of ingredients meets the fish’s needs at the lowest practical cost, without breaking quality rules?” You start with nutrient constraints, then add cost boundaries, and finally include real-world limits like maximum inclusion rates and processing losses. The model is only as good as the inputs, so the workflow should be systematic.
Step 1: Define the Target Nutrient Profile
Begin with a target specification for the diet by species and life stage. Typical targets include crude protein, digestible energy, essential amino acids, essential fatty acids, minerals, and vitamins. For each nutrient, decide whether you need a minimum (e.g., lysine) or a range (e.g., calcium). A practical model uses “minimums” for nutrients that fish cannot synthesize and “ranges” for nutrients that can become waste or cause imbalance.
Easy example: If the target digestible energy is 4.0 kcal/g minimum, and your ingredient database shows energy values, the model must choose ingredients whose weighted average meets or exceeds 4.0 kcal/g.
Step 2: Convert Ingredient Data Into Usable Constraints
Ingredient labels rarely match your exact diet basis. Convert everything to a consistent basis (as-fed or dry matter) and align units. Then decide whether to use crude values or digestible values. Digestible values usually reduce overfeeding risk, but they require more reliable data.
Easy example: If algae meal has 45% crude protein but only 80% digestibility proxy, you can model digestible protein as 0.80 × crude protein. If you lack digestibility data, you can still model crude protein but expect more conservative inclusion limits.
Step 3: Add Nutrient Constraints That Reflect Biology
Use constraints that prevent common failure modes:
- Amino acid balance: constrain lysine, methionine, threonine, and others relative to protein.
- Energy-protein coupling: prevent high protein diets caused by low-energy ingredients.
- Mineral ratios: constrain calcium and phosphorus to avoid precipitation and poor availability.
- Fatty acid essentials: include omega-3 sources when required.
Easy example: If methionine is limiting, the model may raise total protein by adding a high-protein ingredient. A methionine constraint forces the model to add the right ingredient rather than just more protein.
Step 4: Add Cost Boundaries and Practical Limits
Cost boundaries are not just “minimize cost.” You also need guardrails:
- Ingredient cost per ton and any handling costs.
- Maximum inclusion rates based on palatability, processing behavior, or anti-nutritional factors.
- Minimum inclusion rates for functional ingredients like binders or emulsifiers.
- Batch feasibility limits such as maximum number of ingredients or minimum lot sizes.
Easy example: Even if fermented algae protein is cheap per unit protein, you may cap it at 15% inclusion because it can change pellet water stability. The model should respect that cap.
Step 5: Choose the Model Type and Solve
A common approach is linear programming: the decision variables are ingredient inclusion rates, and the objective is minimizing total cost subject to nutrient and inclusion constraints. If you include nonlinear effects like pellet durability, you can approximate with linear proxies (e.g., binder percentage ranges) or run a two-stage workflow.
Easy example: Stage one minimizes cost while meeting nutrient targets. Stage two checks pellet water stability and adjusts binder within allowed ranges, then re-solves if needed.
Step 6: Validate with “Sanity Checks” Before Trusting the Output
Validation catches bad inputs and unrealistic solutions:
- Mass balance: inclusion rates must sum to 100%.
- Nutrient math: verify weighted averages match the model’s calculations.
- Constraint tightness: if one nutrient is always barely met, you may need a safety margin.
- Ingredient behavior: confirm the chosen ingredients are compatible with your manufacturing process.
Easy example: If the model chooses a very high inclusion of a fine powder that your mill cannot handle consistently, the output is mathematically valid but operationally wrong. Add a particle-size or processing constraint.
Mind Map: Nutrient Constraints and Cost Boundaries
Example: Two Diets with Different Cost Structures
Suppose you have three protein sources: crop protein meal, algae meal, and fermented algae protein. Crop protein is cheapest per kg, algae meal is moderate, and fermented algae protein is slightly higher cost but has better functional performance.
- Diet A goal: meet minimum protein and amino acids at lowest cost.
- Diet B goal: meet the same nutrient targets but also respect a pellet water stability proxy by limiting the crop protein inclusion and allowing more fermented algae protein.
In Diet A, the model may push crop protein to the maximum allowed. In Diet B, the pellet proxy constraint shifts the feasible region, so the model reallocates inclusion toward fermented algae protein even if it raises ingredient cost. The key is that both diets satisfy nutrient constraints; they differ because the model includes different practical boundaries.
Example: Safety Margins Without Guesswork
If your ingredient assays vary, add a margin to critical nutrients rather than relying on a single point estimate. For instance, set lysine as a minimum of target lysine × 1.05 instead of exactly target lysine. This margin should be applied only to nutrients with known variability and known consequences.
When you implement this consistently, the model stops producing “just barely meets the spec” diets and starts producing formulations that survive normal ingredient fluctuation—without turning every constraint into a blanket overage.
8.2 Balancing Amino Acids Energy Lipids and Micronutrients in Practical Recipes
Balancing a practical aquafeed recipe is mostly about matching nutrient supply to nutrient demand, then preventing the “side effects” that happen when one nutrient is abundant while another is limiting. Amino acids drive growth, energy and lipids determine how efficiently those amino acids are used, and micronutrients keep enzymes and transport systems running. The trick is to balance them in a way that survives real-world variation in ingredients.
Core Logic for Recipe Balancing
Start with three constraints that you can measure or estimate:
- Amino acid adequacy: Identify the limiting amino acids for the target species and life stage (often lysine and methionine for many fish diets). Use a formulation approach that treats amino acids as separate inputs rather than assuming “crude protein” is enough.
- Energy adequacy: Ensure the diet provides enough digestible energy so amino acids are not burned for fuel. If energy is too low, feed conversion worsens and waste increases.
- Micronutrient adequacy: Vitamins and minerals are required in small amounts but can cap performance when missing or poorly available.
Then add two practical constraints:
- Ingredient variability: Algae meal, fermented proteins, and crop proteins can swing in amino acid profile, digestibility, and mineral availability.
- Physical performance: Water stability, pellet durability, and leaching influence how much of the formulated nutrients fish actually ingest.
Mind Map: Nutrient balancing workflow
Amino Acids: Treat Protein as a Delivery System
Crude protein is a useful headline, but it hides the real bottleneck: the digestible amino acid pattern. For example, if a fermented algae protein increases total protein but also changes amino acid digestibility, the diet may still be limiting in lysine even though “protein percent” looks fine. A practical workflow is to:
- Use ingredient amino acid profiles (including digestibility assumptions).
- Formulate to the limiting amino acids first.
- Then check the rest of the amino acid spectrum for imbalances that can create secondary limitations.
Easy example: Suppose you target a digestible lysine level of 2.2% for a juvenile fish diet. If your fermented ingredient has lysine digestibility that is 10% lower than expected, you may need a higher inclusion rate than the spreadsheet suggests, or you may need to blend with a complementary protein source.
Energy and Lipids: Prevent “Amino Acids as Fuel”
Energy balance is often the silent driver of poor feed conversion. When digestible energy is too low, fish use amino acids for energy instead of growth. When energy is too high, you can end up with excess fat deposition and less efficient growth.
Lipids contribute energy, but they also affect pellet quality and feed intake. Essential fatty acids must be included, yet total lipid should not be treated as a free lever.
Easy example: If you replace a portion of fish oil with a lower-energy protein ingredient, the diet’s digestible energy drops. If you do not adjust with a more energy-dense ingredient or a lipid fraction, you may see slower growth even if amino acids remain at target levels.
Micronutrients: Small Amounts, Big Caps
Micronutrients include vitamins and minerals such as phosphorus, iron, zinc, selenium, and iodine. Their availability can change with processing and ingredient type. Fermentation can improve some nutrient availability, but it can also alter mineral binding and pH-related chemistry.
A practical approach is to:
- Set micronutrient premix inclusion based on species requirements.
- Check mineral antagonisms and binding risks, especially where high phytate or high fiber ingredients are present.
- Confirm that the premix is compatible with the manufacturing process and pellet drying conditions.
Easy example: If a crop protein ingredient brings along higher phytate, phosphorus availability may drop. The recipe may still meet total phosphorus targets on paper, but performance can lag unless you adjust available phosphorus or use appropriate processing to improve availability.
Integration Checks That Catch Common Mistakes
After you balance amino acids and energy, run two quick checks:
- Protein-to-energy ratio: If protein is high relative to energy, amino acids are more likely to be used for fuel.
- Amino acid to energy balance: Even with correct protein percent, an energy mismatch can shift how efficiently amino acids support growth.
Also consider water stability and leaching. If a pellet breaks down quickly, the effective intake of amino acids and micronutrients drops, and the diet “underperforms” despite correct formulation.
Worked Mini-Recipe Logic
Imagine a diet built around fermented algae protein plus a plant protein blend.
- Choose inclusion rates so limiting amino acids meet digestible targets.
- Adjust lipid level to hit digestible energy without overshooting essential fatty acids.
- Set micronutrient premix to species requirements, then verify phosphorus availability assumptions for the plant fraction.
- Mix a small batch and check pellet durability and water stability; if leaching is high, reduce breakdown by adjusting binders and processing parameters.
If the fish show slower growth, the first questions are not “Is protein too low?” but “Is energy adequate?” and “Are the limiting amino acids actually digestible at the level we assumed?” That order saves time and feed.
8.3 Pellet Production Parameters Including Conditioning Extrusion and Drying
Pellet production is where formulation theory meets physics. Your goal is consistent pellet shape, stable water behavior, and predictable nutrient availability—without turning proteins into rubber or fat into a puddle.
Conditioning Fundamentals for Consistent Pellet Formation
Conditioning is the controlled step before extrusion. Feed is mixed with steam and held long enough for moisture and temperature to distribute evenly.
Key targets are not universal numbers; they are relationships. Higher protein blends often need gentler conditioning to avoid excessive protein denaturation and poor digestibility. Higher fiber or starch blends often need more heat and moisture to improve binding.
A practical way to set conditioning parameters is to start with a “stability check” rather than a “growth promise.” Run short batches and measure: (1) pellet die face behavior, (2) pellet integrity after a short water soak, and (3) pellet moisture after drying. If pellets crack in the first minutes of soaking, you likely need better binding (often more moisture/heat or a different binder level). If pellets are soft and smear, you likely overdid heat or moisture.
Example: Suppose you are using fermented algae protein with higher solubility. You may reduce conditioning temperature slightly and increase hold time to distribute moisture without overheating. The result is often better pellet surface integrity and less sticky die buildup.
Extrusion Mechanics and Die Design for Water Stable Pellets
Extrusion shapes the pellet and influences internal structure. The die controls diameter, length, and surface texture. The barrel and screw design influence shear and residence time.
For aquafeeds, water stability matters because many pellets are eaten after partial immersion. A pellet that disintegrates quickly wastes nutrients and increases solids in the water.
Two practical checks help connect extrusion settings to outcomes:
- Die pressure and torque behavior: Rising torque with stable throughput can indicate excessive friction from formulation changes (for example, too much fine powder or too little lubrication from fats).
- Pellet cross-section texture: A dense, uniform core usually correlates with better mechanical strength. A porous core often means insufficient binding or too rapid moisture flash-off.
Example: If you switch from a crop protein blend to a fermented algae protein blend and notice more fines, reduce the fraction of very fine particles or adjust conditioning moisture upward slightly. Fines often form when the material cannot compact before exiting the die.
Drying Strategy for Nutrient Integrity and Pellet Durability
Drying removes moisture to a target level that supports storage stability and reduces microbial risk. It also locks in the pellet’s physical structure.
Drying is a balancing act between speed and damage. Too hot or too fast can cause case hardening, where the outside dries and seals while the inside remains wetter. That can lead to later cracking or uneven water uptake.
A systematic drying approach uses three stages:
- Stage 1: Gentle moisture removal to avoid surface sealing. Use moderate air temperature and ensure airflow reaches the pellet bed.
- Stage 2: Main drying to reach the target moisture. Maintain steady airflow and avoid large temperature swings.
- Stage 3: Conditioning or equilibration to reduce moisture gradients. This step improves uniformity and reduces breakage during handling.
Example: If pellets show higher breakage after cooling, you may be drying too aggressively in Stage 1. Lowering initial air temperature while increasing residence time often reduces surface sealing and improves durability.
Integrated Parameter Map for Troubleshooting
Use the following mind map to connect symptoms to likely process causes.
Mind Map: Conditioning Extrusion and Drying
Example Workflow for Setting Parameters Without Guessing
Start with a baseline run using your current formulation and record: conditioning moisture, conditioning temperature, hold time, die diameter, screw speed, and drying air profile.
Then change one variable at a time:
- If water stability is poor, adjust conditioning moisture and hold time first, then review die pressure behavior.
- If mechanical durability is poor, review drying profile and equilibration, not just final moisture.
- If die buildup increases, reduce conditioning temperature or steam rate and check fine particle fraction.
Example: For a batch containing fermented algae protein, you might observe good extrusion but weak water stability. Increase conditioning hold time slightly while keeping temperature constant, then confirm with a short soak test. If pellets improve without increasing die buildup, you have likely improved internal binding rather than just surface drying.
Practical Quality Checks During Production
Quality checks should be fast enough to guide the next batch.
- Moisture after drying: verify target range and uniformity.
- Short soak test: compare pellet integrity after a fixed immersion time.
- Fines fraction: measure after cooling and handling.
- Process logs: die pressure, torque, and any buildup events.
When these checks disagree, prioritize the one that matches the failure mode. Pellet disintegration points to conditioning/extrusion binding. Pellet cracking points to drying gradients. Die buildup points to conditioning and formulation physical behavior.
8.4 Binder Selection and Water Stability Testing for Different Feed Types
Water stability is the difference between “pellet stays together” and “pellet becomes soup.” Binder choice controls how strongly particles stick during conditioning, how they resist softening in water, and how they behave in the gut. The goal is not maximum hardness; it is predictable performance across feed type, species, and feeding method.
Foundational Concepts for Binder Behavior
Binders work through three main mechanisms. First is gelation and film formation, where a binder creates a surface layer that slows water penetration. Second is protein or starch network development, where heat and moisture promote swelling and bonding. Third is particle bridging, where fine binder particles fill gaps and increase contact points.
A practical way to think about binder selection is to match binder mechanism to feed type. Dry, floating feeds need surface integrity. Sinking feeds need structural stability long enough to reach the bottom without turning into crumbs. Extruded feeds often already have a cooked matrix, so binders mainly fine-tune surface behavior rather than create the entire structure.
Binder Options and When They Make Sense
Starches and modified starches are common for water stability because they form films as they gelatinize. They work best when conditioning provides enough moisture and heat to activate gelatinization, and when the pellet is dried to lock in the structure.
Gelatin and collagen-derived binders create strong films and can improve cohesion, especially for feeds that must resist early sloughing. They can also increase palatability, but they may soften faster if the drying step is incomplete.
Proteins such as wheat gluten or soy protein concentrates contribute to bonding through heat-induced network formation. They are useful when the feed already contains proteins that can integrate with the binder matrix.
Cellulose derivatives and gums improve water resistance by increasing viscosity and forming a protective layer. They are often used at lower inclusion rates to avoid excessive softness or reduced digestibility.
Lignin-based binders and mineral binders can improve pellet integrity, but they may affect texture and nutrient availability. They are best treated as structural aids rather than primary cohesion systems.
Binder Selection Workflow for Real Formulations
- Identify feed type and target water window. For example, a sinking feed for bottom feeders may need stability for 10–20 minutes, while a floating feed may need stability for shorter periods but with minimal surface erosion.
- Check the base matrix. If the formulation already has high gelatinization potential (starch-rich) or strong extrusion cooking, binder needs are typically lower.
- Set inclusion constraints. Keep binder additions consistent with nutrient goals and avoid pushing the feed into “too sticky to handle” territory.
- Plan for drying and storage. A binder that forms a good film can still fail if moisture is too high after drying.
- Run bench trials with the same conditioning and drying profile you will use in production.
Water Stability Testing That Actually Guides Decisions
Water stability testing should measure both physical integrity and water behavior. Use at least two endpoints: pellet disintegration and leaching.
Pellet disintegration test: Place a known mass of pellets in standardized water at controlled temperature and gentle agitation. At set time points, collect remaining pellets, dry them, and calculate mass loss.
Water clarity and fines release: Measure turbidity or visually score suspended fines. This helps distinguish “pellet softens but holds shape” from “pellet breaks into fine particles.”
Nutrient leaching proxy: If you cannot run full nutrient assays each time, track a consistent proxy such as protein nitrogen in the water or a standardized dye tracer in pilot blends. The point is to compare binders under the same conditions.
Example Binder Choices by Feed Type
Example: Sinking extruded feed with moderate starch
- Start with a protein-based binder or gelatin at a modest inclusion.
- Ensure conditioning moisture is sufficient for network formation.
- Dry to a target moisture that prevents post-drying softening.
- Expect improved pellet integrity with reduced fines release.
Example: Floating pellet with high surface exposure
- Use starch or gum-based film formers to slow surface erosion.
- Focus on drying uniformity so the film is continuous.
- Test stability at early time points because floating feeds often fail quickly at the surface.
Example: High-fiber plant-protein blend
- Consider cellulose derivatives or gums to manage viscosity and cohesion.
- Pair with a binder that bridges particles, since fiber can reduce contact points.
- Confirm that the binder does not overly increase softness in the first minutes.
Mind Map: Binder Selection and Water Stability Testing
Practical Testing Setup and Interpretation
Keep water temperature consistent because gelatinization and film softening are temperature-sensitive. Use the same pellet size and number of pellets per test to avoid misleading results from overcrowding. Record agitation intensity; gentle mixing can preserve pellets longer than turbulent conditions.
When comparing binders, look for three patterns. If mass loss is low but turbidity is high, the pellet is shedding fines rather than holding a coherent structure. If turbidity is low but mass loss is high, the pellet is dissolving or breaking into larger fragments. If both are low, you likely achieved a binder-film plus matrix-cohesion balance.
Finally, confirm handling performance. A binder that improves water stability but makes pellets crumble during transport defeats the purpose. The best binder is the one that stays intact in water without turning the production line into a stress test.
8.5 Practical Troubleshooting for Pellet Durability Feed Leaching and Odor
Pellet problems usually come from one of three places: the pellet is not strong enough, water carries nutrients out too easily, or the ingredient blend is producing compounds that smell even when the fish do not. The fastest way to troubleshoot is to separate these symptoms, then trace them back to formulation, processing, and handling.
Start with Symptom Separation
Pellet durability shows up as fines, cracked pellets, or rapid breakdown in the first minutes after water contact. Feed leaching shows up as nutrient loss in the water column, often noticed as cloudiness or a “nutrient wash” after feeding. Odor can be ingredient-specific (algae, fermented fractions, certain crop proteins) or process-related (overheating, poor drying, or contamination).
A practical workflow is to test three small batches: one stored dry, one conditioned to simulate handling, and one soaked in water for a fixed time. Keep the soak water temperature consistent with your farm conditions so you are not chasing a temperature artifact.
Pellet Durability Failure Modes and Fixes
Common causes
- Insufficient binder performance: binders may be present but not activated, or they may be mismatched to pellet moisture and conditioning.
- Low conditioning energy: too little steam or too short conditioning time can leave proteins and starches less plastic.
- Over-drying or under-drying: pellets that are too dry can become brittle; pellets that are too wet can crumble after extrusion.
- Particle size mismatch: very fine meals increase surface area and can raise water demand; very coarse particles reduce cohesion.
Easy examples
- If pellets crumble during bagging, reduce fines by adjusting mill screen size to avoid excessive dust, then verify binder inclusion and conditioning time.
- If pellets crack after drying, check whether drying temperature is too high or residence time too long; aim for consistent moisture rather than “as hot as possible.”
Quick checks
- Measure pellet moisture after drying and after 24 hours of storage.
- Compare binder performance by running a small bench pellet test with and without the binder at the same conditioning moisture.
Feed Leaching Failure Modes and Fixes
Leaching is not only about “water stability.” It reflects how much of the pellet surface dissolves before the pellet matrix tightens.
Common causes
- High surface solubles: fermented proteins and some algae fractions can be rich in readily soluble components.
- Insufficient matrix formation: low starch gelatinization or inadequate protein denaturation can leave a weak network.
- Binder type mismatch: some binders improve durability but do not reduce diffusion of dissolved nutrients.
- Pellet geometry and thickness: thicker pellets take longer to hydrate and can reduce early leaching, but they must still be strong.
Easy examples
- If water turns cloudy quickly, try increasing conditioning moisture slightly and confirm binder activation. Then re-test soak loss using the same soak time.
- If leaching is high but pellets remain intact, focus on binder selection and formulation solubles rather than pellet hardness.
Practical soak test
Use a fixed pellet count and a fixed water volume. After a set time, filter the water and compare turbidity or simple colorimetric indicators. Consistency matters more than absolute numbers.
Odor Failure Modes and Fixes
Odor usually traces to either ingredient chemistry or microbial activity.
Common causes
- Fermentation carryover: residual acids or volatile compounds can smell strongly.
- Inadequate drying: high moisture after fermentation or after pelleting can allow microbial growth.
- Oxidation: lipids in algae or crop oils can develop rancid notes if storage is warm or oxygen exposure is high.
- Cross-contamination: residues in grinders, mixers, or pellet dies can transfer odor between batches.
Easy examples
- If odor appears only in fermented-algae batches, check fermentation termination and drying targets before blaming the fish feed.
- If odor appears in every batch after a certain day, inspect equipment cleaning and verify that the die and cooler are not holding residues.
Root-cause checks
- Smell and moisture check at three points: incoming fermented ingredient, post-dry ingredient, and finished pellets.
- Confirm storage conditions for both ingredient and finished feed: warm storage often turns “mild” into “noticeable.”
Mind Map: Pellet Durability, Leaching, and Odor
Integrated Example: One Batch, Three Problems
A batch shows high fines, cloudy soak water, and a sour odor.
- Durability: Measure finished pellet moisture and compare to the target. If moisture is high, drying residence time or cooler performance is likely insufficient; if moisture is low, drying may be too aggressive, causing brittleness.
- Leaching: If pellets are intact but water is cloudy, leaching is driven by surface solubles and diffusion. Adjust conditioning to improve matrix formation and verify binder activation.
- Odor: If sour notes match the fermented ingredient, check fermentation termination and drying. If odor appears after equipment cleaning lapses, inspect mixers, grinders, and the die for residue.
When you fix only one symptom, the others often persist. Treat the batch like a system: confirm moisture first, then binder activation, then ingredient-specific odor sources.
9. Testing Protein Quality and Feed Safety for Ingredient Acceptance
9.1 Proximate Analysis and Protein Determination Methods for Incoming Materials
Incoming ingredients are where feed quality either starts strong or starts drifting. Proximate analysis gives a fast, practical snapshot of major fractions, while protein determination methods translate that snapshot into a usable number for formulation. The key is to treat results as ingredient fingerprints, not universal truths.
What Proximate Analysis Covers and Why It Matters
Proximate analysis typically reports moisture, ash, crude protein, crude fat, crude fiber, and sometimes nitrogen-free extract. For aquafeed formulation, the most actionable outputs are moisture (for storage stability and weighing accuracy), ash (for mineral load and dilution effects), and crude protein (for nutrient balancing).
A simple example: two algae meals may both list “50% protein,” but one contains higher ash and moisture. If you weigh them into the same recipe, the fish receive different amino acid supply and the pellet may behave differently in water.
Protein Determination Methods and Their Assumptions
Most “protein” numbers come from nitrogen measurement plus a conversion factor. The logic is straightforward: proteins contain nitrogen, so nitrogen content can estimate protein content. The catch is that not all nitrogen is protein nitrogen, and different ingredients contain different non-protein nitrogen fractions.
Common approaches include:
- Kjeldahl nitrogen: Measures total nitrogen after digestion. It is robust for many matrices but can overestimate protein when non-protein nitrogen is high.
- Dumas combustion: Measures nitrogen by combustion and can be faster. It also relies on conversion factors and can be sensitive to sample preparation.
- Amino acid profiling: Measures amino acids directly. It is more specific but slower and more expensive, and it requires careful hydrolysis conditions.
For incoming materials, a practical best practice is to use Kjeldahl or Dumas as the routine method, then periodically verify with amino acid profiling for calibration of conversion factors and to catch systematic bias.
Sampling and Sample Handling
Protein results are only as good as the sample. Incoming lots often vary by container, transport vibration, and moisture uptake.
Use a sampling plan that includes:
- Composite sampling across multiple points in the lot.
- Moisture control by sealing subsamples quickly.
- Homogenization before weighing, especially for meals with particle size differences.
Example: if you only sample the top of a bag of fermented algae meal, you may capture more dried, lighter material and understate moisture and protein concentration.
Laboratory Workflow for Routine Protein Determination
A systematic workflow reduces avoidable variability.
- Drying or moisture correction: Decide whether results are reported on an “as received” or “dry matter” basis. Mixing bases is a classic way to create formulation errors.
- Weighing and replication: Run duplicates or triplicates for each composite sample.
- Blank and standard checks: Include reagent blanks and a nitrogen standard or reference material.
- Digestion or combustion: Follow validated parameters for the matrix type.
- Calculation: Convert nitrogen to crude protein using an appropriate factor.
A practical note: if you change the conversion factor, document it and apply it consistently across all lots used in a formulation period.
Choosing Conversion Factors Without Guessing Blindly
Conversion factors are not universal. Ingredients with higher non-protein nitrogen (for example, some fermented products) can inflate crude protein if you use a generic factor.
A best practice is to:
- Start with a standard factor used by your facility.
- Compare routine protein results against periodic amino acid profiling.
- Adjust the factor only if the difference is consistent and justified by your ingredient chemistry.
Quality Control for Incoming Material Acceptance
Protein determination should include acceptance logic, not just measurement.
- Precision checks: If duplicates differ beyond your lab’s control limits, re-run.
- Mass balance sanity checks: Compare protein plus ash plus fat plus fiber plus moisture to expected ranges for that ingredient class.
- Trend monitoring: Track protein and moisture by supplier and by lot to detect shifts.
Example: if protein stays stable but ash jumps, the ingredient may have contamination from mineral-rich handling surfaces or different drying conditions.
Mind Map: Proximate Analysis and Protein Determination for Incoming Materials
Worked Example: Turning Results Into Formulation Inputs
Suppose an incoming algae meal is tested as follows (values are illustrative): moisture 8.0%, ash 12.0%, crude protein 45.0% on an as-received basis.
- Convert protein to dry matter basis: dry matter is 92.0%, so protein on dry matter is 45.0 / 0.92 = 48.9%.
- Use ash to anticipate mineral dilution: ash 12.0% on as-received means minerals are substantial and may require balancing with other ingredients.
- If fermented batches show protein consistently higher than amino acid profiling suggests, apply your facility’s validated factor adjustment rather than changing it ad hoc.
When these steps are done consistently, formulation becomes less about “best guesses” and more about controlled inputs with traceable reasoning.
9.2 Amino Acid Profiling and Digestibility Proxies for Ingredient Comparisons
When you compare aquafeed ingredients, protein quantity alone is not enough. Two meals can share the same crude protein percentage yet differ in amino acid balance, availability, and how much of that protein the fish can actually use. Amino acid profiling answers the “what is there” question, while digestibility proxies answer the “how much is usable” question. Used together, they help you compare ingredients on a common playing field.
Amino Acid Profiling Foundations
Amino acid profiling typically starts with hydrolysis of the ingredient protein, followed by quantification of individual amino acids. The practical goal is not just listing numbers, but converting them into formulation-ready constraints.
Key choices affect comparability:
- Hydrolysis method: Different conditions can degrade certain amino acids. For example, methionine and cysteine can be sensitive, so you need a consistent method across ingredients.
- Reporting basis: Use a consistent basis such as “per kg dry matter” or “per kg crude protein.” Mixing bases is a common reason comparisons look wrong.
- Free vs bound amino acids: Some ingredients contain more free amino acids, which can inflate apparent availability if you treat all amino acids as equally digestible.
A simple example: Ingredient A and Ingredient B both show 45% crude protein. Profiling reveals Ingredient A has lower lysine per kg protein. Even if total protein matches, Ingredient A will likely require more lysine supplementation or will underperform in growth.
From Profiles to Formulation Constraints
Once you have amino acid concentrations, translate them into constraints that match the target species and life stage. The workflow is:
- Choose the target amino acid pattern for the fish stage.
- Convert ingredient amino acids to the same basis as the target.
- Apply digestibility assumptions to estimate “available” amino acids.
- Check limiting amino acids first, then verify energy and micronutrient compatibility.
A practical check: If an ingredient is rich in non-limiting amino acids but weak in the limiting one, you may still need supplementation. The limiting amino acid is the one that determines whether the fish can convert protein into tissue.
Digestibility Proxies What They Measure
Direct digestibility trials are accurate but slow and expensive. Digestibility proxies provide faster, ingredient-to-ingredient comparisons. They do not replace feeding trials, but they help you screen candidates.
Common proxy categories:
- In vitro protein digestibility: Enzyme-based assays estimate how much protein breaks down under controlled conditions.
- Protein solubility and dispersibility: Higher solubility often correlates with faster access by digestive enzymes, especially for fish that feed on pellets in water.
- Nitrogen release behavior: Some tests estimate how quickly nitrogenous compounds appear in solution, which can relate to leaching and availability.
A concrete example: Two meals have similar amino acid profiles. Ingredient C shows higher solubility in water at relevant pH, and its in vitro digestibility is higher. In formulation, you can treat Ingredient C as providing more “available” amino acids, reducing the need for extra supplementation.
Mind Map: Amino Acid Profiling and Digestibility Proxies
Choosing and Interpreting Proxies Without Getting Tricked
Proxies can mislead if you ignore ingredient processing. Heat treatment can reduce digestibility by creating protein cross-links, even when amino acid composition looks unchanged. That’s why you should interpret proxies alongside processing history.
A practical interpretation rule:
- If amino acid profile is similar but digestibility proxy differs, the difference is likely about availability, not composition.
- If amino acid profile differs, the difference is likely about balance, and supplementation strategy should change.
Example: Comparing Two Plant-Based Protein Ingredients
Suppose Ingredient D and Ingredient E both contain 40% crude protein.
- Amino acid profiling shows Ingredient D has 2.8% lysine per kg protein, while Ingredient E has 3.4%.
- In vitro digestibility proxy results show Ingredient D at 85% and Ingredient E at 70%.
How to reason it through:
- Ingredient E may reduce lysine supplementation needs due to higher lysine content.
- Ingredient D may provide more usable amino acids due to higher digestibility.
- The “best” ingredient depends on which amino acid is limiting after applying digestibility assumptions.
If lysine is limiting in your formulation, you compute available lysine as lysine concentration multiplied by digestibility proxy. Then you compare available lysine per kg feed, not just per kg protein.
Integration Checklist for Ingredient Comparisons
Before you finalize a comparison, confirm:
- Amino acid results use the same basis and method across ingredients.
- Digestibility proxies are measured under conditions relevant to your feed type.
- You apply digestibility assumptions consistently when estimating available amino acids.
- You prioritize limiting amino acids first, then verify that other constraints do not break.
This approach turns “numbers on a lab report” into a coherent basis for ingredient selection, with fewer surprises when you move from bench measurements to feeding performance.
9.3 Microbiological Safety Testing for Fermented Ingredients and Finished Feeds
Microbiological safety testing answers one question: “Are we controlling the organisms that can cause harm, spoilage, or process failure?” Fermented algae-derived ingredients add complexity because fermentation can reduce some risks while creating conditions that favor others if handling goes wrong. A good testing plan treats fermentation as a controlled step, then verifies safety at both the ingredient and finished-feed stages.
Core Concepts and Testing Logic
Start with a simple risk chain. Raw biomass may carry environmental microbes. Fermentation changes pH, temperature, and oxygen exposure, which can suppress some organisms but not all. After fermentation, drying, milling, and mixing introduce opportunities for recontamination. Finished feed then adds storage and water-activity considerations.
A systematic approach uses three layers:
- Process verification during fermentation (to confirm the intended conditions are achieved).
- Ingredient release testing for fermented intermediates.
- Finished-feed testing for batch acceptance and shelf stability checks.
What to Test and Why
Use a targeted panel rather than a long wish list. Common categories include:
- Indicator organisms (e.g., total aerobic counts) to track hygiene and process consistency.
- Pathogen screening where relevant to your supply chain and regulatory expectations.
- Hygiene and spoilage organisms that can grow during storage if moisture is too high.
- Fungal and yeast counts because fermented ingredients and plant-based components can support molds when water activity rises.
A practical rule: if your fermentation reliably lowers pH and you dry to a stable moisture target, you should see indicator counts drop and fungal growth remain controlled. If results do not match that pattern, investigate handling steps rather than assuming the ingredient is “fine.”
Sampling Strategy That Actually Works
Sampling errors are the most common reason microbiological results feel confusing. For fermented ingredients, take samples from multiple points in the batch: top, middle, and bottom of storage containers. For finished feed, sample across the production run so you capture start-up and steady-state conditions.
Keep samples cool and process them promptly. Label clearly with batch ID, time, and sampling location. If you use composite samples, document how many subsamples were combined and from where.
Test Methods and Acceptance Criteria
Choose methods that match the organism category and the matrix.
- Culture-based enumeration for indicator organisms and many pathogens.
- Selective media to reduce background and improve interpretability.
- Rapid screening tests when you need faster decisions, followed by confirmatory methods when required.
Acceptance criteria should be written as thresholds tied to your risk chain. For example, if your fermentation consistently reaches a target pH and your drying step reliably reduces moisture, your ingredient release criteria can be stricter than your incoming biomass criteria. The key is that criteria must align with what your process is designed to achieve.
Mind Map: Microbiological Safety Testing Workflow
Example: Interpreting a Fermented Ingredient Result
Imagine a fermented algae meal batch with acceptable pH and odor, but total aerobic counts are higher than your historical range. If fungal counts are also elevated, the likely issue is post-fermentation moisture exposure or incomplete drying. If aerobic counts are high while fungal counts remain low, the issue may be hygiene during mixing or packaging.
Your next action should be specific: review drying logs, check storage humidity, and verify sanitation of the mill and packaging line. Then re-test a retained sample and, if needed, sample the next production run to confirm whether the problem is isolated.
Example: Finished Feed Batch Decision
Suppose finished pellets show low indicator counts but a borderline fungal/yeast result. If water activity is within your target and pellets were stored in controlled humidity, you can treat it as a sampling or batch-to-batch variation and follow your written hold-and-retest procedure. If water activity is high or storage humidity exceeded limits, you should reject or rework because the risk is not just “what grew today,” but what can grow during storage.
Documentation and Traceability
Every result must connect to a batch record: fermentation start and end times, pH and temperature logs, drying parameters, and sampling locations. When a batch fails, the record should help you identify whether the failure is tied to fermentation conditions, equipment sanitation, or handling after drying. That is how testing becomes a control tool rather than a paperwork exercise.
Practical Checklist for Operators
- Confirm fermentation conditions met the written targets.
- Sample fermented intermediate from multiple container locations.
- Sample finished feed across the production run.
- Use a targeted microbiological panel aligned to your risk chain.
- Interpret results against process expectations, not against vibes.
- Document actions taken for holds, re-tests, and reworks.
9.4 Contaminant Screening Including Heavy Metals Mycotoxins and Residues
Contaminant screening is where “low-impact” meets reality: ingredients can be clean in one batch and messy in the next. The goal is not to test everything forever, but to test the right things at the right frequency, using methods that match the risk.
Foundational Concepts and Risk Framing
Start with a simple risk map: (1) where the contaminant comes from, (2) how it moves into algae meal, fermented protein, or crop-derived ingredients, and (3) whether processing reduces or concentrates it.
Heavy metals often enter from water, soil, or equipment corrosion. Mycotoxins usually come from crop storage conditions and can persist through typical milling. Residues include pesticides, veterinary drugs, cleaning agents, and processing aids that may remain if washing and drying are incomplete.
A practical screening plan uses three layers:
- Incoming material screening to decide acceptance.
- In-process checks to catch deviations early.
- Finished feed verification to confirm the formulation and manufacturing steps did what they were supposed to do.
Sampling Plans That Actually Represent the Batch
Contaminants are rarely evenly distributed, so sampling design matters as much as the lab method.
Use a stratified approach for bulk solids: sample from multiple locations and depths (top, middle, bottom) and combine into a composite sample. For pellets, sample across production time (early, mid, late) and across physical zones in the cooler.
A concrete example: if you receive 10 tons of dried algae meal, take small increments from at least 20 locations, then composite and split into lab and retain portions. If results are borderline, you can re-test the retain portion without re-sampling the entire lot.
Heavy Metals Screening Workflow
Define a target list based on ingredient origin and known exposure pathways. For many aquafeed contexts, common targets include cadmium, lead, mercury, arsenic, and sometimes chromium.
Screening workflow:
- Set action limits for each metal and ingredient type.
- Test incoming lots and compare to limits.
- Check formulation math by estimating metal contribution from each ingredient.
- Verify finished feed when risk is elevated or when you change suppliers.
Example: if algae biomass is produced in a controlled system, metals may be low and stable. If you switch to a different water source or supplier, you treat the next few lots as “high attention” until you confirm stability.
Mycotoxins Screening Workflow
Mycotoxins are strongly linked to moisture and storage time. Screening should focus on the crop and storage history.
Common targets for plant-based ingredients include aflatoxins, ochratoxin A, fumonisins, deoxynivalenol, and zearalenone, depending on crop type.
Systematic workflow:
- Collect storage data such as moisture at receipt and time in storage.
- Use screening tests for rapid triage.
- Confirm positives with a higher-specificity method.
- Apply segregation rules so suspect lots do not mix into “good” inventory.
Example: if a batch of alternative protein crop meal arrives with higher-than-usual moisture, you increase sampling intensity and require confirmatory testing before it enters fermentation or blending.
Residues Screening Including Pesticides and Cleaning Agents
Residues require a different mindset: they are often tied to specific practices rather than general contamination.
Approach:
- Start with a residue matrix: ingredient source, crop protection history, and processing steps.
- Screen for likely classes rather than random lists.
- Verify that cleaning and drying steps reduce carryover.
Example: if a facility uses a specific cleaning chemical for equipment sanitation, you validate that rinsing and drying prevent measurable carryover in the next production run. If you cannot validate, you treat the first batches after cleaning as higher risk.
Mind Map of Contaminant Screening Decisions
Mind Map: Contaminant Screening Decisions
Interpreting Results and Taking Action Without Guessing
Interpretation should be tied to a decision tree:
- Below action limit: release with routine frequency.
- Between screening and action limits: quarantine and re-test using retain sample.
- Above action limit: reject or divert to non-feed use.
Example: if a fermented algae protein lot shows a mycotoxin near the screening threshold, you do not automatically reject it. You quarantine, re-test the retain sample, and check whether the fermentation inputs and drying conditions were within spec. If both align, you may release; if not, you reject.
Documentation That Makes Audits Boring
Keep records that connect cause to decision: sampling plan, lab method identifiers, action limits, batch traceability, and the exact disposition. A good record answers one question quickly: “Why was this lot allowed to become feed?”
9.5 Acceptance Criteria and Release Procedures for Production Batches
A production batch should not be released because it “looks fine.” It should be released because it meets defined acceptance criteria for safety, identity, and performance, and because the paperwork matches what actually happened. This section turns that idea into a repeatable workflow.
Core Release Logic
Start with three questions for every batch: What is it? Is it safe? Will it perform as intended?
-
Identity is verified through ingredient traceability and formulation controls. For example, if fermented algae protein is a key input, the batch record must show the correct lot numbers and inclusion targets.
-
Safety is verified through microbiological and contaminant testing. A practical example: if a fermented ingredient is produced under controlled conditions, you still test the incoming fermented lot and the finished feed, because handling and storage can change outcomes.
-
Performance is verified through quality attributes that correlate with feeding outcomes. For example, water stability and pellet durability matter because they determine how much feed remains available in the tank.
Acceptance Criteria by Category
Use acceptance criteria that are specific enough to prevent arguments, but simple enough to measure consistently.
-
Documentation acceptance: Batch record completeness, correct weights, correct mixing times, and correct equipment settings. Example: if the conditioning temperature is recorded as 85°C, the release decision should require that the log shows that value for the entire run.
-
Ingredient identity and traceability: Lot numbers, supplier certificates where applicable, and internal verification results. Example: if a plant protein lot is substituted due to supply issues, the batch should be treated as a new formulation and tested accordingly.
-
Safety acceptance: Microbial limits, heavy metals, and any relevant chemical residues. Example: if a contaminant test fails for one ingredient lot, the batch should not be released even if the finished feed test is pending.
-
Physical and functional acceptance: Moisture, pellet durability, water stability, and basic sensory checks. Example: a batch with acceptable moisture but poor water stability may still be rejected because it will increase waste and reduce growth.
-
Nutritional acceptance: Proximate analysis and targeted nutrient checks that confirm the formulation is within tolerance. Example: if protein is consistently low across multiple batches, the issue is likely upstream in ingredient variability or processing.
Release Procedure Workflow
A release procedure should be written as a sequence of gates. Each gate has a decision and a documented outcome.
-
Pre-release review: Confirm the batch record is complete and deviations are documented. Example: if mixing time was shortened due to a jam, the deviation must be recorded with the corrective action.
-
Sampling plan verification: Confirm samples were taken at the right points and labeled correctly. Example: finished feed samples should represent the full run, not only the start.
-
Test results review: Compare results to acceptance criteria. Example: if pellet durability is slightly low, check whether it is linked to binder level or conditioning conditions before deciding on rework.
-
Decision: Release, hold, reject, or rework. Example: a hold is appropriate when one non-critical test is pending, but not when a safety test fails.
-
Corrective action linkage: If a deviation or out-of-spec result occurred, ensure the corrective action is assigned and completed or formally scheduled.
-
Release authorization: Only designated roles can approve release, and the approval must reference the batch ID and test results.
Concrete Example: One Batch, Four Decisions
Imagine a batch containing fermented algae protein and a plant protein blend.
- Gate 1 passes: Records show correct lot numbers and mixing time.
- Gate 2 passes: Finished feed samples were taken from the full run.
- Gate 3 results:
- Safety tests pass.
- Pellet durability is within tolerance.
- Water stability is pending.
- Decision: Place the batch on hold until water stability is confirmed, because safety is already cleared and the remaining test is performance-related.
Now consider a second batch where the contaminant test fails for a heavy metal screening on an incoming ingredient lot. Even if finished feed results are not yet available, the correct decision is reject for that batch because safety criteria are non-negotiable.
Finally, consider a third batch where water stability is low but safety tests pass. If the deviation points to binder under-dosing, the batch may be reworked by adjusting binder level and reprocessing, followed by retesting the relevant functional attribute.
The point of these examples is consistency: every decision ties back to a category of criteria and a gate in the workflow, so release is a controlled outcome rather than a judgment call.
10. Feeding Trials and Performance Evaluation in Aquaculture Settings
10.1 Designing Trials Including Replication Randomization and Duration
A feeding trial is only as useful as its design. The goal is simple: estimate how a feed affects growth, survival, and waste, while separating feed effects from tank effects, handling effects, and plain old chance.
Core Trial Questions
Start by writing three measurable questions before you touch a spreadsheet:
- Does the feed change growth rate or final biomass?
- Does it change feed conversion ratio and waste indicators?
- Does it affect health, survival, or gut condition?
Each question maps to an outcome variable and a measurement schedule. For example, growth outcomes need periodic weighing, while gut condition may require a terminal sampling day.
Experimental Unit and Replication
The experimental unit is the smallest unit that receives a treatment independently. In aquaculture trials, that is usually a tank or cage, not an individual fish.
Replication means multiple experimental units per treatment. A practical rule: use enough replicates to detect the expected effect size with acceptable uncertainty. If you expect a modest improvement in feed conversion, you need more tanks than if you expect a large growth difference.
Easy example: If you test three diets (A, B, C) and you have 12 tanks, you can assign 4 tanks per diet. If you instead assign 12 fish per diet but only one tank per diet, you cannot separate diet effects from tank effects.
Randomization and Blocking
Randomization prevents systematic bias, like placing the “best” tanks near the inlet. Use random assignment of treatments to experimental units.
Blocking handles known sources of variation. If tanks differ by position, flow, or light, group them into blocks and randomize within each block.
Easy example: Suppose you have 6 tanks in two rows. Treat each row as a block. Randomly assign diets A, B, C within each row so every diet appears in both rows.
Duration and Measurement Schedule
Duration should cover the life stage and the time needed for measurable differences to appear. Too short, and you measure noise. Too long, and you risk confounding factors like size-dependent feeding behavior.
A systematic approach:
- Choose a primary endpoint tied to the question, such as final weight or specific growth rate.
- Estimate how quickly fish reach a stable feeding response after diet change.
- Set a sampling cadence that captures trends without excessive disturbance.
Easy example: If you expect diet effects on feed conversion within two weeks, you might weigh weekly and compute cumulative feed conversion at the end. If you expect gut changes to show earlier, you can add a mid-trial sampling day.
Controls and Baseline Handling
Include a reference diet or a standard formulation when possible. If you cannot, ensure baseline measurements are collected before the trial starts.
Baseline handling matters because fish size distributions often differ. Use a pre-trial acclimation period with the same feed, then measure initial biomass and average size.
Allocation, Feeding, and Consistency
Keep feeding procedures consistent across treatments:
- Use the same feeding method and schedule.
- Record daily feed offered and uneaten feed.
- Maintain consistent stocking density and water management.
If you adjust ration based on biomass, apply the same rule across treatments. Example: “Feed 3% body weight per day, adjusted weekly based on the last weigh-in.”
Data Integrity and Pre-Defined Calculations
Define calculations before the trial begins:
- Specific growth rate
- Feed conversion ratio
- Survival rate
- Waste indicators such as fecal output proxies
Also pre-define exclusion rules. Example: If a tank experiences an equipment failure, decide whether it is excluded and how. If you do not pre-define this, “cleanup” decisions can accidentally bias results.
Mind Map: Trial Design Logic
Worked Example: Three Diets with Blocking
Imagine testing Diet A (control), Diet B (algae meal fermentation protein), and Diet C (plant protein blend). You have 9 tanks arranged in 3 blocks of 3 tanks each.
- Block 1: tanks with similar flow
- Block 2: tanks with similar flow
- Block 3: tanks with similar flow
Randomize A, B, C within each block. Run the trial for a duration that matches the species life stage and expected response window, with weekly weighing and daily feed logging. At the end, compute growth and feed conversion per tank, then compare diets using tank-level averages.
Practical Checklist Before Starting
- Primary endpoint and secondary endpoints are written.
- Experimental unit is confirmed as tank or cage.
- Replication per diet is set.
- Randomization and blocking plan is documented.
- Duration and sampling schedule are fixed.
- Feeding ration rule is consistent across treatments.
- Calculations and exclusion rules are pre-defined.
When these pieces are in place, the trial results can be interpreted without guessing whether the tanks, the handling, or the calendar did the heavy lifting.
10.2 Measuring Growth Feed Conversion Ratio and Survival Outcomes
Measuring growth and survival is where “formulation math” meets living biology. Growth Feed Conversion Ratio (FCR) tells you how much feed was used to produce biomass, while survival outcomes tell you whether the diet supported basic health and tolerance. Together, they prevent a common trap: a diet that looks efficient on paper but quietly harms fish.
Core Definitions and Why They Matter
FCR is typically calculated as:
- FCR = Feed intake (dry matter) / Biomass gain (wet or dry matter, consistently defined)
To keep comparisons fair, you must lock down three choices before the trial starts:
- Feed basis: dry matter intake versus as-fed intake.
- Biomass basis: wet weight gain versus dry weight gain.
- Accounting rule: whether you subtract mortalities from biomass at the end only, or adjust for their contribution during the trial.
Survival outcome is usually reported as percent survival:
- Survival (%) = (Final number of fish / Initial number of fish) × 100
Percent survival is simple, but it hides timing. A diet that causes early mortality is different from one that causes late, slow losses. Recording when deaths occur helps interpret FCR without guessing.
Trial Setup for Reliable Growth and FCR
Start with replication and consistent handling. If you stock multiple tanks, treat each tank as an experimental unit for statistics, not each fish. Randomize fish to tanks to reduce “tank personality” effects like water flow differences.
Feed intake measurement must be disciplined. Use one of these approaches:
- Weighed feeding: weigh feed offered and collect uneaten feed for drying and weighing.
- Automated feeders with calibration: verify actual delivered feed by collecting and weighing output over a short calibration window.
Uneaten feed is not a nuisance; it is part of the FCR story. If you ignore it, FCR will look better than reality.
Step-by-Step Calculation Workflow
- Record initial biomass per tank (sum of individual weights or a representative sample method).
- Track feed offered daily and uneaten feed at scheduled intervals.
- Compute dry feed intake: offered dry matter minus uneaten dry matter.
- Measure final biomass at the end of the trial.
- Adjust biomass gain using your mortality accounting rule.
- Calculate FCR for each tank.
- Compute survival (%) and plot mortality timing.
A practical example: if a tank consumes 12.0 kg dry feed and shows 3.0 kg net biomass gain after accounting for mortalities, then FCR = 12.0 / 3.0 = 4.0. If survival is 95% versus 80%, you can interpret whether the diet’s efficiency came with acceptable biological support.
Interpreting FCR Without Overclaiming
FCR can improve for reasons that are not purely “better nutrition.” For instance, a diet that increases activity or changes gut fill can alter measured biomass gain. That’s why you should pair FCR with survival and, when possible, with digestibility indicators or consistent growth curves.
Also watch for outlier tanks. One tank with unusually low uneaten feed collection can distort mean FCR. Predefine how you handle sampling errors: typically you flag the tank, verify records, and avoid silent correction.
Survival Outcomes and Their Link to Diet Performance
Survival outcomes should be reported alongside FCR, not after. A diet with slightly worse FCR but higher survival may still be the better operational choice because it reduces losses and maintains production stability.
To connect survival to diet effects, record:
- Death timing (days post-stocking)
- Observed signs (e.g., abnormal behavior, lesions, fin damage)
- Tank conditions (temperature, oxygen, salinity, flow)
If mortality clusters early, suspect palatability, stress from handling, or ingredient tolerance issues. If mortality is spread out, consider chronic factors like nutrient imbalance or water quality interactions.
Mind Map: Growth FCR and Survival Measurement
Example: Comparing Two Diets in a Tank Trial
Suppose Diet A and Diet B are tested with three replicate tanks each. Diet A yields mean FCR 1.9 with survival 92%. Diet B yields mean FCR 1.8 with survival 78%. Even though Diet B looks slightly more efficient, the survival gap suggests the diet may be less supportive under the trial conditions. The next step is not to “average away” the problem; it is to review mortality timing and tank logs to confirm whether the losses align with diet exposure.
Practical Reporting Checklist
When you report results, include for each diet:
- Mean and variability of FCR per tank
- Mean and variability of survival (%)
- Mortality timing summary
- Clear statement of dry matter basis and biomass basis
- Mortality accounting rule used for biomass gain
This keeps the numbers interpretable and prevents the classic situation where two teams calculate FCR differently and then argue about who is “right.”
10.3 Assessing Digestibility and Waste Outputs Including Fecal Indicators
Digestibility tells you how much of the feed’s nutrients actually get used, while waste indicators tell you what leaves the system. In aquaculture, both matter because a feed can look “nutrient-rich” on paper yet still produce high nitrogen or phosphorus losses. The goal of this section is to connect measurements to practical decisions: ingredient acceptance, formulation tweaks, and feeding adjustments.
Core Concepts That Link Feed to Feces
Start with three linked ideas.
-
Apparent digestibility estimates how much of a nutrient disappears from the feed and does not show up in feces. It is “apparent” because it includes losses from metabolism and because feces sampling is never perfect.
-
Fecal indicators are measurable signals in fecal material or settled solids that correlate with undigested nutrients. They help you interpret digestibility results when direct nutrient assays are limited.
-
Waste outputs include both feces and dissolved losses. Fecal indicators mainly reflect the particulate fraction; dissolved nitrogen and phosphorus reflect the soluble fraction.
A simple way to keep the system straight: digestibility answers “how much was used,” while waste outputs answer “where did the leftovers go.”
Designing Sampling That Doesn’t Lie
Digestibility measurements fail most often due to sampling bias. Fish do not produce feces on a neat schedule, and solids settle at different rates depending on pellet size and water flow.
Use a consistent sampling window after feeding. For example, if you feed at 09:00, collect fecal/settled solids between 10:00 and 12:00 for a species that typically clears feed within that period. Keep the window the same across diets.
Also standardize:
- Feed form and size: pellet diameter and hardness affect leaching and fecal particle size.
- Water flow and aeration: higher flow can reduce settling time and change what you collect.
- Collection method: siphoning settled solids, using fecal collection trays, or using settlement columns. Choose one method and stick to it.
Measuring Digestibility with Nutrient Mass Balance
A practical approach uses a nutrient marker to estimate how much nutrient was absorbed.
- Marker choice: inert markers (like chromic oxide in some contexts) or endogenous markers (like ash or fiber fractions) depending on your lab capability.
- Sampling: collect feed samples and fecal/solids samples from the same diet period.
- Analysis: run proximate or targeted nutrient assays (crude protein, amino acids, lipid, ash).
Then compute apparent digestibility using a mass balance equation based on marker concentration in feed and feces. The exact formula depends on marker type, but the logic is consistent: if marker is stable and nutrient decreases in feces, digestibility increases.
Using Fecal Indicators to Interpret What’s Happening
Fecal indicators are not substitutes for nutrient assays, but they are excellent for diagnosing patterns.
Common indicators include:
- Dry matter and ash in feces: higher ash with similar dry matter can suggest more indigestible mineral fraction.
- Fecal protein or nitrogen content: higher fecal protein often signals insufficient protein digestibility or excessive protein inclusion.
- Fecal particle size distribution: larger, intact pellet fragments suggest poor breakdown or short gut residence time.
- Leaching-related cues: if feces protein is low but dissolved nitrogen is high, the issue may be leaching before ingestion.
A concrete example: if Diet A and Diet B have similar apparent protein digestibility, but Diet B produces feces with higher lipid content, you may be dealing with lipid digestibility differences even when crude protein looks fine. That can happen when lipid emulsification or fatty acid availability differs between ingredient blends.
Waste Outputs That Complement Fecal Data
To avoid a one-sided view, pair fecal indicators with water measurements.
- Total ammonia nitrogen (TAN) and nitrate reflect nitrogen transformations. Elevated TAN shortly after feeding can indicate rapid release from leaching or incomplete assimilation.
- Dissolved phosphorus reflects phosphorus release and uptake dynamics.
- Suspended solids and settling rate help interpret whether waste is mostly particulate (feces) or mostly dissolved.
If fecal indicators show high undigested protein but dissolved nitrogen is not proportionally high, the system may be retaining particulate waste in the collection zone. In that case, your fecal sampling likely captures the main loss pathway.
Mind Map: Digestibility and Waste Assessment
Example Workflow for One Diet Comparison
Suppose you compare a control diet to an algae-fermented protein diet.
- Feed both diets at the same ration schedule and keep pellet size identical.
- Collect settled solids during the same post-feeding window for each tank.
- Measure marker and nutrient concentrations in feed and solids to compute apparent digestibility.
- Run fecal indicator assays: dry matter, ash, and fecal nitrogen.
- Measure TAN and dissolved phosphorus in water at matching times.
Interpretation rule of thumb: if the fermented diet shows higher apparent protein digestibility and fecal nitrogen drops while TAN does not spike, you have evidence that the protein is being used rather than leaking. If fecal nitrogen drops but TAN rises, the protein may be dissolving or leaching earlier than ingestion.
Quality Checks That Keep Results Comparable
Before trusting conclusions, verify:
- Feed intake consistency across diets.
- Marker stability in feces samples.
- Collection completeness by checking total solids mass recovered.
- Replicate agreement so one tank’s odd feces day doesn’t become “the result.”
When digestibility and waste indicators agree, you can make confident formulation decisions. When they disagree, the mismatch is useful—it points to whether the problem is digestion, leaching, or sampling.
10.4 Health Monitoring Including Histology Gut Condition and Stress Markers
Health monitoring in aquaculture is most useful when it links “what you see” to “what might be happening” and then to “what you will change.” Histology and stress markers work best as a paired system: histology shows tissue-level effects, while stress markers show physiological responses that can shift before tissue damage becomes obvious.
Core Principles for Interpreting Gut Health
Start with the gut as a functional organ, not just a tube. In many species, early stress shows up as altered digestion capacity, changes in mucus production, and epithelial disruption. Later, those changes can progress to inflammation, villus or fold damage, and impaired barrier function.
A practical approach is to monitor three layers in sequence:
- Barrier layer: mucus, epithelial integrity, and tight junction appearance.
- Digestive layer: enterocyte morphology and signs of enzyme-related wear.
- Immune layer: inflammatory cell presence and distribution.
When these layers move together, you can interpret cause more confidently. When only one layer changes, you look for a narrower explanation such as feed particle size, binder effects, or ingredient-specific irritation.
Histology Workflow That Produces Comparable Results
Histology is only as good as its sampling consistency. Use the same fish size range, sampling time relative to feeding, and fixation method across batches.
A systematic workflow:
- Sampling timing: collect at a consistent interval after feeding so digestion stage is comparable.
- Tissue selection: sample the same gut region each time, because anterior and posterior segments respond differently.
- Fixation and sectioning: fix promptly, keep orientation consistent, and use comparable section thickness.
- Staining choice: use stains that highlight epithelial structure and mucus, plus a stain or method that supports inflammation assessment.
To keep scoring repeatable, define a gut condition scale before you start. For example, score epithelial integrity, mucus coverage, and inflammatory infiltration separately, then combine them into a gut condition index.
Stress Markers That Complement Histology
Stress markers are measurable indicators of physiological strain. They help you distinguish “feed-related irritation” from “system-wide stress” such as handling or water quality.
Common marker categories include:
- Endocrine stress markers: hormones that rise with acute stress and can normalize if the stressor stops.
- Oxidative stress markers: indicators of reactive oxygen balance that can increase with poor digestibility or ingredient irritation.
- Inflammation-associated markers: signals that align with histological immune changes.
Use a simple logic: if stress markers rise but histology is unchanged, the stress may be recent or mild. If histology changes but stress markers are low, the issue may be chronic tissue damage with partial physiological adaptation. If both rise, you likely have an active stressor affecting both physiology and tissue.
Mind Map: Gut Condition and Stress Monitoring
Example: Linking Observations to Likely Causes
Example 1: Epithelial disruption with high inflammation scores
- Histology shows reduced mucus coverage and patchy epithelial lifting.
- Inflammatory infiltration is concentrated near the lumen.
- Stress markers show elevated endocrine and inflammation-associated signals.
A likely driver is an ingredient or processing factor that irritates the gut lining. In practice, you would check whether the new ingredient inclusion changed particle size distribution, pellet water stability, or the degree of protein denaturation and solubility.
Example 2: Oxidative stress markers rise without major epithelial damage
- Histology shows mostly intact epithelium and normal mucus coverage.
- Oxidative markers are elevated.
This pattern often points to digestion inefficiency or localized chemical stress rather than direct barrier failure. You would review digestibility proxies from ingredient testing and confirm that the feed is not producing excessive leaching or uneven intake.
Example 3: Chronic tissue changes with modest stress markers
- Histology shows persistent epithelial thinning and mild inflammation.
- Stress markers are not strongly elevated.
This can occur when the stressor has been present long enough for physiological responses to partially settle. Here, the action is to focus on sustained feed quality issues such as consistent ingredient composition, stable processing conditions, and reliable pellet durability.
Action Loop for Monitoring Results
After each sampling round, translate findings into one of three categories:
- Barrier problem: prioritize mucus and epithelial integrity checks.
- Digestive problem: prioritize digestibility-related formulation and processing factors.
- Immune problem: prioritize inflammation patterns and ingredient-specific irritation.
Then adjust only one major variable at a time—formulation, processing, or feeding regimen—so the next histology and marker set can be interpreted without guesswork. The goal is not to collect more data; it is to make the next batch easier to explain.
10.5 Data Handling and Reporting Using Standard Performance Metrics
Good aquaculture data handling is mostly about boring consistency: same units, same definitions, same calculations, and the same way of handling missing values. When those pieces are stable, your performance metrics become comparable across tanks, days, and ingredient batches—without turning every report into a debate.
Define Metrics Before You Collect Data
Start by writing a one-page metric sheet that states: (1) what each metric measures, (2) the exact formula, (3) required inputs, (4) sampling frequency, and (5) acceptance thresholds for data quality. For example, if you plan to compute Feed Conversion Ratio (FCR), you must define whether “feed input” means dry matter or as-fed weight, and whether uneaten feed is estimated or assumed negligible.
A practical approach is to separate metrics into three layers:
- Production outcomes: growth, survival, biomass gain.
- Efficiency: feed use, nutrient use proxies.
- Health and waste indicators: condition, gut observations, fecal output proxies.
Use Standard Units and Consistent Time Windows
Standard performance metrics only behave well when time windows match. If you weigh fish weekly, compute growth rates over the same week boundaries for every replicate. If you switch feeding rates mid-week, record the change and keep the metric window aligned with the feeding schedule.
Use a single unit system across the study. For instance, keep mass in grams, feed in grams dry matter (or as-fed consistently), and water temperature in °C. If you must convert, do it once in a documented step and store both the raw and converted values.
Build a Data Pipeline That Survives Real Life
A simple pipeline prevents most reporting errors:
- Raw capture: weigh logs, feed delivery logs, mortality counts, water measurements.
- Validation: range checks (e.g., temperature not negative), unit checks, and cross-checks (e.g., mortality counts never exceed starting stock).
- Transformation: compute derived variables like mean body weight, daily feed intake, and cumulative feed.
- Metric calculation: apply formulas to derived variables.
- Reporting: generate tables and plots with the same metric definitions.
When data are missing, avoid silent guessing. Use a consistent rule such as “exclude the tank from growth-rate calculations for that interval” while still reporting survival if mortality data are complete.
Core Metrics and Their Reporting Format
Report metrics with three elements: value, variability, and the basis for the calculation.
- Growth: final mean weight and specific growth rate (SGR) over the defined interval.
- Survival: percent survival and the underlying mortality counts.
- Feed Conversion Ratio: FCR computed from feed input and biomass gain using the defined time window.
- Condition and health: gut condition scoring summary and any standardized stress indicators.
A useful reporting table includes columns for replicate ID, starting biomass, final biomass, feed input, uneaten feed estimate (if used), FCR, SGR, and survival. If you include water quality, summarize it as mean and range per interval so readers can interpret performance without hunting through logs.
Mind Map of Standard Reporting Workflow
Mind Map: Data Handling and Reporting Workflow
Example: Turning Logs Into a Replicate-Level Summary
Imagine a trial interval where each tank has a starting biomass, a final biomass, and a feed total. You compute biomass gain as final minus starting, then compute FCR as feed input divided by biomass gain using your defined feed basis. If one tank has missing final weighing, you exclude it from FCR and SGR for that interval but still report survival if mortality is complete.
In the final report, you present replicate-level results first, then summarize across replicates using mean and standard deviation. If variability is high, include the raw replicate values so the reader can see whether the spread comes from one outlier tank or consistent differences.
Reporting Consistency Checklist
Before publishing results, verify:
- Metric formulas match the metric sheet exactly.
- Units are consistent across all tables.
- Time windows align with sampling and feeding schedules.
- Missing data rules are applied uniformly.
- Every table states the calculation basis (as-fed vs dry matter, interval dates, and whether uneaten feed was estimated).
This is the unglamorous part that makes the glamorous part—ingredient comparisons—actually trustworthy.
11. Case Studies of Integrated Algae Fermentation and Circular Feed Operations
11.1 Case Study of Algae Meal Fermentation Into Protein Enriched Feed Ingredient
Case Setup and Baseline
A mid-sized aquafeed plant receives dried algae meal with variable protein (32–45% as-fed) and noticeable pigments that can tint pellets. The goal is to produce a protein-enriched ingredient for grow-out diets while keeping water stability and safety consistent. The team starts with a baseline batch: algae meal is milled to a uniform particle size, then analyzed for moisture, crude protein, amino acid profile, and microbial load. They also run a quick bench solubility test by mixing meal in warm water, then measuring how much protein remains suspended after settling. This baseline matters because fermentation should improve functional behavior, not just lab protein numbers.
Mind Map: Case Workflow and Decision Points
Fermentation Design from First Principles
The plant chooses a fermentation approach that prioritizes protein functionality and safety. They select a microbial starter based on two practical criteria: it should reduce undesirable compounds associated with pigments and it should not degrade essential amino acids under the chosen conditions. Instead of guessing, they run a small pilot using three fermentation temperatures and two moisture levels, each with the same starter dose. The endpoint is not “time until it feels done,” but a measurable pH range plus a consistent reduction in off-odor intensity during sampling.
A simple rule guides the process: if the pH drops too slowly, the batch risks inconsistent microbial activity; if it drops too fast, the process may stall before the protein fraction becomes more functional. The team therefore monitors pH at regular intervals and adjusts with controlled water addition only during the early phase. That keeps the fermentation repeatable without turning the process into a chemistry experiment.
Pre-Treatment and Handling That Prevent Problems
Algae meal is often dusty and uneven. The plant sieves it to remove oversized particles that ferment unevenly. They then adjust moisture to a target that supports microbial growth without creating a slurry that is hard to dry later. If the meal is unusually high in pigments, they consider a brief heat pre-step to reduce pigment-associated compounds that can interfere with downstream odor screening. The pre-step is kept short to avoid excessive protein denaturation.
Post-Fermentation Processing for Ingredient Stability
After fermentation reaches the endpoint, the batch is inactivated to stop further reactions that could change amino acid availability. Inactivation is followed by drying to a moisture level that prevents spoilage during storage. Drying is tuned to avoid scorching, because heat damage can reduce solubility even if crude protein stays high. Finally, the ingredient is sieved again so the feed mill receives a consistent particle distribution.
Quality Results and What They Mean
The plant compares the fermented ingredient to the baseline algae meal using four checks:
- Protein solubility proxy: fermented meal shows higher suspended protein after settling, indicating improved functional behavior for digestion.
- Amino acid retention: essential amino acids remain within acceptance ranges; the process avoids conditions that cause excessive breakdown.
- Microbial safety: microbial counts drop to acceptable levels after inactivation and drying.
- Color and odor screening: pellets made with the fermented ingredient show less intense tinting and fewer “green” notes during handling.
These results are not treated as trophies. They are used to set inclusion levels and pellet parameters.
Example: Inclusion and Pellet Water Stability Test
The feed formulation team replaces part of a conventional protein source with fermented algae ingredient at a 5% inclusion level in a grow-out pellet. They run a water stability test by soaking pellets for a fixed time and measuring mass loss. If pellets lose too much mass, the team adjusts binders and conditioning temperature rather than blaming fermentation. This is a key integration practice: fermentation improves ingredient behavior, but pellet durability depends on the whole manufacturing chain.
Batch Release Criteria and Documentation
A batch is released only if it meets predefined thresholds for moisture, safety tests, solubility proxy, and amino acid retention. The plant records starter lot, fermentation temperature profile, pH endpoint, inactivation method, drying parameters, and sieve settings. That documentation turns “it worked last time” into “it will work again,” which is the whole point of a case study.
Mind Map: Quality Checks and Release Logic
Integration Outcome
The fermented algae ingredient becomes a consistent protein-functional component rather than a variable raw material. In the grow-out diet, fish accept the feed without unusual refusal, and pellet integrity improves when binder and conditioning settings are aligned with the fermented ingredient’s water behavior. The case demonstrates that fermentation success is measured by how the ingredient performs inside the feed system, not just by what happens in a beaker.
11.2 Case Study of Crop Protein Blends with Fermented Algae Protein
This case study shows how a feed mill blends a crop protein ingredient with fermented algae protein to hit amino acid targets while keeping water stability and safety consistent. The starting point is a practical problem: crop proteins often bring good bulk protein but uneven functional behavior, while fermented algae protein can improve digestibility and reduce certain undesirable compounds. The goal is not to “replace everything,” but to engineer a blend that performs like a single ingredient system.
Starting Assumptions and Ingredient Roles
The crop protein in this case is a defatted plant meal (high protein, moderate fiber, variable solubility). The fermented algae protein is produced from algae meal using a controlled fermentation step, then dried and milled to a consistent particle size.
In the blend, each ingredient has a job:
- Crop protein supplies most of the protein mass and a predictable amino acid baseline.
- Fermented algae protein contributes improved protein quality and better functional behavior in the pellet.
- Minerals and binders are adjusted to compensate for differences in ash, water absorption, and leaching.
A simple way to prevent confusion is to set targets before mixing: crude protein range, essential amino acid balance, maximum inclusion limits for any ingredient with known anti-nutritional factors, and pellet water stability.
Formulation Logic Using Constraints
The mill uses a constraint-based approach rather than “best guess.” First, they set minimum essential amino acids based on species and life stage. Next, they cap ingredients that can raise off-odors or reduce palatability. Then they check functional proxies: solubility, water absorption, and expected pellet durability.
Example blend logic for a juvenile fish diet:
- Crop protein inclusion: 25–35% depending on amino acid balance.
- Fermented algae protein inclusion: 5–15% to improve digestibility without overwhelming pellet structure.
- Lipid source and energy: adjusted so the blend does not become protein-heavy relative to energy.
- Binder: selected based on water stability tests, not just pellet hardness.
The key detail is that fermented algae protein can change how the pellet holds together. If the binder is chosen for a crop-protein-only recipe, the new blend may leach more or soften faster.
Processing Compatibility Checks
Before finalizing the recipe, the mill checks three compatibility points.
-
Particle size alignment
If fermented algae protein is much finer than the crop meal, it can increase surface area and water uptake, which may reduce pellet durability. The fix is simple: mill both ingredients to a comparable range or adjust conditioning time. -
Moisture and handling
Fermented ingredients can be more hygroscopic. The mill stores both proteins in sealed containers and uses quick sampling to avoid moisture drift that would alter conditioning. -
Heat sensitivity
Some functional improvements from fermentation can be reduced by excessive conditioning. The mill keeps conditioning within a tested window and verifies water stability after extrusion.
Batch Trial and Measurement Plan
A systematic trial avoids “one-off” conclusions.
- Treatments: crop protein only, crop plus low fermented algae inclusion, crop plus medium inclusion.
- Replication: enough tanks or cages to separate real performance from random variation.
- Duration: long enough to see growth and feed conversion differences, not just early appetite.
Measurements include:
- Growth and feed conversion ratio.
- Fecal indicators or digestibility proxies.
- Pellet water stability: measure mass loss after a standardized soak.
- Sensory checks: odor and feed acceptance during feeding.
Example outcome interpretation:
- If growth improves but water stability worsens, the formulation may be digestible but structurally weak.
- If water stability improves but growth does not, the amino acid balance may be off even if crude protein looks correct.
Mind Map of the Integrated Workflow
Mind Map: Crop Protein Blends with Fermented Algae Protein
Practical Example Blend and Adjustment Rules
Example starting point for a blend concept (percent of total diet):
- Crop protein meal: 30%
- Fermented algae protein: 10%
- Other protein sources: 0–10% depending on species needs
- Lipid and energy sources: adjusted to maintain target energy
- Binder: selected to match expected water uptake
Adjustment rules that keep the process grounded:
- If pellet leaching increases, reduce fermented algae inclusion slightly or increase binder proportion, then re-test water stability.
- If feed conversion worsens while leaching is acceptable, re-check amino acid balance and digestibility proxies rather than assuming “more protein fixes it.”
- If odor becomes noticeable, verify fermentation batch quality and check storage moisture; do not compensate by simply raising inclusion.
What Makes This Case Study “Integrated”
The blend succeeds because formulation, processing, and testing are treated as one system. Crop protein provides mass and baseline nutrition, fermented algae protein improves functional and digestive behavior, and the mill tunes conditioning and binders to match the new physical properties. The result is a recipe that can be repeated with controlled inputs, not a lucky combination that only works once.
11.3 Case Study of Circular Infrastructure for Ingredient Flow and Waste Reuse
A mid-sized aquafeed plant wanted to cut two recurring problems: inconsistent ingredient quality and “where does this go?” waste streams from algae and crop processing. The solution was not a single machine. It was a circular infrastructure plan that treated ingredient flow, water use, and solids handling as one system.
Starting with System Boundaries and Flow Maps
The team defined boundaries around three loops: (1) ingredient loop, (2) process water loop, and (3) solids loop. They then drew a simple flow map on paper before touching equipment. The key decision was to separate “clean” and “dirty” handling zones. Clean zones received approved ingredients only; dirty zones processed incoming wet materials and returned solids for reprocessing.
Example: Fermentation slurry was kept out of the pellet mill area. Instead, it moved through a dedicated dewatering and drying line that fed into storage bins labeled by batch and moisture class.
Designing Ingredient Flow for Traceability and Stability
Circular reuse fails when batches mix without control. The plant implemented batch-linked containers and a single direction of movement: receipt → pre-processing → intermediate storage → feed manufacturing → finished feed storage. Reuse streams were treated as ingredients, not “leftovers,” and therefore required the same labeling and sampling plan.
They also standardized intermediate storage targets. For instance, fermented protein concentrate was held at a moisture range that prevented clumping and reduced microbial growth risk.
Example: If a batch exceeded the moisture threshold, it was routed to re-drying rather than blended “to meet spec.” That one rule reduced variability in pellet water stability.
Reusing Water Without Mixing Quality Signals
Process water can be reused, but it carries dissolved nutrients, fine solids, and sometimes off-odors. The plant used a two-tier water strategy: reuse within the same process family and controlled dilution only where formulation allowed.
They installed settling and filtration steps before returning water to upstream operations. The most important practice was to measure turbidity and conductivity at the point of return, not only at the outlet.
Example: Water from algae harvesting was clarified and reused for algae slurry preparation. Water from pellet cooling was not returned to fermentation; it was used for cleaning and then sent to solids recovery.
Solids Recovery That Actually Becomes Feed Input
Solids streams were the biggest opportunity and the biggest trap. The plant categorized solids by composition and risk: (A) protein-rich fines, (B) fiber-rich crop residues, and (C) mixed fines from cleaning. Each category had a defined path.
- Protein-rich fines went to drying and then to formulation as a controlled ingredient.
- Fiber-rich residues were milled and used as a digestibility-managed fraction.
- Mixed fines were only reused after a defined cleaning and reprocessing step.
Example: Cleaning dust from milling was collected with sealed extraction, then processed through a re-milling and sieving step before any blending.
Mind Map of Circular Infrastructure Decisions
Mind Map: Circular Infrastructure for Ingredient Flow and Waste Reuse
Operational Workflow with Concrete Routing
The plant used a routing matrix that operators could follow without guessing. Each stream had a destination, a sampling step, and an approval gate.
Example workflow:
- Fermentation slurry is dewatered.
- Dewatered solids are dried to the target moisture class.
- The dried intermediate is sampled for protein content and microbial safety.
- Approved intermediate is transferred to a labeled bin for formulation.
- Any batch failing moisture targets is re-routed to re-drying.
For water, the workflow was similar but simpler: clarify → measure → return to the approved process loop only if thresholds were met.
Quality Management That Keeps Reuse from Becoming Risk
Circular infrastructure needs quality gates that match the risk of the stream. The plant used three acceptance layers: ingredient spec checks for reuse inputs, process checks for water return, and contamination checks for solids from cleaning.
Example: Protein-rich fines were tested for protein and safety. Mixed cleaning fines were tested more strictly because they had higher variability in composition.
What Changed in Practice
After implementing the infrastructure, the plant saw fewer formulation surprises because reuse streams were standardized and controlled. The biggest behavioral shift was treating every reuse stream as a real ingredient with a defined path, rather than an afterthought.
Example: Operators stopped asking “Can we blend this?” and started asking “Which routing category does this stream belong to, and does it pass the gate?” That question structure reduced errors and made deviations easier to trace.
11.4 Case Study of Pellet Manufacturing Adjustments for Improved Water Stability
A feed pellet that holds together in the first minutes after sinking can reduce nutrient loss, improve intake consistency, and lower the amount of fine particles that fuel unwanted microbial growth. This case study follows one practical improvement cycle: starting from a baseline pellet that disintegrates too quickly, then adjusting formulation and manufacturing parameters in a controlled sequence.
Baseline Problem and What It Means
The facility produced 3 mm pellets for a mixed-species grow-out tank. Observations during routine checks showed rapid surface softening, visible cracks after conditioning, and a cloudy plume within 10–15 minutes of immersion. The team confirmed the issue with a simple water stability test: pellets were submerged in tank water at operating temperature, then visually scored at 5, 10, and 20 minutes while collecting suspended fines on a mesh screen.
The key point: poor water stability is rarely one single failure. It usually comes from binder behavior, pellet internal structure, moisture management, and how the pellet is dried.
Mind Map: Water Stability Levers
Step 1: Identify the Dominant Failure Mode
The team ran three quick checks on the baseline pellets.
- Binder sensitivity: pellets were soaked, then gently pressed between fingers. If they turned into a soft paste quickly, the binder likely lacked water resistance.
- Surface vs core failure: if the surface softened first but the core stayed intact, the drying and cooling profile was suspect.
- Fines generation during handling: if pellets shed many fines before immersion, the pellet internal structure was weak, often linked to particle size and insufficient binding during extrusion.
In this case, pellets shed fines during handling and also softened quickly in water, pointing to both binder performance and internal structure.
Step 2: Adjust Binder Strategy Without Overcorrecting
The facility used a standard binder blend. They changed it in a controlled way: keeping total binder inclusion constant while shifting the ratio toward a more water-stable component. The practical reason is simple: some binders form a strong matrix during drying, while others rely on starch gelatinization that can be reversed by rehydration.
Example adjustment:
- Binder blend A to blend B at the same total inclusion rate.
- No other ingredient changes in the first trial.
They then repeated the immersion test and measured fines mass on the mesh screen. The goal was not “maximum hardness,” but reduced fines release at 10 minutes.
Step 3: Tune Conditioning for Better Matrix Formation
Next, they adjusted conditioning temperature and time. Higher conditioning can improve starch gelatinization and binder activation, but too much heat can weaken proteins or drive excessive moisture into the pellet core.
Example adjustment:
- Increase conditioning temperature slightly while reducing conditioning time to keep total energy input similar.
- Keep screw speed constant to isolate the conditioning effect.
After this change, pellets showed fewer surface cracks and held shape longer, indicating improved matrix formation.
Step 4: Fix Particle Size Distribution for Packing Density
Even with good binders, pellets can fail if the mix contains too many coarse particles or too many fines. Coarse particles create weak points; excess fines reduce effective binding by occupying binder space.
Example adjustment:
- Sieve the ground meal to narrow the coarse fraction.
- Reduce the proportion of very fine particles by adjusting mill settings and recirculation.
The team confirmed improvement by comparing pellet breakage during handling and by observing fewer “dusty” pellets at the start of the immersion test.
Step 5: Drying and Cooling Profile to Prevent Surface Rehydration
Finally, they adjusted drying and cooling. If pellets cool too slowly or are exposed to humid air, the surface can rehydrate and soften, which looks like “binder failure” even when the binder is fine.
Example adjustment:
- Use a staged drying profile: moderate heat early, then a lower heat finish.
- Improve airflow during cooling and reduce time pellets spend warm in humid conditions.
Acceptance Criteria and Batch Release
They set a simple, measurable standard: at 10 minutes immersion, pellets must show minimal surface sloughing and fines collected on the mesh must be below the facility’s historical threshold for the baseline batch.
Example acceptance rule:
- Pass if the 10-minute fines mass is reduced by a defined percentage and pellets remain intact enough for normal feeding.
What Changed in the End
The final pellet batch showed slower softening, fewer cracks after conditioning, and a clear reduction in suspended fines during the first 10 minutes. Importantly, the improvements came from a sequence of isolated adjustments, so the team could attribute results to specific levers rather than guessing. The process also produced a repeatable workflow: test, adjust one variable class, verify with immersion scoring and fines mass, then move to the next lever.
11.5 Case Study of Quality Management Systems for Traceability and Safety
A mid-sized aquafeed plant integrates three ingredient streams: algae meal, fermented algae protein, and crop-derived proteins. The challenge is not only producing consistent pellets, but proving—batch by batch—that every input stayed within safety and quality limits. The quality management system (QMS) below is built around traceability that can survive real-world messiness: split lots, rework, and occasional equipment downtime.
Quality Management System Scope and Roles
The QMS starts with a clear boundary: what counts as “finished feed” and what counts as “intermediate.” In this case, algae meal is an intermediate, fermented protein is an intermediate, and the final pellet is the finished feed. Roles are assigned so decisions are not made by whoever is closest to the lab.
- Production owns batch execution and holds the batch record.
- Quality Assurance approves release and manages nonconformances.
- Quality Control runs tests and maintains calibration.
- Maintenance documents downtime that could affect processing conditions.
A simple rule prevents confusion: if a step changes the ingredient’s risk profile (for example, fermentation, drying, or pellet conditioning), it must be recorded with time, operator, and key parameters.
Traceability Design from Receiving to Release
Traceability is easiest when it follows physical reality. Each incoming lot receives a unique identifier, and every transformation creates a new identifier linked to the previous one.
Example workflow
- Algae meal arrives as Lot A-1042.
- After drying and milling, it becomes Intermediate D-1042.
- Fermentation produces Fermented Batch F-1042-07.
- Formulation and pelleting produce Feed Batch P-1042-07.
If a test fails at the finished-feed stage, the plant can immediately identify which intermediate lots contributed. That avoids the “guess and hope” approach where entire weeks of production are quarantined.
Safety Controls That Match Risk
Safety controls are chosen based on the hazards most likely for each ingredient type.
- Incoming algae meal: focus on microbial load and contaminants.
- Fermented protein: focus on process lethality and post-process contamination.
- Crop proteins: focus on mycotoxins and chemical residues.
Each control has a measurable acceptance criterion. For fermentation, the criterion is not “it was fermented,” but that the batch met defined temperature and time targets and passed microbial checks after inactivation.
Nonconformance Handling Without Chaos
Nonconformance is any deviation that could affect safety or quality: a parameter out of range, a failed test, or a labeling mismatch. The system requires three decisions in order: quarantine, investigation, disposition.
Example: Pellet durability is low and water stability fails.
- Quarantine the batch.
- Check whether conditioning temperature and die settings match the batch record.
- If the issue is mechanical (for example, die wear), rework may be allowed only if the reworked batch passes the same water stability test.
- If the issue is formulation (for example, binder level), rework is permitted only with documented adjustments and verification testing.
This keeps “rework” from becoming a synonym for “we fixed it somehow.”
Mind Map: Traceability and Safety QMS
Integrated Batch Record and Evidence Package
A batch record is not a formality; it is the evidence package that connects actions to outcomes. For each batch, the record includes:
- Ingredient lot IDs and weights.
- Processing parameters for drying, milling, fermentation, inactivation, and pelleting.
- Sampling points and sample IDs.
- Test results with method identifiers.
- Release decision and sign-off.
Example evidence package
- Fermented Batch F-1042-07 includes fermentation temperature logs, pH readings, and post-inactivation microbial results.
- Feed Batch P-1042-07 includes pellet water stability results and contaminant screening results.
If an operator changes a setpoint during a shift, the record captures the reason and the approval. That single detail prevents disputes later.
Practical Release Procedure with Clear Gates
Release is a gate process, not a single test.
- Pre-release review: verify batch record completeness and calibration status.
- Safety gate: confirm microbial and contaminant criteria are met.
- Quality gate: confirm functional pellet metrics (for example, water stability and durability).
- Label and distribution check: confirm correct lot ID on packaging.
Example: If safety gate passes but water stability fails, the batch is not released. It may be held for rework only if the rework plan is approved and the reworked batch passes the same quality gate.
Closing the Loop with Internal Audits
Internal audits check whether the system works under normal conditions and under stress. The audit focuses on traceability accuracy (can you reconstruct the ingredient path?) and evidence completeness (can you prove the parameter history?). When audits find gaps, corrective actions are assigned with due dates and verification steps, so fixes are not just paperwork.
A well-run QMS makes the plant boring in the best way: every batch has a clear story, every safety decision has evidence, and containment is fast enough to matter.
12. Practical Implementation Guides for Facilities and Operators
12.1 Building Standard Operating Procedures for Fermentation and Handling
A Standard Operating Procedure (SOP) is a written “do this, then that” workflow that turns fermentation and handling into repeatable results. For algae meal fermentation protein and related ingredient streams, the SOP should cover three things end-to-end: what goes in, what happens during processing, and what comes out. If any step is skipped or improvised, the batch record becomes a detective story instead of a control tool.
Core SOP Structure That Works in Practice
Start with a one-page overview that states the purpose, scope, and responsible roles. Then include the detailed sections below in the same order every time.
- Inputs and acceptance
- List each incoming material with sampling method, acceptance limits, and storage conditions.
- Example: algae meal lot must meet moisture and microbial thresholds before fermentation; otherwise, the fermentation “starter” is fighting an unknown background.
- Pre-processing and setup
- Define particle size targets, mixing order, and equipment readiness checks.
- Example: if the meal is too coarse, the fermenting microbes get uneven access and you’ll see inconsistent protein enrichment across the tank.
- Fermentation run instructions
- Specify setpoints (temperature, pH, aeration or mixing regime), monitoring frequency, and what to do when readings drift.
- Example: if pH drops faster than expected, the SOP should state whether to adjust buffering, mixing intensity, or feed rate rather than “wait and see.”
- Inactivation and stabilization
- Define the exact endpoint criteria and the method to stop fermentation.
- Example: stopping by time alone can fail when starting biomass differs; endpoint criteria should include pH and microbial activity proxies.
- Post-processing handling
- Cover drying or dewatering targets, cooling steps, and packaging.
- Example: hot material in a sealed bag can trap moisture and encourage spoilage; the SOP should require cooling to a defined range before packaging.
- Quality checks and release
- List tests for safety and functionality, plus acceptance criteria.
- Example: fermented ingredient release should include microbial safety and basic composition checks, not just “it smells fine.”
- Batch records and deviations
- Provide a template for recording every measurement and action.
- Include a deviation workflow: identify, assess impact, document corrective action, and decide release or hold.
Mind Map: Fermentation and Handling SOP Flow
Example: A Simple Fermentation SOP Run Sheet
Use a batch record that mirrors the SOP steps. Each line should have a place to record the value and the operator’s initials.
- Before start: confirm equipment sanitation log is complete; verify tank temperature sensor calibration.
- Charge: record algae meal lot ID, mass, particle size check result, and water volume.
- Start fermentation: record initial pH and temperature; note mixing speed.
- During run: at each sampling time, record pH, temperature, and any visible settling or foaming.
- Control actions: if pH drift exceeds the allowed band, record the exact adjustment and the time it was applied.
- Endpoint: record the criteria met and the time fermentation was stopped.
- Inactivation: record method parameters and duration.
- Stabilization: record cooling time and final moisture target.
- Release: record QC results and final disposition (release or hold).
Example: Deviation Handling That Prevents “Silent Failures”
If a batch shows unexpected microbial growth early, the SOP should require immediate actions: stop further charging, isolate the batch, and document the last known good readings. Then the deviation section should specify whether to proceed with inactivation, whether to extend monitoring, and what additional tests are required before any release decision.
Practical Tips for Keeping SOPs Usable
- Write setpoints as numbers and drift limits as ranges, not instructions like “keep it stable.”
- Define sampling methods so two operators collect comparable samples.
- Keep the SOP language consistent with the batch record fields to avoid transcription errors.
- Ensure every “what to do if” scenario has a defined response path, even if the response is “hold and escalate.”
A good SOP doesn’t just describe fermentation; it describes how to stay in control when reality refuses to cooperate.
12.2 Training Checklists for Operators Including Sampling and Cleaning
Operators are the bridge between a good formulation and a consistent feed. This checklist trains them to collect representative samples, prevent cross-contamination, and clean equipment in a way that matches the ingredient’s risk profile. The goal is simple: when you test a batch, the sample and the equipment state must reflect reality.
Training Outcomes and Roles
Start with outcomes, not tasks. By the end of training, each operator can:
- Identify sampling points that represent the whole batch.
- Use correct tools and labeling so results can be traced to a specific run.
- Clean and verify cleanliness using a repeatable sequence.
- Record deviations immediately, not after the shift ends.
Assign roles during training runs: one person samples, one person verifies labels and times, and one person logs cleaning completion. This reduces the “everyone did a little” problem.
Sampling Checklist for Incoming and In-Process Materials
Before sampling, confirm the batch identity: ingredient name, supplier lot, delivery date, and intended use. Then follow a consistent sampling pattern.
Sampling steps
- Prepare: wear gloves, set up clean containers, and pre-label with lot number, sampling point, and time.
- Mix before you sample: for powders and meals, gently mix the container or use a thief sampler that reaches multiple depths.
- Collect multiple increments: take increments from different locations to form a composite sample.
- Avoid contact: keep tools from touching the outside of containers; wipe or replace gloves if they contact non-sampling surfaces.
- Seal and store: close containers tightly, store per the ingredient’s testing needs, and keep a chain-of-custody log.
Easy example
If you sample algae meal from a tote, don’t scoop only from the top. Take increments from top, middle, and bottom, then combine into one composite. This prevents “top-dry” material from biasing protein and moisture readings.
Cleaning Checklist for Contact Surfaces
Cleaning is not just “wash and hope.” Train operators to clean by surface type and residue risk.
Cleaning sequence
- Stop and isolate: lock out the line if needed, tag equipment, and confirm the next batch is not already queued.
- Dry clean first: remove bulk residue with a scraper or vacuum before water is introduced.
- Wash: use the approved detergent and water temperature for the residue type.
- Rinse: rinse until runoff is clear and no detergent smell remains.
- Sanitize if required: apply the approved sanitizer only when the process plan calls for it.
- Dry: air-dry or use clean forced air so moisture doesn’t support microbial growth.
- Verify: perform a visual check and, when required, a swab or conductivity check.
- Release: record completion time, chemicals used, and verification results.
Easy example
For fermented protein ingredients, residue can be sticky and odor-active. Dry clean first, then wash thoroughly, then rinse longer than you think you need. If you skip the dry step, you turn residue into a paste that spreads across the next batch.
Mind Map: Operator Training Flow
Common Mistakes and How Training Prevents Them
- Wrong label, right sample: operators learn to label before sampling and to verify lot numbers twice.
- Single-point sampling: training uses a “top-only” demonstration to show how composites change results.
- Cleaning without verification: operators practice a checklist-based signoff so release never happens on memory.
- Skipping dry clean: trainees run a short exercise comparing residue spread with and without dry removal.
Practical Training Schedule and Checkpoints
Use short, repeatable sessions rather than one long lecture.
- Session 1: sampling tool handling, labeling, and composite formation.
- Session 2: cleaning sequence on a mock line section with visible residue.
- Session 3: verification practice using visual criteria and one objective method when available.
- Session 4: full run simulation with documentation and deviation handling.
Checkpoint example
During the simulation, introduce a “label mismatch” scenario. The correct response is to stop sampling, correct labeling, and document the deviation immediately. This trains calm, fast correction instead of end-of-shift cleanup.
Operator Sign-Off Criteria
Operators sign off only when they can demonstrate:
- Correct sampling coverage and composite creation.
- Proper sealing, storage, and chain-of-custody logging.
- A complete cleaning sequence with verification and release records.
- Immediate deviation reporting with clear, factual notes.
12.3 Equipment Selection and Maintenance for Milling Fermentation and Pelletizing
Good equipment choices start with a simple question: what failure mode can you tolerate least. For milling, it’s inconsistent particle size and heat damage. For fermentation, it’s contamination and pH drift. For pelletizing, it’s poor durability and excessive water leaching. The trick is to match equipment capability to the ingredient’s behavior, then maintain it so the capability stays real.
Equipment Selection for Milling
Start with particle size goals and heat sensitivity. Fermented algae proteins and many crop proteins can lose functional performance if overheated. Choose a mill type based on the target distribution, not just the average particle size.
- Hammer mill: fast throughput; good for coarse-to-medium reduction. Use when you need consistent bulk flow and can manage screen selection.
- Pin mill or jet mill: tighter control for functional ingredients. Use when solubility and dispersibility depend on finer fractions.
- Cryogenic or chilled milling: consider when proteins are heat sensitive and you must prevent smear and denaturation.
Select screens and wear parts as a system. A screen that’s worn or misaligned effectively changes your recipe. Plan for spare screens, consistent mounting, and a routine for checking wear.
Add dust control and metering. Milling creates fine dust that affects both worker safety and ingredient dosing accuracy. Use sealed transfer points, dust extraction, and loss-in-weight or gravimetric feeding so the formulation doesn’t “quietly” shift.
Equipment Selection for Fermentation
Choose bioreactors by control needs, not by size alone. Fermentation equipment must hold temperature, pH, and aeration steady enough to keep protein enrichment predictable.
- Stirred-tank bioreactors: best when you need uniform mixing and controlled aeration.
- Air-lift or packed systems: useful when mixing is challenging, but they require careful monitoring of oxygen transfer.
- Single-use or cleanable vessels: select based on your cleaning validation capacity and batch frequency.
Instrumentation matters more than you think. Reliable pH probes, temperature sensors, and dissolved oxygen measurement reduce batch-to-batch variability. Calibrate on a defined schedule and keep spare sensors ready.
Plan for sterilization and clean-in-place. If you can’t reliably sanitize the vessel and lines, you’ll spend more time troubleshooting than producing. Design the process so cleaning steps are repeatable and measurable.
Equipment Selection for Pelletizing
Match pelletizing method to binder and water stability needs. Extrusion and pelletizing equipment should produce the right density and surface structure for your feed type.
- Conditioning and extrusion: good for controlling starch gelatinization and improving pellet integrity.
- Pellet mills with die selection: choose die diameter and thickness based on target pellet size and durability.
Conditioning is where many failures begin. Steam conditioning time and temperature affect protein denaturation, starch behavior, and binder activation. Use a conditioner with measurable steam control and uniform residence time.
Drying must be gentle and consistent. Overdrying can reduce surface quality and increase dust. Under-drying can raise microbial risk and shorten shelf life. Select dryers with controllable airflow and temperature profiles.
Maintenance Strategy That Prevents Drift
Maintenance should be scheduled around the process, not around vibes.
- Daily: check lubrication points, inspect seals, verify pH and temperature readings, and confirm dryer airflow and temperature stability.
- Weekly: clean milling screens and hoppers, inspect augers and bearings, and verify calibration status for key sensors.
- Batch-based: after each fermentation run, verify cleaning effectiveness using defined acceptance checks, then document results.
- Seasonal or run-hour: replace worn liners, screens, and cutting surfaces before they change your particle distribution.
Use a “measurement-first” approach. If you can’t measure the output, maintenance becomes guesswork. Track particle size distribution, pellet durability, and leaching rate as your equipment health indicators.
Mind Map: Milling Fermentation and Pelletizing Equipment
Example: Milling Setup That Stays Consistent
A plant targets a medium particle fraction for fermented algae protein to improve dispersibility. They choose a hammer mill with a defined screen size, then add a routine: after every 2,000 kg processed, they inspect screen wear and verify particle size distribution with a sieve set. When the distribution shifts, they replace screens before pelletizing starts showing higher dust and lower durability.
Example: Fermentation Control That Reduces Variability
A batch shows protein enrichment differences even when recipes match. The troubleshooting path is equipment-focused: pH probe calibration is checked, temperature sensor drift is verified, and aeration flow is measured at the sparger. After correcting probe calibration and confirming airflow, the next three batches show consistent pH trajectories and stable final ingredient performance.
Example: Pelletizing Adjustments Based on Equipment Health
Pellets begin to leach more during water exposure. Instead of changing the formulation first, the team checks conditioner steam control, then confirms die wear and drying airflow stability. Once steam temperature uniformity and die condition return to baseline, leaching drops without altering nutrient targets.
12.4 Batch Documentation Templates for Traceability and Compliance
Batch documentation is the quiet backbone of low-impact aquafeed production. It connects what you received, what you processed, what you tested, and what you shipped—so the next person can answer “what happened?” without guessing. The templates below are designed to work together: each form captures a specific decision point, and each decision point feeds the next.
Foundational Principles for Traceability
Start with four rules that keep records consistent across ingredients, fermentation, and pellet manufacturing.
- One batch, one identity. Assign a unique batch ID at the moment the first ingredient is released for processing. Use it on every form, sample label, and pallet tag.
- Record at the time of action. If you write later, you will forget the small deviations that matter (extra water added, longer conditioning, different sieve size).
- Link inputs to outputs. Every batch output should list which incoming lots were used and in what proportions.
- Separate “done” from “approved.” Production can complete a step, but release happens only after defined checks.
Mind Map: Batch Documentation Flow
Template Set Overview
Use five templates in sequence. They can be paper, spreadsheet, or a simple form system, but the fields should match.
Template 1: Batch Setup and Ingredient Lot Linkage
Purpose: Create the batch identity and lock the ingredient lot list before processing.
Fields to include:
- Batch ID, product code, target species and life stage
- Planned batch size and expected inclusion ranges
- Ingredient lot numbers and supplier IDs
- Ingredient release status (approved, quarantined, pending)
- Storage locations for each ingredient
- Weighing plan (who weighs, who verifies)
Example: Batch ID “AF-2403-017” lists algae meal lot “AL-22-104” and fermented protein base “FP-22-009.” The template records that both lots are “approved” and stored in “S2-Rack3-Bay1.”
Template 2: Processing Log for Fermentation and Manufacturing
Purpose: Capture the “how” so you can explain variability.
Fields to include:
- Start and end times for each stage
- Fermentation vessel ID and working volume
- Temperature, pH, aeration rate, and mixing schedule
- Any pre-treatments (particle size, moisture adjustment)
- Conditioning parameters for extrusion (time, temperature, screw speed if used)
- Drying and cooling targets
Example: If pH drifted by 0.2 units during fermentation, record the corrective action and the time it was applied. That single line can prevent a later dispute about whether the ingredient was “the same.”
Template 3: Sampling Plan and Sample Chain of Custody
Purpose: Ensure samples represent the batch and stay traceable.
Fields to include:
- Sampling points (in-process and finished)
- Sample IDs tied to batch ID
- Sampling method and equipment used
- Who collected, who sealed, and storage conditions
- Transfer times between production and lab
Example: A finished feed sample labeled “AF-2403-017-FIN-01” is sealed immediately after cooling and stored at 2–8°C until analysis. The chain-of-custody section records the handoff from production to lab.
Template 4: Test Results Summary and Acceptance Criteria
Purpose: Convert lab results into a clear pass/fail decision.
Fields to include:
- Test list with method references internal to your system
- Results, units, and detection limits
- Acceptance criteria thresholds
- QA decision: release, hold, or reject
- Notes for out-of-spec results and required actions
Example: Water stability fails the target durability threshold. The template records whether the batch is reconditioned, blended with retained compliant material, or rejected—only one path should be chosen.
Template 5: Deviation Log and Corrective Action Closure
Purpose: Track deviations from the moment they are noticed through closure.
Fields to include:
- Deviation ID and batch ID
- Description of what went wrong
- Immediate containment action
- Root cause category (process, equipment, operator, supplier)
- Corrective action and verification method
- Closure date and QA sign-off
Example: A deviation occurs when a fermentation vessel temperature sensor is found out of calibration. The log records containment (hold affected batch), recalibration, verification test, and the final QA closure.
Integrated Compliance Checklist
Use this checklist to confirm the templates are complete before release.
| Checkpoint | What Must Be Present | Common Miss |
|---|---|---|
| Batch identity | Batch ID on every form and sample | Sample labels without batch ID |
| Ingredient linkage | Lot numbers and release status | Storage location omitted |
| Processing record | Stage times and key parameters | Missing corrective actions |
| Sampling custody | Sample IDs and transfer times | Unsealed sample jars |
| Test decision | Results plus acceptance outcome | Results recorded but no QA decision |
| Deviation closure | Containment and verification | Corrective action not verified |
Mind Map: Who Signs What

Practical Example Batch Packet
A complete batch packet for “AF-2403-017” includes: Template 1 with ingredient lot linkage, Template 2 with fermentation and pellet parameters, Template 3 with sample IDs and custody, Template 4 with test outcomes and release decision, and Template 5 if any deviations occurred. If no deviations occurred, the deviation log still records “none” with QA sign-off so the absence of issues is explicit, not implied.
Date Field Standard
When a date is required, record it in a consistent format such as 2026-03-15 and include the role of the date (setup date, sampling date, test date, or release date). This prevents confusion when multiple steps occur on the same day.
12.5 Step-by-Step Workflows for Ingredient Receipt to Feed Release
A reliable workflow turns “we received a bag” into “we can safely feed fish” without relying on memory or guesswork. The steps below assume you are handling multiple ingredient types, including algae meal, fermented protein ingredients, and crop-derived proteins, and that you want consistent quality across batches.
Step 1: Prepare for Receipt and Define Batch Identity
Start by assigning a unique batch ID before the truck arrives. Record supplier, ingredient name, grade, intended use, and target inclusion range. Set up sampling materials and labels so the sample you take is traceable to the exact batch ID.
Example: If you receive fermented algae protein, label three containers as “Batch 0147-A, sample A,” “sample B,” and “retention.” Sample A goes to rapid tests, sample B to deeper checks, and retention stays sealed for investigations.
Step 2: Receive, Inspect, and Verify Documentation
Check packaging integrity, lot numbers, and storage conditions during unloading. Verify documents against the batch ID: delivery note, certificate of analysis, and any fermentation or processing records for fermented inputs.
Practical check: If a shipment arrives with damaged sacks or signs of moisture, treat it as a separate risk stream. You can still test it, but you should not mix it into a “good” lot.
Step 3: Sample Using a Repeatable Plan
Use a defined sampling plan based on container count and ingredient type. For powders, mix the bulk gently before sampling to reduce stratification. Take enough material for all required tests plus retention.
Example: For algae meal, take incremental samples from multiple sack positions, then combine into a composite sample. For fermented ingredients, sample from sealed units if possible to avoid oxygen exposure.
Step 4: Perform Rapid Triage Tests Before Storage
Run quick checks that catch obvious problems early. Typical triage includes moisture, appearance, odor, particle size (for powders), and basic protein confirmation where feasible.
Decision rule: If moisture exceeds your internal threshold or odor suggests spoilage, quarantine the batch and expand testing. This prevents you from “discovering” issues after the ingredient has already been milled and blended.
Step 5: Conduct Full Acceptance Testing
Complete the required lab tests for each ingredient category. For protein ingredients, focus on protein level, amino acid profile proxies where available, and digestibility-related indicators. For fermented inputs, include microbial safety checks and any relevant fermentation quality markers.
For crop proteins, also check for anti-nutritional factors and contaminants appropriate to your supply chain. Record results in a batch-specific acceptance sheet.
Step 6: Quarantine, Release, or Reject with Clear Criteria
Do not rely on “looks fine” decisions. Use predefined acceptance criteria tied to your formulation needs and safety requirements.
Example: If fermented algae protein passes microbial safety but fails a functional threshold like water binding, you may still release it for specific feed types where that functionality is less critical. If it fails safety, it stays quarantined or is rejected.
Step 7: Store Correctly to Protect Quality
Store released ingredients under conditions that match their risk profile. Control humidity, temperature, and pest access. Use FIFO (first in, first out) and keep storage locations mapped to batch IDs.
Practical detail: Keep fermented ingredients separate from unfermented powders to avoid cross-contamination and to simplify cleaning verification.
Step 8: Pre-Processing and Milling Controls
Before formulation, verify that pre-processing equipment is clean and calibrated. For milling, confirm target particle size and document settings. If you adjust milling for one ingredient, record the change so you can reproduce it later.
Example: If algae meal is too coarse, it can cause uneven mixing and pellet leaching. Instead of increasing inclusion blindly, correct particle size and re-run mixing validation.
Step 9: Formulation, Weighing, and Mixing Verification
Use formulation sheets that include nutrient targets and maximum/minimum inclusion limits. Weigh ingredients using calibrated scales, then verify totals before mixing.
Mixing verification: Perform a mixing uniformity check at defined intervals. For powders, confirm that the blend is homogeneous enough to prevent “hot spots” of protein or fermentation byproducts.
Step 10: In-Process Checks During Pellet Manufacturing
During conditioning, extrusion, and drying, record key parameters and monitor feed stability indicators. If you use binders, confirm water stability with a simple leaching test appropriate to your feed type.
Example: If pellets soften too quickly in water, adjust conditioning moisture or binder level, then document the change and retest stability.
Step 11: Finished Feed Testing and Batch Record Completion
Before release, test finished feed for safety and quality indicators relevant to your process. Ensure the batch record is complete: ingredient IDs, test results, processing parameters, and any deviations with their disposition.
Deviation handling: If a parameter drifted, document what you did to correct it and whether the batch still meets acceptance criteria.
Step 12: Release, Label, and Retain Samples
Release only when all acceptance steps are satisfied. Label finished feed with batch ID, ingredient traceability, and storage guidance. Retain samples from finished feed for the defined retention period so you can investigate complaints without guessing.
Example: Retain a sealed sample of the final pellet and a sample of the blend before pelleting. If a customer reports poor performance, you can trace whether the issue started at mixing or during pellet formation.
Mind Map: Ingredient Receipt to Feed Release Workflow
Example: End-to-End Batch Walkthrough
On 2026-03-20, you receive 10 sacks of algae meal and 2 sealed units of fermented algae protein under batch IDs 0147 and 0148. You sample each batch using the composite plan, run moisture and odor triage the same day, and quarantine both until full acceptance testing completes. After release, you store them in separate locations, mill to the target particle size, and formulate using the approved inclusion limits. During pelleting, you run a leaching test on the first production hour and again after any parameter adjustment. When finished feed tests pass and the batch record is complete, you label the finished pellets with both ingredient batch IDs and retain sealed samples for investigation.