Advanced Commodity Trading Risk Management and Derivatives Hedging Strategies
1. Introduction to Commodity Trading and Risk Management
1.1 Overview of Commodity Markets and Trading Dynamics
Commodity markets form the backbone of the global economy, facilitating the exchange of raw materials that fuel industries and consumer demand. Understanding their structure and trading dynamics is essential for commodity traders and risk managers aiming to navigate these markets effectively.
What Are Commodity Markets?
Commodity markets are platforms where raw or primary products are exchanged. These products fall into two broad categories:
- Hard Commodities: Natural resources that are mined or extracted, such as crude oil, natural gas, metals (gold, copper, aluminum).
- Soft Commodities: Agricultural products or livestock, such as wheat, coffee, sugar, cattle.
These markets can be physical (spot markets) or derivative-based (futures, options, swaps).
Key Participants in Commodity Markets
- Producers: Entities that extract or grow commodities (e.g., oil companies, farmers).
- Consumers: Industries or companies that use commodities as inputs (e.g., airlines, food manufacturers).
- Speculators: Traders seeking profit from price movements.
- Hedgers: Participants aiming to reduce price risk exposure.
Trading Venues
- Exchanges: Centralized platforms like CME Group, ICE, LME where standardized contracts trade.
- Over-the-Counter (OTC): Customized bilateral contracts negotiated directly between parties.
Trading Dynamics Mind Map
Price Drivers and Market Influences
Commodity prices are influenced by a complex interplay of factors:
- Supply and Demand: Crop yields, mining output, consumption trends.
- Geopolitical Events: Conflicts, trade policies, sanctions.
- Weather Conditions: Droughts, floods affecting agricultural commodities.
- Economic Indicators: Inflation rates, currency fluctuations, interest rates.
Example: Crude Oil Market Dynamics
Consider crude oil, one of the most actively traded commodities:
- Supply Factors: OPEC production quotas, US shale output.
- Demand Factors: Global economic growth, transportation fuel consumption.
- Geopolitical Risks: Middle East tensions, sanctions on oil-producing countries.
- Market Impact: Sudden supply disruptions can cause sharp price spikes.
Best Practice: Mapping Market Dynamics for Risk Identification
A practical approach to managing risk is to create a dynamic mind map of the commodity market you trade. For example, a trader in agricultural commodities might map:
This visual tool helps identify potential risk triggers and informs hedging strategies.
Summary
Understanding commodity markets and their trading dynamics requires grasping the types of commodities, key participants, trading venues, and the multifaceted factors driving prices. Mind maps serve as an effective method to visualize these complex relationships and support risk management decisions.
Additional Example: Coffee Market
- Supply: Sensitive to weather in Brazil and Vietnam.
- Demand: Influenced by global consumption trends.
- Risks: Crop diseases, currency fluctuations.
Mapping these factors helps traders anticipate price movements and design appropriate hedges.
By mastering the overview of commodity markets and trading dynamics, commodity traders and risk managers lay a strong foundation for advanced risk management and derivatives hedging strategies.
1.2 Key Risks in Commodity Trading: Market, Credit, Operational, and Liquidity Risks
Commodity trading is inherently exposed to a variety of risks that can impact profitability and operational stability. Understanding these risks in detail is essential for effective risk management. Below, we explore the four primary categories of risks in commodity trading: Market Risk, Credit Risk, Operational Risk, and Liquidity Risk. Each section includes mind maps to visualize the risk components and practical examples to illustrate their real-world implications.
Market Risk
Market risk refers to the potential losses arising from adverse movements in commodity prices, interest rates, foreign exchange rates, and volatility. This is the most visible and actively managed risk in commodity trading.
Mind Map: Market Risk Components
Example:
A crude oil trader holds a large position expecting prices to rise. However, geopolitical developments cause oil prices to drop sharply. Without hedging, the trader faces significant losses. By using futures contracts to lock in prices, the trader can mitigate this price risk.
Credit Risk
Credit risk arises from the possibility that counterparties will fail to fulfill their contractual obligations, leading to financial losses.
Mind Map: Credit Risk Components
Example:
A metals trading firm enters into an OTC swap with a counterparty to hedge price exposure. If the counterparty defaults during a period when the swap is in-the-money for the firm, the firm incurs losses. To mitigate this, the firm requires collateral and sets credit limits.
Operational Risk
Operational risk involves losses resulting from inadequate or failed internal processes, people, systems, or external events.
Mind Map: Operational Risk Components
Example:
An agricultural commodity desk experiences a trade booking error where a large position is mistakenly recorded twice. This leads to an unintended oversized exposure. The error is caught during reconciliation, but it highlights the need for robust operational controls.
Liquidity Risk
Liquidity risk is the risk that a trader cannot buy or sell positions quickly enough without significantly impacting the market price or incurring losses.
Mind Map: Liquidity Risk Components
Example:
A trader holds a large position in a niche metal with low daily trading volume. When attempting to unwind the position, the trader faces wide bid-ask spreads and limited counterparties, resulting in a significant market impact and losses.
Summary Table of Key Risks with Examples
| Risk Type | Description | Example Scenario | Mitigation Practice |
|---|---|---|---|
| Market Risk | Losses from price, interest rate, FX, volatility changes | Crude oil price drop impacting unhedged positions | Use of futures/options to hedge price exposure |
| Credit Risk | Counterparty failure to meet obligations | OTC swap counterparty default | Collateral agreements, credit limits |
| Operational Risk | Failures in processes, people, systems, external events | Trade booking error leading to oversized exposure | Strong reconciliation and control processes |
| Liquidity Risk | Difficulty in executing trades without loss | Large position in illiquid metal causing market impact | Position limits, use of algorithmic trading |
By systematically identifying and understanding these key risks, commodity traders and risk managers can design comprehensive strategies to monitor, mitigate, and manage exposures effectively.
1.3 Importance of Risk Management in Commodity Trading
Commodity trading is inherently exposed to a wide array of risks due to the volatile nature of commodity prices, geopolitical factors, supply-demand imbalances, and operational complexities. Effective risk management is not just a regulatory or procedural requirement but a strategic imperative that safeguards profitability, ensures business continuity, and enhances competitive advantage.
Why Risk Management is Crucial in Commodity Trading
- Price Volatility: Commodity prices can fluctuate dramatically due to weather events, geopolitical tensions, or macroeconomic shifts.
- Market Uncertainty: Sudden changes in market sentiment or unexpected news can impact supply chains and pricing.
- Credit Risk: Exposure to counterparties who may default on contracts.
- Operational Risk: Errors in trade execution, settlement failures, or system breakdowns.
- Liquidity Risk: Difficulty in entering or exiting positions without significant price impact.
Mind Map: Core Reasons for Risk Management in Commodity Trading
Best Practice: Embedding Risk Management into Trading Strategy
Integrate risk management at every stage of the trading lifecycle—from trade idea generation, execution, to post-trade monitoring. This includes:
- Setting clear risk limits aligned with organizational risk appetite.
- Using real-time risk analytics to monitor exposures.
- Conducting regular scenario and stress testing.
- Establishing escalation protocols for breaches.
Practical Example: Managing Price Risk in Crude Oil Trading
A crude oil trading desk faces daily price swings driven by geopolitical events and supply disruptions. Without risk management, a sudden price drop could wipe out profits or cause losses.
Approach:
- The desk sets a maximum daily loss limit of $500,000.
- Uses futures contracts to hedge 60% of their open physical positions.
- Implements daily Value at Risk (VaR) reporting to track exposure.
- Conducts weekly stress tests simulating a 10% price drop.
Outcome:
- The hedging program reduces the impact of adverse price moves.
- Early detection of risk limit breaches allows timely trade adjustments.
- The firm avoids unexpected losses and maintains stable cash flows.
Mind Map: Risk Management Benefits Illustrated by the Example
Summary
Risk management in commodity trading acts as a shield against the inherent uncertainties of the markets. It enables traders and risk managers to anticipate, measure, and mitigate risks proactively rather than reactively. By embedding robust risk management practices, firms not only protect their financial health but also position themselves to capitalize on market opportunities with confidence and resilience.
1.4 Best Practices in Setting Up a Risk Management Framework
Setting up a robust risk management framework is essential for commodity traders and risk managers to effectively identify, assess, monitor, and mitigate risks inherent in commodity trading. This section outlines best practices, supported by clear examples and mind maps to help visualize the process.
Key Components of a Risk Management Framework
A comprehensive risk management framework typically includes the following components:
- Risk Identification
- Risk Assessment and Measurement
- Risk Mitigation and Controls
- Risk Monitoring and Reporting
- Governance and Compliance
Below is a mind map illustrating these components:
Risk Management Framework Mind Map
Best Practice 1: Establish Clear Risk Appetite and Limits
Description: Define the organization’s risk appetite clearly to guide decision-making. Set quantitative limits for different risk types (e.g., maximum Value at Risk (VaR), credit exposure limits).
Example: A commodity trading firm sets a daily VaR limit of $1 million for its crude oil portfolio. If the VaR breaches this limit, trading activities are paused until risk mitigation actions are taken.
Best Practice 2: Implement Robust Risk Identification Processes
Description: Use a combination of quantitative tools and expert judgment to identify risks. Regularly update risk registers.
Example: A natural gas trading desk holds weekly risk review meetings where traders and risk managers discuss new market developments, potential operational risks, and counterparty credit exposures.
Best Practice 3: Use Quantitative and Qualitative Risk Assessment Methods
Description: Combine statistical models (VaR, stress tests) with qualitative assessments (expert opinions, scenario analysis) for a holistic view.
Example: The firm runs Monte Carlo simulations to estimate potential losses under normal market conditions and supplements this with scenario analysis for geopolitical events affecting oil supply.
Best Practice 4: Develop and Enforce Risk Mitigation Controls
Description: Deploy hedging strategies, set credit limits, and establish operational controls to reduce risk.
Example: To mitigate price risk, a metals trader uses futures contracts to hedge exposure. Credit limits are set per counterparty, and collateral agreements are enforced.
Best Practice 5: Continuous Risk Monitoring and Transparent Reporting
Description: Implement real-time risk monitoring systems and produce clear, actionable reports for stakeholders.
Example: A dashboard provides intraday updates on portfolio risk metrics, and daily reports highlight limit breaches and exceptions for senior management review.
Best Practice 6: Strong Governance and Compliance Framework
Description: Establish risk committees, define roles and responsibilities, and ensure compliance with regulations.
Example: A risk committee meets monthly to review risk exposures, approve limits, and oversee adherence to regulatory requirements such as EMIR or Dodd-Frank.
Integrated Mind Map: End-to-End Risk Management Framework with Examples
Summary
Setting up a risk management framework requires a structured approach combining clear policies, quantitative and qualitative tools, and strong governance. By following these best practices and continuously refining the framework with real-world examples, commodity traders and risk managers can effectively safeguard their portfolios against diverse risks.
1.5 Practical Example: Identifying and Categorizing Risks in a Crude Oil Trading Desk
In this section, we will explore how a crude oil trading desk identifies and categorizes the various risks it faces. Understanding these risks is fundamental to building an effective risk management framework.
Step 1: Overview of the Crude Oil Trading Desk
A crude oil trading desk typically engages in buying and selling physical crude oil and related derivatives such as futures, options, and swaps. The desk is exposed to multiple risk types that can impact profitability and operational stability.
Step 2: Identifying Key Risk Categories
The primary risk categories for a crude oil trading desk include:
- Market Risk: Price fluctuations in crude oil and related products.
- Credit Risk: Counterparty default risk.
- Operational Risk: Failures in processes, systems, or human errors.
- Liquidity Risk: Inability to enter or exit positions without significant cost.
- Legal and Regulatory Risk: Compliance with laws and regulations.
Step 3: Mind Map of Risk Categories
Step 4: Detailed Examples of Each Risk with Categorization
Market Risk
- Price Risk: The price of Brent crude oil drops unexpectedly due to geopolitical tensions easing.
- Example: The desk holds a long position in Brent futures; a price drop leads to mark-to-market losses.
- Basis Risk: The price difference between WTI and Brent crude widens unexpectedly.
- Example: The desk hedges WTI exposure using Brent futures, but the spread widens, causing imperfect hedge results.
Credit Risk
- Counterparty Default: A counterparty fails to deliver crude oil after the contract settlement date.
- Example: A physical supplier defaults, forcing the desk to buy oil at a higher spot price.
- Settlement Risk: Delay in payment or delivery from counterparties.
Operational Risk
- Trade Capture Errors: Incorrect data entry leads to wrong position reporting.
- Example: A trader enters a buy order for 10,000 barrels but mistakenly inputs 100,000 barrels.
- System Failures: Trading platform outage during volatile market conditions.
Liquidity Risk
- Market Liquidity: Difficulty in selling large crude oil futures positions without impacting price.
- Funding Liquidity: Insufficient cash or credit lines to meet margin calls.
Legal & Regulatory Risk
- Contractual Disputes: Ambiguities in delivery terms leading to disputes.
- Regulatory Compliance: Failure to comply with position limits or reporting requirements.
Step 5: Mind Map of Market Risk Subcategories with Examples
Step 6: Integrating Risk Identification into Daily Workflow
- Pre-Trade Analysis: Assess market conditions and counterparty creditworthiness.
- Real-Time Monitoring: Use risk dashboards to track exposures and P&L.
- Post-Trade Review: Confirm trade capture accuracy and compliance.
Step 7: Summary Table of Risks and Mitigation Approaches
| Risk Category | Description | Example Scenario | Mitigation Practice |
|---|---|---|---|
| Market Risk | Price and volatility fluctuations | Brent price drop impacting long futures | Use stop-loss orders, diversify hedges |
| Credit Risk | Counterparty default or settlement delays | Supplier fails to deliver crude oil | Perform credit checks, collateral agreements |
| Operational Risk | Errors in trade capture, system outages | Incorrect trade quantity entered | Implement trade validation, system backups |
| Liquidity Risk | Difficulty in executing large trades | Unable to exit large futures position quickly | Use limit orders, maintain cash reserves |
| Legal & Regulatory | Contract disputes and compliance failures | Breach of position limits | Regular legal reviews, compliance training |
This practical example illustrates how a crude oil trading desk systematically identifies and categorizes risks, supported by clear examples and mind maps to enhance understanding. This foundation enables the desk to apply targeted risk management strategies effectively.
2. Fundamentals of Derivatives in Commodity Markets
2.1 Types of Commodity Derivatives: Futures, Options, Swaps, and Forwards
Commodity derivatives are financial instruments whose value is derived from the price of an underlying commodity. They are essential tools for managing price risk in commodity trading. This section explores the four primary types of commodity derivatives — Futures, Options, Swaps, and Forwards — with clear explanations, mind maps, and practical examples.
Futures Contracts
Definition: A futures contract is a standardized agreement traded on an exchange to buy or sell a specific quantity of a commodity at a predetermined price on a specified future date.
Key Characteristics:
- Standardized terms (quantity, quality, delivery date)
- Traded on regulated exchanges (e.g., CME, ICE)
- Marked-to-market daily
- Requires margin deposits
Mind Map:
Example: A wheat farmer expects to harvest 10,000 bushels in 3 months. To lock in the selling price and protect against price drops, the farmer sells wheat futures contracts today at $6.00 per bushel. If the market price falls to $5.50 at harvest, the farmer still sells at $6.00 via the futures contract, effectively hedging the price risk.
Options Contracts
Definition: An option gives the buyer the right, but not the obligation, to buy (call option) or sell (put option) a commodity at a specified strike price before or on a certain expiration date.
Key Characteristics:
- Right without obligation
- Premium paid upfront
- Can be American (exercise anytime before expiry) or European (exercise only at expiry)
Mind Map:
Example: An oil refiner worried about rising crude oil prices buys call options with a strike price of $70/barrel, paying a premium of $2/barrel. If prices rise to $80, the refiner can exercise the option to buy at $70, saving $8/barrel (minus premium). If prices stay below $70, the refiner lets the option expire, losing only the premium.
Swaps
Definition: A commodity swap is a private agreement between two parties to exchange cash flows based on the price of a commodity over a specified period.
Key Characteristics:
- Over-the-counter (OTC) contract
- Customized terms
- Typically involves exchanging fixed price payments for floating price payments
Mind Map:
Example: A power company wants to stabilize fuel costs. It enters a swap agreement to pay a fixed price of $50 per MMBtu of natural gas while receiving payments based on the floating market price. If market prices rise above $50, the company benefits by paying only the fixed price, effectively hedging against price spikes.
Forwards
Definition: A forward contract is a customized agreement between two parties to buy or sell a commodity at a specified price on a future date. Unlike futures, forwards are OTC contracts and are not standardized or exchange-traded.
Key Characteristics:
- Customized terms (quantity, quality, delivery date)
- OTC trading
- Settlement at contract maturity
- Higher counterparty risk
Mind Map:
Example: A coffee importer agrees with a grower to buy 100,000 lbs of coffee beans in 6 months at $1.20 per lb. This forward contract locks in the price, protecting the importer from price increases and the grower from price decreases.
Summary Mind Map: Commodity Derivatives Overview
Best Practice: Choosing the Right Derivative
- Understand the specific risk exposure (price volatility, timing, quantity)
- Consider liquidity and market availability
- Evaluate counterparty risk (exchange-traded vs OTC)
- Match derivative terms closely with underlying exposure to minimize basis risk
By mastering these four types of commodity derivatives and their applications, traders and risk managers can effectively design hedging strategies tailored to their unique risk profiles.
2.2 Pricing Basics and Market Conventions
Understanding pricing basics and market conventions is fundamental for effective commodity trading and risk management. This section breaks down key concepts, pricing mechanisms, and standard market practices with clear examples and mind maps to facilitate comprehension.
Pricing Basics in Commodity Markets
Commodity prices are influenced by supply and demand dynamics, geopolitical factors, weather conditions, and market sentiment. Pricing in commodity derivatives markets typically revolves around the spot price, futures price, and the concept of cost of carry.
Key Pricing Terms:
- Spot Price: The current market price for immediate delivery of the commodity.
- Futures Price: The agreed price today for delivery of the commodity at a future date.
- Cost of Carry: The cost associated with holding the physical commodity until the futures contract delivery date, including storage, insurance, and financing costs.
- Contango: A market condition where futures prices are higher than the spot price.
- Backwardation: A market condition where futures prices are lower than the spot price.
Mind Map: Pricing Basics
Market Conventions in Commodity Pricing
Market conventions standardize how prices and contracts are quoted, traded, and settled. These conventions vary by commodity and exchange but generally cover contract size, tick size, delivery terms, and trading hours.
Common Market Conventions:
- Contract Size: Standardized quantity of the commodity per contract (e.g., 1,000 barrels for crude oil futures).
- Tick Size: Minimum price fluctuation allowed (e.g., $0.01 per barrel).
- Delivery Terms: Specifications on quality, location, and timing for physical delivery.
- Trading Hours: Defined periods when contracts can be traded.
Mind Map: Market Conventions
Pricing Formula: Futures Price and Cost of Carry Model
The futures price can be derived from the spot price using the cost of carry model:
\[ F = S \times e^{(r + c - y) \times T} \]
Where:
- \(F\) = Futures price
- \(S\) = Spot price
- \(r\) = Risk-free interest rate
- \(c\) = Storage cost rate
- \(y\) = Convenience yield (benefit of holding the physical commodity)
- \(T\) = Time to maturity (in years)
Example:
Suppose the spot price of gold is $1,800 per ounce, the risk-free rate is 2% annually, storage costs are 0.5% annually, convenience yield is 0.3%, and the futures contract expires in 6 months (0.5 years).
Calculate the futures price:
\[ F = 1800 \times e^{(0.02 + 0.005 - 0.003) \times 0.5} = 1800 \times e^{0.011} \approx 1800 \times 1.0111 = 1819.98 \]
So, the futures price is approximately $1,820 per ounce.
Example: Pricing a Crude Oil Futures Contract
- Spot price of crude oil: $70 per barrel
- Risk-free rate: 3% per annum
- Storage cost: 1% per annum
- Convenience yield: 0.5% per annum
- Time to maturity: 3 months (0.25 years)
Calculate the futures price:
\[ F = 70 \times e^{(0.03 + 0.01 - 0.005) \times 0.25} = 70 \times e^{0.00875} \approx 70 \times 1.00879 = 70.62 \]
The futures price is approximately $70.62 per barrel.
Practical Considerations
- Impact of Convenience Yield: Commodities with high convenience yields (e.g., agricultural products during harvest) often exhibit backwardation.
- Seasonality: Many commodities have seasonal price patterns affecting futures pricing.
- Exchange-Specific Conventions: Always verify contract specifications on the exchange website (e.g., CME, ICE).
Summary Mind Map: Pricing and Market Conventions Overview
By mastering these pricing basics and market conventions, commodity traders and risk managers can better interpret market signals, price derivatives accurately, and design effective hedging strategies.
2.3 Role of Derivatives in Risk Mitigation
Derivatives are financial instruments whose value is derived from an underlying asset, such as commodities, currencies, or interest rates. In commodity trading, derivatives play a crucial role in managing and mitigating various types of risks, primarily price volatility risk. By using derivatives, traders and risk managers can hedge exposures, lock in prices, and stabilize cash flows, thereby reducing uncertainty and potential losses.
Mind Map: Role of Derivatives in Risk Mitigation
Key Functions of Derivatives in Risk Mitigation
-
Price Risk Management
- Commodity prices are highly volatile due to supply-demand imbalances, geopolitical events, weather conditions, and other factors.
- Derivatives allow traders to lock in prices or set price floors/ceilings to protect against unfavorable price movements.
-
Hedging Strategies
- Derivatives enable the creation of hedging positions that offset the risk of the underlying commodity exposure.
- Examples include perfect hedges (using the exact underlying asset), cross hedges (using a related asset), and dynamic hedges (adjusting hedge ratios over time).
-
Risk Transfer
- Derivatives facilitate transferring risk from one party to another willing to bear it, often for a premium (e.g., option premiums).
-
Liquidity Management
- Futures and options markets provide liquidity, allowing traders to enter and exit positions efficiently without impacting the physical market.
-
Speculation vs Hedging
- While derivatives can be used for speculation, their primary risk management role is to hedge exposures and stabilize financial outcomes.
Practical Examples
Example 1: Hedging with Futures Contracts
A crude oil refiner expects to purchase 100,000 barrels of crude oil in three months. Concerned about rising prices, the refiner sells crude oil futures contracts today to lock in the current price.
- If prices rise, losses on the physical purchase are offset by gains on the futures contracts.
- If prices fall, the refiner pays more on the futures contracts but benefits from lower physical prices.
This hedge reduces price uncertainty and stabilizes budgeting.
Example 2: Using Options for Price Protection
A wheat farmer wants to protect against a price drop but also wants to benefit if prices rise.
- The farmer buys put options on wheat futures, which give the right to sell at a strike price.
- If prices fall below the strike, the farmer exercises the option, limiting downside.
- If prices rise, the farmer lets the option expire and sells at the higher market price.
This strategy provides asymmetric protection.
Example 3: Cross-Hedging with Related Commodities
A trader holds exposure to a rare metal with no active futures market but a correlated base metal futures market exists.
- The trader uses futures on the base metal to hedge price risk, accepting some basis risk.
This approach mitigates risk when direct hedging instruments are unavailable.
Mind Map: Example of Hedging with Futures
Summary
Derivatives are indispensable tools in commodity trading risk management. They provide mechanisms to mitigate price volatility, transfer risk, and enhance liquidity. By carefully selecting and applying derivatives, traders and risk managers can protect their portfolios, optimize cash flows, and improve financial stability in uncertain markets.
2.4 Best Practice: Selecting the Appropriate Derivative Instrument for Specific Commodity Risks
Selecting the right derivative instrument is crucial for effectively managing commodity risks. Each derivative type—futures, options, swaps, and forwards—has unique characteristics that make it suitable for different risk profiles and trading objectives. This section provides a structured approach to choosing the appropriate derivative instrument, supported by mind maps and practical examples.
Understanding Commodity Risks and Derivative Instruments
Before selecting a derivative, it is essential to understand the nature of the commodity risk you face:
- Price Risk: Exposure to adverse price movements.
- Basis Risk: Risk arising from imperfect correlation between the hedged item and the derivative.
- Volatility Risk: Risk related to fluctuations in price volatility.
- Liquidity Risk: Risk of not being able to enter or exit positions easily.
Each derivative instrument offers different ways to mitigate these risks.
Mind Map: Derivative Instrument Selection Based on Risk Type
Mind Map: Decision Flow for Selecting Derivative Instruments
Practical Examples
Example 1: Hedging Wheat Price Exposure with Futures
A grain trader expects to sell 10,000 bushels of wheat in three months. The trader is exposed to price risk and wants a straightforward hedge.
- Instrument Chosen: Wheat futures contract on the Chicago Board of Trade (CBOT).
- Reason: Futures are standardized, highly liquid, and allow locking in a price.
- Outcome: The trader sells futures contracts equivalent to 10,000 bushels, offsetting price risk.
Example 2: Protecting Against Oil Price Spike Using Options
An airline company wants to protect against rising jet fuel prices but still benefit if prices fall.
- Instrument Chosen: Call options on crude oil futures.
- Reason: Options provide the right to buy at a strike price, limiting upside cost while retaining downside benefit.
- Outcome: The airline pays a premium for call options, capping fuel costs without losing potential savings.
Example 3: Managing Long-Term Natural Gas Price Exposure with Swaps
A utility company has a 2-year natural gas supply contract with variable pricing.
- Instrument Chosen: Natural gas price swap.
- Reason: Swaps allow fixing the price over the contract period, providing cash flow certainty.
- Outcome: The utility pays a fixed price and receives floating market prices, stabilizing costs.
Example 4: Custom Forward Contract for Specialty Metal Delivery
A manufacturer requires a specific grade of rare metal delivered in six months.
- Instrument Chosen: Forward contract negotiated OTC.
- Reason: Futures markets do not exist for this metal; forwards allow customization of quantity, quality, and delivery.
- Outcome: The manufacturer locks in price and delivery terms, mitigating price and supply risks.
Summary Best Practices
- Match instrument to risk profile: Use futures for standardized, short-term price risk; options for asymmetric risk management; swaps and forwards for long-term or customized needs.
- Consider liquidity: Prefer exchange-traded instruments for liquidity; use OTC instruments when customization is essential.
- Evaluate cost vs protection: Options require premium payments but offer flexibility; futures and swaps have no upfront premium but may require margin.
- Monitor basis risk: When cross-hedging or using non-standard instruments, assess basis risk carefully.
By systematically analyzing the commodity risk and understanding the characteristics of each derivative instrument, traders and risk managers can select the most effective hedging tool to protect their portfolios.
2.5 Practical Example: Using Futures Contracts to Hedge Wheat Price Exposure
Introduction
Hedging wheat price exposure using futures contracts is a fundamental strategy employed by commodity traders and risk managers to mitigate the risk of adverse price movements. This example will walk through the process of setting up a hedge, calculating hedge ratios, and monitoring the position over time.
Step 1: Understanding the Exposure
A wheat farmer expects to harvest 10,000 bushels of wheat in 3 months. The current spot price is $6.00 per bushel, but the farmer fears that prices might decline by the time of harvest, which would reduce revenue.
Objective: Lock in a selling price today to protect against price drops.
Step 2: Selecting the Hedging Instrument
The farmer decides to use Chicago Board of Trade (CBOT) wheat futures contracts, each representing 5,000 bushels.
- Number of contracts needed = Exposure (bushels) / Contract size
- = 10,000 / 5,000 = 2 contracts
Step 3: Executing the Hedge
The farmer takes a short position in 2 wheat futures contracts at the current futures price of $6.05 per bushel (slightly above spot due to carry costs).
Mind Map: Hedging Wheat Price Exposure with Futures
Step 4: Price Movement and Hedge Outcome
Assume that at harvest, the spot price has dropped to $5.50 per bushel.
-
Without Hedge:
- Revenue = 10,000 bushels * $5.50 = $55,000
-
With Hedge:
- Loss on spot sale = (6.00 - 5.50) * 10,000 = $5,000 loss
- Gain on futures = (6.05 - 5.50) * 10,000 = $5,500 gain
- Net revenue = $60,500 (approximate, ignoring transaction costs)
The futures position offsets the loss in the physical market, effectively locking in a price close to $6.00 per bushel.
Step 5: Hedge Ratio and Basis Risk
In real scenarios, the hedge ratio may not be exactly 1 due to:
- Differences in contract size vs exposure
- Basis risk (difference between spot and futures prices at settlement)
Mind Map: Factors Affecting Hedge Effectiveness
Step 6: Adjusting the Hedge
If the farmer’s expected quantity changes or the harvest date shifts, the hedge position should be adjusted accordingly.
Example: If the farmer expects only 8,000 bushels, the hedge would be:
- 8,000 / 5,000 = 1.6 contracts
- Since partial contracts aren’t possible, the farmer may hedge 1 or 2 contracts and accept some residual risk.
Step 7: Monitoring and Closing the Hedge
As the harvest approaches, the farmer monitors the basis and futures prices.
-
At harvest, the farmer delivers the wheat and closes the futures position by buying back the contracts.
-
The combined cash flows from the physical sale and futures position realize the locked-in price.
Summary Mind Map: Futures Hedging Process
Additional Example: Hedging a Wheat Buyer
A food processing company expects to purchase 15,000 bushels of wheat in 4 months and fears price increases.
-
The company takes a long position in 3 CBOT wheat futures contracts (15,000 / 5,000).
-
If prices rise, gains on futures offset higher spot prices.
-
If prices fall, losses on futures are offset by cheaper physical purchases.
This demonstrates how futures contracts can hedge both short and long commodity exposures.
Conclusion
Using futures contracts to hedge wheat price exposure is a practical and effective risk management strategy. By understanding contract specifications, calculating appropriate hedge ratios, and monitoring basis risk, traders and risk managers can protect against unfavorable price movements while maintaining flexibility.
References
- CME Group CBOT Wheat Futures Specifications
- Hull, J. C. (2018). Options, Futures, and Other Derivatives.
- Commodity Markets Council: Hedging Best Practices
3. Advanced Hedging Strategies Using Commodity Derivatives
3.1 Static vs Dynamic Hedging: Concepts and Applications
Introduction
In commodity trading, hedging is a fundamental risk management technique used to protect against adverse price movements. Two primary hedging approaches are static hedging and dynamic hedging. Understanding their concepts, applications, and differences is crucial for traders and risk managers aiming to optimize risk mitigation strategies.
What is Static Hedging?
Static hedging involves establishing a hedge position that remains unchanged or fixed over the hedge horizon. Once the hedge is placed, it is not actively adjusted in response to market movements.
-
Key Characteristics:
- One-time hedge setup
- Minimal ongoing management
- Simplicity and lower transaction costs
-
When to Use:
- When the underlying exposure is stable
- When transaction costs are high
- When the hedge instrument closely matches the exposure
Example of Static Hedging:
A wheat farmer expects to sell 10,000 bushels in 6 months. To protect against price drops, the farmer sells wheat futures contracts now and holds them until delivery. No adjustments are made regardless of price fluctuations.
What is Dynamic Hedging?
Dynamic hedging involves continuously adjusting the hedge position in response to changes in market conditions, underlying exposure, or risk parameters.
-
Key Characteristics:
- Frequent rebalancing of hedge positions
- More complex and resource-intensive
- Better risk alignment in volatile markets
-
When to Use:
- When exposure or market conditions are volatile
- When the hedge instrument is imperfect or the underlying exposure changes
- When managing options or nonlinear risks
Example of Dynamic Hedging:
An energy trader holds options on crude oil. Since option delta changes with price and time, the trader continuously buys or sells futures contracts to maintain a delta-neutral position, adjusting the hedge as market prices move.
Mind Map: Static vs Dynamic Hedging Overview
Mind Map: Applications and Considerations
Practical Example: Comparing Static and Dynamic Hedging for Natural Gas Exposure
Scenario: A utility company expects to consume 1 million MMBtu of natural gas over the next 3 months. The company wants to hedge price risk.
-
Static Hedge Approach:
- The company sells futures contracts covering 1 million MMBtu at current prices.
- The hedge remains unchanged regardless of consumption variations or price movements.
- Pros: Simple, low cost.
- Cons: If consumption changes or prices move significantly, the hedge may become ineffective.
-
Dynamic Hedge Approach:
- The company adjusts futures positions weekly based on updated consumption forecasts and market prices.
- If consumption is lower than expected, futures are bought back; if higher, more futures are sold.
- Pros: More precise risk management.
- Cons: Increased transaction costs and operational complexity.
Best Practices for Choosing Between Static and Dynamic Hedging
- Assess the volatility and predictability of the underlying exposure.
- Evaluate transaction costs and operational capabilities.
- Consider the complexity of the derivative instruments involved.
- Use static hedging for straightforward, stable exposures.
- Employ dynamic hedging for options or when exposures are uncertain or highly volatile.
Summary
| Aspect | Static Hedging | Dynamic Hedging |
|---|---|---|
| Hedge Adjustment | None after initial setup | Continuous or periodic adjustments |
| Complexity | Low | High |
| Transaction Costs | Lower | Higher |
| Suitability | Stable, predictable exposures | Volatile, nonlinear exposures |
| Risk Mitigation | Basic, may leave residual risk | More precise, reduces residual risk |
Understanding these approaches and their appropriate applications enables commodity traders and risk managers to tailor hedging strategies that best fit their risk profiles and market conditions.
3.2 Cross-Hedging Techniques for Non-Standard Commodities
Cross-hedging is a powerful risk management technique used when direct hedging instruments for a specific commodity are unavailable, illiquid, or too costly. It involves using derivatives of a related but different commodity to hedge price risk. This technique is especially relevant for non-standard commodities—those that may not have active futures markets or standardized contracts.
What is Cross-Hedging?
Cross-hedging is the practice of hedging a commodity exposure by taking a position in a different but correlated commodity’s derivative. The goal is to reduce price risk by leveraging the price relationship between the two commodities.
Key Points:
- Used when direct hedging instruments are unavailable or inefficient.
- Relies on correlation between the commodity to be hedged and the hedging instrument.
- Basis risk (the risk that the hedge does not perfectly offset the exposure) is a critical consideration.
Mind Map: Cross-Hedging Overview
Selecting a Proxy Commodity for Cross-Hedging
The effectiveness of cross-hedging depends largely on the selection of an appropriate proxy commodity. This involves:
- Correlation Analysis: Statistical measurement of price movements between the target commodity and potential proxies.
- Fundamental Linkages: Supply chain relationships, substitution effects, or shared demand drivers.
- Liquidity and Market Depth: The proxy should have a liquid derivatives market.
Mind Map: Proxy Commodity Selection
Practical Example 1: Cross-Hedging Rare Earth Metals with More Liquid Base Metals
Scenario: A trader holds exposure to a rare earth metal (e.g., Neodymium) which lacks a liquid futures market.
Approach: Use futures contracts on a more liquid base metal like Copper or Aluminum as a proxy hedge.
Steps:
- Analyze historical price correlation between Neodymium and Copper.
- Determine hedge ratio based on volatility and correlation.
- Enter a short futures position in Copper to offset price risk in Neodymium holdings.
- Monitor basis risk and adjust hedge dynamically.
Example Calculation:
- Neodymium price volatility: 30%
- Copper price volatility: 20%
- Correlation coefficient: 0.75
Hedge ratio = (Volatility of Neodymium / Volatility of Copper) * Correlation = (0.30 / 0.20) * 0.75 = 1.125
This means for every 1 unit exposure in Neodymium, the trader takes a 1.125 unit position in Copper futures.
Practical Example 2: Cross-Hedging Specialty Agricultural Products Using Corn or Soybean Futures
Scenario: A risk manager for a company trading specialty grains like millet or sorghum needs to hedge price risk but finds no direct futures contracts.
Approach: Use corn or soybean futures as proxies due to similar growing conditions and overlapping demand.
Steps:
- Conduct correlation and regression analysis between millet/sorghum prices and corn/soybean prices.
- Calculate optimal hedge ratio.
- Implement hedge using futures or options on corn or soybeans.
- Continuously monitor and rebalance hedge positions.
Mind Map: Cross-Hedging Process
Managing Basis Risk in Cross-Hedging
Basis risk arises because the proxy commodity’s price movements do not perfectly offset the target commodity’s price changes. To manage basis risk:
- Regularly update correlation and hedge ratios to reflect current market conditions.
- Use dynamic hedging strategies that adjust positions as relationships evolve.
- Combine multiple proxies if appropriate to better capture price movements.
- Incorporate scenario and stress testing to understand potential hedge performance under different market conditions.
Best Practices for Cross-Hedging
- Perform thorough quantitative and qualitative analysis before selecting proxy instruments.
- Maintain ongoing monitoring of correlation and basis risk.
- Use a combination of derivatives (futures, options) to tailor risk profiles.
- Educate trading and risk teams on the nuances and limitations of cross-hedging.
- Document hedge rationale and assumptions clearly for audit and compliance.
Summary
Cross-hedging is an essential strategy for managing price risk in non-standard commodities where direct hedging instruments are unavailable. By carefully selecting proxy commodities based on correlation and fundamental linkages, calculating appropriate hedge ratios, and actively managing basis risk, commodity traders and risk managers can effectively reduce exposure and improve portfolio stability.
Additional Resources
- Hull, J. C. (2018). Options, Futures, and Other Derivatives. Pearson.
- Geman, H. (2005). Commodities and Commodity Derivatives: Modeling and Pricing for Agriculturals, Metals and Energy. Wiley.
- CME Group: Educational materials on commodity futures and options.
3.3 Basis Risk Management and Minimization Strategies
Introduction to Basis Risk
Basis risk arises when the price of a hedging instrument (usually a futures contract) does not move perfectly in line with the price of the underlying physical commodity or exposure being hedged. This imperfect correlation creates residual risk even after hedging, known as basis risk.
Why Basis Risk Matters:
- It can lead to unexpected gains or losses despite a hedge.
- It affects the effectiveness of hedging strategies.
- Managing basis risk is critical for accurate risk control and profit stability.
Mind Map: Understanding Basis Risk
Sources of Basis Risk
- Location Differences: Physical commodity prices vary by delivery location, while futures contracts are tied to specific delivery points.
- Quality Differences: The physical commodity may differ in grade or quality from the standardized futures contract.
- Timing Differences: Mismatches between the timing of the physical transaction and futures contract expiration.
- Contract Specifications: Variations in contract size, delivery terms, or settlement methods.
Measuring Basis Risk
- Historical Basis Analysis: Calculate the difference between spot price and futures price over time to understand typical basis behavior.
- Correlation Coefficient: Statistical measure of how closely the futures price moves with the spot price.
- Basis Volatility: Standard deviation of the basis over a given period.
Mind Map: Basis Risk Measurement Techniques
Strategies to Manage and Minimize Basis Risk
Selecting the Most Appropriate Futures Contract
- Choose contracts with delivery locations and specifications closely matching the physical exposure.
- Example: A natural gas trader in Henry Hub region should use Henry Hub futures rather than a distant hub.
Using Basis Contracts or Swaps
- Instruments designed to hedge basis risk specifically, such as basis swaps that exchange floating basis for fixed.
- Example: An electricity producer hedges the difference between local spot prices and regional futures using basis swaps.
Cross-Hedging
- When no exact futures contract exists, hedge with a related commodity or contract with high correlation.
- Example: Hedging jet fuel exposure with crude oil futures, while monitoring basis risk closely.
Timing Alignment
- Match the hedge duration and delivery timing as closely as possible to the physical exposure.
- Rolling futures positions carefully to avoid gaps.
Dynamic Hedge Adjustments
- Continuously monitor basis and adjust hedge ratios or instruments accordingly.
- Use statistical models or AI tools to predict basis changes.
Geographical Arbitrage and Logistics Optimization
- Manage physical logistics to reduce location basis risk.
- Example: Adjusting delivery points or storage to align better with futures contract locations.
Mind Map: Basis Risk Minimization Strategies
Practical Examples
Example 1: Basis Risk in Wheat Hedging
- A grain trader in Kansas hedges wheat exposure using Chicago Board of Trade (CBOT) wheat futures.
- Basis risk arises because local Kansas wheat prices can differ from CBOT prices due to transportation costs and local demand.
- The trader monitors historical basis and adjusts hedge ratios monthly.
- Uses local cash market data to estimate basis trends and employs a partial hedge to balance risk and cost.
Example 2: Managing Basis Risk in Crude Oil
- An oil refiner hedges using NYMEX WTI futures but sources crude from a different region (e.g., Brent crude).
- The basis between Brent and WTI fluctuates due to regional supply-demand differences.
- The refiner uses a cross-hedge with Brent futures and applies a basis swap to manage residual risk.
- Regularly reviews correlation and basis volatility to adjust hedge strategy.
Example 3: Timing Basis Risk in Natural Gas
- A utility company hedges winter natural gas demand with futures contracts expiring in December.
- Actual consumption peaks in January and February, creating timing basis risk.
- The company staggers futures contracts across multiple months and uses storage options to align physical and financial exposures.
Best Practices Summary
- Always analyze and understand the sources of basis risk before implementing a hedge.
- Use historical data and statistical tools to quantify basis risk.
- Select hedging instruments that closely align with physical exposure in location, quality, and timing.
- Employ specialized instruments like basis swaps when available.
- Continuously monitor and adjust hedges dynamically.
- Integrate physical logistics considerations into risk management.
By mastering basis risk management and minimization strategies, commodity traders and risk managers can significantly enhance hedge effectiveness, reduce unexpected losses, and improve overall portfolio stability.
3.4 Best Practice: Constructing a Dynamic Hedge for Volatile Natural Gas Prices
Managing price volatility in natural gas markets requires a flexible and adaptive hedging strategy. A dynamic hedge adjusts the hedge ratio and instruments over time in response to market conditions, reducing risk exposure while optimizing cost efficiency.
Understanding Dynamic Hedging
Dynamic hedging involves continuously monitoring the natural gas price movements and adjusting the hedge position accordingly. Unlike static hedging, which sets a fixed hedge ratio for a period, dynamic hedging responds to price volatility, seasonality, and market liquidity.
Key Components of a Dynamic Hedge for Natural Gas
- Hedge Ratio Adjustment: Modifying the percentage of exposure hedged based on risk tolerance and market signals.
- Instrument Selection: Using a mix of futures, options, and swaps to tailor risk coverage.
- Rebalancing Frequency: Determining how often to review and adjust hedge positions.
- Market Indicators: Incorporating volatility indices, weather forecasts, and inventory reports.
Mind Map: Dynamic Hedging Framework for Natural Gas
Step-by-Step Example: Constructing a Dynamic Hedge
Scenario: A natural gas trading desk has an exposure of 10,000 MMBtu per month for the next 6 months. The market is highly volatile due to unpredictable weather patterns.
-
Initial Hedge Setup:
- Hedge 70% of exposure using NYMEX natural gas futures for the next 3 months.
- Buy call options to protect against price spikes for the remaining 30%.
-
Monitoring Market Volatility:
- Use the CBOE Natural Gas Volatility Index (NGVIX) to track market turbulence.
- When NGVIX rises above a threshold (e.g., 40%), increase hedge ratio to 85% by purchasing additional futures.
-
Adjusting for Weather Forecasts:
- If a cold snap is forecasted, increase call option positions to benefit from potential price spikes.
- If mild weather is expected, reduce hedge ratio to 60% to avoid over-hedging.
-
Rebalancing Frequency:
- Review hedge positions weekly.
- Adjust futures and options holdings based on updated market data and exposure changes.
-
Risk and Cost Optimization:
- Monitor margin requirements and liquidity to avoid excessive costs.
- Use options to cap downside risk while allowing upside participation.
Mind Map: Example Dynamic Hedge Adjustment Cycle
Practical Tips for Effective Dynamic Hedging
- Use Real-Time Data Feeds: Ensure access to up-to-date price, volatility, and weather data.
- Set Clear Thresholds: Define triggers for hedge adjustments to avoid emotional decision-making.
- Leverage Technology: Utilize risk management software for scenario analysis and automated alerts.
- Maintain Flexibility: Be prepared to shift between instruments as market conditions evolve.
- Document Decisions: Keep detailed records of hedge adjustments and rationale for audit and learning.
Summary
Constructing a dynamic hedge for volatile natural gas prices involves a continuous process of monitoring, analysis, and adjustment. By combining futures and options, leveraging market indicators like volatility indices and weather forecasts, and maintaining disciplined rebalancing, traders can effectively manage price risk while optimizing hedging costs.
This approach not only reduces unexpected losses but also provides opportunities to capitalize on favorable market movements, making it a best practice for natural gas risk management.
3.5 Practical Example: Cross-Hedging Aluminum Exposure with Copper Futures
Cross-hedging is a risk management strategy used when a direct hedge instrument is unavailable or illiquid. In commodity trading, this often occurs when the commodity you want to hedge (the exposure) does not have a liquid futures market or the futures contracts are too expensive or impractical to use. Instead, you use a related commodity’s futures contract to hedge your position.
Scenario Overview
Suppose you are a commodity trader with a significant exposure to aluminum prices, but the aluminum futures market is either illiquid or unavailable for your desired contract size or delivery location. Copper futures, on the other hand, are highly liquid and actively traded on major exchanges such as the COMEX.
You decide to use copper futures to hedge your aluminum price risk, leveraging the historical price correlation between aluminum and copper.
Step 1: Understanding the Relationship Between Aluminum and Copper
- Both aluminum and copper are base metals used extensively in industrial applications.
- Their prices often move in tandem due to similar demand drivers (e.g., construction, manufacturing) and supply factors.
- However, the correlation is not perfect, so basis risk exists.
Mind Map: Relationship Between Aluminum and Copper Prices
Step 2: Calculating the Hedge Ratio
The hedge ratio determines how many copper futures contracts you need to hedge your aluminum exposure effectively.
Formula:
\[ \text{Hedge Ratio} = \rho \times \frac{\sigma_{Al}}{\sigma_{Cu}} \]
Where:
- \(\rho\) = correlation coefficient between aluminum and copper prices
- \(\sigma_{Al}\) = standard deviation (volatility) of aluminum prices
- \(\sigma_{Cu}\) = standard deviation (volatility) of copper prices
Example Calculation:
- Correlation (\(\rho\)) = 0.75
- Aluminum volatility (\(\sigma_{Al}\)) = 4.5% monthly
- Copper volatility (\(\sigma_{Cu}\)) = 6.0% monthly
\[ \text{Hedge Ratio} = 0.75 \times \frac{4.5}{6.0} = 0.75 \times 0.75 = 0.5625 \]
This means for every 1 unit of aluminum exposure, you hedge approximately 0.56 units of copper futures.
Step 3: Determining the Number of Futures Contracts
Assume:
- Aluminum exposure: 100 metric tons
- Aluminum price: $2,000 per metric ton
- Copper futures contract size: 25 metric tons
- Copper futures price: $9,000 per metric ton
Calculate the dollar exposure:
- Aluminum exposure value = 100 tons * $2,000 = $200,000
Calculate the equivalent copper exposure using hedge ratio:
- Equivalent copper exposure = $200,000 * 0.5625 = $112,500
Calculate number of copper futures contracts:
-
One copper futures contract value = 25 tons * $9,000 = $225,000
-
Number of contracts = $112,500 / $225,000 = 0.5 contracts
Since you cannot trade half a contract, you round to the nearest whole number, usually rounding up to 1 contract for better risk coverage.
Step 4: Executing the Hedge
- Sell 1 copper futures contract to hedge the aluminum exposure.
- Monitor the hedge effectiveness regularly, adjusting the hedge ratio and number of contracts as market conditions and correlations change.
Step 5: Monitoring and Managing Basis Risk
Because aluminum and copper prices do not move perfectly together, there is residual risk (basis risk) after hedging.
Mind Map: Managing Basis Risk in Cross-Hedging
Summary Table
| Step | Action | Example Values |
|---|---|---|
| 1. Analyze correlation | Correlation between aluminum and copper | 0.75 |
| 2. Calculate hedge ratio | \(0.75 \times (4.5\% / 6.0\%) = 0.5625\) | 0.5625 |
| 3. Determine contracts | Aluminum exposure = $200,000 | Copper futures contract = $225,000 |
| Equivalent copper exposure = $112,500 | Number of contracts = 0.5 → 1 | |
| 4. Execute hedge | Sell 1 copper futures contract | Ongoing monitoring |
| 5. Manage basis risk | Regular updates and risk controls | Use regression and scenario tests |
Key Takeaways
- Cross-hedging allows risk mitigation when direct futures are unavailable or illiquid.
- Calculating an accurate hedge ratio based on correlation and volatility is critical.
- Basis risk is inherent and must be actively managed.
- Regular monitoring and adjustment ensure hedge effectiveness.
This practical example demonstrates how commodity traders and risk managers can apply cross-hedging with copper futures to manage aluminum price risk effectively, balancing liquidity and risk control.
4. Quantitative Risk Measurement and Analytics
4.1 Value at Risk (VaR) Models for Commodity Portfolios
Value at Risk (VaR) is a fundamental quantitative risk measurement tool widely used in commodity trading to estimate the potential loss in value of a portfolio over a defined period for a given confidence interval. It helps traders and risk managers understand the maximum expected loss under normal market conditions.
What is VaR?
- Definition: VaR answers the question: “What is the worst loss that can be expected over a given time horizon at a certain confidence level?”
- Example: A 1-day VaR of $1 million at 95% confidence means there is a 5% chance that losses will exceed $1 million in one day.
Key Components of VaR
Mind Map: Components of VaR
VaR Methodologies Explained
-
Parametric (Variance-Covariance) Method
- Assumes returns are normally distributed.
- Uses mean and variance-covariance matrix of returns.
- Fast and simple but may underestimate risk if returns are not normal.
-
Historical Simulation
- Uses actual historical returns to simulate portfolio losses.
- No assumption about return distribution.
- Dependent on the quality and length of historical data.
-
Monte Carlo Simulation
- Generates a large number of random price paths based on statistical models.
- Flexible and can incorporate complex risk factors.
- Computationally intensive.
Mind Map: VaR Methodologies
Example: Calculating Parametric VaR for a Crude Oil Portfolio
- Portfolio Value: $10 million
- Daily Return Mean: 0%
- Daily Return Std Dev: 2%
- Confidence Level: 95% (Z-score ≈ 1.65)
Calculation:
VaR = Portfolio Value × Z-score × Std Dev
VaR = $10,000,000 × 1.65 × 0.02 = $330,000
Interpretation: There is a 5% chance that the portfolio could lose more than $330,000 in one day.
Example: Historical Simulation VaR for a Wheat Trading Portfolio
- Collect last 250 trading days’ daily returns of wheat futures.
- Sort returns from worst to best.
- At 95% confidence, identify the 13th worst return (5% of 250).
- Suppose the 13th worst return is -3.5%.
- Portfolio Value: $5 million
VaR = 3.5% × $5,000,000 = $175,000
Interpretation: Based on historical data, there is a 5% chance the portfolio could lose more than $175,000 in one day.
Best Practices for VaR in Commodity Portfolios
- Use multiple VaR methodologies to cross-validate risk estimates.
- Incorporate stress testing alongside VaR to capture extreme events.
- Regularly update input data and parameters to reflect current market conditions.
- Adjust for non-normality and fat tails in commodity price returns.
- Combine VaR with other risk metrics like Expected Shortfall for a fuller picture.
Mind Map: Best Practices for VaR
Summary
Value at Risk is a powerful tool for quantifying potential losses in commodity portfolios. Understanding its methodologies, assumptions, and limitations is crucial for effective risk management. By integrating VaR with practical examples and best practices, commodity traders and risk managers can better prepare for market uncertainties and make informed hedging decisions.
4.2 Stress Testing and Scenario Analysis in Commodity Trading
Stress testing and scenario analysis are critical tools in commodity trading risk management. They help traders and risk managers understand how extreme but plausible events could impact their portfolios, enabling proactive mitigation strategies.
What is Stress Testing?
Stress testing involves applying hypothetical or historical extreme market conditions to a commodity portfolio to evaluate potential losses beyond normal market fluctuations.
- Purpose: Identify vulnerabilities under adverse conditions.
- Scope: Can be applied to price shocks, volatility spikes, liquidity crunches, or operational disruptions.
What is Scenario Analysis?
Scenario analysis examines the impact of specific, often complex, events or combinations of events on a portfolio.
- Purpose: Understand the effects of multi-factor events.
- Scope: Includes geopolitical crises, regulatory changes, supply chain disruptions, or demand shocks.
Mind Map: Stress Testing Framework in Commodity Trading
Mind Map: Scenario Analysis Examples
Best Practices for Stress Testing and Scenario Analysis
- Use Multiple Scenarios: Combine historical shocks with hypothetical events to cover a wide risk spectrum.
- Incorporate Correlations: Account for how commodity prices and related risk factors move together under stress.
- Regular Updates: Refresh scenarios frequently to reflect evolving market conditions and emerging risks.
- Integrate with Risk Limits: Use stress test results to adjust trading limits and hedging strategies.
- Communicate Clearly: Present findings in an understandable format for decision-makers.
Practical Example 1: Stress Testing a Crude Oil Portfolio
Context: A trading desk holds a diversified crude oil portfolio including futures, options, and swaps.
Stress Test Scenario: Sudden 30% drop in Brent crude prices within one week due to unexpected global demand slowdown.
Steps:
- Reprice all instruments using the shocked price.
- Calculate portfolio loss.
- Assess impact on margin requirements and liquidity.
Outcome: The portfolio shows a potential loss of $15 million, exceeding the desk’s risk limit.
Action: Increase hedging using put options and reduce open positions.
Practical Example 2: Scenario Analysis for Agricultural Commodities
Scenario: Severe drought in a major wheat-producing region combined with a trade embargo on exports.
Impact Analysis:
- Wheat prices spike by 40% due to supply shortage.
- Corn and soy prices increase due to substitution effects.
- Currency depreciation in importing countries affects demand.
Portfolio Effect: Long positions in wheat futures gain value, but short positions in corn suffer losses.
Risk Management Response: Adjust portfolio to reduce exposure to correlated commodities and increase monitoring of geopolitical developments.
Visualizing Scenario Impact: Mind Map
Summary
Stress testing and scenario analysis provide commodity traders and risk managers with a structured approach to anticipate and prepare for extreme market events. By combining quantitative rigor with practical examples, these techniques enhance resilience and support informed decision-making.
4.3 Greeks and Sensitivity Analysis for Commodity Options
Understanding the Greeks is essential for effective risk management and hedging in commodity options trading. The Greeks measure the sensitivity of an option’s price to various factors such as changes in the underlying commodity price, volatility, time decay, and interest rates. This section delves into the key Greeks relevant to commodity options and demonstrates how sensitivity analysis can be applied to manage risk.
Key Greeks in Commodity Options
- Delta (Δ): Measures the rate of change of the option price with respect to changes in the underlying commodity price.
- Gamma (Γ): Measures the rate of change of Delta with respect to changes in the underlying price; indicates convexity.
- Vega (ν): Measures sensitivity of the option price to changes in the volatility of the underlying commodity.
- Theta (Θ): Measures the sensitivity of the option price to the passage of time (time decay).
- Rho (ρ): Measures sensitivity to changes in the risk-free interest rate.
Mind Map: Overview of Greeks
Practical Example 1: Calculating Delta for a Crude Oil Call Option
Suppose you hold a call option on crude oil with the following parameters:
- Current crude oil price: $70/barrel
- Strike price: $75
- Time to expiration: 30 days
- Volatility: 25%
- Risk-free rate: 2%
Using an option pricing model (e.g., Black-Scholes adapted for commodities), you calculate Delta to be approximately 0.35. This means that for every $1 increase in crude oil price, the option price increases by $0.35.
Interpretation: If crude oil price rises from $70 to $71, the option price should increase by roughly $0.35, all else equal.
Mind Map: Delta and Gamma Relationship
Practical Example 2: Using Gamma to Adjust Hedging
Continuing the crude oil option example, suppose Gamma is 0.05. If the underlying price moves from $70 to $71, Delta will increase from 0.35 to approximately 0.40 (0.35 + 0.05). This means your hedge ratio needs to be adjusted to maintain a delta-neutral position.
Vega and Volatility Sensitivity
Volatility is a critical factor in commodity options pricing due to the often volatile nature of commodity markets.
- Vega is highest for at-the-money options and decreases as options move in- or out-of-the-money.
- A rise in implied volatility increases option premiums.
Practical Example 3: Vega Impact on Natural Gas Option
Consider a natural gas call option with a Vega of 0.12. If implied volatility rises from 30% to 35%, the option price increases by approximately 0.12 * 5 = $0.60.
Mind Map: Vega and Volatility
Theta and Time Decay
Options lose value as expiration approaches, all else equal. Theta quantifies this time decay.
- Theta is generally negative for long options.
- Time decay accelerates as expiration nears.
Practical Example 4: Theta Effect on Corn Option
A long call option on corn has a Theta of -0.03. This means the option loses $0.03 in value each day, assuming no change in other factors.
Mind Map: Theta and Time Decay
Rho and Interest Rate Sensitivity
Rho measures sensitivity to interest rate changes but is generally less impactful in commodity options compared to equity options.
Integrated Sensitivity Analysis Example
Imagine a portfolio holding multiple commodity options on gold and oil. By calculating the Greeks for each option, the risk manager can:
- Use Delta to hedge directional price risk.
- Monitor Gamma to understand how hedge ratios will change with price movements.
- Use Vega to assess exposure to volatility spikes, especially during geopolitical events.
- Track Theta to manage time decay, deciding when to roll or close positions.
Best Practice: Using Greeks for Dynamic Hedging
- Regularly compute Greeks for all option positions.
- Adjust hedge ratios dynamically based on Gamma and Delta changes.
- Monitor Vega to protect against volatility risk.
- Factor in Theta to avoid unexpected erosion of option value.
Summary
Greeks provide a powerful toolkit for measuring and managing the sensitivities of commodity options. By integrating Greeks into daily risk management and hedging strategies, commodity traders and risk managers can better anticipate price movements, volatility changes, and time decay effects, leading to more effective risk mitigation and optimized portfolio performance.
4.4 Best Practice: Integrating VaR and Stress Testing into Daily Risk Reporting
Effective risk management in commodity trading hinges on timely, accurate, and comprehensive risk reporting. Integrating Value at Risk (VaR) and stress testing into daily risk reports empowers traders and risk managers to understand potential losses under normal and extreme market conditions, enabling proactive decision-making.
Why Integrate VaR and Stress Testing Daily?
- Real-time risk visibility: Daily updates provide a current snapshot of portfolio risk.
- Early warning signals: Detect emerging vulnerabilities before losses materialize.
- Regulatory compliance: Many regulators require regular risk reporting.
- Informed hedging decisions: Helps optimize hedging strategies based on risk exposure.
Key Components of Daily Risk Reporting with VaR and Stress Testing
Step-by-Step Implementation Example
Scenario: A natural gas trading desk wants to integrate VaR and stress testing into its daily risk report.
-
Calculate Daily VaR:
- Use a 99% confidence level and 1-day horizon.
- Apply historical simulation using 1-year price data.
- Result: VaR = $2 million loss potential.
-
Perform Stress Tests:
- Historical scenario: 2008 natural gas price spike.
- Hypothetical scenario: sudden 20% price drop due to geopolitical event.
- Result: Potential losses of $5 million and $3.5 million respectively.
-
Create Risk Dashboard:
- Display VaR and stress test results side-by-side.
- Show current exposure vs. risk limits.
- Include trend charts of VaR over past 30 days.
-
Distribute Report:
- Automated email to traders, risk managers, and senior management.
- Upload to risk management system for audit trail.
Mind Map: Daily Risk Reporting Workflow
Practical Tips for Best Practice Implementation
- Automate data feeds: Ensure market data and positions update in real-time to avoid stale inputs.
- Standardize scenarios: Use a consistent set of stress scenarios relevant to your commodity portfolio.
- Visualize effectively: Use charts and heatmaps to highlight risk concentrations and trends.
- Set thresholds and alerts: Trigger notifications when VaR or stress losses approach risk limits.
- Document assumptions: Clearly state models, confidence levels, and scenario rationales in reports.
- Regularly validate models: Backtest VaR and review stress scenarios for relevance.
Example Visualization Ideas
- VaR Trend Chart: Line chart showing daily VaR over the past month.
- Stress Test Impact Table: Tabular display of scenario names and corresponding loss estimates.
- Risk Limit Gauge: Dial or bar showing current VaR as a percentage of the risk limit.
Summary
Integrating VaR and stress testing into daily risk reporting creates a robust framework for monitoring commodity trading risks. By combining statistical risk measures with scenario analysis, traders and risk managers gain a comprehensive view of potential losses under both normal and extreme conditions. Automation, clear visualization, and consistent communication are key to embedding this best practice successfully into daily operations.
4.5 Practical Example: Calculating Delta and Vega for Crude Oil Options
Understanding the Greeks—particularly Delta and Vega—is crucial for effective risk management and hedging in commodity options trading. This section walks through a detailed example of calculating Delta and Vega for a crude oil call option, illustrating how these sensitivities inform trading decisions.
What are Delta and Vega?
- Delta (Δ): Measures the sensitivity of the option’s price to a $1 change in the underlying asset price.
- Vega (ν): Measures the sensitivity of the option’s price to a 1% change in the implied volatility of the underlying asset.
Step 1: Define the Option Parameters
| Parameter | Value |
|---|---|
| Underlying Price (S) | $70 per barrel |
| Strike Price (K) | $75 per barrel |
| Time to Maturity (T) | 3 months (0.25 years) |
| Risk-Free Rate (r) | 2% per annum |
| Implied Volatility (σ) | 30% (0.30) |
| Option Type | European Call Option |
Step 2: Calculate d1 and d2 (Black-Scholes Model)
\[ \begin{aligned} d_1 &= \frac{\ln(\frac{S}{K}) + (r + \frac{\sigma^2}{2}) T}{\sigma \sqrt{T}} \\ d_2 &= d_1 - \sigma \sqrt{T} \end{aligned} \]
- Calculate \( d_1 \):
\[ \begin{aligned} d_1 &= \frac{\ln(70/75) + (0.02 + 0.5 \times 0.3^2) \times 0.25}{0.3 \times \sqrt{0.25}} \\ &= \frac{\ln(0.9333) + (0.02 + 0.045) \times 0.25}{0.3 \times 0.5} \\ &= \frac{-0.069 + 0.01625}{0.15} = \frac{-0.05275}{0.15} = -0.3517 \end{aligned} \]
- Calculate \( d_2 \):
\[ d_2 = -0.3517 - 0.3 \times 0.5 = -0.3517 - 0.15 = -0.5017 \]
Step 3: Calculate Delta
- For a European call option, Delta is given by:
\[ \Delta = N(d_1) \]
where \( N(\cdot) \) is the cumulative distribution function (CDF) of the standard normal distribution.
- Using standard normal tables or a calculator:
\[ N(-0.3517) = 1 - N(0.3517) \approx 1 - 0.6377 = 0.3623 \]
So,
\[ \Delta = 0.3623 \]
Interpretation: The option price will increase by approximately $0.36 for every $1 increase in crude oil price.
Step 4: Calculate Vega
- Vega formula:
\[ \text{Vega} = S \times \sqrt{T} \times n(d_1) \]
where \( n(\cdot) \) is the probability density function (PDF) of the standard normal distribution.
- Calculate \( n(d_1) \):
\[ n(d_1) = \frac{1}{\sqrt{2\pi}} e^{-\frac{d_1^2}{2}} = \frac{1}{2.5066} e^{-\frac{(-0.3517)^2}{2}} = 0.375 \]
- Calculate Vega:
\[ \text{Vega} = 70 \times 0.5 \times 0.375 = 13.125 \]
Interpretation: The option price will increase by approximately $13.13 for every 1.0 (or 100%) increase in implied volatility. For a 1% increase in volatility, the option price changes by approximately $0.1313.
Mind Map: Understanding Delta and Vega for Crude Oil Options
Example: Using Delta and Vega in Hedging
Scenario: A trader holds 100 crude oil call options with the parameters above.
-
Delta Hedge:
- Total Delta = 100 options × 0.3623 = 36.23
- To hedge price risk, short 36.23 barrels of crude oil futures.
-
Vega Risk:
- Total Vega = 100 × 13.125 = 1,312.5
- If implied volatility rises by 1%, option value increases by $1,312.50.
- Trader may consider volatility derivatives or options spreads to hedge this risk.
Summary
| Greek | Value | Meaning | Practical Use |
|---|---|---|---|
| Delta | 0.3623 | Price sensitivity to $1 move in crude oil | Hedge underlying price risk |
| Vega | 13.125 | Price sensitivity to 100% change in volatility | Manage volatility exposure |
By calculating Delta and Vega, commodity traders and risk managers can better understand and hedge their exposure to price and volatility risks in crude oil options, enabling more informed and effective risk management strategies.
5. Credit Risk Management in Commodity Trading
5.1 Counterparty Credit Risk and Exposure Measurement
Counterparty credit risk is the risk that the counterparty to a commodity trading transaction will default before the final settlement of the transaction’s cash flows. This risk is particularly significant in over-the-counter (OTC) derivative transactions where the exposure is bilateral and not guaranteed by an exchange.
Understanding Counterparty Credit Risk
- Definition: The possibility that the counterparty fails to fulfill its contractual obligations.
- Importance: Unmanaged credit risk can lead to significant financial losses and liquidity issues.
Key Components of Counterparty Credit Risk
Mind Map: Counterparty Credit Risk Components
Exposure Measurement
Exposure is the amount at risk if the counterparty defaults. It can be broken down as:
- Current Exposure: The current mark-to-market (MTM) value of the trade if positive.
- Potential Future Exposure (PFE): The possible increase in exposure over the life of the transaction due to market movements.
Methods to Measure Exposure
- Mark-to-Market Exposure: Simple and immediate, reflecting current exposure.
- Add-On Methods: Regulatory prescribed add-ons based on notional amounts and asset classes.
- Simulation-Based Methods: Monte Carlo simulations to estimate PFE by modeling future price paths.
Mind Map: Exposure Measurement Techniques
Practical Example: Measuring Exposure in a Crude Oil Swap
- Scenario: A commodity trader enters into a 6-month fixed-for-floating crude oil swap with a counterparty.
- Current Exposure: The swap is currently in-the-money by $500,000 (positive MTM).
- Potential Future Exposure: Using Monte Carlo simulation, the PFE at 95% confidence over 6 months is estimated at $1.2 million.
This means the trader is currently exposed to $500,000 but could potentially face exposure up to $1.2 million if market prices move adversely.
Probability of Default (PD) and Loss Given Default (LGD)
- PD: The likelihood that the counterparty will default within a given time horizon.
- LGD: The proportion of exposure that would be lost if default occurs, after recoveries.
These parameters are often derived from credit ratings, market data, or internal assessments.
Credit Valuation Adjustment (CVA)
CVA is the market value of counterparty credit risk — the difference between the risk-free portfolio value and the true portfolio value considering counterparty default risk.
-
Calculation: CVA = Expected Exposure × PD × LGD
-
Purpose: To price in credit risk and adjust the valuation of derivative contracts.
Mind Map: Components of CVA
Best Practices in Counterparty Credit Risk Management
- Regular Exposure Monitoring: Daily MTM and exposure updates.
- Use of Collateral and Margining: To reduce unsecured exposure.
- Credit Limits: Establish and enforce counterparty credit limits.
- Netting Agreements: To offset exposures across multiple trades.
- Stress Testing: Assess exposure under extreme market conditions.
Practical Example: Applying Credit Limits and Collateral
A metals trading firm has a credit limit of $2 million with a counterparty. The current exposure is $1.5 million, but PFE could rise to $2.5 million. To mitigate risk, the firm requires collateral posting once exposure exceeds $2 million, reducing unsecured risk.
Summary
Counterparty credit risk is a critical element in commodity trading risk management. Accurate exposure measurement combining current MTM and potential future exposure, coupled with PD and LGD assessments, enables traders and risk managers to quantify and mitigate credit risk effectively. Implementing best practices such as collateral management, credit limits, and regular monitoring ensures a robust defense against counterparty defaults.
5.2 Credit Mitigation Techniques: Collateral, Netting, and Limits
In commodity trading, managing credit risk is essential to protect against counterparty defaults and ensure financial stability. Credit mitigation techniques are tools and practices designed to reduce the credit exposure a trader or firm faces. This section explores three primary credit mitigation techniques: collateral, netting, and limits, with detailed explanations, mind maps, and practical examples.
Collateral
Definition: Collateral is an asset or cash pledged by a counterparty to secure a trade or derivative contract, reducing the risk of loss if the counterparty defaults.
Key Points:
- Collateral can be cash, government bonds, letters of credit, or other liquid assets.
- Margin calls ensure collateral levels stay aligned with exposure.
- Collateral agreements are typically governed by Credit Support Annexes (CSAs) in OTC derivatives.
Mind Map: Collateral in Credit Mitigation
Example:
A commodity trader enters into a forward contract to buy 10,000 barrels of crude oil from a counterparty. To mitigate credit risk, the counterparty posts cash collateral equivalent to the mark-to-market exposure. If oil prices move adversely, margin calls adjust collateral to reflect the new exposure, protecting the trader from credit losses.
Netting
Definition: Netting is the process of consolidating multiple obligations between two counterparties into a single net payment or exposure, reducing the overall credit risk.
Types of Netting:
- Payment Netting: Offsetting payments due on the same date.
- Close-out Netting: Upon default, all transactions are terminated and netted to determine a single net amount owed.
- Novation Netting: Replacing multiple contracts with a single contract.
Mind Map: Netting Techniques
Example:
A metals trading firm has multiple outstanding contracts with a counterparty: buying copper and selling aluminum. Instead of settling each contract separately, payment netting consolidates the amounts due on the same date, resulting in a single net payment. This reduces the credit exposure and operational complexity.
Limits
Definition: Credit limits are pre-established thresholds that restrict the amount of credit exposure a trader or firm can have with a single counterparty or group.
Types of Limits:
- Single Counterparty Limits: Maximum exposure allowed per counterparty.
- Product Limits: Limits based on commodity type or derivative product.
- Portfolio Limits: Aggregate exposure limits across multiple counterparties or products.
Mind Map: Credit Limits
Example:
A risk manager sets a credit limit of $50 million for a single counterparty trading crude oil futures. If the trader’s exposure approaches this limit, new trades with that counterparty are restricted until the exposure decreases, preventing excessive concentration of credit risk.
Integrating Credit Mitigation Techniques
These techniques often work together to provide a robust credit risk management framework.
Combined Example:
Consider a commodity trading firm with multiple OTC derivative contracts with a counterparty. The firm uses netting agreements to consolidate exposures, requires collateral to cover net exposure, and enforces credit limits to cap total risk. This layered approach ensures that even if one technique falls short, others provide additional protection.
Summary
| Technique | Purpose | Key Benefit | Example Use Case |
|---|---|---|---|
| Collateral | Secures exposure with assets | Immediate loss protection | Margin calls on crude oil forward contracts |
| Netting | Consolidates multiple exposures | Reduces gross credit exposure | Payment netting across multiple metals contracts |
| Limits | Caps exposure per counterparty | Controls concentration risk | $50M credit limit on a single counterparty |
By effectively applying collateral, netting, and limits, commodity traders and risk managers can significantly reduce credit risk, ensuring more resilient trading operations.
5.3 Managing Credit Risk in OTC Derivative Transactions
Over-the-counter (OTC) derivatives are customized contracts traded directly between counterparties without going through an exchange. While OTC derivatives offer flexibility to tailor terms to specific needs, they also introduce significant credit risk due to the bilateral nature of the contracts and lack of centralized clearing.
Understanding Credit Risk in OTC Derivatives
Credit risk in OTC derivatives arises from the possibility that the counterparty may default on its obligations, leaving one party exposed to potential losses. This risk is dynamic and depends on the mark-to-market value of the derivative, collateral arrangements, and the creditworthiness of the counterparty.
Key Components of Credit Risk Management in OTC Derivatives
- Exposure Measurement: Quantifying current and potential future exposure.
- Credit Assessment: Evaluating counterparty creditworthiness.
- Credit Mitigation: Using collateral, netting agreements, and credit limits.
- Monitoring and Reporting: Ongoing surveillance of exposures and credit quality.
Mind Map: Managing Credit Risk in OTC Derivative Transactions
Best Practices in Managing Credit Risk for OTC Derivatives
-
Robust Legal Framework: Ensure all OTC derivatives are governed by standardized legal documents such as the ISDA Master Agreement and Credit Support Annex (CSA). These documents define netting rights, collateral terms, and default procedures.
-
Accurate Exposure Measurement: Use sophisticated models to calculate current exposure and potential future exposure (PFE), considering market volatility and contract terms.
-
Collateral Management: Implement daily margining with variation margin to cover mark-to-market changes and initial margin to cover potential future exposure.
-
Netting Agreements: Leverage close-out netting to reduce gross exposures to a net amount in case of default, minimizing credit risk.
-
Credit Limits and Monitoring: Set counterparty credit limits based on creditworthiness and monitor exposures in real-time to prevent breaches.
-
Stress Testing: Regularly conduct stress tests and scenario analyses to evaluate credit risk under extreme market conditions.
-
Dispute Management: Establish clear processes for resolving disputes on valuations or collateral calls promptly to avoid credit risk escalation.
Practical Example: Managing Credit Risk in an OTC Interest Rate Swap
Scenario: A commodity trading firm enters into an OTC interest rate swap with a counterparty to hedge interest rate exposure on a loan. The notional amount is $50 million, with quarterly payments over 3 years.
Step 1: Legal Documentation
- The firm ensures the swap is governed by an ISDA Master Agreement with a CSA outlining collateral requirements.
Step 2: Exposure Measurement
- Using a risk system, the firm calculates the mark-to-market value daily. Suppose the current MTM is $1.2 million in favor of the firm.
Step 3: Collateral Management
- The counterparty posts variation margin equal to the MTM amount.
- Initial margin is set at $500,000 to cover potential future exposure.
Step 4: Netting and Limits
- The firm has a credit limit of $10 million for this counterparty.
- Netting agreements reduce exposure if multiple trades exist.
Step 5: Monitoring and Reporting
- Daily reports track exposure and collateral.
- Alerts trigger if exposure approaches limits.
Step 6: Stress Testing
- The firm simulates a 200 basis point interest rate shock to estimate potential future exposure.
Outcome: Through these steps, the firm effectively manages credit risk, ensuring that potential losses from counterparty default are minimized.
Additional Mind Map: Collateral Management Process
Summary
Managing credit risk in OTC derivative transactions requires a comprehensive approach combining legal safeguards, precise exposure measurement, collateralization, netting, and continuous monitoring. By implementing these best practices and leveraging technology, commodity traders and risk managers can significantly reduce counterparty credit risk, ensuring more resilient trading operations.
5.4 Best Practice: Implementing a Robust Credit Approval and Monitoring Process
Effective credit risk management is critical in commodity trading, where counterparty default can lead to significant financial losses. Implementing a robust credit approval and monitoring process ensures that exposures are controlled, creditworthiness is continuously assessed, and potential risks are mitigated proactively.
Key Components of a Robust Credit Approval and Monitoring Process
Credit Approval & Monitoring Process Mind Map
Step-by-Step Best Practice Implementation
-
Comprehensive Counterparty Evaluation
- Collect and analyze financial statements, credit ratings, and market reputation.
- Use both internal scoring models and external ratings (e.g., Moody’s, S&P).
- Example: Before onboarding a new metals supplier, the risk team reviews their latest audited financials and assigns a credit score that influences the credit limit.
-
Setting Clear and Dynamic Credit Limits
- Define limits based on exposure type (spot, forward, options), tenor, and product risk.
- Implement tiered limits for different counterparty risk profiles.
- Example: A counterparty with a BBB rating may have a $5 million limit on futures contracts but only $1 million on OTC swaps due to higher credit risk.
-
Structured Approval Workflow
- Establish a multi-level approval process involving credit analysts, risk managers, and senior management.
- Escalate high-risk or large exposure requests to a credit committee.
- Example: A request to increase a credit limit beyond $10 million triggers an automatic review by the credit committee.
-
Real-Time Exposure Monitoring and Alerts
- Use technology platforms to track exposures continuously across all trading desks.
- Set automated alerts for limit breaches or unusual activity.
- Example: A dashboard shows that a counterparty’s exposure is approaching 90% of its limit, triggering an alert for the risk manager to review.
-
Ongoing Counterparty Performance Review
- Monitor payment timeliness, market news, and any credit rating changes.
- Use early warning indicators such as delayed payments or negative press.
- Example: After a sudden downgrade of a counterparty’s credit rating, the risk team initiates a limit reassessment and requests additional collateral.
-
Mitigation Techniques
- Require collateral or margin calls for higher-risk counterparties.
- Implement netting agreements to reduce gross exposures.
- Use credit insurance where appropriate.
- Example: For an OTC derivatives contract with a new counterparty, the firm requires a cash collateral deposit equal to 20% of the notional value.
-
Regular Reporting and Governance
- Produce weekly and monthly credit risk reports for senior management.
- Conduct periodic audits of credit processes and exposures.
- Continuously update policies based on market conditions and regulatory changes.
- Example: Quarterly reports highlight top 10 counterparties by exposure and any breaches or near breaches.
Practical Example: Credit Approval and Monitoring in a Multi-Counterparty Metals Portfolio
A global metals trading firm manages credit exposures to over 50 counterparties worldwide. To implement a robust credit process, they:
- Use an internal credit scoring system combining financial ratios, payment history, and market intelligence.
- Set exposure limits per counterparty and per product type (e.g., spot, forward, options).
- Automate exposure tracking with real-time dashboards integrated with their trading system.
- Establish a credit committee that meets weekly to review limit requests and breaches.
- Require collateral for counterparties with scores below a certain threshold.
- Monitor news feeds and credit rating agencies for early warning signs.
Outcome: The firm successfully avoided a potential $3 million loss when a mid-tier counterparty showed signs of financial distress, triggering a timely reduction in exposure and collateral calls.
Summary
Implementing a robust credit approval and monitoring process in commodity trading involves a combination of rigorous counterparty evaluation, clear limit setting, structured approvals, continuous exposure monitoring, and proactive mitigation. Leveraging technology and maintaining strong governance ensures that credit risk is managed effectively, protecting the firm from unexpected losses.
Additional Mind Map: Credit Risk Mitigation Techniques
Credit Risk Mitigation Mind Map
This comprehensive approach ensures that commodity trading firms can manage credit risk dynamically and sustainably.
5.5 Practical Example: Assessing Credit Exposure in a Multi-Counterparty Metals Portfolio
In commodity trading, particularly in metals trading, managing credit exposure across multiple counterparties is critical to minimize potential losses arising from counterparty defaults. This practical example walks through the process of assessing credit exposure in a multi-counterparty metals portfolio, illustrating key concepts, calculations, and best practices.
Step 1: Understanding the Portfolio and Counterparties
Imagine a metals trading desk holding positions with five different counterparties involving contracts for gold, copper, and aluminum. Each counterparty has different credit ratings and outstanding exposures.
Portfolio Snapshot:
| Counterparty | Commodity | Position (MT) | Market Price (USD/MT) | Notional Value (USD) | Credit Rating |
|---|---|---|---|---|---|
| Alpha Metals | Gold | 50 | 60,000 | 3,000,000 | A |
| Beta Traders | Copper | 200 | 9,000 | 1,800,000 | BBB |
| Gamma Corp | Aluminum | 300 | 2,500 | 750,000 | BB |
| Delta LLC | Copper | -150 | 9,000 | -1,350,000 | A |
| Epsilon Inc | Gold | -30 | 60,000 | -1,800,000 | B |
Note: Positive positions indicate long exposure, negative positions indicate short exposure.
Step 2: Calculating Gross and Net Credit Exposure
- Gross Exposure: Sum of absolute values of all positive and negative positions per counterparty.
- Net Exposure: Sum of all positions (long and short) per counterparty.
Mind Map: Credit Exposure Components
Calculations:
| Counterparty | Gross Exposure (USD) | Net Exposure (USD) |
|---|---|---|
| Alpha Metals | 3,000,000 | 3,000,000 |
| Beta Traders | 1,800,000 | 1,800,000 |
| Gamma Corp | 750,000 | 750,000 |
| Delta LLC | 1,350,000 | -1,350,000 |
| Epsilon Inc | 1,800,000 | -1,800,000 |
Note: For Delta LLC and Epsilon Inc, net exposure is negative, indicating short positions.
Step 3: Incorporating Credit Ratings and Probability of Default (PD)
Credit ratings help estimate the likelihood of default. For simplicity, assume the following annual PDs:
| Credit Rating | Probability of Default (PD) |
|---|---|
| A | 0.5% |
| BBB | 1.5% |
| BB | 4.0% |
| B | 8.0% |
Mind Map: Credit Risk Assessment Factors
Step 4: Calculating Expected Credit Loss (ECL)
ECL = Exposure at Default (EAD) × Probability of Default (PD) × Loss Given Default (LGD)
Assuming LGD = 60% (industry standard for unsecured exposures).
Example Calculation for Alpha Metals:
- EAD = 3,000,000 USD
- PD = 0.5% = 0.005
- LGD = 60% = 0.6
ECL = 3,000,000 × 0.005 × 0.6 = 9,000 USD
ECL for all counterparties:
| Counterparty | EAD (USD) | PD (%) | LGD (%) | ECL (USD) |
|---|---|---|---|---|
| Alpha Metals | 3,000,000 | 0.5 | 60 | 9,000 |
| Beta Traders | 1,800,000 | 1.5 | 60 | 16,200 |
| Gamma Corp | 750,000 | 4.0 | 60 | 18,000 |
| Delta LLC | 1,350,000 | 0.5 | 60 | 4,050 |
| Epsilon Inc | 1,800,000 | 8.0 | 60 | 86,400 |
Step 5: Considering Netting Agreements and Collateral
Netting agreements allow offsetting positive and negative exposures with the same counterparty, reducing credit exposure.
- For example, if Delta LLC has both long and short positions, netting reduces exposure.
- Collateral posted by counterparties further reduces exposure.
Mind Map: Credit Risk Mitigation Techniques
Assuming Delta LLC and Alpha Metals have netting agreements and collateral posted worth 500,000 USD each.
Adjusted EAD:
- Alpha Metals: 3,000,000 - 500,000 = 2,500,000 USD
- Delta LLC: 1,350,000 - 500,000 = 850,000 USD
Recalculate ECL accordingly.
Step 6: Reporting and Monitoring
- Aggregate ECL across all counterparties to understand total credit risk.
- Monitor credit ratings and update PDs regularly.
- Use credit exposure dashboards for real-time tracking.
Mind Map: Credit Exposure Monitoring Workflow
Summary
This example demonstrates a structured approach to assessing credit exposure in a multi-counterparty metals portfolio:
- Calculate gross and net exposures per counterparty.
- Incorporate credit ratings and PDs to estimate expected credit losses.
- Adjust exposures for netting agreements and collateral.
- Continuously monitor and report credit risk metrics.
By following these steps, commodity traders and risk managers can proactively manage credit risk, ensuring portfolio resilience against counterparty defaults.
6. Operational Risk and Compliance in Commodity Trading
6.1 Identifying Operational Risks Specific to Commodity Trading
Operational risk in commodity trading refers to the potential for losses resulting from inadequate or failed internal processes, people, systems, or external events. Given the complexity and fast-paced nature of commodity markets, identifying these risks early is crucial for maintaining smooth operations and safeguarding financial performance.
Key Categories of Operational Risks in Commodity Trading
Detailed Explanation and Examples
-
Process Risks
- Trade Capture Errors: Mistakes during trade entry, such as incorrect quantity, price, or commodity type, can lead to significant financial discrepancies.
- Example: A trader enters a futures contract for 1,000 barrels of oil but mistakenly inputs 10,000 barrels, leading to unintended exposure.
- Settlement and Confirmation Failures: Delays or errors in confirming trades with counterparties can cause settlement risks.
- Example: Failure to confirm a physical delivery contract on time results in missed delivery deadlines and penalties.
- Documentation and Contract Management: Poorly managed contracts can lead to misunderstandings or legal disputes.
- Example: Ambiguous contract terms on quality specifications cause disputes between buyer and seller.
- Trade Capture Errors: Mistakes during trade entry, such as incorrect quantity, price, or commodity type, can lead to significant financial discrepancies.
-
People Risks
- Human Errors in Trading Decisions: Misjudgments or lapses in judgment can expose the firm to losses.
- Example: A trader misinterprets market signals and takes an overly aggressive position.
- Inadequate Training or Knowledge: Lack of proper training can lead to operational mistakes.
- Example: New staff unfamiliar with complex derivatives mishandles option exercise processes.
- Fraud and Unauthorized Trading: Unauthorized trades or fraudulent activities can cause severe damage.
- Example: A rogue trader executes unauthorized trades exceeding risk limits.
- Human Errors in Trading Decisions: Misjudgments or lapses in judgment can expose the firm to losses.
-
Systems Risks
- IT System Failures or Downtime: System outages can halt trading operations and delay critical processes.
- Example: Trading platform downtime during peak hours prevents order execution.
- Data Integrity and Reconciliation Issues: Inaccurate or incomplete data can distort risk assessments.
- Example: Mismatched trade data between front-office and back-office systems leads to incorrect P&L reporting.
- Cybersecurity Threats: Attacks on IT infrastructure can compromise sensitive information.
- Example: A phishing attack leads to unauthorized access to trading accounts.
- IT System Failures or Downtime: System outages can halt trading operations and delay critical processes.
-
External Risks
- Regulatory Changes and Compliance Failures: Non-compliance with evolving regulations can result in fines.
- Example: Failure to report trades under new regulatory mandates triggers penalties.
- Market Disruptions: Exchange outages or extreme volatility can disrupt trading.
- Example: A sudden exchange halt prevents closing out positions.
- Natural Disasters Affecting Supply Chains: Disruptions in physical commodity flows impact trading operations.
- Example: Flooding delays delivery of agricultural products, causing contract breaches.
- Regulatory Changes and Compliance Failures: Non-compliance with evolving regulations can result in fines.
-
Third-Party Risks
- Counterparty Failures: Defaults or delays by counterparties can cause credit and operational issues.
- Example: A supplier fails to deliver metals as contracted, forcing the trader to source at higher spot prices.
- Vendor or Service Provider Issues: Dependence on external providers for technology or logistics can introduce vulnerabilities.
- Example: A clearinghouse system outage delays settlement processing.
- Counterparty Failures: Defaults or delays by counterparties can cause credit and operational issues.
Mind Map: Operational Risk Identification Process
Best Practice Example: Identifying Operational Risks in a High-Volume Agricultural Commodities Desk
- Scenario: A trading desk handling multiple agricultural commodities with frequent physical deliveries.
- Approach:
- Conduct process walkthroughs with traders and operations staff.
- Use checklists to identify common error points such as trade entry, delivery scheduling, and invoicing.
- Review past incidents to detect recurring issues.
- Implement a risk register capturing identified operational risks.
- Example finding: Frequent mismatches between delivery quantities recorded by warehouse and those in trade systems, leading to settlement disputes.
Summary
Identifying operational risks in commodity trading requires a holistic view of processes, people, systems, and external factors. Using structured frameworks and involving cross-functional teams ensures comprehensive risk identification. Real-world examples highlight how seemingly small errors can escalate into significant financial and reputational losses, underscoring the importance of vigilance and proactive management.
6.2 Regulatory Environment and Compliance Requirements
Commodity trading operates within a complex regulatory landscape designed to ensure market integrity, transparency, and protect participants from systemic risks. Understanding these regulations and embedding compliance into daily operations is critical for risk managers and commodity traders alike.
Overview of Key Regulatory Bodies and Frameworks
- Commodity Futures Trading Commission (CFTC) (US): Oversees futures and options markets.
- Securities and Exchange Commission (SEC) (US): Regulates securities and certain derivatives.
- European Securities and Markets Authority (ESMA): Oversees EU derivatives markets.
- Dodd-Frank Act: US legislation enhancing transparency and reducing systemic risk post-2008 crisis.
- Markets in Financial Instruments Directive II (MiFID II): EU directive enhancing transparency and investor protection.
- Basel III: International banking regulations impacting commodity trading firms with banking arms.
Mind Map: Regulatory Environment in Commodity Trading
Core Compliance Requirements
-
Reporting and Transparency
- Trade Reporting: All derivative trades must be reported to swap data repositories (SDRs) or trade repositories.
- Real-time Public Reporting: Certain trades require real-time publication to enhance market transparency.
-
Position Limits and Accountability
- Limits on the maximum number of contracts a trader/entity can hold to prevent market manipulation.
- Position aggregation rules for related entities.
-
Anti-Manipulation and Market Abuse Rules
- Prohibition of spoofing, layering, and other manipulative practices.
- Monitoring for suspicious trading patterns.
-
Margin and Capital Requirements
- Variation and initial margin requirements for OTC derivatives.
- Capital adequacy rules for trading firms.
-
Record Keeping and Audit Trails
- Maintaining detailed records of trades, communications, and risk assessments.
- Ensuring auditability for regulators.
Mind Map: Compliance Requirements Breakdown
Best Practices for Regulatory Compliance
- Establish a Dedicated Compliance Team: Specialized personnel to monitor regulatory changes and ensure adherence.
- Automate Reporting Processes: Use technology to capture and report trades accurately and timely.
- Implement Real-Time Surveillance Systems: Detect and prevent manipulative behaviors proactively.
- Regular Training and Awareness: Keep traders and risk managers updated on regulatory obligations.
- Maintain Robust Documentation: Ensure all compliance activities and decisions are well documented.
Practical Example: Compliance Implementation in a Natural Gas Trading Desk
Scenario: A mid-sized natural gas trading firm needs to comply with CFTC regulations under Dodd-Frank.
- Trade Reporting: The firm integrates an automated system that captures all futures and swaps trades and reports them to an SDR within minutes.
- Position Limits: The risk management system flags when traders approach position limits, triggering alerts and requiring managerial approval before further trading.
- Anti-Manipulation Controls: Real-time surveillance software monitors order book activity to detect spoofing attempts.
- Record Keeping: All trade communications are archived and linked to trade records for audit purposes.
This integrated approach ensures the firm meets regulatory requirements while minimizing compliance risk.
Summary
Navigating the regulatory environment in commodity trading demands a proactive, structured approach. By understanding the key regulations, embedding compliance into trading workflows, and leveraging technology, commodity traders and risk managers can effectively mitigate regulatory risks and maintain market integrity.
6.3 Technology and Systems for Risk Control and Reporting
Effective risk control and reporting in commodity trading rely heavily on robust technology infrastructure and sophisticated systems. These tools enable traders and risk managers to monitor exposures, enforce limits, and generate timely, accurate reports that inform decision-making and regulatory compliance.
Key Components of Risk Control and Reporting Systems
Data Management
Accurate and timely data is the foundation of any risk control system. This includes real-time market prices, trade capture data, and historical records.
Best Practice: Implement automated trade capture systems that validate trades immediately upon entry to reduce errors and ensure data integrity.
Example: A commodity trading firm uses an automated interface to ingest futures prices from multiple exchanges in real-time, feeding this data into their risk engine to update exposure calculations every minute.
Risk Analytics
Advanced analytics engines calculate risk metrics such as Value at Risk (VaR), stress test outcomes, and credit exposure.
Best Practice: Use modular risk engines that allow customization of risk models for different commodity classes and trading strategies.
Example: A natural gas trader employs a risk system that calculates intraday VaR using Monte Carlo simulations, adjusting for seasonal volatility patterns unique to energy markets.
Limit Monitoring
Systems continuously monitor trading positions against pre-set limits to prevent excessive risk-taking.
Best Practice: Configure real-time alerts and automated trade blocks when limits are breached.
Example: When a metals trader approaches their position limit on copper futures, the system triggers an alert and temporarily blocks new trades until risk managers review the exposure.
Reporting
Comprehensive reporting tools generate regulatory filings, internal risk dashboards, and audit logs.
Best Practice: Develop customizable dashboards that provide both high-level summaries and drill-down capabilities for detailed analysis.
Example: A risk manager reviews a daily dashboard showing aggregated commodity exposures by desk, with the ability to click through to individual trade details and P&L attribution.
Integration
Seamless integration between front-office trading platforms, risk systems, market data providers, and back-office settlement systems is critical.
Best Practice: Adopt APIs and middleware solutions to ensure data consistency and reduce manual reconciliation.
Example: A trading firm integrates its order management system with a risk platform via REST APIs, enabling real-time risk updates as trades are executed.
Mind Map: Technology Workflow for Risk Control and Reporting
Example Scenario: Implementing a Risk Control System for an Agricultural Commodity Desk
Context: An agricultural commodity trading desk wants to implement a technology solution to manage price risk, credit exposure, and operational controls.
Steps:
-
Trade Capture Automation: Deploy a trade capture platform that automatically validates and timestamps all trades in corn and soybean futures.
-
Market Data Integration: Connect to multiple exchange feeds to ensure real-time price updates.
-
Risk Analytics Engine: Configure the risk engine to calculate VaR and stress tests tailored to seasonal harvest cycles.
-
Limit Monitoring: Set position and credit limits with real-time alerts and automated trade blocks.
-
Reporting: Build dashboards for traders and risk managers showing exposures, P&L, and limit status.
-
Integration: Link the risk system with back-office settlement to track margin calls and collateral.
Outcome: The desk reduces operational errors, improves risk visibility, and ensures compliance with internal and regulatory requirements.
Summary
Technology and systems for risk control and reporting are indispensable in modern commodity trading. By combining real-time data management, advanced analytics, automated limit monitoring, comprehensive reporting, and seamless integration, firms can effectively manage risk and enhance decision-making.
Remember: The best systems are those that are flexible, scalable, and user-friendly, enabling both traders and risk managers to collaborate efficiently.
6.4 Best Practice: Establishing Effective Trade Capture and Reconciliation Processes
Effective trade capture and reconciliation processes are critical pillars in managing operational risk within commodity trading. These processes ensure that every trade executed is accurately recorded, validated, and matched across systems, minimizing errors, preventing financial losses, and maintaining regulatory compliance.
Why Trade Capture and Reconciliation Matter
- Accuracy: Precise recording of trade details (price, quantity, counterparty, timestamps) avoids discrepancies.
- Risk Control: Early identification of mismatches reduces exposure to operational and financial risks.
- Regulatory Compliance: Accurate records support audit trails and reporting obligations.
- Transparency: Facilitates clear communication between trading, risk, finance, and compliance teams.
Key Components of an Effective Trade Capture and Reconciliation Process
Step 1: Accurate and Timely Trade Capture
- Real-time Entry: Trades should be captured immediately after execution to reduce latency and risk of missing data.
- Automated Validation: Implement system checks for trade parameters (e.g., price limits, quantity ranges, counterparty validity).
- Standardized Templates: Use uniform trade capture forms to reduce manual errors and facilitate downstream processing.
Example: A natural gas trading desk uses an electronic trading platform that automatically captures trade details and runs validation checks against pre-set credit limits and price bands before confirming the trade.
Step 2: Robust Reconciliation Process
- Trade Matching: Match trades captured internally with confirmations from counterparties or clearinghouses.
- Exception Management: Identify mismatches or missing trades promptly.
- Timely Resolution: Assign ownership and deadlines for resolving exceptions to prevent backlog.
Example: A metals trading firm runs a nightly reconciliation report comparing its internal trade capture system with broker confirmations. An exception is flagged where the quantity of a copper futures contract differs. The trade operations team investigates and discovers a manual entry error, which is corrected before settlement.
Step 3: Leveraging Technology for Efficiency
- Integrated Trading Platforms: Systems that combine trade capture, risk management, and settlement reduce manual handoffs.
- Middleware & APIs: Facilitate seamless data flow between front office, middle office, and back office systems.
- Reporting Dashboards: Provide real-time visibility into trade status, exceptions, and reconciliation metrics.
Example: An agricultural commodities trader implements an API-based solution that automatically pulls trade confirmations from counterparties’ systems into their reconciliation platform, reducing manual reconciliation time by 60%.
Step 4: Governance and Controls
- Defined Roles & Responsibilities: Clear ownership for trade capture, reconciliation, and exception resolution.
- Audit Trails: Maintain immutable logs of trade entries, edits, and reconciliation activities.
- Escalation Procedures: Formal processes for escalating unresolved exceptions to senior management.
Example: A crude oil trading desk establishes a policy where any trade exception unresolved after 24 hours is escalated to the risk manager for review and potential intervention.
Practical Example: End-to-End Trade Capture and Reconciliation in a Grain Trading Desk
- Trade Execution: Trader executes a corn futures contract on an electronic exchange.
- Trade Capture: The trade is automatically captured by the trading platform with validation checks on price and quantity.
- Confirmation Receipt: The clearinghouse sends a trade confirmation.
- Reconciliation: The back office system automatically matches the internal trade record with the clearinghouse confirmation.
- Exception Handling: A mismatch in settlement date is detected.
- Resolution: The operations team contacts the clearinghouse, confirms the correct date, and updates the internal record.
- Reporting: Daily reconciliation report shows zero unresolved exceptions.
Summary Checklist for Best Practice Implementation
- Implement real-time, automated trade capture with validation.
- Use standardized trade entry templates.
- Automate trade matching with counterparties and clearinghouses.
- Establish clear exception management workflows.
- Leverage integrated technology platforms and APIs.
- Define governance structures with clear roles and escalation paths.
- Maintain comprehensive audit trails.
- Produce daily reconciliation and exception reports.
By embedding these best practices into your commodity trading operations, you significantly reduce operational risk, enhance data integrity, and support a resilient risk management framework.
6.5 Practical Example: Mitigating Operational Risk in a High-Volume Agricultural Commodities Desk
Operational risk in a high-volume agricultural commodities desk can arise from multiple sources, including trade capture errors, settlement failures, system outages, and human mistakes. Given the fast-paced nature and complexity of agricultural markets—such as grains, oilseeds, and soft commodities—effective mitigation strategies are essential to avoid financial losses and reputational damage.
Understanding Operational Risk in Agricultural Commodities Trading
- Trade Capture Errors: Mistakes in entering trade details (quantity, price, counterparty).
- Settlement Failures: Delays or errors in physical delivery or financial settlement.
- System Failures: Technology outages impacting order execution or risk reporting.
- Human Errors: Miscommunication, incorrect approvals, or lack of training.
Mind Map: Key Operational Risk Areas and Mitigation Strategies
Best Practices with Examples
-
Automated Trade Capture with Dual Verification
- Practice: Implement electronic trade capture platforms integrated with validation rules to flag discrepancies.
- Example: A corn trading desk uses a system where every trade entered triggers an automatic check against market prices and contract terms. A second trader verifies the trade details before confirmation.
-
Standardized Contract Templates and Settlement Instructions
- Practice: Use standardized contracts with clearly defined delivery terms and payment instructions to reduce ambiguity.
- Example: The soybean trading team adopts ISDA-based templates customized for agricultural commodities, ensuring all counterparties follow uniform settlement procedures.
-
Daily Trade Reconciliation and Exception Reporting
- Practice: Reconcile trade records daily between front office, middle office, and back office to detect discrepancies early.
- Example: The wheat desk runs an automated reconciliation report every morning, highlighting unmatched trades or settlement issues for immediate resolution.
-
Robust Training and Clear Communication Channels
- Practice: Conduct regular training sessions on systems, compliance, and operational procedures; establish clear escalation paths.
- Example: New hires on the sugar trading desk undergo a 2-week onboarding program focused on operational risk awareness, followed by monthly refresher workshops.
-
System Redundancy and Disaster Recovery Planning
- Practice: Maintain backup systems and conduct periodic disaster recovery drills to ensure business continuity.
- Example: The coffee trading desk has a mirrored data center; quarterly drills simulate system outages to test failover capabilities.
Mind Map: Workflow for Trade Capture and Risk Controls
Example Scenario: Preventing a Trade Capture Error
- Situation: A trader accidentally enters 10,000 bushels of wheat instead of 1,000.
- Mitigation: The system’s validation rule flags the trade as an outlier compared to typical volumes.
- Action: The second trader receives an alert, reviews the trade, and corrects the quantity before confirmation.
- Outcome: Potential financial loss and settlement issues are avoided.
Summary
Mitigating operational risk in a high-volume agricultural commodities desk requires a combination of technology, process controls, and people-centric strategies. Automated systems with validation, standardized documentation, rigorous reconciliation, and continuous training form the backbone of a resilient operational risk framework. Embedding these best practices ensures smoother trade flows, reduces errors, and enhances overall risk management effectiveness.
7. Liquidity Risk and Market Impact Considerations
7.1 Understanding Liquidity Risk in Commodity Markets
Liquidity risk in commodity markets refers to the potential difficulty or inability to quickly buy or sell commodity positions without causing a significant impact on the price. This risk can lead to increased transaction costs, slippage, or even the inability to exit or enter positions at desired prices, which can severely affect profitability and risk exposure.
Key Dimensions of Liquidity Risk
- Market Liquidity: Availability of buyers and sellers in the market.
- Funding Liquidity: The trader’s ability to meet cash flow needs to maintain or close positions.
- Asset Liquidity: How easily a specific commodity or derivative can be converted to cash.
Mind Map: Components of Liquidity Risk
Factors Influencing Liquidity Risk in Commodity Markets
-
Commodity Type: Highly traded commodities like crude oil or gold tend to have better liquidity compared to niche or seasonal commodities like rare earth metals or specialty agricultural products.
-
Market Structure: Exchange-traded commodities generally offer higher liquidity than over-the-counter (OTC) contracts.
-
Contract Maturity: Near-term futures contracts usually have higher liquidity than long-dated contracts.
-
Market Conditions: Volatile or stressed markets can reduce liquidity as participants become risk-averse.
-
Regulatory Environment: Changes in regulations can impact market participation and liquidity.
Mind Map: Factors Affecting Liquidity Risk
Practical Example 1: Liquidity Risk in Crude Oil Futures
A trader holds a large position in the front-month WTI crude oil futures contract. Due to geopolitical tensions, volatility spikes and many market participants withdraw, reducing trading volumes. The bid-ask spread widens from 3 cents to 15 cents per barrel, increasing the cost to unwind the position. The trader faces liquidity risk as exiting the position quickly would incur significant slippage.
Practical Example 2: Low Liquidity in Specialty Agricultural Commodities
A commodity trader attempts to hedge exposure to a rare spice using OTC forward contracts. The market for this spice is thin, with few counterparties willing to trade. The trader finds it difficult to source counterparties at competitive prices and faces delays in executing trades, illustrating asset liquidity risk.
Best Practices to Understand and Monitor Liquidity Risk
- Regularly Monitor Market Indicators: Track bid-ask spreads, trading volumes, and order book depth.
- Stress Test Liquidity: Simulate scenarios with reduced market participation.
- Diversify Across Commodities and Instruments: Avoid concentration in illiquid assets.
- Maintain Adequate Funding: Ensure access to cash or credit lines to meet margin calls.
Mind Map: Best Practices for Managing Liquidity Risk
Understanding liquidity risk is critical for commodity traders and risk managers to avoid unexpected losses and ensure smooth execution of trading strategies. By recognizing the factors that influence liquidity and applying best practices, market participants can better navigate the complexities of commodity markets.
7.2 Measuring Market Impact and Slippage
In commodity trading, understanding and measuring market impact and slippage is critical for effective liquidity risk management. Both concepts relate to the costs incurred when executing trades, especially large orders, and can significantly affect profitability.
What is Market Impact?
Market impact refers to the change in the price of a commodity caused directly by the execution of a trade. Large buy orders tend to push prices up, while large sell orders push prices down. This price movement is a cost to the trader because it moves the execution price away from the initial market price.
What is Slippage?
Slippage is the difference between the expected price of a trade and the actual price at which the trade is executed. It can result from market impact, but also from other factors such as latency, order execution delays, or sudden market movements.
Mind Map: Components of Market Impact and Slippage
Types of Market Impact
- Temporary Impact: Price moves during order execution but reverts partially after completion.
- Permanent Impact: Lasting price change caused by the trade, reflecting new market information or liquidity depletion.
Measuring Market Impact
Pre-Trade Benchmarking
- Benchmark Price: The price before order execution, often the last traded price or mid-price.
- Traders compare execution prices against this benchmark to estimate impact.
Post-Trade Analysis
- Analyze price changes during and after trade execution.
- Separate temporary and permanent impact by observing price reversion patterns.
Volume Weighted Average Price (VWAP)
- VWAP is the average price weighted by volume over a trading period.
- Comparing execution price to VWAP helps assess market impact.
Implementation Shortfall
- Measures the difference between the decision price (when the trade was decided) and the final execution price.
- Captures both market impact and slippage costs.
Mind Map: Measurement Techniques
Practical Example: Measuring Market Impact and Slippage in Crude Oil Trading
Scenario: A trader wants to buy 50,000 barrels of crude oil futures. The current mid-price is $70.00 per barrel.
- Step 1: Benchmark price is set at $70.00.
- Step 2: The trader executes the order over 30 minutes.
- Step 3: The average execution price is $70.20.
- Step 4: VWAP for the 30-minute period is $70.10.
Calculations:
- Market Impact Estimate = Execution Price - Benchmark Price = $70.20 - $70.00 = $0.20 per barrel
- Slippage Estimate = Execution Price - VWAP = $70.20 - $70.10 = $0.10 per barrel
- Implementation Shortfall = Execution Price - Decision Price (assumed $70.00) = $0.20 per barrel
Interpretation:
- The trader paid $0.20 more per barrel than the initial price, partly due to market impact.
- Slippage of $0.10 indicates additional costs beyond market impact, possibly from execution delays or volatility.
Best Practices for Measuring Market Impact and Slippage
- Use multiple benchmarks (last price, mid-price, VWAP) for comprehensive analysis.
- Break down impact into temporary and permanent components to understand price dynamics.
- Regularly analyze historical trade data to identify patterns and optimize execution strategies.
- Employ algorithmic trading tools to minimize market impact by slicing orders intelligently.
Mind Map: Best Practices
Summary
Measuring market impact and slippage is essential for understanding the true cost of executing commodity trades. By applying robust measurement techniques and best practices, traders and risk managers can optimize execution strategies, reduce hidden costs, and improve overall trading performance.
7.3 Strategies to Manage Liquidity Risk in Large Commodity Positions
Liquidity risk is a critical concern for commodity traders holding large positions, as it can significantly impact the ability to enter or exit trades without causing substantial price movements or incurring excessive costs. Managing liquidity risk effectively ensures smoother execution, reduces market impact, and preserves portfolio value.
Key Strategies to Manage Liquidity Risk
Detailed Explanation and Examples
1. Position Sizing and Staggering
Large positions can overwhelm market liquidity if executed all at once. Breaking down trades into smaller lots and staggering execution over time helps mitigate price slippage.
Example: A trader holding 50,000 barrels of crude oil plans to sell. Instead of selling all at once, they execute 5,000-barrel lots over several hours or days, reducing the risk of pushing prices down sharply.
2. Use of Limit Orders and Algorithmic Trading
Limit orders allow traders to specify the worst acceptable price, preventing unfavorable fills. Algorithmic trading tools (e.g., VWAP, TWAP algorithms) automate order execution, slicing large orders into smaller pieces executed incrementally.
Example: Using a TWAP (Time-Weighted Average Price) algorithm, a trader sells a large natural gas position evenly over a trading day, minimizing market impact and achieving an average execution price close to the market average.
3. Diversification Across Markets and Instruments
Spreading exposure across related commodities or using derivatives with better liquidity can reduce the risk of illiquid markets.
Example: Instead of holding a large position solely in physical copper, a trader hedges part of the exposure using copper futures or options on a major exchange, which typically have higher liquidity.
4. Monitoring Market Depth and Order Book Dynamics
Understanding the current market depth helps traders decide when and how much to trade. Trading during periods of higher volume and tighter spreads reduces liquidity risk.
Example: A trader notices that soybean futures have deeper order books and tighter spreads during morning hours; they schedule large trades accordingly.
5. Utilizing OTC and Block Trades
OTC and block trades allow large transactions to be negotiated privately, avoiding public market impact.
Example: A metals trader arranges a block trade of 10,000 metric tons of aluminum with a counterparty off-exchange, preventing large price swings in the open market.
6. Establishing Relationships with Market Makers and Brokers
Strong relationships can provide access to liquidity pools and better execution.
Example: A trader works closely with multiple brokers to tap into their liquidity networks, enabling quicker fills on large orders.
7. Hedging with Proxy Instruments
When direct instruments are illiquid, correlated proxies can be used, though this introduces basis risk.
Example: A trader hedges a large position in a niche agricultural commodity by using futures on a more liquid related commodity, such as corn, while monitoring the correlation closely.
8. Dynamic Liquidity Risk Assessment
Liquidity conditions fluctuate with market volatility and external events. Continuous monitoring allows timely adjustments.
Example: During a geopolitical event causing volatility in oil markets, a trader reduces position size and slows execution to avoid exacerbated liquidity risk.
Mind Map Summary
Conclusion
Managing liquidity risk in large commodity positions requires a multifaceted approach combining careful trade execution, market intelligence, and strategic use of instruments and relationships. By applying these strategies, commodity traders and risk managers can minimize adverse market impact, reduce execution costs, and maintain portfolio stability even in challenging market conditions.
7.4 Best Practice: Using Limit Orders and Algorithmic Trading to Minimize Market Impact
In commodity trading, executing large orders can significantly move the market price against the trader, increasing costs and reducing profitability. Minimizing market impact is therefore a critical risk management practice. Two powerful tools to achieve this are limit orders and algorithmic trading.
Understanding Market Impact
Market impact occurs when the execution of a trade influences the price of the commodity, often pushing it in an unfavorable direction. This is especially pronounced in less liquid commodity markets or when trading large volumes.
Limit Orders: Control and Precision
A limit order specifies the maximum price to buy or minimum price to sell, ensuring the trader does not pay more or receive less than desired. Unlike market orders, limit orders do not guarantee immediate execution but help control market impact by avoiding aggressive price moves.
Advantages:
- Protects against adverse price movements
- Helps maintain price discipline
- Can be used to strategically enter or exit positions
Example: A trader wants to buy 10,000 barrels of crude oil but fears pushing the price up. Instead of placing a market order, the trader sets a limit order at the current best bid price. The order only executes if the market price reaches or improves upon this limit, avoiding paying a premium caused by market impact.
Algorithmic Trading: Smart Execution
Algorithmic trading uses computer programs to break large orders into smaller slices, executing them over time based on predefined strategies. This reduces visibility of the full order size and minimizes market impact.
Common Algorithmic Strategies:
- TWAP (Time-Weighted Average Price): Executes trades evenly over a specified time period.
- VWAP (Volume-Weighted Average Price): Executes trades in proportion to historical or real-time market volume.
- Iceberg Orders: Only a small portion of the total order is visible on the order book at any time.
Mind Map: Minimizing Market Impact
Practical Example: Using Algorithmic Trading for Natural Gas
A risk manager overseeing a large natural gas portfolio needs to sell 5 million MMBtu over a trading day. Executing this as a single market order would likely cause a sharp price drop. Instead, they deploy a VWAP algorithm that:
- Analyzes intraday volume patterns
- Schedules smaller sell orders aligned with high liquidity periods
- Adjusts dynamically based on real-time market conditions
Outcome: The execution price closely tracks the daily volume-weighted average price, minimizing market impact and slippage.
Combining Limit Orders and Algorithms
Many algorithmic trading platforms allow the use of limit orders within their execution logic, combining the benefits of price control and smart order slicing.
Example: An algorithm is programmed to execute a large copper purchase using limit orders set slightly above the current bid to capture liquidity without aggressively pushing prices higher. The algorithm adjusts limit prices dynamically based on market depth and volatility.
Summary of Best Practices
- Use limit orders to control execution price and avoid unfavorable slippage.
- Employ algorithmic trading to break large orders into smaller, less visible trades.
- Select execution algorithms (TWAP, VWAP, Iceberg) based on market conditions and liquidity.
- Monitor real-time market data to adjust strategies dynamically.
- Combine limit orders with algorithms for enhanced price control.
By integrating limit orders and algorithmic trading into your execution strategy, commodity traders and risk managers can significantly reduce market impact, lower transaction costs, and improve overall trading performance.
7.5 Practical Example: Managing Liquidity Risk in a Bulk Energy Commodity Portfolio
Liquidity risk is a critical concern for traders managing large energy commodity portfolios, such as crude oil, natural gas, and coal. This example illustrates how a commodity trader and risk manager can identify, measure, and mitigate liquidity risk effectively.
Understanding Liquidity Risk in Bulk Energy Commodities
Liquidity risk arises when a trader cannot execute large transactions quickly without significantly impacting the market price or when the market depth is insufficient.
Key Challenges:
- Large position sizes relative to market volume
- Market volatility causing sudden drops in liquidity
- Concentration in less liquid contract months or regional hubs
Step 1: Assessing Liquidity Risk
The first step is to analyze the liquidity profile of each commodity and contract in the portfolio.
Mind Map: Assessing Liquidity Risk
Example:
- Portfolio holds 50,000 barrels of crude oil futures for delivery in 3 months.
- ADV for this contract is 100,000 barrels.
- Bid-ask spread is $0.05 per barrel.
The trader notes that selling the entire position in one go could widen the spread and move the market price adversely.
Step 2: Measuring Market Impact and Slippage
Market impact is the price movement caused by executing large orders.
Best Practice: Use historical trade data to estimate slippage and market impact curves.
Mind Map: Measuring Market Impact
Example:
- Historical data shows that selling 20% of ADV causes a 0.1% price drop.
- For 50,000 barrels, 20% ADV = 20,000 barrels.
- Selling 50,000 barrels at once could cause a 0.25% price drop.
Step 3: Developing Execution Strategies to Mitigate Liquidity Risk
To minimize market impact, the trader can split orders, use limit orders, or employ algorithmic trading.
Mind Map: Execution Strategies
Example:
- The trader decides to execute the 50,000 barrel sell order over 5 days using a VWAP algorithm.
- This approach aligns sales with market volume, reducing price impact.
Step 4: Monitoring and Adjusting in Real-Time
Continuous monitoring of market liquidity and execution performance is essential.
Mind Map: Real-Time Monitoring
Example:
- On day 3, an unexpected geopolitical event increases volatility and reduces liquidity.
- The trader pauses the algorithmic execution to avoid excessive slippage.
- Resumes once liquidity normalizes.
Step 5: Post-Trade Analysis and Reporting
After execution, analyze actual market impact and refine future strategies.
Mind Map: Post-Trade Analysis
Example:
- The trader compares the average execution price to the VWAP benchmark.
- Finds that the strategy reduced slippage by 40% compared to a single large order.
Summary Table: Managing Liquidity Risk in Bulk Energy Portfolios
| Step | Action | Example Outcome |
|---|---|---|
| 1. Assess Liquidity Risk | Analyze ADV, bid-ask spreads, position size | Identified risk of price impact on large crude oil position |
| 2. Measure Market Impact | Estimate slippage from historical data | Estimated 0.25% price drop if sold at once |
| 3. Execution Strategy | Use VWAP algorithm to split orders | Reduced market impact by spreading sales over 5 days |
| 4. Real-Time Monitoring | Adjust execution based on market conditions | Paused trades during volatility spike to avoid losses |
| 5. Post-Trade Analysis | Evaluate performance and refine approach | Achieved 40% reduction in slippage vs single order |
Final Best Practices for Liquidity Risk Management
- Always benchmark position size against market liquidity.
- Use algorithmic execution to minimize market impact.
- Monitor markets continuously and be ready to adapt.
- Maintain clear communication between traders, risk managers, and brokers.
- Conduct thorough post-trade reviews to improve future executions.
This practical example demonstrates how integrating quantitative analysis, strategic execution, and real-time monitoring can effectively manage liquidity risk in bulk energy commodity portfolios.
8. Portfolio Risk Management and Optimization
8.1 Diversification and Correlation Analysis Across Commodity Classes
Effective portfolio risk management in commodity trading hinges on understanding diversification and correlation across different commodity classes. Diversification reduces unsystematic risk by spreading exposure across assets that do not move perfectly in sync. Correlation analysis quantifies the degree to which commodity prices move relative to each other, enabling traders and risk managers to construct portfolios that balance risk and return.
What is Diversification?
Diversification is the practice of allocating capital among various commodities to reduce overall portfolio risk. By investing in commodities with low or negative correlations, losses in one asset may be offset by gains or stability in another.
Key Benefits:
- Reduces volatility of portfolio returns
- Mitigates impact of adverse price movements in any single commodity
- Enhances risk-adjusted returns
Understanding Correlation
Correlation measures the strength and direction of a linear relationship between two commodity price returns. It ranges from -1 to +1:
- +1: Perfect positive correlation (prices move together)
- 0: No correlation (prices move independently)
- -1: Perfect negative correlation (prices move in opposite directions)
Correlation helps identify which commodities can provide diversification benefits when combined.
Mind Map: Diversification and Correlation Concepts
Correlation Matrix Example
A correlation matrix helps visualize relationships between commodities. Below is a simplified example of monthly return correlations among select commodities:
| Commodity | Crude Oil | Natural Gas | Gold | Copper | Wheat |
|---|---|---|---|---|---|
| Crude Oil | 1.00 | 0.65 | -0.10 | 0.45 | 0.20 |
| Natural Gas | 0.65 | 1.00 | -0.05 | 0.30 | 0.10 |
| Gold | -0.10 | -0.05 | 1.00 | 0.15 | 0.00 |
| Copper | 0.45 | 0.30 | 0.15 | 1.00 | 0.25 |
| Wheat | 0.20 | 0.10 | 0.00 | 0.25 | 1.00 |
Interpretation:
- Crude Oil and Natural Gas have a strong positive correlation (0.65), indicating similar market drivers.
- Gold shows near zero or slightly negative correlation with energy commodities, suggesting diversification potential.
- Agricultural commodities like Wheat have low correlations with metals and energy, enhancing diversification.
Practical Example: Building a Diversified Commodity Portfolio
Scenario: A commodity trader wants to reduce portfolio volatility by combining commodities.
- Initial Portfolio: 100% exposure to Crude Oil.
- Step 1: Add Gold (negatively correlated with Crude Oil).
- Step 2: Add Wheat (low correlation with both Crude Oil and Gold).
Outcome:
- The portfolio’s overall volatility decreases.
- Losses in Crude Oil during market downturns may be offset by gains or stability in Gold and Wheat.
Mind Map: Portfolio Construction Using Correlation
Best Practice Tips:
- Regularly update correlation matrices as relationships between commodities can change over time.
- Use rolling correlation windows (e.g., 6-month, 12-month) to capture dynamic relationships.
- Combine fundamental analysis with statistical correlation to understand drivers behind relationships.
- Consider macroeconomic factors (e.g., geopolitical events, weather) that may impact correlations.
Summary
Diversification and correlation analysis are foundational to advanced commodity portfolio risk management. By understanding how different commodity classes interact, traders and risk managers can construct portfolios that optimize risk-adjusted returns and reduce vulnerability to market shocks.
8.2 Portfolio Construction Techniques for Risk-Adjusted Returns
Constructing a commodity portfolio that maximizes risk-adjusted returns is a critical skill for commodity traders and risk managers. This involves balancing expected returns against the risks inherent in commodity markets, which are often volatile and influenced by multiple factors such as geopolitical events, weather, and supply-demand imbalances.
Key Concepts in Portfolio Construction
- Risk-Adjusted Return: Measures like the Sharpe Ratio, Sortino Ratio, and Information Ratio help evaluate returns relative to the risk taken.
- Diversification: Spreading investments across different commodities or instruments to reduce unsystematic risk.
- Correlation: Understanding how commodity prices move relative to each other to optimize diversification.
- Volatility: The degree of variation in commodity prices, used as a proxy for risk.
Step-by-Step Portfolio Construction Process
-
Define Investment Objectives and Constraints
- Risk tolerance
- Investment horizon
- Liquidity needs
- Regulatory or policy constraints
-
Select Commodities and Instruments
- Choose commodities based on market outlook and liquidity
- Select instruments (spot, futures, options) suitable for hedging or speculation
-
Estimate Expected Returns and Risks
- Use historical data, fundamental analysis, and quantitative models
- Calculate expected returns, volatilities, and correlations
-
Optimize Portfolio Allocation
- Apply portfolio optimization techniques to maximize risk-adjusted returns
- Incorporate constraints such as position limits or sector caps
-
Implement and Monitor
- Execute trades according to the optimized allocation
- Continuously monitor performance and risk metrics
Mind Map: Portfolio Construction Techniques
Portfolio Optimization Techniques Explained
Mean-Variance Optimization (MVO)
- Developed by Harry Markowitz, MVO seeks to find the portfolio weights that minimize portfolio variance for a given expected return.
- Inputs: Expected returns, covariance matrix of commodity returns.
- Output: Optimal allocation across commodities.
Example:
Suppose you have three commodities: Crude Oil, Gold, and Corn.
| Commodity | Expected Return | Volatility |
|---|---|---|
| Crude Oil | 8% | 25% |
| Gold | 5% | 15% |
| Corn | 6% | 20% |
Correlation matrix:
| Crude Oil | Gold | Corn | |
|---|---|---|---|
| Crude Oil | 1 | 0.3 | 0.4 |
| Gold | 0.3 | 1 | 0.2 |
| Corn | 0.4 | 0.2 | 1 |
Using MVO, you can compute the portfolio weights that maximize return for a target volatility or minimize volatility for a target return.
Risk Parity
- Allocates capital so that each commodity contributes equally to the overall portfolio risk.
- Useful when commodities have very different volatilities.
Example:
If Crude Oil is highly volatile and Gold less so, risk parity will allocate more capital to Gold to equalize risk contributions.
Black-Litterman Model
- Combines market equilibrium returns with investor views to generate adjusted expected returns.
- Useful when incorporating subjective views or forecasts.
Practical Example: Constructing a Multi-Commodity Portfolio
Scenario: A trader wants to build a portfolio with Energy (Crude Oil, Natural Gas), Metals (Gold, Copper), and Agriculture (Corn, Soybean) commodities.
Step 1: Gather historical monthly returns for the past 5 years.
Step 2: Calculate expected returns, volatilities, and correlations.
Step 3: Use Mean-Variance Optimization to find weights that maximize the Sharpe Ratio.
Step 4: Apply constraints such as no single commodity exceeding 30% allocation.
Step 5: Backtest the portfolio to evaluate risk-adjusted performance.
Result: The optimized portfolio might allocate 25% to Crude Oil, 20% to Gold, 15% to Natural Gas, 15% to Copper, 15% to Corn, and 10% to Soybean, achieving a Sharpe Ratio higher than any single commodity.
Best Practices
- Regularly update input data to reflect changing market conditions.
- Incorporate stress testing and scenario analysis to understand portfolio behavior under extreme events.
- Use a combination of quantitative models and fundamental insights.
- Monitor correlations as they can change significantly during market turmoil.
- Maintain flexibility to rebalance portfolio allocations as risk-return profiles evolve.
Summary
Portfolio construction for risk-adjusted returns in commodity trading requires a disciplined approach combining data analysis, optimization techniques, and practical constraints. By leveraging diversification, understanding correlations, and applying robust optimization models, traders and risk managers can build portfolios that better withstand market volatility while targeting attractive returns.
8.3 Using Derivatives for Portfolio Risk Optimization
Optimizing a commodity portfolio involves balancing expected returns against the risks inherent in the portfolio’s composition. Derivatives are powerful tools that allow traders and risk managers to fine-tune portfolio risk exposures, hedge unwanted risks, and enhance risk-adjusted returns. This section explores how derivatives can be strategically used for portfolio risk optimization, supported by clear examples and mind maps to visualize the concepts.
Understanding Portfolio Risk Optimization with Derivatives
Portfolio risk optimization aims to minimize risk for a given level of expected return or maximize return for a given level of risk. Derivatives such as futures, options, and swaps provide flexibility to adjust exposures without necessarily buying or selling the underlying physical commodities.
Key benefits of using derivatives for portfolio optimization:
- Cost Efficiency: Derivatives often require less capital than physical holdings.
- Flexibility: Ability to quickly adjust exposures to changing market conditions.
- Leverage: Amplify portfolio adjustments with smaller upfront investment.
- Risk Control: Target specific risk factors like price volatility, basis risk, or correlation risk.
Mind Map: Using Derivatives in Portfolio Risk Optimization
Step-by-Step Approach to Using Derivatives for Optimization
-
Analyze Portfolio Risk Profile:
- Identify key risk drivers (commodity price movements, volatility, correlation).
- Quantify exposures using metrics like Value at Risk (VaR), beta, or sensitivities.
-
Set Optimization Objectives:
- Define acceptable risk levels or target returns.
- Determine constraints such as liquidity, capital, or regulatory limits.
-
Select Appropriate Derivative Instruments:
- Use futures to adjust directional price exposure.
- Use options to manage volatility or create protective floors/ceilings.
- Use swaps to customize exposure to specific risk factors.
-
Construct Hedging or Overlay Strategies:
- Design static or dynamic hedges.
- Consider cross-commodity hedges if direct instruments are unavailable.
-
Simulate and Backtest:
- Model portfolio performance with derivatives overlays.
- Evaluate risk reduction and cost implications.
-
Implement and Monitor:
- Execute trades with attention to market impact.
- Continuously monitor and adjust based on market changes.
Practical Example 1: Hedging a Multi-Commodity Portfolio with Futures
Scenario: A commodity trader holds a portfolio consisting of 40% crude oil, 30% natural gas, and 30% copper. The trader wants to reduce overall portfolio volatility without liquidating physical positions.
Approach:
- Use futures contracts on each commodity to reduce directional price risk.
- Calculate portfolio beta to each commodity’s futures price.
- Short futures contracts proportional to the beta to neutralize price exposure.
Result:
- Portfolio volatility reduced by 25%.
- Cost of futures margin is significantly lower than liquidating physical inventory.
Mind Map: Futures-Based Portfolio Hedging
Practical Example 2: Using Options to Manage Volatility Risk
Scenario: A risk manager is concerned about sudden spikes in volatility for agricultural commodities (corn and soybeans) during planting season.
Approach:
- Purchase put options on corn and soybean futures to protect against downside price moves.
- Use call options to maintain upside participation.
- Construct a collar strategy to limit cost.
Result:
- Portfolio downside risk is capped.
- Upside potential remains intact.
- Cost of options is offset by premium received from selling calls.
Mind Map: Options-Based Volatility Management
Practical Example 3: Using Swaps to Manage Basis Risk
Scenario: A metals trader faces basis risk between physical aluminum prices and aluminum futures prices used for hedging.
Approach:
- Enter into a basis swap that exchanges the difference between physical aluminum spot prices and futures prices.
- This swap offsets the basis risk that futures alone cannot hedge.
Result:
- Basis risk is significantly reduced.
- Overall hedge effectiveness improves.
Summary
Using derivatives for portfolio risk optimization allows commodity traders and risk managers to tailor risk exposures precisely, reduce unwanted volatility, and improve capital efficiency. By combining futures, options, and swaps thoughtfully, portfolios can be dynamically managed to adapt to evolving market conditions and risk appetites.
Remember: Successful portfolio risk optimization requires continuous monitoring, robust analytics, and a clear understanding of the interplay between physical and derivative positions.
8.4 Best Practice: Applying Mean-Variance Optimization to a Multi-Commodity Portfolio
Mean-Variance Optimization (MVO) is a cornerstone technique in portfolio risk management, originally developed by Harry Markowitz. It helps commodity traders and risk managers construct portfolios that maximize expected return for a given level of risk or minimize risk for a given expected return. When applied to multi-commodity portfolios, MVO enables effective diversification and risk-adjusted performance enhancement.
What is Mean-Variance Optimization?
- Mean (Expected Return): The average return expected from the portfolio based on historical or forecasted commodity prices.
- Variance (Risk): The variability or volatility of portfolio returns, representing risk.
The goal is to find the optimal weights of commodities in the portfolio that achieve the best trade-off between return and risk.
Why Use MVO in Commodity Trading?
- Commodities often exhibit different risk-return profiles and correlations.
- MVO helps identify diversification benefits by combining commodities with low or negative correlations.
- It supports strategic hedging decisions by quantifying portfolio risk.
Step-by-Step Process to Apply MVO
Mind Map: Mean-Variance Optimization Process
Example: Optimizing a Portfolio of Crude Oil, Natural Gas, and Gold
Step 1: Collect Data
-
Historical monthly returns for the last 3 years:
- Crude Oil: Mean return 2.5%, Std Dev 15%
- Natural Gas: Mean return 3.0%, Std Dev 25%
- Gold: Mean return 1.2%, Std Dev 10%
-
Correlation matrix:
| Crude Oil | Natural Gas | Gold | |
|---|---|---|---|
| Crude Oil | 1.0 | 0.6 | 0.2 |
| Natural Gas | 0.6 | 1.0 | 0.1 |
| Gold | 0.2 | 0.1 | 1.0 |
Step 2: Define Constraints
- Weights sum to 1
- No short selling (weights >= 0)
Step 3: Run Optimization
- Objective: Minimize portfolio variance for target return of 2.0%
Step 4: Results
-
Optimal weights:
- Crude Oil: 40%
- Natural Gas: 30%
- Gold: 30%
-
Portfolio expected return: ~2.0%
-
Portfolio standard deviation: ~11.5% (reduced from individual commodity volatilities)
Mind Map: Benefits of MVO in Commodity Portfolios
Practical Tips and Best Practices
- Use robust and recent data: Commodity markets can be volatile; ensure data reflects current market conditions.
- Incorporate transaction costs and liquidity constraints: These impact real-world portfolio adjustments.
- Regularly rebalance: Commodity correlations and volatilities change over time.
- Stress test portfolios: Evaluate performance under extreme market scenarios.
- Combine with qualitative insights: Market fundamentals and geopolitical factors should complement quantitative models.
Summary
Applying Mean-Variance Optimization to multi-commodity portfolios empowers traders and risk managers to systematically balance risk and return. By leveraging historical data, correlation structures, and optimization techniques, portfolios can be constructed to enhance diversification benefits and improve risk-adjusted performance.
This best practice is essential for sophisticated commodity trading operations aiming for sustainable profitability and risk control.
8.5 Practical Example: Hedging a Diversified Commodity Basket with Index Futures
In commodity trading, managing risk across a diversified basket of commodities can be complex due to varying price behaviors, correlations, and liquidity profiles. Hedging with individual futures contracts for each commodity can be costly and operationally intensive. An effective alternative is to use commodity index futures, which represent a weighted basket of multiple commodities, allowing traders to hedge overall market exposure efficiently.
Understanding the Commodity Basket and Index Futures
A diversified commodity basket might include commodities such as crude oil, natural gas, gold, copper, wheat, and corn. Each commodity has its own price dynamics, but the overall basket exposure reflects the combined market risk.
Commodity Basket Example:
- Crude Oil: 30%
- Natural Gas: 20%
- Gold: 15%
- Copper: 15%
- Wheat: 10%
- Corn: 10%
Commodity Index Futures:
Examples include the Bloomberg Commodity Index (BCOM) futures or S&P GSCI futures, which track a broad range of commodities with specific weightings.
Step 1: Assess Portfolio Exposure
Calculate the total market value and exposure of each commodity in the basket.
| Commodity | Quantity | Price per Unit | Market Value | Portfolio Weight |
|---|---|---|---|---|
| Crude Oil | 10,000 bbl | $70 | $700,000 | 30% |
| Natural Gas | 50,000 mmbtu | $3 | $150,000 | 20% |
| Gold | 100 oz | $1,800 | $180,000 | 15% |
| Copper | 50,000 lbs | $4 | $200,000 | 15% |
| Wheat | 200,000 bushels | $5 | $1,000,000 | 10% |
| Corn | 300,000 bushels | $4 | $1,200,000 | 10% |
Note: The weights here are illustrative and may differ from index weights.
Step 2: Identify the Appropriate Index Future
Choose an index future that closely matches the commodity basket’s composition. For example, the Bloomberg Commodity Index (BCOM) futures include energy, metals, and agriculture sectors.
Index Composition Example (Simplified):
- Energy: 40%
- Metals: 30%
- Agriculture: 30%
Step 3: Calculate Hedge Ratio
The hedge ratio determines how many index futures contracts are needed to offset the portfolio risk.
Formula:
\[ \text{Hedge Ratio} = \frac{\text{Portfolio Value}}{\text{Index Futures Contract Value}} \times \text{Beta Adjustment} \]
- Portfolio Value: Sum of market values of all commodities
- Index Futures Contract Value: Index level × contract multiplier
- Beta Adjustment: Correlation factor between portfolio returns and index returns
Example:
- Portfolio Value = $3,430,000
- Index Futures Price = 85 (index points)
- Contract Multiplier = $1000 per index point
- Contract Value = 85 × $1000 = $85,000
- Beta (correlation) = 0.9 (since portfolio is diversified but not perfectly correlated)
\[ \text{Hedge Ratio} = \frac{3,430,000}{85,000} \times 0.9 = 40.7 \approx 41 \text{ contracts} \]
Step 4: Execute the Hedge
Sell 41 index futures contracts to hedge the portfolio’s market risk. This position will gain value if the commodity prices fall, offsetting losses in the physical portfolio.
Step 5: Monitor and Adjust the Hedge
Because the portfolio composition and index weights may diverge over time, continuous monitoring is essential. Adjust the hedge ratio based on:
- Changes in portfolio composition or value
- Changes in index futures price and contract specifications
- Shifts in correlation (beta) between portfolio and index
Mind Map: Hedging a Diversified Commodity Basket with Index Futures
Additional Example: Partial Hedge Using Index Futures
Suppose a trader wants to hedge only the energy portion (crude oil + natural gas) of the portfolio using an energy-focused index future.
- Energy portfolio value = $700,000 (crude oil) + $150,000 (natural gas) = $850,000
- Energy index future price = 60 points
- Contract multiplier = $1000
- Contract value = $60,000
- Beta = 0.95
Hedge ratio = (850,000 / 60,000) × 0.95 = 13.45 ≈ 13 contracts
The trader sells 13 energy index futures contracts to hedge the energy exposure only, while managing metals and agriculture separately.
Best Practices Summary
- Align Index Selection: Choose an index future that closely matches your portfolio’s commodity mix to minimize basis risk.
- Calculate Beta: Use historical price data to estimate correlation between your portfolio and the index for accurate hedge sizing.
- Regular Rebalancing: Commodity prices and portfolio weights fluctuate; adjust hedge positions accordingly.
- Understand Contract Specifications: Be aware of contract size, expiration, and margin requirements.
- Monitor Basis Risk: The difference between portfolio returns and index futures returns can cause residual risk.
By leveraging index futures, commodity traders and risk managers can efficiently hedge diversified portfolios, reduce transaction costs, and streamline risk management processes while maintaining flexibility to adjust for changing market conditions.
9. Emerging Trends and Technologies in Commodity Risk Management
9.1 Role of Artificial Intelligence and Machine Learning in Risk Analytics
Artificial Intelligence (AI) and Machine Learning (ML) have revolutionized risk analytics in commodity trading by enabling more accurate, timely, and comprehensive risk assessments. These technologies help traders and risk managers process vast datasets, identify hidden patterns, predict market movements, and automate decision-making processes.
Key Applications of AI and ML in Commodity Risk Analytics
- Price Forecasting: ML models analyze historical price data, supply-demand factors, and macroeconomic indicators to predict future commodity prices.
- Volatility Prediction: AI algorithms estimate price volatility, crucial for option pricing and risk measurement.
- Credit Risk Assessment: Machine learning models evaluate counterparty creditworthiness by analyzing transaction histories and external data.
- Fraud Detection and Anomaly Identification: AI systems detect unusual trading patterns or operational errors that may indicate fraud or risk events.
- Portfolio Optimization: ML techniques optimize commodity portfolios by balancing risk and return based on dynamic market conditions.
Mind Map: AI and ML Applications in Commodity Risk Analytics
Best Practices for Implementing AI and ML in Risk Analytics
- Data Quality and Integration: Ensure comprehensive, clean, and timely data from multiple sources (market data, news, social media, internal systems).
- Model Selection and Validation: Choose appropriate ML models (e.g., Random Forest, Gradient Boosting, Neural Networks) and rigorously validate them with backtesting.
- Explainability: Use interpretable AI techniques to understand model decisions, essential for regulatory compliance and stakeholder trust.
- Continuous Learning: Regularly retrain models with new data to adapt to changing market conditions.
- Cross-Functional Collaboration: Engage traders, risk managers, data scientists, and IT teams to align AI initiatives with business goals.
Practical Example 1: Using ML for Crude Oil Price Forecasting
A commodity trading firm implemented a Gradient Boosting Machine (GBM) model to forecast crude oil prices 1 month ahead. The model incorporated:
- Historical daily prices over 10 years
- Global inventory levels
- Geopolitical event indicators
- Macroeconomic variables like USD index and interest rates
Outcome: The model reduced forecasting error by 15% compared to traditional time-series models, enabling better hedging decisions and improved risk-adjusted returns.
Practical Example 2: AI-Based Volatility Prediction for Agricultural Commodities
An agricultural commodities desk used a Long Short-Term Memory (LSTM) neural network to predict daily volatility of corn futures. Inputs included:
- Historical price and volume data
- Weather forecasts
- Market news sentiment analysis
Outcome: The AI-driven volatility estimates improved option pricing accuracy and helped optimize hedge ratios, reducing unexpected losses during volatile periods.
Mind Map: Workflow for AI-Driven Risk Analytics Implementation
Challenges and Considerations
- Data Privacy and Security: Handling sensitive trading and counterparty data requires strict controls.
- Model Risk: Overfitting or model bias can lead to misleading risk assessments.
- Regulatory Compliance: AI models must comply with financial regulations and be auditable.
- Human Oversight: AI should augment, not replace, expert judgment in risk decisions.
Summary
AI and ML are powerful tools that enhance commodity trading risk analytics by enabling predictive insights, automation, and improved decision-making. By following best practices and addressing challenges, commodity traders and risk managers can leverage these technologies to build more resilient and adaptive risk management frameworks.
9.2 Blockchain and Smart Contracts for Commodity Trading Transparency
Introduction
Blockchain technology and smart contracts are revolutionizing commodity trading by enhancing transparency, reducing settlement times, and minimizing fraud risks. This section explores how these technologies are applied in commodity markets, their benefits, challenges, and practical examples demonstrating their impact.
What is Blockchain?
Blockchain is a decentralized, immutable ledger technology that records transactions across a network of computers, ensuring transparency and security without a central authority.
What are Smart Contracts?
Smart contracts are self-executing contracts with the terms directly written into code. They automatically enforce and execute contractual clauses when predefined conditions are met.
Mind Map: Blockchain and Smart Contracts in Commodity Trading
Benefits of Blockchain and Smart Contracts in Commodity Trading
-
Enhanced Transparency: Every transaction is recorded on a shared ledger visible to authorized participants, reducing information asymmetry.
-
Improved Traceability: Blockchain enables end-to-end tracking of commodities from origin to delivery, ensuring provenance and quality.
-
Faster Settlement: Smart contracts automate payments and delivery confirmations, reducing settlement cycles from days to minutes.
-
Reduced Counterparty Risk: Automated enforcement of contract terms minimizes disputes and defaults.
-
Lower Costs: By reducing intermediaries and manual processes, operational costs decrease.
Practical Example 1: Using Blockchain for Coffee Supply Chain Transparency
A coffee trading company implements a blockchain platform to track coffee beans from farmers to roasters. Each batch is assigned a digital token representing its origin, quality certifications, and shipment status.
-
Process:
- Farmer records harvest details on blockchain.
- Transporter updates shipment status.
- Roaster confirms receipt and quality.
- Smart contract releases payment automatically upon delivery confirmation.
-
Outcome:
- Buyers verify authenticity and ethical sourcing.
- Reduced paperwork and faster payments.
Mind Map: Coffee Supply Chain on Blockchain
Practical Example 2: Smart Contracts for Crude Oil Futures Settlement
A trading firm uses smart contracts to automate settlement of crude oil futures contracts:
-
Contract Terms Encoded: Delivery date, quantity, price, and penalties.
-
Execution: On delivery confirmation, the smart contract automatically triggers payment transfer and updates ownership records.
-
Benefits:
- Eliminates manual reconciliation.
- Reduces settlement risk.
- Increases operational efficiency.
Challenges and Considerations
-
Scalability: Blockchain networks may face performance bottlenecks with high transaction volumes.
-
Integration: Legacy trading and risk management systems require adaptation to interface with blockchain platforms.
-
Regulatory Compliance: Legal frameworks for blockchain-based contracts are evolving and vary by jurisdiction.
-
Data Privacy: Balancing transparency with confidentiality is critical, especially for sensitive commercial data.
Best Practices for Implementation
- Start with pilot projects focusing on specific trade processes.
- Collaborate with industry consortia to develop standards.
- Ensure legal review of smart contract enforceability.
- Incorporate robust identity and access management.
- Plan for integration with existing risk management and trading systems.
Summary
Blockchain and smart contracts offer transformative potential for commodity trading transparency and efficiency. By enabling immutable records and automated contract execution, they reduce risks and costs while enhancing trust among market participants. However, successful adoption requires careful planning, technology integration, and regulatory alignment.
Additional Mind Map: Implementation Roadmap
9.3 Environmental, Social, and Governance (ESG) Risks in Commodity Trading
Environmental, Social, and Governance (ESG) risks have become increasingly critical factors in commodity trading. These risks not only affect the sustainability and ethical footprint of trading activities but also have direct financial and reputational impacts. Understanding and managing ESG risks is essential for commodity traders and risk managers aiming to align with global standards and stakeholder expectations.
What are ESG Risks in Commodity Trading?
- Environmental Risks: Related to the impact of commodity extraction, production, and transportation on natural resources, climate change, pollution, and biodiversity.
- Social Risks: Concerns about labor practices, community relations, human rights, and health and safety in commodity supply chains.
- Governance Risks: Issues involving corporate governance, transparency, regulatory compliance, corruption, and ethical business conduct.
Mind Map: ESG Risks in Commodity Trading
Why ESG Risks Matter in Commodity Trading
- Financial Impact: ESG risks can lead to fines, sanctions, and loss of market access.
- Reputational Damage: Negative publicity can affect relationships with customers, investors, and regulators.
- Regulatory Pressure: Increasing global regulations require adherence to ESG standards.
- Investor Demand: Growing preference for ESG-compliant investments influences commodity market dynamics.
Best Practices for Managing ESG Risks
- Integrate ESG Criteria into Risk Frameworks: Embed ESG risk assessment into existing risk management processes.
- Due Diligence and Supplier Audits: Conduct thorough ESG due diligence on suppliers and counterparties.
- Use ESG Data and Ratings: Leverage third-party ESG ratings and data analytics to monitor exposures.
- Engage Stakeholders: Maintain open communication with communities, regulators, and investors.
- Develop ESG Policies and Training: Establish clear policies and train staff on ESG risk awareness.
Practical Example: Managing ESG Risks in Palm Oil Trading
Palm oil trading is often scrutinized for deforestation and social issues. A commodity trader implements the following steps:
- Environmental: Uses satellite data to verify suppliers do not engage in illegal deforestation.
- Social: Requires suppliers to comply with fair labor practices and community engagement standards.
- Governance: Enforces transparency by mandating regular ESG reporting and third-party audits.
This approach reduces exposure to ESG-related controversies and aligns with sustainable sourcing commitments.
Mind Map: ESG Risk Management Workflow
Example: ESG Risk Incident and Response in Mining Commodities
A mining commodity trader discovers that one of its suppliers is involved in unsafe working conditions leading to accidents. The trader:
- Immediately suspends new purchases from the supplier.
- Initiates an independent audit to verify conditions.
- Collaborates with the supplier to improve safety standards.
- Communicates transparently with investors about the issue and remediation plan.
This proactive response mitigates reputational damage and aligns with governance best practices.
Conclusion
ESG risks are integral to modern commodity trading risk management. By embedding ESG considerations into trading strategies, risk managers can protect financial performance, enhance reputation, and contribute to sustainable global commodity markets.
Key Takeaway:
Effective ESG risk management requires a holistic approach combining data-driven analysis, stakeholder engagement, and continuous monitoring to navigate the evolving landscape of environmental, social, and governance challenges in commodity trading.
9.4 Best Practice: Leveraging Technology to Enhance Real-Time Risk Monitoring
In today’s fast-paced commodity markets, the ability to monitor risk in real time is crucial for effective decision-making and loss prevention. Leveraging advanced technology solutions enables commodity traders and risk managers to gain immediate insights, automate risk controls, and respond swiftly to market changes.
Key Components of Real-Time Risk Monitoring Technology
Real-Time Risk Monitoring Technology Mind Map
Best Practices for Implementing Real-Time Risk Monitoring
-
Integrate Multiple Data Sources Seamlessly
- Combine market prices, trade positions, and counterparty credit data in a unified platform.
- Example: A natural gas trading desk integrates live market prices with internal position data to calculate intraday exposure.
-
Use Advanced Analytics for Instant Risk Metrics
- Implement real-time VaR and Greeks calculations to understand risk sensitivities as markets move.
- Example: An aluminum trader monitors delta and gamma exposure continuously to adjust hedges dynamically.
-
Automate Alerts and Limit Breaches
- Set up automated alerts triggered by risk limit breaches or unusual market movements.
- Example: When crude oil exposure exceeds predefined limits, an automated alert notifies the risk manager and trading desk immediately.
-
Deploy Interactive Dashboards for Visualization
- Use dashboards that update in real time with drill-down capabilities for detailed analysis.
- Example: A dashboard shows portfolio risk by commodity, counterparty, and geography with color-coded risk levels.
-
Leverage Cloud and Scalable Infrastructure
- Utilize cloud computing for scalable processing power and low-latency data handling.
- Example: A commodity trading firm uses cloud-based analytics to run complex Monte Carlo simulations within seconds.
-
Ensure Robust Security and Compliance
- Implement encryption, access controls, and audit trails to protect sensitive data and meet regulatory requirements.
Example: Real-Time Risk Monitoring in Action
Scenario: A copper trading desk faces sudden market volatility due to geopolitical events.
- The system ingests live copper futures prices and updates the trader’s position exposure every second.
- Real-time VaR spikes beyond the risk limit, triggering an automated alert.
- The dashboard highlights the increased risk with red indicators.
- The risk manager reviews the scenario analysis generated by the system, showing potential losses under stressed conditions.
- Based on these insights, the trader executes offsetting futures contracts to reduce exposure.
- The system confirms the new risk metrics are back within limits, and the alert clears.
This seamless flow from data ingestion to action exemplifies how technology enhances risk responsiveness.
Mind Map: Workflow of Real-Time Risk Monitoring
Additional Example: Using Machine Learning for Anomaly Detection
Some firms integrate machine learning algorithms into their real-time risk monitoring to detect unusual trading patterns or market behaviors that traditional models might miss.
- Example: An agricultural commodity trader uses an ML model trained on historical price and volume data to flag atypical price spikes.
- When the model detects an anomaly, it automatically alerts the risk team to investigate potential market manipulation or operational errors.
Summary
Leveraging technology for real-time risk monitoring empowers commodity traders and risk managers to:
- Detect and respond to risk exposures instantly
- Automate routine risk controls and reporting
- Enhance transparency and decision-making
- Maintain compliance with evolving regulatory standards
By adopting integrated platforms, advanced analytics, and automation, firms can build resilient risk management frameworks that keep pace with the dynamic commodity markets.
9.5 Practical Example: Using AI-Based Models to Predict Price Volatility in Agricultural Commodities
In this section, we explore how artificial intelligence (AI) can be harnessed to predict price volatility in agricultural commodities such as corn, wheat, and soybeans. Accurate volatility forecasts enable commodity traders and risk managers to optimize hedging strategies, manage risk exposure, and improve decision-making.
Understanding Price Volatility in Agricultural Commodities
Agricultural commodity prices are influenced by multiple factors including weather conditions, geopolitical events, supply-demand imbalances, and macroeconomic indicators. Volatility reflects the degree of variation in price over time and is a critical input for risk management and derivatives pricing.
Why Use AI for Volatility Prediction?
Traditional volatility models like GARCH or historical volatility calculations have limitations in capturing complex nonlinear relationships and sudden regime shifts. AI models, especially machine learning and deep learning techniques, can analyze vast datasets and uncover hidden patterns to improve volatility forecasts.
Step-by-Step AI-Based Volatility Prediction Workflow
Example Dataset Description
- Historical Prices: Daily closing prices of corn futures over 5 years.
- Weather Data: Temperature, rainfall, drought indices for major corn-producing regions.
- Economic Indicators: USD index, interest rates, export demand data.
- News Sentiment: Sentiment scores derived from agricultural news articles.
Feature Engineering Examples
- Lagged Returns: Price returns from previous days to capture momentum.
- Volatility Indicators: Rolling standard deviation of returns (e.g., 10-day, 30-day).
- Weather Anomalies: Deviations from average rainfall or temperature.
- Sentiment Scores: Aggregated positive/negative news sentiment per day.
Model Example: LSTM Neural Network for Volatility Prediction
Long Short-Term Memory (LSTM) networks are well-suited for time series data due to their ability to capture long-range dependencies.
- Input: Multivariate time series including price returns, weather features, and sentiment.
- Output: Predicted volatility for the next day or week.
Sample Python Code Snippet (Conceptual)
import numpy as np
import pandas as pd
from keras.models import Sequential
from keras.layers import LSTM, Dense

# Assume 'features' is a NumPy array of shape (samples, timesteps, features)
# 'targets' is the volatility value to predict

model = Sequential()
model.add(LSTM(50, input_shape=(features.shape[1], features.shape[2])))
model.add(Dense(1))
model.compile(optimizer='adam', loss='mse')

model.fit(features, targets, epochs=20, batch_size=32, validation_split=0.2)

# Predict volatility
predicted_volatility = model.predict(features_test)
Interpreting Results and Applying to Risk Management
- Volatility Forecast: Use predicted volatility to adjust Value at Risk (VaR) models dynamically.
- Hedging Decisions: Increase hedge ratios during predicted high volatility periods to reduce risk.
- Stress Testing: Simulate portfolio performance under forecasted volatility spikes.
Mind Map: Integrating AI Volatility Predictions into Trading Strategy
Real-World Example
A commodity trading firm implemented an LSTM-based volatility prediction model for soybean futures. By incorporating weather forecasts and news sentiment, the model improved volatility prediction accuracy by 15% compared to traditional GARCH models. This enabled the firm to adjust its hedging positions proactively, reducing unexpected losses during sudden market swings caused by drought news.
Best Practices Summary
- Combine diverse data sources (price, weather, sentiment) for richer feature sets.
- Use advanced AI models like LSTM to capture temporal dependencies.
- Continuously validate and recalibrate models with new data.
- Integrate AI predictions with existing risk management frameworks.
- Communicate model insights clearly to traders and risk managers.
By leveraging AI-based models for volatility prediction, commodity traders and risk managers can gain a competitive edge in managing agricultural commodity price risks more effectively.
10. Case Studies and Real-World Applications
10.1 Case Study 1: Hedging Crude Oil Price Risk in a Volatile Market Environment
Introduction
Crude oil is one of the most actively traded commodities globally, known for its price volatility driven by geopolitical events, supply-demand imbalances, and macroeconomic factors. For commodity traders and risk managers, effectively hedging crude oil price risk is crucial to protect profit margins and ensure stable cash flows.
Understanding the Risk
- Price Volatility: Crude oil prices can swing dramatically within short periods.
- Market Uncertainty: Events like OPEC decisions, geopolitical tensions, and economic data releases impact prices.
- Exposure: Physical crude oil producers, refiners, and traders face risk of adverse price movements.
Objectives of Hedging
- Lock in selling or buying prices to reduce uncertainty.
- Protect margins against unfavorable price moves.
- Maintain flexibility to benefit from favorable price movements when possible.
Hedging Instruments Used
- Futures Contracts: Standardized contracts traded on exchanges like NYMEX.
- Options on Futures: Provide the right, but not the obligation, to buy/sell futures at a strike price.
- Swaps: OTC contracts to exchange fixed price for floating price payments.
Mind Map: Crude Oil Price Risk Hedging Strategy
Step-by-Step Example
Scenario: A crude oil trading firm holds 100,000 barrels of physical crude oil inventory expected to be sold in 3 months. The current spot price is $70/barrel. The firm wants to hedge against a price decline.
Step 1: Identify Exposure
- Exposure: 100,000 barrels to be sold in 3 months.
Step 2: Select Hedging Instrument
- Use NYMEX crude oil futures contracts (each contract = 1,000 barrels).
Step 3: Define Hedge Ratio
- Full hedge: 100 contracts (100,000 barrels / 1,000 barrels per contract).
Step 4: Implement Hedge
- Sell 100 crude oil futures contracts at current futures price (assume $71/barrel).
Step 5: Monitor and Adjust
- If market conditions change, adjust hedge by buying/selling futures or rolling contracts.
Step 6: Evaluate Effectiveness
- At sale, compare physical sale price plus futures gains/losses to understand hedge effectiveness.
Example Calculation
| Date | Spot Price ($/bbl) | Futures Price ($/bbl) | Action | Result |
|---|---|---|---|---|
| Day 0 | 70 | 71 | Sell 100 futures contracts | Locked in futures price |
| Day 90 (Sale) | 65 | 66 | Sell physical crude oil | Loss on spot price (-$5/bbl) |
| Day 90 (Close) | Buy back futures contracts | Gain on futures (+$5/bbl) |
Net Effect: Loss on physical sale is offset by gain on futures, effectively locking in $71/barrel.
Incorporating Options for Flexibility
- Buying put options can provide downside protection with upside participation.
- Example: Buy 100 put options with strike price $70.
- If price falls below $70, option gains offset losses; if price rises, firm benefits from higher spot price minus premium paid.
Mind Map: Using Options for Hedging
Best Practices Highlighted
- Accurate Exposure Measurement: Precisely quantify physical exposure before hedging.
- Instrument Selection: Match hedging instrument to risk tolerance and market conditions.
- Hedge Ratio Optimization: Avoid over-hedging or under-hedging to minimize basis risk.
- Continuous Monitoring: Regularly review hedge positions and market developments.
- Use of Options for Flexibility: Incorporate options to allow upside potential.
Summary
This case study illustrates how a crude oil trading firm can effectively hedge price risk in a volatile market by using futures contracts and options. By carefully assessing exposure, selecting appropriate instruments, and actively managing hedge positions, traders and risk managers can protect their portfolios from adverse price movements while maintaining strategic flexibility.
10.2 Case Study 2: Managing Basis Risk in Coal Trading Using Forward Contracts
Introduction
Basis risk is a critical challenge in commodity trading, especially when the hedging instrument does not perfectly match the underlying exposure. In coal trading, where regional price differentials and quality variations exist, managing basis risk effectively is essential to protect profit margins.
This case study explores how a coal trading firm used forward contracts to manage basis risk and optimize their risk management strategy.
Understanding Basis Risk in Coal Trading
Basis Risk Definition: The risk that the price difference between the physical commodity and the hedging instrument changes unfavorably.
In coal markets, basis risk arises due to:
- Regional Price Differentials: Coal prices vary by delivery location (e.g., Newcastle vs. Richards Bay).
- Quality Variations: Differences in calorific value, sulfur content, and ash affect pricing.
- Contract Specifications: Forward contracts may be standardized, while physical contracts are customized.
Mind Map: Components of Basis Risk in Coal Trading
Scenario Overview
- Trader: Mid-sized coal trading firm
- Exposure: Physical coal purchase contract for 50,000 metric tons of thermal coal delivered at Richards Bay in 6 months
- Risk: Price volatility and basis risk between Richards Bay physical coal and Newcastle forward contracts
- Challenge: No liquid forward contracts exist for Richards Bay coal; Newcastle contracts are the closest proxy
Hedging Strategy Using Forward Contracts
- Identify Proxy Hedge Instrument: Newcastle coal forward contracts
- Calculate Historical Basis: Analyze historical price differentials between Richards Bay and Newcastle coal prices
- Estimate Basis Volatility: Understand how the basis fluctuates over time
- Determine Hedge Ratio: Decide on the proportion of exposure to hedge using Newcastle forwards
- Execute Hedge: Enter forward contracts on Newcastle coal to offset price risk
- Monitor and Adjust: Continuously monitor basis movements and adjust hedge as needed
Mind Map: Hedging Process for Basis Risk
Example: Calculating Historical Basis and Hedge Ratio
- Step 1: Collect 12 months of daily spot prices for Richards Bay coal and Newcastle forward prices
- Step 2: Calculate daily basis = Price_RichardsBay - Price_Newcastle
- Step 3: Compute average basis = $5 per metric ton (Richards Bay is typically $5 higher)
- Step 4: Calculate standard deviation of basis = $1.50 per metric ton
Interpretation: The basis fluctuates around $5 with moderate volatility.
Hedge Ratio Calculation:
- If the trader wants to hedge 80% of price risk but expects basis risk to cause some residual exposure, they might hedge 80% of the exposure using Newcastle forwards.
Practical Implementation
| Step | Action | Example Detail |
|---|---|---|
| Exposure Identification | 50,000 MT Richards Bay coal contract | Delivery in 6 months |
| Proxy Selection | Newcastle forward contracts | Most liquid forward market |
| Basis Analysis | Average basis = $5/MT, Std Dev = $1.50/MT | Historical data analysis |
| Hedge Ratio | 80% hedge ratio | Partial hedge to account for basis risk |
| Execution | Sell 40 Newcastle forward contracts (1,000 MT each) | Lock in prices for 40,000 MT |
| Monitoring | Weekly basis review | Adjust hedge if basis deviates significantly |
Managing Residual Basis Risk
Despite hedging, residual basis risk remains. Best practices include:
- Regular Basis Monitoring: Track basis movements and update models
- Dynamic Hedge Adjustments: Increase or decrease hedge size based on basis trends
- Use of Options: Incorporate options to protect against adverse basis movements
- Diversification: Hedge across multiple instruments or locations if possible
Mind Map: Residual Basis Risk Management
Summary and Lessons Learned
- Basis risk is a significant factor in coal trading hedges, especially when proxy instruments are used.
- Historical basis analysis is essential to quantify and understand basis risk.
- Partial hedging with forward contracts can mitigate price risk but requires active management.
- Continuous monitoring and flexibility in hedge adjustments improve risk outcomes.
- Incorporating options and diversification can further reduce residual risks.
Final Thought
This case study demonstrates that while forward contracts are effective tools for hedging commodity price risk, understanding and managing basis risk is crucial for successful coal trading risk management. Combining quantitative analysis with practical execution and ongoing monitoring creates a robust risk mitigation framework.
10.3 Case Study 3: Credit Risk Management in a Global Metals Trading Firm
Introduction
Credit risk is a critical concern for global metals trading firms due to the high value, volatility, and counterparty exposure inherent in the sector. This case study explores how a leading metals trading firm implemented a comprehensive credit risk management framework to mitigate potential losses and ensure business continuity.
Company Background
- Operates globally with offices in Asia, Europe, and the Americas
- Trades base metals (copper, aluminum, nickel), precious metals (gold, silver), and specialty alloys
- Engages in both physical and derivatives markets
Credit Risk Challenges Faced
- Diverse counterparty base including producers, consumers, financial institutions, and brokers
- Exposure to emerging market counterparties with less transparent credit profiles
- Complex OTC derivative contracts with long maturities
- Volatile metal prices impacting collateral valuations
Credit Risk Management Framework
Credit Risk Management Mind Map
Step 1: Counterparty Credit Assessment
-
Process:
- Gathered financial statements and credit ratings from agencies like S&P, Moody’s
- Performed internal credit scoring for counterparties without external ratings
- Conducted qualitative assessments including management interviews and market reputation
-
Example:
- A mid-sized copper smelter in South America had no external rating. The firm used a proprietary scoring model based on liquidity ratios, profitability, and payment history to assign an internal credit grade.
Step 2: Exposure Measurement
-
Mark-to-Market (MTM) Exposure:
- Calculated daily MTM values on all open trades to assess current exposure.
-
Potential Future Exposure (PFE):
- Used Monte Carlo simulations to estimate the maximum expected exposure over the life of derivative contracts at a 95% confidence level.
-
Netting Agreements:
- Implemented ISDA Master Agreements to legally net exposures across multiple trades with the same counterparty.
-
Example:
- For a 6-month aluminum swap, the firm simulated price paths to estimate PFE, which informed collateral requirements.
Step 3: Credit Mitigation Techniques
-
Collateral Management:
- Required counterparties to post cash or metal-backed collateral based on exposure.
- Daily margin calls adjusted for market volatility.
-
Credit Limits:
- Set exposure limits per counterparty and product type.
- Limits reviewed quarterly based on counterparty creditworthiness.
-
Credit Derivatives:
- Purchased credit default swaps (CDS) as protection against key counterparties.
-
Example:
- A large financial institution counterparty had a $50 million credit limit. When exposure neared $45 million due to market moves, the firm requested additional collateral and reduced new trade approvals.
Step 4: Monitoring and Reporting
-
Daily Reporting:
- Risk team generated daily exposure and collateral reports for senior management.
-
Limit Breach Alerts:
- Automated alerts triggered when exposures approached or breached limits.
-
Stress Testing:
- Conducted monthly stress tests simulating extreme metal price shocks and counterparty defaults.
-
Example:
- During a sudden nickel price spike, stress tests showed potential limit breaches with an emerging market counterparty, prompting preemptive risk reduction measures.
Step 5: Governance and Continuous Improvement
-
Credit Committee:
- Met weekly to review large exposures, approve exceptions, and update policies.
-
Approval Processes:
- New counterparties required multi-level approval based on risk rating.
-
Policy Updates:
- Incorporated lessons from market events and regulatory changes.
-
Example:
- After a counterparty default in 2022, the firm tightened collateral thresholds and enhanced credit scoring models.
Summary of Best Practices Illustrated
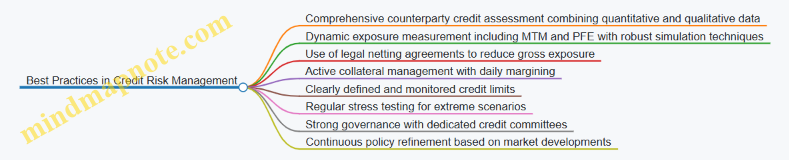
Conclusion
This case study demonstrates that effective credit risk management in global metals trading requires an integrated approach combining rigorous assessment, real-time exposure monitoring, proactive mitigation, and strong governance. By applying these strategies, the firm successfully minimized credit losses and maintained operational resilience despite volatile market conditions.
Additional Mind Map: Credit Risk Workflow
This detailed case study, supported by mind maps and practical examples, provides commodity traders and risk managers with actionable insights into managing credit risk effectively in complex metals trading environments.
10.4 Case Study 4: Operational Risk Mitigation in a Large-Scale Grain Trading Operation
Introduction
Operational risk in large-scale grain trading operations can arise from multiple sources including trade capture errors, logistics and storage mishaps, regulatory compliance failures, and technology system breakdowns. This case study explores how a major grain trading firm implemented a comprehensive operational risk mitigation framework to safeguard its business, improve efficiency, and ensure regulatory compliance.
Understanding Operational Risks in Grain Trading
- Trade Capture and Execution Errors: Manual entry mistakes, mismatched contracts, or incorrect pricing.
- Logistics and Storage Risks: Delays in shipment, spoilage, warehouse mismanagement.
- Regulatory and Compliance Risks: Failure to adhere to export/import regulations, quality standards.
- Technology and Systems Risks: System outages, cybersecurity threats, data integrity issues.
Mind Map: Operational Risks in Grain Trading
Risk Mitigation Strategies Implemented
-
Automated Trade Capture System:
- Replaced manual entry with an integrated electronic trade capture platform.
- Real-time validation checks for contract terms and pricing.
-
Enhanced Logistics Tracking:
- Implemented GPS and IoT sensors for real-time shipment monitoring.
- Automated alerts for delays or temperature deviations in storage.
-
Regulatory Compliance Automation:
- Integrated compliance software to track export/import regulations.
- Automated generation of required documentation and audit trails.
-
Robust IT Infrastructure and Cybersecurity:
- Multi-layered cybersecurity protocols including firewalls and encryption.
- Regular system backups and disaster recovery plans.
-
Trade Reconciliation and Exception Management:
- Daily reconciliation between trading, operations, and finance systems.
- Exception reports with escalation workflows.
Mind Map: Operational Risk Mitigation Framework
Practical Examples
Example 1: Preventing Trade Capture Errors
- Before automation, a trader entered a contract for 10,000 metric tons of corn at $200/ton but mistakenly typed $20/ton.
- The new system flagged the price as outside acceptable market ranges and prevented trade confirmation.
- Result: Avoided a potential $1.8 million loss.
Example 2: Mitigating Spoilage Risk in Storage
- IoT sensors detected a temperature rise in a grain silo storing wheat.
- Automated alert triggered immediate inspection and cooling system activation.
- Result: Prevented spoilage of 500 metric tons, saving approximately $75,000.
Example 3: Ensuring Regulatory Compliance
- The compliance software automatically generated export documentation for a shipment to the EU.
- It flagged missing phytosanitary certificates before shipment.
- Result: Shipment delayed for correction rather than incurring fines or rejection.
Lessons Learned and Best Practices
- Invest in Automation: Reduces human error and increases operational efficiency.
- Real-Time Monitoring: Enables proactive risk detection and mitigation.
- Cross-Functional Collaboration: Align trading, operations, compliance, and IT teams.
- Regular Training: Ensures staff understand systems and risk protocols.
- Continuous Improvement: Use incident data to refine controls and processes.
Summary
This case study demonstrates that operational risk mitigation in large-scale grain trading requires a holistic approach combining technology, process improvements, and organizational alignment. By implementing automated trade capture, advanced logistics tracking, compliance automation, and strong IT controls, the firm significantly reduced operational losses and enhanced overall risk resilience.
10.5 Lessons Learned and Best Practices from Industry Leaders
In this section, we distill key lessons and best practices gleaned from top commodity trading firms and risk management experts. These insights are drawn from real-world experiences, highlighting what works effectively in managing complex commodity risks and executing derivatives hedging strategies.
Key Lessons Learned
- Holistic Risk Integration: Successful firms integrate market, credit, operational, and liquidity risks into a unified risk framework rather than managing them in silos.
- Dynamic Hedging Adaptability: Markets are volatile; adaptive hedging strategies that adjust to changing market conditions outperform static approaches.
- Robust Data Infrastructure: Accurate, timely data and analytics are foundational for informed decision-making and risk measurement.
- Strong Counterparty Management: Proactive credit risk assessment and mitigation prevent unexpected losses.
- Culture of Risk Awareness: Embedding risk consciousness at all organizational levels enhances early risk detection and response.
Best Practices with Examples and Mind Maps
Unified Risk Management Framework
Description: Integrate all risk types into a single platform to enable comprehensive risk visibility.
Example: A global metals trader implemented an integrated risk dashboard combining market risk (VaR), credit exposures, and operational risk incidents. This enabled faster decision-making during market shocks.
Mind Map:
Adaptive Dynamic Hedging
Description: Continuously recalibrate hedge positions based on market volatility and price movements.
Example: An energy trading firm used a delta-gamma hedging approach for natural gas options, adjusting hedge ratios daily to minimize exposure to price swings.
Mind Map:
Data Quality and Analytics Excellence
Description: Invest in data governance and advanced analytics to improve risk insights.
Example: A commodity trading firm implemented machine learning models to forecast price volatility in agricultural commodities, improving hedging timing and effectiveness.
Mind Map:
Proactive Counterparty Credit Management
Description: Regularly assess counterparty creditworthiness and enforce limits.
Example: A global oil trader used real-time credit exposure monitoring combined with automated collateral calls, reducing credit losses during market downturns.
Mind Map:

Cultivating a Risk-Aware Culture
Description: Promote continuous training and open communication on risk topics.
Example: A large agricultural commodities firm instituted monthly risk workshops and cross-departmental risk committees, fostering transparency and shared responsibility.
Mind Map:

Summary Table of Best Practices and Examples
| Best Practice | Description | Real-World Example |
|---|---|---|
| Unified Risk Framework | Integrate all risk types for holistic view | Metals trader’s integrated risk dashboard |
| Adaptive Dynamic Hedging | Rebalance hedge positions dynamically | Energy firm’s delta-gamma hedging for gas |
| Data Quality & Analytics | Use advanced analytics for better insights | ML-based volatility forecasting in agriculture |
| Proactive Credit Management | Monitor and mitigate counterparty risk | Oil trader’s real-time exposure and collateral |
| Risk-Aware Culture | Embed risk awareness organization-wide | Agri firm’s workshops and risk committees |
By adopting these lessons and best practices, commodity traders and risk managers can enhance their risk mitigation capabilities, improve hedging effectiveness, and build resilient trading operations that thrive even in volatile market environments.
11. Building a Culture of Risk Awareness and Continuous Improvement
11.1 Training and Development for Commodity Traders and Risk Managers
Effective training and development programs are essential for commodity traders and risk managers to keep pace with the rapidly evolving market dynamics, regulatory requirements, and technological advancements. This section explores structured approaches to skill enhancement, knowledge sharing, and continuous learning, supported by practical examples and mind maps to facilitate understanding.
Importance of Training and Development
- Enhances technical skills in derivatives, risk analytics, and market strategies.
- Builds awareness of regulatory compliance and operational best practices.
- Fosters a proactive risk culture and decision-making confidence.
Core Competencies to Develop
- Market fundamentals and commodity-specific knowledge.
- Quantitative risk measurement techniques.
- Derivatives pricing and hedging strategies.
- Credit and operational risk management.
- Technology utilization including trading platforms and risk systems.
Mind Map: Key Areas of Training for Commodity Traders and Risk Managers
Structured Training Approaches
-
Classroom and Online Courses
- Formal courses on commodity markets, derivatives, and risk management.
- Example: A 6-week online certification in Commodity Derivatives offered by industry bodies.
-
On-the-Job Training and Mentorship
- Pairing junior traders/risk managers with experienced mentors.
- Example: Shadowing senior risk managers during daily risk assessments.
-
Simulation and Scenario-Based Learning
- Using trading simulators and risk scenario exercises to practice decision-making.
- Example: Simulated hedging of a volatile natural gas portfolio under stressed market conditions.
-
Workshops and Seminars
- Interactive sessions focusing on emerging trends, regulatory updates, and case studies.
- Example: Workshop on managing ESG risks in commodity trading.
-
Cross-Functional Training
- Encouraging collaboration between trading, risk, compliance, and IT teams.
- Example: Joint sessions on trade capture systems and risk reporting workflows.
Practical Example: Developing a Training Program for a Mid-Sized Commodity Trading Firm
Objective: Enhance the risk awareness and derivatives expertise of the trading and risk teams.
Steps:
- Conduct a skills gap analysis through surveys and interviews.
- Design a blended learning curriculum combining online modules and live workshops.
- Implement monthly simulation exercises replicating real-market scenarios.
- Establish a mentorship program pairing junior staff with senior experts.
- Schedule quarterly knowledge-sharing sessions featuring external industry speakers.
Outcome: Improved hedging accuracy, faster risk identification, and stronger regulatory compliance.
Mind Map: Training Program Development Workflow
Best Practices
- Regularly update training content to reflect market and regulatory changes.
- Encourage a culture of continuous learning supported by leadership.
- Use real-world examples and case studies to contextualize theoretical concepts.
- Leverage technology for interactive and accessible learning experiences.
- Measure training effectiveness through assessments and performance tracking.
By investing in comprehensive training and development programs, commodity trading firms can empower their traders and risk managers to navigate complex markets confidently, manage risks effectively, and contribute to sustainable business success.
11.2 Establishing Clear Communication Channels Between Trading and Risk Teams
Effective communication between trading and risk management teams is a cornerstone of successful commodity trading operations. Clear, timely, and structured communication ensures that risks are properly identified, assessed, and mitigated, while traders can execute strategies with a full understanding of risk limits and controls.
Importance of Clear Communication
- Aligns objectives between traders and risk managers
- Facilitates rapid response to market changes
- Enhances transparency and trust
- Reduces operational errors and misunderstandings
Key Components of Communication Channels
Best Practices for Establishing Communication Channels
-
Define Clear Roles and Responsibilities
- Traders: Provide trade rationale, market insights, and flag potential risks
- Risk Managers: Monitor exposures, enforce limits, and communicate risk assessments
-
Regular Scheduled Meetings
- Daily pre-market briefings to discuss market conditions and risk appetite
- Weekly risk review meetings to analyze exposures and performance
-
Use of Collaborative Technology Platforms
- Instant messaging tools (e.g., Slack, Microsoft Teams) for quick queries and alerts
- Shared dashboards for real-time risk metrics and trade status
-
Standardized Reporting Formats
- Trade confirmation templates
- Exception and limit breach reports
-
Encourage Open and Two-Way Communication
- Create a culture where traders and risk managers feel comfortable raising concerns
- Implement feedback loops to continuously improve communication processes
Example 1: Daily Risk Briefing Mind Map
Scenario: Every morning at 8:30 AM, the trading desk and risk team hold a 30-minute video call. Traders share their market views and planned trades, while risk managers provide updates on current exposures and any limit breaches. This ensures everyone starts the day aligned and aware.
Example 2: Incident Escalation Flow
Scenario: A trader notices unusual price volatility impacting an open position. They immediately notify the risk manager via instant message. The risk manager assesses the situation, escalates to senior management, and together they decide to reduce exposure. The incident is documented for future learning.
Example 3: Technology-Enabled Communication
- Risk Dashboard: A centralized platform displaying real-time P&L, VaR, limit utilizations, and open positions accessible to both teams.
- Chat Channels: Dedicated channels for urgent risk alerts and trade clarifications.
- Automated Reports: Daily emails summarizing key risk metrics and exceptions.
Summary
Establishing clear communication channels between trading and risk teams involves a combination of structured processes, appropriate technology, and a culture that values transparency and collaboration. By implementing regular meetings, standardized reporting, and leveraging digital tools, commodity trading firms can significantly enhance their risk management effectiveness.
Call to Action
- Assess your current communication workflows.
- Introduce or refine daily and weekly meetings.
- Invest in collaborative tools that support real-time information sharing.
- Foster an open environment encouraging proactive communication.
Clear communication is not just a process—it’s a strategic advantage in managing commodity trading risks effectively.
11.3 Continuous Monitoring and Feedback Loops for Risk Processes
Continuous monitoring and feedback loops are essential components of an effective risk management framework in commodity trading. They ensure that risk exposures are consistently tracked, deviations are promptly identified, and corrective actions are taken in a timely manner. This section explores the principles, tools, and best practices for implementing continuous monitoring and feedback mechanisms, supported by practical examples and illustrative mind maps.
Why Continuous Monitoring Matters
- Early Detection of Risk Events: Real-time or frequent monitoring helps identify emerging risks before they escalate.
- Improved Decision Making: Provides traders and risk managers with up-to-date information to adjust strategies.
- Regulatory Compliance: Many regulations require ongoing risk assessment and reporting.
- Adaptive Risk Management: Enables organizations to learn from past events and refine risk controls.
Key Components of Continuous Monitoring
Best Practices for Continuous Monitoring
-
Automate Data Collection and Reporting: Use technology platforms to gather trade, market, and credit data automatically, reducing manual errors and delays.
-
Define Clear Risk Metrics and Thresholds: Establish key risk indicators (KRIs) with predefined limits to trigger alerts.
-
Implement Real-Time Dashboards: Visualize exposures and limit utilizations dynamically for quick assessment.
-
Set Up Alert Mechanisms: Configure email, SMS, or system notifications for breaches or unusual patterns.
-
Regularly Review and Update Risk Models: Incorporate new data and market conditions to keep analytics relevant.
-
Establish Feedback Loops: After any risk event or near miss, conduct root cause analysis and update policies or controls accordingly.
-
Engage Cross-Functional Teams: Ensure communication between traders, risk managers, compliance, and IT for holistic risk oversight.
Practical Example: Continuous Monitoring in a Crude Oil Trading Desk
Scenario: A crude oil trading desk uses futures and options to hedge price risk. The risk management team implements continuous monitoring to track market exposure and counterparty credit risk.
- Data Collection: Automated feeds capture real-time futures prices, option Greeks, and trade positions.
- Analytics: Daily VaR and stress test calculations run automatically.
- Dashboards: Traders and risk managers access a dashboard showing current exposures, limit utilizations, and margin requirements.
- Alerts: If the VaR exceeds 95% of the limit, an alert is sent to the risk manager.
- Feedback Loop: After a sudden market spike caused a near-limit breach, the team analyzed the event, identified gaps in hedge effectiveness, and adjusted the dynamic hedging strategy accordingly.
Example: Feedback Loop Process Flow
Summary
Continuous monitoring combined with structured feedback loops creates a resilient risk management environment. By leveraging automation, clear metrics, and collaborative processes, commodity trading firms can proactively manage risks, adapt to changing market conditions, and continuously improve their risk controls.
Remember: The goal is not only to detect risks but to learn from them and evolve the risk management framework accordingly.
11.4 Best Practice: Implementing Risk Culture Assessments and Incentive Alignment
Creating a strong risk culture is fundamental to effective commodity trading risk management. It ensures that every team member—from traders to risk managers and executives—understands, values, and acts in accordance with the organization’s risk appetite and policies. Two critical components in fostering this culture are risk culture assessments and incentive alignment.
What is Risk Culture?
Risk culture refers to the shared values, beliefs, knowledge, attitudes, and behaviors that shape how risks are identified, understood, discussed, and acted upon within an organization.
Why Assess Risk Culture?
- Identify gaps between desired and actual risk behaviors.
- Promote transparency and accountability.
- Enhance communication between trading and risk teams.
- Support continuous improvement in risk management practices.
Mind Map: Components of Risk Culture Assessment
Steps to Implement Risk Culture Assessments
- Define Objectives and Scope: Determine what aspects of risk culture to evaluate (e.g., communication, accountability).
- Develop Assessment Tools: Use surveys, interviews, focus groups, and workshops tailored to commodity trading environments.
- Collect Data: Engage all relevant stakeholders including traders, risk managers, compliance officers, and senior leadership.
- Analyze Results: Identify strengths, weaknesses, and areas for improvement.
- Report Findings: Share insights transparently with leadership and teams.
- Action Planning: Develop targeted initiatives to address gaps.
- Monitor Progress: Conduct periodic reassessments to track improvements.
Example: Risk Culture Survey Questions for Commodity Traders
- How comfortable do you feel raising concerns about potential trading risks?
- Do you understand the firm’s risk appetite for your commodity products?
- Are risk management policies clearly communicated and accessible?
- Do you believe incentives encourage appropriate risk-taking?
- How often do you receive feedback related to risk management performance?
Incentive Alignment: Why It Matters
In commodity trading, incentives often drive behavior. Misaligned incentives can encourage excessive risk-taking or risk avoidance, both detrimental to the firm.
Key Principles:
- Incentives should reward both profitable trading and prudent risk management.
- Avoid rewarding short-term gains at the expense of long-term risk exposure.
- Incorporate risk-adjusted performance metrics.
- Balance quantitative targets with qualitative assessments.
Mind Map: Designing Incentive Alignment
Practical Example: Aligning Incentives in a Crude Oil Trading Desk
Scenario: Traders historically received bonuses based solely on quarterly profits, leading to aggressive positions and occasional breaches of risk limits.
Solution:
- Introduce a risk-adjusted performance metric, such as RAROC, that factors in the risk taken to generate returns.
- Implement deferred bonuses, where a portion of the reward is paid out over multiple quarters, contingent on no significant risk breaches.
- Incorporate qualitative assessments from risk managers and compliance teams into performance reviews.
- Establish a recognition program for traders who proactively identify and mitigate risks.
Outcome:
- Improved adherence to risk limits.
- Enhanced collaboration between traders and risk managers.
- More sustainable profitability with controlled risk exposure.
Mind Map: Continuous Improvement Cycle for Risk Culture and Incentives
Summary
Implementing risk culture assessments combined with well-designed incentive alignment ensures that commodity trading teams not only understand risk but are motivated to manage it effectively. This holistic approach fosters a resilient trading environment where risk-taking is balanced, transparent, and aligned with organizational goals.
Key Takeaways
- Regularly assess risk culture using tailored tools.
- Engage leadership to set the tone from the top.
- Align incentives to reward prudent risk-taking and compliance.
- Use a mix of quantitative and qualitative performance measures.
- Promote open communication and accountability.
- Continuously monitor and improve risk culture and incentive programs.
11.5 Practical Example: Developing a Risk Awareness Program in a Mid-Sized Commodity Trading Firm
Developing a risk awareness program is essential for embedding a strong risk culture within any commodity trading firm, especially mid-sized firms that may lack the extensive resources of larger organizations. This example outlines a step-by-step approach to designing and implementing an effective risk awareness program, integrating best practices and practical examples.
Step 1: Assess Current Risk Culture and Awareness
- Conduct anonymous surveys and interviews with traders, risk managers, and support staff to gauge current understanding and attitudes toward risk.
- Identify gaps in knowledge, communication barriers, and areas prone to operational or market risk.
Example: A mid-sized metals trading firm conducted a survey revealing that 40% of traders were unclear about the firm’s credit risk limits, and 30% had never attended formal risk training.
Step 2: Define Clear Risk Objectives and Communication Goals
- Establish what the program aims to achieve: improved risk identification, better adherence to limits, enhanced reporting accuracy, etc.
- Develop key messages tailored to different roles (traders, risk managers, compliance officers).
Example: Objectives included reducing limit breaches by 25% within 6 months and increasing risk training participation to 90%.
Step 3: Design Training Modules and Materials
- Create engaging, role-specific training covering market, credit, operational, and liquidity risks.
- Use real-world commodity trading scenarios and case studies.
- Incorporate interactive elements such as quizzes, role-playing, and group discussions.
Example: A training module on hedging strategies included a simulation where traders managed a hypothetical crude oil portfolio facing sudden price shocks.
Step 4: Implement Regular Risk Communication Channels
- Establish weekly risk bulletins summarizing key risk metrics, limit utilizations, and market developments.
- Hold monthly risk forums where traders and risk managers discuss recent events and lessons learned.
Example: The firm introduced a “Risk Radar” newsletter highlighting emerging risks like geopolitical tensions affecting commodity supply chains.
Step 5: Embed Risk Awareness into Performance and Incentives
- Align trader incentives with risk management objectives to discourage excessive risk-taking.
- Include risk adherence metrics in performance reviews.
Example: Traders received bonuses only if their trading activities remained within approved risk limits and if they actively participated in risk training.
Step 6: Monitor, Review, and Continuously Improve
- Use feedback loops from surveys, incident reports, and risk metrics to refine the program.
- Update training materials regularly to reflect market changes and regulatory updates.
Example: After six months, the firm noted a 30% reduction in operational errors linked to improved risk awareness and adjusted training to focus more on emerging cyber risks.
Mind Map: Developing a Risk Awareness Program
Example Scenario: Simulation Exercise for Traders
Context: Traders manage a portfolio of agricultural commodities facing unexpected drought forecasts.
Objective: Use derivatives to hedge price risk while adhering to credit and market limits.
Process:
- Traders receive simulated market data.
- They decide on futures and options positions.
- Risk managers provide feedback on exposures and limit adherence.
Outcome: Traders learn the impact of hedging decisions on portfolio risk and firm limits, reinforcing risk awareness in a practical setting.
Key Takeaways
- A structured risk awareness program fosters a proactive risk culture.
- Tailored training and communication enhance understanding and engagement.
- Aligning incentives ensures risk management is integral to trading activities.
- Continuous monitoring and adaptation keep the program relevant and effective.
By following this example, mid-sized commodity trading firms can significantly improve their risk culture, reduce incidents, and enhance overall risk management effectiveness.
12. Conclusion and Future Outlook
12.1 Summary of Key Risk Management and Hedging Strategies
In this section, we consolidate the essential risk management and hedging strategies covered throughout the blog, providing a clear and actionable summary for commodity traders and risk managers. Understanding and applying these strategies effectively can significantly reduce exposure to market uncertainties and improve portfolio resilience.
Key Risk Management Strategies Mind Map
Example: Identifying Risks in a Crude Oil Trading Desk
- Market Risk: Price volatility due to geopolitical events
- Credit Risk: Counterparty default on OTC swaps
- Operational Risk: Trade capture errors
- Liquidity Risk: Difficulty unwinding large futures positions
Core Hedging Strategies Mind Map

Example: Using Futures to Hedge Wheat Price Exposure
- Farmer sells wheat futures contracts equal to expected harvest
- Locks in price, reducing downside risk
- Risk: Basis risk if local wheat price diverges from futures price
Quantitative Risk Measurement Summary
Example: Calculating Delta for Crude Oil Options
- Delta of 0.6 means option price moves 60% of underlying price change
- Helps adjust hedge ratios dynamically
Credit and Operational Risk Management Highlights
Example: Credit Exposure in Metals Portfolio
- Monitor net exposure per counterparty
- Use collateral agreements to mitigate default risk
Liquidity and Market Impact Management
Example: Minimizing Market Impact in Energy Commodities
- Break large orders into smaller trades
- Use VWAP algorithms to achieve better average price
Portfolio Risk Optimization
Example: Hedging a Commodity Basket
- Use commodity index futures to hedge overall portfolio risk
- Adjust weights based on correlation and volatility
Final Thoughts
Mastering these key strategies enables commodity traders and risk managers to build robust defenses against price volatility, credit defaults, operational failures, and liquidity crunches. By integrating quantitative analytics with practical hedging techniques and a strong risk culture, firms can achieve sustainable trading success.
For further details, revisit chapters 3, 4, 5, 7, and 8 where these strategies are explored with in-depth examples and best practices.
12.2 Preparing for Market Evolution and Regulatory Changes
As commodity markets evolve rapidly due to technological advances, geopolitical shifts, and changing economic conditions, risk managers and commodity traders must proactively prepare for these transformations. Additionally, regulatory landscapes are continuously updated to address emerging risks and market practices. This section explores strategies to anticipate and adapt to market evolution and regulatory changes, ensuring resilient and compliant commodity trading operations.
Understanding Market Evolution Drivers
- Technological Innovation: Adoption of AI, blockchain, and algorithmic trading reshapes market dynamics.
- Geopolitical Factors: Trade wars, sanctions, and political instability impact supply chains and pricing.
- Environmental Changes: Climate change affects commodity availability and introduces ESG considerations.
- Market Structure Changes: Emergence of new exchanges, product offerings, and liquidity shifts.
Regulatory Change Landscape
- Global Regulatory Bodies: CFTC, SEC, ESMA, FCA, and others update rules affecting commodity derivatives.
- Key Regulations: Dodd-Frank Act, EMIR, MiFID II, Basel III impacting reporting, margining, and capital requirements.
- Compliance Challenges: Data transparency, trade reporting, position limits, and anti-manipulation rules.
Best Practices for Preparing and Adapting
Continuous Market and Regulatory Monitoring
- Establish dedicated teams or utilize technology platforms for real-time updates.
- Subscribe to regulatory bulletins and participate in industry forums.
Flexible Risk Management Frameworks
- Design adaptable policies that can incorporate new risk factors and compliance requirements.
- Use modular systems enabling quick updates to risk models and reporting tools.
Scenario Planning and Stress Testing
- Develop scenarios reflecting potential regulatory changes and market disruptions.
- Regularly stress test portfolios against these scenarios to assess vulnerabilities.
Stakeholder Engagement and Training
- Engage with regulators, industry groups, and internal teams to understand implications.
- Conduct ongoing training programs to keep staff informed and compliant.
Leveraging Technology
- Implement AI-driven analytics for predictive insights on market trends and regulatory impacts.
- Use blockchain for enhanced transparency and auditability in trade processes.
Mind Map: Preparing for Market Evolution and Regulatory Changes
Practical Examples
Example 1: Adapting to MiFID II Reporting Requirements
A European commodity trading firm faced challenges complying with MiFID II’s enhanced transaction reporting and position limits. By implementing an automated trade capture system integrated with a regulatory reporting platform, the firm ensured timely and accurate submissions. Additionally, scenario analysis was used to anticipate the impact of position limits on trading strategies, enabling proactive adjustments.
Example 2: Managing ESG Risks Amid Climate Regulations
An agricultural commodities trader incorporated ESG risk factors into their risk management framework after new climate-related disclosure regulations were introduced. They used AI-powered analytics to assess climate impact scenarios on crop yields and prices, adjusting hedging strategies accordingly. This proactive approach helped mitigate potential losses and aligned the firm with emerging regulatory expectations.
Example 3: Responding to Geopolitical Sanctions
When sanctions were imposed on a key oil-producing country, a global energy trading desk quickly reassessed counterparty credit risks and supply chain exposures. By leveraging flexible risk models and real-time market data, they restructured hedges using alternative instruments and counterparties, maintaining compliance and minimizing disruption.
Summary
Preparing for market evolution and regulatory changes requires a proactive, technology-enabled, and flexible approach. By continuously monitoring developments, engaging stakeholders, and embedding adaptability into risk frameworks, commodity traders and risk managers can navigate uncertainties effectively and sustain competitive advantage.
12.3 The Future Role of Technology and Innovation in Commodity Risk Management
The landscape of commodity risk management is rapidly evolving, driven by technological advancements and innovative solutions. As commodity markets become more complex and interconnected, leveraging technology is no longer optional but essential for effective risk mitigation, decision-making, and operational efficiency.
Key Technological Innovations Shaping Commodity Risk Management
Big Data and Advanced Analytics
Commodity traders and risk managers now have access to unprecedented volumes of data — from satellite imagery tracking crop health to social media sentiment impacting oil prices. Advanced analytics platforms can process this data to identify emerging risks and opportunities.
Example: A natural gas trading firm integrates weather forecast data, pipeline sensor data, and historical consumption patterns into a big data platform. Using predictive analytics, they anticipate demand spikes and price volatility, adjusting their hedging strategies proactively.
Artificial Intelligence (AI) and Machine Learning (ML)
AI and ML algorithms enhance forecasting accuracy, automate routine tasks, and detect subtle market signals that humans might miss.
Example: An agricultural commodities desk employs ML models to forecast soybean prices by analyzing global crop reports, shipping delays, and geopolitical news. The model flags unusual price movements early, enabling traders to adjust futures positions and reduce downside risk.
Blockchain and Smart Contracts
Blockchain technology offers immutable transaction records, enhancing transparency and reducing counterparty risk. Smart contracts automate contract execution based on predefined conditions.
Example: A metals trading company uses blockchain to track ownership and delivery status of copper shipments. Smart contracts automatically trigger payment upon verified delivery, reducing settlement risk and improving cash flow certainty.
Cloud Computing and Collaborative Platforms
Cloud infrastructure enables scalable risk management systems accessible from anywhere, facilitating collaboration between global trading and risk teams.
Example: A multinational commodity firm migrates its risk analytics platform to the cloud, allowing real-time risk dashboards accessible by traders, risk managers, and compliance officers worldwide. This reduces latency in decision-making and enhances transparency.
Internet of Things (IoT) and Sensor Technologies
IoT devices provide real-time data on commodity quality, storage conditions, and transportation status, which can be integrated into risk models.
Example: An agricultural trader uses IoT sensors in grain silos to monitor moisture levels and temperature, preventing spoilage risk. This data feeds into pricing and hedging decisions, minimizing losses.
Automation and Robotics
Automation streamlines trade execution, compliance monitoring, and reporting, reducing operational risk and increasing efficiency.
Example: A crude oil trading desk implements robotic process automation (RPA) to reconcile trade confirmations and generate regulatory reports, freeing risk managers to focus on strategic analysis.
Integrated Example: Leveraging Multiple Technologies
A global energy commodity firm develops an integrated risk management platform combining AI-driven price forecasting, blockchain-based trade settlement, and IoT-enabled supply chain monitoring. This holistic approach enables the firm to dynamically hedge exposures, reduce counterparty risk, and respond swiftly to operational disruptions.
Summary
The future of commodity risk management lies in embracing technology and innovation to enhance predictive capabilities, operational resilience, and transparency. Firms that invest in these technologies and integrate them into their risk frameworks will gain a competitive edge in navigating volatile commodity markets.
Call to Action: Commodity traders and risk managers should begin evaluating emerging technologies, pilot innovative solutions, and foster a culture of continuous technological adaptation to future-proof their risk management strategies.
12.4 Final Best Practices for Sustainable and Resilient Commodity Trading
In today’s fast-evolving commodity markets, sustainability and resilience are no longer optional but essential pillars for long-term success. This section distills the final best practices that commodity traders and risk managers should embed into their daily operations to build robust, adaptive, and responsible trading frameworks.
Integrate ESG (Environmental, Social, Governance) Factors into Risk Management
- Why: ESG risks increasingly impact commodity prices, regulatory environments, and reputational risk.
- How: Incorporate ESG data into risk models and decision-making processes.
Example: A metals trader integrates carbon emission data into pricing models to anticipate regulatory cost impacts on nickel supply chains.
Maintain Dynamic and Adaptive Hedging Strategies
- Continuously monitor market conditions and adjust hedge ratios accordingly.
- Use scenario analysis and stress testing to anticipate extreme events.
Example: A natural gas trader uses a dynamic hedge adjusting futures positions weekly based on weather forecasts and demand changes.
Foster Strong Collaboration Between Trading, Risk, and Compliance Teams
- Encourage transparent communication channels.
- Align incentives to promote risk-aware decision-making.
Example: Weekly cross-departmental meetings to review risk exposures and compliance updates, ensuring all teams are aligned on market developments.
Leverage Technology for Real-Time Risk Monitoring and Analytics
- Implement AI-powered analytics for volatility forecasting.
- Use blockchain for transparent and immutable trade records.
Example: An agricultural commodities firm uses machine learning models to predict price spikes during drought conditions, enabling proactive hedging.
Develop Robust Operational Controls and Audit Trails
- Automate trade capture and reconciliation to reduce errors.
- Maintain comprehensive audit logs for regulatory compliance and internal reviews.
Example: A crude oil trading desk deploys automated reconciliation software that flags mismatches instantly, reducing operational risk.
Prioritize Liquidity Management and Market Impact Minimization
- Use limit orders and algorithmic trading to reduce slippage.
- Maintain diversified counterparties to avoid concentration risk.
Example: A bulk energy trader breaks large orders into smaller slices executed over time using algorithms to avoid moving the market.
Mind Map: Sustainable and Resilient Commodity Trading Best Practices
Mind Map: Example Workflow for Implementing Best Practices
By embedding these best practices, commodity trading firms can not only mitigate traditional risks but also embrace sustainability and resilience as strategic advantages. This holistic approach ensures preparedness for market volatility, regulatory shifts, and evolving stakeholder expectations.
Summary Example:
A global agricultural commodities firm revamped its risk management by integrating ESG metrics into its pricing models, deploying AI-driven volatility forecasts, and automating operational workflows. This enabled the firm to dynamically hedge against weather-driven price shocks, reduce operational errors by 30%, and meet emerging regulatory requirements ahead of competitors — ultimately enhancing profitability and market reputation.
This concludes the final best practices section, setting the stage for a future-ready commodity trading and risk management approach.
12.5 Call to Action: Enhancing Risk Management Capabilities for Long-Term Success
As commodity markets continue to evolve with increasing complexity, volatility, and regulatory scrutiny, it is imperative for commodity traders and risk managers to proactively enhance their risk management capabilities. This final section serves as a call to action, outlining practical steps, frameworks, and examples to build resilient, adaptive, and forward-looking risk management functions.
Key Pillars for Enhancing Risk Management Capabilities
Practical Steps to Take Today
-
Conduct a Risk Capability Assessment:
- Evaluate current risk frameworks, tools, and team skillsets.
- Identify gaps in coverage, technology, or expertise.
-
Invest in Technology Upgrades:
- Implement advanced risk analytics platforms capable of real-time monitoring.
- Integrate AI models for predictive risk insights, such as price volatility forecasting.
-
Enhance Training Programs:
- Develop tailored workshops on derivatives hedging, scenario analysis, and regulatory compliance.
- Use case studies and simulations to deepen understanding.
-
Strengthen Cross-Department Collaboration:
- Establish regular communication forums between trading, risk, compliance, and IT teams.
- Align incentives to promote shared risk ownership.
-
Regularly Update Hedging and Risk Strategies:
- Incorporate lessons learned from past market events.
- Adjust strategies dynamically in response to market signals.
Example: Implementing a Risk Capability Enhancement Plan at a Mid-Sized Commodity Trading Firm
- Situation: The firm faced increasing margin calls due to unexpected price swings in natural gas.
- Action: Conducted a comprehensive risk assessment revealing insufficient scenario analysis and outdated hedging tools.
- Implementation: Adopted a cloud-based risk analytics platform with integrated VaR and stress testing modules; launched monthly cross-team risk workshops.
- Result: Improved risk visibility reduced margin volatility by 30%, and hedging strategies became more adaptive to market changes.
Mind Map: Continuous Improvement Cycle in Risk Management
Final Thoughts
Enhancing risk management capabilities is not a one-time project but a continuous journey. By embracing technology, fostering a strong risk culture, and maintaining agile processes, commodity traders and risk managers can safeguard their firms against unforeseen shocks and capitalize on market opportunities with confidence.
Start today by assessing your current capabilities, engaging your teams, and committing to ongoing improvement — the foundation for long-term success in commodity trading risk management.