The Long-Term Capital Playbook
1. Define Long Money and Fast Money in Real Deal Terms
1.1 Distinguish Capital Horizons by Contract Structure and Liquidity Terms
Long money and fast money are not just labels for investor personalities. They are encoded in contracts: how long capital is locked, what rights exist during stress, and how easily money can exit without breaking the deal. If you can read those terms, you can predict how decisions will behave when reality gets messy.
Start with the Contract Horizon
A capital horizon is the time window in which the investor expects to be paid back, plus the time window in which the investor can influence outcomes. Contracts express this through:
- Lockup and transfer limits: whether the investor can sell or transfer interests.
- Redemption rights: whether the investor can demand cash back on a schedule.
- Distribution mechanics: whether cash flows are paid out early or retained for growth.
- Default and cure provisions: what happens when performance slips.
Example: A private equity limited partnership might be “10 years” on paper, but the contract can include multi-year investment periods, staggered distributions, and restrictions on selling partnership interests. The effective horizon is often longer than the headline number.
Map Liquidity to Decision Pressure
Liquidity terms shape behavior because they change the cost of being wrong.
- High liquidity reduces the cost of exiting, so investors can tolerate more short-term uncertainty.
- Low liquidity increases the cost of exiting, so investors must underwrite more carefully and monitor more consistently.
Example: In a publicly traded bond, an investor can sell at market prices if credit deteriorates. In a private credit loan, the investor may have limited options: wait for maturity, negotiate amendments, or accept a restructuring. The second situation forces earlier attention to covenants, collateral, and cash flow durability.
Use a Practical Taxonomy of Contract Structures
Think of capital horizons as a spectrum of contract “friction.” Higher friction usually means longer horizon and more reliance on internal value creation.
Mind Map: Capital Horizon Signals
Compare Common Private and Public Structures
Below is a simplified way to distinguish horizons by contract features.
Example 1: Public Equity
- Liquidity: typically daily trading.
- Contract horizon: short in practice because exit is frictionless.
- Decision pressure: investors can react quickly to new information.
Example 2: Open-End Fund With Redemptions
- Liquidity: periodic redemption windows.
- Contract horizon: medium; investors can leave, but timing and gates matter.
- Decision pressure: managers must manage liquidity buffers to meet redemptions.
Example 3: Closed-End Private Fund
- Liquidity: no routine redemptions; transfers restricted.
- Contract horizon: long; investors expect value realization through a planned lifecycle.
- Decision pressure: underwriting and monitoring must be designed for the full holding period.
Example 4: Private Credit With Covenants
- Liquidity: limited exit; often held to maturity.
- Contract horizon: medium to long, depending on maturity and amendment rights.
- Decision pressure: covenants and collateral become the “early warning system.”
Read the “Stress Clauses” Like a Map, Not a Footnote
Many investors focus on return targets and ignore what the contract does under strain. For long money, stress clauses are where the real horizon shows up.
- Cure periods indicate how long the borrower has to fix a breach.
- Consent thresholds indicate whether investors can block value-destructive actions.
- Amendment mechanics indicate whether the deal can be restructured without a full investor vote.
Example: If a loan allows amendments with a supermajority of lenders, a minority investor may have limited ability to stop a restructuring. That changes the effective horizon because the investor’s “exit” becomes negotiation rather than sale.
Convert Terms into an “Effective Horizon” Checklist
When you evaluate a deal, translate contract language into a checklist you can apply consistently.
- How long until investors can realistically receive cash?
- What actions require investor consent?
- What happens in default and who controls the process?
- Can investors transfer interests and at what cost?
- Are distributions discretionary or formula-driven?
If you can answer these questions, you can distinguish long money from fast money based on contract mechanics rather than vibes. The contract is the behavior manual; liquidity is the pressure gauge.
1.2 Map Incentives Across Investors Managers and Operators
Long money outperforms fast money when incentives stay aligned across the full chain: investors fund the capital, managers run the strategy, and operators execute the business. Misalignment usually shows up as a mismatch between who bears downside and who captures upside. The goal here is to map incentives so you can predict behavior under stress, not just under good news.
Start with the Incentive Chain
Think of every private deal as three layers.
- Investors decide how much risk they can tolerate and how quickly they expect liquidity.
- Managers decide how they allocate time, capital, and attention across deals and how they get paid.
- Operators decide how they run the company day to day, including pricing, hiring, and capex.
A useful first check is to ask: When the deal goes wrong, who loses money first? If the answer is “investors,” but the manager and operator still get paid as if everything is fine, you have a structural problem.
Identify Incentive Surfaces
Incentives are not only about compensation. They also live in constraints and information.
- Economic incentives: fees, carried interest, equity ownership, option-like upside, and repayment waterfalls.
- Time incentives: preferred return schedules, hurdle timing, and whether performance is measured quarterly or over the holding period.
- Control incentives: governance rights, vetoes, board seats, and who can approve budgets or refinancing.
- Information incentives: reporting detail, auditability, and whether management has to disclose bad news early.
- Reputation incentives: track record credit, ability to raise the next fund, and whether incentives reward durability or short-term optics.
When you map these surfaces, you can see why two deals with the same headline return can produce different outcomes.
Mind Map: Incentive Mapping
Translate Incentives into Concrete Questions
Use a short set of questions that force specificity.
- Investor questions: “What portion of downside is borne before the manager earns performance fees?” and “How are fees treated during underperformance?”
- Manager questions: “Is carry earned on realized outcomes or on mark-to-model valuations?” and “Does the manager have incentives to extend, refinance, or sell when covenants tighten?”
- Operator questions: “Are bonuses tied to accounting earnings, cash generation, or both?” and “Do operator incentives penalize liquidity hoarding or reward it?”
These questions are not theoretical. They predict whether the team will protect the balance sheet or chase a metric.
Example: Same Business, Different Incentives
Consider a sponsor-led buyout of a distribution company.
- In Deal A, the operator bonus is tied to EBITDA and the sponsor’s carry is measured on mark-to-market. During a downturn, the operator can reduce maintenance capex to keep EBITDA stable, and the sponsor can report improved valuations even if cash collections are slipping.
- In Deal B, the operator bonus is tied to free cash flow and the sponsor’s carry is earned on realized exits with a clawback for certain losses. The operator still manages EBITDA, but the incentive system pushes maintenance capex back into the plan and prioritizes collections.
Both deals can look fine on paper at first. The difference is how each team behaves when cash tightens.
Example: A Simple Waterfall Check
Suppose a fund invests $50 million with a 10% preferred return. If management fees continue unchanged and performance fees are earned before investors recover principal, the manager’s incentives can tilt toward “keep the process moving” rather than “protect investor capital.” A better-aligned structure typically ensures that performance economics depend on investors actually receiving their return and that key protections exist when refinancing becomes necessary.
Advanced Details That Matter in Practice
- Vesting and clawbacks: If carry vests early, the manager may prefer actions that improve near-term marks even when long-term outcomes are uncertain.
- Reserved matters: If operators can approve capex or pricing changes without board oversight, you may see metric gaming rather than value creation.
- Covenant strategy: If the team can avoid covenant breaches by refinancing at any cost, incentives may favor “paper fixes” over operational repairs.
The practical takeaway is straightforward: map incentives, then test them against the failure modes you actually expect to encounter in private deals.
1.3 Identify Where Fast Money Enters and How It Changes Decision Making
Fast money is capital that expects outcomes on a short clock and is willing to trade away some long-horizon uncertainty to get there. In private markets, it usually arrives through specific channels: it can be a buyer with a quick turnaround plan, a lender focused on near-term covenants, or an investor who wants an exit path before the business has time to prove itself. The key is not the label; it’s the behavior it creates in underwriting, negotiation, and monitoring.
Start by mapping the “entry points” where short-horizon incentives show up. Then connect each entry point to the decision changes it causes. If you can do that, you can price risk more accurately and avoid building a long-money thesis on fast-money assumptions.
Foundational Concept: Time Horizon Becomes a Pricing Mechanism
When capital is measured in months instead of years, the investor’s model compresses. Cash flows that would matter later get discounted more aggressively, and risks that are slow to surface get treated as “unlikely enough.” That compression shows up in three places: (1) what gets underwritten deeply, (2) what gets negotiated tightly, and (3) what gets monitored weekly.
A simple example: suppose a software company needs 18 months to stabilize churn after a pricing change. Long money treats that as a core operating cycle. Fast money asks for proof within 90 days, so it either demands a structure that shifts risk back to the sponsor or it walks away. The business doesn’t change; the decision criteria do.
Entry Points: How Fast Money Typically Shows Up
Fast money tends to enter where liquidity is easier to engineer or where downside can be controlled quickly.
- Secondary buyers and recapitalization investors: They often buy after early execution risk has been partially reduced, aiming to harvest value before the next operating cycle.
- Bridge lenders and covenant-heavy debt: They focus on near-term coverage ratios and collateral value, pushing management to prioritize short-term compliance.
- Deal-by-deal opportunistic funds: They may underwrite with a single dominant exit story, such as a refinancing or a near-term sale.
- Strategic buyers with internal hurdle rates: Even if they are “strategic,” their internal approval timelines can behave like fast money.
Each entry point changes the negotiation room. If fast money is present, you’ll see more emphasis on immediate protections and less emphasis on learning through iteration.
Decision Changes: What Fast Money Does Differently
Fast money changes decisions in predictable ways. Use this checklist to spot it in diligence and term sheets.
-
Underwriting focus shifts to measurable near-term metrics
- Long money asks how the business compounds.
- Fast money asks whether the business can hit a threshold before the next reporting period.
- Example: instead of modeling customer lifetime value over time, fast money may require a minimum monthly net revenue retention by a specific date.
-
Structure becomes risk transfer, not risk sharing
- Long money prefers terms that align incentives across cycles.
- Fast money prefers terms that cap downside quickly.
- Example: a lender might require an equity cure right or a mandatory prepayment trigger if EBITDA coverage falls below a set level.
-
Exit planning dominates entry planning
- Long money designs the business plan first, then considers exits.
- Fast money designs the exit first, then reverse-engineers the business plan.
- Example: if the exit assumption is a sale within 12 months, the sponsor may be pushed to “clean up” financial statements rather than fix the underlying retention drivers.
-
Monitoring becomes reactive and frequent
- Long money monitors to confirm the thesis and adjust gently.
- Fast money monitors to detect covenant risk and trigger actions.
- Example: weekly reporting on working capital swings can crowd out attention on product improvements.
Mind Map: Fast Money Entry Points and Decision Effects
Example: The Same Deal, Two Different Decision Lenses
Imagine an acquisition of a regional healthcare services provider. The long-money thesis is that operational improvements—scheduling efficiency and referral conversion—will reduce bad debt over two years. Fast money arrives through a recapitalization investor who expects a refinancing in under 18 months.
- In long-money diligence, you spend time on referral pipeline quality, staffing ratios, and the lag between process changes and collections.
- With fast money present, diligence emphasizes current delinquency rates and near-term cash conversion, and the term sheet adds tighter reporting and prepayment triggers.
The business plan can still work, but the decision process becomes more brittle. If collections don’t improve on the expected timeline, the structure forces renegotiation or exit—even if the underlying operational levers are progressing.
Practical Takeaway: Identify the Clock Before You Evaluate the Numbers
When you see a deal team asking for fast proof, negotiating for quick downside caps, or monitoring for triggers rather than learning, treat it as evidence of fast-money influence. Your job is to translate that influence into underwriting assumptions: what will be prioritized, what will be constrained, and what will be forced to happen on a short schedule. That translation is where long money earns its edge—by making the decision criteria match the actual holding period.
1.4 Establish What Outperformance Means Using Net Returns and Risk Adjusted Measures
Outperformance is not a feeling; it’s a measurable outcome after you account for what you actually paid, what you actually earned, and what could have gone wrong. In long money investing, the temptation is to compare gross returns and call it a day. That works about as well as judging a car by its paint color. This section builds a practical definition using net returns and risk adjusted measures, then shows how to apply them consistently across private deals.
Start with Net Returns That Reflect Real Cash
Net return means you measure performance after fees, expenses, taxes where applicable, and any cash drag from timing. In private markets, timing matters because cash flows are lumpy: you fund at closing, wait through operations, and receive distributions at exit or interim events.
A simple way to operationalize net performance is to use net IRR (internal rate of return) and net multiple on invested capital (MOIC). Net IRR answers: “What annualized rate would turn my actual cash flows into the ending value?” Net MOIC answers: “How many dollars came back for each dollar put in?”
Example: You invest $10M in a fund. You pay $0.6M in fees and expenses over the life, and you receive $14M at exit. If you ignore fees, you might compute a gross MOIC of 1.4x. If you treat fees as reducing net proceeds (or as additional cash outflows), the effective net invested capital becomes $10.6M, and net MOIC becomes 14/10.6 ≈ 1.32x. That difference is not cosmetic; it changes whether the deal clears your hurdle.
Use Risk Adjusted Measures to Avoid “Right Answer, Wrong Risk”
Two strategies can produce the same net IRR while one takes materially more downside risk. Risk adjusted measures help you compare outcomes on a common footing.
In private markets, risk is often about dispersion of outcomes, tail losses, and the chance you miss liquidity needs. You can’t always compute a perfect volatility number, but you can still quantify risk in a disciplined way.
Three practical risk lenses:
- Downside probability: How likely is it you underperform a target (or lose principal)?
- Loss severity: If things go wrong, how bad is it likely to be?
- Capital at risk over time: How long is your money tied up while uncertainty remains?
Example: Deal A has a net IRR of 16% with a wide range of outcomes. Deal B has a net IRR of 15% but a tighter range because the downside case is protected by covenants and a conservative entry price. If your underwriting shows Deal B has a much lower probability of a loss, it can be the better long money choice even with slightly lower IRR.
Define Your Benchmark and Your Target Clearly
Outperformance requires a comparison. In private markets, benchmarks can be tricky because deals are not identical. The fix is to benchmark against what you actually could have done with similar money.
Use one or more of these benchmarks:
- Hurdle rate: Your minimum acceptable net IRR given your liquidity and risk tolerance.
- Comparable opportunity set: Deals with similar structure, sector, and holding period.
- Policy portfolio baseline: For family offices and strategic holdings, compare to the return profile of your broader allocation.
Example: If your policy requires net returns above 10% to justify illiquidity, then a 12% net IRR is “above hurdle,” but not automatically “outperforming.” If the comparable opportunity set typically clears 14% net IRR with similar downside, then 12% may be underperformance.
Mind Map: What Outperformance Means in Practice
Apply Consistency Rules So Comparisons Don’t Lie
Most “bad comparisons” come from inconsistent definitions. Before you declare outperformance, align these items across deals:
- Fee treatment: Are fees modeled as cash outflows or netted from distributions?
- Valuation conventions: Are interim marks conservative, neutral, or optimistic?
- Timing: Are you using actual funding dates and distribution dates?
- Tax assumptions: Are you comparing pre-tax to pre-tax, or net-of-tax to net-of-tax?
Example: Two co-investments both show 1.3x MOIC on paper. Deal X includes management fees in the cash flow model; Deal Y nets fees from distributions. If you compare them without harmonizing fee treatment, you’ll misrank them.
A Simple Scorecard That Combines Net and Risk
You don’t need a complicated system to be rigorous. A practical scorecard can be:
- Net IRR vs hurdle (pass/fail)
- Net MOIC (scale of outcome)
- Downside case (expected loss and probability)
- Liquidity fit (whether you can hold through the downside window)
Example: A deal clears the hurdle on net IRR but has a meaningful probability of a large loss and a long time to recovery. Another deal has slightly lower net IRR but a smaller downside and better liquidity fit. The second can be the outperformance winner because it delivers more reliable net outcomes for the same capital commitment.
Outperformance, then, is not “highest number wins.” It’s the best net result for the risk you actually took, measured with consistent definitions and anchored to a benchmark you could reasonably have achieved.
1.5 Build a Practical Vocabulary for Private Market Investing
Private markets run on the same basic math as public markets, but the language is different. A practical vocabulary helps you ask better questions, spot missing information, and avoid “sounds right” misunderstandings. The goal is not to memorize jargon; it’s to translate deal documents into a small set of repeatable concepts.
Start with the core unit: capital. In private deals, capital is not just money in; it’s also time, risk, and constraints. When someone says “we’re long-term,” ask what that means in contract terms: when cash moves, when decisions happen, and what happens if things go wrong.
Next, learn the vocabulary of cash flow. Private deals often separate returns into components that public investors see blended together. You’ll hear terms like distribution, return of capital, and residual value. A distribution is cash paid out during the life of the investment. Return of capital is cash that reduces your invested amount rather than representing profit. Residual value is what remains after distributions, often realized later through a sale or refinancing.
Then comes valuation. In private markets, valuation is frequently a negotiated estimate, not a daily market price. Terms like mark, fair value, and appraised value describe how managers report value between liquidity events. A useful habit is to ask: “Is this a model output, a third-party appraisal, or a transaction-based reference?”
Now define risk in the way private deals actually experience it. The vocabulary here is operational: downside scenario, covenant, liquidity event, and refinancing risk. A covenant is a contractual rule that can trigger default or require consent. Liquidity event is the moment cash can be returned, such as a sale, recapitalization, or IPO. Refinancing risk is the chance that debt terms can’t be rolled over on acceptable economics.
Finally, connect vocabulary to incentives. Private market participants are paid for different outcomes, at different times. Terms like management fee, performance fee, carry, and preferred return describe how economics are split. A preferred return is a hurdle that must be met before certain profit shares apply. Carry is the manager’s share of profits, often subject to a “waterfall” that determines the order of payments.
Mind Map: Private Market Vocabulary Map
Example: Translating Deal Language into Plain Meaning
Suppose a term sheet says: “We target an 18% preferred return with quarterly distributions.” Translate it into questions.
- Preferred return: Is the 18% calculated on invested capital, and is it cumulative? If it’s cumulative, missed preferred returns may accumulate and must be paid later.
- Quarterly distributions: Are distributions mandatory or discretionary? Mandatory distributions reduce uncertainty, but they can also be constrained by covenants.
- Cash source: Are distributions expected from operating cash flow, asset sales, or refinancing? If it’s refinancing-driven, then refinancing risk becomes central.
- Valuation and marks: If the manager reports marks quarterly, ask whether marks are based on comparable transactions, internal models, or third-party inputs.
A manager might say “we’re conservative on downside.” Your vocabulary should let you test that claim: which downside scenario is modeled, what covenant headroom exists, and what actions are available if performance slips.
Mind Map: Waterfall and Payment Order

Example: Using Vocabulary During Monitoring
Imagine you receive a quarterly update with three numbers: EBITDA, leverage ratio, and “valuation mark.” Your vocabulary tells you what to do next.
- EBITDA is an operating metric, but it doesn’t automatically equal cash available for distributions. Ask whether there are working capital swings or capex needs.
- Leverage ratio ties to covenants. If the ratio approaches a threshold, you should look for consent requirements and potential restrictions on distributions.
- Valuation mark is not the same as realized value. Ask whether the mark reflects updated assumptions, comparable transactions, or changes in discount rates.
This is how vocabulary becomes a workflow: translate terms into cash flow, valuation mechanics, risk triggers, and incentive alignment. Once you can do that consistently, you spend less time interpreting documents and more time deciding whether the deal’s economics actually match your expectations.
2. Build the Long-Term Investment Thesis and Decision Framework
2.1 Translate a High Level Thesis into Investable Criteria and Boundaries
A thesis is a direction; criteria are the steering wheel. The goal is to convert a broad belief—“long money should prefer durable cash flows”—into specific, testable rules that decide what you buy, at what price, and when you walk away.
Start with Thesis Statements That Can Be Tested
Write your thesis as three short claims:
- What you expect to be true (e.g., recurring demand, sticky customers, repeatable underwriting).
- Why it should persist (e.g., switching costs, regulatory barriers, network effects, contract structure).
- How you will earn (e.g., cash yield, operational improvement, multiple stability).
Example: “We like software businesses with high retention because customers replace workflows slowly.” That becomes testable by retention cohorts, churn drivers, and renewal economics.
Convert Claims into Investable Criteria
For each thesis claim, define criteria in four buckets: business quality, financial profile, deal structure, and price discipline.
Business quality criteria answer: “Is the engine real?”
- Customer retention and concentration limits.
- Evidence of repeatable sales motion or contract renewal.
- Unit economics that don’t rely on one-time events.
Financial profile criteria answer: “Can it survive normal stress?”
- Cash conversion and working-capital behavior.
- Leverage tolerance under a downside operating case.
- Coverage ratios that remain acceptable after realistic cost inflation.
Deal structure criteria answer: “Do we get paid even when things get messy?”
- Seniority and collateral quality.
- Covenants that are measurable and enforceable.
- Redemption, call protection, and amortization schedule.
Price discipline criteria answer: “Are we buying the upside or the downside?”
- Entry valuation tied to conservative assumptions.
- A maximum entry price that still clears your downside hurdle.
- Comparable transaction checks to prevent “thesis drift” into overpaying.
Define Boundaries So You Don’t Drift
Boundaries are explicit “no” rules. They keep the thesis from turning into a wish.
Common boundaries include:
- Concentration limits: no single customer above a set percentage of revenue.
- Quality thresholds: minimum retention, minimum gross margin floor, or minimum cash conversion.
- Complexity limits: avoid structures where key risks are unmeasurable (e.g., unclear revenue recognition practices).
- Liquidity limits: for long money, you still need a plan for capital lockup and refinancing risk.
Example boundary: “If retention is below 85% for two consecutive periods, we do not proceed, even if growth looks strong.” That prevents paying for growth that may not be durable.
Build a Decision Matrix That Forces Consistency
Create a simple scoring system that maps criteria to decisions. Use it to standardize underwriting and committee discussion.
- Must-pass items: if violated, the deal is rejected.
- Should-pass items: if weak, require stronger price or stronger protections.
- Nice-to-have items: improve confidence but cannot compensate for must-pass failures.
A slightly playful rule: if a criterion is important enough to mention in the thesis, it should be either must-pass or should-pass. Otherwise it’s just decoration.
Mind Map: Thesis to Criteria and Boundaries
Example: Turning a Broad Thesis into Rules
Suppose your thesis is: “We invest in mid-market services businesses where operational improvements can convert into durable cash flow.”
Business quality criteria
- Gross margin above a floor that indicates pricing power.
- Evidence that margin is not purely labor-cost arbitrage.
Financial profile criteria
- Positive operating cash flow in at least one of the last two years.
- Working capital not consuming cash beyond a defined range.
Deal structure criteria
- Prefer structures with covenants tied to leverage or interest coverage.
- Require reporting that allows you to verify the operating levers.
Price discipline criteria
- Model a downside case where revenue growth is flat and margins compress modestly.
- Set a maximum entry valuation so the downside still meets your minimum return.
Boundaries
- Reject if customer concentration exceeds your limit.
- Reject if management’s improvement plan depends on assumptions you cannot validate.
Evidence Requirements That Keep Criteria Honest
For each criterion, specify what counts as proof. “Retention is strong” becomes “retention is measured by cohort renewal rates with supporting contract data.” “Cash conversion is good” becomes “operating cash flow exceeds a defined percentage of EBITDA in the relevant periods.”
When criteria are evidence-based, underwriting becomes repeatable. When boundaries are explicit, you avoid the slow creep from “long money” to “long excuses.”
2.2 Define Time Horizon Assumptions and Holding Period Logic
Time horizon assumptions are where long money stops being a slogan and becomes a set of constraints. You are not just choosing “longer”; you are specifying what must be true for the investment to work, how long you are willing to wait for each value-creation lever, and what you will do if reality arrives late.
Start with the Contract Reality
Begin by reading the deal like a clock, not like a story. Ask what cash flows are contractually scheduled, when refinancing or re-leveraging is possible, and what events trigger mandatory actions. A common mistake is to assume a five-year hold because the pitch deck says so, while the documents quietly imply a shorter window for key outcomes.
Example: A preferred equity investment may pay current income for only the first 24 months, then convert or require a sale. If your thesis depends on operational improvements that typically show up after 36 months, your “holding period” must include the conversion risk, not just the improvement timeline.
Separate Holding Period from Value-Realization Period
Holding period is the time you remain invested. Value-realization period is the time it takes for the thesis drivers to show up in measurable results and become monetizable.
- If value realization is faster than your holding period, you need a plan for what to do with interim outcomes.
- If value realization is slower, you need a plan for how you will fund the wait and how you will respond to underperformance.
A practical way to structure this is to map each thesis lever to a “first measurable signal” date and a “likely monetization” date.
Build a Holding Period Logic Ladder
Use a ladder so decisions are consistent across deals.
- Entry window: when you can buy under your price and underwriting constraints.
- Stabilization window: when you expect early operational or credit normalization.
- Value-creation window: when the main levers should move the metrics.
- Realization window: when exit paths become available or rational.
- Contingency window: when you tolerate delays and still have options.
Example: In a small business acquisition, stabilization might be 6–9 months, value creation 12–24 months, and realization 24–36 months. If the seller’s earnout structure delays cash certainty, your contingency window should explicitly cover that gap.
Define Decision Gates with Time-Based Triggers
Time-based triggers prevent “we’ll see” from becoming a permanent strategy. Pair each gate with a metric and an action.
- Gate 1: at 3–6 months: confirm underwriting assumptions on revenue quality, churn, or occupancy.
- Gate 2: at 12 months: confirm unit economics or leverage trajectory.
- Gate 3: at 18–24 months: confirm whether the plan is on track to reach the realization threshold.
Action examples:
- If metrics are slightly off but improving, negotiate for additional operational support or adjust the plan.
- If metrics are off and worsening, consider restructuring, replacing management support, or preparing for an earlier exit.
Model Cash Needs and Liquidity Without Hand-Waving
Long money does not mean “no liquidity.” It means you can absorb timing differences. Translate the holding period into cash needs: capital calls, reserves, debt service, and any expected distributions.
Example: A fund that calls capital in tranches might require additional cash during the stabilization window. If your family office plans to hold for 7 years but has a 2-year liquidity need for another obligation, your holding period logic must include how you will bridge that mismatch.
Use a Simple Timeline Table for Each Deal
Create a one-page timeline that forces clarity.
| Phase | Months | Thesis Lever | Evidence To Look For | Decision Gate |
|---|---|---|---|---|
| Entry | 0–1 | Pricing and structure | Purchase price vs comps | Approve close |
| Stabilization | 1–6 | Operational baseline | KPI trend direction | Continue or adjust |
| Value Creation | 6–24 | Growth or margin | Unit economics, retention | Re-underwrite plan |
| Realization | 24–48 | Exit readiness | Buyer interest, refinance terms | Hold, sell, or restructure |
| Contingency | 48+ | Delay tolerance | Updated downside case | Trigger contingency actions |
Mind Map: Holding Period Logic
Example: Turning Assumptions into a Usable Plan
Assume a strategic holding in a regional software firm. Your thesis is that switching costs and customer retention will support stable cash flows, while a pricing refresh improves margins.
- You assume stabilization in the first 6 months by verifying churn and sales cycle behavior.
- You assume value creation from months 6–18 as pricing changes roll through renewals.
- You assume realization in months 24–36 if a buyer values recurring revenue and the company can show margin durability.
- You set a contingency gate at month 12: if gross margin is not trending toward the target range, you require a revised pricing plan or additional cost controls.
This is the essence of long money logic: you specify what you expect to see, when you expect to see it, and what you will do if the timeline slips.
Common Failure Modes to Avoid
- Single-number horizon: “We’ll hold for five years” without mapping levers to dates.
- No gate actions: metrics are tracked, but nothing changes when they miss.
- Ignoring contract clocks: documents impose earlier constraints than your plan.
- Liquidity mismatch: the holding period assumes capital is available when it may not be.
A good holding period assumption reads like a set of operational instructions. It should tell you what to look for, when to look, and how to respond—before the calendar forces the decision.
2.3 Set Decision Gates for Entry Underwriting and Ongoing Monitoring
Long money doesn’t mean “set it and forget it.” It means you decide up front what must be true to proceed, what would change your mind, and how you’ll keep checking without reinventing the wheel every quarter.
Entry Underwriting Decision Gates
Gate 1: Deal Fit and Constraint Check Before underwriting, confirm the deal matches your constraints: target return range, acceptable leverage, sector comfort, governance tolerance, and liquidity needs. A simple example: a family office that needs predictable cash distributions should treat an equity-only growth deal with uncertain timing as a mismatch, even if the headline IRR looks attractive.
Gate 2: Sponsor and Counterparty Credibility Assess whether the people behind the deal can execute the plan they’re selling. Look for evidence of similar outcomes, not just credentials. Example: if a sponsor claims operational improvement, require proof from prior investments—such as margin expansion tied to specific initiatives—rather than generic “best practices.”
Gate 3: Business Model and Cash Conversion Underwrite how cash is generated and when it becomes available. For a services business, revenue growth that doesn’t convert to cash (due to receivables buildup) is a red flag. Example: require a working-capital bridge showing how much cash is expected to be consumed or released during the holding period.
Gate 4: Value Creation Levers With Ownership List the levers that drive returns and assign who owns each lever. If the plan depends on pricing changes, specify the mechanism: contract renewal cadence, churn assumptions, and competitive response. If it depends on cost reduction, define the cost categories and the operational steps to achieve them.
Gate 5: Downside Case and “No-Go” Thresholds Define failure modes and the point at which you stop funding or exit. Example: if refinancing risk is central, set a threshold for interest coverage deterioration or covenant headroom that triggers renegotiation or a structured exit. This is where long money earns its keep: you’re not surprised; you’re prepared.
Gate 6: Entry Price and Terms Consistency Confirm that the price and structure support the downside case. A practical test: if the downside scenario still requires optimistic assumptions to break even, the deal fails the gate even if the base case looks fine.
Ongoing Monitoring Decision Gates
Ongoing monitoring should be staged so you act early, not late. Think of it as a sequence of “checkpoints” tied to specific actions.
Checkpoint A: Monthly Data Quality and Variance Review Start with data hygiene: are numbers complete, consistent, and comparable to the underwriting model? Example: if revenue is reported net of credits, ensure the same treatment is used in forecasts; otherwise, variance signals become noise.
Checkpoint B: Quarterly Operating Metric Gates Track leading indicators that precede financial outcomes. For a retailer, inventory turns and shrink matter before EBITDA does. For a software business, churn and net revenue retention often show up earlier than cash flow.
Checkpoint C: Covenant and Liquidity Gates Monitor covenant ratios and liquidity buffers with a calendar that matches reporting and lender timelines. Example: if a covenant is tested quarterly, you should review it monthly with a forecast that includes the next two reporting periods.
Checkpoint D: Governance and Information Rights Gates If you don’t receive the right information, you can’t make decisions. Confirm reporting cadence, budget updates, and variance explanations. Example: require a standardized quarterly business review pack that includes pipeline, churn drivers, and cost run-rate changes.
Checkpoint E: Action Triggers and Escalation Paths Define what you do when metrics cross thresholds. Actions might include requesting a revised plan, tightening spending, renegotiating terms, or preparing for an exit. Example: if gross margin drops for two consecutive quarters without a documented recovery plan, escalate to a management meeting with a decision on corrective actions.
Mind Map: Decision Gates for Entry and Monitoring
Integrated Example: One Deal, Two Timelines
A mid-market buyout targets 18% equity IRR over five years. Gate 1 blocks the deal if the family office needs annual distributions that the projected cash profile can’t support. Gate 5 sets a no-go threshold: if interest coverage falls below a defined level for two consecutive quarters, the investor requires a refinancing plan or cost reset before additional capital is approved.
After closing, Checkpoint A ensures the monthly reporting matches underwriting definitions. Checkpoint B watches the leading indicator—customer churn and receivables days—because EBITDA can lag. If churn rises and receivables days extend, Checkpoint E triggers escalation: management must present a corrective plan with quantified effects on cash conversion. If the plan doesn’t restore the metrics within the agreed window, the investor shifts from “support execution” to “prepare exit options,” consistent with the original downside gate.
This structure keeps decisions consistent over time: entry underwriting sets the rules, monitoring measures reality, and action triggers translate measurement into outcomes.
2.4 Create a Repeatable Investment Memorandum Template
A repeatable investment memorandum (IM) is less about sounding thorough and more about preventing avoidable mistakes. The goal is to capture the same decision-relevant facts every time, in the same order, so an investment committee can compare deals without re-learning your process.
Investment Memorandum Purpose and Audience
Write the IM for three readers who may not share your assumptions: (1) the investment committee deciding yes/no, (2) the diligence team executing work, and (3) the portfolio manager monitoring after closing. If a section can’t help at least one of them, it probably doesn’t belong.
Template Overview
Use a consistent structure with four layers: decision summary, underwriting evidence, deal mechanics, and implementation/monitoring. Keep the first page decision-ready; everything else should support it.
Mind Map: Investment Memorandum Flow
Section-by-Section Template Text
Decision Summary
Start with a short recommendation and why it is rational given the risks.
- Recommendation: Approve / Approve with conditions / Reject.
- Proposed Investment: Amount, instrument, and expected entry date (use the date you actually plan for diligence completion; for example, 2026-02-26).
- Expected Outcome Range: Provide a base case and a downside case outcome, not a single number.
- Top Three Return Drivers: Example: pricing power, margin expansion from cost controls, and refinancing at a specified leverage target.
- Top Three Risks: Example: customer concentration, working-capital volatility, and refinancing timing.
- Mitigants That Matter: Tie each risk to a specific action or term.
Example sentence you can reuse: “We underwrite returns to margin expansion from procurement renegotiation and pricing discipline; the downside case assumes slower cost realization and delayed refinancing, with mitigants limited to covenant protections and sponsor replacement triggers.”
Deal Snapshot
This section should be factual and skimmable.
- What is being bought or financed: one paragraph.
- Who is involved: sponsor, management, key counterparties.
- Why this deal fits the strategy: one paragraph that references your thesis criteria.
- Transaction terms: purchase price, equity/debt mix, interest rate, maturity, covenants, fees, and any warrants or earn-outs.
- Use of proceeds: list the major uses and the expected timing.
Underwriting Evidence
Your model is only as good as the inputs you can defend.
- Operating assumptions: revenue growth, churn/retention, unit economics, cost structure.
- Financial statement bridge: show how operating assumptions map to margins, cash conversion, and leverage.
- Base case: the single most likely path.
- Sensitivities: show how outcomes change when one variable moves (for example, revenue growth ±2 points, gross margin ±150 bps, or collection days +10 days).
- Downside case and breakpoints: define the point where the deal stops working. Example: “If EBITDA margin fails to reach 18% by quarter 6 and leverage remains above 5.5x, we expect covenant pressure and reduced refinancing options.”
A practical rule: every sensitivity should connect to a diligence question. If you can’t ask someone for evidence on that variable, you shouldn’t model it.
Risk and Mitigation
Organize risks by category and include both “term” and “behavior” mitigants.
- Operational risks: Example: key-person dependency; mitigant: management transition plan and reporting on hiring milestones.
- Financial risks: Example: working-capital swings; mitigant: cash sweep mechanics and tighter reporting on receivables.
- Legal and governance risks: Example: information rights; mitigant: defined reporting package and audit rights.
- Liquidity and exit risks: Example: limited buyer pool; mitigant: pre-agreed process for refinancing or secondary sale triggers.
Include a short “what we will do if it goes wrong” subsection. Keep it concrete: who decides, what data triggers the decision, and what action is available.
Governance and Alignment
This is where long money earns its keep.
- Investor rights: board/observer rights, protective provisions, consent thresholds.
- Reporting cadence: monthly/quarterly financials, KPI dashboard, covenant compliance.
- Incentive alignment: fee and carry structure, hurdle conditions, and how sponsor incentives change under stress.
Example: “Sponsor receives performance fees only after specified equity return hurdles; reporting includes a covenant tracker and a KPI set tied to the value creation plan.”
Diligence Plan
Turn open questions into a work plan.
- Open questions: list 8–15 items.
- Workstreams: financial, legal, commercial, operational.
- Evidence required: what document or data proves or disproves each item.
- Owners and deadlines: assign responsibility and due dates.
Implementation and Monitoring
Close the loop so the IM doesn’t die at signature.
- Closing checklist: key conditions precedent and responsible parties.
- Monitoring dashboard: KPIs, covenant metrics, and leading indicators.
- Value creation plan: 3–5 initiatives with owners and milestones.
- Decision cadence: when you revisit underwriting assumptions.
Mind Map: Repeatability Controls
Mini Example: How It Looks in Practice
A one-paragraph decision summary for a hypothetical deal might read: “Approve $25m equity with a $40m debt component. Base case assumes revenue growth of 6% and margin improvement to 19% within 12 months, producing an IRR range of 14–18%. Downside assumes revenue growth of 2% and delayed margin realization, with leverage staying above 5.5x; mitigants include quarterly covenant reporting, a cash sweep after a defined threshold, and consent rights over refinancing terms. Diligence must confirm customer concentration and working-capital drivers before closing.”
A good template makes this level of clarity repeatable, even when the deal changes.
2.5 Document Tradeoffs Between Return Drivers and Downside Protection
Long money wins by paying for certainty where it matters and accepting uncertainty where it doesn’t. The underwriting task is not to maximize return; it’s to explain, in writing, which return drivers you trust and which downside paths you refuse to fund.
Start with a Two-Column Truth Table
Create a one-page “drivers vs. protection” table. Each row should name one return driver and one protection mechanism that offsets the most relevant failure mode.
- Return driver: the lever you expect to move (e.g., operating margin improvement, refinancing at a lower rate, multiple expansion).
- Downside protection: the mechanism that limits loss if the lever underperforms (e.g., seniority, covenants, downside pricing, reserve accounts, governance rights).
Example: If your return driver is rental growth, your downside protection might be lease rollover structure plus vacancy reserves. If your return driver is multiple expansion, your downside protection might be a floor on cash yield plus a call/repurchase right.
Map Failure Modes to Driver Assumptions
Next, document the assumptions that must be true for each driver to work. Then list the failure modes that break those assumptions.
Use a consistent pattern:
- Assumption: what must happen.
- Failure mode: what happens instead.
- Impact: how returns change.
- Protection: what prevents the impact from becoming a loss.
- Evidence: what you checked to believe the assumption.
Example: For a private credit deal, a common assumption is stable cash flow coverage. A failure mode is temporary margin compression. The impact might be covenant pressure. Protection could be cash sweep only after a buffer is used, plus interest coverage tests measured with conservative add-backs.
Mind Map: Tradeoffs You Must Write Down
Document the “If-Then” Logic Behind Your Price
A good underwriting memo makes the price feel inevitable. Write the logic as if you were explaining it to a careful colleague who will challenge every step.
Use three scenarios:
- Base: drivers work as expected.
- Adverse: one key driver underperforms.
- Severe: multiple assumptions break, but protection still limits damage.
For each scenario, state:
- which return drivers are active,
- which are muted,
- what protection absorbs the shock,
- and what loss looks like in plain numbers.
Example: Suppose you underwrite a buyout where return depends on deleveraging. In the adverse scenario, EBITDA growth is lower, so deleveraging slows. Your memo should show how mandatory amortization, excess cash sweeps, and a conservative interest rate assumption keep the downside bounded.
Use a “Protection Priority” Ranking
Not all protections are equal. Rank them by how directly they prevent permanent loss.
- First priority: protections that stop cash from disappearing (waterfalls, collateral, seniority).
- Second priority: protections that constrain behavior (covenants, governance, reporting).
- Third priority: protections that compensate you (pricing, yield floors, reserves).
Then document the tradeoff: if you rely heavily on third-priority protection, you should be stricter on entry price or accept smaller upside.
Example: If a deal has weak covenants but strong pricing, your memo should explicitly say: “We are underwriting yield as compensation for limited contractual control.” That sentence prevents later confusion when the yield is the only thing doing the heavy lifting.
Mind Map: The Underwriting Sentence That Prevents Confusion

Finish with Monitoring Triggers That Match the Tradeoff
Tradeoffs are only real if you can detect when they’re breaking. Add monitoring triggers that correspond to each driver’s assumptions.
- If the driver is revenue retention, track churn and renewal pipeline weekly or monthly.
- If the driver is refinancing, track interest rate sensitivity and lender appetite indicators at each reporting date.
- If the driver is cost reduction, track run-rate and one-time expense normalization rules.
Write the trigger as a decision rule: “If metric X falls below Y for Z periods, we will reassess the driver and either renegotiate terms, increase reserves, or reduce exposure.”
A clean memo doesn’t just predict outcomes; it explains which outcomes you can tolerate and why. That’s the tradeoff, documented.
3. Source Deals with Quality Filters and Relationship Discipline
3.1 Design a Deal Sourcing System for Direct and Intermediated Flows
A long-money sourcing system is less about finding “more deals” and more about finding the right deals at the right stage, with enough information to underwrite without guessing. The system should run on two rails: direct flow from operators and owners, and intermediated flow through brokers, bankers, and platforms. Both rails feed the same pipeline, but they enter at different points and require different screening.
Foundational Inputs and Roles
Start by defining four roles, even if one person wears multiple hats.
- Sourcing owner: maintains the pipeline, tracks conversion rates, and enforces stage definitions.
- Underwriting lead: sets what “enough information” means for each stage.
- Relationship manager: runs outreach and follow-ups, keeping context in a CRM.
- IC prep editor: ensures every opportunity has a consistent memo package.
Then define your deal stage taxonomy. For example: Targeted → Intro → NDA → First Pass → Diligence → IC Review → Term Sheet → Closed. Each stage should have a checklist of required artifacts.
Mind Map: Deal Sourcing System
Deal Sourcing System Mind Map
Direct Flow: Build Trust Without Waiting for Permission
Direct sourcing works best when you can explain your process clearly and ask for information that helps the owner decide whether to engage.
Step 1: Create a target list with real constraints. Instead of “manufacturing companies,” define constraints like EBITDA range, customer concentration tolerance, and geography. A useful target list includes a contact path: owner, CFO, or advisor.
Step 2: Use a two-message outreach sequence.
- Message A: a short note stating what you invest in and why you’re reaching out.
- Message B: a follow-up that offers a specific next step, such as a 20-minute call to confirm fit.
Step 3: Ask for underwriting-relevant facts early. For example, request a one-page summary covering revenue mix, gross margin trend, debt terms, and capex needs. If the owner cannot provide this, you learn quickly whether the opportunity is real or merely interesting.
Example: You contact a regional services business. The owner shares last three years of revenue by segment and a current debt schedule. That single packet lets your first-pass model run with fewer assumptions, so you can decide whether to proceed to NDA within a week.
Intermediated Flow: Control the Noise with Stage Gates
Intermediated deals often arrive with incomplete information and a faster timeline. Your job is to prevent “NDA sprawl” and keep the pipeline clean.
Step 1: Require a minimum data package before NDA. Examples include a teaser with basic financials, a high-level capex plan, and a preliminary debt summary. If the package is missing, you can still log the lead but you should not spend underwriting time.
Step 2: Use a pricing and timeline gate. Ask for expected process timing and whether there are competing bids. If the seller insists on a quick close but your thesis requires operational stabilization, you can decline early.
Example: A broker offers an LBO candidate with a tight timeline. The teaser shows margin compression and a large working-capital swing. Your gate flags the mismatch: you can’t underwrite the working-capital behavior without deeper data, so you request a short diligence call before signing an NDA.
Unifying the Pipeline with Conversion Metrics
Both rails should feed the same CRM pipeline with consistent stage definitions. Track conversion rates by source and stage, not just overall volume.
- If direct leads convert Intro → NDA at 30% but intermediated leads convert at 10%, you adjust outreach questions for intermediated sources or tighten your pre-NDA gate.
- If time in Diligence is long for one source, you likely need better first-pass templates or clearer diligence requests.
Practical rule: every stage should have a “definition of done.” For First Pass, define the minimum inputs needed to decide: proceed, request more info, or stop.
Operating Rhythm and Feedback Loop
Run a weekly sourcing review with three outputs: pipeline health, bottleneck diagnosis, and filter updates. When a deal fails, record the reason in a structured way: thesis mismatch, pricing, information quality, financing friction, or operational risk. Then update your outreach scripts and screening checklists so the next batch of leads starts with fewer surprises.
Example: After several intermediated leads fail due to hidden customer concentration, you add a mandatory question in your first-pass intake. The next quarter, you spend fewer hours on NDAs that would have been rejected anyway.
3.2 Evaluate Sponsor Track Records Using Evidence Not Marketing
A sponsor’s track record is only useful if you can connect it to decisions, not just outcomes. Marketing materials often show winners and omit the messy middle. Evidence-based evaluation starts by separating three things: what the sponsor says they do, what they actually did, and what you can verify independently.
Step 1: Define What “Track Record” Means for Your Deal
Before reviewing any portfolio, write down the sponsor traits that matter for your investment. For example, if you’re buying a control position in a manufacturing business, you care about operating improvements, not just financial engineering. If you’re underwriting a credit-like structure, you care about underwriting discipline, covenant awareness, and workout behavior.
A practical way to do this is to create a one-page scorecard with categories and evidence types:
- Deal sourcing quality: direct relationships, repeatable pipeline, and documented screening.
- Underwriting rigor: how they priced risk and handled downside.
- Value creation: operational levers they used and whether results match the plan.
- Capital structure competence: refinancing timing, leverage management, and liquidity planning.
- Exit execution: how they prepared for sale and managed bid processes.
Step 2: Collect Evidence That Survives Cross-Examination
Start with documents that show process, not just performance. Ask for:
- Investment memos or underwriting summaries for a sample of deals.
- Board materials, quarterly reporting, or post-close update notes.
- Waterfalls and fee schedules that show how returns were generated.
- Deal-by-deal timelines including entry price, key milestones, and exit mechanics.
Then triangulate. If the sponsor claims a turnaround worked because of pricing and retention, look for customer metrics, churn trends, and margin bridge details. If they claim refinancing success, check whether the refinancing depended on stable cash flows or on optimistic assumptions.
Step 3: Use a Portfolio Map to Find Pattern, Not Just Peaks
Sponsors can have one great year and one rough year. What matters is whether their best outcomes come from repeatable methods.
Mind Map: Sponsor Evidence Map
Step 4: Analyze Outcomes with Return Decomposition
A sponsor’s headline IRR can be inflated by timing. Decompose returns into drivers you can reason about:
- Operating growth: revenue, gross margin, EBITDA margin, and working capital discipline.
- Multiple expansion: whether the exit multiple was supported by fundamentals or by market conditions.
- Leverage and refinancing: how much return came from capital structure changes.
- Fees and carry: what you actually paid over time.
A simple example: Sponsor A reports a 2.0x multiple on a $50M equity investment. If the exit EBITDA is higher because of margin improvement and working capital release, that’s operating value. If EBITDA is flat but the exit multiple is higher, that’s multiple expansion. If leverage increased materially and cash flows were used to pay down debt, that’s capital structure value. Your underwriting should treat each driver differently.
Step 5: Stress Test the Sponsor’s Downside Behavior
Winning deals are easier to describe than losing ones. Ask for the deals that didn’t go as planned and how the sponsor responded. Evidence to request:
- What changed after underwriting assumptions broke.
- Whether they renegotiated terms, replaced management, or adjusted capex.
- How they handled liquidity constraints and covenant pressure.
Example: Evidence-Based Downside Review A sponsor says they “protected downside through active governance.” Ask for a specific case: the quarter when cash conversion deteriorated, the actions taken, and the resulting impact on runway. If they can show a timeline—early warning indicator, decision, and measurable outcome—you have evidence. If they only provide a narrative summary, you have a story.
Step 6: Score the Sponsor’s Process Consistency
Create a small set of “process questions” and score answers based on evidence strength:
- Did they document assumptions before closing?
- Did they update assumptions when facts changed?
- Did they use the same value creation levers across similar deals?
- Did exits follow a preparation plan rather than a last-minute scramble?
A sponsor with strong process will show consistent documentation quality across deals, not just the best performers.
Step 7: Translate Findings into Your Investment Decision
Close the evaluation by linking evidence to your deal’s risk. If the sponsor’s track record shows strong operating improvements but weak refinancing discipline, that matters if your structure depends on refinancing. If their exits rely heavily on multiple expansion, that matters if your underwriting assumes stable exit pricing.
The goal is not to crown a sponsor. It’s to decide whether their demonstrated behavior matches the job your investment needs them to do.
3.3 Use Quality Filters to Avoid Competitive and Overpriced Situations
Quality filters are the rules you apply before you fall in love with a deal. They prevent two common failure modes: (1) competing with better-capitalized or better-informed bidders, and (2) paying a price that assumes everything goes right. The goal is not to avoid competition entirely; it’s to avoid the kind of competition where your underwriting assumptions get steamrolled by the auction.
Start with What You Can Control
You can’t control who else is bidding, but you can control what you will accept. Begin by defining three “hard gates” that must be true before you spend serious time.
- Information gate: You can explain the business model and cash conversion using evidence you can verify. If key inputs rely on vague assurances, you’re not underwriting—you’re hoping.
- Economics gate: Your base-case return clears your minimum threshold at a conservative entry price. If you need optimistic refinancing terms or perfect execution to reach the bar, the deal is already priced for wishful thinking.
- Alignment gate: The sponsor’s incentives match the value-creation levers you plan to pull. If the sponsor benefits most from selling quickly rather than improving fundamentals, your upside is capped by their timeline.
Example: A sponsor offers a “turnaround” with a 30% EBITDA uplift target. Your filter asks for three years of margin drivers, not just a narrative. If the company can’t show how working capital, pricing, and labor productivity will move together, you stop. That’s not pessimism; it’s refusing to underwrite a story.
Build a Quality Scorecard That Survives an Auction
Once hard gates pass, use a scorecard to compare deals on the dimensions that predict whether you’ll overpay.
- Competitive pressure indicators: multiple bidders, short diligence windows, heavy marketing, or “last best offer” language early in the process.
- Pricing transparency: whether the seller can justify valuation with comparable transactions, not only internal projections.
- Underwriting robustness: how many assumptions are required to make the deal work, and how sensitive returns are to each.
- Operational leverage clarity: whether value creation depends on controllable actions (pricing discipline, cost structure, sales retention) rather than one-off events.
Example: Two deals look similar on paper. Deal A has a longer diligence timeline and provides customer churn cohorts. Deal B compresses diligence and provides only aggregate revenue. Even if Deal B offers a slightly higher headline return, your scorecard flags higher uncertainty and higher competitive pressure—so you require a larger price discount to compensate.
Use a “Price-to-Underwriting” Check
Overpriced situations often hide behind attractive headline yields. A practical filter is to compute what price would be “fair” under your underwriting, then compare it to the offered price.
- Calculate your base-case and downside-case enterprise value (or equity value) based on cash flows and realistic exit assumptions.
- Define a maximum entry price that still meets your minimum return in the downside case.
- If the offered price exceeds your maximum, you either renegotiate terms or walk.
Example: Your downside case assumes slower revenue recovery and a refinancing that happens later than planned. That pushes your maximum entry price down by 12%. If the seller’s asking price is only 5% below the “optimistic” valuation, you’re effectively buying the optimistic scenario. Your filter says no.
Apply Term Filters That Reduce the Cost of Being Wrong
Sometimes you can’t change the price, but you can change how you’re protected.
- Downside participation: structures that let you benefit if performance is worse than expected (for example, equity-like protection through preferred returns with clear triggers).
- Covenant and reporting clarity: frequent reporting and measurable covenants reduce the chance that problems surface after the damage is done.
- Reinvestment and fee drag limits: ensure fees don’t consume the margin of safety you’re relying on.
Example: A deal is priced aggressively, but it includes tighter reporting, a clear budget approval process, and a mechanism to adjust economics if certain milestones aren’t met. Your filter still requires a price concession, but the terms reduce the downside cost of overpaying.
Mind Map: Quality Filters for Avoiding Overpriced Competition
A Simple Decision Rule You Can Actually Use
When a deal is offered at a price that exceeds your maximum entry price, don’t negotiate emotionally. Use a two-step rule: (1) require a price concession to restore your downside return, and (2) if price can’t move, require term protections that reduce the downside cost of being wrong. If neither is possible, the quality filter does its job and you move on.
Example: The seller won’t reduce price, but you can add milestone-based economics and stronger reporting. If those changes restore your downside return to acceptable levels, you proceed. If they don’t, you decline—even if the deal is “good.”
3.4 Structure First Conversations to Gather Underwriting Relevant Information
A first conversation should produce two things: (1) enough facts to underwrite without guessing, and (2) enough clarity to decide whether you should spend more time. The trick is to treat the call like a structured data-collection session, not a sales pitch or a therapy session.
Foundational Goal and Call Flow
Start with a simple agenda: confirm context, map the business, test the numbers, and identify decision constraints. A practical flow is 45–60 minutes:
- Confirm what is being offered and why now.
- Establish the business model and revenue mechanics.
- Verify financial quality and drivers.
- Review risks that could break the underwriting.
- Agree on next steps and what documents you need.
If the seller cannot answer a question with specifics, ask for the closest measurable proxy. “We think churn is low” becomes “What is monthly churn for the last 12 months, and how is it calculated?”
What You Need to Learn Before You Underwrite
Underwriting-relevant information falls into five buckets. Each bucket should have at least one question that forces a measurable answer.
- Deal Scope and Constraints
- What exactly is for sale: equity, assets, a minority stake, or a continuation structure?
- What is the expected timeline and what approvals are required?
- What is the seller’s reason for exiting, stated in operational terms (not just “focus on other things”)?
- Business Model and Revenue Mechanics
- How do customers buy and renew, and what triggers non-renewal?
- What portion of revenue is recurring versus one-time?
- Example: If it is a B2B subscription, ask for renewal cohorts and the average contract length.
- Financial Quality and Normalization
- What are the top three line items that management adjusts, and why?
- How are one-time expenses treated, and what is recurring?
- Example: If EBITDA is adjusted for “owner expenses,” ask for a schedule showing each item and whether it will persist after the transaction.
- Unit Economics and Operating Levers
- What drives gross margin: pricing, mix, utilization, or input costs?
- What drives operating expense: headcount, sales efficiency, or overhead allocation?
- Example: For a services business, ask for utilization rates and how billing ties to capacity.
- Risk Map and Downside Triggers
- What has hurt performance in the past 24 months?
- Which covenant or liquidity constraint would be most likely to be breached?
- Example: If customer concentration is high, ask for the revenue share of the top 5 customers and whether any have contract termination rights.
Question Design That Produces Evidence
Use “measure-first” questions. They reduce the chance of getting confident but unusable answers.
- Ask for definitions: “How do you define churn?”
- Ask for time windows: “Show the last 12 months monthly.”
- Ask for calculation: “How do you compute revenue recognition for annual contracts?”
- Ask for variance: “What changed quarter over quarter and why?”
When you hear a vague answer, respond with a narrowing question rather than a rebuttal. “Understood. What metric would you use to show that change?”
Mind Map: First Conversation Underwriting Inputs
Example: A 60-Minute Call Script That Stays Useful
Minute 0–10: Scope and timeline
- “What is being sold, and what is the target close date?”
- “What approvals or consents could delay closing?”
Minute 10–25: Revenue mechanics
- “Walk me through the customer journey from first sale to renewal.”
- “What is the churn definition and the monthly churn for the last 12 months?”
Minute 25–40: Financial quality
- “Show the top adjustments to EBITDA and whether each is expected to recur.”
- “How is revenue recognized for annual contracts?”
Minute 40–55: Operating levers and risks
- “What drives gross margin changes quarter to quarter?”
- “Which customer or contract terms have the biggest downside risk?”
Minute 55–60: Next steps
- “To underwrite, we need these documents: normalization schedule, cohort report, and customer concentration list. Can you provide them by [date]?”
A concrete next-step list prevents the classic failure mode: “We’ll send it soon” with no measurable deliverables.
Case Study: When the Call Reveals a Deal Break
A buyer hears “high retention” but cannot provide churn definition. In the follow-up, the seller’s churn metric excludes customers who downgrade rather than cancel. Underwriting then shows that the true downgrade rate would reduce revenue growth assumptions. The deal is paused because the revenue mechanics were not evidence-backed in the first conversation.
The lesson is simple: if you cannot tie claims to definitions, time windows, and calculations, you are not underwriting—you are hoping.
3.5 Maintain a Deal Log That Supports Post Mortems and Learning
A deal log is not a graveyard of PDFs. It’s a structured record that lets you answer, with evidence, why you made a decision, what you expected, what happened, and what you changed next time. The goal is simple: reduce the number of times you “learn” the same lesson twice.
What to Capture from Day One
Start the log when the first term sheet draft exists, not after closing. For each deal, record:
- Decision context: why this deal fit your thesis, and what you believed about the sponsor or business.
- Key assumptions: the 5–10 inputs that drive returns (growth rate, churn, margin, default probability, exit multiple, refinancing timing).
- Risk register: the top failure modes and how you planned to respond.
- Structure and protections: covenants, governance rights, reporting requirements, and any “we’ll handle it later” items.
- Pricing rationale: what made the entry price acceptable given the assumptions.
- Owner and cadence: who monitors what, and when you review it.
A practical rule: if you can’t point to the assumption that later proved wrong, your post mortem will turn into a vibes-based meeting.
How to Keep It Usable During the Life of the Deal
A log that only updates at exit is a museum exhibit. Instead, treat it like a living worksheet:
- Update assumptions when facts change. If revenue retention drops, record the date, the magnitude, and whether the underwriting assumption was revised.
- Record decisions immediately. When you approve a waiver, refinance, or budget change, capture the rationale and the alternatives you considered.
- Track evidence, not just outcomes. For example, note whether the issue was operational (pricing, sales pipeline) or financial (working capital, leverage).
Use consistent labels so you can search later. “Refinancing risk” should mean the same thing across deals, not a different phrase each time.
Post Mortems That Produce Action, Not Blame
A good post mortem connects four layers: inputs → decision → execution → results.
- Inputs: Which assumptions were most influential? Were they supported by evidence at the time?
- Decision: Did the decision follow your framework and gates? If not, why?
- Execution: Were there delays, reporting gaps, or governance friction that changed outcomes?
- Results: What actually happened, and how close were you to the expected path?
Then convert findings into changes you can apply. Examples:
- If the sponsor’s reporting was late, update your closing checklist to require a specific cadence and escalation path.
- If a model failed because of one missing variable, add that variable and define its data source.
- If you consistently underestimated downside correlation, tighten your scenario set and entry price discipline.
Mind Map: Deal Log to Learning Loop
Example: A Log Entry That Makes Post Mortems Easy
Deal: Mid-market software buyout
- Assumption: Net revenue retention of 112% for year 1, based on cohort data.
- Risk: Churn spike after pricing changes; mitigation was quarterly retention reporting and a pricing governance vote.
- Decision: Entry price justified by expected margin expansion and retention stability.
- Update on 2026-02-15: Retention fell to 104% earlier than expected. The log records the date, the cohort segment affected, and whether the pricing governance vote occurred.
- Decision record: On 2026-03-01, you approved a budget shift from new features to customer success. The log notes the alternative rejected and the specific metric used to judge success.
- Outcome: Exit multiple was lower than expected, but the operational plan reduced churn enough to preserve cash flow.
In the post mortem, you can separate what went wrong (retention timing) from what went right (mitigation effectiveness) without rewriting history.
Example: Turning a Repeated Mistake into a System Change
If multiple deals show the same pattern—late refinancing decisions causing covenant stress—your log should reveal whether the issue is:
- Underwriting: you assumed refinancing would be available when it wasn’t.
- Monitoring: you didn’t detect the early liquidity signal.
- Governance: you lacked timely approval rights.
Once you identify the layer, you can change one thing at a time. For instance, add a refinancing trigger rule to the monitoring cadence: when leverage exceeds a threshold for two consecutive quarters, the sponsor must present options within 30 days.
A Simple Template for Consistency
Deal Log Template
- Deal name and ID
- Thesis fit and decision date
- Key assumptions (top 5–10)
- Risk register (top failure modes)
- Structure and protections
- Pricing rationale
- Monitoring owner and cadence
- Timeline of decisions and updates
- Post mortem date and findings
- Actions taken and where they were applied
A deal log works when it’s consistent enough to compare deals and detailed enough to explain outcomes. When that happens, post mortems become a disciplined way to improve underwriting, execution, and monitoring—without turning every meeting into a courtroom.
4. Underwrite Private Assets with Long Money Assumptions
4.1 Model Cash Flows with Multiple Operating Scenarios
Long money underwriting starts with a simple question: what cash flows do we actually expect under different ways the business can go? Multiple operating scenarios answer that question without pretending the future is knowable. The goal is not to create a spreadsheet that looks confident; it’s to create one that behaves honestly when assumptions change.
Start with the Cash Flow Engine
Build your model around a consistent cash flow “engine” that can be driven by operating assumptions. A practical structure is:
- Revenue drivers (volume, price, churn, utilization)
- Operating costs (fixed vs variable, labor, materials, support)
- Working capital (receivables, payables, inventory, contract assets)
- Capital expenditures (maintenance vs growth)
- Financing (interest, scheduled principal, fees, refinancing assumptions)
- Taxes (using an appropriate tax rate and loss carry logic if relevant)
Even if you ultimately model equity returns, the cash flow engine should begin with enterprise cash flows and then flow through financing.
Define Scenarios Before You Estimate Numbers
Scenarios are not “best case” and “worst case” vibes. They are coherent operating stories that change a small set of drivers. Use three to five scenarios to keep the model readable.
- Base case: what you would bet on if you had to be right more often than not.
- Downside case: what breaks first, and how quickly it shows up in cash.
- Upside case: what improves, but only through mechanisms you can explain.
- Stress case (optional): a targeted failure mode, such as margin compression plus slower collections.
A good scenario changes drivers that are connected. If revenue falls but costs magically fall faster with no mechanism, your model will lie.
Translate Operating Stories into Driver Changes
Pick a small set of drivers and map each scenario to them. For example, in a subscription business:
- Revenue = customers × ARPU × (1 − churn)
- ARPU changes with pricing and mix
- Churn changes with retention and product quality
- Costs include customer support per active customer and hosting per usage
- Working capital depends on billing cycles and collections
Now you can specify how each scenario changes those drivers.
Example: A Simple Operating Model for a Subscription Business
Assume a company with 100,000 customers today, ARPU of $50/month, and churn of 3% monthly. Costs are 40% variable (support and hosting) and 25% fixed (management and overhead) of revenue. Working capital is modeled via receivables days: 30 days of revenue outstanding. Capex is 2% of revenue annually, spread evenly by quarter. Taxes are ignored for simplicity.
Base case assumptions
- ARPU stays at $50
- Churn stays at 3%
- Variable cost stays at 40% of revenue
- Receivables days stay at 30
Downside case assumptions
- ARPU drops to $47
- Churn rises to 4.5%
- Variable cost rises to 43% of revenue (more support per customer)
- Receivables days extend to 45
Upside case assumptions
- ARPU rises to $52
- Churn drops to 2.5%
- Variable cost falls to 39% of revenue
- Receivables days improve to 25
From these, you compute quarterly revenue, operating profit, working capital change, and capex. The key is that the downside case hits both the income statement (lower revenue, higher variable costs) and the cash statement (slower collections). That dual impact is often where fast money models get surprised.
Mind Map: Scenario Modeling Workflow
Add Advanced Details Without Losing Control
Once the engine works, add details that matter for cash timing.
- Working capital timing: model collections and payables explicitly rather than using a single “% of revenue” shortcut.
- Capex phasing: maintenance capex often doesn’t scale down quickly, even when revenue dips.
- One-time items: treat them as separate lines with clear triggers, not as hidden adjustments.
- Debt constraints: if the deal has covenants, compute cash available for debt service and show where it fails.
Sanity Checks That Prevent Self-Deception
Before you trust results, run three checks:
- Cash vs profit: in the downside case, cash should generally deteriorate at least as fast as profit when working capital worsens.
- Magnitude plausibility: a small driver change should not create a huge cash swing unless leverage or timing amplifies it.
- Scenario coherence: every scenario should have a short list of driver changes that could plausibly occur together.
When these checks pass, your multiple operating scenarios become a tool for decision-making rather than a decoration for the underwriting memo.
4.2 Incorporate Financing Structure and Refinancing Risk into Returns
Long money returns in private deals are rarely just about operating performance. They also depend on how the deal is paid for today and how it can be paid for later. Financing structure sets the “math path” from cash flows to equity outcomes, while refinancing risk determines whether that path stays open.
Foundational Concepts That Drive Equity Outcomes
Start with three building blocks:
- Capital stack order: Senior debt gets paid first, then mezzanine or preferred, then common equity. Equity returns are therefore a residual.
- Cash flow allocation: Interest, principal, and fees consume cash before equity sees anything.
- Maturity and amortization: A loan that amortizes slowly can look fine until the maturity wall arrives.
A simple example: if a business generates $10M of annual EBITDA and costs $6M in operating expenses, the remaining cash may still not reach equity if debt service is $5M and covenants restrict distributions.
Financing Structure: What Changes the Return Profile
Financing structure affects returns through five levers.
- Interest rate type: Fixed rates reduce uncertainty; floating rates can shift returns even if operations are stable. In underwriting, model both the base case and a stressed rate scenario.
- Amortization schedule: Faster amortization reduces refinancing exposure and can improve downside outcomes, even if it slightly lowers near-term equity IRR.
- Covenants and restricted payments: Tight covenants can block equity distributions during temporary underperformance.
- Payment-in-kind or toggle features: If some interest accrues instead of being paid, equity may look better early while leverage quietly rises.
- Equity contribution timing: Delayed equity funding can increase early leverage and worsen refinancing risk.
Example: Same Business, Different Financing
Assume a sponsor buys a company for $200M enterprise value.
- Structure A: 60% senior debt at 9% fixed, 5-year maturity, moderate amortization.
- Structure B: 60% senior debt at 9% floating, 3-year maturity, minimal amortization.
If EBITDA stays flat and the company can cover interest in both cases, Structure A still tends to produce steadier equity because principal is reduced before the maturity date. Structure B can force a refinancing at a worse time, turning “flat operations” into “loss of optionality.”
Refinancing Risk: The Failure Modes to Model
Refinancing risk is not just “rates might be higher.” It’s about whether lenders will refinance on acceptable terms given the borrower’s condition.
Model these failure modes explicitly:
- Cash flow shortfall: EBITDA declines or working capital absorbs cash, reducing coverage.
- Covenant breach: Even if the lender would refinance, a breach can trigger default mechanics or require immediate paydown.
- Credit spread widening: Lenders demand higher pricing or lower leverage.
- Value reset: If the company’s valuation drops, lenders may refuse the same loan-to-value.
- Liquidity and fees: Refinancing can require fees, hedging costs, or additional reserves.
How to Incorporate Financing into Underwriting Returns
Use a cash flow model that tracks debt balances and covenant capacity through time.
- Build a debt schedule: opening balance, interest, amortization, fees, and maturity payoff.
- Link covenants to distributions: if coverage falls below a threshold, set equity distributions to zero or reduced levels.
- Create a refinancing decision rule: at each maturity date, either refinance on assumed terms or model a forced deleveraging event.
- Run scenarios that change financing outcomes: not just EBITDA. Change coverage, interest rate, and refinancing terms together.
Mind Map: Financing Structure and Refinancing Risk
Case Study: A Practical Refinancing Rule
Consider a 3-year loan with a $120M balance at maturity. Underwriting assumes refinancing at 7.5% with 5.0x leverage.
Set a rule:
- If EBITDA coverage stays above 2.5x and net leverage stays below 5.0x, refinance proceeds.
- If either fails, model a deleveraging: equity receives less, and the deal may require an asset sale or an equity top-up.
This rule forces the model to “care” about financing conditions, not just operating averages. It also prevents a common mistake: assuming refinancing always happens because it happened in the sponsor’s last deal.
Advanced Details Without Overcomplication
To keep the model usable, separate assumptions into three layers:
- Operating layer: EBITDA, working capital, capex.
- Financing layer: interest type, amortization, fees, covenant thresholds.
- Refinancing layer: maturity date terms, lender haircut to leverage, and a deleveraging severity.
When these layers interact, returns become interpretable. If equity IRR drops, you can point to whether the cause is reduced cash flow, blocked distributions, or a refinancing event that changes the payoff waterfall.
4.3 Treat Value Creation as a Set of Measurable Levers
Value creation in private deals is easiest to manage when it is treated like a system: inputs you can influence, outputs you can measure, and feedback loops you can tighten. Instead of hoping the business “turns around,” define a small set of levers that connect operational actions to financial results.
Start with a simple chain: lever → operational metric → financial impact. For example, changing pricing affects win rate and gross margin, which affects EBITDA, which affects cash flow available for debt service and eventual exit valuation. If you cannot draw that chain for a lever, it is probably a wish, not a lever.
Lever Design Principles
- Measurable: Each lever must map to at least one metric you can track weekly or monthly.
- Controllable: You need decision rights or strong influence over the lever. If you only own capital, focus on levers that management can execute with clear support.
- Time-Bound: Assign a realistic measurement window. Some levers show results in weeks (collections), others in quarters (product mix).
- Non-Duplicative: Avoid stacking levers that are the same thing under different names. If two levers move the same metric, pick one as primary and the other as a supporting indicator.
Core Lever Categories
Most value creation can be grouped into five categories. The trick is to keep the list short enough to act on.
- Revenue quality: pricing, retention, conversion, and channel mix.
- Cost structure: direct costs, labor productivity, overhead discipline.
- Working capital: collections, inventory turns, payables strategy.
- Capital efficiency: capex intensity, maintenance vs growth spending.
- Risk and resilience: customer concentration, churn drivers, compliance and operational reliability.
Mind Map: Value Creation Levers
Example: Turning Levers into a Measurement Plan
Assume a mid-market services business with EBITDA pressure from margin drift and cash strain. The investment thesis is not “grow revenue.” It is: improve net margin and free cash flow.
Pick three levers and define metrics:
-
Pricing discipline
- Lever action: tighten discount approvals and standardize quote templates.
- Metric: net price realization (net revenue per billed hour or per unit).
- Financial impact: higher gross margin without changing headcount.
-
Collections and dispute reduction
- Lever action: weekly billing review, tighter dispute workflow, and escalation rules.
- Metric: DSO and % invoices past due by bucket.
- Financial impact: faster cash conversion, reducing reliance on short-term borrowing.
-
Labor productivity
- Lever action: route work to the right teams, reduce rework, and improve scheduling.
- Metric: revenue per FTE and overtime hours as a percentage of total hours.
- Financial impact: lower labor cost per revenue unit, supporting EBITDA.
Now connect them to outcomes. If net price realization rises by 2% and labor productivity improves enough to reduce labor cost per revenue unit, EBITDA increases. If DSO drops, free cash flow improves even if EBITDA growth is modest. That separation matters because cash and earnings can move differently.
Example: Lever Tradeoffs You Must Measure
Suppose management proposes a “growth lever” by adding discounts to win larger contracts. That can raise revenue while quietly damaging margin. The measurable lever is not “win more deals.” It is net price realization and gross margin per contract. If discounting increases win rate but lowers net margin, the lever fails.
Similarly, pushing working capital too hard can hurt revenue if customers experience service delays. That is why working capital levers should be paired with a service metric such as on-time delivery or ticket backlog.
From Levers to Operating Cadence
A lever without a cadence becomes a spreadsheet. Create a monthly operating rhythm:
- Weekly: collections status, pricing exceptions, and top operational blockers.
- Monthly: margin bridge review, labor productivity trends, and working capital roll-forward.
- Quarterly: reassess lever assumptions, but only after the metrics have enough data to be meaningful.
This is how long money earns its keep: not by predicting outcomes, but by making the business measurable enough that outcomes can be influenced.
4.4 Stress Test for Covenant Breaches and Liquidity Shortfalls
Long money underwriting assumes you will not get perfect information at the worst moment. A stress test is how you check whether the deal still survives when reality shows up with bad timing: revenue slips, costs rise, refinancing becomes expensive, and cash gets stuck in working capital. The goal is not to predict the future; it is to map which failures break the investment and how quickly.
Foundational Inputs You Must Stress
Start with the covenant package and the cash engine.
- Covenants: Identify each covenant, its calculation method, measurement frequency, and cure rights. Common examples include leverage ratios, interest coverage, minimum liquidity, and restrictions on additional debt.
- Liquidity sources and uses: Build a cash waterfall for each quarter: beginning cash, operating cash flow, capex, debt service, required reserves, and any scheduled distributions.
- Cash conversion: Model working capital drivers separately from profitability. A business can be “profitable” and still miss liquidity if receivables stretch or inventory builds.
- Financing mechanics: Include interest rate resets, amortization schedules, fees, and any refinancing assumptions embedded in the base case.
A practical rule: if you cannot explain how the covenant number is computed from the financial statements, you cannot stress it.
Stress Scenarios That Actually Stress
Use a small set of scenarios that represent distinct failure modes. Each scenario should change a few key inputs, not everything at once.
- Operating shortfall: Revenue declines and/or gross margin compresses. Keep the timing realistic by applying the shock to the next two measurement periods.
- Cost inflation: Operating expenses rise faster than revenue. This often hits EBITDA and interest coverage before it hits cash, then catches up.
- Working capital squeeze: Days sales outstanding increases and/or days inventory increases. This can drain cash even if EBITDA holds.
- Refinancing friction: New debt costs more, maturities are pushed out, or lenders tighten terms. Model both higher interest and reduced proceeds.
- Combined stress: Pair operating shortfall with working capital squeeze. This is the scenario that most often produces covenant breaches and liquidity shortfalls together.
Mind Map: Covenant and Liquidity Stress Test
Building the Stress Model Step by Step
- Compute covenant metrics under base case. For each covenant, calculate the metric exactly as the lender would. Record the headroom: how far the metric can move before breaching.
- Apply scenario shocks to the cash engine. For each quarter, update operating cash flow, working capital, and debt service. Then compute ending cash.
- Translate cash stress into covenant stress. Many covenants are based on accounting numbers, but those numbers are affected by cash decisions: interest expense, amortization, and sometimes reserve levels.
- Track timing, not just magnitude. A deal that breaches in quarter 6 is different from one that breaches in quarter 2. Timing determines whether cure actions are feasible.
- Add behavioral assumptions carefully. For example, if management cuts capex under stress, reflect it with a clear link to the cash flow statement rather than a vague “they will manage.”
Example: Leverage Covenant Meets Liquidity Reality
Assume a sponsor invests in a company with a quarterly leverage covenant measured as Net Debt / EBITDA. Base case shows leverage at 4.0x with a covenant limit of 5.0x, giving 1.0x headroom.
- Scenario A operating shortfall: EBITDA drops 15% for two quarters. Net debt rises because cash is used for debt service while EBITDA is lower.
- Scenario B working capital squeeze: Receivables extend by 20 days, reducing cash by a fixed amount each quarter.
In the combined stress, leverage breaches in quarter 3 because EBITDA falls while net debt increases. Separately, liquidity hits a minimum cash threshold in quarter 2 due to working capital drain. The key insight: liquidity stress can arrive earlier than covenant breach, forcing management to take actions that then affect EBITDA and accelerate the covenant failure.
Turning Stress Results into Decisions
A useful stress test ends with decision triggers that are specific and actionable.
- Covenant headroom thresholds: If headroom is below a defined buffer under combined stress, require renegotiation of covenant terms or additional protections.
- Liquidity runway: If ending cash falls below the minimum covenant-linked liquidity level before the next measurement date, treat it as a breach risk even if the covenant metric is not yet calculated.
- Cure feasibility: If cure rights exist, test whether the cure can be funded from available sources without destroying the investment thesis.
The best underwriting question is simple: “If this scenario happens, what exactly do we do, when do we do it, and who pays?”
4.5 Validate Key Inputs With Triangulation Across Data Sources
Private deal underwriting lives or dies on inputs: growth rates, margins, churn, default probabilities, recovery assumptions, and timing. Triangulation is the habit of checking each key input using multiple independent sources, then reconciling differences into a defensible range. The goal is not to “find the one true number.” The goal is to understand why numbers disagree and which assumptions are most likely to be wrong.
Start with an Input Inventory and a Confidence Level
List every assumption that materially moves the valuation or return. For each, assign a preliminary confidence level based on how directly it can be observed. For example, a trailing twelve-month revenue number from audited financials is high confidence; a forecasted customer churn rate for a new product line is low confidence.
A simple rule: if an input is both high-impact and low-confidence, it must be triangulated with at least three sources or explicitly bounded with a conservative range.
Triangulate Using Three Lenses
Use three lenses that rarely fail in the same way:
- Primary financial evidence: audited statements, management accounts, bank statements, invoices, cap table records.
- Operational evidence: CRM exports, usage logs, production metrics, pipeline reports, maintenance records.
- Market and contractual evidence: customer contracts, pricing schedules, renewal terms, comparable transactions, credit agreements.
When you triangulate, you’re looking for consistency in direction and magnitude, not identical values.
Example: Validating Revenue Growth for a SaaS Buyout
Suppose you’re underwriting a SaaS company and the model uses 25% annual recurring revenue (ARR) growth.
- Primary lens: Review ARR bridge schedules from the last two quarters. Confirm that growth is driven by net new ARR plus expansion, not accounting reclassifications.
- Operational lens: Pull cohort retention and churn by month. If churn is trending down but the ARR bridge shows flat expansion, the growth assumption may be overstated.
- Market/contract lens: Check pricing tiers and discounting policies in signed contracts. If discounts are increasing, net revenue retention may be lower than historical gross retention suggests.
Reconciliation step: if the operational lens implies churn is 1.5% higher than management reports, adjust churn upward and re-run the model. If the market lens shows discounts are contractually capped, you can narrow the discount impact and keep the growth assumption within a smaller band.
Example: Validating Default and Recovery for a Credit Investment
For a private credit deal, key inputs often include default probability, loss given default (LGD), and timing.
- Primary lens: Examine historical covenant compliance, payment history, and prior restructuring outcomes for similar borrowers.
- Operational lens: For asset-backed or cash-flow lending, validate collateral performance metrics (occupancy, utilization, receivables aging) that support recovery.
- Market/contract lens: Read the credit agreement for collateral priority, intercreditor terms, and cure rights. A “high recovery” assumption that ignores seniority is just wishful thinking with spreadsheets.
Reconciliation step: if contract terms indicate a recovery haircut due to priority differences, lower LGD even if historical recoveries look better.
Reconcile Differences with a Structured Approach
When sources disagree, categorize the discrepancy:
- Timing mismatch: One source is cash-based, another is accrual-based. Align periods before comparing.
- Definition mismatch: “Churn” may mean logo churn in one report and revenue churn in another.
- Coverage mismatch: A dataset may exclude certain customer segments or geographies.
- Selection bias: Management may report only “representative” cohorts.
Then decide whether to adjust the assumption, adjust the mapping, or bound it. Bounding is appropriate when you cannot confidently correct the mapping but you can quantify the downside range.
Use a Triangulation Mind Map
Triangulation Mind Map
Turn Triangulation into Model Discipline
After reconciliation, update the model inputs and add monitoring triggers tied to the assumptions. If churn is validated using cohort data, define a trigger for churn drift by cohort segment. If recovery is validated using collateral performance, define a trigger for collateral deterioration metrics.
Finally, document the “why” in plain language: which source was most reliable for which part of the assumption, what mismatch existed, and what you did about it. That documentation becomes the fastest way to prevent the same mistake from reappearing in the next deal.
Quick Checklist for the Underwriting File
- Every high-impact, low-confidence input has at least three lenses.
- Disagreements are categorized as timing, definition, coverage, or selection.
- The model uses reconciled values or bounded ranges, not raw numbers.
- Monitoring triggers map directly to the validated assumptions.
5. Price Risk with Downside First Thinking and Margin of Safety
5.1 Identify The Most Likely Failure Modes in Private Deals
Private deals fail for a small set of reasons, but those reasons show up in different costumes: a cash crunch, a covenant breach, a stalled turnaround, or a “we’ll fix it later” operating plan. The goal here is to identify the failure modes that are both (1) plausible for the specific deal and (2) damaging enough to matter for long-money underwriting.
Start with a simple foundation: every private investment has a cash path (how money moves), a control path (who can steer decisions), and an information path (how quickly problems become visible). Failure modes usually break one or more of these paths.
Failure Mode Categories That Actually Show Up
-
Cash Flow Breaks Before Value Creation The business misses revenue, margins, or timing. In private deals, the timing mismatch is common: costs hit monthly, while collections lag. Example: a software services company wins a contract but delivery capacity is constrained, so invoices go out later than modeled. Even if the long-term customer relationship is solid, the near-term cash gap can force expensive refinancing or an equity top-up.
-
Financing Structure Creates Forced Choices Returns can look fine on paper, but the debt schedule or covenants force action at the worst time. Example: an acquisition is underwritten with a refinancing assumption in year two. If EBITDA dips for two quarters, the lender tightens terms or blocks the refinance, turning a manageable dip into a permanent loss of flexibility.
-
Underestimated Operating Levers The plan depends on changes that are harder than expected: pricing discipline, churn reduction, procurement savings, or turnaround execution. Example: a manufacturing buyer assumes a 5% scrap reduction from process changes. During diligence, the team sees pilot results, but the pilot was run with extra attention and temporary staffing. After closing, the operational lift takes longer, and the margin improvement arrives late.
-
Governance and Incentives Misalign Even good operators can make bad decisions if incentives push them toward short-term optics. Example: management is rewarded for revenue growth but not for working-capital discipline. The company grows sales by extending payment terms, which inflates revenue while cash drains.
-
Information Lag Hides Problems Problems are real, but reporting is slow or metrics are incomplete. Example: a healthcare services provider reports revenue monthly, but the key driver is claim denials and reimbursement timing. If those metrics are reviewed quarterly, the first “surprise” shows up only when cash already fell.
-
Exit Path Requirements Are Ignored Some deals fail because the exit needs conditions that the underwriting never truly tested. Example: a sponsor plans a sale based on a multiple expansion narrative, but the buyer pool requires a clean customer concentration profile. If one major customer churns, the exit becomes a discount sale or a longer hold with higher carrying costs.
Mind Map: Failure Modes and Their Signals
Turn Failure Modes into Testable Questions
For each category, translate it into a diligence question and a measurable early-warning signal.
- Cash flow breaks: “What is the worst month-to-month cash conversion we’ve seen?” Early-warning signal: days sales outstanding rising for two consecutive periods.
- Financing structure: “Which covenant is closest to the line, and what would push it over?” Early-warning signal: leverage ratio trending toward the threshold while EBITDA is still “fine” on paper.
- Operating levers: “What evidence shows the lever works at scale, not just in a pilot?” Early-warning signal: operational KPIs improve slower than the plan’s ramp curve.
- Governance and incentives: “Which decisions are made without the investor’s input, and who benefits if things go wrong?” Early-warning signal: budgets approved that increase risk without corresponding mitigation.
- Information lag: “How quickly would we know if the key driver moved against us?” Early-warning signal: variance between leading metrics and financial outcomes widening.
- Exit path: “What buyer requirements would be violated by the most likely adverse scenario?” Early-warning signal: customer concentration or compliance items deteriorating.
Example: A Deal That Looks Fine Until You Map Failure Modes
A private equity sponsor considers buying a regional distributor. The model shows steady growth and stable gross margin. The failure-mode map highlights two likely risks: working capital swings and exit requirements.
During diligence, the distributor’s sales growth is tied to offering longer terms to win accounts. The cash conversion cycle is already stretched, and the lender’s covenant is based on leverage that includes cash flow timing effects. The sponsor then tests the plan: if collections slip by 30 days for three quarters, the company breaches liquidity thresholds before margin improvements arrive. The deal isn’t “bad,” but the underwriting must either reprice the risk, add liquidity protection, or restructure terms so the business can survive the cash gap without forcing a bad decision.
The practical takeaway is simple: the most likely failure modes are the ones that combine plausible drivers with measurable signals that appear early enough to act. If you can’t name the failure mode and the signal, you’re not underwriting—you’re hoping.
5.2 Use Sensitivity Analysis to Quantify Sensible Ranges
Sensitivity analysis answers a practical question: “If a few key assumptions move, how does the outcome move?” In long money investing, you’re not trying to predict the future; you’re trying to avoid being surprised by it. The goal is to translate uncertainty into a range you can defend.
Start with the Outcome You Actually Care About
Pick one primary outcome and keep it consistent across scenarios. Common choices are:
- Equity IRR (after fees and financing costs)
- Net cash-on-cash at a target hold period
- Probability of covenant breach or liquidity shortfall
Example: You’re underwriting a private credit deal. Your primary outcome is “equity IRR over five years.” Secondary outcomes include “minimum interest coverage” and “expected recovery if refinancing fails.”
Identify the Assumptions That Matter Most
Sensitivity works best when you focus on a small set of drivers. A good rule is to start with 5–8 assumptions that plausibly move and plausibly change returns.
Typical drivers in private deals:
- Revenue growth rate and timing
- Gross margin or EBITDA margin
- Operating expense growth
- Working capital intensity (cash conversion cycle)
- Capex level and cadence
- Interest rate or refinancing spread
- Exit multiple or sale price
- Default probability and recovery rate
Example: For a buyout, you might choose EBITDA margin, revenue growth, capex, and exit multiple. For a credit deal, you might choose default probability, recovery, and refinancing spread.
Build a Simple Base Case Model
Before you vary anything, lock a base case that is internally consistent. “Consistent” means the model’s cash flow story matches the underwriting story. If EBITDA margin improves, you should see it flow through to cash generation and debt service capacity.
Keep the base case readable. If you can’t explain how the model reaches the outcome in a minute, sensitivity will be harder than it needs to be.
Define Sensible Ranges Instead of Wild Ranges
A range should reflect what you can justify from evidence, not what makes a spreadsheet look dramatic. Use three anchors:
- Historical variation in similar businesses or prior deals
- Contractual or structural limits (floors, caps, step-ups)
- Underwriting uncertainty (what you know you don’t know)
Example: If you believe revenue growth is likely 6% with uncertainty, you might set a range of 3% to 9% rather than 0% to 30%. The narrower range forces you to confront realistic downside.
Run One-Factor Sensitivities First
Change one assumption at a time while holding others at base case. This produces a “tornado” style intuition even if you don’t plot it.
How to interpret it:
- If changing a driver barely moves the outcome, you can spend less time on it.
- If changing a driver moves the outcome a lot, you’ve found a lever worth deeper diligence.
Example: In the buyout model, you test exit multiple from 7x to 9x. Equity IRR moves from 14% to 20%. That tells you exit pricing matters, but it doesn’t tell you whether the downside is driven by operations or by the market.
Then Use Two-Factor Scenarios for Interactions
Real life has interactions. Margin compression often travels with slower growth. Refinancing risk often coincides with weaker cash flow.
Create a small scenario grid using combinations of the top two or three drivers. Keep it limited so you can reason about each cell.
Example scenario set for a buyout:
- EBITDA margin: 30% (base), 27% (downside)
- Revenue growth: 6% (base), 3% (downside)
- Exit multiple: hold at base for this grid
You’ll likely see that the “downside” cell is not just a smaller number; it may trigger a different financing outcome, such as a covenant breach or a forced recap.
Convert Scenario Results into Decision Rules
Sensitivity is only useful if it changes decisions. Turn results into rules like:
- Reject if downside equity IRR falls below a minimum threshold
- Require additional protections if the probability of liquidity shortfall exceeds X
- Renegotiate terms if the model is overly sensitive to one assumption you can’t verify
Example decision rule:
If the downside scenario (margin 27%, growth 3%) produces a five-year equity IRR below 10% and also shows interest coverage below the covenant, you don’t “hope harder.” You either adjust price, add protective terms, or walk away.
Mind Map: Sensitivity Analysis Workflow
Worked Example with Numbers You Can Sanity-Check
Assume base case equity IRR is 16%.
- One-factor: exit multiple 8x → 7x drops IRR to 13%.
- One-factor: EBITDA margin 30% → 27% drops IRR to 12%.
- Two-factor: margin 27% and growth 3% together drop IRR to 9% and cause a refinancing shortfall.
Interpretation: exit multiple matters, but operational deterioration matters more because it changes financing feasibility. That’s a different diligence focus than “market timing.”
Common Mistakes to Avoid
- Using ranges that are too broad to be meaningful
- Varying assumptions without checking model consistency
- Treating sensitivity as a one-time exercise instead of a decision input
- Ignoring financing and liquidity mechanics, then wondering why IRR behaves oddly
Sensitivity analysis is at its best when it forces clarity: which assumptions you must verify, which protections you must negotiate, and what outcomes you will not accept.
5.3 Apply Discounting and Probability Weighting Consistently
Long money thinking treats uncertainty as a first-class input, not an afterthought. Discounting sets the time value of money; probability weighting sets how likely each cash-flow path is. Consistency matters because mixing methods can quietly double-count risk or, worse, pretend uncertainty doesn’t exist.
Foundational Concepts You Must Keep Separate
Start by separating three ideas:
- Timing: when cash flows happen.
- Risk: how uncertain those cash flows are.
- Required return: the rate that compensates the investor for bearing risk.
Discounting handles timing. Probability weighting handles risk across scenarios. The required return should reflect the same risk assumptions you used to create the scenarios.
A practical rule: if you assign probabilities to scenarios, your discount rate should not also embed the same uncertainty in a second layer.
A Consistent Workflow That Doesn’t Contradict Itself
Use this sequence every time:
- Define scenario cash flows: base, downside, and severe downside. Each scenario must specify cash flows by year (or quarter) and include operating and financing effects.
- Assign probabilities: probabilities should sum to 100% and reflect your underwriting view, not the sponsor’s optimism.
- Choose a discount rate aligned to scenario definition: either
- discount each scenario at a rate consistent with its risk level, or
- discount a probability-weighted expected cash flow at a single rate.
Pick one approach and stick to it. Switching midstream is where models go to retire early.
Discounting Approaches That Stay Coherent
Approach A: Probability-Weighted Expected Cash Flows
Compute expected cash flow each period:
- Expected CF in year t = Σ (probability of scenario i × CF of scenario i in year t)
Then discount the expected cash flows using one required return rate.
Approach B: Scenario Discounting
Discount each scenario’s cash flows using a scenario-appropriate rate (or the same rate if you built scenarios with identical risk). Then probability-weight the present values.
If your scenarios differ mainly in outcomes but not in riskiness, Approach A is usually cleaner. If scenarios represent materially different risk profiles, Approach B can be more faithful.
Mind Map: Discounting and Probability Weighting
Example: A Simple Private Credit Case
Assume a deal pays annual interest and a principal repayment at year 3. You model three scenarios for year-3 principal repayment:
- Base: 100% principal repaid. Probability 60%.
- Downside: 70% principal repaid. Probability 30%.
- Severe: 40% principal repaid. Probability 10%.
Interest is paid each year in all scenarios at the contractual rate, so uncertainty is mostly about principal at year 3.
You decide to use Approach A because the cash-flow timing is the same across scenarios and the uncertainty is about the terminal amount, not about when payments occur.
- Compute expected principal at year 3:
- Expected principal = 0.60×100% + 0.30×70% + 0.10×40% = 81%
- Build expected cash flows:
- Years 1–2: same interest cash flows.
- Year 3: interest + 81% principal.
- Discount once using a required return rate that reflects the overall risk of the instrument.
If you instead discounted each scenario using a higher rate for the downside cases and also probability-weighted, you’d likely double-count risk unless your discount rates were carefully constructed to avoid overlap.
Example: When Approach B Helps
Now consider an equity investment where downside scenarios include delayed distributions because the company must refinance at worse terms. Here, timing differs by scenario.
- Base: distributions in years 1–3.
- Downside: distributions pushed to years 2–4.
- Severe: distributions only after a restructuring in year 4.
Because timing and risk profile shift together, Approach B is often more coherent:
- Discount each scenario’s cash flows using a rate consistent with that scenario’s risk.
- Probability-weight the present values.
This keeps the model honest about the fact that “less money” and “later money” are different problems.
Consistency Checks Before You Trust the Number
Before finalizing valuation, run these quick checks:
- Probability sanity: do probabilities reflect your underwriting evidence, and do they match the scenario definitions?
- Rate alignment: does the discount rate represent the same risk level you assumed when building scenarios?
- No double-counting: if you used probability weighting to capture uncertainty, don’t also inflate the discount rate for the same uncertainty without justification.
- Driver clarity: can you point to whether value is driven by timing, terminal outcomes, or operating growth?
When these checks pass, discounting and probability weighting stop being math exercises and start being a disciplined way to price uncertainty.
5.4 Set Entry Price Discipline Using Comparable Transactions and Multiples
Entry price discipline is the part of underwriting where optimism goes to get measured. Comparable transactions and multiples help you anchor valuation to reality, but only if you use them as a structured input—not as a decorative number.
Start with What Comparables Can Actually Tell You
Comparable transactions are most reliable for pricing similar risk and similar cash-flow timing. Multiples are most reliable when the underlying drivers are aligned: growth profile, margin structure, leverage level, and the quality of recurring revenue (or lack of it). If those drivers differ, the multiple becomes a guess with better typography.
A practical way to begin is to separate valuation into three layers:
- Business economics: margins, growth, churn, unit economics.
- Capital structure: leverage, interest coverage, refinancing risk.
- Deal terms: control rights, governance, liquidity, and any special protections.
Comparables should match on layers 1 and 2 first. Layer 3 is where you adjust for what you’re actually buying.
Build a Comparable Set with Clear Inclusion Rules
Before looking at numbers, define your inclusion rules. For example, if you’re underwriting a private company acquisition, you might require:
- Revenue model similarity (recurring vs. project-based)
- Similar geography or customer concentration profile
- Comparable scale band (e.g., within a 2–3x revenue range)
- Similar leverage tolerance (or at least disclosed debt terms)
- Similar time period for market conditions
If you can’t verify a rule, treat that comparable as “informational,” not “pricing.” Your goal is a set that supports a defensible range, not a set that flatters your target.
Convert Transactions into Comparable Multiples
Multiples come in many flavors, and mixing them is a common way to accidentally compare apples to boats.
Use consistent definitions:
- Enterprise Value (EV) multiples for capital-structure neutrality (EV/EBITDA, EV/Revenue)
- Equity Value multiples only when you’re sure leverage and preferred claims are comparable
- Trailing vs. forward periods aligned to your underwriting horizon
Then normalize the earnings base. In private deals, EBITDA can be “creative.” Your job is to standardize:
- One-time costs and unusual items
- Owner compensation and non-recurring adjustments
- Stock-based compensation treatment (be consistent)
A simple discipline: if you can’t explain an adjustment in one paragraph, you probably shouldn’t use it.
Adjust for Deal Differences Without Hand-Waving
Once you have a comparable multiple, adjust for differences using a small set of explicit levers.
Common levers include:
- Growth rate: higher growth often supports higher multiples, but only if margins don’t collapse.
- Margin quality: recurring gross margin stability matters more than average margin.
- Risk and cyclicality: more volatile cash flows deserve a lower multiple.
- Leverage: higher leverage can inflate equity outcomes while increasing downside risk; EV multiples help, but terms still matter.
- Control and liquidity: control rights and governance can justify a premium; lack of liquidity can justify a discount.
Keep adjustments grounded in underwriting inputs. For instance, if you adjust for growth, tie it to your modeled revenue growth and the sustainability of that growth.
Use a Range, Not a Single Number
A disciplined entry price is usually a range with a decision rule. Here’s a workable approach:
- Compute a base multiple from the median of your best-matching comparables.
- Apply risk adjustments based on your underwriting deltas.
- Produce a valuation range that reflects uncertainty in both multiple and earnings.
Then set a decision rule: for example, you only proceed if the implied price supports your required return under your downside scenario.
Example: Pricing a Private Acquisition Using EV/EBITDA
Assume you’re considering buying a company with:
- Underwritten EBITDA (normalized) of $10.0m
- Your downside EBITDA scenario of $8.0m
- Your required entry economics imply you need an EV/EBITDA that supports a target net return
You find five comparable transactions with EV/EBITDA multiples (after normalization):
- 9.0x, 9.5x, 10.0x, 10.5x, 12.0x
You exclude the 12.0x deal from pricing because it had materially higher recurring revenue and lower customer concentration. Your pricing set becomes 9.0x–10.5x.
- Median base multiple: 10.0x
Next, you adjust for your company’s higher customer concentration versus the median comparable. Suppose your underwriting treats that as a meaningful cash-flow risk delta. You apply a conservative adjustment of -0.5x, yielding a disciplined entry multiple of 9.5x.
Implied EV at entry: 9.5x × $10.0m = $95.0m.
Now test downside: EV/EBITDA on downside becomes $95.0m / $8.0m = 11.9x. That tells you whether your entry price is robust when earnings slip. If your required return doesn’t hold under that downside, you lower the entry multiple or demand better terms.
Mind Map: Comparable Transactions and Multiples Entry Discipline
Final Discipline Checklist
Before you sign, verify four things: (1) your comparables match the economics you’re underwriting, (2) your multiple definitions are consistent, (3) your adjustments are tied to underwriting inputs, and (4) your entry price survives a downside earnings test without relying on heroic assumptions.
5.5 Define What Triggers Repricing Rejection or Renegotiation
Long money pricing discipline is mostly about deciding what you will do when reality disagrees with your model. Repricing, rejection, and renegotiation are not separate personalities; they are three responses to the same question: “Which assumption broke, how badly, and can we fix it without paying for the fix twice?”
Start with a clean baseline. Before you sign, define (1) the key underwriting assumptions, (2) the measurable indicators that prove or disprove them, and (3) the action ladder tied to thresholds. If you do not write these down, you will later argue about feelings instead of numbers.
Foundational Triggers That Justify Action
1) Cash flow timing breaks. If collections, rent rolls, production schedules, or customer payment terms slip beyond what your model allows, the issue is usually timing, not “demand.” A common trigger is a sustained delay that compresses the ability to service debt or preferred returns.
Example: You underwrite a small services business assuming average receivables of 45 days. After closing, receivables average 70 days for two consecutive quarters. Even if annual revenue is close to plan, the cash conversion gap can force a covenant breach. Your action ladder might require immediate reporting, then repricing or renegotiation if the gap persists.
2) Operating margin misses with a clear cause. Not all margin misses are equal. A one-time cost spike is different from structural pricing pressure or recurring inefficiency.
Example: Gross margin falls 300 bps. If the cause is temporary (one-time vendor transition), you may hold. If the cause is recurring (price concessions to win renewals), you should treat it as a value driver failure and revisit the entry price or terms.
3) Leverage and coverage drift. Private deals often fail through balance sheet math. If leverage rises or coverage falls, you should not wait for the first missed payment to act.
Example: A covenant requires 1.30x interest coverage. Your model targets 1.55x. If quarterly reporting shows coverage trending to 1.25x, you have a trigger before the breach.
4) Refinancing or liquidity assumptions break. Many “safe” returns depend on refinancing windows, exit timing, or liquidity events. If those assumptions fail, the return math changes.
Example: You underwrite a mezzanine position expecting a refinance at year three. If lenders tighten terms and the sponsor cannot secure the expected rate or amount, you should trigger renegotiation of maturity, interest, or repayment structure.
5) Governance and information rights degrade. Long money needs visibility. If reporting quality drops, decision rights shift, or approvals become inconsistent, you should treat it as a risk escalation.
Example: You agreed to monthly KPI reporting and quarterly budgets. After closing, you receive only annual statements and no budget updates. That is not a minor inconvenience; it blocks monitoring and increases the chance that you discover problems too late.
The Action Ladder: Rejection, Repricing, Renegotiation
Rejection triggers apply before closing or before funding tranches. Use them when the deal’s core assumptions are already broken or when the sponsor cannot provide credible evidence.
Example: During diligence, the sponsor claims stable churn, but churn data shows a step-change after a pricing change. If the new churn pattern is likely to persist, you reject or restructure the deal rather than “hoping it normalizes.”
Repricing triggers apply when evidence arrives after closing but before the situation becomes irreversible. Repricing is appropriate when the economics can be adjusted to reflect the updated risk level.
Example: After closing, you learn that customer concentration is higher than disclosed, and the business is more sensitive to one account. If the sponsor can provide mitigation (contract restructuring, customer diversification plan) but the risk remains elevated, you may reprice via an interest rate adjustment, additional equity, or a revised preferred return.
Renegotiation triggers apply when the deal is still salvageable but the original structure cannot carry the updated facts. Renegotiation should target the specific broken assumption.
Example: A property deal assumes a certain capex schedule. If inspections reveal major deferred maintenance, you renegotiate by adjusting the capex budget, extending amortization, or changing the distribution waterfall to fund repairs without immediate default.
Mind Map: Triggers and Responses
Practical Thresholds That Prevent Argument
Use three threshold styles so decisions are consistent.
-
Single metric breach: One event that is large enough to matter (for example, a covenant headroom drop below a defined buffer).
-
Sustained trend breach: A pattern over two reporting periods (for example, receivables days above target for two consecutive quarters).
-
Breach plus mitigation failure: The metric breaks and the sponsor cannot show a credible plan that addresses the root cause.
Example: If coverage falls below 1.30x for one quarter, you request a plan. If it falls below again next quarter and the plan does not change the drivers, you move to repricing or renegotiation.
A Compact Decision Checklist
Before you choose an action, confirm four items: (1) the broken assumption is identified, (2) the evidence is reliable and timely, (3) the action targets the root cause rather than symptoms, and (4) the sponsor’s incentives remain aligned after the change.
If you can answer those four, you can act without turning the meeting into a courtroom. If you cannot, the correct trigger is usually “pause and request better information,” not “reprice because it feels safer.”
6. Negotiate Terms That Protect Long Money
6.1 Translate Long Horizon Goals Into Legal and Economic Terms
Long money goals are easy to state and harder to write down. The translation step turns “we want stability” into specific legal rights and economic outcomes that survive bad quarters, refinancing events, and management mistakes.
Start with Goal Statements That Can Be Measured
Write each long-horizon goal as a plain sentence with a measurable consequence. For example:
- “We want downside protection if cash flow drops.” Consequence: the structure must reduce the chance of permanent capital loss.
- “We want time to fix operations.” Consequence: the agreement must avoid forced exits triggered by temporary underperformance.
- “We want alignment with value creation.” Consequence: fees and incentives must not reward short-term optics over durable results.
If a goal cannot be linked to a consequence, it will not survive legal drafting.
Convert Goals into Economic Levers
Legal terms matter because they change cash flows, control, and remedies. Map each goal to the economic lever it affects.
- Downside protection → priority of payments, collateral, guarantees, covenants, and default triggers.
- Time to execute → cure periods, waiver mechanics, and restrictions on acceleration.
- Alignment → fee waterfalls, carried interest hurdles, and governance over budgets and major actions.
- Information and oversight → reporting covenants, inspection rights, and decision rights.
A useful check: for every goal, identify at least one lever that changes outcomes in a stress scenario.
Translate Economic Levers into Legal Clauses
Now you pick the clause family that implements the lever. The same goal can be achieved through different legal paths, but each path has different failure modes.
- Priority and security: payment waterfall language, liens, collateral descriptions, intercreditor agreements.
- Covenants: financial covenants, reporting covenants, and operational covenants that define “acceptable” performance.
- Defaults and remedies: what counts as a default, cure periods, acceleration rights, and what happens after default.
- Governance: consent rights, reserved matters, voting thresholds, and board or manager appointment mechanics.
- Incentives: fee definitions, expense reimbursement rules, and performance-based economics.
Mind Map: From Goals to Clauses
Example: Turning “Downside Protection” Into Specific Terms
Assume you invest in a private credit deal where the sponsor expects a refinancing in 18–24 months. Your long-horizon goal is to avoid permanent loss if refinancing slips.
A translation might look like this:
- Economic lever: reduce the chance that a temporary miss becomes an irreversible default.
- Legal terms:
- Add a cure period for financial covenant breaches (so a short-term dip does not automatically accelerate).
- Define default triggers narrowly (for example, exclude one-time accounting items if they are documented and reversible).
- Require additional reporting during the refinancing window (so you can see whether the plan is working).
- Include a remedy hierarchy: first amend/waive, then restructure, then accelerate.
Concrete outcome: if EBITDA temporarily underperforms, you have time and information to evaluate whether the sponsor can correct course without forcing a sale at the worst moment.
Example: Turning “Time to Execute” Into Governance Rights
Suppose your goal is to support a multi-year operating turnaround. You want to prevent unilateral actions that sabotage the plan.
Translation:
- Economic lever: keep the company from making value-destructive moves while you are trying to fix operations.
- Legal terms:
- Reserved matters requiring investor consent for major capex, asset sales, or changes to key contracts.
- Budget approval mechanics with a defined process for amendments.
- Restrictions on related-party transactions without independent review.
Concrete outcome: management can run the business day-to-day, but the agreement blocks the “easy” decisions that would undermine the turnaround.
Example: Turning “Alignment” Into Fee and Incentive Definitions
Long money alignment fails when economics reward activity rather than outcomes.
Translation:
- Economic lever: ensure fees and incentives depend on durable value, not just closing or short-term milestones.
- Legal terms:
- Clarify what counts as distributable proceeds and how expenses are treated.
- Use performance hurdles tied to realized or sustainable metrics, not only projections.
- Define how amendments affect economics so the sponsor cannot shift risk onto investors through later drafting.
Concrete outcome: if the sponsor spends time and effort on the right operational levers, the economics reflect it; if not, the structure does not quietly transfer losses to you.
Final Integration Step: Stress-Test Each Goal Clause Pair
Before signing, take each goal and run a simple scenario: “What happens if performance drops for two quarters?” Then verify that the legal clause pair you selected produces the intended economic effect. If the answer is “it depends on interpretation,” tighten definitions or add a clear remedy path.
Long money is not just patience. It is patience that has been written into the contract so it still works when things get inconvenient.
6.2 Evaluate Control Rights Information Rights and Governance Mechanics
Control rights decide who can steer outcomes when facts get messy: budgets drift, performance misses, or a refinancing becomes unavoidable. Information rights decide who sees the facts early enough to act. Governance mechanics decide how decisions get made, documented, and enforced. Treat these as a single system, not three separate checklists.
Foundational Concepts That Prevent Governance Surprises
Start with the “decision map.” List the decisions that matter over the holding period: approving budgets, changing leverage, selling assets, issuing new equity, replacing management, waiving covenants, and approving related-party transactions. For each decision, ask three questions.
- Who has the right to approve? This is control rights.
- Who must receive the information in time to evaluate? This is information rights.
- How is the vote or consent calculated and recorded? This is governance mechanics.
A common failure mode is having strong information rights but weak control rights. You can see the problem, but you cannot stop it. Another failure mode is having control rights but no reliable reporting cadence, so you discover issues after the vote has already happened.
Control Rights: What “Control” Actually Means
Control rights show up in several layers.
Board and manager appointment rights. If the investor can appoint a board seat or key manager, they can influence strategy and oversight. The practical question is not “do we have a seat,” but “what decisions require board approval and what quorum rules apply.”
Protective provisions. These are consent rights over major actions. They typically cover actions that can change risk or economics, such as taking on new debt, selling substantially all assets, amending governing documents, or changing distribution policies.
Majority versus supermajority thresholds. A 51% right behaves differently from a 67% or unanimous requirement. Supermajority rights can protect minority investors, but they can also create gridlock. The best structure matches the expected friction level of the business.
Voting mechanics and class rights. Some deals split voting by class of equity or by investor group. You want to know whether votes are counted per share, per class, or per consent category. If class rights exist, confirm which class controls which decision.
Information Rights: Timing, Detail, and Verification
Information rights are only useful if they arrive early enough and contain enough detail to support decisions.
Reporting cadence. Look for monthly or quarterly financials, plus timely notices for covenant tests, material events, and refinancing discussions. If the agreement allows “as soon as practicable” without a defined timeline, you may get reports after the window for action.
Quality of reporting. Financial statements should be consistent with the underwriting model: same revenue recognition approach, same definitions for EBITDA or cash flow, and clear reconciliation from operating metrics to reported figures.
Operational reporting. For operating businesses, investors often need KPIs tied to the value creation plan: customer retention, backlog, utilization, churn, or unit economics. For asset-heavy deals, investors need capex plans, leasing status, and maintenance schedules.
Audit and inspection rights. If you cannot verify numbers, you are relying on trust. Audit rights, access to books and records, and the ability to request third-party reports reduce the risk of “numbers that look right.”
Governance Mechanics: How Decisions Become Real
Governance mechanics translate rights into procedures.
Quorum and meeting rules. Quorum determines whether a meeting can proceed. If quorum is set too low, a small group can act without broader consent. If quorum is too high, decisions can stall.
Written consent versus in-person meetings. Written consent can speed up routine approvals, but it can also reduce transparency if notice requirements are weak. Confirm notice periods and what materials must be attached.
Deadlock resolution. Deadlocks happen when supermajority or unanimous consent is required. Look for mechanisms such as escalation to an investment committee, mediation, or buy-sell provisions. The key is whether the mechanism is triggered by a defined category of decision.
Enforcement and remedies. Rights without remedies are wishful thinking. Check what happens if reporting is late, if covenants are breached, or if an action is taken without required consent. Remedies might include injunctive relief, default interest, or the ability to block distributions.
Mind Map: Control, Information, Governance
Example: Two Term Sheets, Same Ownership, Different Outcomes
Consider an investor holding 30% of an equity vehicle.
Term Sheet A grants protective provisions over debt and asset sales, but information rights are limited to quarterly financials delivered “as soon as practicable.” If a refinancing becomes necessary in month two, the investor may only receive details after the sponsor has already negotiated terms.
Term Sheet B keeps the same protective provisions, but adds monthly reporting, a defined notice period for covenant breaches, and audit rights for key schedules. The investor can evaluate whether the refinancing changes risk and can use consent rights before the deal is locked.
The difference is not the percentage ownership. It is the timing and enforceability of rights.
Example: Reserved Matters That Actually Matter
A reserved matters list that is too broad can paralyze operations, while one that is too narrow can allow risk drift. A practical approach is to tie reserved matters to value drivers.
- If leverage is a key risk driver, require consent for any increase in net leverage beyond a threshold.
- If the business depends on capex discipline, require consent for capex above an annual budget line.
- If dilution would change control economics, require consent for equity issuance except under predefined employee plans.
This keeps governance aligned with underwriting assumptions and reduces “surprise approvals.”
6.3 Negotiate Protective Provisions for Downside Scenarios
Protective provisions are the parts of a deal that keep “long money” from turning into “long suffering.” They don’t guarantee good outcomes, but they reduce the chance that a single bad quarter, covenant breach, or governance failure forces you into an irreversible loss.
Foundational Concepts for Downside Protection
Start by separating downside into four buckets, because each bucket needs different legal tools.
- Cash-flow stress: the business can’t meet interest, rent, or working-capital needs.
- Balance-sheet stress: leverage, collateral, or asset values deteriorate.
- Governance stress: decisions get made that shift risk away from you.
- Information stress: you don’t get timely data to react.
A useful negotiation goal is to ensure you have (a) early warning, (b) decision rights, and (c) economic consequences that make bad behavior expensive.
Mind Map: Downside Buckets to Protective Tools
Protective Provisions That Actually Change Outcomes
Covenant Packages with Clear Failure Definitions
Covenants should be specific enough that everyone agrees what “bad” means. For example, instead of a vague “maintain adequate liquidity,” negotiate a measurable liquidity threshold and define the calculation method.
Easy example: A lender requires a minimum cash balance of $5 million tested monthly. If cash drops below $5 million, the borrower must submit a 30-day liquidity plan. If the plan isn’t delivered on time, that counts as a default even if cash later recovers. This turns information delays into a real consequence.
Restricted Payments and Debt Incurrence Limits
Downside often accelerates when cash is paid out while the business is under stress. Restricted payments provisions limit dividends, management fees, and certain related-party payments.
Easy example: A private credit deal allows distributions only if the borrower is above a leverage threshold and has complied with covenants for the prior quarter. If performance slips, distributions stop automatically, preserving cash for operations and debt service.
Consent Rights over Reserved Matters
Reserved matters are the decisions that can shift risk: asset sales, mergers, new debt, changes in business scope, and amendments to key contracts.
Easy example: If the company wants to sell a core customer contract, the agreement requires investor consent. Without consent, the sale can’t close. This prevents a “sell the engine to pay the rent” pattern.
Cure Periods and Waiver Mechanics
Cure rights matter because not every breach is malicious. A cure period gives the borrower time to fix a temporary issue, but waiver mechanics should protect you from silent drift.
Easy example: A breach triggers a 20-business-day cure window. During that window, the borrower can propose an amendment. If you don’t receive the amendment terms by day 10, the waiver is deemed denied. That forces timely negotiation rather than last-minute surprises.
Advanced Details: Make Remedies Proportionate and Usable
Step-In and Control Rights
Step-in rights should be narrow and triggered by clear events, such as repeated covenant breaches or failure to deliver audited statements. Overbroad step-in rights can be hard to exercise and can spook other stakeholders.
Easy example: Step-in is available only after two consecutive missed reporting deadlines. Once triggered, you can appoint an independent monitor for cash management and reporting. You’re not running the company; you’re preventing the “we’ll tell you later” problem.
Proceeds Application and Waterfall Clarity
When assets are sold or refinancing occurs, proceeds application provisions specify where money goes first. This reduces the risk that new capital or sale proceeds are used to pay junior claims while senior investors wait.
Easy example: If collateral is sold, 100% of net proceeds must first pay secured debt, then fees and expenses, then only afterward any junior obligations. The waterfall removes ambiguity during stress.
Information Rights Tied to Default Definitions
Information rights should not be “nice to have.” Tie delivery failures to default or at least to a remedy.
Easy example: Monthly reporting is required within 15 days of month-end. Failure to deliver within 15 days triggers a default, not a polite reminder. This gives you leverage early, when it’s still possible to fix the problem.
Negotiation Checklist for Downside Provisions
- Define each default with a measurable trigger and a calculation method.
- Ensure remedies are usable: step-in, consent, or payment restrictions that can be exercised.
- Align cure periods with the reporting cadence so you can react.
- Restrict value leakage during stress via restricted payments and related-party limits.
- Make reserved matters cover the decisions that change risk, not just the ones that sound important.
Example: Putting It Together in One Term Sheet Slice
A borrower misses a liquidity test in month two.
- The breach triggers a liquidity plan requirement.
- Restricted payments are automatically suspended until compliance returns.
- If reporting is late again, it becomes a default.
- Any asset sale of core contracts requires investor consent.
- If collateral is sold, proceeds apply first to secured debt.
The result is straightforward: the agreement doesn’t wait for a catastrophe. It forces early disclosure, limits cash leakage, and gives you decision rights when the business is still salvageable.
6.4 Structure Fees and Carried Interest to Align Incentives
Long money investors care about one thing: the economics should reward the behavior that produces durable outcomes. In private deals, fees and carried interest can either support that goal or quietly encourage speed, optics, and short-term risk. The trick is to design incentives so that the sponsor’s best move is also the investor’s best move—especially when things get messy.
Foundational Concepts for Fee and Carry Alignment
Start with three building blocks.
-
What gets paid: management fees, transaction fees, monitoring fees, and expenses. Carried interest is typically paid from profits after returning capital.
-
When it gets paid: upfront, during the holding period, or only at exit. Timing matters because early payments can reduce the sponsor’s pain when later performance disappoints.
-
What it depends on: gross proceeds, net proceeds, realized gains, or specific return hurdles. The more the sponsor’s pay depends on net investor outcomes, the more alignment you get.
A simple mental model: if the sponsor can earn money while investor returns are flat or negative, alignment is incomplete.
Fee Design That Avoids Paying for Activity
Fees should cover legitimate work without turning diligence into a subscription service.
Management fees: Commonly charged annually on invested capital or committed capital. To align incentives, investors often prefer fees that step down as the portfolio matures, and that are calculated on invested capital rather than unused commitments.
Transaction fees: These can be appropriate for real deal effort, but they should be capped and clearly defined. If transaction fees are large and recurring, a sponsor may prefer frequent deals over careful underwriting.
Monitoring fees: These should reflect actual monitoring scope. A monitoring fee that continues unchanged even when the sponsor’s role becomes minimal is a classic misalignment.
Expense treatment: Define what is reimbursable. If “expenses” include items that are effectively sponsor overhead, the sponsor can shift costs to the fund while keeping carry based on net proceeds.
Example: A fund charges a 2% annual management fee on committed capital for the first three years, then 1% on invested capital thereafter. If the sponsor delays investing, the investor still pays the early fee. A better alignment is to reduce the fee as deployment slows, or to tie the fee base to actual invested amounts.
Carried Interest Mechanics That Tie Pay to Investor Outcomes
Carried interest is where alignment either becomes real or stays theoretical.
Waterfall basics: Investors typically receive a return of capital first, then a preferred return (often called a hurdle), and then profits split between investors and the sponsor.
Preferred return and hurdle: A hurdle ensures the sponsor does not share profits until investors earn a minimum net return. The hurdle should be calculated on the same net basis used for investor returns.
Catch-up: Some structures include a catch-up where the sponsor receives a larger share until it reaches a target split. Investors should ensure catch-up does not allow the sponsor to earn carry while investors are still below the hurdle.
Clawback: Clawback requires the sponsor to return carry if later results reduce overall performance. This is especially important when carry is distributed before the full fund performance is known.
Example: A sponsor receives carry after an early exit that looks strong, but later deals underperform. Without a clawback, the sponsor keeps the early carry even if the fund ends up below the hurdle. With a clawback, the sponsor’s early distributions are effectively a loan against future performance.
Aligning Incentives Across the Whole Fund Life Cycle
Alignment fails when incentives change midstream.
- During investment: Fees should not reward deal volume over underwriting quality.
- During holding: Monitoring fees and governance responsibilities should match the sponsor’s actual work.
- At exit: Carry should depend on realized, net investor outcomes, not on paper marks.
- Across multiple deals: Investors should consider whether carry is calculated deal-by-deal or at the fund level. Fund-level calculations can reduce the incentive to “cherry-pick” winners.
Mind Map: Incentive Alignment Levers
Practical Checklist for Negotiation
Use a checklist that forces clarity.
- Fee base: Is it on committed or invested capital, and does it step down?
- Fee caps: Are transaction fees capped and tied to defined work?
- Expense definitions: What is reimbursable, and what is not?
- Waterfall terms: Is there a hurdle, and is carry after the hurdle?
- Catch-up limits: Does it allow carry before investors reach the target?
- Clawback: Is it mandatory, and how is it calculated?
- Net basis consistency: Are the same costs deducted for both investors and carry?
- Calculation transparency: Are statements frequent enough to catch issues early?
Example: In one negotiation, investors asked for quarterly fee and carry statements with a reconciliation to the capital account. The sponsor agreed because it reduced disputes later; alignment improved not because someone got kinder, but because the math became harder to argue about.
Integrated Example: Two Term Sheets, One Incentive Outcome
Consider two simplified structures.
- Term Sheet A: Management fee on committed capital, transaction fees uncapped, carry with a hurdle but no clawback.
- Term Sheet B: Management fee on invested capital with step-down, capped transaction fees, carry with a hurdle, deal-level carry subject to fund-level true-up, and a clawback.
Even if both sponsor teams claim they will act the same, Term Sheet B makes it harder to profit from early wins while leaving investors to absorb later losses. That is the point: incentives should follow outcomes, not just effort.
6.5 Build Term Sheet Checklists for Common Private Market Structures
A term sheet is where long money gets its seatbelt. The checklist below helps you verify that the economics, control rights, and downside protections match the underwriting assumptions you already made. Use it as a pre-signing review, not a post-mortem activity.
1) Start with a One-Page Term Sheet Map
Before line-by-line review, confirm the structure type and the “who decides what” logic.
- Transaction type: equity, preferred equity, unitranche, senior secured, mezzanine, revenue-based, or structured continuation.
- Capital stack order: what gets paid first, and what gets diluted or wiped first.
- Decision rights: who approves budgets, debt incurrence, asset sales, and equity issuances.
- Information rights: what you receive, how often, and in what format.
- Exit mechanics: sale, redemption, conversion, and drag/tag.
If any of these are unclear, the rest of the checklist will feel like solving a puzzle with missing pieces.
2) Equity and Preferred Equity Checklist
Use this when you’re buying ownership or quasi-ownership.
- Valuation and price: pre-money/post-money clarity, option pool treatment, and whether the price is fixed or subject to adjustments.
- Liquidation preference: participating vs non-participating; multiple size; seniority among preferred rounds.
- Conversion terms: conversion ratio, mandatory vs optional conversion, and anti-dilution method.
- Protective provisions: reserved matters requiring investor consent (e.g., new senior debt, dividends, major capex, M&A).
- Governance: board composition, observer rights, quorum, and voting thresholds.
- Dividends and redemption: dividend rate, redemption triggers, redemption schedule, and funding source.
- Transfer restrictions: ROFR/ROFO, permitted transfers, and lockups.
Example: A preferred investor expects a 1x non-participating preference. If the term sheet quietly says “participating,” the investor’s upside can become less aligned with common shareholders, and your exit math changes.
3) Senior Secured and Unitranche Checklist
Use this for debt where collateral and covenants drive the risk.
- Interest and fees: cash vs PIK interest, OID/origination, default interest, and fee triggers.
- Collateral package: lien priority, collateral description, and perfection obligations.
- Covenants: financial maintenance vs incurrence; definitions of EBITDA, leverage, and liquidity.
- Reporting: frequency of financial statements, compliance certificates, and notice requirements.
- Events of default: cure periods, materiality thresholds, and cross-default scope.
- Intercreditor terms (if multiple lenders): payment waterfall, standstill, and enforcement rights.
- Amendments and waivers: voting thresholds for covenant changes.
Example: If the covenant uses “net leverage” but the definitions allow add-backs that your underwriting excluded, the covenant may be easier to satisfy than you assumed.
4) Mezzanine and Subordinated Debt Checklist
Use this when the lender sits below senior secured.
- Subordination: explicit payment blockage and lien restrictions.
- Equity-like features: warrants, conversion rights, or equity kickers.
- Covenants: whether they are lighter than senior debt and how that affects default timing.
- Payment terms: PIK mechanics, maturity, and call protection.
- Control rights: who can block asset sales or refinancing.
Example: A mezz lender with a “soft” covenant may not receive early warning signals. If your plan relies on refinancing before maturity, confirm the default and enforcement timeline.
5) Revenue-Based Financing and Structured Equity-Like Checklist
Use this when payments depend on performance metrics.
- Revenue definition: gross vs net revenue, exclusions, and timing of recognition.
- Payment formula: percentage, caps/floors, and how refunds/chargebacks affect payments.
- True-ups: reconciliation process and dispute resolution.
- Default triggers: missed payments, reporting failures, and material adverse change clauses.
- Term and buyout: maturity, early repayment price, and prepayment penalties.
Example: If “revenue” excludes certain recurring items, the borrower can unintentionally reduce payments by changing accounting categories. The checklist forces the definition to be operational.
6) Continuation Vehicles and Secondary Structures Checklist
Use this for deals where assets move into a new entity.
- Roll-over economics: how much capital rolls, at what valuation, and whether there’s a haircut.
- New financing: seniority of new debt and whether it changes the risk for remaining investors.
- Governance: board rights and reserved matters in the new entity.
- Fees and carry: whether fees reset, and how carry is calculated post-roll.
- Tax and allocation mechanics: allocation of gains/losses and treatment of expenses.
- Exit alignment: drag/tag rights and how sale approvals work.
Example: A continuation can be fair, but only if the new structure doesn’t quietly shift value from the selling investors to the sponsor through fees, priority, or governance.
Mind Map: Term Sheet Checklist by Structure
7) Final Pre-Sign Checklist That Applies to Everything
These items prevent “structure drift” between underwriting and legal reality.
- Definitions consistency: confirm EBITDA, revenue, leverage, and materiality match your model.
- Notice and cure: ensure you receive time to respond before a default becomes irreversible.
- Reserved matters list: verify it covers the actions that would break your value-creation plan.
- Fee and expense scope: confirm who pays what, and when.
- Remedies: understand what happens after default, including enforcement and standstill.
- Documentation completeness: term sheet should map cleanly to definitive agreements.
Example: If the term sheet says “investor consent for additional debt,” but the definitive documents narrow it to “secured debt above a threshold,” your downside protection may vanish exactly when you need it.
8) Quick Scoring Method for Decision Confidence
Assign each checklist item one of three statuses: Aligned, Needs Clarification, or Mismatch.
- Aligned: proceed.
- Needs Clarification: request edits or written interpretation.
- Mismatch: stop until the economics or protections match the underwriting.
This scoring keeps the process practical: you’re not trying to be perfect, you’re trying to be consistent.
7. Execute with Operational Readiness and Integration Planning
7.1 Prepare an Execution Plan Before Closing
A closing date is not the start of work; it’s the moment you stop negotiating and start operating under the deal’s rules. A good execution plan turns that transition into a checklist with owners, timelines, and evidence. It also prevents the classic problem where the legal documents are signed, but the business still runs on yesterday’s assumptions.
Execution Plan Purpose and Scope
Start by writing a one-page “what changes on closing” summary. Include the new capital structure, governance rights, reporting cadence, and any operational obligations (for example, replacing a reporting system, funding a working-capital true-up, or meeting a milestone before a tranche is released). Then define the plan’s scope: what must be ready by closing day, what can be handled in the first 30 days, and what is ongoing.
A practical rule: if something affects cash, control, or information flow, it belongs in the pre-closing plan.
Mind Map: Pre-Closing Execution Plan
Build the Closing Checklist That Actually Gets Used
Create a checklist with three columns: task, owner, and proof of completion. “Proof” matters because it’s the difference between “we think it’s done” and “we can show it.” Examples of proof include a signed consent letter, a screenshot of system access, a bank confirmation email, or a completed template sent to the right recipients.
Group tasks by workstream so the team can execute without cross-reading everything. A simple set of workstreams works well:
- Legal and compliance: confirm all closing conditions are satisfied, ensure notices are sent, and verify any required consents are received.
- Finance and funding: confirm wiring instructions, escrow releases, and any working-capital or debt paydown mechanics.
- Operations and data: ensure you can access the systems and data needed for reporting, and confirm KPI definitions match the underwriting model.
- Governance and people: set up board/committee logistics, confirm voting thresholds, and align management incentives with the new structure.
- Communications: draft short, factual messages to counterparties and internal stakeholders so expectations don’t drift.
Timeline: From Draft Documents to Closing Day
Use a timeline anchored to the planned closing date. If you need a reference date, use one like 2026-02-26 for internal planning documents.
- T-30 to T-15: finalize the “what changes” summary, confirm reporting requirements, and lock the KPI dictionary. Start dependency tracking for consents and system access.
- T-14 to T-7: run a mock closing. The goal is to simulate the sequence of events: who approves what, when funds move, and what happens if a condition is late.
- T-6 to T-0: verify wiring details, confirm final legal execution steps, and ensure governance meetings are scheduled for the first week.
RACI and Decision Rights to Prevent Post-Closing Confusion
Add a RACI matrix for the first 30 days. For each recurring activity—monthly reporting, budget updates, covenant monitoring, and management reporting—assign Responsible, Accountable, Consulted, and Informed parties.
Also include a “decision rights map” that translates legal language into operational behavior. For example: who approves a budget variance above a threshold, who can authorize a new vendor contract over a spend limit, and who signs off on drawdowns or distributions.
Example: Execution Plan in a Typical Private Deal
Assume a private equity investment with quarterly reporting and a board seat.
- Legal: owner is the deal counsel lead; proof is a consent tracker showing all counterparties acknowledged the change.
- Finance: owner is the finance operations lead; proof is bank account readiness and confirmation that escrow release instructions match the final agreement.
- Operations: owner is the portfolio analytics lead; proof is that the KPI dashboard can be produced from the company’s systems within the agreed reporting format.
- Governance: owner is the investor relations lead; proof is a scheduled first board meeting and a draft agenda aligned to the reporting calendar.
Mind Map: First 30 Days After Closing
Close the Loop with an Escalation Path
Finally, define what happens when something slips. Name a single escalation owner and specify the trigger conditions: missing a consent, delayed access to systems, or inability to produce required reporting. The plan should include backup owners for critical tasks so the closing doesn’t stall on one person’s calendar.
When the checklist is complete, the team should be able to answer three questions quickly: what must be true at closing, how we prove it, and who decides if the plan needs adjustment.
7.2 Coordinate Legal Tax and Compliance Steps Without Delays
Private deals often fail in the boring places: a tax election missed, a compliance questionnaire answered inconsistently, or a legal condition that was “almost” satisfied. The fix is coordination that treats legal, tax, and compliance as one workflow with shared inputs, shared owners, and shared deadlines.
Foundational Workflow and Ownership
Start by defining three workstreams that run in parallel but share a single timeline.
- Legal: deal documents, closing conditions, reps and warranties, and signature mechanics.
- Tax: entity structure, allocations, elections, withholding, and reporting obligations.
- Compliance: KYC/AML, sanctions screening, beneficial ownership, and any investor suitability or regulatory filings.
Assign one Deal Coordinator who owns the master checklist and one Owner per workstream who owns deliverables. Every item on the checklist must have: a responsible person, a dependency, and a “ready to sign” criterion.
A practical rule: if an item affects cash at closing, it must be resolved before the legal team finalizes the closing statement.
Master Checklist That Prevents Last-Minute Surprises
Use a single checklist with explicit dependencies. Example items:
- Entity and authority: confirm signatory authority, good standing, and organizational documents.
- Tax elections: confirm whether any election is required for the structure and whether it must be filed by a specific deadline.
- Withholding and reporting: confirm whether any withholding applies to distributions or redemption.
- AML and sanctions: complete screening for the investor and any relevant counterparties.
- Beneficial ownership: collect documentation in the format required by the compliance policy.
Example timeline anchor: if a tax election must be filed by March 1, 2026, treat it as a hard dependency and schedule legal document review early enough that the tax team can confirm the election language matches the structure.
Mind Map: Legal Tax and Compliance Coordination
Integration Points Where Delays Usually Start
Delays cluster at three integration points. Treat them like junctions, not afterthoughts.
-
Structure-to-Documents alignment
- Tax conclusions must map to legal language. If the tax team approves a structure but the legal draft uses different allocation mechanics, you get a mismatch that can force rework.
- Example: if the tax team expects a specific allocation method for partnership-style economics, require legal to include the matching allocation provisions before the document is marked “final.”
-
Compliance clearance-to-Closing mechanics
- Some deals cannot close until onboarding is complete. If compliance clearance is delayed, legal may still be drafting, creating a false sense of readiness.
- Example: require compliance to confirm “clear to close” status before legal finalizes signature instructions.
-
Tax reporting-to-Cash flow
- Withholding and reporting obligations can affect net proceeds and distribution timing.
- Example: if withholding is expected on a distribution at closing, ensure the closing statement reflects it and that the tax owner signs off on the calculation.
Systematic Cadence and Decision Rules
Run a weekly integration meeting with a fixed agenda:
- Review the master checklist by dependency level.
- Confirm what is “ready to sign” in each workstream.
- Resolve conflicts immediately, not by committee.
Decision rule: when legal and tax disagree, the tax owner provides the “why” in plain terms and legal translates it into document language. When compliance blocks progress, legal pauses only the affected closing condition rather than halting the entire process.
Example: Coordinated Closing in Practice
Assume a fund invests through an SPV and the deal requires both a tax election and AML clearance.
- Day 1: Deal Coordinator issues the master checklist and sets the election deadline.
- Day 5: Tax owner confirms the election is required and drafts the election language requirements for legal.
- Day 10: Legal owner updates the documents to match the election mechanics and shares the draft with tax for confirmation.
- Day 12: Compliance owner completes onboarding and issues a clearance memo.
- Day 15: Closing statement is finalized using tax-confirmed withholding assumptions.
The key is that each workstream produces an output that the next workstream can consume without translation work.
Mind Map: Integration Points That Prevent Delays
Practical Output Checklist for Closing Readiness
Before signatures, require four confirmations:
- Legal: all closing conditions are satisfied or explicitly waived.
- Tax: elections and reporting mechanics match the structure.
- Compliance: clearance memo is issued for the relevant parties.
- Coordinator: closing statement inputs are complete and consistent across teams.
This approach keeps the process calm and fast: fewer surprises, fewer re-drafts, and fewer “we thought someone else handled it” moments.
7.3 Establish Reporting Cadence and Data Room Governance
Long money investors don’t just want updates; they want updates that can be trusted, compared over time, and acted on without hunting through folders. Reporting cadence and data room governance are the system that makes that possible.
Start with two foundational decisions: (1) what decisions the reporting must support, and (2) how quickly those decisions must be made. For example, if the investment committee needs to decide whether to approve a refinancing within a month, then the reporting cadence must surface covenant headroom and cash runway early enough to model options. If the committee only meets quarterly, the reporting should still capture monthly operational signals so the quarterly packet is not a surprise recap.
Reporting Cadence That Matches Decision Timing
A practical cadence for private deals often looks like this:
- Monthly operational pack: KPIs, customer metrics, production or delivery metrics, and a short narrative explaining variances.
- Monthly finance pack: cash balance, burn rate or cash generation, AR/AP aging, and a simple forecast for the next 60–90 days.
- Quarterly board or investor pack: full performance summary, updated underwriting assumptions, and a decision log of what changed since the last quarter.
- Event-driven updates: anything that changes risk—breach notices, material contract disputes, major customer loss, refinancing discussions, or unexpected capex.
The key is consistency. If “revenue” means one thing in January and another in March, the data room becomes a museum, not a tool.
Data Room Governance That Prevents Chaos
Governance is mostly rules, not effort. Define who can upload, what must be uploaded, and how files are named.
Use a simple operating model:
- Single source of truth: the data room is where the latest version lives. Email attachments are for convenience, not recordkeeping.
- Versioning rules: every financial model update and board deck gets a version tag and date.
- Naming convention: include company name, document type, period, and version.
- Access tiers: limit sensitive documents to the right roles, but avoid creating so many tiers that people stop using the system.
- Upload SLAs: set deadlines for monthly and quarterly packs so the investor team can review without last-minute scrambling.
A lightweight naming convention example: AcmeCo_Financials_Monthly_2025-02_v03. The exact format matters less than the fact that it sorts correctly and tells you what you’re looking at.
Mind Map: Reporting Cadence and Data Room Governance
Integrated Workflow from Pack Creation to Investor Review
To keep the process smooth, treat each pack like a product with a checklist.
- Before upload: confirm definitions (for example, whether churn is logo or revenue churn), reconcile key totals (cash in the finance pack matches the bank statement summary), and ensure the narrative references the same line items.
- After upload: investors review against a fixed checklist: what changed, why it changed, and whether it affects the underwriting assumptions.
- During review: questions should be logged and converted into template requirements. If investors repeatedly ask for the same detail, the template should include it next month.
A small but powerful habit is the “assumption delta” section in the quarterly pack. It lists which assumptions moved since the prior quarter and the reason. That prevents the classic problem where the model changes but the story does not.
Concrete Example: Monthly Pack with Clear Decision Hooks
Imagine a portfolio company with a covenant tied to EBITDA and a liquidity trigger tied to minimum cash.
- The monthly finance pack includes a 60–90 day cash forecast with three scenarios: base, downside, and “no new sales.” The downside scenario is not a doomsday story; it’s a structured way to show whether the liquidity trigger is likely to be breached.
- The monthly operational pack includes customer retention and pipeline conversion metrics that explain why the forecast changed.
- The event-driven update rule is triggered if the cash forecast indicates the liquidity trigger could be breached within the next 30 days. That update includes the proposed actions and who is responsible.
This structure means the investor team is not guessing what matters. The reporting cadence tells you when to look, and the data room governance tells you where to find the latest, consistent version.
Finally, set a review rhythm for the investor side too. A simple weekly internal review of newly uploaded items keeps monthly packs from piling up, and it turns “we’ll look at it later” into “we already did.”
7.4 Plan for Management Transitions and Incentive Alignment
Management transitions are where good underwriting meets real life. A deal can pencil out on paper, but if the people who run the business change midstream without a plan, the cash flows tend to change too. The goal of this section is simple: ensure continuity of decision-making, align incentives with the long-term value creation plan, and reduce the number of surprises between signing and stabilization.
Foundational Concepts for Transition Planning
Start by separating three timelines that often get mixed together:
- Pre-close continuity: what happens between signing and closing.
- Post-close stabilization: the first 90–180 days after closing.
- Value creation execution: the next 12–36 months, when operating improvements should show up.
Then define who owns what. Investors typically influence outcomes through governance, reporting, and incentives, not day-to-day operations. Management owns execution; the investor owns the conditions that make execution possible.
A practical way to prevent confusion is to write down a “decision map” that lists recurring decisions (pricing, hiring, capex, customer retention, financing) and assigns a responsible party for each decision during each timeline.
Management Transition Playbook
Step 1: Identify the transition trigger and its scope. Triggers include founder retirement, sponsor replacement, acquisition of a platform, or a performance-driven change. Scope includes role changes (CEO only vs. full leadership team), timing (immediate vs. phased), and knowledge transfer needs (systems, customer relationships, vendor terms).
Step 2: Build a knowledge transfer plan that is measurable. “Hand over the keys” is not a plan. Require artifacts: pricing policy documentation, top-20 customer playbooks, capex justification templates, and a list of recurring exceptions with resolution history.
Step 3: Create a stabilization cadence. For the first 90 days, require weekly operating reviews with a fixed agenda: revenue drivers, margin drivers, working capital, hiring plan, and capex status. The investor should focus on whether the plan is being followed, not whether the presentation is pretty.
Step 4: Define interim authority. If a new CEO is coming, specify who can approve spending, sign contracts, and negotiate with lenders during the transition. Without interim authority, teams freeze, and freeze is expensive.
Step 5: Plan for the “people math.” Incentives and retention matter. If key leaders are leaving, the operating plan changes. Treat retention as an underwriting input: estimate which roles are critical, what it costs to retain them, and what happens if retention fails.
Incentive Alignment That Matches Long Money
Incentives should reward behaviors that improve long-term outcomes and discourage short-term games. The most common misalignment is paying for accounting metrics that management can influence without improving cash generation.
A clean approach is to tie incentives to a small set of drivers:
- Cash and liquidity: free cash flow, working capital discipline, and covenant compliance.
- Operating levers: gross margin improvement, churn reduction, utilization, or on-time delivery.
- Capital discipline: capex that meets return thresholds and avoids “maintenance by surprise.”
Use vesting schedules that match the value creation horizon. If the business needs 18 months to realize improvements, then paying everything in 3 months is like rewarding a sprint for a marathon.
Also align incentives with governance. If management can take actions that increase risk without investor visibility, incentives will drift. Require reporting triggers for material changes: new debt, major customer concentration shifts, unusual related-party transactions, or capex above thresholds.
Mind Map: Transition and Incentive Alignment
Example: CEO Change with Retention and Authority
Assume a deal closes on 2026-02-15 and the incumbent CEO will step down at closing, replaced by an internal COO.
- Pre-close continuity: the incumbent CEO stays as an advisor for 60 days, with a written list of decisions they must approve (customer contract renewals above a threshold, major hiring, and any debt refinancing).
- Stabilization cadence: the new CEO runs weekly operating reviews starting week one, using a standardized dashboard. The investor attends the first two meetings and then reviews minutes and KPI variance explanations.
- Incentives: the CEO’s bonus is split: 50% tied to free cash flow targets and working capital improvements, 30% tied to gross margin and churn metrics, and 20% tied to capex meeting return thresholds. Vesting occurs over 24 months, with a holdback that is released only after covenant compliance is demonstrated for two consecutive quarters.
- Retention: the COO’s direct reports receive retention grants contingent on staying through the stabilization period and meeting role-specific operating targets.
The result is not just “aligned incentives.” It is a system where authority, information, and rewards point in the same direction, so the business keeps moving while leadership changes.
Example: Sponsor-Led Transition with Governance Guardrails
If a sponsor replaces a management team after closing, require a transition agreement that specifies: (1) who owns the budget for the first quarter, (2) what capex can be approved without board approval, and (3) how quickly the new team must deliver a 12-month operating plan with scenario assumptions. Incentives should not be based solely on revenue growth; they should include cash conversion and margin protection so the team doesn’t trade quality for speed.
A good transition plan reduces ambiguity. Ambiguity is where time goes to hide, and long money does not pay for hiding.
7.5 Define Early Wins and Milestones for Value Creation
Early wins are not “feel-good progress.” They are concrete, measurable steps that reduce underwriting uncertainty and move the business toward the value drivers you modeled. Milestones turn a thesis into a sequence: what must be true by when, who owns it, what evidence proves it, and what happens if the evidence doesn’t show up.
Start with a simple rule: every milestone should either (1) improve cash generation, (2) reduce risk of downside outcomes, or (3) increase the probability that your planned operating changes will stick. If a milestone doesn’t do at least one of those, it’s probably a task list, not a value plan.
Step 1: Translate Value Levers into Early Proof
Take the value levers from your underwriting—pricing, retention, cost structure, working capital, capex discipline, sales pipeline conversion, churn reduction, or margin recovery—and ask: “What is the earliest observable signal that this lever is working?”
Example: If your model assumes margin expansion from renegotiating supplier terms, the early proof is not “margin went up.” The early proof is “supplier contracts are re-papered and the new pricing takes effect on the next purchase cycle,” plus “purchase orders reflect the new terms.” That evidence arrives before full quarterly margin impact.
Step 2: Set Milestone Types and Evidence Standards
Use three milestone types so you don’t mix operational work with performance outcomes.
- Operational Milestones prove execution: contracts signed, systems configured, new process adopted.
- Commercial Milestones prove market traction: win rates, retention cohorts, pipeline conversion.
- Financial Milestones prove cash and margin movement: gross margin, EBITDA run-rate, free cash flow, and working capital ratios.
For each milestone, define evidence standards. Evidence can be a report, a signed document, a dashboard metric, or a reconciliation. If you can’t name the evidence, you can’t manage the milestone.
Step 3: Build a Timeline That Matches Private-Market Reality
A typical cadence for early wins is 30–60–90 days for proof of execution, then 120–180 days for performance confirmation. The exact timing depends on the business cycle, but the logic stays the same.
Example: In a subscription business, churn and retention cohorts can show movement within 60–90 days if you change onboarding or customer success motions. In a manufacturing business, supplier pricing and inventory turns may take longer because purchase cycles and production schedules control the timeline.
Step 4: Assign Ownership and Decision Triggers
Milestones need owners with authority. If the owner can’t influence the lever, the milestone becomes a report with no consequences.
Add decision triggers: what you do if the milestone evidence is late or missing. Triggers prevent “waiting politely.”
Example triggers:
- If renegotiated supplier terms are not implemented by day 75, switch to an interim pricing surcharge or reduce discretionary spend to protect gross margin.
- If retention cohorts don’t improve by the next billing cycle, tighten the customer segmentation and revise the playbook for at-risk accounts.
Step 5: Keep Milestones Lean and Linked
A value plan should be readable in one page. If you have 40 milestones, you’ll manage none. Prefer 8–15 milestones that map directly to your top 3–5 value drivers.
Mind Map: Early Wins and Milestones
Example: Milestones for a Pricing and Retention Plan
Assume your thesis is: improve gross margin by repricing and reduce churn by tightening onboarding.
- Day 30 Operational: Pricing governance process live; sales team trained; new price approval workflow documented. Evidence: signed training roster and workflow screenshots.
- Day 60 Operational: Contract templates updated; top 20 customers offered revised terms. Evidence: executed amendments or documented offer logs.
- Day 90 Commercial: Retention cohort for newly onboarded customers improves by a defined amount. Evidence: cohort report comparing to baseline.
- Day 120 Financial: Gross margin run-rate improves and customer discounting stays within policy. Evidence: margin bridge and discount variance report.
Notice the sequence: execution proof first, then commercial signal, then financial confirmation. That order matches how value actually shows up in private businesses.
Example: Milestones for Working Capital Protection
If your model depends on free cash flow, early wins should focus on cash conversion mechanics.
- Day 30 Operational: Invoice accuracy and dispute workflow standardized. Evidence: dispute rate baseline and new process adoption.
- Day 60 Financial: DSO improves for a defined customer segment. Evidence: aging report with segment-level comparison.
- Day 90 Operational: Inventory replenishment rules implemented; slow-moving inventory identified and actioned. Evidence: SKU aging report and disposition plan.
- Day 120 Financial: Free cash flow improves without margin sacrifice. Evidence: cash flow statement reconciliation to operating metrics.
Governance Rhythm That Makes Milestones Real
Run a monthly milestone review with a consistent agenda: status vs evidence, root cause for misses, and decision triggers. When evidence contradicts assumptions, update the plan and underwriting inputs immediately. Long money doesn’t mean “no accountability”; it means accountability with time to fix the lever.
8. Monitor Investments with Evidence Based Stewardship
8.1 Build a Monitoring Dashboard for Financial and Operational Metrics
A monitoring dashboard is not a spreadsheet that happens to be updated. It is a decision tool: it tells you what changed, why it matters, and what you will do next. For long money, the goal is early signal detection without drowning in noise.
Start with the Dashboard Purpose and Users
Define three outputs before choosing metrics. First, “alerting” identifies when assumptions used in underwriting are breaking. Second, “diagnosis” explains which driver is moving. Third, “action tracking” records what the team decided and whether it worked. Then map these outputs to users: investment committee members need summary views, while operators need drill-downs.
A practical rule: every metric must answer one of these questions—Are we on plan? Are we drifting? Are we protected? If a metric can’t answer one, it doesn’t belong.
Choose Financial Metrics That Reflect Underwriting Assumptions
Begin with the financial statements you actually underwrote. For each investment, list the top three return drivers and the top two downside paths. Then select metrics that measure those drivers.
Common financial categories:
- Cash generation: cash flow from operations, free cash flow, and cash conversion cycle.
- Leverage and coverage: net debt, interest coverage, and covenant headroom.
- Liquidity: cash balance, revolver availability, and near-term maturities.
- Earnings quality: gross margin, operating margin, and working-capital swings.
Example: if underwriting assumed margin recovery from pricing discipline, track gross margin by product line and the mix of discounting. If underwriting assumed refinance risk is manageable, track debt maturity ladder and covenant compliance dates.
Add Operational Metrics That Explain the Financials
Operational metrics should be leading indicators—things that move before the income statement does. Pick metrics that are measurable monthly and controllable by management.
Operational categories:
- Demand and retention: customer churn, net revenue retention, backlog, or order frequency.
- Unit economics: customer acquisition cost, payback period, contribution margin.
- Execution: on-time delivery, defect rate, throughput, or utilization.
- Cost drivers: labor hours per unit, procurement price variance, or warranty cost.
Example: for a services business, revenue can look stable while utilization quietly declines. Track billable utilization and average bill rate. A small utilization drop often shows up in cash collections later.
Build a Metric Hierarchy with Clear Thresholds
Use a three-layer structure.
- Top layer: 8–12 “at a glance” metrics with traffic-light status.
- Driver layer: 3–6 metrics per return driver that explain the movement.
- Evidence layer: supporting data and notes that justify the status.
Thresholds must be explicit. Use underwriting ranges, covenant limits, and historical volatility. Avoid arbitrary red/yellow/green rules.
Example threshold logic:
- Yellow when a metric moves beyond the underwriting range but remains within covenant limits.
- Red when it breaches the underwriting range and the evidence layer indicates a sustained driver change.
- Green when the metric returns and the underlying cause is addressed.
Design the Dashboard Layout for Fast Interpretation
A good layout reduces cognitive load.
- Put status and driver first, not charts.
- Show trend lines with the last 6–12 months and the underwriting baseline.
- Include variance notes: one sentence on what changed and one sentence on why.
A slightly playful but useful constraint: if a reader can’t explain the red metric in 20 seconds, the dashboard needs better driver mapping.
Include Governance and Action Tracking
Every alert should link to an action owner and a due date. Track three fields:
- Proposed action: what will be done.
- Decision status: pending, approved, or completed.
- Effect check: whether the metric improved after the action.
This prevents the common failure mode where dashboards report problems but never close the loop.
Mind Map: Monitoring Dashboard Components
Example: A Simple Dashboard Template for One Investment
Assume an investment underwrote a turnaround driven by pricing and working-capital discipline. Your dashboard could include:
- At a glance: gross margin %, days sales outstanding, interest coverage, cash balance, covenant headroom.
- Driver layer: discount rate, mix shift, collections by aging bucket, inventory turns.
- Evidence layer: notes on sales pipeline quality, customer disputes, and procurement timing.
If gross margin turns yellow while discount rate rises and mix shifts toward lower-margin SKUs, the dashboard should immediately show the driver change and the action owner for pricing approvals.
Operational Cadence and Data Quality Checks
Set a consistent review cadence. Monthly is typical, with a shorter “exception review” when thresholds are breached. Data quality checks should run before metrics are shown: missing values, stale uploads, and unit mismatches are the boring bugs that cause expensive confusion.
Finally, keep a short change log. When definitions change—like how churn is calculated—record it so comparisons remain meaningful. Long money doesn’t need perfect data; it needs trustworthy data.
8.2 Track Leading Indicators That Precede Financial Deterioration
Financial deterioration in private deals rarely arrives as a single dramatic event. It usually shows up as a pattern: operational friction increases, cash conversion weakens, and reporting becomes less reliable. Leading indicators are the early signals that those patterns are forming, before they become obvious in the income statement.
Start with the Logic of Early Signals
Leading indicators work because they sit closer to the cause than the effect. Cash flow is an effect; customer churn, inventory aging, and collection behavior are causes. A useful indicator should change before the financial metric it ultimately threatens. For example, a rise in “days sales outstanding” (DSO) typically precedes lower revenue recognition quality and later cash shortfalls.
To keep this systematic, define three layers:
- Operational drivers that managers can influence weekly.
- Process health metrics that reveal whether the drivers are moving.
- Financial consequences that confirm the deterioration is reaching the statements.
Build a Leading Indicator Set That Matches the Business Model
A leading indicator for a software company is not the same as one for a logistics provider. Choose indicators that reflect the business’s value creation mechanism.
Revenue-led models often deteriorate through customer acquisition quality, retention, and billing discipline.
- Example: If new customer cohorts show slower activation and higher early churn, revenue growth will likely slow before it appears in quarterly totals.
Cost-led models often deteriorate through utilization, throughput, and procurement behavior.
- Example: If labor hours per unit rise due to scheduling inefficiency, margins compress before the P&L fully reflects it.
Cash-led models deteriorate through collections, payables timing, and working capital management.
- Example: If collections tighten less than expected, cash conversion worsens even while revenue still looks stable.
Mind Map: Leading Indicators by Failure Mode
Operationalize the Indicators into a Monitoring Routine
A dashboard without a routine becomes decorative. Use a cadence that matches how quickly the indicators can change.
- Weekly: operational drivers (pipeline conversion, production yield, collections calls completed).
- Monthly: process health (DSO, inventory aging, backlog aging, refund rates).
- Quarterly: financial consequences (gross margin, operating margin, cash conversion, covenant headroom).
Then define thresholds using ranges, not single numbers. For instance, DSO might be “normal” at 45–55 days. A move to 60+ days for two consecutive weeks is a signal to investigate collections behavior, not a reason to panic.
Example: Turning Collections Signals into Action
Assume a services business with stable bookings but weakening cash. The first leading indicators appear in collections behavior:
- Dispute rate rises from 2% to 6% of invoices.
- DSO increases by 8–10 days over a month.
- The share of invoices paid within terms drops.
A practical response is to run a structured investigation:
- Segment disputes by customer and reason.
- Check whether disputes correlate with a specific billing process change.
- Confirm whether revenue recognition is still aligned with delivery and acceptance.
If disputes concentrate in one customer cohort, the issue may be operational (service quality or documentation). If disputes spread broadly, it may be process or staffing. Either way, the leading indicators guide the root-cause search before cash becomes the headline.
Example: Inventory Aging as a Margin Early Warning
For a distributor, margins can compress even when sales volume holds steady. Leading indicators include:
- Inventory aging bucket growth (e.g., “90+ days” increases).
- Stockout frequency increases for fast movers while slow movers accumulate.
- Purchase order lead times lengthen or forecast accuracy drops.
These signals point to demand forecasting and replenishment discipline. The financial consequence often arrives later as s, write-offs, and higher carrying costs.
Keep Indicators Actionable and Avoid False Precision
Not every metric is useful. Reject indicators that cannot trigger a decision. If a metric changes but no one can act on it, it becomes noise.
Also watch for “reporting artifacts.” A sudden improvement in a KPI might reflect a change in how data is entered rather than real performance. A simple control is to compare the indicator to a second view of the same reality, such as reconciling DSO from billing records against cash receipts timing.
Close the Loop with Evidence-Based Follow-Up
Each time a leading indicator crosses a threshold, document:
- What changed and when.
- Which driver is most likely responsible.
- What action was taken and by whom.
- Whether the indicator moves back toward normal.
This creates a feedback loop that improves future underwriting and monitoring. Over time, you learn which indicators truly precede financial deterioration in your specific portfolio—because every business has its own way of failing quietly.
8.3 Conduct Periodic Business Reviews With Clear Agendas
A periodic business review is where long money earns its keep: you compare what you expected to happen with what actually happened, then decide what to do next. The agenda matters because it forces the meeting to be about evidence and decisions, not about reciting the same story in different words.
The Purpose of the Review
A good review has three outcomes. First, it confirms whether the investment’s operating drivers are moving in the right direction. Second, it surfaces issues early enough to matter, such as weakening demand, margin compression, or cash conversion problems. Third, it produces decisions with owners and dates, so the next quarter starts with fewer surprises.
A simple rule helps: every agenda item must answer one of these questions—What changed? Why did it change? What do we do now?
The Meeting Cadence and Inputs
Most teams run business reviews quarterly, with a shorter monthly check-in for deals that are operationally intense or have tight covenants. The review packet should arrive at least five business days before the meeting. It should include the same core set of metrics each time, plus a short narrative explaining variances.
Use a consistent “variance ladder” in the packet:
- Volume changes (units, customers, utilization)
- Price changes (net pricing, discounting, mix)
- Cost changes (labor, materials, overhead)
- Working capital changes (DSO, DPO, inventory)
- One-time items (non-recurring charges, settlements)
The Agenda That Works
Below is a practical agenda that fits a 60–90 minute meeting and keeps the discussion structured.
Mind Map: Business Review Agenda
Opening: Start with Decisions, Not Slides
Begin by reviewing the decisions from the prior meeting and whether they were executed. If a prior action was missed, ask one question: “What prevented it?” This prevents the meeting from becoming a recap of effort rather than a record of outcomes.
Then confirm the objectives for this meeting in one sentence. For example: “We will determine whether the quarter’s margin and cash conversion are on track and agree on the next two actions.”
Performance Review: Use Drivers, Not Headlines
Walk through the variance ladder in order. If revenue is down, do not stop at “demand softened.” Break it into volume, price, and mix. If margin is down, separate cost inflation from operational inefficiency. If cash is down, distinguish earnings shortfall from working capital deterioration.
Example: A portfolio company reports EBITDA down 8% quarter over quarter. The variance ladder shows volume down 5%, net pricing down 2%, and cost down 1% due to delayed hiring. The conclusion is not “performance slipped,” but “the company is losing customers and discounting to retain them, while cost savings are temporary.” That distinction changes what you ask for next.
Operating Reality Check: Tie Metrics to Mechanisms
After financials, discuss the mechanisms behind them. If pipeline conversion worsened, ask whether it is lead quality, sales cycle length, or proposal win rates. If retention fell, ask whether it is product issues, onboarding quality, or competitor pricing.
Keep this part concrete. Instead of “sales is improving,” require a measurable statement such as “win rate increased from 22% to 26% due to revised proposal structure and faster quote turnaround.”
Risk and Constraint Review: Make Liquidity Visible
Even when things look fine, review constraints. For debt-like structures, confirm covenant headroom and the cash runway based on current operating assumptions. For equity-like structures, confirm whether concentration risk or customer churn could force a strategic pivot.
Example: A company is “profitable” but has rising receivables. The agenda should force a working-capital discussion: Did collection terms change? Are disputes increasing? Is billing lagging delivery? The review should end with a decision such as “tighten credit approval and add weekly collections reporting starting next week.”
Value Creation Plan: Progress with Blockers
Review each initiative with three fields: status, evidence, and next step. Evidence can be as simple as “pilot results show 12% lower defect rate” or “pricing changes are reflected in signed contracts.” Blockers should be stated as constraints, not opinions.
Example: The initiative is “reduce churn.” The status is “in progress,” but evidence shows churn is flat while churn risk indicators are improving. The decision might be to keep the initiative running but adjust the timeline for when to expect financial impact.
Decisions and Actions: Assign Owners and Dates
End with a short action list. Each action must have an owner, a due date, and a success criterion.
Example action:
- Owner: CFO
- Due date: 2026-02-15
- Action: Provide a revised cash conversion forecast using updated DSO and capex assumptions
- Success criterion: Forecast explains the variance between EBITDA and operating cash flow for the last two quarters
Close: Confirm the Next Information Gap
Before adjourning, identify what information is missing for the next review. If the team cannot produce it, the agenda should include a decision about how to measure it going forward. That keeps the next meeting from starting at square one.
8.4 Use Covenant and Liquidity Monitoring to Prevent Surprise Outcomes
Long money investors don’t just wait for quarterly reports and hope for the best. They monitor the specific mechanisms that can force an outcome: covenants that trigger defaults, and liquidity constraints that turn “fine on paper” into “can’t pay.” The goal is simple—spot covenant pressure early enough to act, and distinguish temporary strain from structural failure.
Foundational Concepts for Covenant Monitoring
A covenant is a contractual rule tied to measurable conditions. It usually falls into one of three buckets: leverage limits (debt versus earnings), coverage limits (ability to pay interest or fixed charges), and liquidity or working-capital requirements. A default can be triggered by a breach, but many deals also include “cure” periods, waivers, or renegotiation rights. Monitoring must therefore track both the metric and the deal’s response path.
Start with a covenant inventory. For each covenant, record: the calculation method, the measurement date, the reporting source, the cure/waiver mechanics, and who has the right to request changes. If you can’t explain how the number is computed, you can’t manage it.
Liquidity Monitoring That Matches How Failure Actually Happens
Liquidity problems rarely announce themselves as “we are insolvent.” They show up as missed vendor payments, delayed payroll, inventory build-ups, or emergency refinancing attempts. Liquidity monitoring should therefore include both accounting liquidity (cash, revolver availability) and operational liquidity (cash conversion cycle, capex timing, and working-capital swings).
A practical approach is to maintain a rolling liquidity view: expected cash inflows and outflows over the next 13 weeks, updated weekly or biweekly. This is not about precision to the dollar; it’s about identifying whether the business is consistently short of cash before covenant tests become imminent.
Mind Map: What to Track and Why
Covenant and Liquidity Monitoring Mind Map
Systematic Workflow from Data to Decisions
-
Build the covenant calculator: replicate the covenant math using the same inputs the issuer uses. Then test it with historical quarters to confirm you match their reported ratios. This catches subtle issues like classification changes or different EBITDA adjustments.
-
Track headroom, not just compliance: compute the distance between the current ratio and the covenant threshold. A deal can be “in compliance” while still being close enough that a single quarter of margin compression causes a breach.
-
Separate forecast noise from signal: compare management’s forecast to actuals for the last two to four reporting periods. If forecasts routinely miss on the same line items—say, gross margin or working-capital assumptions—then covenant risk is likely to be underestimated.
-
Link liquidity to covenant timing: covenant tests often occur quarterly, but liquidity stress can develop weekly. Create a calendar that shows when the covenant is measured and when the next liquidity forecast update will occur. This prevents the classic mistake of discovering covenant risk after the liquidity problem has already forced rushed decisions.
-
Define escalation triggers: choose thresholds that prompt action before a breach. For example, escalate when projected cash falls below a minimum comfort level for two consecutive forecast updates, or when headroom drops below a pre-set percentage ahead of the covenant test date.
Example: Preventing a Covenant Breach with Early Liquidity Signals
Consider a leveraged buyout with a quarterly leverage covenant tested at quarter-end. The leverage ratio is calculated using trailing twelve-month EBITDA, adjusted for certain items. In month one of the quarter, the business reports stable revenue, so management expects compliance.
Your liquidity monitoring shows a different story: receivables are aging faster than planned, and inventory is building due to slower sell-through. The 13-week forecast indicates that revolver availability will tighten earlier than expected. Two weeks later, the issuer requests a short-term waiver for a related working-capital covenant, and the lender notes that EBITDA adjustments will be scrutinized.
Because you already modeled the covenant calculator and tracked headroom, you can quantify the leverage impact of lower EBITDA and higher working-capital drag. The action path becomes concrete: reduce discretionary capex, tighten credit terms, and negotiate a temporary adjustment to the covenant calculation or a waiver with a clear cure plan. The breach is avoided because the response is timed to the liquidity problem, not the covenant test date.
Example: When Liquidity Stress Is Real but Not Yet Structural
In another deal, cash is low and the revolver is being drawn, but the working-capital drivers are seasonal. Your monitoring flags that the cash forecast shortfall is concentrated in the first half of the quarter and improves later. The covenant headroom is shrinking, yet the forecast variance is improving and the issuer’s collection metrics are trending back toward plan.
Instead of treating every drawdown as a crisis, you focus on whether the liquidity issue is reversible within the covenant measurement window. You request a tighter reporting cadence, confirm the seasonal pattern with recent history, and agree on operational steps that can be executed quickly if the pattern breaks. This keeps decisions proportional to risk.
Practical Checklist for “No Surprise” Monitoring
- Covenant inventory is complete and the math is reproducible.
- Headroom is monitored continuously, not only at quarter-end.
- Liquidity forecasts cover at least the next 13 weeks and include working-capital drivers.
- Escalation triggers are written down and tied to covenant test dates.
- Actions are documented with the specific metric they are meant to improve.
When covenant and liquidity monitoring are connected like this, surprises shrink from “unexpected default” to “early, manageable negotiation.”
8.5 Document Decisions and Update Underwriting Assumptions
Long money wins by staying coherent. Coherence comes from writing down why you acted, what you assumed, and what would have changed your mind. When you document decisions well, you can later tell whether outcomes were driven by execution, by market conditions, or by underwriting optimism.
The Decision Log That Actually Gets Used
A decision log should capture four things for every material choice: the decision, the rationale, the underwriting assumptions it depends on, and the evidence that supports or challenges those assumptions.
Use a consistent structure:
- Decision: what you approved, rejected, or renegotiated.
- Assumptions: the specific inputs that must hold (not a vague “performance will improve”).
- Evidence: what you saw at the time (models, diligence findings, management statements, third-party data).
- Update Triggers: what new information would require revisiting the assumptions.
A simple rule: if you cannot point to the assumptions in your model, you are not documenting the underwriting—you are documenting opinions.
Updating Underwriting Assumptions Without Losing Discipline
Underwriting assumptions drift because reality arrives in messy forms: customers churn, costs move, refinancing windows open and close, and covenants interpret themselves in surprising ways. Updating assumptions is not the same as changing your story. Treat updates like controlled experiments.
When new information arrives, do three steps in order:
- Classify the change: is it a measurement error, a one-time event, or a structural shift?
- Map the change to model inputs: revenue growth, margin, default probability, recovery rate, timing of cash flows, or exit multiple.
- Recompute base and downside cases: keep the same decision thresholds so you can compare “then” versus “now.”
If the update changes the expected outcome but not the decision threshold, you still document it. Long money doesn’t only record reversals; it records confirmations.
Mind Map: Decision Documentation and Assumption Updates
Example: Covenant Headroom Shrinks
Assume a private credit investment where the underwriting assumed EBITDA margin of 18% and net leverage staying below 5.0x. The decision log states that the investment is acceptable if covenant headroom remains above a defined buffer.
Two quarters later, reporting shows margin at 16.5% and leverage at 5.2x. The update process begins with classification. If the margin drop is tied to a temporary input cost spike, you adjust the margin assumption but keep the structural default probability unchanged. If the margin drop reflects permanent pricing pressure, you update both margin and leverage trajectory.
Then you recompute:
- Base case: updated margin and leverage path.
- Downside case: slower recovery and higher default probability.
Finally, you decide using the same threshold written at entry. If the covenant buffer is now below the trigger, you document the mitigation plan: tighter reporting, management action requests, or a renegotiation of terms. The key is that the decision is linked to the updated assumptions, not to a new mood.
Example: Refinancing Assumption Breaks
In a strategic holding, the underwriting might assume refinancing within 24 months at a reasonable spread. Your decision log should specify what “reasonable” means: target rate range, acceptable lender terms, and required coverage metrics.
When refinancing becomes harder, you document the change as structural if multiple lenders cite the same constraint (for example, reduced cash flow coverage). You then update the refinancing probability and timing, not just the discount rate. After recomputation, you may still hold if the revised downside remains within your tolerance and the governance rights allow you to manage the path.
Governance That Prevents “Model Drift with Feelings”
Assign ownership for updates. The person who updates assumptions should not be the only person who approves the decision. A lightweight review cadence works: quarterly for operating metrics, event-driven for covenant or liquidity triggers.
Also document the “why” behind thresholds. If you set a covenant headroom buffer of 1.0x, write down the reasoning: reporting lag, measurement uncertainty, and the time needed to execute mitigation. That way, when the buffer is breached, the response is grounded in the original logic.
What Good Documentation Produces
When you document decisions and update underwriting assumptions properly, you get three practical benefits: you can explain outcomes without rewriting history, you can compare “then” and “now” with consistent thresholds, and you can act faster because the next decision has a clear evidence trail. It’s not glamorous, but it keeps long money from turning into long confusion.
9. Manage Value Creation Through Governance and Active Support
9.1 Define the Investor Role from Passive Oversight to Active Partnership
Long money wins when investors understand what they can influence, what they should monitor, and what they must not meddle with. The investor role is not a personality trait; it’s a set of responsibilities that changes with deal type, governance rights, and the company’s maturity.
Start with the Baseline Responsibilities
Passive oversight is the default when you have limited control rights. Your job is to ensure the investment thesis is still true and that risks are visible early.
Core duties
- Verify reporting quality: confirm financials match the underwriting model and that key assumptions are tracked, not just summarized.
- Monitor risk signals: watch covenant headroom, customer concentration, working capital swings, and capex execution.
- Maintain decision discipline: escalate only when predefined thresholds are crossed.
Example: An investor in a senior secured credit position receives quarterly reporting. They don’t ask for weekly updates; instead, they require a covenant dashboard and a variance explanation for interest coverage and leverage. If leverage drifts beyond the agreed band, they trigger a structured review.
Define the Escalation Ladder
Active partnership begins when you can help prevent problems, not just react to them. The transition is governed by an escalation ladder: who decides, what triggers action, and what “help” means.
Escalation ladder
- Information request when metrics deviate from plan.
- Management meeting to reconcile assumptions and execution.
- Governance action such as approving budgets, replacing a committee member, or renegotiating terms.
- Operational support through specific resources or expertise, within agreed boundaries.
Example: In a growth equity investment, gross margin falls for two quarters. The investor first requests a margin bridge. If the bridge shows pricing pressure plus higher input costs, the investor convenes a meeting with commercial leadership. If the company lacks a pricing playbook, the investor offers a structured pricing review workshop, but does not take over sales decisions.
Map Investor Influence to Company Needs
Not every company needs the same kind of involvement. Influence should match the bottleneck.
- Early stage or fast scaling: involvement is often about hiring, incentives, and operational cadence.
- Turnaround or restructuring: involvement is often about cash discipline, governance, and decision speed.
- Mature businesses: involvement is often about capital allocation, portfolio strategy, and risk management.
Example: A family office holds a strategic stake in a manufacturing firm. The investor’s most useful role is to help the board tighten capital allocation criteria—what gets funded, what gets paused, and what requires a business case—because the company’s bottleneck is not demand, it’s prioritization.
Use Governance to Prevent “Helpful” Chaos
Active partnership fails when investors blur lines with management. Governance should specify boundaries so support is consistent.
Governance mechanisms
- Board or committee charter: defines scope, cadence, and decision rights.
- Reserved matters list: spells out what requires investor approval.
- Information rights: defines what data arrives, when, and in what format.
- Decision logs: records rationale and assumptions.
Example: A private equity investor wants to improve reporting. They don’t request ad hoc spreadsheets. Instead, they negotiate a quarterly operating pack template and a monthly cash forecast format as a reserved matter for the first year.
Mind Map: Investor Role Spectrum
Mind Map: Escalation Ladder in Practice
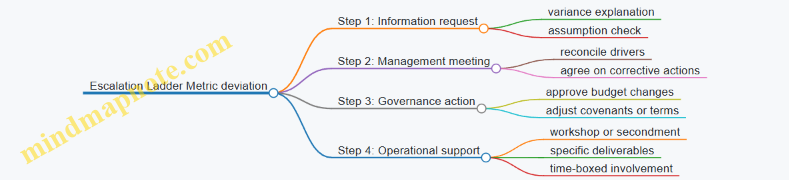
A Practical Example Timeline
Assume an investor holds a minority position with board observation rights.
- Month 1: confirm reporting pack format and agree on variance definitions.
- Quarter 1: review a margin bridge and working capital movement; request a corrective plan only if thresholds are breached.
- Quarter 2: if the plan stalls, escalate to a board-level discussion and approve a revised operating cadence.
- Quarter 3: if the company needs commercial capability, provide a targeted pricing and retention review delivered as a workshop plus a management-owned action plan.
This sequence keeps the investor useful without turning the board meeting into a substitute for management.
Define Success in Terms of Decisions Made
Active partnership is not “more involvement.” It’s better decisions under uncertainty. Success looks like fewer surprises, faster corrective actions, and clearer accountability.
Example: After implementing decision logs and reserved matters, the investor notices that budget disagreements shift from emotional debates to documented tradeoffs. That’s not a vibe; it’s a process improvement that reduces wasted time and prevents drift from the original thesis.
9.2 Improve Capital Allocation with Budgeting and Scenario Controls
Capital allocation is where long money quietly earns its keep. The goal is not to “spend less,” but to decide what gets resources, when it gets them, and what evidence must exist before you commit more. Budgeting provides the plan; scenario controls prevent the plan from pretending reality is optional.
Start with Budgeting That Matches How Private Value Actually Forms
A useful budget mirrors the value-creation path of your portfolio. For a typical private holding, value comes from a mix of operating improvements, financing choices, and timing of exits. So your budget should separate capital into buckets that behave differently.
- Operating capital: working capital, capex, and hiring costs tied to measurable operational levers.
- Growth capital: investments that change revenue capacity, such as sales expansion or product development.
- Resilience capital: liquidity buffers, covenant support, and contingency reserves.
- Transaction capital: legal, diligence, integration, and restructuring costs.
Example: If you own a manufacturing business, operating capital might fund a maintenance cycle that reduces downtime. Growth capital might fund a second shift line. Resilience capital might be a cash reserve to cover a seasonal demand dip. Transaction capital might cover a systems upgrade required to integrate a small add-on acquisition.
Define Decision Rights and Budget Ownership
Budgets fail when everyone owns everything. Assign ownership so decisions have a single accountable party.
- Budget owner: accountable for staying within the budget and updating assumptions.
- Approver: investment committee or designated governance group that approves deviations beyond thresholds.
- Data steward: ensures reporting is consistent across deals and time.
A practical rule: the budget owner can move money within a bucket without approval, but moving money across buckets requires approval because the risk profile changes.
Build Scenario Controls Around Failure Modes, Not Wishful Variance
Scenario controls are not “what if the world is 10% better or worse.” They are structured tests of the specific ways your underwriting can break.
Create three scenarios for each material holding:
- Base case: your underwriting assumptions with the most support.
- Downside case: the most plausible operating or financing stress that would hurt cash flow.
- Severe case: a covenant or liquidity stress that forces action, even if it is less likely.
For each scenario, define:
- Key drivers: revenue, gross margin, churn, utilization, pricing, or cost inflation.
- Cash impact: how the drivers flow into cash conversion and debt service.
- Action triggers: what you do when metrics hit thresholds.
- Capital response: whether you pause, re-phase, add, or protect liquidity.
Example: A software company budget assumes churn stabilizes. Scenario controls specify that if churn exceeds a threshold for two consecutive quarters, you re-phase growth spend and redirect capital to retention initiatives. If cash falls below a liquidity floor, you stop discretionary capex and negotiate with lenders before covenant pressure becomes a surprise.
Use Re-Phasing Rules So Capital Moves with Evidence
Instead of approving a full amount upfront, approve capital in tranches tied to milestones.
- Tranche 1: diligence and early operating changes.
- Tranche 2: scale spend after leading indicators confirm.
- Tranche 3: expansion only after cash conversion and unit economics stabilize.
Example: For a retail roll-up, tranche 1 funds store-level merchandising fixes. Tranche 2 funds inventory and staffing only after same-store sales and gross margin hit targets. Tranche 3 funds additional store acquisitions only after integration costs remain within budget.
Mind Map: Budgeting and Scenario Controls
A Simple Integrated Workflow That Keeps You Honest
- Draft the budget with bucket-level capital and explicit assumptions.
- Map drivers to cash so you know which metrics matter.
- Create scenarios that represent real failure modes.
- Set triggers that specify actions, not just warnings.
- Approve in tranches so capital follows evidence.
- Reforecast on schedule and when triggers are hit.
Example: Suppose you allocate $5 million for a portfolio company’s next year. You approve $1.5 million immediately (operating fixes), $2.0 million after gross margin stabilizes, and $1.5 million only after cash conversion improves. If the downside scenario triggers, you re-phase growth capital and protect resilience capital first.
Common Pitfalls and How to Avoid Them
- Budgeting as a spreadsheet exercise: fix by linking each line item to a driver and a cash pathway.
- Scenario controls without actions: fix by writing the capital response and who approves it.
- One-size triggers: fix by tailoring thresholds to the holding’s leverage and operating model.
- Too much discretion: fix by setting movement rules across buckets and clear tranche gates.
When budgeting and scenario controls work together, capital allocation becomes a controlled process rather than a recurring debate. Long money doesn’t just wait; it decides with structure, then updates with discipline.
9.3 Strengthen Commercial Strategy with Pricing and Retention Metrics
Commercial strategy is where underwriting assumptions meet reality. In long money investing, you want pricing and retention metrics that explain why revenue holds up when conditions get noisy. The goal is not to “grow at all costs,” but to keep the unit economics stable enough that value creation doesn’t depend on perfect timing.
Foundational Concepts That Make Metrics Useful
Start with three definitions that prevent metric theater:
- Pricing is the set of levers that determine what you charge and how consistently you can charge it.
- Retention is the set of forces that determine whether customers stay, expand, or churn.
- Commercial efficiency is how much revenue you generate per unit of sales and service effort.
A simple way to connect them is: pricing affects margin, retention affects revenue duration, and efficiency affects how much margin you keep after costs.
Pricing Metrics That Tie to Margin, Not Just Revenue
Use metrics that answer specific questions.
- Net Revenue Per Customer (NRPC): revenue after discounts and credits, divided by active customers. Example: If a customer pays $10,000 list price but receives $1,500 in credits, NRPC reflects the $8,500 reality.
- Discount Rate by Segment: total discounts divided by gross invoice amount, tracked separately for each segment. Example: If Enterprise discounts average 8% in Q1 and jump to 15% in Q2, you can investigate whether sales incentives or competitive pressure changed.
- Price Realization: actual average price versus target price. Example: A pricing policy says “no more than 5% deviation without approval.” If realization shows 12% deviation, you have a governance problem.
- Gross Margin by Contract Type: margin differs between annual and monthly plans, or between bundled and unbundled offerings. Example: A company may report stable revenue while margin falls because monthly plans carry higher support costs.
To keep these metrics actionable, define thresholds. If price realization drops below target by more than a set amount, require a review of discount approvals, competitive win/loss notes, and contract mix.
Retention Metrics That Separate Healthy Churn from Problem Churn
Retention is not one number. Separate it into components so you can diagnose.
- Logo Retention: percent of customers that remain active. Example: If logo retention is 92% but revenue retention is 85%, customers are staying but paying less.
- Revenue Retention: revenue from existing customers divided by prior period revenue from those customers. Example: A customer downgrades from a premium tier to a basic tier; logo retention stays high while revenue retention falls.
- Net Revenue Retention (NRR): revenue retention plus expansion minus contraction. Example: A customer renews at the same tier but adds seats; NRR can exceed 100% even with some churn.
- Churn Rate by Reason Code: categorize churn into pricing, product fit, implementation issues, support quality, or competitor. Example: If “implementation” is 40% of churn, the fix is operational, not sales.
Retention metrics become powerful when you link them to customer cohorts. Track cohorts by start date, acquisition channel, and contract term so you can see whether a change in onboarding or pricing policy affects outcomes.
Mind Map: Commercial Strategy Metrics
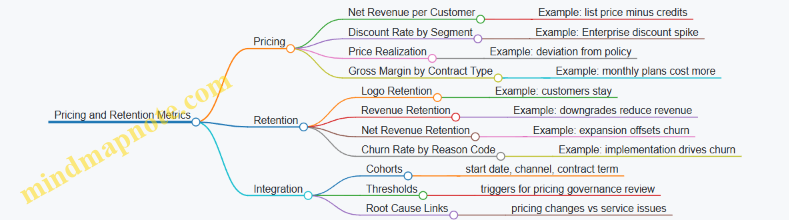
Integrated Operating Rhythm for Long Money Stewardship
A practical cadence keeps metrics from becoming a monthly report that nobody uses.
- Weekly: monitor price realization and discount approvals. Example: If a sales team requests frequent exceptions, you’ll see it before the quarter ends.
- Monthly: review NRPC, discount rate by segment, and gross margin by contract type. Example: If NRPC is flat but margin declines, contract mix is likely shifting.
- Quarterly: review retention cohorts, churn reason codes, and NRR decomposition. Example: If NRR drops while logo retention holds, focus on downgrades and expansion rates.
When you find a problem, avoid jumping straight to “fix pricing.” First check whether the issue is discount governance, contract mix, onboarding quality, or support capacity. Pricing and retention are connected, but they are not the same lever.
Example: Diagnosing a Revenue “Stall” Without Guesswork
Assume revenue is flat quarter over quarter.
- NRPC is flat, but discount rate increased in mid-market.
- Gross margin by contract type shows monthly plans have lower margin, and their share increased.
- Logo retention is stable, but revenue retention fell.
- Churn reason codes show “value not realized” and “implementation delays.”
This pattern suggests the stall is not simply pricing pressure. It’s a mix of discounting and contract mix, plus operational friction that reduces customers’ willingness to stay at higher tiers. The commercial strategy response should therefore include discount governance and an implementation quality fix, not only a pricing change.
Advanced Details That Prevent Common Failure Modes
- Metric definition discipline: ensure “active customer” and “revenue recognized” are consistent across periods.
- Segment integrity: don’t compare retention across segments with different contract terms without normalization.
- Causal separation: treat discount changes and onboarding changes as separate hypotheses until churn reason codes and cohort behavior confirm the driver.
- Governance clarity: define who can approve exceptions and what evidence is required. Example: exceptions tied to a documented competitive event and a plan to restore price realization at renewal.
Strong commercial strategy is measurable stewardship: pricing metrics protect margin, retention metrics protect revenue duration, and the integration between them tells you what to fix first.
9.4 Support Talent and Incentives with Measurable Performance Plans
Long money protects itself by making sure the people doing the work can execute the plan without guessing what “good” means. A measurable performance plan does three things at once: it clarifies priorities, reduces incentive confusion, and creates an evidence trail for governance decisions.
Start with Roles, Outcomes, and Decision Rights
Begin by separating responsibilities into three layers:
- Role outcomes: what the person is accountable for (e.g., “improve gross margin” or “close new customers”).
- Decision rights: what they can change without approvals (e.g., pricing within a band, hiring within a headcount cap).
- Constraints: what cannot change (e.g., debt covenants, brand requirements, regulatory limits).
Example: In a mid-market industrial business, the CFO owns cash conversion and covenant compliance. The CEO owns operating margin and customer retention. The board retains approval for refinancing and major capex. If you only set targets without decision rights, the plan becomes a blame machine.
Build a Scorecard That Matches the Holding Period
A long-term investor should avoid scorecards that reward short-term optics. Use a mix of leading and lagging measures, weighted to the holding period.
- Leading indicators (early signals): pipeline quality, churn risk, on-time delivery, defect rate, sales cycle length.
- Lagging indicators (results): revenue growth, gross margin, EBITDA, free cash flow.
- Process indicators (execution quality): forecast accuracy, budget variance discipline, audit findings.
Example: A software company wants to improve retention. A good plan tracks cohort retention (lagging), support ticket resolution time (leading), and product adoption milestones (process). If you only track churn, you’ll get reactive discounting.
Translate Incentives into Payable Metrics
Incentives should be tied to metrics that are:
- Controllable by the role, at least partially.
- Measurable with consistent definitions.
- Verifiable without heroic effort.
Use a simple structure: base compensation for stability, annual bonus for execution, and longer-term incentives for value creation.
- Annual bonus: 60–80% tied to scorecard metrics; 20–40% tied to qualitative governance items that are still documented (e.g., risk management, compliance).
- Long-term incentives: tied to multi-year outcomes such as cumulative free cash flow, margin improvement, or net revenue retention.
Example: For a family office-backed consumer brand, the COO’s annual bonus includes on-time production and inventory turns. The long-term component includes cumulative gross margin improvement and working-capital discipline. This prevents “sell-through at any cost” behavior.
Add Guardrails So Incentives Don’t Break the Business
Guardrails prevent gaming. Common guardrails include:
- Minimum quality thresholds: e.g., defect rate cannot exceed a ceiling.
- Capital discipline rules: capex must stay within approved ranges.
- Cash integrity checks: bonus eligibility requires cash collection targets to be met, not just revenue.
Example: A sales leader might hit bookings but inflate revenue through extended payment terms. A guardrail ties bonus eligibility to cash collected and maintains a receivables aging limit.
Use a Cadence That Produces Decisions, Not Reports
A performance plan should run on a rhythm that supports governance.
- Monthly: operational scorecard review with variance explanations.
- Quarterly: incentive progress check and metric definition audit.
- Semiannual: calibration meeting for weights and targets if assumptions changed.
Keep the documentation lightweight but consistent. Each review should answer: “What changed, why, and what will we do next?” If the meeting can’t answer those three, the plan is too vague.
Mind Map: Performance Plan Components
Example: Turning a Vague Goal into a Payable Plan
Vague goal: “Improve growth and profitability.”
Replace it with a scorecard for a VP of Operations:
- Leading: production yield, schedule adherence, and procurement lead-time variance.
- Lagging: gross margin and operating expense ratio.
- Process: forecast accuracy and budget variance within a defined band.
- Guardrails: defect rate ceiling and working-capital target.
Incentive payout rule: if gross margin improves but defect rate breaches the ceiling, payout is reduced by a fixed percentage. The rule is simple enough to explain in one page, and strict enough to stop “fix it later” behavior.
Example: Handling Metric Disputes Without Drama
Disputes happen when definitions drift. Solve it with a metric definition sheet that includes:
- calculation formula,
- data source,
- timing cutoffs,
- and who signs off.
When a CFO says “cash is fine,” the plan should already specify whether “cash” means collected cash, net of refunds, and whether it’s measured on invoice date or payment date. Clarity beats persuasion.
Close the Loop with Stewardship and Coaching
A measurable plan is not just for payouts. Use it to guide coaching and resource allocation. If a metric misses repeatedly, the response should be operational: adjust staffing, fix incentives that conflict, or revise constraints that block execution. Long money earns its keep by making the plan actionable, not merely measurable.
9.5 Handle Disagreements with Structured Escalation and Voting Rules
Disagreements are normal in long-money investing because underwriting is probabilistic and information is imperfect. The goal is not to eliminate conflict; it’s to prevent slow drift, hidden vetoes, and “everyone agrees later” outcomes. A structured process makes decisions faster and more defensible, especially when the disagreement is about risk, valuation, or governance.
Start with a Shared Decision Map
Before you argue about the deal, agree on what decision is being made and who has authority. Most disputes come from mixing up categories: underwriting assumptions, term negotiations, portfolio actions, and governance votes.
A practical way to start is to define four decision lanes:
- Lane A: Underwriting changes to assumptions, diligence scope, and risk ratings.
- Lane B: Pricing and Terms entry price, leverage, covenants, and protective provisions.
- Lane C: Portfolio Actions amendments, waivers, capital calls, and follow-on investments.
- Lane D: Governance voting on approvals, board seats, and removal of managers.
Each lane should have a default outcome if no one responds by the deadline. For example, if Lane B pricing is not approved by the deadline, the deal either moves to a revised term sheet or is paused. This prevents “silent disagreement” from becoming a surprise rejection at closing.
Use a Mind Map for Escalation Logic
Disagreement Escalation Mind Map
Define Evidence Standards So Disputes Don’t Become Personality Tests
A disagreement about “how risky this is” becomes productive when you require a concrete evidence standard. Ask each side to answer two questions:
- What would change your view? For instance, “If the downside scenario shows debt service coverage above 1.2x even under a 15% revenue drop, I’d downgrade the risk.”
- What assumptions are non-negotiable? Example: “We will not underwrite a covenant waiver as a plan; it’s only an emergency option.”
This keeps the debate anchored to underwriting logic rather than rhetorical certainty.
Apply Voting Rules That Match Decision Stakes
Voting rules should reflect how hard it is to reverse the decision later. A common structure:
- Routine approvals (e.g., approving diligence scope or a minor follow-on within budget): simple majority.
- Risk-changing decisions (e.g., downgrading a deal from “pass” to “invest” or changing the risk rating): supermajority.
- Irreversible protective changes (e.g., removing a key protective covenant or surrendering information rights): unanimity or veto by the risk function.
Example: A fund committee is split 4–3 on investing in a private credit deal. The dissenting members argue that refinancing risk is underestimated. Because this is a risk-changing decision, the rule requires a supermajority. The committee votes again after reviewing a revised stress case; the final decision is 5–2, meeting the threshold.
Set Deadlines and Escalation Timers
Long-money processes fail when escalation is open-ended. Use timers that force resolution while preserving diligence quality.
- Step 1: working session: 30–60 minutes.
- Step 2: sub-group: within 5 business days.
- Step 3: full committee: within 10 business days.
If the deadline passes, the default is either “pause and request revised materials” or “proceed with the last approved assumptions.” Pick one default and write it down.
Use Concrete Examples for Common Disagreement Types
Example 1: Underwriting Assumptions Two analysts disagree on churn assumptions for a subscription business. The structured approach requires each side to propose a scenario set. The committee compares downside outcomes under both churn paths and decides to invest only if the base case remains acceptable and the downside does not breach a pre-set liquidity buffer.
Example 2: Term Negotiation A sponsor offers weaker reporting covenants. The legal lead and risk lead disagree on whether the change is tolerable. Under the voting rules, removing information rights triggers unanimity. The committee rejects the term sheet and requests a revised version with quarterly reporting and audit rights.
Example 3: Portfolio Action During Stress A portfolio company requests a covenant waiver. The disagreement is whether to grant it now or demand additional collateral. The process routes it to Lane C with a pre-defined evidence standard: the committee requires updated cash flow and a clear plan for restoring compliance. The vote is majority because it’s a routine waiver within the approved risk band.
Document Dissent Without Punishing It
Record dissent reasons in plain language: which assumption, which scenario, and what evidence would resolve it. This matters later when similar deals appear. It also prevents “we disagreed” from turning into “we never knew why.”
A good system ends with closure: communicate the decision, update the underwriting memo, and schedule the next review date. If the next review is not scheduled, the disagreement will quietly return at the worst possible time.
10. Navigate Exits with Long Money Objectives and Realistic Paths
10.1 Identify Exit Options and Their Requirements Before Investing
Before you buy, you should know what “leaving” could look like. In private markets, exits are not just events; they are processes with prerequisites. The goal here is simple: identify the exit paths that match your deal’s economics, governance, and operational reality, then verify you can meet the requirements.
Start with Your Deal’s Exit Constraints
Exit options are limited by three categories of constraints.
-
Contractual constraints: lockups, transfer restrictions, consent rights, ROFR/ROFO, change-of-control provisions, and reporting covenants. Example: if a shareholder agreement requires consent for any transfer, a planned secondary sale may stall unless the buyer can obtain approvals.
-
Economic constraints: leverage levels, interest coverage, maturity schedules, and whether the business can refinance or pay down debt. Example: a company with a balloon payment in 18 months may have an exit window that is narrower than the investment horizon.
-
Operational constraints: data quality, financial controls, customer concentration, and management capacity. Example: if the business cannot produce clean monthly reporting, a strategic buyer’s diligence will take longer, increasing the chance that the buyer walks.
Build an Exit Options Inventory
Create a list of plausible exits for the specific structure you’re investing in. Common options include:
- Strategic sale: a competitor or adjacent operator buys the asset.
- Financial sponsor sale: another private investor buys the stake.
- Secondary sale: you sell to another investor without changing the underlying business.
- Recapitalization: refinancing or dividend recap changes capital structure while keeping ownership.
- IPO or public listing: only relevant if the company can meet public-market readiness.
- Maturity-based outcomes: repayment, redemption, or liquidation depending on instrument terms.
For each option, record the “requirements” you must satisfy.
Translate Requirements into a Checklist
Requirements fall into four practical buckets.
-
Buyer requirements: what the buyer needs to underwrite the deal.
- Example: strategic buyers often want integration synergies and clean customer contracts.
-
Timing requirements: when the exit can realistically happen.
- Example: a lender may require a covenant cure period before any sale proceeds are distributed.
-
Process requirements: what must be prepared for diligence and negotiation.
- Example: a buyer may require audited financials for the last two years and a standardized KPI pack.
-
Legal and governance requirements: what approvals and mechanics are needed.
- Example: if you need board approval for a sale, you must confirm voting thresholds and quorum rules.
Mind Map: Exit Options and Requirements
Exit Options and Requirements Mind Map
Example: Matching Exit Paths to a Hypothetical Deal
Assume you invest in a private company through a preferred equity instrument with a five-year term and a transfer restriction that includes ROFR.
- Strategic sale is plausible if the company has transferable customer contracts and the cap table is clean. Your requirement checklist should include consent mechanics and a diligence-ready KPI pack.
- Secondary sale is plausible only after the lockup ends and if you can satisfy ROFR procedures. Your requirement checklist should include a timeline for notices and proof of compliance.
- Recapitalization may be feasible if cash flows support refinancing and the company can meet lender covenants. Your requirement checklist should include a debt maturity map and covenant headroom.
Notice the pattern: each exit option is not “possible” or “not possible.” It is possible if specific prerequisites are met, and those prerequisites can be tracked.
Turn the Checklist into Pre-Investment Proof
Exit requirements should be validated before you commit capital.
- Read the governing documents to confirm transfer mechanics, consent rights, and any sale-related triggers.
- Ask for a diligence readiness inventory: what reports exist, how often they are produced, and who can explain variances.
- Confirm operational ownership: who will run the exit process, manage the data room, and coordinate with counsel.
- Stress test the timeline: if an exit depends on refinancing, verify whether the business can meet lender conditions without heroic assumptions.
When you finish this step, you should be able to answer one question clearly: “If we want to exit in the most realistic window, what must be true, and who is responsible for making it true?”
10.2 Prepare for Sale Readiness with Data and Operational Hygiene
Sale readiness is less about having a perfect story and more about removing friction from the buyer’s diligence process. When the data is organized and the operations are consistent, the buyer spends time validating economics instead of chasing missing documents. Long money investors benefit because fewer surprises usually mean better terms, or at least fewer “we need to re-trade” moments.
Foundational Principle: Make Diligence Boring
Diligence is a sequence of questions. If your materials answer those questions quickly and consistently, the buyer’s internal process moves faster and with fewer internal objections. “Boring” here means repeatable: the same metric is defined the same way across the deck, the model, the financial statements, and the reporting pack.
A practical way to start is to list the buyer’s diligence workstreams and map each to an owner, a document location, and a refresh cadence. If you cannot name an owner, you do not yet have sale readiness.
Data Room Hygiene That Actually Helps
Create a data room that mirrors diligence questions rather than internal filing habits. Use a folder structure that matches the buyer’s checklist, and include a short index page that states what is inside each folder and what period it covers.
Core data categories to keep consistent:
- Financials: audited or reviewed statements, monthly management accounts, general ledger trial balance, and a reconciliation from GL to financial statements.
- Revenue: customer list, contracts or contract summaries, revenue recognition policy, and a reconciliation from bookings to revenue.
- Expenses: payroll detail, major vendor agreements, and a schedule of one-time items.
- Working Capital: AR aging, AP aging, inventory records, and a policy for reserves.
- Debt and Capex: debt schedules, covenants, capex history, and asset registers.
- Legal and Compliance: material contracts, litigation register, insurance summaries, and regulatory filings.
Operational hygiene for data:
- Every spreadsheet should state the source system, the extraction date, and the definition of key fields.
- Every “snapshot” should be labeled with the period end date. If you update numbers, you must update the label and the reconciliation.
A simple example: if EBITDA is used in the model and the buyer’s deck, the add-backs must match the same policy and the same time period. If one add-back is “management fees” and another is “owner compensation,” the buyer will ask whether they are the same thing. Answering that once is easy; answering it repeatedly is expensive.
Operational Readiness: Prove You Can Run the Business While Selling
Operational readiness means the business continues to produce reliable outputs during diligence. Buyers often request additional reporting. If your team cannot produce it without disrupting operations, the buyer interprets that as fragility.
Set up a “diligence operating rhythm”:
- Weekly reporting: a standard pack with revenue, gross margin, cash position, AR/AP aging movement, and top customer changes.
- Issue log: a running list of questions from the buyer, with status and owner.
- Document refresh rules: what updates weekly, what updates monthly, and what is static.
Example: A services company may be asked to provide utilization and project profitability by customer. If the finance team has to manually rebuild these numbers each time, the buyer will assume the underlying reporting is unreliable. Instead, define a standard extraction process and keep it ready.
Mind Map: Sale Readiness Workflow
Advanced Detail: Reconciliations That Prevent “Wait, What?”
Buyers lose confidence when they see numbers that do not reconcile. Prioritize reconciliations that are frequently challenged:
- Revenue: bookings to revenue, and revenue to cash receipts.
- EBITDA: operating profit to EBITDA bridge with consistent add-backs.
- Cash: bank balances to cash flow statement line items.
- Working Capital: AR/AP/inventory movements to balance sheet changes.
A concrete example: Suppose the buyer’s model shows a higher cash conversion cycle than your management accounts imply. Often the issue is not the business; it is the definition of “net working capital” or the timing of reserves. If you provide a reconciliation that explains the reserve methodology and shows how it flows into the financials, the buyer can focus on the business rather than the accounting.
Practical Checklist for the Final Diligence Window
Use a short checklist to confirm readiness before sharing large batches of materials:
- Data room index exists and matches folder contents.
- Key metrics have consistent definitions across deck, model, and financials.
- Reconciliations for revenue, EBITDA, cash, and working capital are complete.
- Weekly reporting pack is ready and has a named owner.
- Issue log template is in place and actively updated.
- Document refresh dates are labeled, including a last refresh around two months ago for the core financial pack.
When these elements are in place, diligence becomes a controlled process. The buyer still asks hard questions, but the answers arrive quickly, consistently, and with fewer surprises—exactly what long money aims for.
10.3 Manage the Exit Process with Bid Management and Negotiation Discipline
A long-money exit starts before you see a buyer. You already know what “good” looks like: the minimum price that clears your downside math, the conditions you can live with, and the parts of the deal you refuse to trade away. When bids arrive, your job is to compare offers on the same scoreboard and negotiate the terms that protect the economics you underwrote.
Exit Preparation That Makes Bids Comparable
First, standardize your exit inputs. Create a one-page “exit facts” sheet that includes: purchase price target range, required approvals, expected working capital treatment, and the key operational metrics that buyers will ask for. Then build a clean data room index with consistent naming. Buyers bid faster when they trust the paperwork; they bid higher when they believe surprises are unlikely.
Next, decide what you will optimize for. Some exits optimize for headline price, others for certainty of cash at close, and others for tax and reinvestment flexibility. If you do not pick a priority, you will negotiate like a person trying to win a game without knowing the rules.
Bid Management with a Single Scoreboard
Treat every bid as a package of price plus risk. Convert each offer into a comparable “net value at close” estimate.
Use a simple framework:
- Cash at close: base consideration minus any assumed debt-like items.
- Earnouts and contingencies: discount them based on the likelihood of meeting targets and the buyer’s incentives.
- Reps and warranties: estimate the cost of escrow, indemnity caps, and survival periods.
- Financing certainty: assess whether the buyer has committed funds and whether closing conditions are reasonable.
Here’s a practical example. Suppose Bid A is $100M all-cash at close. Bid B is $115M with $15M earnout over two years. If the earnout is tied to metrics that depend on management actions you cannot fully control, you might discount it heavily. If Bid B also includes a longer escrow and broader indemnities, the “net value at close” could be closer to Bid A than the headline numbers suggest.
Negotiation Discipline That Protects Economics
Negotiation should focus on the few terms that actually move outcomes.
-
Working capital and purchase price mechanics Buyers often negotiate these late. Lock the definition early: what counts as current assets, how inventory is valued, and how disputes are resolved. If you underwrote a margin of safety, sloppy mechanics can erase it.
-
Escrow, indemnity, and survival periods Escrow reduces immediate cash but can be acceptable if it is proportionate and time-limited. Push for clear caps, defined baskets, and survival aligned to the risk profile of the business.
-
Earnout structure and governance If earnouts exist, define measurement precisely, set reporting cadence, and include dispute resolution. Also negotiate “operating covenant” boundaries so the buyer cannot starve the business to avoid earnout payments.
-
Closing conditions and timelines Long-money exits dislike open-ended conditions. Ask for objective milestones, reasonable regulatory timelines, and a clear termination fee or walk-right structure if conditions are not met.
-
Management and transition terms Buyers care about continuity. You care about incentives and retention. Tie management retention to milestones that matter for the earnout or post-close integration plan.
Mind Map: Bid Management and Negotiation Discipline
Example: Two Bids, One Decision
Assume you underwrote a minimum net value at close of $92M. Bid A offers $95M all-cash with a 12-month escrow and narrow indemnities. Bid B offers $105M with $20M earnout, a 24-month escrow, and broad indemnities.
Even before legal drafting, your scoreboard might show:
- Bid A: $95M minus modest escrow impact → comfortably above $92M.
- Bid B: earnout discounted for controllability and measurement risk, plus higher escrow and indemnity drag → net value at close could fall near or below $92M.
You then negotiate. If the buyer of Bid B will tighten earnout definitions, shorten escrow, and narrow indemnities, Bid B can become competitive. If they will not, you do not “negotiate hope.” You switch to the offer that matches your underwriting.
Example: Term Sheet Red Flags That Waste Time
Watch for these patterns:
- Purchase price mechanics that allow post-close adjustments without clear dispute rules.
- Earnout targets that can be changed through accounting policy choices.
- Indemnity language that is broad but not capped, especially for matters you already disclosed.
- Closing conditions that are subjective or within the buyer’s control.
When you see these, respond with specific counterproposals rather than general objections. Buyers move faster when you show the exact language you want and explain the economic reason.
Closing Discipline That Prevents “Last Mile” Losses
Before signing, reconcile the final draft to your scoreboard. Confirm that the definitions you relied on—working capital, earnout metrics, escrow amounts, and indemnity caps—match the negotiated term sheet. If anything changed, quantify the impact and decide whether to accept, renegotiate, or walk away. Long money is patient, but it is not casual.
10.4 Evaluate Secondary Sales Recaps and Continuation Structures
Secondary sales recaps and continuation structures are where long money proves it can stay disciplined when the story changes midstream. A recap is the formal accounting of what happened in a deal so far. A continuation structure is the legal and economic mechanism that lets some capital roll into a new vehicle while other capital exits. The key is to evaluate both the math and the incentives, because the paperwork will happily produce outcomes that look tidy while still being economically disappointing.
Foundational Concepts That Drive the Evaluation
Start with three definitions that prevent confusion.
- Recap: A statement showing realized proceeds, remaining value, fees, expenses, and waterfall outcomes up to a cut-off date.
- Continuation: A new structure that buys the exiting investors’ interests or issues new equity for the remaining assets, often with new terms.
- Waterfall: The order of payments that determines who gets what first, including return of capital, preferred returns, and carry.
A recap is not a performance report; it is a transaction accounting. Continuations are not “reinvestments”; they are negotiated exchanges of rights.
Step 1: Confirm the Recap Is Complete and Comparable
Before you judge value, confirm the recap is internally consistent and comparable to your underwriting.
- Reconcile the cut-off: Ensure the recap date matches the reporting period used for your assumptions. If the recap uses a date like 2026-02-15, verify that cash movements and accruals are treated consistently.
- Check fee and expense treatment: Look for management fees, transaction fees, monitoring fees, and legal costs. If fees are capitalized in one section and expensed in another, you need a clean bridge.
- Validate the valuation basis: Remaining value may be based on appraisals, marks, or last-round pricing. Ask whether the mark is net of transaction costs and whether it reflects control or minority status.
- Match waterfall inputs: Confirm preferred return calculations, catch-up mechanics, and whether carry is calculated on realized plus unrealized value or only on realized proceeds.
Example: A recap shows $12.0M realized and $18.0M remaining. Your underwriting assumed $28.0M of net proceeds at exit. If the recap’s remaining value is gross of expected sale costs, your “remaining” is overstated. The fix is to adjust remaining value to a net-of-cost basis before comparing to your plan.
Step 2: Evaluate the Continuation Terms Like a New Deal
Treat the continuation as a fresh investment with its own risk profile.
- What is being rolled: Are you rolling equity, debt, or both? Rolling debt can change your downside dramatically.
- What changes: New leverage, new sponsor economics, new governance, and new reporting cadence can all shift outcomes.
- What stays: Some rights persist, like information rights or certain protective provisions. Identify what truly carries over.
- What price you pay: Continuations often involve a purchase of interests at a negotiated value. Compare that value to the recap’s implied value and to any recent comparable pricing.
Example: You are offered a continuation at a 1.00x “fair value” based on the recap mark. But the continuation includes a new preferred return and a higher fee stack. Even if the entry price is fair, the economics can be worse because the return waterfall is now more sponsor-friendly.
Step 3: Stress Test the Incentives and the “Exit Path”
A continuation is only sensible if the exit path is credible and the incentives don’t encourage delay or value leakage.
- Sponsor incentives: If carry resets or increases, confirm whether the reset is tied to performance or merely to a new timeline.
- Governance and control: Determine who can approve refinancing, asset sales, or additional investments.
- Information rights: Ensure you receive the same level of reporting as before, including budget variances and covenant status.
- Liquidity expectations: If your capital is rolling, you need clarity on expected timing for the next liquidity event, even if you do not rely on it.
Example: A continuation allows the sponsor to extend the holding period without investor consent. If the recap shows a valuation that depends on a near-term refinancing, the sponsor may have room to “manage marks” while delaying the event that would validate the value.
Mind Map: Secondary Recaps and Continuations
Practical Decision Checklist for the Committee
Use a short list that forces clarity.
- Is the recap mathematically consistent with the deal’s cash flows and waterfall?
- Is remaining value net of realistic costs and consistent with your underwriting basis?
- Does the continuation offer a comparable or better expected net return after fees, carry, and downside scenarios?
- Are governance and information rights at least as strong as before?
- Can you explain the decision in one paragraph using numbers, not narratives?
Example: If the recap is clean but the continuation terms add a higher preferred return and weaker consent rights, you may still accept—but only if your downside case remains acceptable and you can quantify the trade-off. If you cannot quantify it, that’s not a “maybe later” problem; it’s a “terms need revision” problem.
Common Failure Modes to Avoid
The most frequent mistakes are treating the recap as a valuation guarantee, assuming continuation terms are neutral because the price matches the mark, and overlooking how governance changes the distribution of outcomes. Long money doesn’t need perfect information; it needs consistent accounting, explicit economics, and rights that match the risk you’re taking.
10.5 Determine When to Hold When to Sell and When to Restructure
Long money decisions are less about predicting outcomes and more about choosing the right action for the information you already have. “Hold, sell, or restructure” is a three-way fork, but the fork should be guided by a small set of repeatable questions: What is the remaining value creation path? What is the downside if you do nothing? What constraints prevent a clean exit?
The Decision Inputs That Actually Matter
Start with three inputs, each with a simple yes-or-no core.
-
Value creation path: Can the business or asset still reach the underwriting case through identifiable levers (pricing, cost, utilization, refinancing, governance)? If the levers are gone or the plan depends on unrealistic execution, holding becomes inertia.
-
Downside containment: If conditions worsen, do you have contractual or economic protection (covenants, call rights, liquidation preferences, step-ups, collateral, or simply enough cash flow to avoid forced sales)? If downside containment is weak, you need a faster decision.
-
Exit feasibility: Is there a buyer or refinancing option that can be executed without destroying value (reasonable bid spread, acceptable terms, time to close)? If exit is feasible, selling can be a disciplined risk reduction tool.
A practical way to combine these inputs is to score each from 1 to 5 and then map the action. The scoring is not about precision; it’s about consistency.
Mind Map: Hold Sell or Restructure
When Holding Makes Sense
Holding is appropriate when the underwriting story still has working parts and you can survive the next few quarters without being forced into a bad outcome.
Example: Hold a performing mezzanine position. A fund bought mezzanine debt with a covenant tied to EBITDA coverage. After two quarters, EBITDA is down 12% but the company has already implemented cost reductions and has headroom of 1.6x against the covenant. The value creation lever is still active, and the covenant buffer suggests you are not one bad month away from default. In this case, holding is a controlled bet: you monitor the leading indicators (cash conversion, retention, pricing) and you only escalate if the buffer compresses.
Holding should still include a “monitoring with teeth” plan: define what metrics, at what thresholds, would change the decision to sell or restructure.
When Selling Is the Rational Risk Cut
Selling is not admitting defeat; it’s choosing a better risk position when the information you have says the original path is no longer the best use of capital.
Example: Sell after the buyer market opens and the bid spread is tight. Suppose an investor owns a minority stake in a logistics platform. The company’s customer churn rises and management’s stated plan depends on a new contract that fails to materialize. At the same time, a strategic buyer offers a price that is close to the last comparable transaction, with a short closing timeline. The value creation path is broken, and the exit feasibility is strong. Selling converts an uncertain future into a known outcome and prevents further deterioration from eroding value.
A key discipline: if you sell, you should be able to explain why the next owner can do what you cannot. If the answer is “they might,” that’s not a decision; it’s a hope.
When Restructuring Is the Middle Path
Restructuring is for situations where the asset still has potential, but the current structure makes the downside too likely or the upside too hard to realize.
Example: Restructure debt to avoid a forced sale. An investor holds secured debt where the company’s refinancing window is delayed. Cash flow is temporarily weak, and covenant headroom is shrinking. The business still has strong utilization and a credible plan to stabilize margins, but the capital structure forces a near-term breach. The investor negotiates an amendment: temporary covenant relief, an interest step-up only if performance improves, and additional reporting requirements. This is not charity; it’s a targeted change that aligns incentives and buys time for the controllable levers to work.
Restructuring should be treated like a mini-investment: specify the conditions under which the amendment is justified, the metrics that prove progress, and the consequences if those metrics are missed.
Triggers That Force the Next Action
To avoid slow drift, define decision triggers that are concrete enough to act on. Common triggers include covenant risk, loss of a key operational driver, material deviation from the base-case cash flow, and legal or tax constraints that change the feasibility of an exit.
Example: A “two-step” trigger. If EBITDA coverage falls below a threshold for two consecutive reporting periods, the default action becomes restructure. If it falls below a lower threshold or liquidity drops below a minimum cash level, the default action becomes sell or pursue a formal liquidation path.
A Simple Closing Checklist for the Decision
Before you choose hold, sell, or restructure, confirm three items: (1) the value creation path is still present or clearly absent, (2) downside containment is adequate for the time you need, and (3) the chosen action is executable with reasonable certainty. If any item fails, the decision should move to the next action category rather than staying in limbo.
That’s the long-money version of decisiveness: not faster reactions, but better-structured ones.
11. Family Office and Strategic Holding Playbooks for Long Capital
11.1 Set Governance and Investment Policy for Family Capital
Family capital governance is the boring part that makes the exciting part possible. The goal is simple: decisions should be consistent, documented, and made by the right people for the right reasons. A good governance and investment policy also prevents the classic failure mode where everyone has an opinion, but no one has authority.
Start with Purpose and Boundaries
Begin by writing a one-page “why” and a set of non-negotiable boundaries. Purpose answers what the family is trying to achieve, while boundaries answer what it will not do.
A practical purpose statement includes:
- Primary objective: income, growth, preservation, or a blend.
- Time horizon: how long capital can be illiquid.
- Risk tolerance: what kinds of losses are acceptable and what are not.
- Liquidity expectations: how much cash must be available without selling at bad times.
Boundaries should be concrete. For example: “No leverage above X% of portfolio value,” “No investments in operating businesses we cannot understand,” or “No concentration above Y% in any single issuer or strategy.”
Define Roles and Decision Rights
Governance fails when responsibilities are fuzzy. Create a role map that distinguishes who proposes, who reviews, who approves, and who executes.
A typical structure:
- Family Council: sets objectives and approves major policy changes.
- Investment Committee: evaluates deals and approves allocations within delegated authority.
- Management Team or External Manager: sources, underwrites, and manages investments.
- Administrator/Operations: handles reporting, compliance, and recordkeeping.
Decision rights should be tiered by size and complexity. For instance, small co-investments might be approved by the Investment Committee, while new strategies or large commitments require Family Council approval.
Establish the Investment Policy Statement
The Investment Policy Statement (IPS) is the family’s operating manual for money. It should read like instructions, not aspirations.
Include these sections:
- Eligible asset types: private equity, private credit, public equities, real assets, strategic holdings.
- Strategy constraints: target sectors, geography, and deal size ranges.
- Liquidity rules: how and when capital is expected to be returned.
- Leverage rules: permitted structures and limits.
- Concentration limits: issuer, manager, strategy, and sector caps.
- Valuation approach: how the family expects marks to be handled and challenged.
- Fees and expenses: what is acceptable and how conflicts are managed.
- Reporting requirements: cadence, metrics, and what must be included.
A useful IPS also defines “exceptions.” If someone wants to break a rule, the policy should specify who can approve the exception and what documentation is required.
Build a Conflict-of-Interest System
Family investing often overlaps with family businesses, board seats, and personal relationships. That overlap is manageable if the system is explicit.
Minimum controls:
- Mandatory disclosure of relationships and side arrangements.
- Written recusal rules for votes.
- A policy for co-investments involving insiders.
- A process for reviewing related-party transactions with independent input.
The point is not to eliminate relationships; it’s to ensure decisions are made on the same basis for everyone.
Create a Decision Process with Evidence Standards
Governance should specify what “good enough” looks like. Use an underwriting checklist that requires evidence, not vibes.
Evidence standards might include:
- Market and competitive context: why the business can win.
- Financial quality: cash flow drivers and downside case assumptions.
- Sponsor or management credibility: track record and operational capacity.
- Legal and structural review: rights, covenants, and exit mechanics.
- Portfolio fit: how the deal affects concentration, liquidity, and risk.
Mind Map: Governance and Investment Policy
Example: Turning Policy into a Deal Decision
Assume the IPS sets a concentration limit of 10% per strategy and a leverage cap of 30% at the portfolio level. A manager proposes a private credit deal that would raise the portfolio’s leverage exposure to 34%.
The Investment Committee does not “debate the deal’s vibes.” It checks the policy:
- If the leverage cap is non-negotiable, the deal is rejected or restructured.
- If exceptions are allowed, the committee prepares an exception memo showing why the downside is controlled, how liquidity is protected, and what offsetting actions reduce risk elsewhere.
If approved, the decision is documented with the exact policy rule that was exceeded, the rationale, and the conditions for future compliance.
Example: A Simple Reporting Cadence That People Actually Use
A family that meets quarterly can require a consistent package:
- Portfolio summary: exposures by strategy, manager, and sector.
- Liquidity schedule: expected capital calls and distributions.
- Investment updates: key operational milestones and any covenant issues.
- Valuation notes: what changed since last report and why.
This turns governance into a routine. People can disagree, but they disagree using the same facts, at the same time, with the same rules.
11.2 Build Liquidity Planning Across Private and Public Holdings
Liquidity planning is the boring part that keeps the exciting parts from becoming forced sales. The goal is simple: know what cash you can raise, when you can raise it, and what it costs you to do so—across both public holdings (fast, usually) and private holdings (slow, often).
Start with a Liquidity Map of Your Balance Sheet
Begin by listing every position and tagging it by liquidity behavior, not by asset class. A public ETF is usually “same-week,” but a concentrated public position may still be “same-week with price impact.” A private fund may be “quarterly gates,” while a direct investment may be “exit-dependent.”
Create three buckets:
- Available cash: checking, money market, and any committed capital already called.
- Near-term liquidity: positions you can sell or borrow against within 30–90 days.
- Long-term liquidity: positions that require an exit, a refinancing, or a structured secondary.
A practical rule: plan for the worst month, not the average month. If your family office has recurring expenses and periodic capital calls, the “worst month” is the month where those two collide.
Translate Commitments into a Cash Calendar
Liquidity planning fails when it’s built around holdings instead of obligations. Convert capital calls, management fees, taxes, and debt service into a cash calendar.
For each private commitment, record:
- expected call frequency and typical size range
- whether calls are discretionary or contractual
- notice period (how long you get before cash is due)
For public holdings, record:
- dividend schedule and expected tax timing
- any planned rebalancing dates
- borrowing capacity if you use margin or pledged assets
Example: A family office holds two private funds and one direct deal. One fund calls capital in irregular bursts; the other calls on a quarterly schedule. The office also has quarterly estimated taxes. The cash calendar should show that even if the annual total capital calls match available cash, a single burst month can still force a sale.
Define Liquidity Costs and Constraints
Liquidity is not free. Selling public assets can trigger taxes and spreads. Borrowing can add covenants and interest. Private exits can be delayed, and secondaries can discount value.
Assign a simple “cost score” to each liquidity path:
- Tax cost: estimated realized gains and timing
- Market impact: expected price movement for your size
- Financing cost: interest rate and any fees
- Execution risk: likelihood of completing the transaction on time
Then add constraints:
- minimum cash reserve you refuse to breach
- concentration limits that restrict selling certain positions
- governance rules that require committee approval
This is where long money thinking shows up: you’re not just asking “can we raise cash,” you’re asking “can we raise cash without breaking the investment plan.”
Build a Liquidity Ladder with Triggers
A liquidity ladder is a schedule of actions tied to cash levels. It prevents ad hoc decisions.
A simple ladder:
- Above reserve threshold: do nothing; keep cash for flexibility.
- Between thresholds: fund obligations using near-term liquidity (sell small public positions or use credit line draw).
- Below critical threshold: pause new commitments and activate pre-approved sale or borrowing actions.
Triggers should be based on cash forecast confidence. If you’re uncertain about a private capital call, treat it as “not yet received” until the notice arrives.
Mind Map: Liquidity Planning Across Private and Public Holdings
Example: Coordinating Public Sales with Private Capital Calls
Assume the office has $5M in near-term liquidity and $10M in long-term private holdings. A private fund may call $2M with 10–15 days’ notice, and estimated taxes of $1M are due in the same month.
If the office waits until notice arrives, it may need to sell public holdings quickly. Instead, the office can:
- keep a dedicated “tax buffer” in cash or near-term instruments
- pre-approve a small public sale range if the cash forecast drops below the ladder’s middle threshold
- reserve borrowing capacity as a short bridge if the public sale would create an unfavorable tax outcome
The key is that the decision is made before the pressure hits, and the ladder defines what “small” means.
Operationalize the Plan with a Review Rhythm
Liquidity planning must be updated with real information. A workable cadence:
- Monthly: update the cash calendar using actual distributions, new notices, and revised expense assumptions.
- Quarterly: review the ladder triggers and whether constraints still match reality.
- After each capital call or sale: reconcile forecast vs. actual and adjust the next forecast.
This turns liquidity planning from a spreadsheet exercise into a repeatable process that respects both public market speed and private market patience.
11.3 Create Direct Investing and Co Investing Operating Models
Direct investing and co investing are not just “ways to invest.” They are operating models with different workflows, decision rights, and data needs. The goal is to make long money consistent: fewer surprises, clearer accountability, and underwriting that matches the holding period.
Foundational Choices That Shape the Model
Start by choosing three inputs, because they determine everything else.
-
Who leads the deal? In direct investing, your team leads underwriting and negotiation. In co investing, you lead only if you are the primary investor; otherwise you become a supporting investor with a defined diligence scope.
-
How much control do you need? If you care about governance, you must plan for information rights, board or observer seats, and decision thresholds. If you only need economic exposure, you can keep diligence narrower.
-
What is your liquidity reality? Long money can tolerate illiquidity, but it still needs a cash plan. Your operating model must specify how capital is reserved, called, and tracked across multiple deals.
A practical rule: if you cannot describe the decision rights in one paragraph, you do not yet have an operating model.
Operating Model for Direct Investing
Direct investing works best when you can consistently source, underwrite, and manage.
Workflow
- Sourcing intake: Log deal origin, sponsor identity, and initial fit score.
- Screening: Confirm thesis alignment, downside plausibility, and whether you can obtain the information you need.
- Underwriting: Build a cash-flow model with scenario ranges, then map value creation levers to measurable KPIs.
- Terms negotiation: Translate your underwriting into legal protections and governance.
- Execution: Assign owners for legal, tax, compliance, and closing logistics.
- Stewardship: Set a monitoring cadence and escalation rules.
Team roles
- Deal lead: Owns underwriting narrative and final recommendation.
- Modeling analyst: Owns assumptions, sensitivities, and documentation.
- Legal/commercial liaison: Owns term sheet translation into enforceable rights.
- Portfolio steward: Owns monitoring and business review agenda.
Example: You invest directly in a profitable services company with a growth plan. Your underwriting identifies three risks: customer churn, working-capital swings, and refinancing timing. You negotiate information rights for monthly churn and cash conversion, plus a covenant-style reporting package. During ownership, you run quarterly business reviews that focus on those three risks, not on generic “progress.”
Operating Model for Co Investing
Co investing is efficient, but only if you define your diligence scope and decision triggers.
Workflow
- Co-investment intake: Confirm whether the lead investor is credible on underwriting depth and governance.
- Diligence scope: Decide what you will verify independently versus rely on.
- Terms review: Focus on the clauses that protect your downside and preserve your ability to monitor.
- Decision gating: Approve only if your key assumptions are supported and your rights are acceptable.
- Ongoing monitoring: Align with the lead investor’s reporting cadence, then add your own checks where it matters.
Example: You co-invest alongside a known lead investor in a buyout fund. You do not redo every workstream. Instead, you independently validate the refinancing plan and the top customer concentration. You also confirm that your information rights match your monitoring needs. When the portfolio company misses a cash conversion target, you escalate using the agreed reporting and governance pathway rather than waiting for the next quarterly update.
Mind Map: Direct and Co Investing Operating Model
Integrated Governance and Decision Rights
Whether direct or co, your model needs explicit thresholds.
- Approval thresholds: Define what requires full committee review versus delegated approval.
- Assumption thresholds: If a key underwriting assumption moves beyond a set range, you trigger a re-underwrite.
- Information thresholds: If reporting quality drops, you either renegotiate rights or reduce exposure.
A simple governance pattern works well: “lead owns the process, you own the risk.” In direct investing, you are both lead and risk owner. In co investing, you remain the risk owner even when you are not the process lead.
Practical Templates That Keep the Model Honest
Use three short artifacts.
- Deal fit scorecard: Thesis fit, downside plausibility, information availability, and governance feasibility.
- Rights checklist: Reporting cadence, financial statement timing, covenant or trigger visibility, and escalation mechanics.
- Monitoring agenda: Leading indicators, decision points, and who attends the business review.
These templates prevent the common failure mode: spending time on analysis while ignoring the operational reality of how you will actually monitor and respond.
Example: Switching Between Direct and Co Investing
Suppose you have a family office with a small direct team. For a core platform deal, you invest directly because you want governance and hands-on stewardship. For a satellite deal where the lead investor already has strong operational reporting, you co-invest with a narrower diligence scope. The operating model stays consistent because your templates and decision thresholds remain the same; only the workflow depth changes.
11.4 Manage Concentration Risk and Intergenerational Objectives
Concentration risk is the chance that one holding, one sponsor, or one theme dominates outcomes. Intergenerational objectives add a second constraint: what matters to today’s decision makers must still make sense when preferences, taxes, and liquidity needs change. Long money handles both by treating concentration as a design problem, not a vibe.
Start with Definitions That Survive Reality
Begin by defining concentration in three layers.
- Economic concentration: how much of net worth is tied to one asset or strategy.
- Operational concentration: how dependent you are on one management team, one platform, or one credit source.
- Liquidity concentration: how much of your near-term cash needs rely on distributions or sale proceeds from a single illiquid position.
Example: A family office owns 40% of net worth in one private credit fund. Even if the fund is diversified across borrowers, operational concentration remains high if the manager controls refinancing timing and reporting quality. Liquidity concentration is also high if the family plans a large purchase in 18 months and expects distributions that may not arrive on schedule.
Map Objectives into Constraints
Intergenerational objectives usually include at least four items: capital preservation, income needs, legacy giving, and control over decision making. Convert them into constraints that can be checked.
- Preservation constraint: maximum acceptable drawdown in a defined stress scenario.
- Income constraint: minimum expected cash flow over a set period.
- Legacy constraint: portion of assets earmarked for future transfers.
- Governance constraint: who can approve exceptions to concentration limits.
A practical trick: write constraints as “if-then” rules. If a holding breaches a limit, then the response must be pre-approved and time-bound.
Set Concentration Limits with Two Numbers
Use both a target and a maximum.
- Target is where you want to be most of the time.
- Maximum is where you must act.
Example: For a single strategic holding, set a 15% target and a 25% maximum of investable assets. If it rises above 25% due to valuation changes, you do not need to sell immediately, but you must implement a plan within a defined window, such as 60 days.
Use a “Liquidity Ladder” to Prevent Forced Decisions
Illiquid assets can be profitable and still create concentration risk if cash needs collide with lockups. Build a liquidity ladder that assigns each holding to a time bucket based on realistic exit paths.
- Bucket A: cash and near-cash for 0–12 months.
- Bucket B: liquid public holdings for 12–24 months.
- Bucket C: private positions with predictable distributions for 24–48 months.
- Bucket D: long lockups for 48+ months.
Example: If a family’s major tax payment is due in 14 months, any private position that cannot reliably generate cash should not be counted as Bucket B, even if it looks “safe” on paper.
Mind Map: Concentration Risk and Intergenerational Objectives
Advanced Controls That Keep the Plan Credible
1) Breach playbooks. Decide in advance what “action” means: sell, hedge, negotiate, or pause new commitments. The playbook should specify who signs off and what evidence is required.
2) Sponsor and counterparty concentration. Two holdings can be “different” but still share the same risk engine. If the same sponsor structures both, treat them as one operational exposure.
3) Governance continuity. Intergenerational objectives fail when decision rights change without a shared rule set. Use a written investment policy that survives leadership transitions, including concentration limits and exception procedures.
Example: A Family Office with One Dominant Holding
A family office holds 30% of investable assets in a private operating company. The family plans to fund education expenses over the next three years, and the next generation will assume governance in two years.
- They set a 20% target and 30% maximum for this holding.
- They place the position in the 24–48 month liquidity bucket, not the 0–12 month bucket.
- They require quarterly reporting on cash generation and working capital needs.
- They agree that if the position exceeds 30% or cash generation falls below a threshold for two consecutive quarters, the response is to reduce exposure by selling a portion when permitted, and to redirect new capital to diversified strategies.
This approach respects both realities: the holding may remain attractive, yet the family avoids being trapped by its own success.
Keep It Simple Enough to Execute
Concentration limits are only useful if they are measurable, time-bound, and tied to governance. Intergenerational objectives are only useful if they are translated into constraints that can be checked without interpretation. Long money wins by making the rules do the heavy lifting, so decisions stay consistent when life changes.
11.5 Use Strategic Synergies Without Overpaying for Control
Strategic synergies are real only when they show up in measurable cash flows or risk reduction. The trick is to treat “synergy” as a set of specific mechanisms, not a single number that magically appears in the model.
Start with Synergy Mechanisms, Not Synergy Headlines
Begin by listing the ways the combined business can create value. For each mechanism, write down: (1) what changes operationally, (2) who must do it, (3) what data proves it is working, and (4) what can go wrong.
Common mechanisms in private deals include:
- Commercial cross-sell: shared customer lists, bundled offerings, coordinated pricing.
- Procurement leverage: consolidated vendors, volume discounts, standardized specs.
- Cost consolidation: overlapping functions, shared back office, reduced duplication.
- Revenue retention: improved service levels that reduce churn.
- Risk reduction: diversification of end markets or supply sources.
Example: A regional software firm acquires a smaller competitor. The synergy plan is not “grow faster.” It is “migrate 60% of overlapping customers to a unified support process within 9 months, reducing churn by 1.0 percentage point.” That becomes testable.
Price Control Rights Like a Tool, Not a Trophy
Control can help execute synergy, but it also increases the price you pay and the complexity you inherit. Overpaying for control happens when buyers assume governance will automatically produce operational change.
Use a simple decision rule:
- If synergy execution depends on day-to-day decisions (pricing, product roadmap, vendor selection), control rights matter.
- If synergy execution depends on shared incentives and clear operating plans, you may achieve results with minority protections and strong reporting.
Example: In a roll-up of industrial services, procurement savings require vendor renegotiations and standardized contracts. Control rights can speed this. But if the target’s management already runs a disciplined vendor program, you may not need full control to capture savings; you need the right reporting cadence and a procurement playbook.
Build a Synergy Budget with Timing and Ownership
Synergies should be scheduled like projects. Create a synergy budget with three layers:
- Year 1 actions: integration steps that can be completed quickly.
- Year 2 actions: process changes that require training and system updates.
- Steady-state effects: benefits that persist after integration.
Assign ownership for each mechanism. If no one is accountable, the synergy is a wish.
Example: A family office buys a platform company and plans to reduce customer churn across subsidiaries. The synergy budget includes a “service quality” initiative with a named head of customer success, a target response-time metric, and a monthly review. The model includes only the churn reduction that is supported by historical benchmarks from the best-performing subsidiary.
Stress Test Synergies with “Friction” Assumptions
Synergies fail for predictable reasons: integration delays, cultural mismatch, systems incompatibility, and sales teams protecting their territories. Add friction assumptions to your model.
A practical approach:
- Reduce synergy magnitude by a realization factor (for example, 70–85% depending on integration complexity).
- Delay the ramp by adding a time-to-effect buffer.
- Add a cost-to-achieve line item for integration work.
Example: Procurement leverage looks great on paper, but vendor contracts may have notice periods and qualification requirements. If you assume savings start immediately, you will overpay. Instead, model savings as phased: 30% in quarter 2, 60% by quarter 3, and full run-rate by quarter 4.
Prevent Overpayment with a “Control Premium” Check
Before finalizing price, compute what you are paying for control versus what you are paying for cash-flow improvement.
Use this checklist:
- What portion of the purchase price is justified by standalone performance?
- What portion is justified by synergy realization?
- What portion is justified by risk reduction (for example, diversification or reduced refinancing risk)?
If the synergy portion is doing most of the work, you need either (a) stronger protections, (b) a lower price, or (c) a narrower synergy plan.
Example: Two strategic buyers compete. One offers a higher price because they believe they can “combine sales.” The other offers less but insists on measurable milestones: joint pipeline targets, shared CRM fields, and a quarterly synergy report. If the higher bidder cannot specify milestones and accountability, the control premium is likely too expensive.
Mind Map: Synergies Without Overpaying for Control
Example: A Milestone-Based Approach That Keeps Price Honest
A buyer pays a base price tied to standalone cash flows and structures additional consideration around synergy milestones. The milestones are not vague (“improve cross-sell”). They are specific: number of bundled contracts signed, churn reduction in defined cohorts, and procurement savings measured against agreed vendor categories.
If milestones are missed, the buyer either reduces the earn-out payout or gains additional rights to enforce the operating plan. This keeps the synergy story from becoming a blank check.
Practical Takeaway
Treat synergy as a set of operational projects with owners, metrics, and friction-aware timing. Then price control as a means to execute those projects, not as a substitute for proof.
12. Measure Performance and Build a Long Money Learning System
12.1 Use Net IRR and Multiple on Invested Capital with Consistent Definitions
Net IRR and Multiple on Invested Capital With Consistent Definitions
Long money performance reporting is only as good as its definitions. If two investors compute “IRR” differently, they are not comparing outcomes; they are comparing formulas. This section standardizes two core metrics—Net IRR and Multiple on Invested Capital (MOIC)—so your investment committee, family office, or strategic holding group can make decisions with the same math every time.
Foundational Concepts That Prevent Metric Drift
Net IRR is the internal rate of return after accounting for cash flows that actually left or entered the investor. That includes paid-in capital, distributions, fees, and any other investor-level cash movements.
MOIC is the total value returned to the investor divided by total invested capital. It is simpler than IRR and often more stable when timing is messy.
A consistent definition requires three choices that must be written down and reused:
- Investor-level cash flows: Use the investor’s perspective, not the fund’s marketing view.
- Timing convention: Decide whether cash flows occur on trade date, wire date, or month-end. Pick one.
- Valuation basis: For unrealized positions, decide whether “current value” is last reported NAV, appraised value, or a marked model value.
Mind Map: Metric Definitions and Inputs
Net IRR: The Practical Definition That Matches Reality
To compute Net IRR, list investor cash flows in chronological order. Outflows are negative; inflows are positive. The terminal inflow for an unrealized position is the current investor value at the measurement date.
Example: An investor commits $10,000,000 to a private credit fund.
- $4,000,000 wired on March 1
- $3,000,000 wired on June 15
- $2,000,000 wired on September 30
- Fees paid by the investor reduce net cash flows (either as separate outflows or embedded in net distributions, but not both)
- Distributions of $1,500,000 on December 20
- Current value of remaining stake is $7,200,000 on the measurement date
Net IRR uses:
- Outflows: -4.0M, -3.0M, -2.0M (plus any investor-level fee outflows)
- Inflows: +1.5M, +7.2M (terminal value)
Two common mistakes:
- Double counting fees by subtracting fees from distributions and also treating them as separate outflows.
- Mixing valuation bases by using last quarter NAV for IRR but a different mark for MOIC.
MOIC: The Definition That Stays Understandable Under Pressure
MOIC is calculated as:
MOIC = (Total Distributions + Current Value) / Total Invested Capital
Example: Using the same investment:
- Total invested capital: $9,000,000 (the funded amount)
- Distributions received to date: $1,500,000
- Current value: $7,200,000
MOIC = (1.5M + 7.2M) / 9.0M = 8.7M / 9.0M = 0.97x
This result tells you the investment is slightly below invested capital on a mark-to-date basis. It does not tell you the timing of recovery; that’s what IRR is for.
Consistency Rules That Make Comparisons Honest
Write these rules into your reporting template and enforce them:
- One measurement date per report: If you report quarterly, use the same cutoff date for every deal.
- One valuation hierarchy: Prefer audited or agreed marks; if absent, use the most recent board-approved estimate; if still absent, use a model mark with documented assumptions.
- One cash flow mapping: Ensure every fee, tax distribution, or capital call is mapped to the investor cash flow ledger.
- One definition of “invested capital”: Use funded capital net of any return of capital that reduces basis, but apply it consistently.
Advanced Details Without the Confusion
Terminal value inclusion: For Net IRR, the current value must be treated as an inflow at the measurement date. For MOIC, current value is part of the numerator. If you exclude terminal value from IRR but include it in MOIC, you will create misleading divergence.
Partial exits: When a deal sells a portion, treat the sale proceeds as distributions at the sale date. The remaining stake continues to carry its own current value into the next measurement.
Multiple share classes or side letters: If investor economics differ, compute metrics per investor class. Pooling them under one IRR definition hides real differences in net outcomes.
Quick Consistency Checklist
- Net IRR uses investor-level cash flows with a single timing convention.
- MOIC uses the same invested capital definition as Net IRR.
- Unrealized value is handled consistently as terminal inflow for IRR and numerator component for MOIC.
- Fees are included exactly once at the investor level.
- Valuation marks come from the same hierarchy across the portfolio.
When these definitions are consistent, Net IRR and MOIC stop being competing stories and become two complementary lenses: IRR answers “how fast,” MOIC answers “how much.”
12.2 Attribute Returns to Operating Growth Leverage and Multiple Expansion
Attribution is how you explain why net returns happened, not just what happened. For long money, the goal is practical: separate value creation from price paid, and separate operating improvement from financial engineering.
Start with a Simple Return Decomposition
For most private deals, you can think of total return as coming from two broad sources:
- Operating growth leverage: cash flows improve because the business performs better.
- Multiple expansion: the market value of the same cash flows rises because the valuation environment or buyer willingness changes.
A useful mental model is: if the business generates the same cash flows, any return still coming from valuation is multiple expansion. If valuation stays constant, any return coming from higher cash flows is operating leverage.
Define the Attribution Inputs Before You Compute
Attribution fails when definitions drift. Lock these choices up front:
- Operating cash flow basis: use a consistent measure such as EBITDA, unlevered free cash flow, or normalized earnings. Pick one and stick to it.
- Multiple basis: use the same valuation metric at entry and exit (e.g., EV/EBITDA or EV/FCF). Don’t mix EV/EBITDA at entry with equity multiple at exit.
- Timing: decide whether you attribute using annual averages or specific measurement dates. Use the same approach for both entry and exit.
A quick example: if you normalize EBITDA at entry by removing one-time costs, you must do the same at exit. Otherwise, you’ll accidentally attribute “multiple expansion” to “operating improvement” (or vice versa).
Attribute Operating Growth Leverage Systematically
Operating leverage is the part of return driven by improved fundamentals: revenue growth, margin expansion, working capital discipline, and capital efficiency.
Break operating improvement into drivers:
- Revenue growth: new customers, retention, pricing, and channel mix.
- Gross margin: procurement, yield, mix, and pricing power.
- Operating expense discipline: headcount efficiency, automation, and sales productivity.
- Working capital: receivables collection, inventory turns, payables terms.
- Capex efficiency: maintenance vs growth capex, and how much growth you buy per dollar.
Example: A sponsor buys a services business at 6.0x EV/EBITDA. Over three years, EBITDA rises from $10m to $13m due to pricing and improved utilization. If the exit multiple were held at 6.0x, the enterprise value would rise from $60m to $78m. That $18m increase is operating growth leverage.
Attribute Multiple Expansion with a Valuation Bridge
Multiple expansion is what happens when the exit multiple differs from the entry multiple, after accounting for changes in cash flows.
Use a bridge:
- Entry value = Entry multiple × Entry operating metric
- “No multiple change” value = Entry multiple × Exit operating metric
- Exit value = Exit multiple × Exit operating metric
Then:
- Operating leverage contribution = “No multiple change” value − Entry value
- Multiple expansion contribution = Exit value − “No multiple change” value
Example: Continuing the prior case, suppose the exit multiple rises from 6.0x to 7.0x. Exit value becomes 7.0 × $13m = $91m. The operating leverage portion was $78m − $60m = $18m. The multiple expansion portion is $91m − $78m = $13m.
Mind Map: The Attribution Logic
Handle Leverage, Fees, and One-Offs Without Confusing the Story
If you’re attributing to operating leverage and multiple expansion, you still need to prevent common distortions:
- Financing effects: interest expense and refinancing gains can move equity returns without changing enterprise value. Attribute enterprise value changes to operating and multiple; attribute equity return changes to financing separately if needed.
- Fees and carry: fees reduce net returns but don’t change the underlying business value. Keep a “net-to-gross” reconciliation so attribution stays honest.
- One-off items: normalize operating metrics. If a restructuring gain boosts EBITDA, you don’t want that to masquerade as operating leverage.
A Practical Mini-Template for Your Investment Memo
Use this checklist when you write the attribution section:
- Entry operating metric: ___
- Exit operating metric: ___
- Entry multiple: ___
- Exit multiple: ___
- Entry value: ___
- No-multiple-change value: ___
- Exit value: ___
- Operating leverage contribution: ___
- Multiple expansion contribution: ___
- Normalization notes and one-offs removed: ___
When the numbers are laid out this way, the story becomes testable. If operating leverage is small, you know the plan depended more on valuation. If multiple expansion is small, you know the business work mattered more. Either way, long money gets a clearer view of what actually earned the return.
12.3 Track Fees Expenses and Carry Impacts Over the Full Life Cycle
Long money returns are easy to state and harder to measure. Fees, expenses, and carry can quietly reshape outcomes even when the underlying investment performs well. Tracking them across the full life cycle keeps your performance math honest and your decisions consistent.
Foundational Concepts for Fee and Carry Tracking
Start by separating three buckets:
- Fees: amounts paid to service providers (manager, administrator, legal, audit, valuation, placement). These usually reduce net cash flows.
- Expenses: pass-through costs (travel, third-party reports, taxes on services, insurance, bank charges). Some are reimbursed; some are not.
- Carry: the manager’s performance-based share of profits, typically calculated after returning capital and meeting a preferred return or hurdle.
A practical rule: fees and expenses affect timing and net cash flows immediately; carry affects outcomes later and often depends on how profits are realized and distributed.
Life Cycle Map of Where Money Goes
Track from first dollar to final distribution. The same deal can look profitable on paper yet produce a disappointing net result if the fee and carry mechanics are unfavorable.
Mind Map: Fee, Expense, and Carry Flow
Step 1: Build a Cash Flow Model That Includes Everything
Use a single cash flow timeline with consistent sign conventions (investments as negative, distributions as positive). Then add line items:
- Upfront and pre-close costs: legal, diligence, structuring, and any commitment fees.
- Ongoing management fees: often calculated on committed capital, invested capital, or net asset value. The base matters.
- Operating expenses: third-party services and fund-level costs.
- Financing costs: interest, fees, and hedging costs tied to the investment.
- Transaction fees: acquisition and disposition fees, if charged.
- Carry: calculated at distribution events using the waterfall.
Example: Suppose a fund charges 1.5% per year on committed capital for two years, then switches to 1.0% on invested capital. If the fund invests slowly, the early fee drag can be larger than you expect because committed capital stays high.
Step 2: Understand the Waterfall Mechanics for Carry
Carry is not just “a percentage of profit.” It is usually governed by a sequence:
- Return of capital
- Preferred return (sometimes simple, sometimes compounded)
- Catch-up (sometimes)
- Split between investors and manager
Two deals with the same gross profit can produce different carry outcomes because of timing of distributions and how profits are measured (realized vs. unrealized, gross vs. net of certain expenses).
Example: Deal A distributes profits early. That can trigger carry sooner, which reduces the amount available to compound for investors. Deal B holds longer and distributes later, potentially delaying carry and improving investor net IRR even if gross MOIC is similar.
Step 3: Track Fees and Expenses as Effective Rates
A fee schedule is not the same as a fee burden. Convert fees and expenses into effective measures:
- Effective fee rate over the life of the investment (total fees and non-reimbursed expenses divided by average invested capital)
- Carry drag: the difference between investor net returns with and without carry
- Net-to-gross bridge: how much each fee and expense category reduces net distributions
Example: If management fees total $3.0M and expenses total $0.6M on average invested capital of $40M over five years, the combined effective burden is not just 9% over five years; it also affects timing. A $3.6M reduction in early cash flows can reduce net IRR more than a later reduction of the same magnitude.
Step 4: Reconcile Reporting to Your Model
Reporting packages often summarize totals, but you need line-item reconciliation:
- Compare your model’s fee and expense assumptions to actual statements.
- Confirm which costs are reimbursed and which are borne by investors.
- Validate carry calculations against distribution notices.
A simple control: keep a “variance log” with three columns—assumption, actual, and reason. Reasons should be specific, like “base changed from committed to invested capital at first close” or “valuation fee reclassified as expense.”
Step 5: Use a Break-Even Lens for Decision Quality
Before committing, compute what gross performance is required to hit your target net return after fees, expenses, and carry. This prevents surprises later.
Example: If your target net IRR is 12% and the fee burden is heavy in the first three years, you may need a higher gross operating improvement than you initially assumed. The point is not pessimism; it’s clarity about what must go right.
Practical Checklist for Full Life Cycle Tracking
- Maintain one cash flow model from pre-close to final distribution.
- Separate fees, expenses, financing costs, and carry.
- Model the waterfall explicitly, including preferred return and catch-up.
- Convert fee schedules into effective rates using timing.
- Reconcile every reporting period and log variances.
- Compute break-even gross performance to connect underwriting to net outcomes.
When fees, expenses, and carry are tracked this way, net performance stops being a mystery and becomes a measurable consequence of structure, timing, and execution.
12.4 Run Post Mortems with Root Cause Analysis and Actionable Changes
A post mortem is a structured review of what happened versus what you expected, with the goal of changing decisions next time. The trick is to avoid turning it into a blame meeting or a victory lap. You’re not grading people; you’re auditing assumptions, processes, and incentives.
Start with a Clear Scope and Timeline
Pick one investment or one decision cycle. Define the start point (for example, underwriting approval date) and the end point (for example, exit close date or the last reporting period). If the deal is still active, focus on the period where the outcome diverged.
Example: A mezzanine position was underwritten in March 2024 and refinanced in May 2024. The post mortem scope is “from underwriting approval to refinancing outcome,” not the entire holding period.
Separate Expectations from Outcomes
Create a two-column list: “Expected” and “Observed.” Expected items should come from the investment memo: base case, downside case, key covenants, operating assumptions, and financing plan. Observed items should come from actual reporting, legal documents, and cash flow statements.
A simple rule keeps teams honest: if an “expected” item was never written down, it can’t be used as a benchmark.
Use a Root Cause Method That Matches the Problem
Not every failure is the same. Use different lenses depending on what went wrong.
- If the issue is forecasting error, use an assumption audit: which inputs were wrong, and why.
- If the issue is execution error, use a process audit: where the workflow broke (data, approvals, timing, documentation).
- If the issue is incentive mismatch, use a governance audit: who had power, what they were rewarded for, and what information they received.
A practical approach is “5 Whys” for narrow issues and “fishbone” for broader ones. The goal is to land on causes you can act on, not causes you can argue about.
Mind Map: Post Mortem Workflow and Root Cause Paths
Post Mortem Mind Map
Convert Causes into Specific, Testable Changes
Actionable changes are not “be more careful.” They are modifications to a repeatable artifact: a template, a threshold, a checklist, or a monitoring trigger.
Use this structure for each change:
- What will change (template field, covenant trigger, approval step)
- Why it addresses the root cause
- How you will verify adoption (documented evidence)
- What metric should improve next time (for example, fewer covenant surprises)
Example: Root cause identified that the downside case assumed refinancing at a spread that was never supported by comparable transactions. Change: add a “refinancing spread evidence” section to the model inputs and require at least two comparable references before underwriting approval.
Keep the Evidence Chain Tight
Every root cause claim should point to a specific artifact. If someone says “we underestimated liquidity risk,” ask: which liquidity assumption was used, what data supported it, and where it was documented.
A useful exercise is to highlight three items in the underwriting memo:
- the single most important assumption
- the single most fragile assumption
- the single assumption with the weakest evidence
Then compare those to what actually happened.
Mind Map: Root Cause Categories and Example Fixes
Run a Short Follow-Up to Confirm Adoption
A post mortem is only useful if it changes behavior. Schedule a follow-up after the next similar decision cycle. Verify that the updated template was used, the new trigger fired (or didn’t), and the team can explain the change without improvising.
Example: After identifying a monitoring gap, the team adds a quarterly “covenant headroom” report. In the next quarter, the report is produced, and the investment committee can point to the exact covenant metric that drove the decision to renegotiate early.
A Note on Dates and Documentation
When referencing the timeline, use the actual decision dates from your internal logs. For example, if the underwriting approval occurred on 2024-02-15, keep that date consistent across the memo, decision log, and post mortem worksheet. Consistency prevents the most common kind of confusion: arguing about which version of reality you’re reviewing.
12.5 Maintain an Investment Committee Toolkit for Repeatable Decisions
A good investment committee (IC) doesn’t just decide; it produces decisions that can be explained, audited, and improved. The toolkit below is designed to keep meetings consistent without turning them into a checklist theater.
Foundational Inputs That Make Decisions Comparable
Start by standardizing what “good” information looks like. Every deal should arrive with the same core inputs so members can compare apples to apples.
- Thesis and fit: What the investment is trying to achieve, and why this sponsor or company is the right vehicle.
- Return bridge: A simple chain from operating drivers to cash flows to valuation outcomes.
- Downside map: The top failure modes, what would cause them, and what evidence would show early.
- Terms and alignment: How economics and governance change the incentives for the sponsor and management.
- Liquidity and timing: Expected cash flows, lockups, and what happens if refinancing or exit timing slips.
Example: If two deals both target “growth,” the toolkit forces the IC to specify whether growth comes from pricing, retention, new customers, or acquisitions, and which of those is most likely to break.
Decision Templates That Reduce Rework
Use consistent templates for each stage: screening, underwriting, and approval. The goal is not to write more; it’s to prevent the same questions from being asked every time.
- Screening memo (1–2 pages): Deal summary, thesis fit, quick downside, and a recommendation to proceed or stop.
- Underwriting memo (4–6 pages): Full return bridge, scenario analysis, diligence gaps, and key term sensitivities.
- IC decision sheet (1 page): The final decision, the conditions to close, and the monitoring commitments.
Example: If diligence is missing customer concentration data, the decision sheet should state whether the IC can accept that gap at entry, or whether it requires a specific data deliverable before signing.
Mind Map: Committee Workflow and Artifacts
Investment Committee Toolkit Mind Map
Decision Rules That Prevent “Vibes-Based” Approvals
Define what triggers each outcome. The toolkit should include explicit decision rules so members don’t rely on intuition.
- Approve when the base case is supported, downside is bounded, and terms provide credible protection.
- Approve with conditions when key uncertainties exist but can be resolved through specific diligence, pricing adjustments, or governance protections.
- Reject when downside is not explainable, terms shift risk to the investor, or the return bridge depends on assumptions that lack evidence.
Example: A deal might show an attractive base-case IRR, but if the downside map reveals that a single refinancing event could wipe out equity and the terms don’t offer any mitigation, the rule pushes the IC toward rejection or renegotiation.
Monitoring Commitments That Close the Loop
Repeatability requires that decisions come with follow-through. Each approval should specify what will be monitored and what would cause a change in stance.
- Leading indicators: Metrics that move before financials do (retention, churn, pipeline conversion, gross margin trends).
- Assumption checkpoints: The exact underwriting assumptions that must remain true.
- Escalation triggers: Clear thresholds for when the IC must revisit (e.g., covenant headroom falls below a defined band).
Example: If underwriting assumes stable customer renewal rates, the monitoring plan should name the renewal metric, the reporting cadence, and the threshold that would prompt renegotiation or exit planning.
Post-Mortems That Improve Future Underwriting
After an investment reaches a milestone—often at exit, but also at major restructurings—run a structured post-mortem.
- What happened vs. what was expected: Compare realized drivers to the return bridge.
- Which failure modes materialized: Confirm whether the downside map was accurate.
- Decision quality review: Identify whether the issue was diligence quality, pricing, terms, or execution.
- Toolkit updates: Record changes to templates, question lanes, or required diligence items.
Example: If the committee repeatedly underestimates working-capital swings, the post-mortem should update the underwriting memo template to require a standardized working-capital stress test.
A Practical IC Meeting Rhythm
To keep meetings efficient, require pre-reads and use question lanes. Members should ask questions in categories so the sponsor team can respond without getting pulled into unrelated debates.
- Economics lane: return bridge, fees, and cash flow timing.
- Risks lane: failure modes, evidence quality, and stress tests.
- Terms lane: governance, protective provisions, and alignment.
- Execution lane: operational plan, milestones, and reporting.
A toolkit is only useful if it produces consistent outputs. When the same templates and rules are used across deals, the committee can spend less time re-arguing fundamentals and more time improving the quality of the next decision.