Cloud Native Microservices with Kubernetes Service Mesh and Observability
1. Introduction to Cloud Native Microservices
1.1 Understanding Cloud Native Principles
Cloud native is a way of building and running applications that fully exploit the advantages of the cloud computing model. It’s not just about hosting applications in the cloud but designing them to be scalable, resilient, and manageable in dynamic environments like Kubernetes.
At its core, cloud native is about four key principles: containerization, microservices architecture, dynamic orchestration, and declarative APIs. These principles work together to enable rapid development, deployment, and operation of applications.
Mind Map: Core Cloud Native Principles
Containerization
Containers package an application with everything it needs to run: code, runtime, system tools, libraries, and settings. This packaging ensures that the application behaves the same regardless of where it runs. For example, a Node.js microservice packaged in a Docker container will run identically on a developer’s laptop, a testing environment, or a production Kubernetes cluster.
This isolation reduces the “it works on my machine” problem and simplifies dependency management. Containers are lightweight compared to virtual machines, allowing for faster startup and better resource utilization.
Microservices Architecture
Rather than building one large application, cloud native favors splitting functionality into small, loosely coupled services. Each microservice focuses on a single business capability and can be developed, deployed, and scaled independently.
For instance, an e-commerce platform might have separate microservices for user management, product catalog, order processing, and payment. This separation allows teams to work independently and deploy updates without affecting the entire system.
A practical example: if the payment service needs to handle increased traffic during a sale, it can be scaled without scaling unrelated services like the product catalog.
Dynamic Orchestration
Managing many containers manually is impractical. Dynamic orchestration automates deployment, scaling, healing, and networking of containers. Kubernetes is the most widely used orchestrator, managing container lifecycles based on declarative configurations.
For example, if a pod running a microservice crashes, Kubernetes automatically restarts it. If traffic increases, Kubernetes can spin up additional pods to handle the load.
This automation reduces operational overhead and improves application availability.
Declarative APIs
Cloud native systems use declarative APIs to specify the desired state of the system rather than the steps to achieve it. Kubernetes manifests written in YAML or JSON describe what the system should look like—such as how many replicas of a service should run or which container image to use.
The orchestrator continuously works to match the actual state to the declared desired state. If a pod is deleted, Kubernetes notices the discrepancy and creates a new one to restore the declared state.
This approach simplifies management and enables version control of infrastructure and application configurations.
Mind Map: Benefits of Cloud Native Design
Example: Deploying a Simple Cloud Native Microservice
Imagine a simple “Hello World” microservice written in Go. You package it into a Docker container. The Dockerfile specifies the base image, copies the source code, and defines the startup command.
Next, you write a Kubernetes deployment YAML that declares:
- The container image to run
- The number of replicas
- The ports to expose
When you apply this manifest to a Kubernetes cluster, the orchestrator creates the specified number of pods running your microservice. If you update the container image and apply the manifest again, Kubernetes performs a rolling update with zero downtime.
This example highlights how cloud native principles enable consistent, automated, and scalable application management.
In summary, understanding cloud native principles means recognizing how containerization, microservices, dynamic orchestration, and declarative APIs combine to build applications that are easier to develop, deploy, and operate in modern cloud environments.
1.2 Benefits of Microservices Architecture
Microservices architecture breaks down an application into smaller, independent services that communicate over well-defined APIs. This approach contrasts with monolithic architectures, where all components are tightly integrated into a single codebase. The benefits of microservices come from this modularity and independence.
Benefits of Microservices Architecture
Independent Development and Deployment
Each microservice can be developed, tested, and deployed independently. This means teams can work in parallel without waiting for others to finish their parts. For example, a payments service can be updated without touching the user profile service.
Mind Map: Independent Development and Deployment
Scalability
Microservices allow scaling only the parts of the application that need more resources. If a search service experiences heavy load, it can be scaled independently without scaling the entire application. This targeted scaling is more resource-efficient.
Mind Map: Scalability
Technology Diversity
Teams can choose the best technology stack for each microservice. For instance, a data-intensive analytics service might use Python, while a high-throughput API service might use Go. This flexibility is harder to achieve in monoliths.
Mind Map: Technology Diversity
Fault Isolation
Failures in one microservice are less likely to cascade and bring down the entire system. If the recommendation service fails, the rest of the application can continue functioning normally, improving overall system resilience.
Mind Map: Fault Isolation
Easier Maintenance and Understanding
Smaller codebases are easier to understand and maintain. Developers can focus on a single service without needing to grasp the entire application. This reduces cognitive load and speeds up onboarding.
Mind Map: Easier Maintenance
Continuous Delivery and Deployment
Microservices fit well with continuous integration and deployment pipelines. Since services are independent, teams can release updates frequently and reliably without coordinating large-scale releases.
Mind Map: Continuous Delivery
Organizational Alignment
Microservices can mirror organizational structure, with teams owning specific services end-to-end. This alignment reduces handoffs and clarifies responsibilities.
Mind Map: Organizational Alignment
Concrete Example
Consider an e-commerce platform split into microservices: user management, product catalog, order processing, and payment.
- The product catalog service can be scaled during sales events without affecting payment processing.
- The payment service can be written in a language optimized for security and compliance, while the catalog service uses a language suited for fast data retrieval.
- If the order processing service encounters a bug, it can be fixed and redeployed without taking down the entire platform.
This modularity reduces downtime, improves developer productivity, and optimizes resource use.
In summary, microservices architecture offers practical advantages that stem from breaking down complexity into manageable, independently deployable units. These benefits translate into faster development cycles, better resource utilization, and more resilient systems.
1.3 Comparing Monoliths and Microservices with Practical Examples
When deciding between monolithic and microservices architectures, understanding their core differences through concrete examples helps clarify trade-offs.
What is a Monolith?
A monolith is a single, unified application where all components—UI, business logic, and data access—live together. It’s packaged and deployed as one unit.
What are Microservices?
Microservices break down an application into smaller, independently deployable services, each responsible for a specific business capability. These services communicate over a network, often using APIs.
Mind Map: Monolith vs Microservices Overview
Example Scenario: Online Retail Application
Monolithic Approach:
- One application handles user authentication, product catalog, shopping cart, order processing, and payment.
- All modules share the same database.
- Deployment means building and releasing the entire app.
Microservices Approach:
- Separate services for Authentication, Catalog, Cart, Orders, and Payments.
- Each service has its own database optimized for its needs.
- Services communicate via REST or messaging.
- Deployments happen independently per service.
Mind Map: Online Retail Application Components
Key Differences Illustrated
| Aspect | Monolith Example | Microservices Example |
|---|---|---|
| Deployment | One large WAR/JAR deployed as a whole | Each service deployed independently |
| Scaling | Scale entire app even if only one part is busy | Scale only the busy service (e.g., Cart) |
| Technology Stack | Single language/framework (e.g., Java Spring Boot) | Different stacks per service (e.g., Node.js for Auth, Go for Orders) |
| Fault Isolation | One failure can affect entire app | Failure isolated to one service |
| Data Management | Shared relational database | Separate databases per service |
| Development Speed | Changes require full build and deploy | Teams can work and deploy independently |
Practical Example: Adding a New Feature
Monolith: Adding a recommendation engine means modifying the existing codebase, testing the entire app, and deploying the whole system. This can slow down release cycles and increase risk.
Microservices: The recommendation engine is a new service. It can be developed, tested, and deployed independently without touching other services. This reduces risk and speeds up iteration.
Mind Map: Feature Addition Workflow
When Monoliths Make Sense
- Small teams or projects with limited scope.
- Simple applications where overhead of distributed systems isn’t justified.
- When rapid prototyping is needed without complex infrastructure.
When Microservices Make Sense
- Large, complex systems with multiple teams.
- Need for independent scaling and deployment.
- Diverse technology requirements across components.
Summary
Monoliths offer simplicity and ease of development initially but can become cumbersome as the application grows. Microservices provide modularity and flexibility but introduce complexity in communication, deployment, and data consistency. The choice depends on project size, team structure, and operational requirements.
1.4 Introduction to Kubernetes as a Microservices Platform
Kubernetes is an open-source platform designed to automate the deployment, scaling, and management of containerized applications. When working with microservices, Kubernetes provides a structured environment that simplifies running multiple services independently while maintaining overall system coherence.
At its core, Kubernetes organizes containers into units called Pods. A Pod can contain one or more containers that share storage, network, and specifications on how to run. This grouping is useful for tightly coupled components, but typically, each microservice runs in its own Pod.
Mind Map: Kubernetes Core Concepts for Microservices
Kubernetes Services provide stable IP addresses and DNS names for Pods, which are ephemeral by nature. This abstraction allows microservices to discover and communicate with each other without worrying about Pod lifecycle changes.
Deployments manage the desired state of Pods, enabling easy updates and rollbacks. For example, if you want to update a microservice to a new version, you define a new Deployment spec, and Kubernetes handles the rollout.
ConfigMaps and Secrets allow you to decouple configuration and sensitive information from container images. This means you can update configurations without rebuilding your images or redeploying your services unnecessarily.
Namespaces help organize and isolate resources within a Kubernetes cluster. For microservices, namespaces can separate environments (like dev, staging, production) or teams, reducing the risk of resource conflicts.
Example: Deploying a Simple Microservice on Kubernetes
Imagine a microservice called “user-service” that exposes a REST API.
- Pod Definition (simplified):
apiVersion: v1
kind: Pod
metadata:
  name: user-service-pod
spec:
  containers:
  - name: user-service
    image: example/user-service:1.0
    ports:
    - containerPort: 8080
- Service to expose the Pod:
apiVersion: v1
kind: Service
metadata:
  name: user-service
spec:
  selector:
    app: user-service
  ports:
  - protocol: TCP
    port: 80
    targetPort: 8080
  type: ClusterIP
- Deployment for managing replicas:
apiVersion: apps/v1
kind: Deployment
metadata:
  name: user-service-deployment
spec:
  replicas: 3
  selector:
    matchLabels:
      app: user-service
  template:
    metadata:
      labels:
        app: user-service
    spec:
      containers:
      - name: user-service
        image: example/user-service:1.0
        ports:
        - containerPort: 8080
This setup ensures that three instances of the user-service run concurrently, with a Service providing a stable endpoint for other microservices or clients.
Mind Map: Microservice Deployment Workflow on Kubernetes
Kubernetes also supports rolling updates, which means you can update your microservice image version without downtime. It gradually replaces old Pods with new ones, verifying health before proceeding.
In summary, Kubernetes acts as a microservices platform by providing primitives that manage container lifecycle, networking, configuration, and scaling. This reduces the operational burden and allows developers to focus on writing services rather than managing infrastructure.
1.5 Setting Up a Simple Microservice on Kubernetes: A Hands-On Example
In this section, we’ll create a basic microservice, package it in a container, and deploy it on a Kubernetes cluster. The goal is to understand the essential steps and components involved in running a microservice on Kubernetes without overwhelming complexity.
Step 1: Building a Simple Microservice
We’ll start with a minimal HTTP server written in Go. This service responds with a JSON message indicating it’s alive.
package main

import (
    "encoding/json"
    "net/http"
)

type response struct {
    Message string `json:"message"`
}

func handler(w http.ResponseWriter, r *http.Request) {
    w.Header().Set("Content-Type", "application/json")
    json.NewEncoder(w).Encode(response{Message: "Hello from Kubernetes microservice!"})
}

func main() {
    http.HandleFunc("/", handler)
    http.ListenAndServe(":8080", nil)
}
This simple service listens on port 8080 and returns a JSON message.
Step 2: Containerizing the Microservice
Next, we create a Dockerfile to containerize the Go application.
FROM golang:1.20-alpine AS builder
WORKDIR /app
COPY . .
RUN go build -o microservice .

FROM alpine:latest
WORKDIR /root/
COPY --from=builder /app/microservice .
EXPOSE 8080
CMD ["./microservice"]
This multi-stage build compiles the Go binary in a lightweight Alpine image and then copies the binary into a minimal Alpine container.
Step 3: Building and Pushing the Docker Image
Build the image locally:
docker build -t your-dockerhub-username/microservice:1.0 .
Push it to a container registry:
docker push your-dockerhub-username/microservice:1.0
Replace your-dockerhub-username with your actual Docker Hub username.
Step 4: Writing Kubernetes Deployment and Service Manifests
Create a deployment manifest microservice-deployment.yaml:
apiVersion: apps/v1
kind: Deployment
metadata:
  name: microservice-deployment
spec:
  replicas: 2
  selector:
    matchLabels:
      app: microservice
  template:
    metadata:
      labels:
        app: microservice
    spec:
      containers:
      - name: microservice
        image: your-dockerhub-username/microservice:1.0
        ports:
        - containerPort: 8080
Create a service manifest microservice-service.yaml:
apiVersion: v1
kind: Service
metadata:
  name: microservice-service
spec:
  selector:
    app: microservice
  ports:
  - protocol: TCP
    port: 80
    targetPort: 8080
  type: ClusterIP
The deployment manages two replicas of the microservice container. The service exposes the deployment internally on port 80, forwarding to port 8080 on the pods.
Step 5: Deploying to Kubernetes
Apply the manifests:
kubectl apply -f microservice-deployment.yaml
kubectl apply -f microservice-service.yaml
Verify pods are running:
kubectl get pods -l app=microservice
Check the service:
kubectl get svc microservice-service
Step 6: Accessing the Microservice
Since the service is ClusterIP, it’s accessible only inside the cluster. To test locally, use port forwarding:
kubectl port-forward svc/microservice-service 8080:80
Now, open another terminal and run:
curl http://localhost:8080/
Expected output:
{"message":"Hello from Kubernetes microservice!"}
Mind Map: Key Components in This Setup
Best Practices Illustrated
- Multi-stage Docker builds reduce image size and surface area.
- Label selectors in deployments and services ensure correct pod targeting.
- Replicas provide basic availability.
- Port forwarding is a simple way to test services without exposing them externally.
This example covers the minimal viable steps to get a microservice running on Kubernetes. It sets the foundation for adding complexity like service meshes, observability, and scaling in later sections.
2. Designing Microservices for the Cloud Native Ecosystem
2.1 Domain-Driven Design for Microservices with Real-World Scenarios
Domain-Driven Design (DDD) is a method of structuring software projects around the core business domains they serve. When applied to microservices, it helps split a complex system into smaller, manageable, and loosely coupled services that align closely with business capabilities. This section explains how DDD concepts translate into microservices design, illustrated with practical examples and mind maps.
Understanding Core Concepts of DDD
At its heart, DDD focuses on the domain, which is the sphere of knowledge and activity around which the business operates. Within the domain, there are subdomains, which represent distinct areas of business logic. Each subdomain can be a candidate for a microservice boundary.
Key DDD building blocks include:
- Entities: Objects with a distinct identity that persists over time.
- Value Objects: Immutable objects defined by their attributes.
- Aggregates: Clusters of entities and value objects treated as a single unit.
- Bounded Contexts: Explicit boundaries within which a particular domain model applies.
- Domain Events: Events that signify something important happened within the domain.
Mapping DDD to Microservices
Microservices should ideally map to bounded contexts. This ensures that each service owns its data and logic, reducing dependencies and improving maintainability.
Mind Map: DDD Concepts and Microservices Mapping
Real-World Scenario: Online Retail Platform
Imagine an online retail platform with several business capabilities: order management, inventory, payment processing, and customer management. Applying DDD:
- Order Management is a bounded context responsible for order lifecycle.
- Inventory manages stock levels and availability.
- Payment Processing handles payment authorization and transactions.
- Customer Management maintains customer profiles and preferences.
Each bounded context can be implemented as a separate microservice. This separation allows teams to work independently and scale services based on demand.
Mind Map: Online Retail Platform Bounded Contexts
Example: Designing the Order Management Microservice
- Entity: Order with attributes like orderId, customerId, orderStatus.
- Value Object: OrderItem with productId, quantity, price.
- Aggregate: Order aggregate root ensures consistency of order and its items.
- Domain Events: When an order is placed, an
OrderPlacedevent is emitted.
This microservice owns the order data and exposes APIs to create, update, or cancel orders. It communicates with Inventory and Payment services asynchronously through events.
Handling Relationships Between Microservices
DDD encourages minimizing direct dependencies between bounded contexts. Instead, services communicate via well-defined APIs or asynchronous messaging.
For example, when an order is placed, the Order Management service emits an OrderPlaced event. The Inventory service listens for this event to adjust stock levels. This event-driven approach reduces tight coupling.
Mind Map: Event-Driven Communication Between Services
Best Practices in Applying DDD to Microservices
- Define clear bounded contexts: Avoid overlapping responsibilities.
- Keep aggregates small: Large aggregates can lead to performance bottlenecks.
- Use domain events for integration: Prefer asynchronous communication to reduce coupling.
- Model based on business language: Use ubiquitous language shared between developers and domain experts.
- Isolate data per service: Each microservice should own its database to prevent tight coupling.
Summary
Domain-Driven Design provides a structured way to break down complex business domains into microservices aligned with business capabilities. By focusing on bounded contexts and aggregates, teams can build services that are easier to maintain, scale, and evolve. Real-world scenarios like an online retail platform illustrate how DDD concepts translate into concrete microservice boundaries and communication patterns.
2.2 API Design Best Practices: REST vs gRPC Examples
When designing APIs for microservices, the choice between REST and gRPC often comes up. Both have their place, and understanding their strengths and trade-offs helps create better, more maintainable services.
REST API Design Best Practices
REST (Representational State Transfer) is an architectural style that uses HTTP methods explicitly and is resource-oriented. It’s widely adopted and understood.
-
Use nouns, not verbs, for resource URIs:
/usersinstead of/getUsers/orders/123to access a specific order
-
HTTP methods convey intent:
GETto retrieve dataPOSTto createPUTorPATCHto updateDELETEto remove
-
Stateless interactions: Each request contains all information needed.
-
Use proper HTTP status codes:
200 OKfor success201 Createdwhen a resource is created404 Not Foundwhen a resource doesn’t exist400 Bad Requestfor invalid input
-
Support filtering, sorting, and pagination:
/products?category=books&sort=price_asc&page=2
-
Version your API:
- Via URI (
/v1/users) or headers
- Via URI (
-
Use JSON as the data format: It’s human-readable and widely supported.
REST Example: User Service
GET /users/42 HTTP/1.1
Host: api.example.com
Accept: application/json
Response:
{
  "id": 42,
  "name": "Alice",
  "email": "[email protected]"
}
To create a user:
POST /users HTTP/1.1
Host: api.example.com
Content-Type: application/json

{
  "name": "Bob",
  "email": "[email protected]"
}
Response:
HTTP/1.1 201 Created
Location: /users/43
gRPC API Design Best Practices
gRPC is a high-performance RPC framework that uses HTTP/2 and Protocol Buffers (protobuf) for serialization. It’s well-suited for internal microservice communication.
-
Define services and methods explicitly in
.protofiles:- Each RPC corresponds to a method
-
Use strongly typed messages: Protobuf defines message schemas that are compact and fast.
-
Use unary or streaming RPCs:
- Unary for request-response
- Server streaming, client streaming, or bidirectional streaming for continuous data flows
-
Keep APIs backward compatible: Add new fields with unique tags; avoid removing or renaming existing fields.
-
Use meaningful method names:
GetUser,CreateUser,UpdateUser
-
Leverage HTTP/2 features: Multiplexing, header compression, and bidirectional streams
gRPC Example: User Service (user.proto)
syntax = "proto3";

package user;

service UserService {
  rpc GetUser(GetUserRequest) returns (UserResponse);
  rpc CreateUser(CreateUserRequest) returns (UserResponse);
}

message GetUserRequest {
  int32 id = 1;
}

message CreateUserRequest {
  string name = 1;
  string email = 2;
}

message UserResponse {
  int32 id = 1;
  string name = 2;
  string email = 3;
}
Mind Map: REST API Design
Mind Map: gRPC API Design
When to Use REST vs gRPC
| Aspect | REST | gRPC |
|---|---|---|
| Protocol | HTTP/1.1 | HTTP/2 |
| Data Format | JSON | Protocol Buffers |
| Performance | Moderate | High |
| Streaming Support | Limited (via WebSockets) | Built-in (client/server/bidirectional) |
| Browser Compatibility | Native support | Requires proxy or special client |
| Ease of Use | Easy to test with curl/Postman | Requires code generation tools |
| Use Case | Public APIs, external clients | Internal microservice communication |
Practical Example: Calling gRPC from REST
Sometimes, you want to expose a REST API externally but use gRPC internally. You can implement a gateway that translates REST calls into gRPC requests.
Example: REST endpoint /users/{id} calls gRPC GetUser method internally.
This approach combines REST’s accessibility with gRPC’s performance.
Summary
- REST is simple, widely supported, and human-readable, ideal for public-facing APIs.
- gRPC offers better performance and strong typing, suited for internal microservice communication.
- Design APIs with clear resource/method definitions, consistent naming, and versioning.
- Use proper status codes and error handling.
- Consider your client environment and performance needs when choosing between REST and gRPC.
2.3 Data Management Strategies in Microservices: Database per Service Pattern
In microservices architecture, managing data is a challenge that demands careful planning. One widely accepted approach is the Database per Service pattern. This pattern assigns each microservice its own dedicated database, ensuring loose coupling and service autonomy.
Why Database per Service?
When each microservice owns its database, it controls its data schema and storage technology. This independence allows teams to choose the best database type for their service’s needs—SQL, NoSQL, graph, or time-series databases—without affecting others.
This separation also reduces the risk of cascading failures. If one service’s database goes down or needs maintenance, other services remain unaffected. It helps enforce clear service boundaries and encapsulates data management within the service.
Challenges and Considerations
- Data Consistency: Since data is distributed, maintaining consistency across services requires careful design. Transactions spanning multiple services are discouraged.
- Data Duplication: Some data may be duplicated across services, which can lead to synchronization challenges.
- Cross-Service Queries: Queries that join data across services become complex, often requiring API calls or event-driven data replication.
Example Scenario
Imagine an e-commerce platform with two microservices: Order Service and Inventory Service.
- The
Order Servicehas its own relational database to store orders. - The
Inventory Serviceuses a NoSQL database optimized for fast reads and writes of stock levels.
When a customer places an order, the Order Service records the order. To update inventory, it calls the Inventory Service API rather than directly accessing its database. This keeps each service’s data private and consistent within its boundary.
Mind Map: Database per Service Pattern
Handling Data Consistency
Since distributed transactions are generally avoided, microservices often rely on eventual consistency. One common approach is the Saga pattern, which breaks a transaction into a series of local transactions coordinated via events or commands.
For example, when an order is placed:
Order Servicecreates an order record.- It publishes an event
OrderCreated. Inventory Servicelistens forOrderCreatedand updates stock.- If inventory update fails, compensating actions are triggered to rollback or adjust the order.
This approach keeps services decoupled but requires careful error handling.
Example: Simple Saga Implementation (Pseudocode)
// Order Service
createOrder(order) {
  saveOrderToDB(order)
  publishEvent('OrderCreated', order.id)
}

// Inventory Service
onEvent('OrderCreated', orderId) {
  if (reduceStock(orderId)) {
    publishEvent('InventoryUpdated', orderId)
  } else {
    publishEvent('InventoryUpdateFailed', orderId)
  }
}
Data Duplication and Querying
Sometimes, services duplicate data to reduce cross-service calls. For instance, the Order Service might keep a cached copy of product names from the Product Service. This duplication requires synchronization mechanisms, often implemented via event-driven updates.
Cross-service queries are discouraged because they break service boundaries and increase coupling. Instead, data aggregation happens at the API gateway or through dedicated aggregator services that call multiple services and combine results.
Mind Map: Data Consistency and Communication
Summary
The Database per Service pattern is a cornerstone of microservices data management. It supports service independence and scalability but introduces complexity in consistency and querying. Using event-driven communication, sagas, and careful data duplication strategies helps maintain system integrity without sacrificing autonomy.
This pattern encourages thinking about data as part of the service’s internal state rather than a shared resource, which aligns well with microservices’ goal of decentralized ownership and deployment.
2.4 Handling Configuration and Secrets Securely in Kubernetes
In Kubernetes, managing configuration and secrets is a fundamental task that directly impacts the security and flexibility of your microservices. Configuration refers to non-sensitive data like URLs, feature flags, or environment variables, while secrets involve sensitive information such as passwords, API keys, or certificates. Treating these two categories differently is crucial.
Configuration Management with ConfigMaps
Kubernetes provides ConfigMaps to store configuration data separately from container images. This separation allows you to update configuration without rebuilding images or redeploying applications.
Example: Suppose you have a microservice that connects to a database. Instead of hardcoding the database URL, you create a ConfigMap:
apiVersion: v1
kind: ConfigMap
metadata:
  name: db-config
data:
  DATABASE_URL: "postgresql://db.example.com:5432/mydb"
Your Pod spec then references this ConfigMap:
env:
- name: DATABASE_URL
  valueFrom:
    configMapKeyRef:
      name: db-config
      key: DATABASE_URL
This approach keeps your configuration outside the container and allows easy updates by modifying the ConfigMap.
Secrets Management with Kubernetes Secrets
Secrets are similar to ConfigMaps but designed for sensitive data. Kubernetes stores Secrets base64-encoded, which is not encryption but obfuscation. Therefore, additional security measures are necessary.
Example: To store a database password:
apiVersion: v1
kind: Secret
metadata:
  name: db-secret
type: Opaque
data:
  DB_PASSWORD: c2VjdXJlUGFzc3dvcmQ=  # base64 encoded 'securePassword'
Your Pod spec references the secret like this:
env:
- name: DB_PASSWORD
  valueFrom:
    secretKeyRef:
      name: db-secret
      key: DB_PASSWORD
Mind Map: Configuration vs Secrets
Best Practices for Secure Handling
-
Use RBAC to restrict access: Limit who can view or modify ConfigMaps and Secrets using Kubernetes Role-Based Access Control.
-
Enable encryption at rest: Kubernetes supports encrypting Secrets in etcd. This prevents plain-text storage.
-
Avoid embedding secrets in images: Never bake secrets directly into container images.
-
Use environment variables or mounted volumes: Inject secrets into containers either as environment variables or mounted files, depending on your application’s needs.
-
Rotate secrets regularly: Change passwords and keys periodically and update Kubernetes Secrets accordingly.
-
Audit access: Monitor who accesses or modifies secrets and configurations.
Injecting Secrets as Files vs Environment Variables
Sometimes, applications expect secrets as files rather than environment variables. Kubernetes lets you mount Secrets as files inside containers.
Example: Mounting a TLS certificate secret:
volumes:
- name: tls-cert
  secret:
    secretName: tls-secret
containers:
- name: my-app
  volumeMounts:
  - name: tls-cert
    mountPath: "/etc/tls"
    readOnly: true
This method can be more secure since environment variables may be exposed in process listings.
Mind Map: Secret Injection Methods
Automating Secret Management
Manual secret management can lead to errors. Tools like Kubernetes Operators or external secret managers can automate secret creation and rotation. However, even with automation, the principles of least privilege and encryption remain essential.
Summary
Handling configuration and secrets securely in Kubernetes requires understanding the differences between ConfigMaps and Secrets, using the right injection methods, and applying strict access controls. Proper management reduces risk and keeps your microservices flexible and secure.
2.5 Implementing Service Discovery and Load Balancing with Kubernetes Services
Service discovery and load balancing are fundamental to microservices communication. Kubernetes provides built-in mechanisms to handle these concerns, simplifying how services locate each other and distribute traffic.
What is Service Discovery in Kubernetes?
Service discovery is the process by which a microservice finds the network location of another service it needs to communicate with. In Kubernetes, this is mostly automated through its Service abstraction.
Kubernetes Service Types Relevant to Discovery and Load Balancing
- ClusterIP: Default type, exposes the service on a cluster-internal IP. Useful for internal communication.
- NodePort: Exposes the service on each Node’s IP at a static port. Useful for external access.
- LoadBalancer: Provisions an external load balancer (cloud provider dependent).
- ExternalName: Maps the service to a DNS name.
For microservices talking inside the cluster, ClusterIP is the most common choice.
How Kubernetes Service Enables Service Discovery
Kubernetes assigns a stable DNS name and a virtual IP (ClusterIP) to each Service. Pods can reach the service by this DNS name, and Kubernetes routes the traffic to one of the healthy pods backing that service.
Load Balancing in Kubernetes
Kubernetes uses kube-proxy to handle load balancing at the network level. It distributes requests across pods selected by the Service’s label selector.
Mind Map: Service Discovery and Load Balancing in Kubernetes
Example: Creating a Service for a Microservice
Suppose you have a microservice called orders running in pods labeled app=orders. Here’s a simple YAML for a ClusterIP Service:
apiVersion: v1
kind: Service
metadata:
  name: orders-service
spec:
  selector:
    app: orders
  ports:
    - protocol: TCP
      port: 80
      targetPort: 8080
  type: ClusterIP
This Service exposes port 80 inside the cluster and forwards traffic to port 8080 on the pods.
Accessing the Service
Other pods can reach this service using the DNS name orders-service (or orders-service.namespace.svc.cluster.local for full qualification). Kubernetes DNS resolves this to the ClusterIP.
Load Balancing Behavior
When multiple orders pods are running, kube-proxy distributes incoming requests across them. The default mode is iptables or ipvs depending on the cluster setup, both providing efficient load balancing.
Mind Map: Example Workflow
Practical Considerations
- Health Checks: Kubernetes only routes traffic to pods that are ready and healthy. Ensure readiness probes are configured.
- Session Affinity: By default, load balancing is random. You can enable session affinity if sticky sessions are needed.
- Scaling: As pods scale up or down, the Service endpoints update automatically.
Example: Enabling Session Affinity
spec:
  sessionAffinity: ClientIP
This setting ensures requests from the same client IP go to the same pod.
Summary
Kubernetes Services provide a straightforward way to implement service discovery and load balancing without extra configuration. By defining a Service with appropriate selectors and ports, microservices can find and talk to each other reliably. kube-proxy handles distributing traffic across pods, ensuring balanced load and availability.
Understanding these basics is essential before adding complexity like service meshes or external load balancers.
3. Kubernetes Fundamentals for Microservices Deployment
3.1 Core Kubernetes Concepts: Pods, Deployments, and Services Explained
Kubernetes organizes and manages containerized applications using several fundamental building blocks. Among these, Pods, Deployments, and Services are the most essential. Understanding how they work and interact is key to managing applications effectively on Kubernetes.
Pods: The Smallest Deployable Unit
A Pod is the smallest unit that Kubernetes can create or manage. It represents one or more containers that share storage, network, and a specification for how to run them. Typically, a Pod contains a single container, but sometimes multiple containers run together to support tightly coupled functionality.
Key characteristics of Pods:
- Share the same IP address and port space.
- Share storage volumes.
- Scheduled together on the same node.
Example: Imagine a web server container paired with a helper container that updates content. Both run inside the same Pod, sharing the network and storage.
apiVersion: v1
kind: Pod
metadata:
  name: example-pod
spec:
  containers:
  - name: web-server
    image: nginx
  - name: content-updater
    image: busybox
    command: ['sh', '-c', 'while true; do echo updating; sleep 3600; done']
Deployments: Managing Pods at Scale
A Deployment manages a set of identical Pods and ensures the desired number of replicas are running. It handles rolling updates, rollbacks, and scaling.
Why use Deployments?
- Pods are ephemeral and can be replaced; Deployments maintain the desired state.
- Automate updates without downtime.
- Easily scale the number of Pods.
Example: Deploying three replicas of an NGINX server:
apiVersion: apps/v1
kind: Deployment
metadata:
  name: nginx-deployment
spec:
  replicas: 3
  selector:
    matchLabels:
      app: nginx
  template:
    metadata:
      labels:
        app: nginx
    spec:
      containers:
      - name: nginx
        image: nginx:1.21
        ports:
        - containerPort: 80
This Deployment ensures that three Pods with the NGINX container are always running. If one Pod crashes, Kubernetes creates a new one to replace it.
Services: Stable Network Endpoints
Pods are ephemeral and can be created or destroyed at any time, which means their IP addresses change. Services provide a stable IP address and DNS name to access a set of Pods.
Types of Services:
- ClusterIP (default): Exposes the Service on an internal IP in the cluster.
- NodePort: Exposes the Service on each Node’s IP at a static port.
- LoadBalancer: Exposes the Service externally using a cloud provider’s load balancer.
Example: Creating a ClusterIP Service to expose the NGINX Deployment:
apiVersion: v1
kind: Service
metadata:
  name: nginx-service
spec:
  selector:
    app: nginx
  ports:
  - protocol: TCP
    port: 80
    targetPort: 80
  type: ClusterIP
This Service routes traffic to any Pod with the label app: nginx, balancing the load among the three replicas.
Mind Map: Core Kubernetes Concepts
How They Work Together
- Pod: Runs one or more containers.
- Deployment: Creates and manages multiple Pods, ensuring the desired number is running.
- Service: Provides a stable endpoint to access the Pods managed by the Deployment.
This trio forms the backbone of running scalable, resilient applications on Kubernetes.
Practical Example: Deploying a Simple Web Application
- Create a Deployment with three replicas of a web server.
- Expose the Deployment with a Service.
- Access the web application using the Service’s IP or DNS.
This setup ensures that even if individual Pods fail, the Deployment replaces them, and the Service continues to route traffic seamlessly.
Understanding Pods, Deployments, and Services is the first step toward mastering Kubernetes. They provide the foundation for running containerized applications reliably and at scale.
3.2 Managing Microservice Lifecycle with Kubernetes Controllers
Managing Microservice Lifecycle with Kubernetes Controllers
Kubernetes controllers are the workhorses that keep your microservices running smoothly. They continuously monitor the state of your cluster and make adjustments to ensure the actual state matches the desired state you declare. Understanding how these controllers operate is key to managing the lifecycle of your microservices effectively.
What Are Kubernetes Controllers?
At their core, controllers are control loops. They watch the cluster’s shared state through the Kubernetes API server and make or request changes where needed. This process is ongoing, ensuring your services stay healthy and available.
Key Kubernetes Controllers for Microservices
- Deployment Controller: Manages stateless applications by creating and updating ReplicaSets, which in turn manage Pods.
- StatefulSet Controller: Manages stateful applications, ensuring stable network IDs and persistent storage.
- DaemonSet Controller: Ensures a copy of a Pod runs on all or some nodes.
- Job and CronJob Controllers: Manage batch and scheduled tasks.
Mind Map: Kubernetes Controllers Overview
Managing Microservice Lifecycle with Deployments
Deployments are the most common controller for microservices. They let you declare the desired state for your Pods and ReplicaSets. Kubernetes takes care of creating, updating, and rolling back Pods as needed.
Example:
apiVersion: apps/v1
kind: Deployment
metadata:
  name: my-microservice
spec:
  replicas: 3
  selector:
    matchLabels:
      app: my-microservice
  template:
    metadata:
      labels:
        app: my-microservice
    spec:
      containers:
      - name: my-microservice-container
        image: myrepo/microservice:v1
        ports:
        - containerPort: 8080
This YAML defines a Deployment that maintains three replicas of a microservice. If a Pod crashes, the Deployment controller notices and creates a new one to maintain the replica count.
Rolling Updates and Rollbacks
Deployments support rolling updates, which means you can update your microservice without downtime. Kubernetes gradually replaces old Pods with new ones.
Example: To update the image version:
kubectl set image deployment/my-microservice my-microservice-container=myrepo/microservice:v2
If something goes wrong, you can roll back:
kubectl rollout undo deployment/my-microservice
Mind Map: Deployment Lifecycle
StatefulSet for Stateful Microservices
Some microservices require stable network identities or persistent storage, like databases or caches. StatefulSets manage these requirements.
Example:
apiVersion: apps/v1
kind: StatefulSet
metadata:
  name: my-stateful-microservice
spec:
  serviceName: "my-service"
  replicas: 3
  selector:
    matchLabels:
      app: my-stateful-microservice
  template:
    metadata:
      labels:
        app: my-stateful-microservice
    spec:
      containers:
      - name: my-container
        image: myrepo/stateful-microservice:v1
        ports:
        - containerPort: 8080
  volumeClaimTemplates:
  - metadata:
      name: data
    spec:
      accessModes: ["ReadWriteOnce"]
      resources:
        requests:
          storage: 1Gi
StatefulSets guarantee that each Pod gets a unique, stable hostname and persistent volume, which is crucial for stateful workloads.
DaemonSets for Node-Level Microservices
DaemonSets ensure that a copy of a Pod runs on every node (or a subset). This is useful for logging agents, monitoring, or network proxies.
Example:
apiVersion: apps/v1
kind: DaemonSet
metadata:
  name: log-agent
spec:
  selector:
    matchLabels:
      name: log-agent
  template:
    metadata:
      labels:
        name: log-agent
    spec:
      containers:
      - name: log-agent
        image: myrepo/log-agent:v1
Jobs and CronJobs for Batch and Scheduled Tasks
Jobs run Pods to completion, useful for batch processing. CronJobs schedule Jobs periodically.
Example Job:
apiVersion: batch/v1
kind: Job
metadata:
  name: batch-job
spec:
  template:
    spec:
      containers:
      - name: batch-task
        image: myrepo/batch-task:v1
      restartPolicy: Never
  backoffLimit: 4
Mind Map: Controller Types and Use Cases
Summary
Kubernetes controllers automate the lifecycle management of your microservices. Deployments handle stateless services with rolling updates and scaling. StatefulSets manage stateful services with stable identities and storage. DaemonSets run node-level agents, and Jobs/CronJobs manage batch and scheduled tasks. Understanding these controllers lets you declare your desired state and trust Kubernetes to keep your microservices running as expected.
3.3 Namespace and Resource Quotas for Multi-Tenant Microservices
In Kubernetes, namespaces provide a way to divide cluster resources between multiple users or teams. When running microservices for different tenants or teams on the same cluster, namespaces act as virtual clusters, isolating resources and access. This isolation helps prevent conflicts and makes management easier.
Resource quotas complement namespaces by limiting the amount of compute resources a namespace can consume. This prevents a single tenant or microservice from exhausting cluster resources, which is crucial in multi-tenant environments.
Why Use Namespaces?
- Isolation: Keep microservices and their resources separate.
- Access Control: Apply Role-Based Access Control (RBAC) per namespace.
- Resource Management: Apply quotas and limits per namespace.
Why Use Resource Quotas?
- Prevent Resource Starvation: Avoid one tenant consuming all CPU or memory.
- Cost Control: Limit resource usage to control expenses.
- Predictability: Ensure fair resource distribution.
Mind Map: Namespace and Resource Quotas
Creating a Namespace
Here’s a simple YAML example to create a namespace called tenant-a:
apiVersion: v1
kind: Namespace
metadata:
  name: tenant-a
Apply it with:
kubectl apply -f tenant-a-namespace.yaml
This namespace will now serve as a boundary for tenant A’s microservices.
Defining Resource Quotas
Resource quotas are defined in YAML and applied to a namespace. Below is an example that limits CPU, memory, and the number of pods for the tenant-a namespace:
apiVersion: v1
kind: ResourceQuota
metadata:
  name: tenant-a-quota
  namespace: tenant-a
spec:
  hard:
    pods: "10"
    requests.cpu: "4"
    requests.memory: 8Gi
    limits.cpu: "8"
    limits.memory: 16Gi
- pods: Maximum number of pods allowed.
- requests.cpu/memory: Total CPU and memory requested by pods.
- limits.cpu/memory: Maximum CPU and memory limits allowed.
Apply it with:
kubectl apply -f tenant-a-quota.yaml
Example Scenario
Imagine you have two tenants, tenant-a and tenant-b, sharing a Kubernetes cluster. Without namespaces and quotas, tenant A could accidentally deploy a resource-heavy service that consumes all CPU and memory, starving tenant B.
By creating separate namespaces and applying resource quotas, you ensure tenant A can only use up to 8 CPUs and 16Gi memory, and tenant B has its own limits. This setup keeps the cluster stable and predictable.
Mind Map: Resource Quota Types
Monitoring Quota Usage
You can check quota usage with:
kubectl get resourcequota -n tenant-a
Or for detailed info:
kubectl describe resourcequota tenant-a-quota -n tenant-a
This shows how much of the quota is used and how much remains.
Best Practices
- Define namespaces per team or tenant: This keeps resources and permissions clean.
- Set resource quotas early: Avoid surprises by limiting resource usage from the start.
- Use limit ranges alongside quotas: Limit ranges set default requests and limits for containers, ensuring pods don’t exceed quotas unintentionally.
- Monitor quotas regularly: Keep an eye on usage to adjust quotas as needed.
Example: LimitRange to Complement ResourceQuota
apiVersion: v1
kind: LimitRange
metadata:
  name: tenant-a-limits
  namespace: tenant-a
spec:
  limits:
  - default:
      cpu: 500m
      memory: 512Mi
    defaultRequest:
      cpu: 250m
      memory: 256Mi
    type: Container
This ensures that if a pod doesn’t specify resource requests or limits, Kubernetes applies these defaults, helping keep usage within the quota.
Namespaces and resource quotas are foundational for managing multi-tenant microservices in Kubernetes. They provide clear boundaries, prevent resource contention, and help maintain cluster stability. Using them thoughtfully ensures your microservices coexist peacefully, even when sharing the same cluster.
3.4 ConfigMaps and Secrets: Managing Configuration in Kubernetes
In Kubernetes, managing configuration separately from application code is a foundational practice. This separation allows you to update configuration without rebuilding container images or redeploying applications unnecessarily. Kubernetes provides two primary resources for this purpose: ConfigMaps and Secrets.
What Are ConfigMaps?
ConfigMaps store non-sensitive configuration data as key-value pairs. They are designed for settings like URLs, feature flags, or environment-specific variables.
Example:
apiVersion: v1
kind: ConfigMap
metadata:
  name: app-config
data:
  LOG_LEVEL: "debug"
  FEATURE_X_ENABLED: "true"
  API_ENDPOINT: "https://api.example.com"
You can mount this ConfigMap as environment variables or as files inside a pod.
What Are Secrets?
Secrets hold sensitive data such as passwords, tokens, or keys. Unlike ConfigMaps, Secrets are base64-encoded and intended to be handled more cautiously.
Example:
apiVersion: v1
kind: Secret
metadata:
  name: db-credentials
type: Opaque
data:
  username: YWRtaW4=  # base64 for 'admin'
  password: MWYyZDFlMmU2N2Rm  # base64 for '1f2d1e2e67df'
Secrets can be consumed similarly to ConfigMaps but should never be exposed in logs or error messages.
Mind Map: ConfigMaps vs Secrets
Using ConfigMaps in Pods
You can inject ConfigMaps as environment variables:
apiVersion: v1
kind: Pod
metadata:
  name: configmap-demo
spec:
  containers:
  - name: app
    image: busybox
    envFrom:
    - configMapRef:
        name: app-config
    command: ["sh", "-c", "echo $LOG_LEVEL && sleep 3600"]
Or mount them as files:
volumes:
- name: config-volume
  configMap:
    name: app-config
containers:
- name: app
  image: busybox
  volumeMounts:
  - name: config-volume
    mountPath: /etc/config
Files like /etc/config/LOG_LEVEL will contain the corresponding values.
Using Secrets in Pods
Injecting Secrets as environment variables:
env:
- name: DB_USERNAME
  valueFrom:
    secretKeyRef:
      name: db-credentials
      key: username
- name: DB_PASSWORD
  valueFrom:
    secretKeyRef:
      name: db-credentials
      key: password
Or mounting as files:
volumes:
- name: secret-volume
  secret:
    secretName: db-credentials
containers:
- name: app
  image: busybox
  volumeMounts:
  - name: secret-volume
    mountPath: /etc/secret
Files like /etc/secret/username will contain the decoded secret values.
Best Practices
- Keep Secrets out of ConfigMaps: Never store sensitive data in ConfigMaps since they are not encrypted by default.
- Use RBAC to limit access: Control who can view or modify ConfigMaps and Secrets.
- Avoid exposing Secrets in logs: Be cautious with environment variables and command outputs.
- Use immutable ConfigMaps and Secrets: Mark them immutable to prevent accidental changes.
- Version your ConfigMaps and Secrets: Use labels or naming conventions to track changes.
Mind Map: Best Practices for ConfigMaps and Secrets
Updating Configurations
When you update a ConfigMap or Secret, pods using them do not automatically reload the changes. You can:
- Restart pods manually or via rolling updates.
- Use tools or sidecars that watch for changes and reload configuration.
Example of a rolling update with a Deployment:
kubectl rollout restart deployment/my-app
Summary
ConfigMaps and Secrets are Kubernetes-native ways to manage configuration and sensitive data separately from application code. ConfigMaps handle non-sensitive settings, while Secrets are for sensitive information. Both can be injected into pods as environment variables or mounted as files. Following best practices around access control, immutability, and versioning helps maintain secure and manageable configurations in your cloud native microservices.
3.5 Hands-On: Deploying a Multi-Service Application on Kubernetes
Deploying a multi-service application on Kubernetes involves several steps: defining your services, containerizing them, creating Kubernetes manifests, and applying those manifests to your cluster. This section walks through a practical example of deploying a simple multi-service app composed of a frontend, a backend API, and a database.
Application Overview
Our example app consists of three components:
- Frontend: A simple web UI built with Node.js that calls the backend API.
- Backend API: A RESTful service written in Python Flask that handles business logic.
- Database: A PostgreSQL instance storing persistent data.
Each component runs in its own container and communicates internally within the Kubernetes cluster.
Mind Map: Multi-Service Deployment Workflow
Step 1: Containerizing the Services
Each service requires a Dockerfile. Here’s a brief example for the backend:
# Backend Dockerfile
FROM python:3.9-slim
WORKDIR /app
COPY requirements.txt ./
RUN pip install -r requirements.txt
COPY . .
CMD ["python", "app.py"]
Similarly, the frontend and database use their respective Docker images. For PostgreSQL, we use the official image.
Step 2: Writing Kubernetes Manifests
We need Deployment and Service manifests for each component.
Backend Deployment (backend-deployment.yaml):
apiVersion: apps/v1
kind: Deployment
metadata:
  name: backend
spec:
  replicas: 2
  selector:
    matchLabels:
      app: backend
  template:
    metadata:
      labels:
        app: backend
    spec:
      containers:
      - name: backend
        image: yourrepo/backend:latest
        ports:
        - containerPort: 5000
        env:
        - name: DATABASE_URL
          valueFrom:
            secretKeyRef:
              name: db-secret
              key: database_url
Backend Service (backend-service.yaml):
apiVersion: v1
kind: Service
metadata:
  name: backend
spec:
  selector:
    app: backend
  ports:
  - protocol: TCP
    port: 80
    targetPort: 5000
  type: ClusterIP
The frontend and database have similar manifests. The database requires a PersistentVolumeClaim for data persistence.
Step 3: Configuring Persistent Storage for PostgreSQL
apiVersion: v1
kind: PersistentVolumeClaim
metadata:
  name: postgres-pvc
spec:
  accessModes:
    - ReadWriteOnce
  resources:
    requests:
      storage: 10Gi
Attach this PVC to the PostgreSQL Deployment to ensure data survives pod restarts.
Step 4: Deploying to Kubernetes
Apply manifests in the correct order:
kubectl apply -f postgres-pvc.yaml
kubectl apply -f db-secret.yaml
kubectl apply -f database-deployment.yaml
kubectl apply -f backend-deployment.yaml
kubectl apply -f backend-service.yaml
kubectl apply -f frontend-deployment.yaml
kubectl apply -f frontend-service.yaml
Step 5: Verifying Deployment
Check pods and services:
kubectl get pods
kubectl get svc
Pods should be in Running state, and services should have ClusterIP addresses.
Mind Map: Troubleshooting Deployment Issues
Step 6: Accessing the Application
For local testing, use port forwarding:
kubectl port-forward svc/frontend 8080:80
Then open http://localhost:8080 in a browser. The frontend should communicate with the backend, which in turn queries the database.
Summary
This example demonstrates how to deploy a multi-service application on Kubernetes by containerizing components, defining Kubernetes manifests, managing persistent storage, and verifying the deployment. The same principles apply to more complex applications, with additional considerations for scaling, security, and observability.
4. Introduction to Service Mesh in Kubernetes
4.1 What is a Service Mesh? Core Concepts and Architecture
A service mesh is a dedicated infrastructure layer that manages service-to-service communication within a microservices architecture. It handles the network functions that applications need to communicate reliably, securely, and observably, without requiring those functions to be built into the application code itself.
At its core, a service mesh decouples the communication logic from business logic. This separation allows developers to focus on their services while the mesh manages how those services talk to each other.
Core Concepts of a Service Mesh
-
Data Plane: This is where the actual network traffic flows between services. It consists of lightweight proxies (often called sidecars) deployed alongside each service instance. These proxies intercept and manage all inbound and outbound traffic.
-
Control Plane: This component configures and manages the proxies in the data plane. It provides policies, routing rules, security settings, and collects telemetry data.
-
Sidecar Proxy: A small network proxy injected into the same pod or host as the service. It handles communication tasks such as load balancing, retries, and encryption.
-
Service Discovery: The mesh keeps track of all service instances and their locations, enabling dynamic routing.
-
Traffic Management: It controls how requests flow between services, supporting features like routing, retries, failovers, and circuit breaking.
-
Security: The mesh can enforce mutual TLS (mTLS) for encrypted and authenticated communication between services.
-
Observability: It collects metrics, logs, and traces to provide insight into service behavior and performance.
Architecture Mind Map
Example: How a Service Mesh Works in Practice
Imagine you have two microservices: Order Service and Inventory Service. Without a service mesh, the Order Service needs to handle retries, load balancing, and security when calling Inventory Service. This means extra code and complexity.
With a service mesh:
- Each service runs with a sidecar proxy.
- When Order Service calls Inventory Service, the request first goes through its sidecar proxy.
- The proxy applies routing rules, retries on failure, and encrypts the traffic using mTLS.
- The Inventory Service’s sidecar proxy receives the request, decrypts it, and forwards it to the service.
- Telemetry about this call is collected automatically.
This setup means the Order Service code remains simple and focused on business logic, while the mesh handles communication concerns.
Mind Map: Request Flow Example
In summary, a service mesh provides a transparent and consistent way to manage how microservices communicate. It centralizes network-related concerns, making microservices easier to develop, secure, and monitor.
4.2 Comparing Popular Service Meshes: Istio, Linkerd, and Consul
When choosing a service mesh for Kubernetes microservices, Istio, Linkerd, and Consul are often the top contenders. Each has its own approach, strengths, and trade-offs. Understanding their differences helps in selecting the right tool for your environment.
Mind Map: Service Mesh Comparison Overview
Istio
Istio is a feature-rich service mesh that uses Envoy as its sidecar proxy. It provides advanced traffic management capabilities like fine-grained routing, retries, circuit breaking, and fault injection. Istio also includes robust security features such as mutual TLS (mTLS) and policy enforcement.
Example: Suppose you want to route 10% of traffic to a new version of a microservice for canary testing. Istio’s VirtualService resource lets you specify this routing rule declaratively:
apiVersion: networking.istio.io/v1alpha3
kind: VirtualService
metadata:
  name: myservice
spec:
  hosts:
  - myservice.default.svc.cluster.local
  http:
  - route:
    - destination:
        host: myservice
        subset: v1
      weight: 90
    - destination:
        host: myservice
        subset: v2
      weight: 10
Istio’s control plane includes components like Pilot (for configuration), Mixer (for policy and telemetry), and Citadel (for security). This modularity adds power but also complexity.
Best practice: Use Istio when you need granular traffic control and strong security policies, but be prepared for a steeper learning curve and resource overhead.
Linkerd
Linkerd focuses on simplicity and performance. It uses lightweight proxies written in Rust, which tend to consume fewer resources than Envoy. Linkerd’s feature set covers core service mesh capabilities: mTLS, load balancing, retries, and observability.
Example: To enable automatic mTLS between services, Linkerd requires minimal configuration. Once installed, it transparently encrypts traffic without manual certificate management.
# Install Linkerd CLI
curl -sL https://run.linkerd.io/install | sh

# Validate cluster
linkerd check --pre

# Inject Linkerd proxy into deployment
kubectl get deploy -o yaml | linkerd inject - | kubectl apply -f -
Linkerd’s dashboard provides real-time metrics and success rates, making it easier to monitor service health.
Best practice: Choose Linkerd if you want a lightweight, easy-to-operate mesh that covers most use cases without the overhead of complex configurations.
Consul
Consul started as a service discovery tool and evolved to include service mesh capabilities. It integrates with Envoy proxies to provide traffic management, security, and observability.
One of Consul’s strengths is multi-platform support, including hybrid and multi-cloud environments. It can manage services outside Kubernetes, which is useful if your architecture spans VMs and containers.
Example: To enable service mesh on Kubernetes with Consul, you register services with Consul and configure intentions (Consul’s term for access control policies) to control communication.
# Register a service
consul services register -name=myservice -address=10.0.0.1 -port=8080

# Define an intention to allow service A to talk to service B
consul intention create serviceA serviceB allow
Consul also supports DNS and HTTP-based service discovery, which can simplify integration with legacy systems.
Best practice: Use Consul when you need a service mesh that works beyond Kubernetes or when you require integrated service discovery across diverse environments.
Feature Comparison Table
| Feature | Istio | Linkerd | Consul |
|---|---|---|---|
| Proxy | Envoy | Lightweight Rust proxy | Envoy |
| Complexity | High | Low to Medium | Medium |
| Traffic Management | Advanced (routing, retries) | Basic to moderate | Moderate |
| Security (mTLS) | Yes, configurable | Yes, automatic | Yes, with intentions |
| Observability | Extensive (metrics, tracing) | Good (metrics, dashboard) | Good (metrics, tracing) |
| Multi-Platform Support | Kubernetes-focused | Kubernetes-focused | Kubernetes + VMs + Cloud |
| Installation | Complex, multiple components | Simple, single CLI | Moderate, requires Consul server |
Summary
- Istio is best when you need a full-featured mesh with detailed control and policy enforcement.
- Linkerd suits teams wanting simplicity, performance, and straightforward security.
- Consul fits hybrid or multi-cloud setups that require unified service discovery and mesh.
Choosing the right service mesh depends on your environment, operational preferences, and feature needs. Testing each in a small-scale environment can clarify which aligns best with your requirements.
4.3 Installing and Configuring Istio on Kubernetes: Step-by-Step Guide
Istio is a popular service mesh that adds capabilities like traffic management, security, and observability to Kubernetes microservices. This section walks through installing Istio on a Kubernetes cluster and configuring it for basic use.
Step 1: Prepare Your Kubernetes Cluster
Before installing Istio, ensure you have a Kubernetes cluster running (version 1.19 or later is recommended). You also need kubectl configured to communicate with your cluster.
-
Verify cluster access:
kubectl cluster-info -
Confirm Kubernetes version:
kubectl version --short
Step 2: Download Istio
Istio releases come with an installation CLI called istioctl. Download the latest stable version suitable for your OS.
-
Example for Linux:
curl -L https://istio.io/downloadIstio | sh - cd istio-<version> export PATH=$PWD/bin:$PATH -
Confirm
istioctlis accessible:istioctl version
Step 3: Install Istio Base Components
Istio consists of several components: base, control plane, and optionally addons. The base includes Custom Resource Definitions (CRDs) and core resources.
- Install base:
istioctl install --set profile=default -y
This command installs the default profile, which includes the control plane components like Pilot, Mixer, and Citadel.
Step 4: Enable Automatic Sidecar Injection
Istio uses a sidecar proxy (Envoy) injected into each pod to intercept traffic. Automatic injection simplifies this process.
-
Label the namespace where your microservices run (e.g.,
default):kubectl label namespace default istio-injection=enabled -
Verify the label:
kubectl get namespace -L istio-injection
Step 5: Deploy a Sample Application
To see Istio in action, deploy a simple microservices app like Bookinfo.
-
Deploy Bookinfo:
kubectl apply -f samples/bookinfo/platform/kube/bookinfo.yaml -
Confirm pods are running:
kubectl get pods -
Check that Envoy sidecars are injected (each pod should have 2 containers):
kubectl get pods -o jsonpath='{range .items[*]}{.metadata.name}: {.spec.containers[*].name}\n'{end}
Step 6: Expose the Application
Istio uses a Gateway resource to expose services outside the cluster.
-
Apply the Gateway and VirtualService:
kubectl apply -f samples/bookinfo/networking/bookinfo-gateway.yaml -
Confirm Gateway is created:
kubectl get gateway -
Get the ingress IP and port:
kubectl get svc istio-ingressgateway -n istio-system -
Access the app via the ingress IP and port.
Step 7: Verify Istio Installation
Check the status of Istio components:
-
List pods in
istio-systemnamespace:kubectl get pods -n istio-system -
Confirm all pods are running and ready.
-
Check Istio control plane version:
istioctl version
Mind Map: Istio Installation Workflow
Example: Enabling Sidecar Injection and Deploying a Microservice
- Label the namespace:
kubectl label namespace default istio-injection=enabled
- Deploy a simple microservice (e.g., httpbin):
kubectl apply -f samples/httpbin/httpbin.yaml
- Confirm the pod has two containers (app + Envoy sidecar):
kubectl get pods -l app=httpbin -o jsonpath='{.items[0].spec.containers[*].name}'
Expected output:
httpbin istio-proxy
This confirms the sidecar proxy is injected automatically.
Configuration Tips
- Use
istioctl analyzeto detect common misconfigurations:
istioctl analyze
- To customize installation, create a YAML profile and apply with:
istioctl install -f custom-profile.yaml
- For production, consider enabling strict mTLS and fine-tuning resource limits.
This step-by-step guide covers the essentials to get Istio running on your Kubernetes cluster and ready to manage microservices traffic. The next steps involve exploring traffic routing, security policies, and observability features that Istio offers.
4.4 Sidecar Proxy Pattern Explained with Practical Deployment Examples
The sidecar proxy pattern is a fundamental concept in service mesh architectures, especially within Kubernetes environments. It involves deploying a helper container, called a sidecar, alongside the main application container within the same pod. This sidecar acts as a proxy, intercepting and managing network traffic to and from the application container.
Why Use a Sidecar Proxy?
- Separation of Concerns: The application focuses on business logic, while the sidecar handles networking, security, and observability.
- Uniformity: Sidecars provide consistent capabilities across services without modifying application code.
- Extensibility: New features like retries, circuit breaking, and telemetry can be added transparently.
How the Sidecar Proxy Works
The sidecar proxy runs as a separate container in the same pod, sharing the network namespace with the application. This setup means the proxy can intercept all inbound and outbound traffic without requiring changes to the application.
Traffic flow:
- Outbound requests from the application are routed through the sidecar proxy.
- Inbound requests from other services first hit the sidecar proxy, which then forwards them to the application container.
This interception enables advanced traffic management and security features.
Mind Map: Sidecar Proxy Pattern Overview
Practical Deployment Example: Using Envoy as a Sidecar Proxy
Envoy is a popular proxy used in many service meshes, including Istio. Here’s a simplified example of how a sidecar proxy is deployed alongside an application container in a Kubernetes pod.
apiVersion: v1
kind: Pod
metadata:
  name: myservice-pod
  labels:
    app: myservice
spec:
  containers:
  - name: myservice
    image: myservice:latest
    ports:
    - containerPort: 8080
  - name: envoy-sidecar
    image: envoyproxy/envoy:v1.18.3
    args:
    - -c
    - /etc/envoy/envoy.yaml
    ports:
    - containerPort: 15001
    volumeMounts:
    - name: envoy-config
      mountPath: /etc/envoy
  volumes:
  - name: envoy-config
    configMap:
      name: envoy-config
In this pod spec:
- The
myservicecontainer runs the application. - The
envoy-sidecarcontainer runs Envoy proxy. - Envoy uses a configuration file mounted from a ConfigMap.
Envoy intercepts traffic on the pod’s network namespace, managing inbound and outbound connections.
Mind Map: Envoy Sidecar Deployment
Example: Traffic Interception with iptables
To route traffic through the sidecar proxy, Kubernetes service meshes often use iptables rules. These rules redirect outbound traffic from the application container to the proxy’s port.
A simplified iptables rule might look like this:
iptables -t nat -A OUTPUT -p tcp --dport 80 -j REDIRECT --to-port 15001
This rule redirects all outbound TCP traffic destined for port 80 to port 15001, where Envoy listens.
Mind Map: Traffic Interception Mechanism
Sidecar Proxy Features Enabled by This Pattern
- mTLS Encryption: Automatic mutual TLS between services without app changes.
- Retries and Timeouts: Configurable retry policies for failed requests.
- Circuit Breaking: Prevent cascading failures by limiting request volume.
- Load Balancing: Client-side load balancing across service instances.
- Observability: Collect metrics, logs, and traces for monitoring.
Summary
The sidecar proxy pattern is a practical way to extend microservices with networking and security features without touching the application code. By deploying a proxy container alongside the app in the same pod, Kubernetes service meshes provide consistent traffic management, security, and observability. The pattern relies on shared network namespaces and traffic redirection techniques like iptables to intercept and control service communication.
Understanding this pattern is key to effectively using service meshes such as Istio or Linkerd in cloud native environments.
4.5 Service Mesh Use Cases: Traffic Management, Security, and Observability
Service meshes add a layer of control and insight between microservices, handling communication without requiring changes to the application code. They address three main areas: traffic management, security, and observability. Let’s break down each use case with examples and mind maps to clarify their roles.
Traffic Management
Traffic management in a service mesh means controlling how requests flow between services. This includes routing, load balancing, failure recovery, and deployment strategies like canary releases.
Key capabilities:
- Fine-grained request routing based on headers, weights, or other criteria
- Load balancing across service instances
- Traffic shifting for gradual rollouts
- Fault injection and retries
Example:
Suppose you have a payment service with two versions: v1 (stable) and v2 (new feature). Using Istio, you can route 90% of traffic to v1 and 10% to v2 to test the new version in production without impacting most users.
apiVersion: networking.istio.io/v1alpha3
kind: VirtualService
metadata:
  name: payment-service
spec:
  hosts:
  - payment-service
  http:
  - route:
    - destination:
        host: payment-service
        subset: v1
      weight: 90
    - destination:
        host: payment-service
        subset: v2
      weight: 10
Mind map:
Security
Service meshes secure communication between services by enforcing policies and encrypting traffic. They handle authentication, authorization, and encryption transparently.
Key capabilities:
- Mutual TLS (mTLS) for encrypted, authenticated service-to-service communication
- Role-based access control (RBAC) for fine-grained authorization
- Identity management through service identities rather than IP addresses
Example:
With Istio, enabling mTLS means all traffic between services is encrypted and verified. If a service tries to connect without proper credentials, the mesh denies the request.
apiVersion: "security.istio.io/v1beta1"
kind: "PeerAuthentication"
metadata:
  name: "default"
spec:
  mtls:
    mode: STRICT
This simple configuration enforces strict mTLS across the mesh.
Mind map:
Observability
Observability in a service mesh means collecting and analyzing data about service interactions to understand system behavior and troubleshoot issues.
Key capabilities:
- Metrics collection (e.g., request rates, latencies, error rates)
- Distributed tracing to follow requests across services
- Logging of service interactions
Example:
Istio automatically collects telemetry data without modifying application code. For instance, it can generate metrics on request duration and error rates, which you can visualize in Grafana.
A trace might show a request flowing from the frontend service to the user service, then to the database service, highlighting where delays occur.
Mind map:
Summary Mind Map
Service meshes provide a unified way to handle these concerns consistently across microservices. By offloading these responsibilities from the application code, teams can focus on business logic while gaining control and visibility over their distributed systems.
5. Traffic Management with Kubernetes Service Mesh
5.1 Load Balancing and Intelligent Routing with Service Mesh
Load balancing and routing are fundamental to managing traffic in microservices architectures. When microservices run on Kubernetes, a service mesh adds an extra layer of control and visibility over how requests flow between services. This section explains how service meshes handle load balancing and intelligent routing, with practical examples and mind maps to clarify the concepts.
What is Load Balancing in a Service Mesh?
Load balancing distributes incoming network traffic across multiple instances of a service to ensure no single instance is overwhelmed. Kubernetes provides basic load balancing through Services, but a service mesh enhances this by enabling more granular control, such as routing based on request attributes or service health.
Core Load Balancing Strategies in Service Mesh
- Round Robin: Requests are distributed evenly across all healthy instances.
- Least Connections: Traffic goes to the instance with the fewest active connections.
- Random: Requests are sent to random instances.
- Weighted Load Balancing: Traffic is distributed based on assigned weights to instances.
Intelligent Routing Explained
Intelligent routing means directing requests based on criteria beyond simple load distribution. A service mesh can route traffic based on:
- Request headers or cookies
- Source or destination service
- Version of the service (for canary releases)
- Geographic location
This capability enables use cases like A/B testing, gradual rollouts, and failure recovery.
Mind Map: Load Balancing and Intelligent Routing Concepts
Example: Configuring Load Balancing with Istio
Istio uses Envoy proxies as sidecars to manage traffic. Here’s a simple example of setting weighted load balancing between two versions of a service.
apiVersion: networking.istio.io/v1alpha3
kind: VirtualService
metadata:
  name: reviews
spec:
  hosts:
  - reviews
  http:
  - route:
    - destination:
        host: reviews
        subset: v1
      weight: 80
    - destination:
        host: reviews
        subset: v2
      weight: 20
This configuration sends 80% of traffic to version 1 and 20% to version 2 of the “reviews” service. It’s useful for gradual rollouts or canary deployments.
Weighted Routing Example
- VirtualService
- hosts: reviews
- http
- route
- destination: reviews v1
weight: 80% - destination: reviews v2
weight: 20%
- destination: reviews v1
- route
Example: Header-Based Routing
Routing based on headers allows directing traffic depending on request metadata. For instance, routing mobile users to a mobile-optimized service version.
apiVersion: networking.istio.io/v1alpha3
kind: VirtualService
metadata:
  name: productpage
spec:
  hosts:
  - productpage
  http:
  - match:
    - headers:
        user-agent:
          regex: ".*Mobile.*"
    route:
    - destination:
        host: productpage
        subset: mobile
  - route:
    - destination:
        host: productpage
        subset: desktop
Requests with a User-Agent header containing “Mobile” go to the mobile subset; others go to desktop.
Mind Map: Header-Based Routing
How Load Balancing and Intelligent Routing Work Together
A service mesh combines load balancing and routing rules to optimize traffic flow. For example, you can route 10% of mobile users to a new version of a service while distributing load evenly among instances in that version.
Practical Tips
- Define subsets in DestinationRule to group service versions or environments.
- Use VirtualService to specify routing rules.
- Monitor traffic distribution to verify routing behavior.
- Combine routing with circuit breakers and retries for resilience.
In summary, service meshes extend Kubernetes’ native load balancing by adding routing intelligence based on request context and service metadata. This flexibility supports complex deployment strategies and improves traffic management in microservices environments.
5.2 Implementing Canary Deployments and Blue-Green Deployments Using Istio
Canary and blue-green deployments are two popular strategies to release new versions of microservices with minimal risk. Istio, as a service mesh, provides powerful traffic management features that make these deployment patterns easier and safer to implement on Kubernetes.
Canary Deployments with Istio
A canary deployment gradually shifts a small portion of traffic to the new version of a service while the majority continues to use the stable version. This approach helps detect issues early without impacting all users.
Key Steps:
- Deploy the new version of the microservice alongside the stable version.
- Use Istio’s VirtualService to split traffic between versions.
- Monitor metrics and logs for the canary version.
- Gradually increase traffic to the new version if no issues arise.
- Roll back immediately if problems are detected.
Example:
Suppose you have a service called reviews with version v1 running. You want to deploy v2 as a canary.
-
Deploy
reviews:v2alongsidereviews:v1. -
Define a VirtualService to split traffic:
apiVersion: networking.istio.io/v1alpha3
kind: VirtualService
metadata:
  name: reviews
spec:
  hosts:
  - reviews
  http:
  - route:
    - destination:
        host: reviews
        subset: v1
      weight: 90
    - destination:
        host: reviews
        subset: v2
      weight: 10
- Define DestinationRules to identify subsets:
apiVersion: networking.istio.io/v1alpha3
kind: DestinationRule
metadata:
  name: reviews
spec:
  host: reviews
  subsets:
  - name: v1
    labels:
      version: v1
  - name: v2
    labels:
      version: v2
-
Monitor the canary version’s performance and errors.
-
Adjust weights to increase traffic to
v2gradually. -
Once confident, switch 100% traffic to
v2and deprecatev1.
Mind Map:
Blue-Green Deployments with Istio
Blue-green deployment runs two separate environments (blue and green). One environment serves all production traffic, while the other is idle or used for testing. Switching traffic between them happens instantly, minimizing downtime.
Key Steps:
- Deploy the new version (green) alongside the current version (blue).
- Use Istio VirtualService to route 100% traffic to the active environment.
- Test the green environment without impacting users.
- Switch all traffic to green when ready.
- Keep blue environment as a fallback.
Example:
Assume reviews service is currently running version v1 (blue). You deploy v2 (green).
-
Deploy
reviews:v2alongsidereviews:v1. -
Define subsets in DestinationRule:
apiVersion: networking.istio.io/v1alpha3
kind: DestinationRule
metadata:
  name: reviews
spec:
  host: reviews
  subsets:
  - name: blue
    labels:
      version: v1
  - name: green
    labels:
      version: v2
- Set VirtualService to route all traffic to blue initially:
apiVersion: networking.istio.io/v1alpha3
kind: VirtualService
metadata:
  name: reviews
spec:
  hosts:
  - reviews
  http:
  - route:
    - destination:
        host: reviews
        subset: blue
      weight: 100
    - destination:
        host: reviews
        subset: green
      weight: 0
-
Test the green environment internally.
-
Switch VirtualService weights to route 100% traffic to green:
http:
- route:
  - destination:
      host: reviews
      subset: blue
    weight: 0
  - destination:
      host: reviews
      subset: green
    weight: 100
- Keep blue environment ready for rollback.
Mind Map:
Traffic Routing Details
Istio’s VirtualService resource controls how requests are routed to different service versions. It supports weighted routing, header-based routing, and more.
Weighted Routing: Splits traffic by percentage.
Header-Based Routing: Routes traffic based on HTTP headers (useful for A/B testing).
For canary and blue-green, weighted routing is the primary mechanism.
Practical Tips
- Always monitor key metrics like error rates, latency, and resource usage during deployment.
- Automate traffic weight adjustments where possible to reduce human error.
- Use health checks and readiness probes to ensure new versions are ready before shifting traffic.
- Keep rollback plans simple and tested.
In summary, Istio simplifies canary and blue-green deployments by managing traffic routing at the service mesh layer. This removes the need for complex deployment scripts or manual DNS changes and provides fine-grained control over traffic flow, enabling safer and more controlled microservice releases.
5.3 Fault Injection and Resilience Testing: Practical Examples
Fault injection and resilience testing are essential practices for ensuring that microservices can handle failures gracefully. By deliberately introducing faults, you can observe how your system behaves under stress and identify weaknesses before they cause real problems.
What is Fault Injection?
Fault injection means intentionally causing errors or delays in your system to test its robustness. It helps verify that fallback mechanisms, retries, and circuit breakers work as expected.
Why Resilience Testing Matters
Microservices often depend on each other. A failure in one service can cascade if not properly contained. Resilience testing ensures that failures are isolated and recovery strategies are effective.
Mind Map: Fault Injection and Resilience Testing
Practical Examples Using Istio Service Mesh
Istio provides built-in fault injection capabilities that integrate well with Kubernetes microservices.
Example 1: Injecting Latency
This example adds a 5-second delay to all requests to a specific service, simulating slow responses.
apiVersion: networking.istio.io/v1alpha3
kind: VirtualService
metadata:
  name: reviews
spec:
  hosts:
  - reviews
  http:
  - fault:
      delay:
        fixedDelay: 5s
        percentage:
          value: 100
    route:
    - destination:
        host: reviews
        subset: v1
What this does: Every call to the reviews service will be delayed by 5 seconds. This tests how clients handle slow responses.
Example 2: Injecting HTTP Abort Errors
Here, 10% of requests to the ratings service will return HTTP 500 errors.
apiVersion: networking.istio.io/v1alpha3
kind: VirtualService
metadata:
  name: ratings
spec:
  hosts:
  - ratings
  http:
  - fault:
      abort:
        httpStatus: 500
        percentage:
          value: 10
    route:
    - destination:
        host: ratings
        subset: v1
Purpose: This simulates intermittent failures to verify that retry policies or fallback mechanisms activate correctly.
Mind Map: Resilience Patterns Tested by Fault Injection
Implementing Resilience in Microservices
Fault injection is only useful if your services have resilience mechanisms in place. Here are some patterns with examples:
Retry with Exponential Backoff
Retries can help recover from transient errors. Exponential backoff avoids overwhelming the service.
Example in code (pseudo-Go):
func callService() error {
  var err error
  backoff := time.Millisecond * 100
  for i := 0; i < 5; i++ {
    err = doRequest()
    if err == nil {
      return nil
    }
    time.Sleep(backoff)
    backoff *= 2
  }
  return err
}
Circuit Breaker
Prevents calls to a failing service to avoid cascading failures.
Example with Istio DestinationRule:
apiVersion: networking.istio.io/v1alpha3
kind: DestinationRule
metadata:
  name: ratings-cb
spec:
  host: ratings
  trafficPolicy:
    connectionPool:
      http:
        http1MaxPendingRequests: 1
    outlierDetection:
      consecutiveErrors: 5
      interval: 10s
      baseEjectionTime: 30s
      maxEjectionPercent: 50
This configuration ejects unhealthy instances after 5 consecutive errors.
Observing Effects of Fault Injection
When you inject faults, watch your monitoring dashboards closely:
- Metrics: Look for increased error rates, latency spikes, or circuit breaker state changes.
- Logs: Check for error messages or retry attempts.
- Traces: Follow request paths to see where delays or failures occur.
Example Scenario: Testing a Payment Microservice
Imagine a payment microservice that calls an external fraud detection service.
- Inject 20% HTTP 503 errors on the fraud detection service.
- Verify that the payment service retries with exponential backoff.
- Confirm that after repeated failures, the circuit breaker opens and payment requests fail fast.
- Observe how the user experience changes and whether fallback logic (e.g., manual review flag) triggers.
This test ensures the payment service handles external failures without blocking all transactions.
Summary
Fault injection and resilience testing help you understand how your microservices behave under failure conditions. Using tools like Istio, you can simulate delays and errors to verify retry, timeout, and circuit breaker logic. Observability is key to interpreting test results and improving system robustness.
5.4 Circuit Breaking and Retries Configuration in Service Mesh
Circuit breaking and retries are two key patterns that help maintain the stability and resilience of microservices in a Kubernetes environment, especially when using a service mesh like Istio. These mechanisms prevent cascading failures and improve user experience by handling transient errors gracefully.
What is Circuit Breaking?
Circuit breaking is a protective pattern that stops requests to a failing service before the failure causes widespread disruption. Think of it as an electrical circuit breaker that trips when the current is too high, preventing damage.
In a service mesh, circuit breaking monitors service health and automatically stops sending requests to an unhealthy instance or service, allowing it time to recover.
What are Retries?
Retries are attempts to resend a failed request, assuming the failure is temporary. They help mask transient network glitches or momentary service unavailability.
However, retries must be configured carefully to avoid overloading the system or causing longer delays.
Mind Map: Circuit Breaking and Retries in Service Mesh
Configuring Circuit Breaking and Retries in Istio
Istio uses DestinationRule resources to configure circuit breaking and retry policies for services.
Example: Circuit Breaking Configuration
apiVersion: networking.istio.io/v1beta1
kind: DestinationRule
metadata:
  name: reviews-circuit-breaker
spec:
  host: reviews
  trafficPolicy:
    connectionPool:
      tcp:
        maxConnections: 100
      http:
        http1MaxPendingRequests: 10
        maxRequestsPerConnection: 5
    outlierDetection:
      consecutiveErrors: 5
      interval: 10s
      baseEjectionTime: 30s
      maxEjectionPercent: 50
Explanation:
maxConnectionslimits simultaneous TCP connections.http1MaxPendingRequestscaps pending HTTP requests.maxRequestsPerConnectionlimits requests per connection.outlierDetectionejects unhealthy hosts after 5 consecutive errors, checks every 10 seconds, ejects for 30 seconds, and limits ejection to 50% of hosts.
This setup prevents overloading a service instance and removes failing instances temporarily.
Example: Retry Policy Configuration
apiVersion: networking.istio.io/v1beta1
kind: VirtualService
metadata:
  name: reviews-retry
spec:
  hosts:
  - reviews
  http:
  - route:
    - destination:
        host: reviews
    retries:
      attempts: 3
      perTryTimeout: 2s
      retryOn: gateway-error,connect-failure,refused-stream
Explanation:
- Retries up to 3 times per request.
- Each retry times out after 2 seconds.
- Retries triggered on gateway errors, connection failures, or refused streams.
Best Practices
- Set realistic thresholds: Too low thresholds can cause frequent circuit trips; too high can delay failure detection.
- Limit retries: Excessive retries can worsen congestion.
- Use backoff strategies: Although Istio’s native retry doesn’t support exponential backoff, consider client-side backoff or custom filters.
- Combine with timeouts: Retries should have per-try timeouts to avoid hanging.
- Monitor metrics: Track circuit breaker state changes and retry rates to tune policies.
Practical Scenario
Imagine a payment service that occasionally fails due to downstream database latency spikes. Without circuit breaking, all requests pile up, causing a domino effect.
By configuring a circuit breaker with an outlier detection that ejects the failing instance after 3 errors within 10 seconds, the mesh stops sending requests to the problematic pod, giving it time to recover.
Simultaneously, a retry policy with 2 attempts and a 1-second timeout helps mask transient network glitches.
This combination reduces error rates and improves overall system stability.
Summary
Circuit breaking and retries are complementary tools in a service mesh to improve microservice resilience. Circuit breakers prevent overload on failing services by temporarily halting traffic, while retries handle transient failures by reattempting requests. Configuring these features in Istio involves setting parameters in DestinationRule and VirtualService resources. Proper tuning and monitoring are essential to avoid unintended side effects.
5.5 Securing Service-to-Service Communication with mTLS
Mutual TLS (mTLS) is a security protocol that ensures both parties in a communication verify each other’s identity before exchanging data. In Kubernetes service meshes like Istio, mTLS is a cornerstone for securing service-to-service communication, preventing unauthorized access and eavesdropping.
Why mTLS?
In a microservices environment, services frequently communicate over the network. Without encryption and authentication, this communication is vulnerable to interception and impersonation. mTLS addresses these risks by:
- Encrypting data in transit.
- Authenticating both client and server services.
- Preventing man-in-the-middle attacks.
How mTLS Works in Kubernetes Service Mesh
When mTLS is enabled, each service’s sidecar proxy (e.g., Envoy in Istio) presents a certificate to the peer proxy. Both proxies verify these certificates against a trusted Certificate Authority (CA). Only if verification passes does communication proceed.
This process happens transparently to the application code, meaning developers don’t need to modify services to benefit from mTLS.
Mind Map: mTLS Communication Flow
Enabling mTLS in Istio: A Simple Example
- Enable Peer Authentication:
apiVersion: security.istio.io/v1beta1
kind: PeerAuthentication
metadata:
  name: default
  namespace: your-namespace
spec:
  mtls:
    mode: STRICT
This configuration enforces strict mTLS for all workloads in the namespace.
- Verify mTLS is Active:
Run:
istioctl authn tls-check <pod-name>.<namespace>
This command confirms which services have mTLS enabled and their connection status.
Mind Map: Steps to Enable mTLS
Example: Service-to-Service Call with mTLS
Imagine two microservices, orders and inventory, communicating:
orderssends a request toinventoryto check stock.- Both services have Envoy sidecars injected.
- With mTLS enabled, Envoy proxies exchange certificates before forwarding the request.
- If certificates are valid, the request proceeds encrypted.
This means even if someone intercepts the network traffic, they cannot read or tamper with the data.
Mind Map: Benefits of mTLS in Microservices
Best Practices for mTLS
- Start with permissive mode: Gradually enforce mTLS to avoid breaking existing services.
- Use namespace-scoped policies: Apply mTLS selectively to critical namespaces.
- Rotate certificates regularly: Automate certificate renewal to maintain security.
- Monitor mTLS status: Use tools like
istioctland service mesh dashboards.
Troubleshooting mTLS Issues
- Connection failures: Check if both services have sidecars injected and mTLS enabled.
- Certificate errors: Verify CA trust and certificate validity.
- Mixed modes: Ensure consistent mTLS modes across communicating services.
Summary
mTLS is a practical way to secure service-to-service communication in Kubernetes microservices. By leveraging the service mesh’s sidecar proxies, it provides encryption and authentication without burdening application code. Proper configuration and monitoring ensure that mTLS enhances security without disrupting service availability.
6. Security Best Practices in Cloud Native Microservices
6.1 Kubernetes Security Fundamentals: RBAC and Network Policies
Security in Kubernetes starts with controlling who can do what and controlling how workloads communicate. Two foundational mechanisms for this are Role-Based Access Control (RBAC) and Network Policies. Both serve distinct purposes but are essential for a secure cluster.
Role-Based Access Control (RBAC)
RBAC is Kubernetes’ way of managing permissions. It lets you define roles and assign them to users or service accounts, specifying what actions they can perform on which resources.
Core Concepts of RBAC:
- Role: Defines a set of permissions within a namespace.
- ClusterRole: Defines permissions cluster-wide or across namespaces.
- RoleBinding: Assigns a Role to a user or group within a namespace.
- ClusterRoleBinding: Assigns a ClusterRole to users or groups cluster-wide.
Mind Map: RBAC Structure
Example: Creating a Role and RoleBinding
Suppose you want to allow a developer to only view pods in the development namespace.
apiVersion: rbac.authorization.k8s.io/v1
kind: Role
metadata:
  namespace: development
  name: pod-reader
rules:
- apiGroups: [""]
  resources: ["pods"]
  verbs: ["get", "watch", "list"]

apiVersion: rbac.authorization.k8s.io/v1
kind: RoleBinding
metadata:
  name: read-pods-binding
  namespace: development
subjects:
- kind: User
  name: [email protected]
  apiGroup: rbac.authorization.k8s.io
roleRef:
  kind: Role
  name: pod-reader
  apiGroup: rbac.authorization.k8s.io
This setup restricts Jane Doe to only read pods in the development namespace, preventing accidental or malicious changes.
Best Practices for RBAC
- Least Privilege: Grant only the permissions necessary.
- Use ClusterRoles sparingly: Prefer namespace-scoped Roles unless cluster-wide access is required.
- Audit RoleBindings regularly: Remove unused or overly permissive bindings.
- Use ServiceAccounts for automation: Assign roles to service accounts rather than broad user groups.
Network Policies
Network Policies control how pods communicate with each other and with endpoints outside the cluster. They act like firewall rules at the pod level.
Core Concepts of Network Policies:
- Pod Selector: Defines which pods the policy applies to.
- Ingress Rules: Define allowed incoming traffic.
- Egress Rules: Define allowed outgoing traffic.
- Policy Types: Ingress, Egress, or both.
Mind Map: Network Policy Components
Example: Restricting Ingress to a Pod
Imagine you have a database pod that should only accept traffic from backend pods in the same namespace.
apiVersion: networking.k8s.io/v1
kind: NetworkPolicy
metadata:
  name: db-restrict-ingress
  namespace: production
spec:
  podSelector:
    matchLabels:
      app: database
  policyTypes:
  - Ingress
  ingress:
  - from:
    - podSelector:
        matchLabels:
          app: backend
    ports:
    - protocol: TCP
      port: 5432
This policy blocks all ingress traffic to the database pod except from pods labeled app=backend on port 5432.
Best Practices for Network Policies
- Start with a default deny policy: Explicitly block all traffic and then allow what’s needed.
- Use labels consistently: Clear labeling simplifies policy creation.
- Test policies incrementally: Avoid locking yourself out by applying policies stepwise.
- Combine ingress and egress rules: Control both directions for tighter security.
How RBAC and Network Policies Work Together
RBAC controls who can do what inside the Kubernetes API, while Network Policies control how pods communicate at the network level. For example, RBAC can prevent a user from creating or modifying pods, and Network Policies can prevent pods from talking to unauthorized services.
Mind Map: Security Layers
In summary, mastering RBAC and Network Policies is essential for securing Kubernetes clusters. RBAC ensures only authorized users and services can perform actions, while Network Policies limit network communication to reduce attack surfaces. Both require careful configuration and ongoing management to maintain a secure environment.
6.2 Securing Microservices with Service Mesh Authentication and Authorization
Securing microservices involves controlling who can talk to whom and ensuring that communication is trustworthy. Service meshes provide built-in mechanisms for authentication and authorization, which help enforce security policies consistently across microservices without requiring changes to application code.
Authentication in Service Mesh
Authentication verifies the identity of a service before allowing communication. Service meshes typically use mutual TLS (mTLS) to authenticate services. This means both the client and server verify each other’s certificates before exchanging data.
How mTLS Works in a Service Mesh
- Each service is assigned a cryptographic identity (usually a certificate).
- When two services communicate, their sidecar proxies perform a TLS handshake.
- Both sides verify certificates issued by the mesh’s Certificate Authority (CA).
- If verification passes, the connection is established securely.
This process ensures that only authorized services within the mesh can communicate, preventing impersonation or unauthorized access.
Authorization in Service Mesh
Authorization controls what authenticated services are allowed to do. Service meshes support fine-grained access control policies that specify which services can call which endpoints, often based on service identity, namespaces, or other attributes.
Common Authorization Policies
- Allow-listing: Define which services can access specific APIs.
- Deny-listing: Block certain services or endpoints explicitly.
- Role-based Access Control (RBAC): Assign roles to services and restrict actions accordingly.
Mind Map: Authentication and Authorization in Service Mesh
Example: Enabling mTLS and Authorization with Istio
Let’s consider a simple example using Istio to secure two microservices: frontend and backend.
Step 1: Enable mTLS in the Namespace
kubectl label namespace default istio-injection=enabled
kubectl apply -f - <<EOF
apiVersion: "security.istio.io/v1beta1"
kind: "PeerAuthentication"
metadata:
  name: "default"
  namespace: "default"
spec:
  mtls:
    mode: STRICT
EOF
This enforces mTLS for all services in the default namespace.
Step 2: Define Authorization Policy
Create a policy that allows only the frontend service to call the backend service:
apiVersion: security.istio.io/v1beta1
kind: AuthorizationPolicy
metadata:
  name: backend-access
  namespace: default
spec:
  selector:
    matchLabels:
      app: backend
  rules:
  - from:
    - source:
        principals: ["cluster.local/ns/default/sa/frontend-service-account"]
This policy restricts access to the backend service to requests originating from the frontend service’s service account.
Step 3: Test the Policy
- Requests from
frontendtobackendsucceed. - Requests from any other service to
backendare denied.
Mind Map: Example Workflow
Best Practices
- Use service accounts for identity: Assign each microservice a dedicated Kubernetes service account. This makes policies more precise and manageable.
- Start with permissive policies, then tighten: Begin with mTLS enabled but open authorization, then gradually restrict access to avoid breaking functionality.
- Leverage namespaces for segmentation: Use Kubernetes namespaces to group related services and apply security policies at the namespace level.
- Monitor and audit: Regularly review authorization logs to detect unauthorized access attempts.
Summary
Service mesh authentication and authorization provide a robust framework to secure microservices communication. mTLS ensures that only trusted services talk to each other, while authorization policies control what actions those services can perform. Together, they reduce the attack surface and simplify security management in complex microservice environments.
6.3 Managing Secrets and Sensitive Data in Kubernetes
Managing Secrets and Sensitive Data in Kubernetes
Handling secrets securely is a fundamental part of running microservices on Kubernetes. Secrets include passwords, API keys, TLS certificates, and any other sensitive information your applications need to function. Mishandling secrets can lead to security breaches, so understanding how Kubernetes manages secrets and best practices around them is essential.
What Are Kubernetes Secrets?
Kubernetes Secrets are objects designed to store sensitive data in your cluster. Unlike ConfigMaps, which store non-sensitive configuration data, Secrets are encoded (base64) and intended to be accessed only by authorized pods or users.
However, it’s important to note that Kubernetes Secrets are not encrypted by default—they are simply base64 encoded. This means anyone with access to the etcd datastore or API server can potentially read them. Therefore, additional measures are necessary to protect secrets effectively.
Mind Map: Managing Secrets in Kubernetes
Creating Secrets
You can create secrets in Kubernetes in multiple ways. Here’s an example of creating a generic secret using kubectl:
kubectl create secret generic db-credentials \
  --from-literal=username=admin \
  --from-literal=password='S3cr3tP@ssw0rd'
Alternatively, you can define a secret in a YAML manifest:
apiVersion: v1
kind: Secret
metadata:
  name: db-credentials
type: Opaque
stringData:
  username: admin
  password: S3cr3tP@ssw0rd
The stringData field allows you to provide unencoded strings; Kubernetes will encode them automatically.
Accessing Secrets
Pods can consume secrets either as environment variables or as files mounted in volumes.
Environment Variable Example:
apiVersion: v1
kind: Pod
metadata:
  name: secret-env-pod
spec:
  containers:
  - name: app
    image: busybox
    env:
    - name: DB_USERNAME
      valueFrom:
        secretKeyRef:
          name: db-credentials
          key: username
    - name: DB_PASSWORD
      valueFrom:
        secretKeyRef:
          name: db-credentials
          key: password
    command: ["sh", "-c", "echo Username is $DB_USERNAME; echo Password is $DB_PASSWORD"]
Volume Mount Example:
apiVersion: v1
kind: Pod
metadata:
  name: secret-volume-pod
spec:
  containers:
  - name: app
    image: busybox
    volumeMounts:
    - name: secret-volume
      mountPath: "/etc/secret"
      readOnly: true
    command: ["cat", "/etc/secret/username"]
  volumes:
  - name: secret-volume
    secret:
      secretName: db-credentials
Security Considerations
-
Encryption at Rest: By default, secrets are stored unencrypted in etcd. You should enable encryption of secrets at rest in your Kubernetes cluster configuration to protect them from unauthorized access.
-
RBAC Controls: Use Kubernetes Role-Based Access Control (RBAC) to limit who and what can access secrets. Only grant access to the minimum set of users and service accounts.
-
Avoid Secrets in Images: Never bake secrets directly into container images. This practice risks exposing secrets if images are shared or stored in public registries.
-
Audit Access: Enable audit logging to track access to secrets. This helps detect unauthorized or suspicious activity.
Mind Map: Security Considerations for Kubernetes Secrets
External Secret Management
For higher security needs, many teams integrate Kubernetes with external secret management systems like HashiCorp Vault or cloud provider Key Management Services (KMS). These systems provide features such as dynamic secrets, automatic rotation, and fine-grained access policies.
A common pattern is to use a Kubernetes operator or controller that syncs secrets from an external vault into Kubernetes Secrets, ensuring the cluster only holds short-lived or encrypted secrets.
Best Practices Summary
- Use Kubernetes Secrets for storing sensitive data but enable encryption at rest.
- Limit access to secrets using RBAC and service accounts.
- Inject secrets into pods via environment variables or volumes, not hardcoded in images.
- Avoid logging secrets or exposing them in error messages.
- Consider external secret management tools for advanced use cases.
- Rotate secrets regularly and automate the process where possible.
Example: Enabling Encryption at Rest (snippet from kube-apiserver config)
--encryption-provider-config=/etc/kubernetes/encryption-config.yaml
Encryption config file example:
apiVersion: apiserver.config.k8s.io/v1
kind: EncryptionConfiguration
resources:
  - resources:
      - secrets
    providers:
      - aescbc:
          keys:
            - name: key1
              secret: <base64-encoded-32-byte-key>
      - identity: {}
This configuration encrypts secrets stored in etcd using AES-CBC.
Conclusion
Managing secrets in Kubernetes requires a combination of built-in features and operational discipline. Kubernetes Secrets provide a convenient mechanism, but they must be paired with encryption, access controls, and careful handling to keep sensitive data safe. Integrating external secret management systems can further enhance security but adds complexity. The key is to understand your threat model and apply the right level of protection accordingly.
6.4 Implementing API Gateway Security Patterns
API gateways act as the front door for microservices, managing incoming requests, routing them, and enforcing security policies. Securing this gateway is crucial because it is the first point of contact between clients and your backend services. Here, we’ll explore common API gateway security patterns, illustrated with practical examples and mind maps to clarify their relationships.
Key API Gateway Security Patterns
Authentication
Authentication verifies the identity of the client. The two most common methods are token-based authentication and API keys.
Token-based Authentication (JWT, OAuth2):
- Clients obtain a token after login.
- The token is sent in the
Authorizationheader with each request. - The gateway validates the token before forwarding the request.
Example: Using JWT with an API Gateway like Kong or Ambassador.
# Pseudo-configuration snippet for JWT validation
plugins:
  - name: jwt
    config:
      secret_is_base64: false
      uri_param_names:
        - jwt
The gateway checks the token’s signature and expiry. If valid, the request proceeds; otherwise, it is rejected.
API Keys:
- A simple string key is issued to clients.
- Sent via headers or query parameters.
- Gateway checks the key against a store.
Example: Requiring an x-api-key header.
plugins:
  - name: key-auth
    config:
      key_names:
        - x-api-key
While API keys are easy to implement, they lack the fine-grained control and expiry features of tokens.
Authorization
Once authenticated, the gateway must decide if the client can access the requested resource.
Role-Based Access Control (RBAC):
- Access is granted based on user roles.
- Roles are assigned permissions.
Example: A user with the “admin” role can access /admin/* endpoints.
Attribute-Based Access Control (ABAC):
- Access decisions based on attributes like user department, IP address, or time.
Example: Allow access only if the user is from the “finance” department and request originates from a corporate IP range.
Rate Limiting & Throttling
To protect backend services from overload or abuse, gateways enforce limits on request rates.
- Limits can be per user, IP, or API key.
- Throttling delays or rejects requests exceeding limits.
Example: Allow 100 requests per minute per API key.
plugins:
  - name: rate-limiting
    config:
      minute: 100
      policy: local
      limit_by: credential
This prevents denial-of-service attacks and ensures fair usage.
Request Validation
The gateway can validate request payloads and headers before forwarding.
- Check required headers.
- Validate JSON schema.
Example: Reject requests missing an X-Correlation-ID header.
plugins:
  - name: request-validator
    config:
      headers:
        - X-Correlation-ID
This reduces malformed requests reaching microservices.
IP Whitelisting / Blacklisting
Control access based on client IP addresses.
- Whitelist trusted IPs.
- Blacklist known malicious IPs.
Example: Allow only requests from corporate VPN IP ranges.
plugins:
  - name: ip-restriction
    config:
      whitelist:
        - 192.168.0.0/16
        - 10.0.0.0/8
Logging and Auditing
Gateways log requests and security events.
- Logs help detect suspicious activity.
- Audit trails support compliance.
Example: Log all authentication failures with timestamps and client IPs.
TLS Termination
The gateway often handles TLS termination.
- Offloads encryption/decryption from backend.
- Enforces HTTPS and secure ciphers.
Example: Configure gateway with TLS certificates.
tls:
  enabled: true
  cert_file: /etc/certs/tls.crt
  key_file: /etc/certs/tls.key
Mind Map: API Gateway Security Overview
Example Scenario: Securing a Payment Microservice
Imagine a payment microservice exposed via an API gateway. Here’s how security patterns fit:
- Authentication: Clients use OAuth2 tokens.
- Authorization: Only users with role
payment-processorcan access/paymentsendpoints. - Rate Limiting: Limit to 50 requests per minute per user.
- Request Validation: Ensure all requests have
X-Request-IDand valid JSON body. - IP Whitelisting: Allow only requests from internal network IPs.
- TLS Termination: Enforce HTTPS.
- Logging: Record all failed authentications and authorization denials.
This layered approach ensures only authorized, well-formed, and rate-limited requests reach the payment service.
In summary, API gateway security patterns are essential building blocks to protect microservices. Combining authentication, authorization, rate limiting, and validation at the gateway reduces complexity in backend services and centralizes security controls. Practical implementations depend on your gateway choice but follow these core principles to maintain a secure microservices environment.
6.5 Practical Example: End-to-End Security in a Microservices Application
In this section, we’ll walk through a concrete example of implementing end-to-end security in a Kubernetes-based microservices application using a service mesh. The goal is to secure communication between services, protect sensitive data, and enforce access controls without sacrificing the agility microservices offer.
Scenario Overview
Imagine a simple e-commerce platform composed of three microservices:
- User Service: Manages user profiles and authentication.
- Order Service: Handles order creation and processing.
- Inventory Service: Tracks product stock levels.
Each service runs in its own Kubernetes pod, communicating over the network. We want to ensure:
- Service-to-service communication is encrypted and authenticated.
- Access to services is controlled based on identity.
- Sensitive data such as API keys and database credentials are securely stored.
Step 1: Enabling Mutual TLS (mTLS) with Istio
Mutual TLS ensures that both client and server verify each other’s identity, encrypting traffic between services.
# Sample PeerAuthentication resource to enforce mTLS
apiVersion: security.istio.io/v1beta1
kind: PeerAuthentication
metadata:
  name: default
  namespace: default
spec:
  mtls:
    mode: STRICT
This configuration forces all pods in the default namespace to use mTLS. When the User Service calls the Order Service, Istio’s sidecar proxies handle certificate exchange and encryption automatically.
Step 2: Defining Authorization Policies
Next, we restrict which services can call others. For example, only the User Service should be able to call the Order Service.
apiVersion: security.istio.io/v1beta1
kind: AuthorizationPolicy
metadata:
  name: order-service-policy
  namespace: default
spec:
  selector:
    matchLabels:
      app: order-service
  rules:
  - from:
    - source:
        principals: ["cluster.local/ns/default/sa/user-service-account"]
This policy allows requests to the Order Service only if they originate from the User Service’s service account.
Step 3: Managing Secrets Securely
Store sensitive information like database passwords in Kubernetes Secrets.
apiVersion: v1
kind: Secret
metadata:
  name: db-credentials
  namespace: default
type: Opaque
data:
  username: dXNlcm5hbWU=  # base64 encoded 'username'
  password: cGFzc3dvcmQ=  # base64 encoded 'password'
Mount these secrets as environment variables or files inside pods. For example, the Inventory Service deployment can reference the secret:
env:
- name: DB_USERNAME
  valueFrom:
    secretKeyRef:
      name: db-credentials
      key: username
- name: DB_PASSWORD
  valueFrom:
    secretKeyRef:
      name: db-credentials
      key: password
Step 4: Securing Ingress with an API Gateway
To expose services externally, use an API gateway with authentication.
apiVersion: networking.istio.io/v1alpha3
kind: Gateway
metadata:
  name: ecommerce-gateway
  namespace: default
spec:
  selector:
    istio: ingressgateway
  servers:
  - port:
      number: 443
      name: https
      protocol: HTTPS
    tls:
      mode: SIMPLE
      credentialName: tls-cert
    hosts:
    - "ecommerce.example.com"
Configure JWT validation to authenticate users before requests reach backend services.
Mind Map: End-to-End Security Components
Step 5: Putting It All Together - Example Workflow
- A client sends an HTTPS request to the API Gateway with a valid JWT.
- The gateway verifies the JWT and forwards the request to the User Service.
- The User Service calls the Order Service. Istio sidecars enforce mTLS, encrypting traffic and verifying identities.
- The Order Service queries the Inventory Service, again over mTLS.
- Each service retrieves database credentials from Kubernetes Secrets to access their respective databases.
- Authorization policies ensure that only allowed services communicate.
This setup ensures confidentiality, integrity, and access control throughout the request lifecycle.
Additional Example: Debugging Security Issues
If a service call fails, check:
- mTLS status: Use
istioctl authn tls-check <pod-name>to verify TLS connections. - Authorization policies: Confirm policies allow the source principal.
- Secret mounting: Verify secrets are correctly injected into pods.
This example demonstrates how Kubernetes, Istio service mesh, and native Kubernetes features combine to secure a microservices application comprehensively. Each piece works together, reducing the need for custom security code inside services and centralizing control.
7. Observability in Cloud Native Microservices
7.1 Introduction to Observability: Metrics, Logs, and Traces
Observability is the practice of understanding what’s happening inside a system by examining its external outputs. For cloud native microservices running on Kubernetes, observability is essential to maintain reliability, diagnose issues, and optimize performance. The three pillars of observability are metrics, logs, and traces. Each offers a different perspective on system behavior, and together they provide a comprehensive view.
Mind Map: Observability Pillars
Metrics
Metrics are numerical measurements collected at regular intervals. They provide a high-level overview of system health and performance. For example, you might track the number of HTTP requests per second or the average response time of a microservice.
Metrics are typically stored in time series databases and visualized with dashboards. They help answer questions like:
- Is the system under heavy load?
- Are error rates increasing?
- How is resource consumption trending?
Example: Suppose you have a microservice handling user authentication. A key metric could be the count of failed login attempts per minute. If this spikes, it might indicate a brute force attack or a bug.
Metrics are best for monitoring and alerting because they are lightweight and easy to aggregate.
Logs
Logs are detailed, timestamped records of events generated by applications or infrastructure components. Unlike metrics, logs provide context-rich information, often including error messages, stack traces, or custom debug statements.
Logs are invaluable when investigating specific incidents or understanding the sequence of events leading to a problem.
Example: Continuing with the authentication service, a log entry might record a failed login attempt with details such as username, IP address, and error reason. This level of detail helps pinpoint the cause.
Logs can be voluminous, so centralized log management and filtering are important to extract relevant information efficiently.
Traces
Traces track the path of a single request as it travels through multiple microservices. This is crucial in distributed systems where a user action triggers calls across several components.
A trace breaks down the request into spans, each representing a unit of work within a service, with timing information and metadata.
Example: A user places an order, triggering calls to inventory, payment, and notification services. A trace shows how long each step took and where delays occurred.
Tracing helps identify bottlenecks, understand dependencies, and debug complex workflows.
Mind Map: Observability Use Cases
How They Work Together
Metrics provide the “what” — what is happening at a system level. Logs provide the “why” — why something happened by showing detailed events. Traces provide the “how” — how a request flows through the system.
For example, a spike in error rate (metric) might lead you to examine logs for error details, and then use traces to see which service or call caused the failure.
Summary
- Metrics are aggregated numerical data for monitoring trends and alerting.
- Logs are detailed event records for debugging and context.
- Traces follow requests across services to understand flow and latency.
Together, these pillars form the foundation of observability in cloud native microservices, enabling engineers to maintain system health and troubleshoot effectively.
7.2 Instrumenting Microservices for Metrics Collection with Prometheus
Instrumenting microservices for metrics collection with Prometheus is a foundational step in making your system observable. Metrics provide quantitative data about your services’ behavior, performance, and health. Prometheus, being a widely adopted open-source monitoring system, excels at scraping, storing, and querying these metrics.
What Does Instrumentation Mean?
Instrumentation means adding code to your microservices that exposes metrics in a format Prometheus can scrape. These metrics typically include counters, gauges, histograms, and summaries.
- Counter: A cumulative metric that only increases, such as the number of requests served.
- Gauge: A metric that can go up and down, like current memory usage.
- Histogram: Measures the distribution of values, for example, request durations.
- Summary: Similar to histogram but calculates quantiles on the client side.
Basic Steps to Instrument a Microservice
- Choose a Prometheus Client Library: Prometheus supports many languages (Go, Java, Python, Node.js, etc.). Pick the one matching your microservice’s language.
- Define Metrics: Decide what you want to measure. Common metrics include request counts, error rates, and latency.
- Expose Metrics Endpoint: Usually, an HTTP endpoint (e.g.,
/metrics) that Prometheus scrapes. - Configure Prometheus to Scrape: Add your service’s metrics endpoint to Prometheus’s scrape configuration.
Mind Map: Instrumentation Workflow
Example: Instrumenting a Simple HTTP Service in Go
package main

import (
    "net/http"
    "github.com/prometheus/client_golang/prometheus"
    "github.com/prometheus/client_golang/prometheus/promhttp"
    "time"
)

var (
    requestCount = prometheus.NewCounterVec(
        prometheus.CounterOpts{
            Name: "http_requests_total",
            Help: "Total number of HTTP requests",
        },
        []string{"path", "method", "status"},
    )

    requestDuration = prometheus.NewHistogramVec(
        prometheus.HistogramOpts{
            Name:    "http_request_duration_seconds",
            Help:    "Histogram of response latency (seconds) of HTTP requests",
            Buckets: prometheus.DefBuckets,
        },
        []string{"path", "method"},
    )
)

func init() {
    prometheus.MustRegister(requestCount)
    prometheus.MustRegister(requestDuration)
}

func instrumentHandler(path string, handler http.Handler) http.Handler {
    return http.HandlerFunc(func(w http.ResponseWriter, r *http.Request) {
        start := time.Now()
        rw := &responseWriter{w, http.StatusOK}
        handler.ServeHTTP(rw, r)
        duration := time.Since(start).Seconds()

        requestCount.WithLabelValues(path, r.Method, http.StatusText(rw.status)).Inc()
        requestDuration.WithLabelValues(path, r.Method).Observe(duration)
    })
}

type responseWriter struct {
    http.ResponseWriter
    status int
}

func (rw *responseWriter) WriteHeader(code int) {
    rw.status = code
    rw.ResponseWriter.WriteHeader(code)
}

func main() {
    http.Handle("/metrics", promhttp.Handler())
    http.Handle("/hello", instrumentHandler("/hello", http.HandlerFunc(func(w http.ResponseWriter, r *http.Request) {
        w.Write([]byte("Hello, world!"))
    })))

    http.ListenAndServe(":8080", nil)
}
This example creates two metrics: a counter for total HTTP requests and a histogram for request durations. The /metrics endpoint exposes these metrics in Prometheus format.
Mind Map: Metrics Types and Use Cases
Best Practices for Instrumentation
- Label Sparingly: Excessive labels can cause high cardinality, which impacts Prometheus performance.
- Use Meaningful Labels: Labels like
method,status_code, andendpointhelp slice metrics effectively. - Instrument Critical Paths: Focus on key user interactions and service dependencies.
- Avoid Expensive Metrics: Keep metric collection lightweight to avoid impacting service performance.
- Test Metrics Exposure: Ensure the
/metricsendpoint is accessible and returns valid Prometheus format.
Example: Avoiding High Cardinality Labels
Suppose you label metrics by user ID. If your service has thousands of users, this creates thousands of label values, which can overwhelm Prometheus.
Instead, consider labeling by user role or region, which have fewer distinct values.
Integrating with Kubernetes
In Kubernetes, expose the metrics endpoint via a Service and configure Prometheus to scrape it. For example, add annotations to your Pod spec:
metadata:
  annotations:
    prometheus.io/scrape: "true"
    prometheus.io/port: "8080"
    prometheus.io/path: "/metrics"
This tells Prometheus to scrape the Pod’s /metrics endpoint on port 8080.
Summary
Instrumenting microservices with Prometheus involves selecting the right client library, defining relevant metrics, exposing them on an HTTP endpoint, and configuring Prometheus to scrape those metrics. Keeping labels meaningful and limited in number helps maintain performance. With these steps, you gain quantitative insights into your services that support monitoring, alerting, and troubleshooting.
7.3 Distributed Tracing with Jaeger: Setup and Examples
Distributed tracing helps you track requests as they travel through multiple microservices. Jaeger is an open-source tool designed to collect and visualize these traces. It’s particularly useful in Kubernetes environments where services communicate over the network and problems can be hard to pinpoint.
What is Distributed Tracing?
Distributed tracing breaks down a request into spans, each representing a unit of work within a service. A trace is the collection of these spans, showing the full journey of a request.
Mind Map: Distributed Tracing Basics
Setting Up Jaeger on Kubernetes
-
Deploy Jaeger components: Jaeger typically runs as a set of pods: agent, collector, query service, and UI.
-
Use the Jaeger Operator or YAML manifests: The operator simplifies management, but YAML files work for quick setups.
-
Configure your microservices: Instrument your code to send trace data to the Jaeger agent.
-
Verify the setup: Access the Jaeger UI to see traces.
Example: Deploying Jaeger with YAML
kubectl create namespace observability
kubectl apply -f https://raw.githubusercontent.com/jaegertracing/jaeger-operator/master/deploy/examples/simplest.yaml -n observability
This deploys a simple all-in-one Jaeger instance.
Example: Accessing Jaeger UI
kubectl port-forward svc/jaeger-query 16686:16686 -n observability
Then open http://localhost:16686 in your browser.
Instrumenting Microservices
Instrumentation means adding code to generate trace data. You can do this manually or use libraries that support automatic instrumentation.
Example: Instrumenting a Go microservice with OpenTelemetry and Jaeger
import (
  "go.opentelemetry.io/otel"
  "go.opentelemetry.io/otel/exporters/jaeger"
  "go.opentelemetry.io/otel/sdk/trace"
)

func initTracer() func() {
  exporter, _ := jaeger.New(jaeger.WithCollectorEndpoint(jaeger.WithEndpoint("http://jaeger-collector.observability.svc:14268/api/traces")))
  tp := trace.NewTracerProvider(trace.WithBatcher(exporter))
  otel.SetTracerProvider(tp)
  return func() { _ = tp.Shutdown(context.Background()) }
}

func main() {
  shutdown := initTracer()
  defer shutdown()

  tracer := otel.Tracer("example-service")
  ctx, span := tracer.Start(context.Background(), "main-operation")
  defer span.End()

  // Your business logic here
}
This example shows how to initialize a tracer and create a span.
Propagating Trace Context
To link spans across services, trace context must be passed along with requests, usually via HTTP headers.
Example: Propagating context in HTTP calls (Go)
req, _ := http.NewRequest("GET", "http://downstream-service", nil)
otel.GetTextMapPropagator().Inject(ctx, propagation.HeaderCarrier(req.Header))

resp, err := http.DefaultClient.Do(req)
This ensures the downstream service continues the trace.
Viewing and Interpreting Traces
In the Jaeger UI, you can search traces by service name, operation, or tags. Each trace shows spans with timing and relationships.
Mind Map: Trace Visualization
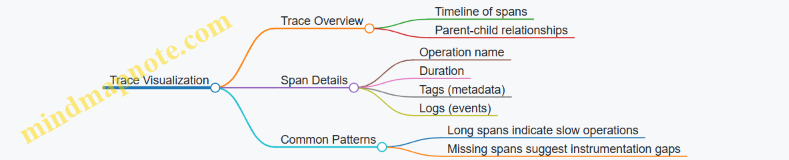
Practical Example: Tracing a Request Flow
Imagine a user request flows through three services: API Gateway, User Service, and Order Service.
- API Gateway starts a root span.
- It calls User Service, passing the trace context.
- User Service creates a child span for its processing.
- User Service calls Order Service, passing context again.
- Order Service creates another child span.
In Jaeger, you’ll see a trace with three spans linked hierarchically, showing where time is spent.
Best Practices
- Instrument all services consistently: Missing spans break the trace.
- Use meaningful operation names: Helps identify what each span represents.
- Tag spans with useful metadata: For example, HTTP status codes, error messages.
- Limit span duration: Keep spans focused on single operations.
- Monitor trace volume: High volume can impact performance; sample traces if needed.
Distributed tracing with Jaeger provides a clear window into your microservices’ behavior. Setting it up involves deploying Jaeger, instrumenting your services, and ensuring trace context flows correctly. The result is a powerful tool to diagnose latency, errors, and service dependencies.
7.4 Centralized Logging with Elasticsearch, Fluentd, and Kibana (EFK Stack)
Centralized logging is essential for managing logs generated by multiple microservices running in Kubernetes. The EFK stack—Elasticsearch, Fluentd, and Kibana—is a popular solution that collects, stores, and visualizes logs in a unified way.
Why Centralized Logging?
In a microservices environment, logs are scattered across many pods and nodes. Without centralization, troubleshooting requires manual log collection from individual containers, which is inefficient and error-prone. Centralized logging aggregates logs in one place, enabling faster search, correlation, and analysis.
Components of the EFK Stack
How Logs Flow in EFK
Setting Up Fluentd as a DaemonSet
Fluentd runs on every node to collect logs locally. It reads container logs from the host filesystem, parses them, and forwards them to Elasticsearch.
Example Fluentd configuration snippet to parse Kubernetes logs:
<source>
  @type tail
  path /var/log/containers/*.log
  pos_file /var/log/fluentd-containers.log.pos
  tag kubernetes.*
  format json
  read_from_head true
</source>

<filter kubernetes.**>
  @type kubernetes_metadata
</filter>

<match **>
  @type elasticsearch
  host elasticsearch.logging.svc.cluster.local
  port 9200
  logstash_format true
  include_tag_key true
  tag_key @log_name
</match>
This configuration:
- Tails all container logs in the node’s
/var/log/containersdirectory. - Parses logs assuming JSON format (common for structured logs).
- Enriches logs with Kubernetes metadata (pod name, namespace, labels).
- Sends logs to Elasticsearch using the Logstash format for compatibility.
Elasticsearch Indexing
Elasticsearch stores logs in indices, typically organized by date (e.g., logstash-2024.06.01). This allows efficient querying and retention policies.
Example query to find error logs from a specific microservice:
{
  "query": {
    "bool": {
      "must": [
        { "match": { "kubernetes.labels.app": "orders-service" }},
        { "match": { "log.level": "error" }}
      ]
    }
  }
}
This query filters logs to show only errors from the orders-service microservice.
Kibana Dashboards
Kibana provides an interface to explore logs visually. You can create dashboards showing:
- Log volume over time
- Error rates per microservice
- Latency or response time extracted from logs
- Distribution of log levels (info, warning, error)
Example: A dashboard widget showing error count per namespace helps identify which team or service is experiencing issues.
Best Practices for EFK Stack
- Structured Logging: Ensure microservices emit logs in JSON or another structured format. This improves parsing accuracy.
- Metadata Enrichment: Use Fluentd filters to add Kubernetes metadata, making logs easier to filter and correlate.
- Log Rotation and Retention: Configure Elasticsearch index lifecycle management to avoid storage bloat.
- Resource Limits: Set resource requests and limits for Fluentd and Elasticsearch pods to maintain cluster stability.
- Security: Secure Elasticsearch with authentication and restrict access to Kibana dashboards.
Example: Deploying EFK Stack on Kubernetes
- Deploy Elasticsearch StatefulSet with persistent storage.
- Deploy Fluentd DaemonSet with configuration to collect container logs.
- Deploy Kibana Deployment and Service.
- Access Kibana UI to create index patterns and start exploring logs.
Each component should be configured to handle the scale and log volume of your cluster.
Centralized logging with the EFK stack turns scattered logs into actionable insights. It simplifies troubleshooting and helps maintain visibility across distributed microservices.
7.5 Integrating Observability Data with Service Mesh Telemetry
Integrating observability data with service mesh telemetry means combining the rich, contextual data that a service mesh collects with your existing observability tools to get a clearer picture of how microservices behave and interact. Service meshes like Istio or Linkerd automatically generate telemetry data such as metrics, logs, and traces by intercepting service-to-service communication. This data can be fed into monitoring and tracing systems to enhance visibility.
Why Integrate Observability with Service Mesh Telemetry?
- Contextualized Metrics: Service mesh telemetry provides detailed metrics at the network and application layer, such as request latencies, error rates, and traffic volumes, tagged with service identities.
- Unified Tracing: Distributed tracing from the mesh includes service-to-service call paths, which helps in pinpointing bottlenecks or failures.
- Security Insights: Mesh telemetry can reveal mTLS handshake successes/failures and unauthorized access attempts.
Core Components of Service Mesh Telemetry Integration
How the Data Flows
- Sidecar Proxy Captures Traffic: Each microservice pod runs a sidecar proxy (e.g., Envoy) that intercepts inbound and outbound traffic.
- Telemetry Generation: The proxy generates metrics (like request counts, latencies), logs (access logs), and traces (spans for each request).
- Telemetry Collection: This data is sent to a telemetry backend, often via a collector component that aggregates and processes it.
- Storage and Visualization: The data is stored in systems like Prometheus (metrics), Elasticsearch (logs), or Jaeger (traces), and visualized through dashboards.
Example: Integrating Istio Telemetry with Prometheus and Jaeger
Istio automatically configures Envoy proxies to emit telemetry. Here’s a simplified example of how to integrate this data:
- Metrics: Istio configures Envoy to expose metrics at
/stats/prometheus. Prometheus scrapes these endpoints from each pod. - Tracing: Envoy generates spans for each request, sending them to Jaeger via the Istio telemetry pipeline.
Prometheus scrape config snippet:
scrape_configs:
  - job_name: 'istio-proxy-metrics'
    kubernetes_sd_configs:
      - role: pod
    relabel_configs:
      - source_labels: [__meta_kubernetes_pod_annotation_prometheus_io_scrape]
        action: keep
        regex: true
      - source_labels: [__meta_kubernetes_pod_annotation_prometheus_io_path]
        action: replace
        target_label: __metrics_path__
        regex: (.+)
      - source_labels: [__address__, __meta_kubernetes_pod_annotation_prometheus_io_port]
        action: replace
        regex: (.+):(?:\d+);(\d+)
        replacement: $1:$2
        target_label: __address__
This config ensures Prometheus scrapes metrics exposed by Envoy sidecars.
Visualizing Integrated Data
Combining metrics and traces helps answer questions like:
- Which service is causing increased latency?
- Are errors localized to a specific service or network segment?
A Grafana dashboard might show:
Practical Example: Diagnosing Latency Spikes
Suppose your dashboard shows a sudden spike in request latency for Service A. The service mesh telemetry reveals:
- Increased retries between Service A and Service B.
- Traces show Service B is slow responding.
By correlating metrics and traces, you identify that Service B’s database queries are slow. This insight comes from the mesh telemetry’s detailed call paths combined with your observability stack.
Best Practices
- Consistent Labeling: Ensure telemetry data includes consistent service and version labels for filtering.
- Sampling Configuration: Adjust trace sampling rates to balance overhead and visibility.
- Centralized Collection: Use a dedicated telemetry collector to reduce load on individual proxies.
- Security: Protect telemetry endpoints and data in transit.
Integrating observability data with service mesh telemetry turns raw network data into actionable insights. It bridges the gap between network-level events and application-level behavior, making troubleshooting and performance tuning more straightforward.
8. Monitoring and Alerting Best Practices
8.1 Defining Service-Level Objectives (SLOs) and Service-Level Indicators (SLIs)
When managing cloud native microservices, clear expectations about service performance and reliability are essential. This is where Service-Level Objectives (SLOs) and Service-Level Indicators (SLIs) come in. They provide measurable targets and the metrics to track those targets, helping teams maintain service quality and prioritize work.
What are SLIs?
Service-Level Indicators are specific metrics that quantify some aspect of the service’s behavior. They are the raw data points you collect to understand how your service is performing. Examples include request latency, error rate, throughput, or availability.
What are SLOs?
Service-Level Objectives are explicit targets set for SLIs. They define the acceptable level of service performance over a given time period. For example, an SLO might state that 99.9% of requests must complete within 200 milliseconds over a month.
Why SLOs and SLIs Matter
Without them, teams operate in the dark, guessing if the service is meeting user expectations. SLOs and SLIs provide a clear, shared language between developers, operators, and stakeholders.
Mind Map: Core Concepts of SLOs and SLIs
Choosing Effective SLIs
Not all metrics are equally useful. Good SLIs are:
- Meaningful: They reflect user experience or critical service behavior.
- Measurable: They can be collected reliably and consistently.
- Actionable: They help teams make decisions.
For example, measuring CPU usage might be interesting but doesn’t directly tell you if users are experiencing slow responses. Measuring request latency or error rate is more directly tied to user experience.
Example: Defining SLIs for an E-commerce Checkout Service
- Latency: 95th percentile of checkout API response times.
- Error Rate: Percentage of failed checkout requests.
- Availability: Percentage of time the checkout service is reachable.
Setting SLOs
Once SLIs are selected, set realistic targets based on business needs and historical data. Targets should balance user expectations with operational capabilities.
Example SLOs for the checkout service:
- 95th percentile latency under 300ms over a 30-day period.
- Error rate below 0.5% over a 30-day period.
- Availability at 99.9% uptime monthly.
These targets create a clear benchmark for service quality.
Mind Map: SLO Components and Relationships
Error Budgets
An error budget is the allowable margin of error within an SLO. For example, if your availability SLO is 99.9%, your error budget is 0.1% downtime. This budget can be “spent” on incidents or planned maintenance.
Error budgets help balance reliability with innovation. If the budget is exhausted, teams might halt new feature releases to focus on stability.
Practical Example: Calculating an Error Budget
If your service handles 1,000,000 requests per month and your error rate SLO is 0.5%, your error budget allows for 5,000 failed requests. Monitoring actual errors against this budget helps decide when to escalate issues.
Summary
- SLIs are the metrics that describe service performance.
- SLOs are the targets set for those metrics.
- Error budgets quantify the acceptable level of failure.
- Together, they provide a framework for maintaining and improving service quality.
By defining clear SLOs and SLIs, teams gain a practical, data-driven way to measure success and make informed decisions about reliability and feature development.
8.2 Creating Effective Alerts with Prometheus Alertmanager
Creating effective alerts with Prometheus Alertmanager is a key part of maintaining reliable cloud native microservices. Alerts should be actionable, timely, and clear to avoid alert fatigue and ensure quick response to issues.
Understanding Alertmanager’s Role
Prometheus collects metrics and evaluates alerting rules, but Alertmanager handles the alerts generated. It groups, deduplicates, throttles, and routes alerts to the right channels like email, Slack, PagerDuty, or custom webhooks.
Key Concepts for Alerting
- Alert Rules: Defined in Prometheus, these specify when an alert should fire based on metric thresholds or conditions.
- Alertmanager Configuration: Defines how alerts are grouped, routed, and inhibited.
- Silencing: Temporarily suppresses alerts during known maintenance or incidents.
Mind Map: Alert Workflow
Writing Effective Alert Rules
An alert rule should have a clear purpose and avoid firing on noise. For example, instead of alerting on a single spike in CPU usage, alert when CPU usage is above 80% for more than 5 minutes:
- alert: HighCpuUsage
  expr: avg(rate(container_cpu_usage_seconds_total[5m])) by (pod) > 0.8
  for: 5m
  labels:
    severity: warning
  annotations:
    summary: "High CPU usage detected on pod {{ $labels.pod }}"
    description: "CPU usage has been above 80% for more than 5 minutes."
This rule uses the for clause to avoid firing alerts on short-lived spikes.
Mind Map: Alert Rule Components
Grouping and Routing Alerts
Grouping alerts reduces noise by bundling related alerts together. For example, group alerts by severity and namespace:
group_by: ['severity', 'namespace']
group_wait: 30s
group_interval: 5m
repeat_interval: 3h
group_waitdelays sending the first notification to allow related alerts to arrive.group_intervalcontrols how often notifications are sent for ongoing alerts.repeat_intervalsets how often to resend alerts if they remain unresolved.
Routing sends alerts to different receivers based on labels. Example routing to Slack for critical alerts and email for warnings:
route:
  receiver: 'default'
  routes:
  - match:
      severity: critical
    receiver: 'slack-critical'
  - match:
      severity: warning
    receiver: 'email-warning'
receivers:
- name: 'slack-critical'
  slack_configs:
  - channel: '#alerts-critical'
- name: 'email-warning'
  email_configs:
  - to: '[email protected]'
Mind Map: Alertmanager Configuration
Using Silences and Inhibitions
Silences suppress alerts temporarily, useful during planned maintenance. Inhibitions prevent alerts from firing when a higher priority alert is active. For example, inhibit warnings if a critical alert is firing for the same service.
Example inhibition rule:
inhibit_rules:
- source_match:
    severity: critical
  target_match:
    severity: warning
  equal: ['namespace', 'service']
Practical Example: Alert for Pod Restarts
Pods restarting frequently can indicate instability. Here’s an alert rule:
- alert: PodRestarting
  expr: increase(kube_pod_container_status_restarts_total[10m]) > 3
  for: 10m
  labels:
    severity: warning
  annotations:
    summary: "Pod {{ $labels.pod }} is restarting frequently"
    description: "Pod {{ $labels.pod }} in namespace {{ $labels.namespace }} has restarted more than 3 times in 10 minutes."
Routing this alert to the on-call Slack channel ensures quick visibility.
Tips for Effective Alerts
- Use meaningful labels to route alerts precisely.
- Avoid alerting on transient conditions by using the
forclause. - Annotate alerts with actionable information.
- Group alerts logically to reduce notification noise.
- Regularly review and tune alert thresholds.
Effective alerting with Prometheus Alertmanager is about balance: enough alerts to catch real issues, but not so many that responders become numb. Clear rules, smart grouping, and thoughtful routing help maintain that balance.
8.3 Visualizing Microservices Health with Grafana Dashboards
Visualizing microservices health with Grafana dashboards is a practical way to keep track of system performance, spot issues early, and communicate status clearly to your team. Grafana acts as a window into the data collected by monitoring tools like Prometheus, turning raw metrics into actionable insights.
Key Metrics to Visualize
Before building dashboards, identify which metrics truly reflect your microservices’ health. Common ones include:
- Request Rate (RPS): Number of requests per second, indicating load.
- Error Rate: Percentage or count of failed requests.
- Latency (Response Time): Distribution of response times, often shown as percentiles (p50, p95, p99).
- CPU and Memory Usage: Resource consumption per service.
- Pod Restarts: Frequency of container restarts, signaling instability.
Mind Map: Core Dashboard Metrics
Dashboard Layout Example
A well-structured dashboard groups related metrics logically:
- Traffic Overview: Top-left corner, showing request and error rates.
- Latency Metrics: Center, with line or heatmap charts for percentiles.
- Resource Usage: Right side, displaying CPU and memory trends.
- Stability Indicators: Bottom, listing pod restarts and crash loops.
Example: Prometheus Query for Request Rate
To plot request rate for a service named orders-service:
sum(rate(http_requests_total{service="orders-service"}[1m]))
This query sums the per-second rate of HTTP requests over the last minute.
Example: Error Rate Calculation
Calculate the error rate as a percentage of total requests:
(sum(rate(http_requests_total{service="orders-service",status=~"5.."}[1m]))
 / sum(rate(http_requests_total{service="orders-service"}[1m]))) * 100
This divides 5xx error requests by total requests, multiplied by 100.
Visualizing Latency Percentiles
Latency is best understood through percentiles rather than averages. For example, to get the 95th percentile latency:
histogram_quantile(0.95, sum(rate(http_request_duration_seconds_bucket{service="orders-service"}[5m])) by (le))
This uses Prometheus histogram buckets to calculate latency.
Mind Map: Dashboard Components and Queries
Resource Usage Queries
CPU and memory usage are critical to spot resource bottlenecks or leaks.
- CPU Usage: Average CPU seconds used per pod over time.
- Memory Usage: Current memory bytes used per pod.
Example CPU query:
avg(rate(container_cpu_usage_seconds_total{pod=~"orders-service.*"}[1m])) by (pod)
Example memory query:
avg(container_memory_usage_bytes{pod=~"orders-service.*"}) by (pod)
Pod Restarts
Frequent restarts often indicate crashes or configuration issues. Track restarts over a window:
increase(kube_pod_container_status_restarts_total{pod=~"orders-service.*"}[1h])
Tips for Effective Dashboards
- Use consistent naming and labels to filter metrics by service, environment, or version.
- Set alert thresholds on key panels to catch anomalies early.
- Combine graphs with single-stat panels for quick status checks.
- Use heatmaps or histograms for latency to show distribution, not just averages.
- Group related metrics visually to reduce cognitive load.
Mind Map: Dashboard Best Practices
Example Walkthrough
Imagine you notice a spike in error rate on the payments-service. On the dashboard, the error rate panel shows a jump from 0.1% to 5%. Simultaneously, latency percentiles increase, and pod restarts rise. This combination points to a potential bug or resource exhaustion. You drill down into logs or traces, but the dashboard gave you the initial heads-up.
In summary, Grafana dashboards translate complex metric data into clear visuals that help you monitor microservices health effectively. By carefully selecting metrics, structuring dashboards logically, and using precise queries, you create a reliable tool for ongoing system maintenance and troubleshooting.
8.4 Automated Incident Response Workflows
Automated incident response workflows are essential for maintaining reliability in cloud native microservices environments. When a problem arises, a swift and structured response reduces downtime and limits impact. Automation helps by triggering predefined actions based on alerts, freeing engineers from routine tasks and enabling faster resolution.
Key Components of Automated Incident Response Workflows
- Detection: Monitoring tools detect anomalies or threshold breaches.
- Alerting: Alerts are generated and routed to the right teams or systems.
- Classification: The incident type and severity are identified.
- Response: Automated or manual remediation steps are initiated.
- Communication: Stakeholders are informed about the incident status.
- Post-Incident Review: Data is collected for analysis and improvement.
Mind Map: Automated Incident Response Workflow
Example: Automating Incident Response Using Prometheus and Alertmanager
Imagine a microservice that experiences a spike in error rate. Prometheus monitors the error rate metric and triggers an alert when it crosses 5% for more than 5 minutes. Alertmanager receives this alert and routes it to a Slack channel and triggers a webhook that starts an automated remediation script.
The remediation script could:
- Scale up the number of pods to handle increased load.
- Restart pods that are returning errors.
- Roll back the latest deployment if the issue correlates with a recent release.
This automation reduces the need for manual intervention during common failure scenarios.
Mind Map: Alert Handling and Automated Remediation
Communication and Escalation
Automation should also handle communication. For example, if an alert is not acknowledged within a set time, the system escalates by notifying a higher-level engineer or team. Status updates can be posted automatically to incident channels to keep everyone informed.
Example: Escalation Workflow
- Alert fires and notifies the primary on-call engineer.
- If no acknowledgement within 10 minutes, escalate to secondary on-call.
- After 30 minutes without resolution, notify the incident manager.
- Automatically update incident status in tracking tools.
Mind Map: Communication and Escalation
Benefits of Automated Incident Response
- Speed: Faster detection and remediation reduce downtime.
- Consistency: Standardized responses prevent human error.
- Focus: Engineers can focus on complex problems rather than routine alerts.
- Documentation: Automated workflows generate logs and reports useful for reviews.
Summary
Automated incident response workflows combine monitoring, alerting, remediation, and communication into a cohesive system. By defining clear rules and actions, teams can handle incidents more efficiently and maintain higher service reliability. Practical examples like scaling pods or rolling back deployments illustrate how automation can tackle common issues without delay.
8.5 Case Study: Troubleshooting a Microservice Outage Using Observability Tools
In this case study, we walk through a real-world scenario where a critical microservice in a Kubernetes cluster suddenly becomes unresponsive. The goal is to demonstrate how observability tools—metrics, logs, and tracing—can be combined to quickly identify and resolve the issue.
Scenario Overview
A payment processing microservice, payment-service, deployed on Kubernetes, stops responding to API requests. This service is part of a larger e-commerce platform. Users report timeouts and errors when attempting to complete transactions.
Step 1: Detecting the Outage with Metrics
The first alert comes from Prometheus, which monitors service health via metrics. The alert triggers because the payment-service’s HTTP request latency exceeds the configured threshold.
Prometheus metrics reveal:
- HTTP 500 error rate spikes from 0.5% to 20%
- Request duration jumps from 200ms to over 5 seconds
- CPU usage remains stable, but memory usage shows a slow increase
This suggests the service is struggling to process requests, but not necessarily CPU-bound.
Step 2: Examining Logs for Errors
Next, we check the centralized logs collected via Fluentd and stored in Elasticsearch.
Key log entries from payment-service show repeated database connection timeouts:
ERROR: Failed to connect to database: timeout after 5s
WARN: Retrying database connection (attempt 3)
ERROR: Payment processing failed due to DB connection error
Kubernetes events for the pod show no restarts or OOM kills, indicating the pod is running but struggling internally.
Step 3: Tracing Request Flows
Using Jaeger, we trace a typical payment request. The trace shows:
- The request enters
payment-servicequickly. - The service attempts to query the database.
- The database call spans several seconds before timing out.
- The service returns an error to the client.
This confirms the bottleneck is the database interaction.
Step 4: Investigating the Database
The database is a managed PostgreSQL instance. Metrics show:
- Connection count at maximum allowed
- Slow query logs indicating locking issues
A recent deployment introduced a change that increased transaction duration, leading to connection pool exhaustion.
Step 5: Applying the Fix
Immediate actions:
- Increase database connection pool size in
payment-serviceconfiguration. - Roll back the recent deployment to restore previous query behavior.
After these changes:
- Prometheus metrics return to normal latency and error rates.
- Logs no longer show connection timeouts.
- Traces confirm database queries complete promptly.
Summary Mind Map
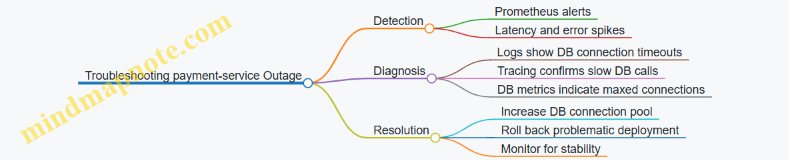
This case study highlights how combining metrics, logs, and tracing provides a clear path from symptom to root cause. Metrics catch the problem early, logs give context, and tracing pinpoints the exact failure point. Observability tools are most effective when used together, allowing cloud engineers and backend developers to troubleshoot microservice outages efficiently and with confidence.
9. Continuous Integration and Continuous Deployment (CI/CD) for Microservices
9.1 Designing CI/CD Pipelines for Kubernetes Microservices
Designing CI/CD Pipelines for Kubernetes Microservices
Continuous Integration and Continuous Deployment (CI/CD) pipelines are the backbone of efficient software delivery, especially when working with Kubernetes microservices. The goal is to automate building, testing, and deploying microservices with minimal manual intervention, ensuring consistency and reliability.
Key Components of a CI/CD Pipeline for Kubernetes Microservices
Mind Map: CI/CD Pipeline Flow
Example Pipeline Walkthrough
Imagine a microservice called order-service. The pipeline starts when a developer pushes code to the main branch.
- Build Stage: The pipeline triggers a build job that compiles the service and builds a Docker image using a Dockerfile. Example Dockerfile snippet:
FROM openjdk:11-jre-slim
COPY target/order-service.jar /app/order-service.jar
ENTRYPOINT ["java", "-jar", "/app/order-service.jar"]
-
Test Stage: Unit tests run inside the build container. If they pass, integration tests run against a test Kubernetes namespace where the service is deployed temporarily.
-
Image Push: The Docker image is tagged with the commit SHA and pushed to a container registry.
-
Deployment Stage: Kubernetes manifests or Helm charts are updated to reference the new image tag. The pipeline applies these manifests to the staging environment.
-
Verification: Automated smoke tests confirm the service responds correctly. If successful, the pipeline can promote the deployment to production using a controlled rollout strategy.
Mind Map: Deployment Strategies in CI/CD
Best Practices
- Immutable Artifacts: Always tag images with unique identifiers (commit hashes) to avoid ambiguity.
- Declarative Manifests: Use Helm or Kustomize to manage Kubernetes manifests, enabling easier updates and rollbacks.
- Environment Parity: Keep staging and production environments as similar as possible to catch issues early.
- Automated Rollbacks: Configure the pipeline to rollback on failed deployments or health checks.
- Security Scanning: Integrate container vulnerability scanning in the pipeline to catch issues before deployment.
Example: Kubernetes Deployment Manifest Snippet
apiVersion: apps/v1
kind: Deployment
metadata:
  name: order-service
spec:
  replicas: 3
  selector:
    matchLabels:
      app: order-service
  template:
    metadata:
      labels:
        app: order-service
    spec:
      containers:
      - name: order-service
        image: registry.example.com/order-service:{{ .CommitSHA }}
        ports:
        - containerPort: 8080
Integrating CI/CD with Kubernetes
- Use Kubernetes namespaces to isolate environments (dev, staging, production).
- Automate manifest updates with tools like
kubectl set imageor Helm upgrades. - Incorporate health checks and readiness probes to ensure pods are ready before routing traffic.
Summary
Designing a CI/CD pipeline for Kubernetes microservices means automating everything from code commit to deployment, with checks at every stage. The pipeline should build and test container images, push them to a registry, deploy to Kubernetes, and verify the deployment. Using deployment strategies like canary or blue-green can reduce risk. Keeping manifests declarative and environments consistent helps maintain reliability. Finally, automation of rollbacks and security scans adds robustness to the process.
9.2 Integrating Service Mesh Features into CI/CD Workflows
Integrating service mesh features into CI/CD workflows involves embedding the capabilities of the service mesh—such as traffic management, security policies, and observability—directly into the automated pipeline that builds, tests, and deploys microservices. This integration ensures that the benefits of the service mesh are consistently applied throughout the software delivery lifecycle, reducing manual intervention and improving reliability.
Why Integrate Service Mesh into CI/CD?
- Consistency: Automate the injection of sidecars and configuration of routing rules so every deployment adheres to the same standards.
- Early Validation: Test service mesh configurations like traffic shifting or fault injection as part of the pipeline.
- Security Enforcement: Apply mTLS and authorization policies automatically during deployment.
- Observability Setup: Ensure telemetry and tracing are enabled and validated before production rollout.
Core Integration Points
Automating Sidecar Injection
Most service meshes, like Istio, use sidecar proxies injected into pods to intercept traffic. CI/CD pipelines should ensure that the deployment manifests or Helm charts include the necessary annotations or configurations for automatic sidecar injection.
Example:
apiVersion: apps/v1
kind: Deployment
metadata:
  name: example-service
  annotations:
    sidecar.istio.io/inject: "true"
spec:
  replicas: 3
  template:
    metadata:
      labels:
        app: example-service
    spec:
      containers:
      - name: app-container
        image: example-service:latest
In the pipeline, a validation step can check for this annotation before proceeding.
Embedding Traffic Management Rules
CI/CD pipelines can apply or update service mesh traffic routing rules as part of deployment. This includes canary releases, blue-green deployments, and fault injection for resilience testing.
Example: Canary Deployment with Istio
apiVersion: networking.istio.io/v1alpha3
kind: VirtualService
metadata:
  name: example-service
spec:
  hosts:
  - example-service
  http:
  - route:
    - destination:
        host: example-service
        subset: v1
      weight: 90
    - destination:
        host: example-service
        subset: v2
      weight: 10
In the CI/CD pipeline, after deploying v2, this VirtualService configuration can be applied to gradually shift traffic. Automated tests can run against the v2 subset before increasing traffic weight.
Security Policy Enforcement
Service mesh supports mutual TLS (mTLS) and fine-grained authorization policies. Pipelines should apply these policies automatically and verify their correctness.
Example: Enabling mTLS
apiVersion: security.istio.io/v1beta1
kind: PeerAuthentication
metadata:
  name: default
  namespace: example-namespace
spec:
  mtls:
    mode: STRICT
A pipeline step can apply this manifest and run connectivity tests to confirm encrypted communication.
Observability Configuration
Ensure that telemetry, logging, and tracing are enabled and configured correctly. Pipelines can validate that necessary annotations or sidecar configurations are present.
Example: Enabling Tracing Add environment variables or annotations to enable tracing:
metadata:
  annotations:
    sidecar.istio.io/tracing: "enabled"
Pipeline tests can verify that traces are generated during test runs.
Validation and Testing
Integrate tests that validate service mesh configurations:
- Configuration Linting: Check YAML manifests for syntax and semantic errors.
- Integration Tests: Deploy to a staging environment with service mesh enabled and run end-to-end tests.
- Fault Injection Tests: Use service mesh fault injection to simulate failures and verify service resilience.
Example CI/CD Pipeline Snippet (Simplified)
# Step 1: Lint manifests
kubectl apply --dry-run=client -f manifests/

# Step 2: Deploy microservice with sidecar injection
kubectl apply -f deployment.yaml

# Step 3: Apply traffic routing rules
kubectl apply -f virtualservice-canary.yaml

# Step 4: Run integration tests
./run_integration_tests.sh

# Step 5: Apply security policies
kubectl apply -f peerauthentication.yaml

# Step 6: Validate observability
./check_tracing.sh
Summary
Integrating service mesh features into CI/CD pipelines means automating sidecar injection, traffic management, security policy application, and observability setup. It also involves validating these configurations through automated tests. This approach reduces manual errors and ensures that microservices consistently benefit from the service mesh capabilities throughout their lifecycle.
9.3 Automated Testing Strategies: Unit, Integration, and End-to-End Tests
Automated testing is a cornerstone of reliable microservices development. It helps catch bugs early, ensures code quality, and supports continuous integration and deployment. In this section, we’ll break down three key testing strategies: unit tests, integration tests, and end-to-end (E2E) tests. Each serves a distinct purpose and fits into the testing pyramid differently.
Mind Map: Automated Testing Strategies
Unit Tests
Unit tests focus on the smallest parts of your code, typically individual functions or classes. They isolate the unit under test by mocking dependencies, so tests run quickly and deterministically.
Example: Suppose you have a microservice that calculates discounts based on customer type.
# discount.py

def calculate_discount(customer_type, amount):
    if customer_type == 'premium':
        return amount * 0.8  # 20% discount
    elif customer_type == 'regular':
        return amount * 0.95  # 5% discount
    else:
        return amount
A unit test for this function might look like:
import unittest
from discount import calculate_discount

class TestDiscount(unittest.TestCase):
    def test_premium_discount(self):
        self.assertEqual(calculate_discount('premium', 100), 80)

    def test_regular_discount(self):
        self.assertEqual(calculate_discount('regular', 100), 95)

    def test_no_discount(self):
        self.assertEqual(calculate_discount('guest', 100), 100)

if __name__ == '__main__':
    unittest.main()
Best Practice: Keep unit tests fast and focused. Mock external calls, databases, or other services to avoid flakiness.
Integration Tests
Integration tests verify how different parts of the system work together. This often means testing interactions between microservices, databases, or external APIs.
Example: Imagine a user service that stores user data in a database. An integration test might spin up a test database and verify that the service correctly saves and retrieves user records.
import unittest
from user_service import UserService
from testcontainers.postgres import PostgresContainer

class TestUserServiceIntegration(unittest.TestCase):
    def setUp(self):
        self.postgres = PostgresContainer('postgres:13')
        self.postgres.start()
        self.user_service = UserService(db_url=self.postgres.get_connection_url())

    def tearDown(self):
        self.postgres.stop()

    def test_create_and_get_user(self):
        user_id = self.user_service.create_user('alice')
        user = self.user_service.get_user(user_id)
        self.assertEqual(user.name, 'alice')

if __name__ == '__main__':
    unittest.main()
Best Practice: Use isolated environments for integration tests to avoid polluting production data. Tools like testcontainers or Kubernetes test namespaces help.
End-to-End (E2E) Tests
E2E tests simulate real user scenarios by exercising the entire system, including UI, APIs, databases, and external services. They confirm that all components work together as expected.
Example: For a microservices-based e-commerce app, an E2E test might simulate a user browsing products, adding an item to the cart, and completing checkout.
// Using a test framework like Cypress

describe('E-commerce Checkout Flow', () => {
  it('allows a user to complete a purchase', () => {
    cy.visit('/products')
    cy.get('.product-item').first().click()
    cy.get('button.add-to-cart').click()
    cy.get('a.cart').click()
    cy.get('button.checkout').click()
    cy.get('input[name="creditCard"]').type('4111111111111111')
    cy.get('button.submit-order').click()
    cy.contains('Thank you for your purchase').should('be.visible')
  })
})
Best Practice: Keep E2E tests focused on critical user journeys. They tend to be slower and more brittle, so avoid covering every edge case here.
Mind Map: Testing Pyramid
Summary
- Unit tests verify individual pieces of code in isolation.
- Integration tests check how components or services work together.
- End-to-end tests validate complete user workflows across the system.
A balanced test suite uses all three types to catch issues early, verify integration points, and ensure the system behaves correctly from the user’s perspective. Automated testing supports confidence in deploying microservices frequently and safely.
9.4 Canary and Blue-Green Deployments in CI/CD Pipelines
In modern CI/CD pipelines, deploying new versions of microservices without downtime or user disruption is crucial. Canary and Blue-Green deployments are two strategies designed to achieve this goal by controlling how new code reaches production.
Canary Deployments
Canary deployments roll out a new version of a service to a small subset of users before gradually increasing the exposure. This approach helps detect issues early without impacting the entire user base.
Key steps in a Canary deployment:
- Deploy the new version alongside the current stable version.
- Route a small percentage of traffic to the new version.
- Monitor metrics and logs for errors or performance degradation.
- Gradually increase traffic to the new version if no issues arise.
- Fully switch over once confidence is established.
Example:
Imagine a microservice orders-service running version 1.0. You want to deploy version 1.1.
- Deploy
orders-service:1.1alongsideorders-service:1.0in Kubernetes. - Use Istio’s VirtualService to route 5% of traffic to version 1.1 and 95% to 1.0.
- Monitor error rates and latency.
- If stable, increase traffic to 25%, then 50%, and so on.
- When 100% traffic is on 1.1, decommission 1.0.
Mind map for Canary Deployment:
Blue-Green Deployments
Blue-Green deployments maintain two identical environments: one active (Blue) and one idle (Green). The new version is deployed to the idle environment, tested, and then traffic is switched over atomically.
Key steps in a Blue-Green deployment:
- Prepare the Green environment with the new version.
- Run integration and smoke tests on Green.
- Switch traffic from Blue to Green with minimal downtime.
- Keep Blue environment intact for quick rollback.
Example:
Suppose payment-service is running in the Blue environment.
- Deploy
payment-service:2.0to the Green environment. - Run automated tests to verify functionality.
- Update Kubernetes Service or Ingress to point to Green.
- Monitor the system.
- If issues occur, switch back to Blue.
Mind map for Blue-Green Deployment:
Integrating Canary and Blue-Green into CI/CD Pipelines
Both deployment strategies can be automated within CI/CD pipelines using tools like Jenkins, Argo CD, or GitLab CI.
Pipeline stages might include:
- Build: Compile and package the microservice.
- Test: Run unit and integration tests.
- Deploy:
- For Canary: Deploy new version alongside existing.
- For Blue-Green: Deploy to idle environment.
- Traffic Shift: Adjust routing rules (e.g., Istio VirtualService or Kubernetes Service selectors).
- Monitor: Automated checks on metrics and logs.
- Promotion or Rollback: Based on monitoring results.
Example Jenkinsfile snippet for Canary traffic shifting:
stage('Deploy Canary') {
  steps {
    sh 'kubectl apply -f deployment-v1.1.yaml'
    sh 'kubectl apply -f canary-virtualservice.yaml' // routes 5% traffic
  }
}

stage('Increase Traffic') {
  steps {
    sh 'kubectl apply -f canary-virtualservice-25.yaml' // routes 25% traffic
  }
}

stage('Promote Canary') {
  steps {
    sh 'kubectl apply -f virtualservice-full.yaml' // routes 100% traffic
    sh 'kubectl delete -f deployment-v1.0.yaml'
  }
}
Mind map for CI/CD Pipeline with Canary:
Mind map for CI/CD Pipeline with Blue-Green:
Best Practices
- Automate monitoring and rollback triggers to avoid manual delays.
- Use feature flags in conjunction with deployments for finer control.
- Keep deployment manifests versioned and parameterized.
- Test rollback procedures regularly.
- Use service mesh capabilities to simplify traffic routing.
Both Canary and Blue-Green deployments reduce risk during releases but have trade-offs. Canary allows gradual exposure but requires careful monitoring. Blue-Green offers instant rollback but needs double infrastructure. Choosing between them depends on your environment, traffic patterns, and risk tolerance.
In CI/CD pipelines, embedding these deployment strategies ensures safer, more controlled rollouts, improving overall system reliability.
9.5 Hands-On Example: Building a CI/CD Pipeline with Jenkins and Argo CD
In this section, we’ll build a practical CI/CD pipeline that integrates Jenkins for continuous integration and Argo CD for continuous deployment on Kubernetes. This pipeline will automate building, testing, and deploying a microservice, demonstrating how these tools complement each other.
Overview of the Pipeline
The pipeline consists of two main stages:
- Continuous Integration (CI) with Jenkins: Code is built, tested, and container images are pushed to a registry.
- Continuous Deployment (CD) with Argo CD: Kubernetes manifests are updated and deployed to the cluster.
Mind Map: CI/CD Pipeline with Jenkins and Argo CD
Step 1: Setting Up Jenkins Pipeline
Jenkinsfile example for a microservice:
pipeline {
  agent any
  environment {
    REGISTRY = 'myregistry.io'
    IMAGE_NAME = 'my-microservice'
    GIT_REPO = '[email protected]:example/microservice.git'
    K8S_MANIFESTS_PATH = 'k8s/'
  }
  stages {
    stage('Checkout') {
      steps {
        git url: env.GIT_REPO, credentialsId: 'git-ssh-key'
      }
    }
    stage('Build') {
      steps {
        script {
          docker.build("${REGISTRY}/${IMAGE_NAME}:${env.BUILD_NUMBER}")
        }
      }
    }
    stage('Test') {
      steps {
        sh 'make test'
      }
    }
    stage('Push Image') {
      steps {
        script {
          docker.withRegistry("https://${REGISTRY}", 'docker-credentials') {
            docker.image("${REGISTRY}/${IMAGE_NAME}:${env.BUILD_NUMBER}").push()
          }
        }
      }
    }
    stage('Update Manifests') {
      steps {
        script {
          sh "sed -i 's|image: .*|image: ${REGISTRY}/${IMAGE_NAME}:${env.BUILD_NUMBER}|' ${K8S_MANIFESTS_PATH}/deployment.yaml"
          sh "git config user.email '[email protected]'"
          sh "git config user.name 'Jenkins CI'"
          sh "git add ${K8S_MANIFESTS_PATH}/deployment.yaml"
          sh "git commit -m 'Update image tag to ${env.BUILD_NUMBER}'"
          sh "git push origin main"
        }
      }
    }
  }
}
Explanation:
- The pipeline checks out the source code.
- Builds a Docker image tagged with the Jenkins build number.
- Runs tests using a Makefile target.
- Pushes the image to a Docker registry.
- Updates the Kubernetes deployment manifest with the new image tag.
- Commits and pushes the updated manifest back to the Git repository.
Step 2: Configuring Argo CD for Continuous Deployment
Argo CD watches the Git repository for changes in the Kubernetes manifests. When Jenkins pushes an updated manifest, Argo CD detects it and syncs the changes to the cluster.
Mind Map: Argo CD Deployment Flow
Key points:
- Argo CD is configured with the Git repository URL and the path to manifests.
- It runs in the Kubernetes cluster and uses Kubernetes API to apply changes.
- Sync status and health are visible via Argo CD UI or CLI.
Step 3: Kubernetes Deployment Manifest Example
A simple deployment.yaml snippet:
apiVersion: apps/v1
kind: Deployment
metadata:
  name: my-microservice
spec:
  replicas: 3
  selector:
    matchLabels:
      app: my-microservice
  template:
    metadata:
      labels:
        app: my-microservice
    spec:
      containers:
      - name: my-microservice
        image: myregistry.io/my-microservice:1.0.0 # This line is updated by Jenkins
        ports:
        - containerPort: 8080
The Jenkins pipeline updates the image tag dynamically to match the build number.
Step 4: Putting It All Together
- Developer pushes code to the Git repository.
- Jenkins triggers the pipeline:
- Builds and tests the application.
- Pushes the Docker image to the registry.
- Updates the Kubernetes manifest with the new image tag.
- Commits and pushes the manifest changes.
- Argo CD detects the manifest update and applies it to the Kubernetes cluster.
- Kubernetes rolls out the updated deployment.
- Argo CD reports the sync status.
Troubleshooting Tips
- Jenkins fails to push manifest changes: Ensure Jenkins has write access to the Git repository.
- Argo CD does not sync: Check repository URL, credentials, and manifest path.
- Deployment stuck: Inspect Kubernetes rollout status with
kubectl rollout status deployment/my-microservice. - Image pull errors: Verify image tag exists in the registry and Kubernetes has access.
This example demonstrates a clear separation of concerns: Jenkins handles building and testing, while Argo CD manages deployment. This approach leverages GitOps principles, making deployments auditable and reproducible.
10. Scaling and Performance Optimization
10.1 Horizontal and Vertical Pod Autoscaling in Kubernetes
Kubernetes offers two primary mechanisms to automatically adjust the resources allocated to your workloads: Horizontal Pod Autoscaling (HPA) and Vertical Pod Autoscaling (VPA). Both aim to maintain application performance and resource efficiency, but they approach the problem differently.
Horizontal Pod Autoscaling (HPA)
HPA adjusts the number of pod replicas based on observed metrics like CPU utilization, memory usage, or custom metrics. It’s about scaling out (or in) by adding or removing pod instances.
How HPA works:
- Kubernetes monitors the specified metric(s) for each pod.
- When the average metric crosses a defined threshold, HPA increases or decreases the number of pods.
- The controller periodically checks metrics and adjusts replicas accordingly.
Example:
Imagine a backend service with a deployment of 3 pods. You set an HPA to maintain CPU utilization at 50%. If CPU usage rises to 80%, HPA will increase the pod count to distribute the load.
Basic HPA YAML snippet:
apiVersion: autoscaling/v2
kind: HorizontalPodAutoscaler
metadata:
  name: example-hpa
spec:
  scaleTargetRef:
    apiVersion: apps/v1
    kind: Deployment
    name: example-deployment
  minReplicas: 2
  maxReplicas: 10
  metrics:
  - type: Resource
    resource:
      name: cpu
      target:
        type: Utilization
        averageUtilization: 50
Mind map for HPA:
Vertical Pod Autoscaling (VPA)
VPA adjusts the resource requests and limits (CPU and memory) of individual pods rather than the number of pods. It’s about scaling up or down the resources assigned to each pod.
How VPA works:
- VPA monitors resource usage over time.
- It recommends or automatically applies updated resource requests and limits.
- Pods may be restarted to apply new resource configurations.
Example:
Suppose a microservice pod initially requests 200m CPU and 256Mi memory. Over time, it consistently uses more CPU, causing throttling. VPA can increase the CPU request to 400m to match actual usage.
Basic VPA YAML snippet:
apiVersion: autoscaling.k8s.io/v1
kind: VerticalPodAutoscaler
metadata:
  name: example-vpa
spec:
  targetRef:
    apiVersion: "apps/v1"
    kind: Deployment
    name: example-deployment
  updatePolicy:
    updateMode: "Auto"
Mind map for VPA:

Comparing HPA and VPA
| Aspect | Horizontal Pod Autoscaler (HPA) | Vertical Pod Autoscaler (VPA) |
|---|---|---|
| What scales | Number of pods | CPU and memory requests of pods |
| Use case | Variable workload with fluctuating traffic | Workloads with changing resource needs |
| Pod restarts needed? | No | Yes, to apply new resource requests |
| Typical metrics | CPU, memory, custom application metrics | Resource usage over time |
| Impact on architecture | Scales out/in horizontally | Adjusts resource allocation per pod |
Combining HPA and VPA
You can use HPA and VPA together, but with care. VPA adjusts pod resource requests, which affects the metrics HPA uses to scale pods. To avoid conflicts:
- Configure VPA in “recommendation” mode only when using HPA.
- Alternatively, use HPA for CPU-based scaling and VPA for memory adjustments.
Practical Example: Autoscaling a Web Service
- Deploy a web service with initial resource requests:
resources:
  requests:
    cpu: 200m
    memory: 256Mi
  limits:
    cpu: 500m
    memory: 512Mi
-
Set up HPA to maintain CPU utilization at 60%, with min 2 and max 5 replicas.
-
Set up VPA in recommendation mode to monitor resource usage and suggest adjustments.
-
Monitor metrics and observe:
- When traffic spikes, HPA adds pods.
- If pods consistently use more CPU or memory, VPA suggests increasing requests.
-
Apply VPA recommendations manually or enable auto-update with pod restarts during maintenance windows.
Autoscaling in Kubernetes is a powerful tool to balance performance and cost. Horizontal scaling handles fluctuating load by adding or removing pods, while vertical scaling fine-tunes resource allocation per pod. Understanding when and how to use each helps maintain a responsive and efficient microservices environment.
10.2 Optimizing Resource Requests and Limits for Microservices
In Kubernetes, resource requests and limits are essential knobs to tune for running microservices efficiently. They define how much CPU and memory a container is guaranteed to get (requests) and the maximum it can consume (limits). Getting these settings right avoids resource contention, prevents wasted capacity, and helps maintain cluster stability.
Why Optimize Resource Requests and Limits?
- Prevent Overcommitment: Setting requests too low can cause pods to compete for CPU and memory, leading to throttling or OOM (Out Of Memory) kills.
- Avoid Wasted Resources: Overestimating requests means reserving more resources than needed, reducing cluster utilization.
- Improve Scheduling: Kubernetes uses requests to decide where to place pods. Accurate requests help the scheduler make better decisions.
- Control Burst Behavior: Limits cap resource usage, preventing a single pod from starving others.
Key Concepts
- CPU requests: The amount of CPU guaranteed to the container. Measured in cores or millicores (1000m = 1 core).
- Memory requests: The amount of RAM guaranteed. Measured in bytes (e.g., MiB, GiB).
- CPU limits: The maximum CPU the container can use. If exceeded, the container is throttled.
- Memory limits: The maximum RAM usage. If exceeded, the container is terminated.
Pod Quality of Service (QoS) Classes
Kubernetes assigns QoS classes based on requests and limits:
- Guaranteed: Requests and limits are equal for all resources.
- Burstable: Requests are less than limits.
- BestEffort: No requests or limits set.
QoS affects eviction priority during resource pressure. Guaranteed pods are least likely to be evicted.
Practical Example: Setting Requests and Limits
Imagine a microservice that processes images. It typically uses 500m CPU and 256Mi memory but can spike to 1 CPU and 512Mi memory during peak loads.
apiVersion: v1
kind: Pod
metadata:
  name: image-processor
spec:
  containers:
  - name: processor
    image: image-processor:latest
    resources:
      requests:
        cpu: "500m"
        memory: "256Mi"
      limits:
        cpu: "1"
        memory: "512Mi"
This configuration ensures the pod gets at least 500m CPU and 256Mi memory, but can burst up to 1 CPU and 512Mi memory when needed.
How to Determine Appropriate Values
- Measure baseline usage: Use monitoring tools like Prometheus or Kubernetes metrics server to observe actual CPU and memory consumption.
- Analyze peak usage: Identify spikes and their duration.
- Set requests near baseline: Requests should cover typical usage to avoid throttling.
- Set limits near peak: Limits cap resource usage during bursts.
- Iterate: Adjust values based on observed behavior.
Mind Map: Steps to Optimize Resource Settings
Common Pitfalls
- Setting requests too low: Causes pod eviction or throttling.
- Setting limits too high or unlimited: Can lead to noisy neighbors consuming excessive resources.
- Requests higher than actual usage: Wastes cluster capacity.
- Ignoring memory limits: Can cause pods to be killed unexpectedly.
Example: Adjusting Requests and Limits Based on Metrics
Suppose monitoring shows the image processor uses 400m CPU and 200Mi memory on average, with spikes up to 900m CPU and 480Mi memory.
Adjust requests and limits accordingly:
resources:
  requests:
    cpu: "400m"
    memory: "200Mi"
  limits:
    cpu: "900m"
    memory: "480Mi"
This reduces reserved resources, freeing capacity for other pods, while still allowing bursts.
Tips for Microservices
- Profile each microservice independently; usage patterns vary widely.
- Use horizontal pod autoscaling (HPA) alongside resource tuning for better scalability.
- Avoid setting identical requests and limits for all services without data.
- Consider QoS class implications when setting requests and limits.
Summary
Optimizing resource requests and limits is a balancing act. It requires measurement, adjustment, and monitoring. Proper settings improve cluster utilization, pod stability, and overall system performance. Start with data, set conservative values, then refine as you gather more insights.
10.3 Load Testing Microservices with Practical Tools and Examples
Load testing microservices means simulating real-world traffic to understand how your services perform under stress. It helps identify bottlenecks, capacity limits, and failure points before they affect users. Because microservices are distributed and often communicate over the network, load testing requires a thoughtful approach to cover individual services and their interactions.
Key Objectives of Load Testing Microservices
- Measure throughput and latency under different load conditions.
- Identify resource saturation points (CPU, memory, network).
- Validate autoscaling and resilience mechanisms.
- Detect cascading failures in service dependencies.
Mind Map: Load Testing Microservices
Step 1: Define the Test Scope
Start by deciding what you want to test. Are you focusing on a single microservice or a chain of services? For example, testing just the user authentication service differs from testing the entire order processing workflow.
Example: If you want to test the payment service, isolate it and simulate requests that mimic real payment transactions. If testing the whole checkout flow, include calls to inventory, payment, and notification services.
Step 2: Select Load Testing Tools
Several open-source tools fit well with Kubernetes and microservices:
- Locust: Python-based, easy to write custom user behavior.
- k6: JavaScript-based, good for scripting and cloud-native integration.
- JMeter: GUI-based, supports complex scenarios but heavier.
- Fortio: Lightweight, integrates with Istio service mesh for latency and load testing.
Example: Use Locust to simulate 1000 concurrent users hitting the authentication endpoint with randomized login data.
Step 3: Design Test Scenarios
Design scenarios that reflect real usage patterns:
- Steady Load: Constant number of requests per second.
- Spike Load: Sudden increase in traffic.
- Stress Test: Push beyond expected peak to find breaking points.
- Soak Test: Long-duration test to detect memory leaks or degradation.
Example: For a spike test, ramp up from 100 to 1000 requests per second over 2 minutes and hold for 5 minutes.
Step 4: Execute Tests and Monitor
Deploy load generators either inside or outside the Kubernetes cluster. While tests run, monitor:
- Service response times and error rates.
- CPU, memory, and network usage on pods.
- Kubernetes autoscaling events.
- Service mesh telemetry if available.
Example: Run k6 from a pod inside the cluster targeting the product catalog service, while Prometheus collects metrics.
Step 5: Analyze Results
Look for:
- Latency percentiles (p50, p95, p99).
- Error spikes or timeouts.
- Resource exhaustion signs.
- Whether autoscaling kicked in timely.
Example: A p99 latency spike during a stress test might indicate a database connection pool limit.
Step 6: Optimize and Repeat
Based on findings, optimize code, tune Kubernetes resource requests/limits, or adjust autoscaling policies. Then rerun tests to verify improvements.
Practical Example: Load Testing a User Profile Service with Locust
- Write a Locustfile: Define user behavior to GET and POST user profiles.
from locust import HttpUser, task, between

class UserProfileUser(HttpUser):
    wait_time = between(1, 3)

    @task(3)
    def get_profile(self):
        self.client.get('/api/profile')

    @task(1)
    def update_profile(self):
        self.client.post('/api/profile', json={"name": "Test User", "email": "[email protected]"})
-
Deploy Locust: Run Locust in a pod inside the Kubernetes cluster.
-
Run Test: Start with 50 users, ramp to 200 over 5 minutes.
-
Monitor: Use Prometheus and Grafana dashboards to watch CPU, memory, and response times.
-
Analyze: Check for error rates and latency spikes.
-
Adjust: If latency is high, consider increasing pod replicas or optimizing database queries.
Mind Map: Locust Load Test Workflow
Additional Notes
- Load testing should be part of your CI/CD or staging environment, not production.
- Consider network latency and cluster resource limits when interpreting results.
- Use service mesh telemetry to correlate load test results with service-to-service communication patterns.
By following these steps and examples, you can build a solid foundation for load testing your microservices, ensuring they handle real-world traffic gracefully.
10.4 Using Service Mesh for Performance Monitoring and Optimization
Service meshes like Istio or Linkerd provide more than just secure communication and traffic routing; they also offer built-in telemetry that can be crucial for monitoring and optimizing microservices performance. This section explains how to leverage these capabilities effectively.
Understanding Service Mesh Telemetry Components
Service mesh telemetry typically includes metrics, logs, and traces collected from the sidecar proxies deployed alongside each microservice instance. These proxies intercept all inbound and outbound traffic, allowing the mesh to gather detailed data without modifying application code.
Here’s a simple mind map to visualize the telemetry data flow:
Metrics Collection and Analysis
Service meshes expose metrics in formats compatible with Prometheus. Common metrics include request duration, success/failure counts, and connection statistics. These metrics help identify slow endpoints, error spikes, or resource bottlenecks.
Example:
Suppose your “order” microservice is experiencing increased latency. By querying the Istio metrics, you find that the 99th percentile latency for the /create endpoint has jumped from 200ms to 800ms over the last hour. This points to a potential performance issue localized to that endpoint.
You can then drill down to see if the latency is due to downstream calls by examining distributed traces.
Distributed Tracing for Root Cause Analysis
Service mesh integrates with tracing systems like Jaeger or Zipkin. Each request passing through the mesh is assigned a trace ID, and spans are created for each hop.
Example:
Tracing reveals that the delay in the /create endpoint is caused by a slow database query in the inventory microservice. This insight directs optimization efforts to the database layer rather than the order service itself.
Using Service Mesh Dashboards
Many service meshes come with dashboards that visualize telemetry data. These dashboards show service-to-service latency, error rates, and traffic volumes.
By monitoring these visualizations, engineers can spot anomalies like sudden latency spikes or increased error rates and respond quickly.
Performance Optimization Techniques Enabled by Service Mesh Data
-
Traffic Shaping: Use telemetry data to implement weighted routing, diverting traffic away from underperforming instances.
-
Circuit Breaking: Configure circuit breakers based on error rate metrics to prevent cascading failures.
-
Retry Policies: Adjust retry attempts and timeouts informed by observed latency and failure patterns.
-
Load Balancing: Choose load balancing strategies (round-robin, least connections) based on real-time performance metrics.
-
Resource Allocation: Identify services with high resource consumption and adjust Kubernetes resource requests and limits accordingly.
Example: Optimizing a Slow Microservice
Imagine your payment microservice is slow during peak hours. Using the service mesh metrics, you notice a high error rate and increased latency. Tracing shows retries caused by transient network failures.
You update the retry policy to reduce retries and add a circuit breaker to fail fast when the service is overwhelmed. After applying these changes, the latency decreases, and error rates stabilize.
Summary Mind Map
Using service mesh telemetry effectively means treating it as a continuous feedback loop. Collect data, analyze it, apply changes, and observe the impact. This cycle helps maintain microservices that perform well under varying conditions without requiring intrusive instrumentation or complex code changes.
10.5 Case Study: Scaling a Microservice Under High Load
Scaling a microservice effectively requires a clear understanding of the workload, resource constraints, and the Kubernetes environment. This case study walks through scaling a payment processing microservice that experienced high traffic during peak hours.
Initial Situation
The payment service was deployed on Kubernetes with a single replica. During peak times, response times increased, and some requests timed out. Logs showed CPU saturation and occasional memory pressure.
Step 1: Identify Bottlenecks
- CPU and Memory Usage: Monitored using Prometheus metrics.
- Request Latency: Traced with Jaeger to pinpoint slow operations.
- Pod Resource Limits: Checked current CPU and memory requests and limits.
Step 2: Adjust Resource Requests and Limits
The initial pod spec had low CPU requests (100m) and limits (200m). Increasing these to 500m and 1 CPU respectively allowed the pod to handle more load without throttling.
Example snippet of updated pod resource configuration:
resources:
  requests:
    cpu: "500m"
    memory: "512Mi"
  limits:
    cpu: "1"
    memory: "1Gi"
Step 3: Enable Horizontal Pod Autoscaler (HPA)
Configured HPA to scale pods based on CPU utilization:
apiVersion: autoscaling/v2
kind: HorizontalPodAutoscaler
metadata:
  name: payment-service-hpa
spec:
  scaleTargetRef:
    apiVersion: apps/v1
    kind: Deployment
    name: payment-service
  minReplicas: 2
  maxReplicas: 10
  metrics:
  - type: Resource
    resource:
      name: cpu
      target:
        type: Utilization
        averageUtilization: 60
This setup ensures that when CPU usage exceeds 60%, Kubernetes adds more pods, up to 10.
Step 4: Load Testing
Simulated traffic using a load testing tool to verify scaling behavior. Observed the following:
- CPU usage per pod stabilized around 50-60%.
- Response times remained consistent under increased load.
- New pods spun up automatically as load increased.
Step 5: Optimize Application Performance
Tracing revealed that database calls were the main latency contributor. Implemented connection pooling and query optimization, reducing average request duration by 30%.
Step 6: Use Service Mesh for Traffic Control
Configured Istio to implement circuit breaking and retries to improve resilience under load:
apiVersion: networking.istio.io/v1alpha3
kind: DestinationRule
metadata:
  name: payment-service-circuit-breaker
spec:
  host: payment-service
  trafficPolicy:
    connectionPool:
      tcp:
        maxConnections: 100
      http:
        http1MaxPendingRequests: 50
        maxRequestsPerConnection: 10
    outlierDetection:
      consecutiveErrors: 5
      interval: 10s
      baseEjectionTime: 30s
      maxEjectionPercent: 50
This configuration prevents cascading failures by limiting connections and ejecting unhealthy pods temporarily.
Step 7: Monitor and Iterate
Continued monitoring with Prometheus and Grafana dashboards to track CPU, memory, latency, and pod counts. Adjusted HPA thresholds and resource limits based on observed patterns.
Summary
Scaling the payment microservice involved a combination of Kubernetes resource tuning, autoscaling configuration, application optimization, and service mesh traffic policies. Each step relied on clear metrics and tracing data to guide decisions. The result was a stable service capable of handling peak loads with consistent performance.
11. Troubleshooting and Debugging Microservices in Kubernetes
11.1 Common Microservices Issues and How to Identify Them
Microservices bring flexibility and scalability, but they also introduce complexity. Identifying issues early helps maintain system health and reduce downtime. Here’s a breakdown of common problems and how to spot them.
Service Communication Failures
Microservices rely heavily on network communication. Failures here can cause cascading problems.
- Symptoms: Timeouts, connection refused errors, or unexpected HTTP status codes (e.g., 503 Service Unavailable).
- How to Identify: Check service logs for connection errors, monitor network latency, and use distributed tracing to see where calls fail.
Example: A payment service calls an inventory service but gets a 504 Gateway Timeout. Tracing reveals the inventory service is overloaded and slow to respond.
Data Consistency Problems
Microservices often own their own databases, which can lead to eventual consistency challenges.
- Symptoms: Conflicting data states, stale reads, or missing updates.
- How to Identify: Monitor data synchronization jobs, audit logs for missing transactions, and use versioning or timestamps to detect stale data.
Example: An order service shows an order as confirmed, but the shipping service has no record of it due to a delayed event message.
Service Discovery and Load Balancing Failures
If microservices cannot find or properly balance traffic to other services, requests fail or degrade.
- Symptoms: 404 errors, uneven load distribution, or service unavailability.
- How to Identify: Inspect service registry health, verify DNS resolution, and check load balancer metrics.
Example: After scaling down, some service instances remain in the registry, causing traffic to be routed to terminated pods.
Resource Exhaustion
Microservices running on Kubernetes can suffer from CPU, memory, or disk exhaustion.
- Symptoms: Pod restarts, OOMKilled errors, slow response times.
- How to Identify: Use Kubernetes metrics to monitor resource usage, check pod events for OOMKilled, and analyze logs for garbage collection or memory leaks.
Example: A logging microservice crashes repeatedly due to unbounded memory growth caused by a bug in log buffering.
Configuration and Version Mismatches
Different microservices or their dependencies may run incompatible versions or configurations.
- Symptoms: Unexpected errors, failed API calls, or feature mismatches.
- How to Identify: Track deployed versions, validate configuration files, and use compatibility tests.
Example: A frontend service calls a backend API that has been updated to a new version, but the frontend still uses the old API contract, causing JSON parsing errors.
Security Misconfigurations
Misconfigured authentication, authorization, or network policies can expose services or block legitimate traffic.
- Symptoms: Unauthorized access, denied requests, or audit failures.
- How to Identify: Review RBAC roles, network policies, and service mesh security settings.
Example: A service mesh policy accidentally blocks traffic between two critical microservices, causing failures in user authentication.
Latency and Performance Bottlenecks
Slow responses can degrade user experience and cause timeouts.
- Symptoms: High response times, timeouts, or slow database queries.
- How to Identify: Use distributed tracing, monitor latency metrics, and profile service code.
Example: An analytics microservice makes synchronous calls to a slow external API, causing request queues to build up.
By keeping an eye on these common issues and using logs, metrics, and tracing data, you can pinpoint problems quickly and keep your microservices running smoothly.
11.2 Using Kubernetes Native Tools: kubectl, logs, and exec
Kubernetes provides a set of native command-line tools that are essential for troubleshooting and managing your microservices. Among these, kubectl is the primary interface to interact with your cluster, while commands like logs and exec help you inspect runtime behavior and debug issues directly inside your pods.
Understanding kubectl
kubectl is the Swiss Army knife for Kubernetes. It lets you query cluster resources, modify configurations, and inspect the state of your applications. Here’s a basic mind map to organize its core functions:
Example: Listing Pods
kubectl get pods
This command lists all pods in the current namespace, showing their status, restarts, and age. Adding -n <namespace> targets a specific namespace.
Inspecting Logs with kubectl logs
Logs are the first place to look when something goes wrong. kubectl logs fetches logs from containers inside pods.
Basic Usage
kubectl logs <pod-name>
If a pod has multiple containers, specify the container name:
kubectl logs <pod-name> -c <container-name>
Tail and Follow Logs
To stream logs in real time, use the -f flag:
kubectl logs -f <pod-name>
To limit the number of log lines, use --tail:
kubectl logs --tail=100 <pod-name>
Mind Map for Logs
Example: Viewing Previous Logs
If a pod crashed and restarted, you can view logs from the previous instance:
kubectl logs <pod-name> --previous
Running Commands Inside Pods with kubectl exec
Sometimes logs aren’t enough. You may want to peek inside a running container to inspect files, check environment variables, or run diagnostic commands.
Basic Usage
kubectl exec -it <pod-name> -- /bin/sh
The -it flags allocate a terminal and keep it interactive. The command after -- is what runs inside the container. Use /bin/bash if available.
Mind Map for Exec
Example: Running a Single Command
To list files in a container’s directory:
kubectl exec <pod-name> -- ls /app
Example: Specifying Container in Multi-Container Pod
kubectl exec -it <pod-name> -c <container-name> -- /bin/sh
Combining Tools for Troubleshooting
Often, you’ll use these commands together. For example, if a pod is crashing:
- Check pod status:
kubectl get pods
- Describe the pod for events and reasons:
kubectl describe pod <pod-name>
- View logs to identify errors:
kubectl logs <pod-name>
- If logs aren’t clear, exec into the pod to inspect:
kubectl exec -it <pod-name> -- /bin/sh
Inside the pod, you can check configuration files, environment variables, or run network commands like curl or ping.
Practical Example: Debugging a CrashLoopBackOff
Imagine a pod stuck in CrashLoopBackOff. First, list pods:
kubectl get pods
You see the pod restarting repeatedly. Next, describe it:
kubectl describe pod <pod-name>
You find an event indicating a failed liveness probe. Check logs:
kubectl logs <pod-name>
Logs show a missing configuration file error. To confirm, exec into the pod:
kubectl exec -it <pod-name> -- /bin/sh
Inside, you verify the file is indeed missing. This points to a deployment or config issue.
Summary
kubectl getandkubectl describeprovide status and event information.kubectl logslets you read container output, with options to follow or view previous logs.kubectl execopens a shell or runs commands inside containers for deeper inspection.
Mastering these commands is fundamental for effective Kubernetes troubleshooting and management.
11.3 Debugging Service Mesh Traffic with Istio Tools
Istio adds a layer of complexity to microservices traffic by introducing proxies, policies, and telemetry. When traffic doesn’t flow as expected, you need tools that help you see inside this mesh. Istio provides several command-line utilities and dashboards to inspect, trace, and debug service-to-service communication.
Mind Map: Key Istio Debugging Tools
Inspecting Proxy Status with istioctl proxy-status
Each pod in your mesh runs an Envoy sidecar proxy. These proxies maintain configuration pushed from Istio control plane components. If proxies are out of sync, traffic may not route correctly.
Run:
istioctl proxy-status
This command lists all sidecars and their synchronization status with the control plane. Look for any proxies marked as STALE or NOT SENT. For example:
NAME                                   CDS        LDS        EDS        RDS          ISTIOD
productpage-v1-5d9f4d5b7f-abcde       SYNCED     SYNCED     SYNCED     SYNCED       SYNCED
reviews-v1-6c7d9f4b7f-fghij           STALE      SYNCED     SYNCED     SYNCED       SYNCED
Here, the reviews-v1 proxy has stale Cluster Discovery Service (CDS) config, which could cause routing issues.
Examining Proxy Configuration with istioctl proxy-config
To understand how a proxy routes traffic, inspect its configuration.
Example: Check listeners on a pod
istioctl proxy-config listeners reviews-v1-6c7d9f4b7f-fghij
This shows ports and protocols the proxy listens on. If your service expects traffic on port 9080 but the listener is missing, requests won’t reach the app.
You can also check routes:
istioctl proxy-config routes reviews-v1-6c7d9f4b7f-fghij
Look for route rules, virtual services, and destination rules applied. Missing or misconfigured routes often cause 404 errors or traffic going to unexpected versions.
Analyzing Configuration Issues with istioctl analyze
Istio can detect common misconfigurations or conflicts.
Run:
istioctl analyze
This scans your cluster for invalid or conflicting Istio resources. For example, it might warn about overlapping virtual service hosts or missing destination rules.
Example output:
Warning [IST0102] (VirtualService default reviews): Host 'reviews.default.svc.cluster.local' is not found in any DestinationRule.
This points to a missing destination rule, which can cause routing failures.
Visualizing Traffic with Kiali
Kiali provides a graphical interface to see service relationships and traffic flow.
- Service Graph: Shows services as nodes and traffic as edges. Look for unexpected gaps or missing edges indicating broken communication.
- Traffic Metrics: Displays request rates, error rates, and latencies.
- Tracing Integration: Links to Jaeger traces for detailed request paths.
For example, if the reviews service shows zero inbound traffic despite calls from productpage, Kiali can confirm the absence of traffic and help pinpoint where it stops.
Distributed Tracing with Jaeger
Tracing lets you follow a request through multiple services and proxies.
- Identify high-latency calls or failed requests.
- See retries, time spent in each service, and errors.
Example: A trace might reveal that requests to reviews are timing out at the Envoy proxy, indicating network or policy issues rather than the application itself.
Using Envoy Access Logs
Envoy proxies log every request and response.
Enable access logs in your Istio configuration or check existing logs:
kubectl logs <pod-name> -c istio-proxy
Look for HTTP status codes, request paths, and response times. Frequent 503 errors may indicate upstream service unavailability or misconfigured destination rules.
Example log snippet:
[2026-02-01T12:00:00.000Z] "GET /reviews HTTP/1.1" 503 NR - "-" "curl/7.68.0" x-envoy-upstream-service-time: 0
Here, 503 NR means no healthy upstream was found.
Summary
When debugging Istio service mesh traffic:
- Start with
istioctl proxy-statusto check proxy sync. - Use
istioctl proxy-configto inspect proxy listeners and routes. - Run
istioctl analyzefor config issues. - Visualize traffic and errors with Kiali.
- Trace requests end-to-end with Jaeger.
- Review Envoy access logs for request-level details.
Combining these tools helps isolate whether issues stem from configuration, network, or application errors. Each tool offers a different perspective, and together they provide a comprehensive view of service mesh traffic.
11.4 Leveraging Observability Data for Root Cause Analysis
Leveraging observability data for root cause analysis (RCA) means using metrics, logs, and traces to pinpoint the exact source of a problem in a microservices environment. When a service misbehaves, the challenge is not just to notice it but to understand why it’s happening and where. Observability data provides the clues needed to connect symptoms to causes.
Understanding the Data Sources
- Metrics offer quantitative measurements over time, such as request rates, error rates, and latency.
- Logs provide detailed, timestamped records of events and errors within services.
- Traces show the path of a request as it moves through multiple services, revealing timing and dependencies.
Each data type complements the others. Metrics can signal a problem, logs can explain what happened, and traces can show where it happened.
Mind Map: Observability Data for Root Cause Analysis
Step-by-Step Example
Imagine a microservice handling user authentication suddenly starts returning 500 errors. Here’s how to use observability data to find the root cause:
-
Check Metrics: Look at the error rate metric for the authentication service. A spike confirms the problem is real and recent.
-
Analyze Latency: Is latency also increasing? If yes, it suggests the service is struggling rather than just failing fast.
-
Review Logs: Search logs around the error spike for exceptions or error messages. Suppose you find repeated “database connection timeout” errors.
-
Trace Requests: Use distributed tracing to follow authentication requests. You notice that calls to the user database service are slow or failing.
-
Drill Down: Check the database service’s metrics and logs. They reveal resource exhaustion due to a recent configuration change.
-
Confirm and Fix: Roll back the configuration or increase resources, then monitor metrics to ensure recovery.
Mind Map: Root Cause Analysis Workflow

Practical Tips
- Correlate timestamps: Align metrics spikes with log entries and trace spans to build a timeline.
- Filter noise: Focus on error logs and slow traces; ignore routine info-level logs.
- Use tags and labels: Kubernetes labels and service mesh metadata help filter observability data by service, version, or environment.
- Automate alerts: Set thresholds on key metrics to get early warnings before failures cascade.
Example: Using Prometheus and Jaeger
- Prometheus alerts on a 5xx error rate above 5%.
- Upon alert, query Prometheus for latency and throughput trends.
- Use Jaeger to trace a failed request, revealing a timeout in a downstream payment service.
- Check payment service logs for database connection errors.
This approach narrows down the root cause from a broad symptom to a specific failing component.
Summary
Root cause analysis with observability data is a detective process. Metrics raise the alarm, logs provide the story, and traces map the journey. Combining these data points systematically leads to faster, more accurate problem resolution in cloud native microservices.
11.5 Practical Debugging Walkthrough: Resolving Latency Issues
Latency in microservices can be a tricky beast. It sneaks in through network delays, inefficient code, or misconfigured infrastructure. This walkthrough will guide you through a systematic approach to identify and fix latency problems in a Kubernetes microservices environment, using service mesh telemetry and native Kubernetes tools.
Step 1: Confirm the Latency Problem
Start by verifying the latency symptoms. Is it user-facing or internal? Use Prometheus metrics or your service mesh telemetry to check response time histograms and percentiles.
Example:
kubectl get --raw "/apis/custom.metrics.k8s.io/v1beta1/namespaces/default/pods/*/http_request_duration_seconds"
Or query Prometheus:
histogram_quantile(0.95, sum(rate(http_request_duration_seconds_bucket[5m])) by (le, service))
If the 95th percentile latency for a service is higher than usual, you have a candidate.
Step 2: Narrow Down the Scope
Identify which microservice or API endpoint is slow. Use distributed tracing (e.g., Jaeger) to visualize request flows and pinpoint where time is spent.
Example:
Open Jaeger UI and search for traces with high duration. Look at the waterfall view to see which spans take the longest. For instance, if Service A calls Service B and Service B’s processing is slow, the problem lies there.
Step 3: Inspect Service Mesh Telemetry
Service mesh proxies collect detailed telemetry. Check metrics like request duration, retries, and connection errors.
Example:
Using Istio’s telemetry dashboard, observe if there are spikes in retries or connection failures. Retries can increase latency by repeating requests.
istioctl dashboard kiali
Within Kiali, check the service graph for abnormal latency or error rates.
Step 4: Analyze Kubernetes Resource Utilization
High CPU or memory usage can cause slowdowns. Check pod metrics and node health.
Example:
kubectl top pods -n your-namespace
kubectl describe pod your-pod
Look for signs of CPU throttling or OOM kills. If pods are resource-starved, latency will spike.
Step 5: Review Network and DNS Performance
Network delays or DNS resolution issues can add latency.
Example:
Run a latency test from one pod to another:
kubectl exec -it pod-a -- ping -c 10 pod-b
Check DNS resolution time:
kubectl exec -it pod-a -- time nslookup service-b
If DNS is slow, consider caching or CoreDNS tuning.
Step 6: Examine Application Logs and Metrics
Look for slow database queries, external API calls, or blocking operations.
Example:
kubectl logs pod-name
If your logs show repeated timeouts or slow queries, optimize those operations.
Step 7: Test Hypotheses and Apply Fixes
Once you identify the cause, test fixes in a staging environment. For example:
- Increase CPU/memory limits if resource constraints are found.
- Optimize database queries.
- Adjust service mesh retry policies to avoid excessive retries.
- Improve DNS caching.
Example:
To reduce retries in Istio, edit the DestinationRule:
apiVersion: networking.istio.io/v1alpha3
kind: DestinationRule
metadata:
  name: example-destinationrule
spec:
  host: service-b
  trafficPolicy:
    connectionPool:
      http:
        http1MaxPendingRequests: 100
    outlierDetection:
      consecutiveErrors: 5
      interval: 10s
      baseEjectionTime: 30s
    retry:
      attempts: 1
      perTryTimeout: 2s
Step 8: Validate Improvements
After applying fixes, monitor latency metrics and traces to confirm improvements.
Example:
Re-run the Prometheus query for 95th percentile latency. Check Jaeger traces for reduced span durations.
Summary Mind Map
This structured approach helps you tackle latency issues methodically, reducing guesswork and focusing your efforts where they matter most.
12. Case Studies and Real-World Examples
12.1 Migrating a Monolith to Cloud Native Microservices on Kubernetes
Migrating a monolithic application to cloud native microservices on Kubernetes is a challenging but rewarding process. It requires careful planning, incremental steps, and a clear understanding of both the existing system and the target architecture. This section breaks down the migration into manageable phases, supported by practical examples and mind maps to clarify the approach.
Understanding the Monolith
Before starting the migration, it’s crucial to analyze the monolith’s structure and dependencies. This means identifying modules, data flows, and integration points. A typical monolith might look like this:
The first step is to map out these components and understand their interactions. This helps identify natural boundaries for microservices.
Step 1: Define Service Boundaries
Use domain-driven design (DDD) principles to carve out bounded contexts. For example, the order processing and inventory management can be split into separate services because they represent distinct business capabilities.
Each service owns its data and logic, reducing coupling.
Step 2: Extract Services Incrementally
Start by extracting a less critical or less complex module. For example, extract the Inventory Service:
- Create a new Kubernetes deployment for Inventory Service.
- Develop a REST or gRPC API for Inventory operations.
- Modify the monolith to call the Inventory Service API instead of internal methods.
This incremental approach minimizes risk and allows testing the new architecture in production.
Step 3: Data Decoupling
One of the hardest parts is moving from a shared database to service-specific databases. For Inventory Service:
- Set up a dedicated database.
- Migrate relevant tables and data.
- Implement data synchronization or event-driven updates if needed.
Example: Use change data capture (CDC) or domain events to keep data consistent during migration.
Step 4: Deploy on Kubernetes
Deploy each microservice as a separate pod with its own deployment and service:
apiVersion: apps/v1
kind: Deployment
metadata:
  name: inventory-service
spec:
  replicas: 2
  selector:
    matchLabels:
      app: inventory
  template:
    metadata:
      labels:
        app: inventory
    spec:
      containers:
      - name: inventory
        image: inventory-service:latest
        ports:
        - containerPort: 8080
Use Kubernetes services to expose microservices internally or externally.
Step 5: Introduce Service Mesh
Once multiple services are running, use a service mesh like Istio to manage traffic, security, and observability. For example, enable mutual TLS between Order and Inventory services to secure communication.
Mind Map: Migration Workflow
Example: Extracting the Payment Service
Suppose the Payment Handling logic is tightly coupled in the monolith. The extraction process might be:
- Develop a standalone Payment Service with its own API.
- Create a new database schema for payment transactions.
- Modify the monolith to send payment requests to the new service asynchronously via a message queue.
- Deploy the Payment Service on Kubernetes.
- Use Istio to monitor payment service traffic and enforce security policies.
This example shows how asynchronous communication can reduce coupling and improve resilience.
Challenges and Mitigations
- Data Consistency: Use eventual consistency and domain events to keep data synchronized.
- Service Coordination: Implement saga patterns or orchestration to handle distributed transactions.
- Incremental Rollout: Use canary deployments to gradually shift traffic to new services.
Summary
Migrating from a monolith to cloud native microservices on Kubernetes is a stepwise process focused on understanding the existing system, defining clear service boundaries, extracting services incrementally, decoupling data, and leveraging Kubernetes and service mesh capabilities. Practical examples and mind maps help keep the process organized and manageable.
12.2 Implementing a Service Mesh for a Multi-Team Environment
Implementing a service mesh in a multi-team environment requires careful planning, clear boundaries, and shared governance to avoid chaos and ensure smooth collaboration. Service meshes like Istio or Linkerd provide capabilities such as traffic management, security, and observability, but when multiple teams operate independently, these features need to be coordinated thoughtfully.
Understanding the Multi-Team Challenge
In a multi-team setup, each team typically owns a set of microservices. These teams may have different release cycles, priorities, and operational practices. Without a service mesh, teams might struggle with service discovery, secure communication, or tracing calls across services owned by different groups.
A service mesh can unify these concerns, but if not configured properly, it can become a bottleneck or source of conflict. For example, if one team changes global traffic routing rules without coordination, it might impact other teams’ services unexpectedly.
Key Considerations for Multi-Team Service Mesh Implementation
- Namespace Isolation: Assign each team its own Kubernetes namespace. This limits the blast radius of changes and simplifies resource management.
- Role-Based Access Control (RBAC): Use Kubernetes and service mesh RBAC to restrict who can modify mesh configurations, ensuring teams only affect their own services.
- Shared vs. Team-Specific Control Planes: Decide whether to use a single shared control plane or multiple control planes per team. Shared control planes simplify management but require strict governance.
- Standardized Policies: Agree on baseline security, observability, and traffic policies to maintain consistency.
- Communication and Change Management: Establish processes for proposing and reviewing mesh-wide changes.
Mind Map: Multi-Team Service Mesh Implementation
Example: Namespace and RBAC Setup
Suppose Team A and Team B each own a set of microservices. You create two namespaces: team-a and team-b. Each team gets a Kubernetes role granting them permission to manage resources only in their namespace.
apiVersion: rbac.authorization.k8s.io/v1
kind: Role
metadata:
  namespace: team-a
  name: team-a-role
rules:
- apiGroups: [""]
  resources: ["pods", "services", "configmaps"]
  verbs: ["get", "list", "watch", "create", "update", "delete"]
Similarly, you configure Istio’s RBAC policies to restrict who can modify virtual services or destination rules in each namespace.
Managing Traffic Routing Across Teams
Teams often need to call services owned by other teams. The service mesh handles this transparently, but routing rules can become complex.
A best practice is to allow teams to manage routing rules only for their own services. For cross-team traffic policies, a shared operations team or mesh administrator should review and apply global routing rules.
Mind Map: Traffic Routing Governance
Observability and Telemetry
Each team should have access to telemetry data for their services. The service mesh collects metrics, logs, and traces centrally but filters or scopes dashboards and alerts by namespace.
For example, Prometheus can be configured with label selectors to scrape metrics per namespace. Grafana dashboards can be set up to display team-specific views.
Example: Prometheus Scrape Config for Team Namespace
- job_name: 'team-a-services'
  kubernetes_sd_configs:
  - role: pod
  relabel_configs:
  - source_labels: [__meta_kubernetes_namespace]
    action: keep
    regex: team-a
Security Considerations
Service meshes enable mutual TLS (mTLS) for service-to-service encryption. In a multi-team environment, mTLS should be enabled cluster-wide to ensure all traffic is secure, regardless of team boundaries.
However, teams should not be able to disable mTLS for their services unilaterally. This requires centralized policy enforcement.
Example: Enforcing mTLS Globally with Istio PeerAuthentication
apiVersion: security.istio.io/v1beta1
kind: PeerAuthentication
metadata:
  name: default
  namespace: istio-system
spec:
  mtls:
    mode: STRICT
Handling Service Mesh Upgrades and Changes
Upgrading the service mesh control plane or changing global policies affects all teams. Schedule upgrades during agreed maintenance windows and communicate clearly.
Use canary upgrades of the control plane where possible, and test changes in staging environments that mimic the multi-team setup.
Summary
Implementing a service mesh in a multi-team Kubernetes environment involves balancing autonomy and control. Namespace isolation and RBAC provide boundaries. Clear governance on traffic routing, security policies, and observability ensures teams can work independently without stepping on each other’s toes. Transparent communication and shared processes keep the mesh manageable and reliable.
This approach helps teams focus on their services while benefiting from the mesh’s features across the entire platform.
12.3 Observability-Driven Development: Improving Reliability with Metrics and Traces
Observability-driven development (ODD) is a practical approach to building and maintaining microservices by embedding observability—metrics, logs, and traces—into the development process itself. The goal is to improve reliability by making it easier to detect, diagnose, and fix issues early, rather than reacting after a failure occurs.
Why Observability-Driven Development Matters
In microservices, complexity grows quickly. Services interact over the network, failures cascade, and pinpointing root causes becomes a challenge. ODD encourages developers to think about how their code will be observed in production from day one. This mindset reduces blind spots and accelerates troubleshooting.
Core Components of Observability in ODD
Integrating Metrics into Development
Metrics provide quantitative data about service health and performance. When writing a microservice, developers should identify key performance indicators (KPIs) relevant to their service’s function. For example, an order processing service might track:
- Number of orders processed per minute
- Average processing time
- Failure rate of order submissions
Example: Using Prometheus client libraries, a developer can instrument code to expose a counter for processed orders:
var ordersProcessed = prometheus.NewCounter(
  prometheus.CounterOpts{
    Name: "orders_processed_total",
    Help: "Total number of orders processed",
  },
)

func processOrder(order Order) {
  // processing logic
  ordersProcessed.Inc()
}
This metric feeds into dashboards and alerts, allowing teams to detect drops in throughput or spikes in failures quickly.
Traces for Understanding Request Flows
Distributed tracing captures the path of a request as it travels through multiple microservices. This is critical for identifying latency bottlenecks and pinpointing which service or operation caused an error.
Example: Using OpenTelemetry, a developer can create spans around critical operations:
with tracer.start_as_current_span("validate_order"):
    validate(order)

with tracer.start_as_current_span("charge_payment"):
    charge(order.payment)
When a request fails or slows down, the trace shows exactly where time was spent and where errors occurred.
Logs as Contextual Backups
Logs provide detailed context that metrics and traces alone cannot. They capture error messages, stack traces, and business events. Structured logging with consistent fields (e.g., request ID, user ID) helps correlate logs with traces.
Example: A JSON log entry might look like:
{
  "timestamp": "2024-06-01T12:00:00Z",
  "level": "error",
  "service": "order-service",
  "request_id": "abc123",
  "message": "Payment authorization failed",
  "error_code": "PAYMENT_DECLINED"
}
This log entry can be linked to a trace with the same request ID, providing a full picture of the failure.
Embedding Observability Early
ODD encourages:
- Designing APIs and code with observability hooks
- Writing tests that verify observability data is emitted correctly
- Reviewing observability outputs as part of code reviews
Example: Before merging a feature, a developer runs integration tests that assert metrics increment and traces include expected spans.
Feedback Loop and Continuous Improvement
Observability data should feed back into development decisions. For instance, if traces reveal a slow database call, developers can optimize queries or add caching. If error rates rise after a deployment, alerts trigger immediate investigation.
Summary
Observability-driven development is about making observability a first-class citizen in the software lifecycle. By embedding metrics, traces, and logs into microservices from the start, teams gain faster insights into system behavior and can maintain reliability more effectively. The examples above show how straightforward instrumentation can be and how it integrates with Kubernetes and service mesh environments to provide a comprehensive view of microservice health.
12.4 Securing Microservices End-to-End in a Financial Application
Securing microservices in a financial application requires a layered approach, addressing security at every stage from code to deployment and runtime. Financial data demands confidentiality, integrity, and availability, so the security measures must be precise and verifiable.
Key Security Domains
Identity and Access Management (IAM)
In a financial microservices environment, every service and user must prove who they are before accessing resources. Use strong authentication methods like OAuth 2.0 or OpenID Connect for users and service accounts for microservices.
Example:
- Each microservice uses a service account with a short-lived token issued by Kubernetes or an external identity provider.
- Role-Based Access Control (RBAC) policies restrict what each service can do. For instance, the payment processing service can only access the transaction database, not user profiles.
# Example RBAC snippet granting read access to transactions
apiVersion: rbac.authorization.k8s.io/v1
kind: Role
metadata:
  namespace: finance
  name: transaction-reader
rules:
- apiGroups: [""]
  resources: ["transactions"]
  verbs: ["get", "list"]
Network Security with mTLS and Network Policies
Mutual TLS (mTLS) ensures that communication between microservices is encrypted and both parties verify each other’s identity. This prevents man-in-the-middle attacks and unauthorized service access.
Example:
- Deploy Istio service mesh to automatically inject sidecar proxies that handle mTLS.
- Define strict network policies to limit pod-to-pod communication only to required services.
# Example Kubernetes NetworkPolicy allowing traffic only from frontend to backend
apiVersion: networking.k8s.io/v1
kind: NetworkPolicy
metadata:
  name: allow-frontend-to-backend
  namespace: finance
spec:
  podSelector:
    matchLabels:
      app: backend
  ingress:
  - from:
    - podSelector:
        matchLabels:
          app: frontend
    ports:
    - protocol: TCP
      port: 8080
Data Security: Encryption Everywhere
Financial data must be encrypted both at rest and in transit. Kubernetes Secrets should be encrypted using a provider like KMS (Key Management Service).
Example:
- Use encrypted Persistent Volumes for databases.
- Enable TLS for all database connections.
- Kubernetes Secrets encrypted with a KMS provider.
# Example of a TLS secret in Kubernetes
apiVersion: v1
kind: Secret
metadata:
  name: db-tls
  namespace: finance
type: kubernetes.io/tls
data:
  tls.crt: <base64-encoded-cert>
  tls.key: <base64-encoded-key>
Application Security: API Gateway and Input Validation
An API Gateway acts as a gatekeeper, enforcing authentication, rate limiting, and request validation.
Example:
- Use an API Gateway like Kong or Ambassador to centralize security policies.
- Validate all inputs to prevent injection attacks.
# Example of rate limiting policy in Istio
apiVersion: config.istio.io/v1alpha2
kind: QuotaSpec
metadata:
  name: request-count
  namespace: finance
spec:
  rules:
  - match:
      request:
        headers:
          x-user-id:
            present: true
    quotas:
    - charge: 1
      quota: requestcount.quota.istio-system
Observability and Auditing
Security is incomplete without visibility. Logs, traces, and alerts help detect suspicious activity.
Example:
- Enable audit logging in Kubernetes for API server requests.
- Use distributed tracing (e.g., Jaeger) to track request flows and detect anomalies.
- Set alerts on unusual authentication failures or traffic spikes.
End-to-End Example Scenario
Imagine a user initiating a funds transfer:
- User authenticates via OAuth 2.0 through the API Gateway.
- The API Gateway validates the token and forwards the request to the transfer microservice.
- The transfer microservice communicates with the accounts microservice over mTLS.
- Both services access encrypted databases with RBAC enforced.
- All communication and database queries are logged and traced.
- Network policies prevent any other service from intercepting or accessing these calls.
This chain ensures that every step is authenticated, authorized, encrypted, and observable.
Summary Mind Map
By applying these layered security controls, a financial microservices platform can maintain strong defenses without sacrificing the agility and scalability that microservices and Kubernetes provide.
12.5 Lessons Learned and Best Practices from Production Deployments
Deploying cloud native microservices with Kubernetes, service mesh, and observability in production environments brings a unique set of challenges and insights. This section summarizes key lessons and practical best practices drawn from real-world deployments.
Start Small and Iterate
Jumping straight into a full-scale service mesh or complex observability setup can overwhelm teams and systems. Begin with a minimal viable deployment:
- Deploy a few critical microservices first.
- Enable basic service mesh features like mTLS and traffic routing on a subset.
- Gradually add observability layers (metrics, logs, traces) service by service.
This approach reduces risk and builds confidence.
Keep Configuration Manageable
Managing configuration across multiple microservices and environments is complex. Use Kubernetes ConfigMaps and Secrets wisely:
- Separate configuration from code.
- Use environment-specific ConfigMaps.
- Avoid embedding secrets in container images.
- Automate configuration updates with GitOps or CI/CD pipelines.
Example: For a payment service, keep API keys in Kubernetes Secrets and update them without redeploying the service.
Use Service Mesh Features Judiciously
Service mesh offers many capabilities, but not all are necessary for every service:
- Enable mutual TLS (mTLS) for sensitive communications.
- Use traffic routing features like canary releases only when needed.
- Avoid overloading the mesh with unnecessary policies that complicate troubleshooting.
Example: In one deployment, enabling circuit breakers on all services caused unexpected failures; selectively applying them to critical services improved stability.
Observability is Essential but Needs Planning
Collecting metrics, logs, and traces is crucial but can generate large volumes of data:
- Define clear objectives for what to monitor.
- Use sampling for distributed tracing to control overhead.
- Correlate logs and traces with service mesh telemetry for faster root cause analysis.
Example: Setting up dashboards that combine Prometheus metrics with Istio telemetry helped identify latency spikes caused by misconfigured retries.
Automate CI/CD with Observability and Mesh Integration
Integrate service mesh and observability checks into CI/CD pipelines:
- Automate deployment of mesh configurations alongside microservices.
- Include automated tests for traffic routing and fault injection.
- Monitor deployments with automated alerts triggered by observability data.
Example: A pipeline that deploys a new version, runs canary tests, and rolls back automatically on error metrics reduced downtime.
Security Needs Layered Controls
Relying solely on service mesh security features is insufficient:
- Use Kubernetes RBAC and network policies to restrict access.
- Rotate secrets regularly.
- Audit service mesh policies and certificates.
Example: A breach was prevented when network policies blocked lateral movement despite a compromised pod.
Prepare for Troubleshooting Complexity
Microservices with service mesh add layers that can complicate debugging:
- Use
kubectlalongside mesh-specific tools likeistioctl. - Correlate logs, metrics, and traces to pinpoint issues.
- Document common failure modes and recovery steps.
Example: A latency issue was traced to a misconfigured retry policy causing request storms.
Optimize Resource Usage
Service mesh sidecars add CPU and memory overhead:
- Monitor resource consumption closely.
- Tune resource requests and limits.
- Consider lighter-weight meshes if overhead is prohibitive.
Example: Switching from a default Istio sidecar configuration to a custom one reduced CPU usage by 30%.
Foster Cross-Team Collaboration
Microservices span multiple teams; success depends on communication:
- Share best practices and common configurations.
- Use shared observability dashboards.
- Coordinate service mesh policy changes.
Example: A shared Slack channel for mesh alerts and troubleshooting improved response times.
Summary Mindmap
These lessons reflect practical experience rather than theory. Applying them can help maintain stability, security, and clarity in complex cloud native microservice environments.