Infrared Technology for Beginners
1. Infrared Basics and How Heat Becomes Images
1.1 What Infrared Radiation Is and How It Differs from Visible Light
Infrared radiation is electromagnetic energy with wavelengths longer than visible light. Visible light sits roughly between 400 and 700 nanometers, while infrared starts just beyond that and extends to millimeters. A thermal camera doesn’t “see heat” directly; it measures infrared energy coming from objects and converts that energy into an image.
The key difference from visible light is how the energy interacts with matter. Visible light is strongly affected by color pigments and surface reflectance, so two objects can look different even if their temperatures are similar. Infrared energy, especially in the common thermal imaging band around 8–14 micrometers, is more tied to how hot surfaces are and how they emit energy at those wavelengths.
Emission is the part people often remember, but it’s only half the story. Every object at a nonzero temperature emits infrared radiation. At the same time, objects also reflect infrared radiation from their surroundings. That’s why a shiny surface can appear “hot” in a thermal image even when its actual temperature is not the highest in the scene.
Another practical difference is how the atmosphere behaves. Visible light can be scattered by dust and fog, but infrared is affected differently by absorption and transmission. Water vapor and certain gases absorb infrared energy, which can reduce signal strength and change apparent temperatures with distance.
Mind Map
A Concrete Comparison: Same Temperature, Different Looks
Imagine two metal blocks placed side by side at the same temperature. One is painted matte black, the other is polished. In visible light, the painted block will look dark and the polished block will look bright because their reflectance differs. In infrared, both blocks emit infrared energy due to temperature, but the polished surface also reflects infrared from nearby objects. If the polished block reflects a warm wall, it can look warmer than the matte block even though their temperatures match.
This is the reason thermal imaging is not a simple “hot equals bright” rule. The camera is measuring radiation, and radiation is a mix of emission and reflection.
A Concrete Comparison: Same Scene, Different Lighting
Now keep the objects fixed and change the environment. Turn on a bright heat source nearby, like a warm radiator. In visible light, the scene might change slightly depending on how the radiator affects illumination and reflections. In infrared, the warm radiator adds infrared radiation that can be reflected by surfaces. Matte surfaces mostly reflect less, so their thermal appearance changes mainly because their own emission depends on their temperature. Shiny surfaces can change appearance more dramatically because reflected infrared becomes a larger fraction of what the camera receives.
What “Heat” Means in Thermal Imaging
When people say “the camera sees heat,” they usually mean it visualizes temperature-related radiation. Temperature is a convenient summary variable, but the camera’s measurement is energy at specific wavelengths. Two objects at the same temperature can still produce different readings if their surface emissivity differs. Emissivity is a measure of how effectively a surface emits infrared compared to an ideal emitter.
So the difference from visible light is not just wavelength. It’s also the measurement model: visible images are dominated by reflected light patterns, while thermal images are dominated by emitted infrared energy, adjusted by reflection and atmospheric effects.
Quick Mental Model
Think of visible light as “what gets reflected into your eyes,” and infrared thermal imaging as “what infrared energy arrives at the sensor.” Both are about radiation arriving at a detector, but the dominant sources and the way surfaces and air affect that radiation are different.
If you remember one practical takeaway: thermal images are best interpreted as radiation maps, where temperature is the main driver but not the only one.
1.2 Emissivity, Reflectivity, and Transmissivity in Plain Terms
Thermal cameras don’t measure “heat” directly. They measure infrared radiation coming from a scene. Three surface properties decide how much radiation a surface emits, reflects, and transmits: emissivity, reflectivity, and transmissivity. If you set these wrong, the camera can report a temperature that looks plausible but is actually based on the wrong mix of radiation.
Emissivity: How Much a Surface Emits
Emissivity (ε) is the fraction of infrared energy a surface emits compared with an ideal blackbody at the same temperature. Real materials have ε values from near 0 (shiny metals) to near 1 (many paints, matte surfaces).
A simple way to think about emissivity: if ε is high, the camera mostly “hears” the surface’s own temperature. If ε is low, the camera mostly “hears” reflections of other warm objects.
Example: A matte black electrical box at 40°C will usually read close to 40°C with a correct ε setting. A polished aluminum cover at the same 40°C might read much lower or higher depending on what it reflects—sunlight, a warm wall, or even the operator’s body.
Reflectivity: What a Surface Sends Back
Reflectivity (ρ) is the fraction of incoming infrared radiation that bounces back. For many opaque surfaces, transmissivity is effectively zero, so emissivity and reflectivity trade off: higher reflectivity often means lower emissivity.
Example: Point a thermal camera at a shiny steel pipe. If the room is cooler than the pipe, the pipe may still appear “cool” because it reflects the cooler surroundings. If you move the camera so it now “sees” a warm heater reflection, the pipe can appear warmer without changing its actual temperature.
Transmissivity: What Passes Through
Transmissivity (τ) matters for materials that are not opaque to infrared, such as some plastics, glass, and thin films. A transmissive surface lets part of the infrared radiation from behind it reach the camera.
Example: A thermal camera looking through a window at an object behind it may report a temperature influenced by both the object and the window’s own temperature. If the window is reflective too, you get a mix of transmitted and reflected contributions.
How the Three Properties Combine
For opaque surfaces, τ ≈ 0, so the camera’s reading is mainly a blend of emitted radiation (set by ε) and reflected radiation (set by ρ). For transmissive materials, the camera also receives radiation coming from behind the surface.
A practical takeaway: emissivity is not just a “setting.” It controls how much of the camera’s measurement is attributed to the target versus the environment.
Mind Map: Radiation Contributions from a Surface
Concrete Measurement Examples
Example: Matte Paint vs. Polished Metal
Place a matte painted plate and a polished metal plate side by side. Keep both at the same temperature using a controlled heat source. The matte plate will usually read consistently because ε is high. The polished plate will vary with camera position because reflections change.
Best practice: If you must measure a low-emissivity surface, improve the situation by applying a small patch of high-emissivity tape or paint to the measurement area. Then set ε to match the patch material.
Example: Measuring Through a Window
Thermal cameras can “see” through some materials, but the reading is rarely the same as if you were measuring directly. The camera receives radiation from the object behind the window (transmission) and from the window itself (emission), plus any reflections on the window surface.
Best practice: If possible, measure the target directly. If not, measure and record the window conditions and avoid comparing readings taken under different window angles or lighting.
Example: A “Correct” Temperature That’s Actually a Reflection
A shiny object in a room with a warm appliance can appear hotter than its true temperature. The camera may be set with an emissivity value that assumes the surface emits strongly, but the surface is reflecting the appliance’s radiation.
Best practice: Use a quick sanity check: change the camera angle slightly. If the apparent temperature swings a lot while the object is stable, reflections are likely dominating.
Quick Rules of Thumb
- High emissivity surfaces tend to give stable readings.
- Low emissivity surfaces tend to give readings that depend on what they reflect.
- Transmissive materials add influence from behind the surface, not just the front.
These rules won’t replace careful setup, but they explain why two “same temperature” objects can look different on a thermal image—and why one measurement can be trustworthy while another is just well-lit guesswork.
1.3 Temperature, Radiance, and Why Thermal Cameras Measure Energy
Thermal cameras do not “see temperature” directly. They measure infrared energy arriving from a scene, then convert that energy into a temperature estimate using assumptions about how surfaces emit and reflect.
Temperature Is a Model Parameter
Temperature is a property of matter that describes how energetic its molecules are. In many practical cases, a surface can be approximated as a body that emits radiation according to its temperature. That approximation is why a camera can report a number like “62 °C.”
The key detail: the camera’s reported temperature is only as meaningful as the model it uses. If the surface does not behave like the assumed emitter, the same measured energy can correspond to a different true temperature.
Radiance Is What the Camera Actually Receives
Radiance is the amount of infrared energy traveling in a particular direction per unit area and per unit solid angle. A thermal camera collects radiance from many directions through its optics, then turns that into pixel values.
A helpful way to think about it: temperature is the label you want, radiance is the measurement you get. The conversion from radiance to temperature depends on emissivity and on the camera’s calibration.
How Energy Becomes a Pixel Value
Each pixel corresponds to a small patch of the scene. The camera optics focus infrared radiation onto a detector array. The detector output reflects how much infrared energy arrived during the integration time.
That output is then processed into an image using calibration curves. These curves map detector response to radiance, and radiance to an estimated temperature.
Emissivity Connects Radiance to Temperature
Emissivity describes how efficiently a surface emits infrared radiation compared to an ideal emitter at the same temperature. Real materials have emissivities less than 1, meaning they emit less than an ideal blackbody.
When emissivity is less than 1, the camera’s measurement includes two contributions:
- Emission from the object itself.
- Reflected radiation from the environment (nearby walls, sky, equipment, and even the camera’s own surroundings).
So two objects at the same true temperature can produce different pixel values if their emissivities differ.
Mind Map: Temperature Versus Radiance
A Concrete Example: Same Temperature, Different Materials
Imagine a warm metal plate and a warm painted plate, both at 50 °C. The painted surface typically has higher emissivity than bare metal.
- The painted plate emits infrared energy more efficiently.
- The bare metal emits less and reflects more of its surroundings.
If you point the camera at both plates and leave emissivity set to a default value that matches neither material, the camera will likely report different temperatures. The difference is not magic; it’s the radiance-to-temperature conversion being fed the wrong emissivity.
A Concrete Example: The “Hot” Reflection Problem
Consider a person standing near a bright window on a sunny day. The person’s skin temperature might be steady, but the window reflects strong infrared radiation.
If the camera treats reflected radiation as if it were purely emitted by the person, the pixel values can rise, and the reported temperature can drift. This is why emissivity settings and scene awareness matter: the camera is measuring energy from everything in its field of view, not just the object you care about.
Why Integration Time and Motion Matter
The detector integrates energy over a time window. If the scene moves during that window, the pixel may blend radiance from different positions. The result can look like a temperature smear or edge artifacts.
This is not a “temperature error” in the physics sense; it’s a measurement geometry issue. The camera is still measuring energy correctly, but the energy corresponds to a moving mixture.
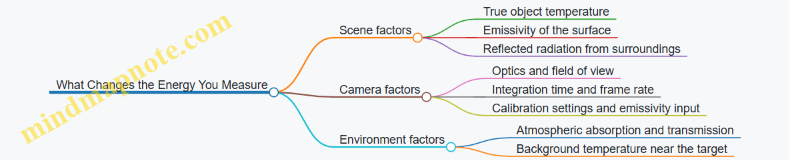
Mind Map: What Changes the Energy You Measure
Practical Takeaway
When you see a thermal image, remember: the camera starts with radiance, then uses emissivity and calibration to produce a temperature estimate. If you want the number to mean something, you need the model inputs to match the scene well enough that the radiance-to-temperature conversion is not guessing wildly.
1.4 The Thermal Imaging Signal Chain from Scene to Display
A thermal camera turns invisible heat radiation into a picture you can interpret. The key idea is that each stage in the signal chain has a job, and each job affects what you see on the screen.
From Scene to Detector
-
Scene radiates infrared energy. Every object emits infrared radiation based on its temperature and surface properties. Two objects at the same temperature can still look different because their surfaces emit differently.
-
Optics collect radiation. The lens gathers infrared energy and focuses it onto the detector array. If the focus is off, energy spreads across pixels, which reduces sharpness and can blur temperature boundaries.
-
The detector converts radiation to an electrical signal. In a microbolometer camera, infrared energy changes the detector’s electrical behavior. The camera then measures that change for each pixel.
-
Pixels are not identical. Even within the same detector, pixels respond slightly differently. That’s why you’ll often see non-uniformity corrections later in the chain.
From Detector to Temperature-Like Numbers
-
Readout and digitization. The camera reads each pixel’s electrical response and converts it into digital values. This step includes timing choices that affect how well the camera handles motion.
-
Noise reduction and correction. Raw detector signals contain noise from electronics and the detector itself. The camera applies corrections so the image represents radiation differences rather than random fluctuations.
-
Non-uniformity correction. The camera compensates for pixel-to-pixel sensitivity differences. Without this, you’d see a “speckled” or blotchy pattern even in a uniform scene.
-
Calibration mapping. The camera maps corrected detector values to temperature-like outputs. This mapping depends on camera settings and assumptions, especially emissivity and reflected temperature.
-
Emissivity and ambient compensation. If you set emissivity incorrectly, the camera will attribute too much or too little of the measured radiation to the target’s own emission. If reflected temperature is not handled correctly, shiny or reflective surfaces can look warmer or cooler than they are.
From Temperature Mapping to Display Image
-
Color palette or grayscale rendering. The camera converts temperature-like values into a visual scale. A palette doesn’t change the underlying numbers, but it changes how quickly your eyes notice differences.
-
Dynamic range and level settings. Many cameras let you set span and level. These choices determine which temperature differences appear large and which appear subtle.
-
Overlay graphics and measurement tools. When you draw a box or place a spot, the camera computes statistics from the mapped values. If the region includes mixed materials or edges, the reported temperature can shift.
-
Output formatting. The final image may be saved with metadata such as emissivity setting, distance, and atmospheric parameters. Those metadata matter when you compare images later.
Mind Map: Signal Chain Responsibilities
Example: Why a Focus Problem Looks Like a Temperature Problem
Imagine inspecting a door frame with a thermal camera. The frame has a cold edge where insulation is missing. If the camera is slightly out of focus, the cold edge spreads into adjacent pixels. The camera then averages mixed radiation across the region, so the “cold spot” looks less cold and wider than it should. The fix is not changing emissivity; it’s improving focus and confirming that the measurement region sits on the intended surface.
Example: Emissivity Setting Changes the Story
Now place two objects in view: a matte painted surface and a glossy metal plate. The metal plate reflects infrared from its surroundings. If you set emissivity as if the metal were matte, the camera will treat reflected radiation as if it came from the plate’s own emission. The result is a temperature reading that tracks the environment rather than the metal’s true temperature. Correct emissivity handling makes the metal’s temperature behave more like what you’d expect from a real measurement.
Example: Palette Choice Affects Your Interpretation Speed
Two images can represent the same temperature-like data but look different because of palette and scaling. If you use a narrow level/span, small temperature differences become visually prominent, which helps when you’re hunting for subtle anomalies. If you use a wide span, the same differences may look muted, and you might miss them. The underlying mapping is the same; your perception changes because the display is a visual transformation.
Practical Takeaway
When something looks wrong, don’t jump straight to “the camera is broken.” First check whether the issue likely originates from optics (focus), assumptions (emissivity and reflections), or display scaling (level/span). Each stage has a distinct signature, and the fastest troubleshooting follows the signal chain in order.
1.5 Common Beginner Misconceptions and How to Avoid Them
Thermal imaging is simple to point and capture, but it is easy to misread. Most beginner mistakes come from treating the camera like a thermometer that “just knows” the truth. In reality, the camera measures infrared radiation and then estimates temperature using assumptions you may not notice.
Misconception 1: “The camera shows temperature directly.”
Thermal cameras output temperature estimates, not direct temperature readings. The estimate depends on settings like emissivity, reflected temperature, distance, and atmospheric conditions. If you change emissivity, the same scene can produce a different temperature readout.
How to avoid it: pick a realistic emissivity for the surface you are measuring, or use a reference method. For example, compare a matte black tape patch to a glossy painted surface on the same object. The glossy surface often looks “hotter” or “colder” than the matte patch because reflections and emissivity assumptions differ.
Misconception 2: “Emissivity is a minor detail.”
Emissivity is often the biggest lever you control. Two surfaces at the same actual temperature can appear different if one reflects more infrared energy toward the camera.
How to avoid it: treat emissivity like a measurement input, not a decoration. If your camera offers an emissivity menu, choose the closest material type and then verify with a simple test. Example: place two identical objects side by side, cover one with matte tape, and set emissivity for both. If the uncovered object’s temperature keeps drifting while the taped one stays stable, you’ve found an emissivity mismatch.
Misconception 3: “Reflections don’t matter.”
Reflections matter because shiny or glossy surfaces act like mirrors for infrared. A hot lamp, a warm wall, or even the sky can reflect into the camera and skew the temperature estimate.
How to avoid it: look for “impossible” patterns. If a surface shows a sharp shape matching a nearby heat source, suspect reflection. Example: aim at a car hood at night. The hood may show a bright region shaped like streetlights even when the hood itself is not uniformly hot.
Misconception 4: “Distance is only about focus.”
Distance affects measurement because the camera measures a finite spot size. At longer distances, each pixel averages over a larger area. If the target is smaller than the camera’s effective spot, you measure a mix of target and background.
How to avoid it: use the camera’s spot-size guidance and keep the target large enough. Example: measure a small electrical terminal from far away. If the readout changes dramatically when you step closer, you were probably including surrounding cooler metal or insulation in the measurement.
Misconception 5: “Color palettes change the truth.”
Palettes change how you perceive differences, not the underlying measurement. Beginners sometimes treat a “red” pixel as hotter than a “blue” pixel without checking whether the palette range is fixed or auto-scaled.
How to avoid it: keep the scale consistent when comparing images. Example: take two photos of the same wall, one with auto-ranging and one with a fixed temperature range. The auto-ranging image can make small changes look dramatic, while the fixed range shows whether the wall actually shifted.
Misconception 6: “If it looks sharp, it’s accurate.”
Sharpness is about focus and image clarity, not about correct assumptions. You can have a crisp image with wrong emissivity or wrong reflected temperature.
How to avoid it: separate “image quality” from “measurement quality.” Example: focus on a window frame. The image can be sharp, but the glass may reflect the room and produce misleading temperature estimates. A quick check is to compare the glass reading to a nearby matte surface at the same apparent temperature.
Misconception 7: “Thermal cameras are immune to environment.”
Air absorbs and scatters infrared energy. Wind, humidity, and temperature gradients in the air can change what reaches the sensor.
How to avoid it: watch for inconsistent readings across similar targets. Example: measure a distant pipe on a breezy day versus a calm day. If the temperature estimate shifts without any real change in the pipe, the environment likely influenced the signal.
Misconception 8: “A single number is enough.”
A lone temperature readout hides uncertainty. Beginners often report one value from a region that includes multiple materials, edges, or mixed emissivity.
How to avoid it: use regions of interest and check boundaries. Example: when measuring a motor housing, avoid selecting a tiny box that includes both the housing and a surrounding bracket. Compare the average over the housing area to the value near the edge.
Mind Map: Misconceptions and Fixes
Quick Self-Check Before You Trust a Reading
Ask three questions: What surface am I measuring, what is it reflecting, and does my measurement area include only that surface? If any answer is “I’m not sure,” adjust the setup or the selection area before concluding anything.
2. Thermal Camera Fundamentals You Must Know
2.1 Core Camera Specifications and What They Actually Mean
Thermal cameras list specifications that look like a shopping checklist, but each one affects what you can measure and how confidently you can interpret it. The trick is to translate each spec into a practical question: “What will I see, how fast will I see it, and how wrong might it be?”
Resolution and Pixel Count
Resolution is the number of pixels in the thermal image, such as 320×240 or 640×480. More pixels generally means smaller details can appear without being smeared into one blob. However, resolution alone does not guarantee accuracy; it mainly improves spatial detail.
Example: If you inspect a cable tray and want to distinguish two adjacent cable connections, a higher pixel count helps separate the hot spots. If the connections are far apart relative to the camera’s lens and distance, even a high-resolution camera may still merge them.
Field of View and Lens Choice
Field of view (FOV) describes how wide a scene the camera sees. A wide FOV lens covers more area but spreads the same pixels over a larger region, reducing detail per object. A narrow FOV lens does the opposite.
Example: For a building inspection, a wide FOV can help you find the general location of a heat leak. For reading a small component temperature at a distance, a narrower FOV lens is more useful.
Thermal Sensitivity and NETD
NETD (often stated in millikelvins) is a measure of how small a temperature difference the camera can reliably distinguish under controlled conditions. Lower NETD is better, but it only matters when the scene actually contains small temperature differences.
Example: If two surfaces differ by 0.5°C, a camera with NETD around 50 mK may show a clear separation, while a camera with NETD around 150 mK might show a subtle gradient that’s hard to trust. Wind, reflections, and emissivity errors can overwhelm NETD in real scenes.
Frame Rate and Integration Time
Frame rate is how many images per second the camera outputs. Integration time is how long the sensor collects energy for each frame. Longer integration can improve signal but increases blur when the scene moves.
Example: Point a camera at a moving conveyor belt. If the integration time is long, edges smear and small hot objects look larger and less distinct. For static inspections, slower frame rates are usually fine.
Measurement Accuracy and Temperature Range
Temperature range tells you the span of temperatures the camera can measure. Accuracy describes how close the reported temperature is to the true temperature, usually under specified conditions.
Example: If you’re measuring a motor housing that runs around 60°C, a camera with a wide range is not automatically better. What matters is whether its stated accuracy applies near that temperature and whether you can set emissivity correctly.
Emissivity Handling and Reflected Temperature
Most thermal cameras require an emissivity setting. Emissivity controls how much of the measured radiation comes from the object versus reflected surroundings. Some cameras also let you account for reflected temperature.
Example: A shiny metal pipe can look “too hot” or “too cold” if you assume the wrong emissivity. If the pipe reflects a warm wall, the camera may report a temperature that blends the pipe’s true emission with the wall’s reflection.
Focus, Minimum Focus Distance, and Optics Quality
Focus affects sharpness and the ability to measure small targets. Minimum focus distance tells you how close you can get while still producing a sharp image.
Example: If you inspect a small electrical component at arm’s length but the camera can’t focus that close, the component edges blur. Blurred edges can cause the hottest pixel to spread out, lowering the apparent peak temperature.
Image Processing Modes and Display Choices
Some cameras offer different palettes and measurement overlays. These choices can change how easily you spot differences, but they should not change the underlying measurement if the camera is configured correctly.
Example: A “rainbow” palette can make small gradients look dramatic, while a grayscale palette may make them easier to judge as gradual. Use palettes to see patterns, not to justify numbers.
Mind Map: What Specs Control
Case Example: Choosing Settings for a Simple Inspection
Suppose you’re checking a wall-mounted electrical panel for overheating. Start by setting the correct emissivity for the panel surface type (painted metal versus bare metal). Then choose a lens or camera position that keeps the suspected hot area large enough in the frame to avoid blending. If the panel is near a window or reflective surface, account for reflected temperature if your camera supports it. Finally, confirm sharp focus so the hottest region is not artificially spread by blur.
The goal is not to chase the “best” camera spec. It’s to match the camera’s strengths to the measurement conditions you can actually control.
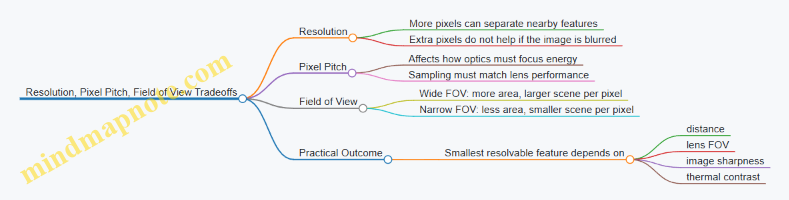
2.2 Resolution, Pixel Pitch, and Field of View Tradeoffs
Thermal cameras turn infrared energy into a grid of numbers. Three specs shape what you see: resolution (how many grid points), pixel pitch (how big each grid point is), and field of view (how much scene fits across the grid). The tradeoffs matter because they determine how small a feature can be and how much detail you can trust.
Resolution and What It Really Controls
Resolution is the number of pixels across the image, such as 640×480 or 1024×768. More pixels means you can represent smaller temperature variations with less “blockiness.” But resolution alone does not guarantee measurement quality. If your optics or setup blur the image, extra pixels just give you more blurry pixels.
A practical way to think about it: if two objects are close together and their thermal contrast is modest, you need enough pixels across the gap to separate them. With too few pixels, the camera averages the temperatures into a single blended region.
Example: You inspect two electrical terminals that are 5 mm apart. At one distance, the terminals occupy only a few pixels each, so the camera may show one broad hot area. Move closer or use a narrower field of view, and each terminal spans more pixels; the hot spot becomes separable.
Pixel Pitch and Why It Changes Sensitivity and Optics
Pixel pitch is the spacing between detector elements, often expressed in micrometers. Smaller pitch can allow more pixels to fit on the same detector size, which can raise resolution without changing the detector footprint. Pixel pitch also influences how the lens must be designed to focus energy onto the detector.
Here’s the key reasoning: the camera’s optics must form an image that matches the detector’s sampling. If the lens produces a spot on the detector that covers multiple pixels, you lose detail even if the detector has many pixels. If the lens is designed well, each pixel samples a distinct portion of the scene.
Example: Two cameras both have 640×480 resolution, but one uses smaller pixel pitch. If both are paired with lenses that deliver similar image sharpness at the target distance, the smaller-pitch design can be easier to optimize for compact optics. If the lens is not matched, you can still end up with the same practical detail limit.
Field of View and the Distance-to-Detail Relationship
Field of view (FOV) describes how wide the scene is across the detector. A wide FOV shows more area, but each pixel covers a larger patch of the scene. A narrow FOV (often achieved with a different lens) covers less area, but each pixel covers a smaller patch, improving the ability to resolve small features.
A simple mental model: pixel coverage on the target scales with distance and inversely with how narrow the FOV is. That’s why “move closer” and “use a narrower lens” often have similar effects on detail.
Example: You’re checking a small leak around a valve. With a wide FOV, the valve might occupy only a small portion of the image, and the leak path blends into surrounding surfaces. With a narrower FOV, the valve fills more of the frame, and the leak region becomes distinct.
The Three-Way Tradeoff in One Picture
A Concrete Setup Example with Numbers
Assume you have a thermal camera with a 640-pixel width. If the camera’s horizontal FOV is wide, say 30°, each pixel corresponds to a larger angular slice of the scene. At a fixed distance, that means each pixel covers a larger physical area. If the leak or defect is smaller than that area, it cannot be represented cleanly.
Now compare a narrower lens with a horizontal FOV of 15°. The angular slice per pixel halves. At the same distance, the physical area per pixel roughly halves as well. That often turns an “unresolved smear” into a visible edge.
Important nuance: this improves spatial detail, but it does not guarantee correct temperature readings. If the target surface has low emissivity or reflections, the pixel may resolve the shape while still reporting a temperature influenced by reflected radiation.
How to Choose Without Getting Lost
Start with the smallest feature you need to detect and the distance you must work at. Then choose a lens/FOV so that the feature spans multiple pixels across its width. After that, resolution and pixel pitch help you maintain separation as you refine focus and reduce motion blur.
Example: If you need to distinguish a 10 mm crack at 3 m, you want the crack to cover several pixels across. If it covers only one or two pixels, you’ll see a hint of contrast at best. If it covers five to ten pixels, you can usually trace the crack shape and compare it across frames.
Finally, remember that “sharpness” is the bridge between specs and reality. Focus accuracy, stable mounting, and avoiding wind-driven motion often matter as much as the headline resolution number.
2.3 Frame Rate, Integration Time, and Motion Artifacts
Thermal cameras turn scene energy into numbers by collecting infrared signal over a time window. Two settings control that window: frame rate (how often you get a full image) and integration time (how long each pixel collects signal before it is read out). When motion enters the scene, those choices determine whether you see a crisp pattern or a smeared one.
Frame Rate and What It Changes
Frame rate is the cadence of complete images. If you increase frame rate, you usually reduce the time available to collect signal per frame. That can lower signal-to-noise in each image, so fine temperature differences may look noisier. If you decrease frame rate, each frame can integrate longer, which often improves stability but makes moving objects appear to “lag” behind where you expect them to be.
A practical way to think about it: frame rate controls how frequently you can “snapshot” the scene, while integration time controls how much each snapshot averages over time.
Integration Time and Why It Smears Motion
Integration time is the exposure-like interval during which each pixel accumulates infrared energy. If the scene is still, longer integration time helps because random noise averages out. If the scene moves, longer integration time averages different positions of the moving object into one pixel value.
Example: You inspect a rotating motor housing. With a short integration time, the hot region stays near its true location across frames. With a longer integration time, the hot region spreads in the direction of motion, and edges look softer. The camera is not “guessing”; it is averaging.
Motion Artifacts You Will Actually See
- Trailing edges: A hot object moving across the field leaves a streak behind it. This happens when the object changes position during the integration window.
- Edge smearing: Sharp boundaries between hot and cool areas become gradients. The boundary is being averaged over time.
- Flicker-like changes: If you compare frames, the apparent temperature of a moving feature may jump because different parts of the object occupy the pixel at different times.
- Ghosting with periodic motion: Fans and belts can produce repeating patterns where the thermal signature appears “layered” across frames.
These artifacts are strongest when motion speed is high relative to the camera’s effective exposure time.
A Simple Mental Model for Choosing Settings
Use this rule of thumb: motion artifacts grow when the object moves a noticeable fraction of the pixel footprint during integration time. You don’t need the exact pixel footprint to apply the idea.
Example: If you can see the object move by about one pixel width during a single frame capture, expect smearing. If it moves less than that, edges will look more stable.
Mind Map: How Settings Interact with Motion
Example Workflows for Common Situations
Example: Inspecting a moving conveyor belt
- Goal: identify hot spots without streaks.
- Approach: increase frame rate to shorten integration time, then check whether the hot region stays near the same location from frame to frame.
- If the image becomes too noisy, reduce the distance or improve focus so the hot area fills more pixels, rather than extending integration time.
Example: Checking a stationary electrical panel
- Goal: stable temperature readings for comparison.
- Approach: you can lower frame rate to allow longer integration time, which often makes the temperature map steadier.
- Keep the panel undisturbed during capture so the “averaging” is over time with no meaningful scene change.
Example: Watching a person walk past a thermal camera
- Goal: avoid interpreting motion blur as temperature gradients.
- Approach: use the highest practical frame rate and shorter integration time, then focus on areas that remain still long enough to form a clear boundary.
- If you must interpret a moving edge, treat it as a qualitative indicator rather than a precise measurement.
Quick Checklist for Reducing Motion Artifacts
- Prefer higher frame rate when the target moves noticeably.
- Shorten integration time when edges smear or trailing appears.
- Confirm improvement by watching boundary sharpness, not just color palette changes.
- When comparing images, keep frame rate and integration time consistent so differences reflect the scene, not the camera.
- If noise increases after shortening integration time, improve optics and framing so the target covers more pixels.
Motion artifacts are a direct consequence of time averaging. Once you treat frame rate and integration time as the camera’s “averaging rules,” the artifacts stop being mysterious and start being predictable.
2.4 Optics, Lenses, Filters, and Their Impact on Measurement
Thermal cameras don’t just “see heat.” They collect infrared radiation, focus it, and then convert it into pixels. Optics and filters decide what portion of that radiation reaches the sensor and how sharply it arrives. The result is that measurement quality depends as much on the lens and filter choices as on the sensor.
Lenses and Focus That Actually Matter
A thermal lens forms an image by concentrating infrared energy from each point in the scene onto the corresponding sensor pixels. If focus is off, energy spreads across multiple pixels, lowering contrast and making temperature readouts less trustworthy.
A practical way to think about it: focus controls how “tight” the image is on the sensor. Tight focus improves edge definition, which helps you measure small hot or cold regions without averaging them away.
Example: Small Cable vs. Big Surface
Imagine checking a cable connection that is only a few centimeters wide. If the camera is slightly out of focus, the hot spot’s energy spreads, and the camera may report a lower peak temperature because the hot region blends with cooler surroundings. With correct focus, the peak stays concentrated and the reported temperature better matches the actual hotspot.
Field of View, Distance, and Spot Size
Lenses trade field of view for magnification. A wide field of view lens covers more area but gives less detail per pixel. A narrower field of view lens covers less area but resolves smaller features.
This matters because measurement regions are not infinitely small. If your target is smaller than the camera’s effective spot size at that distance, the camera averages the target with nearby surfaces.
Example: Reading a Valve at Two Distances
At 2 meters, a valve stem might fill enough pixels for a meaningful temperature. At 6 meters, the same stem may occupy only a few pixels, so the camera blends it with the surrounding pipe. The reported temperature can shift downward or upward depending on the contrast and emissivity of nearby materials.
Filters and Spectral Band Control
Most thermal cameras are designed for specific infrared bands, commonly around 7–14 µm. Filters help ensure the sensor receives radiation primarily from that band. Without proper filtering, the sensor could respond to unwanted wavelengths, which can distort temperature calculations.
What Filters Do in Practice
- They reduce sensitivity to out-of-band radiation.
- They improve measurement consistency by limiting what the sensor “listens to.”
- They can affect how the camera responds to reflections from non-target sources.
Example: Window Reflections
If you aim at a warm object through a window, reflections and the window’s own infrared behavior can dominate what the camera sees. A band-matched optical path and appropriate filtering reduce some unwanted contributions, but they can’t eliminate the fundamental issue: the camera measures what reaches the lens, not what you wish were there.
Lens Materials and Transmission
Infrared lenses must transmit the infrared band efficiently. Different lens designs and materials can have different transmission characteristics, which influence signal strength and image noise.
If transmission is lower, the camera may need to rely more on its internal processing to form an image, which can reduce fine contrast. That shows up as “muddy” gradients where temperature differences are subtle.
Example: Low-Contrast Insulation Check
When inspecting insulation behind a wall cavity, temperature differences may be small. A lens with better transmission helps preserve contrast, making it easier to distinguish a slightly underperforming section from the surrounding area.
Aperture, Sharpness, and Depth of Field
The lens aperture affects how much infrared energy enters the system and how sharply it focuses. A larger aperture can improve signal but may reduce depth of field, meaning more of the scene falls out of focus when the camera-to-target distance varies.
Depth of field is especially relevant when you’re not holding the camera perfectly steady or when the target has depth, like a motor housing with recessed parts.
Example: Motor Housing Inspection
If you scan a motor housing and some components sit deeper than others, a narrow depth of field can make one part look sharper and another look blurred. Blurred regions often show lower apparent peaks because energy spreads. The fix is usually operational: reframe, refocus on the region of interest, and avoid mixing multiple depths into one measurement.
Practical Optics Checklist for Better Measurements
- Focus on the measurement target, not the background.
- Use the right field of view so the target fills enough pixels.
- Confirm the camera’s band and filter behavior matches the intended use.
- Keep the lens clean; smudges and dust can reduce transmission and add artifacts.
- Avoid measuring through reflective or transmissive barriers when possible.
Mind Map: Optics and Measurement Impact
Case Example: Choosing Lens Settings for a Hot Spot
Suppose you’re checking a small electrical terminal. Start by ensuring the terminal occupies a meaningful portion of the image. If it’s too small, switch to a narrower field of view lens or move closer. Then focus precisely on the terminal surface. Finally, watch for reflections from nearby metal or glass; if reflections are strong, reposition to reduce them rather than relying on temperature numbers that are being influenced by the wrong radiation path.
2.5 Image Modes, Palettes, and When They Change Interpretation
Thermal cameras can display the same underlying measurements in different ways. Image modes and palettes mainly change how the data is mapped to colors, contrast, and overlays. The measurement math is still based on radiance and calibration, but your eyes can be tricked if you don’t know what the display is doing.
Image Modes That Change What You See
Auto Mode often adjusts contrast and temperature range based on the current scene. That’s convenient, but it can make two photos of the same object look different if the camera re-scales the palette each time.
Manual Range Mode fixes the temperature span used for the color mapping. This is the mode you want for comparisons, because a “warm” color means the same temperature band across images.
Spot and Area Overlay Modes add measurement markers such as a crosshair, a box, or a region-of-interest readout. These overlays are helpful, but they can hide the fact that the camera is averaging pixels. A small box on a textured surface may report a number that doesn’t match the hottest pixel you think you selected.
Picture-in-Picture or Multi-View Modes show additional views like a visible-light overlay (if available) or a second thermal window. The key is to confirm whether both views share the same temperature range and emissivity settings; otherwise, the combined image can suggest agreement when the scales differ.
Palettes That Change How Contrast Feels
A palette is the mapping from temperature (or temperature difference) to color. Two palettes can show the same scene with different apparent “hotness” because they distribute contrast differently.
Rainbow Palettes spread colors across the range, which can make small temperature differences look dramatic. They’re not wrong, but they encourage over-reading.
Gray Palettes tend to be more linear in how humans perceive steps, making it easier to judge gradients without color bias.
High-Contrast Palettes emphasize edges and small changes by compressing mid-range tones. Great for spotting anomalies, but less reliable for comparing absolute temperatures by eye.
Isotherm or Threshold Palettes color only above or below a set temperature. This is useful for “pass/fail” style checks, but it can hide how far above or below the threshold the object actually is.
Mind Map: How Display Choices Affect Interpretation
Example: Same Scene, Different Conclusions
A technician inspects an electrical panel. In Auto Range, the camera stretches the palette so the hottest component becomes “bright.” The next day, the panel is slightly cooler, but Auto Range again stretches the palette, making the same component look equally intense. If the technician relies on the color intensity alone, they may conclude the issue is unchanged.
Switching to Manual Range and setting the temperature span to cover the expected operating range makes the comparison honest. The component’s color now reflects the same temperature band each time, so a shift from, say, 62°C to 58°C is visible without the camera re-scaling the story.
Example: Palette Choice and Edge Readings
Consider a pipe with a small leak. With a high-contrast palette, the plume region shows a sharp boundary, which is useful for locating the leak. If the technician then uses that same palette to estimate how much hotter the plume is than the surrounding pipe, the estimate can be off because the palette compresses mid-range tones. A gray palette with a manual range makes the gradient easier to judge quantitatively.
Example: ROI Size and Averaging Effects
A user places a small measurement box on a hot spot at the edge of a cable. The hottest pixel sits near the boundary, but the box includes cooler pixels around it. The reported temperature is lower than the peak. If the user enlarges the box slightly and rechecks, the value may rise, revealing that the earlier number was an average artifact rather than a true peak.
Practical Checklist Before You Trust a Color
- Confirm whether the camera is in Auto Range or Manual Range.
- Note the temperature span shown on-screen, not just the colors.
- Check that overlays and ROIs are large enough to represent the feature you’re measuring.
- Choose a palette that matches your goal: gray for gradient judgment, high-contrast for detection, isotherm for threshold checks.
- When comparing images, keep emissivity, reflected temperature settings, and range consistent.
When you treat the display as a mapping tool rather than a direct truth machine, the images become easier to interpret—and harder to misread.
3. Sensor Technologies for Heat Detection
3.1 Uncooled Microbolometer Sensors and Their Operating Principles
Uncooled microbolometer sensors measure temperature by detecting tiny changes in how a surface absorbs and releases heat. They do not require cryogenic cooling, which keeps the system practical for everyday thermal cameras. The key idea is simple: infrared energy warms a microscopic sensing element, and the sensor converts that temperature change into an electrical signal.
The Core Components
A typical uncooled microbolometer pixel includes a thin absorbing layer, a temperature-sensitive element, and a thermal isolation structure. The absorbing layer is tuned to the infrared band the camera is designed for, so incoming radiation is more likely to be captured instead of reflected or transmitted. The thermal isolation reduces heat flow to the surrounding substrate, letting the pixel temperature change more noticeably.
The temperature-sensitive element is often made so its electrical resistance changes with temperature. When the pixel warms, resistance shifts slightly. A readout circuit measures that resistance change and turns it into a pixel value.
How Infrared Becomes Electrical Signal
- Incoming infrared radiation reaches the sensor through the camera optics.
- Absorption occurs in the pixel’s sensing stack, raising the local temperature by a small amount.
- Thermal response follows the sensor’s time constant, which depends on thermal mass and thermal conductance.
- Resistance change converts temperature change into a measurable electrical variation.
- Readout and processing translate the electrical signal into a calibrated temperature estimate or a relative image.
A useful mental model is a tiny heat sponge on a weak spring. Infrared adds heat, the sponge warms, and the spring-like isolation prevents the heat from immediately leaking away.
Why “Uncooled” Still Needs Careful Design
Even without cryogenic cooling, the sensor must handle noise and drift. Two effects matter most for beginners:
- Thermal noise: Random fluctuations in the pixel and electronics can look like temperature changes.
- Offset drift: The sensor’s baseline response can shift over time due to temperature changes in the camera body.
To manage this, cameras use internal calibration steps. Many systems periodically adjust the pixel response using a reference state, so the final image reflects scene temperature rather than sensor quirks.
The Role of Readout and Biasing
Microbolometers are typically operated with a bias that allows resistance changes to produce a voltage or current change. This biasing can also introduce self-heating, so the camera must balance sensitivity with stability. Too much bias can warm the sensor and reduce contrast; too little can bury the signal in noise.
Readout electronics also handle the fact that pixels are numerous. Instead of measuring each pixel independently with a dedicated wire, the camera uses multiplexing schemes. That means the system must carefully separate pixel signals during scanning.
Time Constant and Motion Artifacts
Because the pixel temperature does not change instantly, fast motion can smear details. The sensor’s time constant is the characteristic time it takes to reach a certain fraction of the final temperature response. If the scene changes faster than the sensor can respond, the image lags behind reality.
A concrete example: imagine walking past a warm car. If you swing the camera quickly, the warm region may appear stretched or delayed compared to a slower pan. This is not a “camera failure,” it’s the sensor behaving like a small thermal system with inertia.
Mind Map: Uncooled Microbolometer Operation
Example: Comparing Two Surfaces
Suppose you point a thermal camera at two objects at the same actual temperature: a matte black cloth and a shiny metal plate. The microbolometer measures absorbed infrared energy, not just “temperature” directly. If the metal reflects more infrared from the surroundings, the pixel may absorb less energy than the cloth, even though both objects share the same temperature. The result is a contrast difference that comes from how each surface interacts with infrared.
This example matters because it shows the sensor’s job: it measures the energy reaching it. The camera then uses settings and calibration assumptions to interpret that energy as temperature.
Example: What “Time Constant” Looks Like
Place a small warm object in front of the camera and move it across the field of view at two speeds. At a slow speed, the warm spot appears crisp and stays aligned with the object. At a fast speed, the warm spot trails behind the motion and edges look smeared. The sensor is still responding, but the scene changes before the pixel temperature fully catches up.
Summary
Uncooled microbolometer sensors work by turning infrared-driven heating into resistance changes in a thermally isolated pixel. Their performance depends on absorption efficiency, thermal isolation, biasing and readout stability, and the sensor’s response time. Understanding these mechanics helps you interpret images more accurately, especially when motion, reflections, or calibration assumptions are involved.
3.2 Cooled Infrared Detectors and When They Are Used
Cooled infrared detectors are built to be sensitive to tiny temperature differences by reducing their own internal heat noise. In practice, that means the detector is kept at a lower temperature than the surrounding electronics, so the detector’s “background” signal shrinks and the measured infrared signal stands out more clearly.
Why Cooling Changes the Game
Every detector produces noise, even in perfect darkness. For many infrared sensors, a major part of that noise comes from thermal activity inside the detector material. Cooling reduces the number of thermally excited charge carriers, which lowers noise and improves the smallest detectable temperature difference.
A useful way to think about it: an uncooled sensor is like trying to hear a whisper in a room with a steady hum. Cooling reduces the hum. It does not make the whisper louder; it makes the background quieter.
Common Cooled Detector Types
Cooled detectors come in different material families, each with its own strengths.
- Photonic detectors respond to incoming infrared energy more directly. Their performance is often excellent for low-light scenes and long integration times.
- Quantum detectors can be extremely sensitive, especially when you can control the measurement conditions and accept more complex hardware.
You do not need to memorize material names to use the concept. The key idea is that cooled detectors trade complexity for sensitivity and measurement stability.
What Cooling Hardware Looks Like
Cooling is not just “turn it colder.” It requires a system that maintains a stable detector temperature.
- Cryogenic cooling uses refrigerants or cryocoolers to reach very low temperatures.
- Stabilization control keeps the detector temperature steady, because detector response can drift if temperature changes.
This is why cooled systems are typically bulkier and more power-hungry than uncooled cameras.
When Cooled Detectors Are Used
Cooled detectors show up where you need high sensitivity, precise measurements, or performance that holds up under challenging conditions.
-
Low contrast and low signal scenes
- Example: Inspecting a faint thermal anomaly behind a thin layer of insulation where the temperature difference is small and the background is fairly uniform.
- Reasoning: Lower noise helps you separate the anomaly from the scene’s natural variation.
-
Long-range detection
- Example: Monitoring a distant industrial process where the target occupies only a few pixels and the received infrared power is limited.
- Reasoning: Higher sensitivity improves the chance that the target signal rises above noise after atmospheric losses.
-
Spectral measurements
- Example: Using a cooled detector in a system that separates infrared wavelengths to identify gases or material signatures.
- Reasoning: Spectral discrimination often benefits from detectors with strong sensitivity and stable response.
-
Scientific and metrology-style work
- Example: Calibrating a thermal setup where you need repeatable readings across time.
- Reasoning: Cooling and stabilization reduce drift and help maintain consistent detector behavior.
When You Should Prefer Uncooled Instead
Cooled detectors are not automatically “better.” If your scene has strong thermal contrast, you can tolerate higher noise, or you need portability and quick deployment, uncooled systems are often the practical choice.
- Example: Spot-checking electrical panels during routine maintenance where the goal is to find obvious hot spots quickly.
- Reasoning: The added complexity of cooling may not improve outcomes enough to justify it.
Mind Map: Cooled Infrared Detectors and Use Cases
Case Example: Choosing the Detector for a Building Inspection
Imagine you are checking a wall for moisture-related heat loss. In one room, the temperature difference between the affected area and the surrounding wall is obvious. In another room, the difference is subtle because the whole wall is warmed by sunlight.
- Room with obvious contrast: An uncooled camera can often find the issue quickly because the signal is already well above noise.
- Room with subtle contrast: A cooled detector can help by lowering noise, making it easier to distinguish the moisture-related pattern from background variation.
The decision is not about “best technology.” It is about whether the measurement problem is noise-limited or contrast-limited.
Practical Checklist for Deciding
- Is the target signal small compared to the background? If yes, cooling may help.
- Do you need stable, repeatable measurements over time? If yes, cooling can reduce drift.
- Are you constrained by size, power, or deployment speed? If yes, cooled systems may be impractical.
- Do you require spectral discrimination? If yes, cooled detectors are often a strong fit.
Cooled detectors earn their keep when the measurement is hard because the signal is weak, the scene is subtle, or the application demands stability.
3.3 Spectral Bands and Why 7–14 µm Matters
Thermal cameras don’t “see heat” directly; they measure infrared radiation in specific wavelength ranges. Those ranges are called spectral bands, and the band you use strongly affects what kinds of surfaces look similar, what kinds of materials look different, and how much the atmosphere gets in the way.
Most beginner confusion comes from mixing up three ideas: wavelength, temperature, and emissivity. Wavelength tells you what the camera is sensitive to. Temperature determines how strongly an object emits at each wavelength. Emissivity tells you how efficiently the object emits compared with an ideal blackbody at that wavelength.
What 7–14 µm Means in Practice
The 7–14 µm band is the long-wave infrared (LWIR) region. A camera designed for this band typically measures radiation that is strongly influenced by object temperature in the range most people care about: roughly room temperature to a few hundred degrees Celsius. That’s why LWIR is common for building inspections, electrical maintenance, and many industrial checks.
A key practical point: the same object can look different in different bands because emissivity and reflectivity vary with wavelength. For example, a painted wall and a shiny metal surface might both be “warm,” but their emissivity in LWIR can differ enough that one shows clearer temperature contrast than the other.
How Spectral Bands Change Contrast
Thermal contrast is the difference in measured radiation between two areas. That difference depends on:
- Emission strength at the camera’s wavelengths (temperature effect)
- Emissivity at those wavelengths (material effect)
- Reflected radiation from the environment (surroundings effect)
- Transmission through the atmosphere (path effect)
To see the contrast effect without math, imagine two surfaces at the same temperature. If Surface A has high emissivity in 7–14 µm, it emits strongly and dominates the measurement. If Surface B has low emissivity in that band, it reflects more of the surroundings, so its apparent temperature can shift when the background changes.
The Atmosphere Factor
Infrared radiation travels through air, and air is not equally transparent at all wavelengths. In the 7–14 µm region, the atmosphere is generally more usable than in some other infrared regions for typical inspection distances. That means fewer surprises from absorption and scattering, especially when you’re not working in a lab.
A practical consequence: if you compare two cameras with different bands at the same scene and distance, their readings can diverge even when both are “thermal.” The difference may be partly due to how much the air absorbs at their wavelengths.
Mind Map: Spectral Bands and Their Effects
Example: Two Surfaces at the Same Temperature
Suppose you scan a warm electrical panel with two areas: a matte painted cover and a polished metal fastener. Both are at the same actual temperature.
- The painted cover likely has higher emissivity in 7–14 µm, so the camera measurement is dominated by its own emission.
- The polished fastener likely has lower emissivity in 7–14 µm, so the camera measurement includes more reflected radiation from the panel interior and nearby objects.
Even if the fastener is not hotter, it can appear cooler or hotter depending on what it reflects. This is why emissivity settings and surface preparation matter more than people expect.
Example: Why Band Choice Affects Inspection Confidence
Imagine you’re checking a building façade for insulation issues. You want stable temperature contrast between insulated and uninsulated regions. If the façade includes materials with emissivity that behaves differently across wavelengths, a camera band that produces stronger emissivity separation will make the pattern clearer.
In 7–14 µm, many common building materials provide usable contrast because their emissivity in this band is often sufficiently different from one another. That doesn’t mean it’s perfect for every surface, but it tends to be practical for everyday work.
Quick Self-Check for Beginners
When you see a thermal image, ask two questions:
- Is the camera designed for 7–14 µm, and does that match the materials in the scene?
- Are any key surfaces shiny or reflective, where emissivity and reflections in this band can dominate the reading?
If you can answer those, you’ll interpret spectral-band effects more reliably and waste less time chasing “mystery heat.”
3.4 Noise Sources, NETD, and Practical Implications for Users
Thermal cameras don’t “see temperature” directly. They measure tiny differences in infrared energy, then convert those differences into pixel values. Noise is what happens when the measurement chain adds small, unwanted variations. NETD is the single-number way many cameras summarize how small a temperature difference they can reliably distinguish under typical conditions.
Noise Sources You Can Actually Notice
Detector noise is the baseline randomness inside the sensor. Even if the scene is perfectly still and uniform, individual pixels fluctuate. This shows up as grain in low-contrast areas, especially when you zoom in on a smooth surface.
Readout noise comes from the electronics that sample and digitize the sensor signal. It often behaves like a small amount of extra randomness added during conversion. If you compare two cameras on the same scene, readout noise can be one reason their images “feel” different even when their resolution matches.
Flicker and drift are slower changes over time. Drift can make a static target slowly shift in apparent temperature, which is why averaging multiple frames or using stable setups matters.
Photon noise is tied to the amount of infrared energy reaching the sensor. Colder scenes or shorter integration times reduce signal, which makes random fluctuations relatively larger. In practice, this means the same camera can look noisier in a dim thermal scene than in a warmer one.
Optical and scene noise includes effects like uneven illumination, reflections, and small environmental variations. A shiny surface can “move” in temperature appearance because the reflected background changes, even if the object itself is steady.
NETD Meaning and How to Interpret It
NETD stands for Noise Equivalent Temperature Difference. A common interpretation is: the camera can distinguish a temperature difference of about NETD under specified test conditions. Lower NETD generally means better sensitivity, but the real-world outcome depends on the scene and settings.
NETD is not a promise that every pixel will show every tiny difference. It’s closer to a statistical capability of the system. If the scene has low contrast, you may still struggle to separate subtle features even with a low NETD camera.
A practical way to think about NETD is to compare it to the temperature differences you care about. If you’re trying to spot a 0.5 °C difference and your camera’s NETD is around 50 mK (0.05 °C), the sensitivity is in the right ballpark. If you’re trying to spot 0.1 °C differences, you’ll likely need careful technique, stable conditions, and good emissivity choices.
Mind Map: Noise, NETD, and What Changes the Result
Practical Implications for Users
1) Contrast beats sensitivity. If the object and background are nearly the same temperature, noise dominates. For example, checking a cable in a panel: if the load is steady and the cable is only 0.2 °C above the surrounding metal, the image may look flat. Waiting for a predictable load change or measuring during a known operating state often produces clearer results than simply changing palettes.
2) Integration time and motion trade off. Longer integration can improve signal-to-noise, but it also makes motion blur more likely. Imagine inspecting a fan housing while the fan is spinning. If you increase integration to reduce noise, the moving parts smear, and the “blur” can hide the very hot region you’re trying to locate.
3) Averaging helps, but only when the scene is stable. Averaging multiple frames reduces random noise. If the target temperature is changing quickly, averaging can smear the change and mislead your interpretation. A simple rule: average when nothing meaningful is moving or changing.
4) Emissivity errors can masquerade as noise. If you set emissivity incorrectly, the camera’s temperature output can jump around as the reflected background changes. That can look like noise, but it’s actually a model mismatch. For instance, measuring a painted surface versus bare metal: bare metal often reflects the environment, so the apparent temperature can fluctuate even when the object is steady.
5) Region choice matters. NETD is about distinguishing small differences, but your measurement tool might average over a region that includes edges, reflections, or mixed materials. A small hot spot near a cooler boundary can be diluted by a large measurement box. In practice, place the measurement region to match the physical area you intend to characterize.
Example: Choosing a Measurement Strategy Based on NETD
Suppose you’re checking a refrigeration unit for a weak cooling section. The expected temperature difference between the suspect area and the rest of the evaporator might be around 1–2 °C during steady operation. Even a modest NETD camera can usually show that difference if emissivity is handled reasonably and the scene is stable.
Now imagine you’re trying to detect a tiny 0.2 °C difference to compare two similar panels. Here, noise becomes a major factor. You’ll get better results by improving stability (same distance, same angle, minimal airflow), using consistent emissivity settings, and measuring small, well-defined regions rather than relying on a single frame.
In short: NETD tells you how small a difference the camera can statistically separate, but your job is to make that difference visible by controlling contrast, motion, emissivity, and measurement geometry.
3.5 Calibration Concepts for Sensor Accuracy
Calibration is the process of tying what a sensor reports to what the scene actually is. For thermal sensors, that “tie” is usually built from known reference conditions, then applied through correction steps so your measurements behave consistently.
What Calibration Corrects
A thermal camera or sensor can be off for several reasons at once:
- Offset errors shift all readings up or down. If a sensor always reports 2°C too high, that’s an offset.
- Gain errors scale readings. If a sensor reports 10°C too high at high temperatures but not at low ones, gain is involved.
- Non-uniformity means different pixels behave differently. One pixel might run warm compared to its neighbors.
- Environmental effects change behavior with temperature, especially inside the camera.
Calibration aims to reduce these errors so that the same target gives the same reported temperature across time and conditions.
Calibration Targets and Why They Matter
Most calibration uses a reference surface with a known temperature and known thermal behavior. In practice, that means you need a target whose temperature is stable and whose emissivity is controlled.
A simple way to think about it: the sensor measures radiation, not “temperature.” Calibration converts radiation measurements into temperature estimates by assuming a relationship between emissive behavior and temperature.
Two Key Ideas: Uniformity and Linearity
Uniformity is about pixel-to-pixel consistency. If the camera’s center pixel and edge pixel disagree on the same uniform target, you’ll see blotchy temperature maps.
Linearity is about whether the sensor’s response follows a predictable curve across temperature. If the sensor is accurate at one temperature but drifts at another, linearity is the issue.
A good calibration reduces both, but they’re not the same problem.
Mind Map: Calibration Concepts for Sensor Accuracy
How Calibration Is Applied in Real Use
Calibration data is typically stored as correction parameters. When you measure a scene, the camera uses those parameters to adjust raw sensor outputs.
A practical implication: if you change conditions that the calibration assumed were stable—like optics contamination, large ambient shifts, or emissivity assumptions—you can undo the benefit of calibration.
Example: Spot-Checking a Camera with a Reference Surface
Imagine you have a flat metal plate you can heat to a known temperature using a controlled heater. You measure it with the thermal camera.
- Set the camera emissivity to match the plate’s effective emissivity.
- Let the plate reach steady temperature and wait for the camera to stabilize.
- Record the reported temperature at the center and then at the edges.
If the center reads 60.0°C and the edges read 58.5°C, you have a uniformity issue. If the plate is 60°C but the camera reads 55°C everywhere, you likely have an offset or emissivity mismatch.
Now repeat at a second temperature, say 30°C.
- If the error stays about the same (e.g., always -5°C), that points to offset.
- If the error changes with temperature (e.g., -5°C at 60°C but -1°C at 30°C), that points to gain or linearity.
Example: Emissivity Mistakes That Look Like Calibration Errors
Suppose you calibrate your workflow using a matte surface, then later measure a glossy surface without changing emissivity settings. The camera will treat the glossy surface as if it emits like the matte one, but it actually reflects more radiation from the surroundings.
The result can mimic calibration drift: readings shift even though the sensor itself hasn’t changed. The fix is not “recalibrate the camera,” but correct the emissivity assumption and reduce reflections.
A quick test: compare the reading of the glossy target to a matte patch placed next to it under the same conditions. If the matte patch behaves as expected and the glossy one doesn’t, emissivity and reflections are the likely culprits.
Verification Mindset: Repeatability Beats One-Off Accuracy
Calibration isn’t proven by a single measurement. Accuracy claims hold when you can reproduce results.
Use a simple verification routine:
- Measure the same target in the same spot multiple times.
- Move the target to different positions in the camera’s view.
- Repeat after a short time interval.
If readings vary wildly, you’re dealing with setup variability (emissivity, reflections, focus, or environment), not just sensor calibration.
Case Study: Interpreting a Temperature Discrepancy
You inspect an electrical panel. The camera reports 78°C on a suspected hot spot. A contact thermometer reports 72°C on the same location.
A structured check:
- Emissivity: Is the panel surface reflective or painted? If emissivity is set too low, the camera can under- or over-report depending on reflections.
- Spot size and distance: If the camera’s measurement area includes cooler surrounding metal, the reported value can be pulled down.
- Surface condition: Contact thermometers measure at the contact point; thermal cameras average over an area and may see a slightly different effective temperature.
After adjusting emissivity and ensuring the measurement area matches the contact point, the discrepancy shrinks to 2–3°C. That outcome suggests the original mismatch was mostly about measurement conditions rather than a failing sensor.
Key Takeaways
Calibration improves accuracy by correcting sensor behavior against reference conditions. Sensor accuracy in the field depends on matching the assumptions behind calibration—especially emissivity, reflections, optics cleanliness, and measurement geometry—so the corrections you paid for in the lab still apply to your scene.
4. Measuring Temperature Correctly with Thermal Imaging
4.1 Emissivity Settings and How They Affect Reported Temperature
Emissivity is the fraction of infrared energy a surface emits compared with an ideal “perfect emitter” at the same temperature. Thermal cameras use that number to convert measured infrared radiation into a temperature reading. If the emissivity setting is wrong, the camera can still produce a plausible image, but the temperature value can drift in a predictable way.
What the Camera Is Actually Doing
A thermal camera measures radiation coming from the scene. That radiation is a mix of:
- Emitted radiation from the object itself.
- Reflected radiation from the environment (walls, sky, lamps, the operator’s warm body).
- Transmitted radiation if the material allows infrared to pass through (rare in typical inspection targets).
When you set emissivity, you’re telling the camera how much of the measured radiation should be treated as “emitted” versus “reflected.” The camera also needs an ambient or reflected temperature reference, which many cameras estimate or let you enter.
The Practical Effect of Emissivity Errors
If you set emissivity too high, the camera assumes the surface emits more than it really does. To match the measured radiation, it will report a lower temperature than the true one.
If you set emissivity too low, the camera assumes the surface emits less than it really does. To match the measured radiation, it will report a higher temperature than the true one.
This sign behavior matters because it helps you sanity-check results without guessing wildly.
Mind Map of Emissivity Settings
Examples You Can Recreate
Example 1: Painted Wall vs Bare Metal
Imagine measuring a painted white wall and a bare aluminum panel with the same camera settings.
- The painted wall usually has higher emissivity. If you leave emissivity at a default that’s too low, the camera will report the wall as hotter than it is.
- The bare aluminum panel usually has low emissivity and strong reflections. If you set emissivity too high, the camera will report the panel as cooler than it is, and the reading may change noticeably when you move your body or the room lighting shifts.
A quick check: if the “temperature” of the shiny metal changes when you step sideways, emissivity and reflections are doing most of the work.
Example 2: The Tape Patch Method
Suppose you need a more trustworthy temperature on a shiny surface. You can apply a small piece of matte tape (or a matte emissivity patch) to the area, then measure the taped spot.
Reasoning:
- The tape surface has higher, more stable emissivity than the metal.
- The camera reading becomes dominated by the tape’s emission rather than the metal’s reflections.
Best practice: measure the taped area only, and keep the tape patch small enough that it doesn’t include edges of the underlying metal.
Example 3: One Spot, Mixed Materials
You point at a cable connector where the measurement region includes both a dark rubber sleeve and a metallic connector.
If you set emissivity based on the rubber but the camera’s spot includes metal, the reported temperature becomes a compromise. The camera may show a single number, but the physics is mixed: part of the radiation comes from a high-emissivity region and part comes from a low-emissivity, reflective region.
Fix: use a smaller region of interest, or measure each material separately.
How to Choose an Emissivity Setting Without Guessing
- Start with the surface type: matte painted surfaces generally behave differently than polished metals.
- Use the camera’s presets when they match the material: it’s better than random numbers.
- Confirm with a reference patch when accuracy matters: a tape patch or a known matte target gives you a reality check.
- Watch for sensitivity to reflections: if readings change with your position, emissivity and reflected temperature assumptions are likely the limiting factor.
A Quick Sanity Checklist
- Does the “hot” reading on a shiny object move when you move?
- Are you measuring only one material type within the spot?
- Did you set emissivity higher for matte surfaces and lower for shiny ones?
If you answer “yes” to the first two and “yes” to the third, your emissivity setting is doing its job instead of quietly sabotaging your temperature number.
4.2 Reflected Temperature and Ambient Compensation Basics
A thermal camera reports temperature by assuming it can estimate how much infrared energy is coming from the target. Real scenes include energy reflected from the surroundings, plus energy emitted by the target itself. If you ignore reflections, shiny or reflective surfaces can look “too hot” or “too cold” even when their true temperature is steady.
Reflected Temperature in Plain Terms
Think of a surface as a mix of two contributions:
- Emitted energy: what the surface produces based on its own temperature.
- Reflected energy: what the surface bounces back from nearby objects.
The camera’s emissivity setting controls how much of the measured signal it attributes to emission versus reflection. Emissivity is not just a number you type; it changes the math the camera uses.
Example: A painted wall (high emissivity) mostly emits its own infrared energy, so reflections matter less. A polished metal pipe (low emissivity) reflects the warm ceiling and lights, so the camera may show a temperature closer to the surroundings than the pipe.
The Role of Ambient Compensation
Ambient compensation is the camera’s way of accounting for the reflected component by estimating the “background” infrared temperature around the target. Many cameras use an ambient temperature value and/or a reflected temperature model tied to the scene.
If the camera does not know the reflected background temperature, it has to guess. That guess can be wrong when:
- The background includes a strong heat source (sunlit wall, warm machinery, hot duct).
- The target is small relative to the field of view, so the camera “sees” more background than you expect.
- The camera is close to reflective surfaces, where reflections dominate.
Example: You measure a window frame indoors. The glass reflects the warm room lights and walls. If you set ambient compensation to a generic room value, the reflected component may still be higher than your estimate, shifting the reported temperature.
A Practical Mind Map for Reflections and Ambient
How to Set Up for Better Reflected Temperature Handling
-
Identify the surface type before you touch settings. If it’s matte paint, assume reflections are less important. If it’s metal, glass, glossy plastic, or wet surfaces, treat reflections as a major contributor.
-
Control what the camera sees around the target. Frame the shot so the background behind the target is uniform. A simple move—re-aiming slightly—can replace a mixed background with a more consistent one.
-
Use emissivity settings that match the surface. If you’re unsure, do a quick check: compare the camera reading to a known reference (like a contact thermometer on a matte patch). If the emissivity is wrong, ambient compensation cannot fully fix it.
-
Set ambient compensation using the actual background temperature. If your camera allows a reflected temperature input, use a measurement of the background area that the target “sees.” If it uses an ambient temperature value, choose a value that matches the infrared environment, not just the air temperature.
Example: Measuring a stainless-steel latch on a door. The latch reflects the hallway. If the hallway is warmer than the latch, the camera may report a higher temperature. To reduce error, aim so the latch reflects a cooler, uniform wall, then set ambient compensation to match that wall’s infrared temperature.
Quick Calculation Intuition Without Math Overload
You can build intuition with this rule of thumb:
- High emissivity → the camera trusts the target’s own emission more.
- Low emissivity → the camera trusts the reflected background more.
So when you change ambient compensation, you should expect the reported temperature to move more for low-emissivity targets than for high-emissivity ones.
Example: Take two readings of the same object area: one on a matte sticker and one on the bare metal beside it. Adjust ambient compensation. The matte sticker reading barely changes; the bare metal reading shifts noticeably.
Common Beginner Mistakes
- Using air temperature as ambient infrared temperature. Air temperature is not the same as the infrared temperature of the surrounding surfaces.
- Measuring a small target against a hot background. The camera averages the scene; reflections from the background can dominate.
- Changing emissivity and ambient compensation at the same time without tracking which one caused the change. Make one change, observe the effect, then adjust the next.
Mini Workflow You Can Repeat
- Choose emissivity based on surface type.
- Frame the target so the background is simple and consistent.
- Set ambient or reflected temperature to match the background you framed.
- Take a reading and note whether the result is stable when you slightly reframe.
If the reading swings wildly when you reframe, reflections are likely dominating, and the background temperature estimate is the lever to pull.
4.3 Distance, Spot Size, and the Limits of Point Measurements
Thermal cameras report temperature for pixels and for measurement tools like “spot” or “point.” Those tools are only as trustworthy as the area they actually sample. Two ideas control this: distance-to-target and spot size.
Distance Changes What Your Camera “Sees”
Infrared optics form an image. As you move farther away, the target occupies fewer pixels. That means the camera averages over a smaller portion of the scene, but it also means each pixel covers a larger physical patch on the target.
A practical way to think about it: if you stand close to a wall and look at a small mark, you can tell where the mark ends. Step back, and the mark blends into the surrounding paint. Thermal imaging behaves the same way, except the “blend” happens in pixel coverage.
Example: You measure the temperature of a hot electrical terminal. At 0.5 m, the terminal spans many pixels, so the spot measurement lands mostly on the metal. At 3 m, the terminal might shrink to a handful of pixels, and the spot tool may include nearby cooler insulation, lowering the reported temperature.
Spot Size Defines the Physical Sampling Area
Many thermal devices specify a spot size ratio, often written like “D:S” (distance to spot). D is the distance to the target, and S is the diameter of the area that contributes to the measurement. Even if your camera doesn’t print D:S, the concept still applies: the measurement area grows with distance.
If your spot tool is smaller than the target, you get a more “pure” reading. If the spot tool is larger than the target, you get a mixture of target and background.
Example: Suppose the device effectively samples a circular area whose diameter is 10 mm at your working distance. If the hot component is only 6 mm across, the measurement inevitably includes surrounding cooler material. The reading becomes a weighted average, not the component’s true temperature.
Limits of Point Measurements
Point measurements are convenient, but they are not magic. The main limits are mixing, edge effects, and emissivity mismatch.
- Mixing at the edges: When the spot overlaps both hot and cool regions, the reported temperature sits somewhere in between. This is especially common when measuring small objects like fasteners, pinholes, or narrow cracks.
- Edge effects from focus and alignment: If the image is slightly out of focus or the spot reticle is not centered, the sampled area shifts. Even a small misalignment can matter when the target is only a few pixels wide.
- Emissivity mismatch: If the target surface has different emissivity than the nearby background, the camera’s temperature calculation can be biased. A glossy or reflective surface can also cause the camera to “see” reflected surroundings instead of only the object’s own emission.
Mind Map: Distance and Spot Size
A Simple Decision Rule for Better Spot Readings
Before trusting a point value, ask two questions:
- Does the target occupy enough pixels to be larger than the spot area?
- Is the spot fully inside the target with a margin?
If the answer is “no,” switch to a region measurement (area/box) or move closer until the target fills the measurement area.
Example: Measuring a Small Hot Spot on a Pipe
Scenario: You want the temperature of a small leak area on a pipe elbow. The leak is roughly 20 mm across.
Step 1: Start with a wider view and locate the hottest region using a palette that makes gradients easy to see.
Step 2: Place the spot tool on the center of the hot region, then check whether the spot reticle stays entirely over the hot area. If the spot overlaps the cooler pipe surface, the reading will be pulled downward.
Step 3: Move closer in small increments and repeat the spot measurement. If the value increases and stabilizes as you approach, you were previously averaging with cooler surroundings. If it stays the same, the spot likely already matches the target area.
Step 4: If you cannot move closer, use a box/area measurement that matches the hot region size rather than a tiny point.
Example: Distance Test to Reveal Averaging
Pick a target with a clear temperature difference, like a warm metal plate next to a cooler surface. Measure at two distances.
- At the closer distance, the spot should land mostly on the warm plate, and the reading should be higher.
- At the farther distance, the spot area grows and starts including the cooler surface, so the reading drops.
This test doesn’t require special equipment. It teaches you how your specific camera and optics behave in your typical working conditions.
Practical Takeaways
Distance determines spot size, spot size determines mixing, and mixing determines whether a “point” is a true point or a compromise. When the target is small, treat point measurements as provisional and confirm by moving closer, checking centering, or switching to an area measurement that matches the physical size of what you’re actually trying to measure.
4.4 Atmospheric Effects, Absorption, and Practical Mitigation
Thermal cameras measure infrared energy that travels from the target to the lens. The atmosphere is part of that path, so it can weaken the signal, add its own radiation, and blur the relationship between “what is hot” and “what looks hot.” The good news: most mitigation is practical and repeatable.
What the Atmosphere Does to Infrared Signals
Absorption: Water vapor and carbon dioxide absorb specific infrared wavelengths. If your camera is tuned to a band that overlaps absorption lines, distant targets can appear cooler than they really are because less energy reaches the sensor.
Emission: The atmosphere is not transparent. Warm air emits infrared energy, which the camera can interpret as coming from the scene. This effect is usually small at short distances, but it grows with range and with temperature differences between air and target.
Scattering: Infrared scattering is generally weaker than visible scattering, but aerosols, fog, and smoke can still reduce contrast. You may notice that everything becomes more uniform in temperature, even when the scene has real hot and cold areas.
Net effect: The camera’s temperature readout is only as accurate as the assumptions behind its correction. When the atmosphere changes, those assumptions can drift.
Mind Map: Atmospheric Effects and Their Symptoms
Practical Mitigation That Actually Works
1. Shorten the path length Atmospheric effects scale with distance. If you can move closer by even a small amount, you often gain more accuracy than by changing camera settings. Example: In a parking-lot inspection, a roof leak that reads 35°C at 30 m might read 38°C at 20 m under the same conditions. The difference is not “the leak heating up”; it’s the atmosphere letting more of the target’s energy reach the lens.
2. Measure when the air is stable Rapid temperature swings and strong humidity changes can shift absorption and emission. A simple approach is to take a baseline image, wait a few minutes, and confirm whether the scene’s apparent temperatures drift. Example: If a wall that should be uniform keeps changing by several degrees across a short interval, treat the readings as condition-dependent and focus on relative patterns rather than exact numbers.
3. Use emissivity correctly before blaming the atmosphere Atmospheric issues can masquerade as emissivity errors. If emissivity is wrong, you can get systematic bias that looks like atmospheric attenuation. Mitigation: set emissivity using a known surface type (paint, bare metal, concrete) and then compare nearby points at similar distances. If the bias is consistent across distances, emissivity is likely the culprit; if it grows with distance, atmosphere is more likely.
4. Control for reflected and background radiation Atmospheric emission adds to the background. If you measure a small object against a large, warm background, the camera may blend contributions. Mitigation: frame the measurement so the region of interest is not dominated by sky, sunlit surfaces, or warm walls at different distances.
5. Use reference targets at the same distance A reference target helps separate “camera assumptions” from “scene reality.” Example: Place a matte, high-emissivity reference patch (or a known calibration sticker) on a surface at the same range as the area you’re evaluating. If the reference reads low by an amount that increases with distance, you have evidence of atmospheric attenuation affecting the measurement.
6. Repeat from two distances You can’t directly measure atmospheric absorption with most beginner setups, but you can test its influence. Example: Take a reading of the same electrical cabinet component from 5 m and 10 m. If the apparent temperature drops significantly with distance while the component is stable, treat the longer-range reading as less reliable for absolute temperature.
Example Workflow for a Real Scene
- Pick a target with stable conditions, like a motor housing that is already running.
- Set emissivity based on the surface finish and confirm focus.
- Capture an image at the closest practical distance. Record the temperature of a small region on the target.
- Capture again from a farther position without changing emissivity or palette.
- Compare the change. If the farther reading is consistently lower and the background looks flatter, atmospheric absorption and emission are likely contributing.
- Mitigate by moving closer for the final measurement and using the nearer reading for reporting.
What to Write in Your Notes
When atmosphere matters, your documentation should reflect it. Record distance, approximate humidity conditions (clear/dry vs foggy/humid), and whether you used a reference target. This turns “the number seems off” into a measurable reason.
Atmospheric effects are not a mystery; they’re a predictable consequence of infrared traveling through a non-transparent medium. The best mitigation is reducing uncertainty by controlling distance, verifying with references, and using repeat measurements to confirm what changed.
4.5 Using Reference Targets and Simple Verification Methods
Thermal cameras report temperature based on assumptions: emissivity, reflected temperature, distance, and optics. Reference targets and quick checks help you verify those assumptions before you trust the numbers.
Reference Targets That Make Sense
A reference target is a surface with known or controlled thermal behavior. You use it to confirm that your camera is behaving consistently, not to magically correct every error.
Two practical categories work well for beginners:
-
Known-emissivity surfaces for checking temperature readout.
- Example: a matte black tape patch (common in field work) used as a temporary emissivity reference.
- Why it helps: tape is usually close to “high emissivity,” so the camera’s emissivity setting matters less than it would for shiny materials.
-
Stable temperature references for checking repeatability.
- Example: a small metal block heated to a steady temperature, then left undisturbed while you measure it from the same distance.
- Why it helps: if the camera is stable, the reported temperature should drift slowly and predictably.
Mind Map: Reference Targets and Verification
Method 1: Same Target, Same Settings
Pick one target and keep everything else fixed. Measure it at least three times.
Example:
- Place a matte black tape patch on a surface.
- Set emissivity to the value you plan to use for that patch.
- Measure the tape patch temperature, then wait 10–20 seconds and measure again.
What you’re looking for:
- If the readings jump wildly, the problem is usually motion, focus changes, or a bad emissivity/reflection setup.
- If the readings are steady but offset from what you expect, the emissivity value or reflected temperature input is likely off.
This method is simple because it isolates variables. You’re not trying to prove absolute accuracy; you’re checking whether your workflow is consistent.
Method 2: Distance and Angle Check
Thermal cameras are sensitive to optics and geometry. A target that looks fine at one distance can produce different readings at another.
Example:
- Measure the same tape patch at 0.5 m, then at 1.0 m.
- Keep the camera settings unchanged.
- Ensure the target fills a similar portion of the image.
What you’re looking for:
- If the reading changes more than you’d expect from normal cooling, the target may be too small in the frame, or the camera may be focusing differently.
- If the reading changes mainly when you move off-axis, reflections and spot size effects are likely involved.
A good rule of thumb: if you can see the target’s edges clearly in the thermal image, you’re less likely to mix in background pixels.
Method 3: Reflections Check with Controlled Surfaces
Reflections matter most for shiny or glossy objects. You can test your setup by comparing a high-emissivity target to a reflective one.
Example:
- Place a matte black tape patch on a board.
- Next to it, place a shiny metal strip.
- Measure both from the same position.
Expected behavior:
- The tape patch should report a temperature that tracks the actual surface heating more reliably.
- The shiny strip may show a temperature that seems “too influenced” by the environment.
How to use this:
- If the tape patch looks reasonable but the shiny strip looks erratic, you’ve learned something useful: your emissivity/reflection assumptions are probably fine for matte surfaces and not for reflective ones.
Method 4: Multi-Region Spot Checks
Single-point readings can be misleading because the camera averages over a small area, and edges often contain mixed materials.
Example:
- On a target surface, define three regions: center, near-edge, and background-adjacent.
- Compare the reported temperatures.
What you’re looking for:
- The center should be the most stable.
- Near-edge regions often differ due to edge effects, slight focus changes, or emissivity transitions.
If the center and edge are wildly different, you should avoid using edge pixels for temperature claims.
What to Record for Verification
Write down the inputs that affect the reading. A short log prevents “mystery drift” later.
- Emissivity setting used
- Reflected temperature setting used (if your camera asks for it)
- Distance from camera to target
- Focus state (focused or not)
- Any changes in camera mode or palette
- Time between measurements
Quick Verification Checklist
- Target is matte or has a known high-emissivity patch
- Target fills enough of the frame to avoid edge mixing
- Camera focus is stable
- Same settings used for repeated measurements
- At least one comparison region is checked (center vs edge)
Reference targets and simple checks won’t remove all uncertainty, but they do something valuable: they tell you whether your measurement workflow is behaving before you start interpreting the scene.
5. Optics, Distance, and Focus for Reliable Results
5.1 Focus, Parallax, and Why Blurry Images Mislead
Thermal cameras can look sharp even when the measurement is not. Focus and parallax determine whether the camera is actually sampling the surface you think it is. When either goes wrong, the image may still look “reasonable,” while the temperature readout quietly drifts.
Focus and Why It Affects Temperature
Focus controls how clearly the camera separates fine details. In a thermal camera, that separation matters because each pixel reports energy from a small patch of the scene. If the lens is out of focus, energy from neighboring patches mixes together.
A simple example: imagine a warm pipe next to a cooler wall. When the camera is focused on the wall, the pipe’s edges blur into the wall region. The camera then averages some pipe energy into the wall pixels, making the wall look warmer than it is. If you place a temperature spot on the “wall,” you may be measuring a blend.
Blurry focus also changes how edges appear. Sharp edges show a steep transition between temperatures. Blurry focus spreads that transition over more pixels, so the same spot size covers a larger mix of hot and cold areas.
Parallax and the Gap Between Where You Aim and What You Measure
Parallax happens when the camera’s measurement path and the display/aiming reference are not perfectly aligned. Many thermal cameras have a built-in display and a visible marker or reticle. If the marker is not exactly over the same optical path as the sensor, the marker can point to one location while the sensor samples another.
This becomes noticeable at close distances. Example: you hold the camera 0.5 m from a door handle. The handle is small and has a strong temperature contrast with the surrounding door. If parallax shifts the measurement by even a few pixels, the reading can jump from “handle temperature” to “door temperature.” The image may show the handle near the reticle, but the sensor may be sampling slightly to the side.
Parallax is also affected by how you hold the camera. Tilting the device changes the apparent alignment between the reticle and the sampled patch.
How Blurry Images Mislead in Practice
Blurry images mislead in three common ways:
- Edge blending: Hot and cold regions smear together, shifting spot readings toward the average.
- Misleading region-of-interest selection: A box or area measurement may include pixels that should not be included.
- False confidence: The camera can still show a recognizable scene, so you assume the numbers are tied to the visible edges.
A concrete scenario: checking an electrical panel for hot connections. A loose connection can create a small hot spot. If the camera is slightly out of focus, the hot spot spreads into nearby cooler metal. The peak temperature drops, and the “hot area” grows. That can lead you to miss the exact component that needs attention.
Mind Map: Focus and Parallax Failure Modes
Quick Checks That Prevent Most Errors
1) Focus check using a high-contrast target. Point at a surface with a clear boundary, like a warm mug on a cool counter. Adjust focus until the boundary is crisp. Then place the same spot on the mug and on the counter. If the readings keep drifting as you refine focus, you were measuring a blend.
2) Parallax check by moving your aim slightly. Keep the camera at the same distance and gently shift the reticle across a small, high-contrast object. If the temperature changes abruptly when the object stays centered in the image, parallax or focus is likely involved.
3) Use distance as a lever. If you must measure a small object, step back if optics allow. Increasing distance reduces the impact of small reticle offsets because the object occupies more pixels.
Example: Door Handle Measurement
You want the temperature of a door handle. The handle is glossy and warmer than the door.
- If focus is off, the handle’s warm edge blurs into the door. A spot placed on the handle reads too low or too high depending on which side the blur spreads.
- If parallax is present, the spot may land on the door even though the reticle looks aligned. The reading then matches the door temperature.
The fix is straightforward: focus on the handle boundary, then confirm by placing the spot on the handle center and repeating after a small aim adjustment. Consistent readings indicate you are sampling the intended surface.
5.2 Spot Size, Minimum Measurable Area, and Edge Errors
A thermal camera reports temperature for pixels, but your measurement is only as trustworthy as the smallest region that actually contributes to those pixels. Two ideas keep you out of trouble: spot size (how much area a measurement “sees” at a given distance) and minimum measurable area (the smallest target you can measure without the edges contaminating the reading).
Spot Size: Why Distance Changes Everything
Spot size grows with distance because the camera’s optics spread the field of view. Even if you draw a neat measurement box, the camera is averaging energy from a larger footprint than you might expect.
Practical example: You measure a cable lug at 3 m and then at 10 m. At 3 m, the lug fills most of the measurement region, so the reported temperature tracks the lug. At 10 m, the same lug occupies only part of the region, and the surrounding cooler metal and insulation start influencing the average.
A useful mental model is simple: if your target is smaller than the camera’s effective footprint, the camera is measuring a mix of target plus neighbors. That mix is not “wrong,” but it is not the temperature of the target alone.
Minimum Measurable Area: When Edges Start to Lie
Minimum measurable area is the smallest target size that can be measured with acceptable accuracy. Targets smaller than this threshold suffer from edge errors, where pixels at the boundary include both the target and the background.
Edge errors show up as:
- Temperature underestimation for hot objects (hot pixels get diluted by cooler surroundings).
- Temperature overestimation for cold objects (cold pixels get diluted by warmer surroundings).
- Inconsistent readings when you slightly move the camera or change focus, because the boundary pixels shift.
Concrete example: A small electrical connector is hotter than the surrounding panel. If the connector is smaller than the minimum measurable area, the camera’s “hot spot” may look muted. You might conclude the connector is only mildly warm, when it is actually significantly hotter.
Edge Errors: The Boundary Pixel Problem
Edge errors come from how pixels sample space. A pixel does not have a single “point” location; it integrates energy over its footprint. At edges, that footprint straddles two materials with different emissivity and temperature.
Two factors make edge errors worse:
- High contrast between target and background (big temperature difference).
- Emissivity mismatch (different surface materials reflecting and emitting differently).
Example with emissivity: A painted surface (higher emissivity) next to shiny metal (lower emissivity) can produce a boundary that looks smeared. The camera may report a temperature that seems plausible but does not match either material.
How to Estimate Whether Your Target Is Big Enough
You can do a quick check before trusting a measurement:
- Measure the target size in the scene (length or width).
- Estimate the camera’s footprint at your distance using the spot-size guidance from the camera documentation.
- Compare target size to footprint. If the target is smaller, expect dilution.
If you do not have spot-size guidance, you can still test behavior:
- Take images at the same distance.
- Move the camera slightly left/right or up/down.
- Watch whether the measured temperature jumps. Large jumps suggest edge contamination.
Mind Map: Spot Size and Edge Errors
Example Workflow: Electrical Lug Inspection
- Set up distance so the lug occupies most of the measurement region.
- Focus carefully so the lug edges are crisp; blur increases the effective mixing.
- Use a larger region only if it still stays within the lug boundaries. If the region includes panel metal, the reading becomes a blend.
- Validate with a boundary test: measure the lug center, then measure a slightly smaller region that still stays entirely on the lug. If the temperature changes dramatically, your original measurement was likely edge-contaminated.
Example Workflow: Small Pipe Leak Spot
A small wet patch on a pipe can be colder than the surrounding dry surface. If the wet patch is smaller than the minimum measurable area, the camera may report a temperature closer to the dry pipe, hiding the cold spot.
To reduce edge errors:
- Increase the target coverage by moving closer or using a lens setting that narrows the field of view.
- Avoid placing the measurement box across the boundary between wet and dry.
- Confirm by checking whether the cold reading remains when you slightly shift the measurement region while keeping it fully on the wet area.
Quick Rules That Save Time
- If the target is smaller than the effective footprint, treat the reading as a blend, not a target temperature.
- If the reported temperature changes a lot when you nudge the camera, you are likely measuring edges.
- If the scene has strong material differences (paint vs metal, matte vs shiny), expect emissivity-driven boundary effects.
These checks keep your measurements grounded in what the camera can actually separate, rather than what you wish it could.
5.3 Lens Selection for Close-Up Versus Long-Range Work
Thermal cameras do not “see heat” directly; they collect infrared radiation and focus it onto the sensor. Lens choice controls what portion of the scene is imaged, how much detail you can resolve, and how much of the measurement you can trust. The goal is simple: match the lens to the distance and the size of the target you need to measure.
What Lens Choice Really Changes
A lens mainly affects three practical things: field of view (how wide the scene looks), magnification (how large a target appears), and focus behavior (how well the camera can keep the target sharp). A wider field of view is convenient for finding problems, but it spreads pixels across the scene. A longer focal length narrows the view and concentrates pixels on the target, which improves measurement stability for small objects.
Close-Up Work: Getting Enough Detail on Small Targets
For close-up inspections, you usually care about small areas: a bearing housing, a cable termination, or a patch of insulation. A lens with a shorter focal length (wider view) can still work, but you must ensure the camera can focus at your working distance and that the target fills enough pixels.
A useful rule of thumb is to think in terms of “target coverage.” If your target is only a few pixels across, temperature numbers can jump around because each pixel averages radiation from a tiny mix of surfaces. For example, if you’re checking a small electrical lug and the lug occupies only a thin strip of the image, the reported temperature may be influenced by nearby cooler metal or the surrounding insulation.
Close-up best practices:
- Fill the frame with the object of interest. Move closer or use a lens with higher magnification.
- Use focus carefully. If the camera supports manual focus, set it so edges of the target are crisp.
- Watch for reflections. At close range, shiny surfaces can reflect the environment, and a lens that makes the target look larger also makes the reflected pattern easier to notice.
Long-Range Work: Making Small Targets Measurable at Distance
Long-range work is where lens selection becomes non-negotiable. The farther the target, the smaller it appears in the image. A longer focal length reduces the field of view so the target occupies more pixels.
Example: You’re inspecting a rooftop vent from the ground. With a wide lens, the vent might be a small blob, and the camera’s temperature readout may represent an average of vent material plus sky and nearby surfaces. With a telephoto lens, the vent fills more of the frame, so the camera can isolate the hottest region more consistently.
Long-range best practices:
- Prioritize target size over scene width. You can always take a wider shot to locate, then switch to a longer lens to measure.
- Stabilize your position. At long range, small changes in angle can shift which surfaces are captured.
- Consider atmospheric effects. Even when the camera is focused, distance can reduce contrast, making it harder to distinguish a true hot spot from background variation.
Focus Range and Working Distance Compatibility
Many thermal lenses have a focus range that does not cover every distance equally well. A lens that performs great at one range can be soft at another, even if the camera’s autofocus tries to compensate. Before you commit to a lens, check that your typical working distance falls within the lens’s intended focus behavior.
Example: If you normally inspect machinery from 0.5–1 m away, a lens optimized for far-field use may struggle to keep fine details sharp. The result is not just a blurry image; it can also smear temperature gradients, which makes it harder to identify the exact region to measure.
A Simple Decision Process
Use this sequence during setup:
- Identify the smallest feature you must measure.
- Estimate your distance to that feature.
- Choose the lens that gives enough pixel coverage for that feature.
- Focus on the feature, not the background.
- Confirm by checking whether the feature’s edges look stable between frames.
If the feature is too small in the image, don’t compensate by changing emissivity or palette. Change the lens or the distance.
Mind Map: Lens Selection for Close-Up Versus Long-Range Work
Example Scenarios You Can Reuse
Scenario A: Inspecting a small motor terminal
- Distance: about 1 m.
- Goal: measure the hottest spot on the terminal.
- Lens choice: a close-up-friendly lens or higher magnification so the terminal occupies a meaningful portion of the frame.
- Reasoning: if the terminal is only a few pixels wide, the “hottest” reading may come from a mixed pixel at the boundary.
Scenario B: Locating a hot spot on a distant panel
- Distance: 30–50 m.
- Goal: find and then measure a small defect area.
- Lens choice: start wide to locate, then switch to a longer focal length for measurement.
- Reasoning: wide shots help you avoid guessing the target location; long lenses reduce averaging and improve repeatability.
Scenario C: Checking insulation around a pipe joint
- Distance: 2–3 m.
- Goal: compare joint area to nearby insulation.
- Lens choice: a lens that keeps the joint edges sharp.
- Reasoning: if focus is off, the boundary between joint and insulation blurs, and the comparison becomes less meaningful.
Lens selection is not about getting a “better picture.” It’s about controlling how many pixels represent the surfaces you care about, and whether the camera can keep those surfaces in focus at your working distance.
5.4 Handling Reflections, Windows, and Contaminated Optics
Thermal cameras measure infrared energy, but reflections and surface coatings can make that energy come from somewhere else. The result is often a “temperature” that looks plausible yet belongs to the environment, not the object.
Reflections and Why They Fool Temperature Readings
A reflection happens when the camera “sees” a shiny or glossy surface that reflects warmer or colder surroundings. Two things matter: the surface’s emissivity and the geometry.
- High reflectivity surfaces (polished metal, glossy paint, wet surfaces) tend to show mirror-like patterns.
- Geometry decides what gets reflected. If the camera is positioned so that it views a hot source (sunlit wall, heater, engine exhaust), the reflected energy can dominate.
Example: Point a thermal camera at a stainless-steel handrail near a warm room. The rail may show bright streaks matching window frames or people moving. If you switch to a matte reference sticker on the same rail, the temperature reading becomes steadier and closer to the actual surface temperature.
Best practice: Treat shiny surfaces as “optics” for the scene. Move the camera a few inches left or right and watch whether the bright pattern moves with your viewpoint. If it does, you’re likely looking at reflections.
Windows and Other Transparent Barriers
Windows block and distort infrared in multiple ways: they absorb some wavelengths, transmit others, and can reflect strongly at certain angles. Even when a window is transparent to visible light, it may not behave the same way in the thermal band.
Common issues include:
- Reflections on the window surface that overlay the scene.
- Attenuation that reduces signal strength and increases noise.
- Emissivity confusion where the camera reports the window’s apparent temperature rather than the object behind it.
Example: Inspect a warm electrical panel through a glass cover. The thermal image shows a uniform warm rectangle matching the glass, while the actual hotspots inside are faint or shifted. If you can measure the glass edge and compare it to the panel area, you’ll often find the glass temperature dominates the reading.
Best practice: When possible, measure directly without barriers. If you must measure through a window, use a consistent setup and rely more on relative patterns than absolute temperatures. Also, check whether the hotspot location stays fixed when you slightly change camera angle; reflections tend to move.
Contaminated Optics and How Smudges Change the Picture
Dust, fingerprints, and condensation on the lens or protective window reduce transmission and add scattering. The camera may still produce an image, but contrast drops and temperature gradients can flatten.
Typical symptoms:
- Overall haze or a “washed out” look.
- Edges that look less sharp than expected.
- Inconsistent readings when you wipe and re-check.
Example: After a day of outdoor work, a camera shows weaker contrast on a roof inspection. You clean the protective window and repeat the same shot. The second image shows clearer boundaries around vents and pipes, and the temperature span between hot and cool regions increases.
Best practice: Use a simple before/after check. Capture one image, clean the front element or protective window using appropriate lens-safe methods, then capture again from the same position. If the scene contrast improves, you had an optics contamination problem.
Mind Map: Reflection, Window, and Optics Handling
Quick Field Workflow for Reliable Measurements
- Start with a sanity check: Look for moving bright shapes when you shift your stance.
- Decide direct vs barrier measurement: If a window is involved, plan for relative interpretation.
- Check optics condition: If the image looks hazy, clean and re-shoot before trusting numbers.
- Record what you controlled: Camera angle, distance, and whether a barrier was present matter as much as the emissivity setting.
Example: During a building inspection, you suspect a warm duct behind a plastic cover. You first verify that the bright pattern follows your viewpoint, then you clean the camera’s protective window, and finally you compare two angles. The duct pattern becomes clearer after cleaning, and the remaining hotspot location stays consistent across angles, indicating you’re seeing the duct rather than reflections.
5.5 Practical Setup Checklist for Repeatable Measurements
Repeatable thermal measurements come down to controlling three things: what the camera sees, how the target behaves, and how you set measurement parameters. Use this checklist like a pre-flight routine—short enough to follow, specific enough to prevent “why does it look different?” moments.
Before You Start
-
Confirm the camera settings you will keep constant
- Pick a measurement mode (spot, area, or full-frame) and stick with it for the session.
- Choose the same palette and level/span if you plan to compare images later.
- Example: If you measure a motor housing at two times, keep the same emissivity setting and the same region size.
-
Set emissivity deliberately, not by vibes
- If you know the surface material, use the correct emissivity value.
- If you don’t, treat emissivity as a variable and plan a verification step (see below).
- Example: Painted metal often behaves differently from bare aluminum. If you switch emissivity mid-session, your “temperature change” may be mostly a setting change.
-
Lock the measurement distance and framing
- Keep the camera position fixed relative to the target.
- If you must move, record the distance and re-check focus.
- Example: A small change in distance can shift the spot size so the measurement includes more background.
-
Stabilize the environment around the target
- Avoid measuring while someone is opening a door, blasting air, or moving a fan directly across the scene.
- Example: For HVAC vents, measure after airflow settles for a consistent time window.
Setup Checklist Step-by-Step
-
Focus and image clarity
- Use the camera’s focus tools or manual focus until edges look sharp.
- Confirm that the target fills enough pixels to support the measurement area you’ll use.
- Example: If you’re measuring a small electrical terminal, a slightly out-of-focus image can smear the hot spot into surrounding cooler metal.
-
Check for reflections and “not really the target” readings
- Look for shiny surfaces, windows, glossy paint, or wet areas.
- If reflections are present, change the angle or use a non-reflective reference patch.
- Example: A polished cover may reflect a warm wall. Tilting the camera can reduce the reflected contribution.
-
Choose a consistent measurement region
- Use the same region shape and size each time.
- Avoid including edges where emissivity or temperature changes abruptly.
- Example: When checking a bearing housing, keep the region centered on the housing and away from fasteners or gaps.
-
Record ambient conditions that affect interpretation
- Note ambient temperature and whether the scene is exposed to wind or direct sun.
- If the camera uses ambient compensation, ensure it’s set consistently.
- Example: Outdoor inspections can swing quickly. If you measure at the same time of day and note wind, comparisons become meaningful.
-
Use a simple verification target when emissivity is uncertain
- Apply a small matte patch (or use a known matte reference) to create a stable emissivity surface.
- Measure the patch and compare it to the camera’s reported temperature for that area.
- Example: If a matte patch reads consistently across sessions, you can trust the measurement workflow more than the raw emissivity guess.
-
Capture a short measurement sequence
- Take multiple frames over a brief period and use the one that matches your measurement intent.
- Watch for motion artifacts from moving air, vibration, or people walking through.
- Example: For a running pump, capture 3–5 frames and ensure the hot spot position stays stable.
Mind Map: Repeatable Thermal Setup
Mini Examples You Can Copy
Example 1: Electrical terminal check
- Keep camera distance fixed.
- Focus on the terminal, not the surrounding cable.
- Use a region centered on the metal surface, avoiding insulation edges.
- If the terminal is shiny, tilt to reduce glare or place a matte reference patch nearby.
Example 2: Building envelope spot check
- Measure after interior conditions stabilize.
- Avoid measuring immediately after HVAC cycles or door openings.
- Use the same region on the same wall area each time.
- Note wind exposure because it changes surface cooling.
Example 3: Bearing housing during operation
- Capture a short frame sequence while the machine runs steadily.
- Keep the region away from bolts and seams.
- If the housing has mixed materials, verify emissivity using a matte patch on a representative surface area.
Quick Final Checklist
- Settings consistent: mode, emissivity, palette/range
- Geometry consistent: distance, focus, framing
- Scene controlled: airflow, sun, reflections
- Measurement consistent: region size and placement
- Verification done: matte patch or reference check
- Documentation done: notes on emissivity, distance, ambient, and frame sequence
6. Image Interpretation Skills That Prevent Costly Mistakes
6.1 Reading Thermal Contrast and Understanding Gradients
Thermal images are built from differences in how much infrared energy each pixel receives. If two surfaces have similar temperatures and similar emissivity, they may look nearly the same even when you expect a clear difference. Thermal contrast is the “separation” you can see between those pixel values, and gradients are the smooth transitions that show how temperature changes across space.
What Thermal Contrast Really Means
Thermal contrast is not just “hot vs cold.” It is the visible result of several factors working together:
- Temperature difference between objects.
- Emissivity of each surface, which affects how much energy is emitted versus reflected.
- Distance and optics, which influence how much of each object fills a pixel.
- Atmosphere and reflections, which can add or subtract apparent energy.
A quick way to think about it: the camera converts incoming infrared energy into a number, then maps numbers to colors or grayscale. If the mapping range is wide, small differences can look flat. If the range is narrow, small differences become easier to see.
Gradients: Smooth Change, Not Random Noise
A gradient is a gradual shift in pixel values across an area. In real scenes, gradients often come from:
- Heat flow moving through a material (for example, a warm wall near a heater).
- Geometry and exposure (for example, sunlit surfaces warming more than shaded ones).
- Measurement setup (for example, a slight focus or distance change across the frame).
Gradients can be useful, but they can also mislead if you assume they represent temperature directly. A gradient can be caused by emissivity differences or reflections, not only by temperature.
Mind Map: From Pixels to Meaning
How to Read Contrast in Practice
Start by identifying the largest stable regions in the image. Large regions with consistent color usually correspond to surfaces with similar emissivity and temperature. Then look for edges where the color changes sharply. Sharp edges often indicate a boundary between different materials, different temperatures, or both.
Next, examine the direction of the gradient. If the gradient follows a logical path—like heat spreading from a known source—you can treat it as a strong clue. If the gradient forms a pattern that matches the background (like a window frame reflection), it may be dominated by reflections.
Example: Insulation vs Air Leak
Imagine inspecting a wall at night. The insulation side might show a broad, gentle gradient: warmer near the interior and cooler toward the exterior. An air leak often creates a more abrupt change, such as a narrow band where the temperature drops faster than the surrounding area.
To interpret this correctly, compare two things:
- Edge sharpness: air movement tends to create sharper boundaries than conduction alone.
- Gradient shape: conduction through insulation usually produces smoother transitions.
If the “leak” band looks exactly like a nearby object’s shape, suspect reflections or emissivity differences rather than airflow.
Example: Electrical Connections and Contact Quality
A loose electrical connection can produce a localized hot spot with a steep contrast boundary. The surrounding conductor may show a mild gradient due to heat spreading.
When you see a hot spot, don’t stop at “hot.” Check whether the hot region has a consistent shape across frames. A stable hot spot with a clear boundary is more convincing than a flickering patch that changes shape rapidly. Also note whether the hot spot aligns with the expected location of the connection.
Example: Emissivity Can Create Fake Gradients
Consider a shiny metal surface next to a painted surface. Even if both are at the same temperature, the shiny metal may reflect the surroundings and appear to have a gradient that mirrors the background. The painted surface usually behaves more predictably because it emits more like a “true radiator.”
A practical habit: if you can, compare the thermal behavior of two surfaces that you know are similar in temperature. If one shows a gradient that matches the environment, emissivity and reflections are likely dominating.
A Simple Checklist for Contrast and Gradients
- Confirm focus: blurred images smear edges and flatten contrast.
- Look for plateaus: areas of nearly uniform color suggest consistent conditions.
- Identify edge types: sharp edges often indicate boundaries; smooth gradients suggest heat flow or setup variation.
- Check whether the gradient follows physics: heat typically moves from hotter to cooler regions through materials.
- Use consistent display settings: changing the range can make the same scene look more or less contrasted.
Thermal images reward careful reading. Contrast tells you where differences exist; gradients tell you how those differences change across space. When you treat both as measurement outcomes rather than direct temperature truth, you get more reliable interpretations.
6.2 Hot Spots, Cold Spots, and What They Usually Indicate
Thermal images show relative temperature patterns, not “faults” by default. A hot spot or cold spot is a clue about heat flow, material properties, and measurement conditions. The trick is to connect the pattern to a likely physical cause, then verify with a simple check.
How to Read Hot Spots
A hot spot is an area that is warmer than its surroundings. In many real scenes, it points to one of these mechanisms:
- Heat generation: Electrical resistance, friction, or active components. Example: a breaker panel where one breaker is warmer than adjacent breakers after the same load has been running for 20 minutes.
- Reduced heat spreading: A small area that cannot conduct heat away as effectively as surrounding material. Example: a loose electrical lug that heats locally because contact resistance is higher at the interface.
- Insulation or airflow differences: Warm air trapped near a surface, or cold air bypassing insulation. Example: a wall stud bay that stays warmer because air leakage brings warmer interior air into contact with the drywall.
A practical habit: treat hot spots as “where to look,” not “what to fix.” Confirm whether the heat is tied to operation (changes with load) or tied to construction (stays similar across conditions).
How to Read Cold Spots
A cold spot is an area that is cooler than its surroundings. Common mechanisms include:
- Heat loss: Poor insulation or gaps that let heat escape. Example: a window frame edge that appears colder than the center of the glass on a winter night.
- Reduced heat input: A component that is off, blocked, or not receiving flow. Example: a radiator section that stays cooler because a valve is partially closed.
- Heat absorption or thermal mass: A surface that is cooler because it has not yet warmed up, or because it is absorbing heat from the environment. Example: a metal pipe that looks cold right after a system starts, then warms as flow stabilizes.
Cold spots are especially sensitive to timing. If you compare images taken at different times, you may be measuring “where the system is in its warm-up cycle,” not a defect.
Mind Map: Hot Spots and Cold Spots Interpretation
Example: Electrical Hot Spot in a Panel
Imagine a panel photographed after a steady workload. One breaker shows a noticeably warmer region near its body while neighboring breakers remain similar. The likely interpretation is localized heat generation at a connection or internal resistance. A useful check is to compare the temperature pattern after a short change in load: if the hot spot increases with current, it supports the “operating heat” explanation. If it stays constant even when the load changes, consider measurement artifacts such as reflections from nearby surfaces or an emissivity setting that does not match the breaker’s finish.
Example: Cold Spot at a Window Frame
A thermal image of a room shows the window frame edge colder than the glass center. This pattern usually indicates heat loss through the frame and thermal bridging. A simple verification is to look for a consistent border along the frame rather than a random patch. Random patches often suggest measurement issues like glare, dirty glass, or incorrect emissivity on a reflective surface.
Example: HVAC Airflow Clues
In a ducted system, a supply register might show a hot region near one side and a cooler region near the other. If the hot region aligns with a damper position or a duct branch, it suggests uneven airflow or mixing. For cold spots, a return grille that stays cooler than expected can indicate restricted airflow or a blockage. The key is to correlate the pattern with where air actually travels, not just with temperature alone.
Common Confusions and How to Avoid Them
- Reflections masquerading as temperature: A shiny surface can reflect a warm object, creating a “hot spot” that is not thermally connected. Quick check: shift the camera angle slightly; if the hot spot moves with the camera, reflections are likely.
- Emissivity mismatch: Different surface finishes can report different temperatures even when they are physically similar. Quick check: compare areas with similar materials; if only one finish type looks extreme, emissivity may be the culprit.
- Edge effects: Temperature gradients near edges can look exaggerated because the camera averages pixels. Quick check: focus on the interior region of the area, not the boundary.
Hot spots and cold spots are best treated as structured questions: What mechanism would create that heat-flow pattern, and what quick observation can confirm it? When you follow that loop, the image becomes a map of causes rather than a list of surprises.
6.3 Edges, Halos, and Artifacts from Emissivity Mismatch
Thermal cameras estimate temperature by assuming how much of the scene’s infrared energy is emitted by the surface. Emissivity mismatch happens when the camera’s emissivity setting does not match the target’s true surface behavior. The result is often most obvious at edges, where the camera mixes signals from different materials and distances.
Why Edges Misbehave
At an edge, two things change at once: the surface type changes and the background temperature changes. If emissivity is wrong for either side, the camera’s temperature conversion can “over-correct” one region and “under-correct” the other. This creates a boundary that looks sharper or more dramatic than the real temperature difference.
A common pattern is a bright or dark rim hugging the edge of an object. That rim is not a new heat source; it’s the camera’s attempt to reconcile radiance from a surface with the emissivity it was told to use.
Halos and Reflections
Halos are ring-like or smeared regions around a target. They often appear when a surface has low emissivity (like shiny metal, glossy paint, or polished plastic) and the camera treats it as if it emits like a matte surface.
Low-emissivity materials reflect the environment. If the camera assumes high emissivity, it attributes reflected energy to the object itself. The halo then tracks what’s behind you, behind the object, or behind the camera—especially when the background has a different temperature than the target.
Typical Artifact Shapes You Can Recognize
- Edge darkening or brightening: One side of an edge looks too hot or too cold.
- Thin rims: A narrow band appears along contours, often where emissivity changes abruptly.
- Corner exaggeration: Corners show stronger artifacts because they combine multiple angles and background reflections.
- Patchy “speckle” near transitions: Small areas flicker because the camera’s pixel mix includes both surface types.
These shapes are clues about emissivity and reflections, not about actual thermal behavior.
Mind Map: Emissivity Mismatch Effects
Example: Painted Wood vs. Bare Metal
Imagine measuring a wooden door frame next to a bare metal latch. The wood is matte and close to the emissivity you selected. The metal is shiny and reflects the room.
If you set emissivity to match the wood for the whole scene, the metal latch may show an artificial temperature shift. At the latch’s edges, you’ll see a rim because pixels near the boundary include both reflective metal and matte background. The latch can look hotter or colder depending on what the metal reflects.
A practical fix is to measure each material separately. If your camera allows emissivity per region, use it. If not, cover the metal with a temporary matte reference (like a small patch of high-emissivity tape) and measure that patch to confirm the behavior.
Example: Window Reflections and Halo-Like Rings
Suppose you’re checking a warm appliance behind a glass panel. Glass often has low emissivity and reflects the room. If you point the camera at the appliance through the glass, you can get a halo around the appliance outline.
The halo forms because the camera sees a blend: emitted energy from the appliance plus reflected energy from the room, all filtered through the glass. If you treat the glass surface as if it emits like a matte target, the conversion can attribute reflected patterns to the appliance.
The most reliable approach is to avoid measuring through reflective barriers when possible. If you must, treat the measurement as “what the camera sees,” not “what the object is,” and use consistent geometry so the artifact stays consistent.
Example: Small Hot Spot on a Cold Background
Consider a small electrical component that’s slightly warmer than the surrounding panel. If you choose a large measurement area or rely on a tight emissivity setting that doesn’t match the panel finish, the hot spot can appear surrounded by a cooler or hotter ring.
This happens because the camera averages radiance across pixels. Pixels at the boundary include both the hot component and the cooler panel. Emissivity mismatch changes how that mixed radiance becomes temperature, so the boundary becomes a ring.
To reduce this, use a region of interest that fits the feature and check the result by moving the ROI slightly inward. If the “ring” changes dramatically with tiny ROI adjustments, it’s likely an emissivity or reflection artifact.
Quick Checks That Work in the Real World
- Change the ROI size: If the edge behavior swings, emissivity mismatch is a prime suspect.
- Look for background dependence: If the halo shape changes when you change your position or the background, reflections are involved.
- Compare matte vs. shiny surfaces: Apply emissivity settings per material when you can.
- Use focus and distance consistency: Blurry edges increase pixel mixing, which makes emissivity errors more visible.
Artifacts from emissivity mismatch are usually systematic. Once you recognize the shapes and where they appear, you can treat them as measurement behavior rather than mysterious thermal events.
6.4 Comparing Images Over Time Without Fooling Yourself
Comparing thermal images over time is mostly about controlling variables. The camera can be consistent, but the scene rarely is. Your job is to separate real temperature changes from changes caused by setup, settings, and measurement assumptions.
Start with a Comparison Plan
Before you take the first image, decide what “same” means.
- Same camera position: Use a tripod or mark the floor and wall with tape so the lens returns to the same spot.
- Same framing: Keep the region of interest in the same place in the image. If you crop later, crop the same way each time.
- Same settings: Lock emissivity, reflected temperature/ambient compensation, range, and palette if your camera allows it.
- Same time window: If you’re checking a wall, pick a consistent time relative to HVAC cycles or sun exposure.
A simple rule: if you can’t describe how you kept conditions the same, you can’t confidently claim the difference is thermal.
Use a “What Changed?” Checklist
When images don’t match, run this checklist in order.
- Geometry changed: Distance, angle, or focus shifted. Even small changes can move edges across pixels.
- Emissivity changed: A surface got wet, dusty, painted, or covered. Thermal cameras treat different emissivities as different temperatures.
- Reflections changed: Sunlight, a nearby warm object, or a moving person can alter reflected components.
- Atmosphere changed: Fog, steam, smoke, or strong humidity can reduce contrast.
- Camera settings changed: Range, level, span, or auto-scaling can make the same scene look different.
- Motion occurred: Wind or moving parts smear patterns and create false gradients.
If you address items 1–3 first, you’ll catch most “mystery differences.”
Mind Map: Comparing Images Over Time
Example: Wall Inspection Before and After a Repair
You inspect a wall for insulation gaps.
- Day 1: You image the wall at 2 meters, emissivity set to 0.95 for painted drywall, and you keep the same palette and range.
- Day 3: After a patch, you return. You notice the patch is slightly shinier.
The thermal image shows the patched area cooler than the surrounding region. That could be real, but emissivity changed is a strong suspect. Painted drywall and fresh patch compound can reflect differently. If you re-image after the patch surface dries fully and you confirm emissivity settings match the surface type, the comparison becomes more trustworthy.
Key takeaway: a “cooler patch” is not automatically a better or worse insulation condition until emissivity and surface state are handled.
Example: Electrical Connection Check with Auto-Scaling
You photograph an electrical terminal at two times.
- First image: The camera uses auto range and auto level.
- Second image: The camera switches to a different auto scaling because the scene contrast changed.
The second image looks “hotter,” but the camera may have stretched the color scale differently. To compare, you need fixed range/level or a consistent method for reading temperature values from the same measurement region. If your camera supports it, disable auto scaling and keep the same emissivity and reflected temperature settings.
Key takeaway: color differences can be scale differences.
Example: Comparing Outdoor Objects with Sun Exposure
You compare two thermal images of a metal gate.
On the first day, the gate is shaded. On the second day, it’s in direct sun for part of the interval. The gate’s temperature changes due to absorbed solar energy, not necessarily due to a fault you’re trying to detect.
To avoid being fooled, compare images taken under the same sun conditions or at the same point in the daily heating cycle. If you can’t, treat the comparison as “scene change,” not “system change.”
A Practical Way to Compare Regions of Interest
Pick a few stable regions and stick to them.
- Use fixed landmarks: corners, screw heads, pipe joints, or labels.
- Define small regions for measurement: a 3×3 cm area around the suspected defect.
- Compare temperature values and gradients, not just the hottest pixel.
A real change often shows up as a consistent shift in both the average temperature of the region and the shape of the boundary. A setup artifact often changes the boundary position or produces a uniform shift that tracks camera scaling.
Confidence Rules That Keep You Honest
Use these simple confidence cues.
- High confidence: geometry, settings, and surface state were locked; the same region shows a consistent change.
- Medium confidence: one variable likely changed, but the pattern still matches the expected physical behavior.
- Low confidence: multiple checklist items changed, or the camera scaling likely changed.
When confidence is low, don’t force a conclusion. Re-shoot with locked conditions and a consistent region of interest.
6.5 Documenting Conditions So Others Can Reproduce Results
Reproducibility in thermal work is mostly about controlling variables you can’t see. A thermal image records radiation plus the camera’s settings, optics, and the scene’s surface behavior. If someone else can’t match those conditions, they can’t tell whether a difference is real or just measurement context.
What to Record Every Time
Start with a “minimum viable record” that covers the camera, the environment, and the target.
- Camera identity and settings: camera model/serial (if available), measurement mode (spot, area, full frame), emissivity setting, reflected temperature setting (if used), distance/focus mode, and any automatic features that change behavior (for example, auto gain or auto palette).
- Optics and geometry: lens type, focus distance, whether the camera was handheld or on a tripod, and the approximate camera-to-target distance.
- Scene conditions: air temperature and wind if relevant, whether the target is indoors or outdoors, and whether there’s direct sun, drafts, or recent activity.
- Target surface notes: surface material, visible condition (paint, dust, wetness), and whether the target was covered with tape or a reference patch.
- Timing: time of day and how long the scene was allowed to stabilize before capturing.
A good rule: if you would argue about it in a meeting, it belongs in the record.
A Simple Documentation Template
Use a consistent layout so the reader can scan it quickly.
- Purpose: what you were trying to measure or compare.
- Camera and settings:
- Camera:
- Mode:
- Emissivity:
- Reflected temperature:
- Palette:
- Frame rate or integration mode:
- Geometry:
- Distance:
- Focus method:
- Mount: tripod/handheld:
- Angle relative to surface: approximate degrees or “nearly normal”
- Environment:
- Location:
- Ambient temperature:
- Wind/drafts:
- Sun exposure: yes/no
- Target:
- Surface description:
- Any preparation (tape patch, cleaning):
- Reference target used: yes/no
- Capture details:
- Stabilization time:
- Number of images:
- Notes on anomalies: reflections, motion, occlusions
Mind Map: Reproducibility Checklist
Example: Comparing Two Wall Sections
Scenario: you’re checking two adjacent wall sections for insulation differences. Without documentation, the comparison is mostly vibes.
- You record that both images were taken from the same side, at the same distance (about 1.5 m), with the camera mounted on a tripod.
- You note emissivity was set to 0.95 for painted drywall, and reflected temperature was set using the camera’s reflected-temperature method.
- You capture after a 20-minute stabilization period with HVAC running at a steady setting.
- You include a note that one section had a slightly glossy paint sheen, and you used the same emissivity value for both to keep the comparison consistent.
When someone else repeats the test, they don’t need your interpretation yet. They can verify the measurement context first: same geometry, same emissivity assumption, same stabilization time.
Example: Electrical Hot Spot with Reflections
Scenario: you inspect a panel where shiny metal and nearby conductors reflect radiation.
- You document that the camera was held at a consistent angle and that you avoided direct glare by changing position rather than changing settings.
- You record the emissivity assumption for the metal surface and explicitly note that the reading is sensitive to reflections.
- You capture a reference shot of a matte tape patch placed on the conductor surface before taking the main images.
- You write down the order: patch placed, wait 30 seconds, then capture.
This turns a “why does it look different?” question into a checkable procedure: same patch method, same wait time, same viewing angle.
Evidence Packaging That Doesn’t Create Confusion
- Name images with context: include date, location, and a short label like “PanelA_Conductor1_Em0.95”.
- Keep settings tied to each image: if you change emissivity or reflected temperature, treat that as a new condition.
- Add short anomaly notes: “glare on left edge” or “wind gusts during capture” is more useful than “issues observed.”
If you do this consistently, your documentation becomes a map for someone else’s eyes, not a mystery novel for their imagination.
7. Calibration, Correction, and Quality Control Workflows
7.1 Factory Calibration Versus Field Calibration Needs
A thermal camera’s factory calibration is the baseline that turns sensor output into something you can compare across time. Field calibration is what you do when the baseline is no longer representative of your actual setup, environment, or measurement goals. The trick is knowing which one matters for your use case.
What Factory Calibration Covers
Factory calibration typically addresses sensor non-uniformity, fixed pattern noise, and baseline radiometric behavior under controlled conditions. In practice, it means the camera is characterized so that pixels that “see” slightly different signals can be corrected to behave more consistently. It also means the camera’s internal assumptions about optics and detector response are set to a known starting point.
A useful way to think about it: factory calibration reduces the camera’s tendency to lie in a repeatable way. It does not guarantee that your target’s surface properties, your distance, or your environment match the factory conditions.
When Field Calibration Becomes Necessary
Field calibration is needed when you want measurement repeatability that exceeds what factory settings alone can deliver. Common triggers include:
- You change the measurement geometry: new distance, new lens, or a different mounting position.
- You change the environment: strong drafts, humidity changes, or frequent temperature swings.
- You change the target type: different emissivity materials, coatings, or surfaces with different reflectivity.
- You need tighter consistency: for example, comparing results between shifts or between days.
Field calibration does not have to be a full re-characterization of the sensor. Often it is a correction workflow that aligns the camera’s output with your specific scene and reference.
Mind Map: Calibration Responsibilities
Mind Map: Practical Decision Flow
Example: Electrical Inspection with a Fixed Setup
Suppose you inspect electrical panels weekly. The camera model stays the same, the lens and mounting position are unchanged, and you use the same procedure for focus and distance. If you are mainly looking for relative changes in hot spots, factory calibration plus consistent emissivity settings may be enough.
Field calibration becomes useful when you notice that the same component reads differently after a maintenance shutdown. The likely cause is not the sensor drifting; it is often a change in surface condition, dust, or contact quality that alters emissivity and reflections. In that case, “calibrating the camera” is less effective than verifying emissivity assumptions and using a reference surface or emissivity tape where appropriate.
Example: Temperature Reporting for a Measured Threshold
Now imagine you must report whether a component exceeds a specific temperature limit, and the report is used for acceptance. Here, field calibration matters more because small systematic errors become decision errors.
A practical approach is to use a reference target in the field. For instance, you can place a reference plate with known emissivity near the measurement area and record its apparent temperature under the same atmospheric conditions. If the camera’s reading for that plate consistently offsets from the expected value, you apply a correction workflow in your measurement process.
The key is consistency: you repeat the reference step under the same geometry and timing each session. That way, you correct for your setup rather than chasing random variation.
What “Good Enough” Looks Like
Factory calibration is usually sufficient when your workflow controls the big variables: stable distance, stable focus, controlled emissivity assumptions, and consistent environmental conditions. Field calibration is justified when you need repeatability across sessions and you cannot rely on the scene to behave the same way.
A simple rule of thumb: if you can explain why two readings should match using only your procedure and reference assumptions, you probably do not need extra calibration. If you cannot, field calibration or reference-based correction is the more direct fix.
7.2 Flat-Field Correction, Non-Uniformity, and Practical Limits
Thermal cameras rarely treat every pixel the same. Even with the same scene temperature, some pixels read slightly higher or lower because of sensor manufacturing differences, optics vignetting, and electronics behavior. That pixel-to-pixel variation is called non-uniformity, and it shows up as fixed patterns in the image.
What Flat-Field Correction Actually Does
Flat-field correction is a way to reduce fixed pattern errors by dividing out the camera’s own “pixel bias map.” The idea is simple: capture an image of a uniform reference (or an approximation), then use it to normalize later frames.
A practical way to think about it:
- If a corner pixel always reports 2°C too high, correction subtracts that offset.
- If a row has slightly lower gain, correction scales it up.
- If the optics cause brightness falloff toward the edges, correction compensates for that spatial trend.
The key limitation is that the correction is only as good as the reference and the conditions under which it was captured.
Non-Uniformity Sources You Can See in Real Life
Non-uniformity isn’t one single problem. Common contributors include:
- Offset non-uniformity: some pixels have a consistent bias.
- Gain non-uniformity: some pixels respond more strongly to temperature changes.
- Temporal drift: the pattern slowly changes as the camera warms up or electronics settle.
- Optical shading: edges receive less energy due to lens geometry.
You can often spot these as “stationary blotches” that remain in the same places even when you move the camera.
Mind Map: Flat-Field Correction and Non-Uniformity
Practical Limits: When Correction Helps and When It Can’t
Flat-field correction improves repeatability, but it does not magically make the camera perfect. Here are the practical limits that matter for beginners:
-
Reference mismatch: If the “flat” reference is not truly uniform in temperature or emissivity, the correction map bakes in an error. For example, a matte black reference that is cooler at the edges will cause the corrected image to show a false edge gradient.
-
Changing conditions: If you capture a correction map at one camera temperature and then use it after the camera warms further, the non-uniformity pattern can shift. That’s why many workflows include a warm-up period before critical measurements.
-
Optics and alignment changes: If you swap lenses, remove a protective window, or even change focus in a way that affects vignetting, the spatial response changes. A correction map made under different optics may underperform.
-
Small targets and sharp edges: Correction assumes the scene is sampled consistently. When a target occupies only a few pixels, interpolation and edge effects dominate, and non-uniformity correction can’t fully fix the measurement.
Example: Same Temperature, Different Pixels
Imagine you point a thermal camera at a matte surface that is genuinely uniform at 30°C. Without correction, you might see a faint checkerboard of slightly higher and lower readings. If you measure a small spot on a “hot” pixel cluster, you might read 31.2°C; on a “cold” cluster, 29.6°C.
After flat-field correction, those readings might tighten to something like 30.3°C and 29.9°C. The improvement is real, but you still have residual error because the correction map can’t perfectly match your scene’s emissivity, distance, and optics state.
Example: Edge Falloff and Why It Looks Like a Temperature Gradient
Suppose you photograph a uniform wall. Many cameras show the edges slightly darker or cooler due to optics shading. Without correction, you might interpret it as the wall being cooler at the edges. With flat-field correction, the edge-to-center difference shrinks.
A good beginner check is to compare two regions at the same distance from the camera: one near the center and one near the edge. If the difference remains large after correction, the issue is likely not the scene temperature but the measurement geometry or reference mismatch.
A Simple Verification Routine
Use this routine to understand your camera’s practical limits:
- Warm up the camera to a stable operating state.
- Point at a large, matte, uniform target.
- Capture a short sequence while keeping the camera fixed.
- Compare the spread of readings across multiple small points.
If the spread is small and stable, your correction is doing its job. If the spread changes noticeably over time, temporal drift is dominating your error budget.
Case Study: Inspection with and Without Correction
A technician inspects an electrical panel using a thermal camera. They notice that the panel’s left side consistently reads about 1°C higher than the right side, even when the panel is known to be in a steady condition.
They enable flat-field correction and repeat the measurement after the camera warm-up. The left-right offset drops to about 0.2°C. The technician then focuses on relative hot spots rather than absolute values, using the corrected image to locate anomalies while treating the remaining offset as a baseline limitation.
This is the practical mindset: correction reduces systematic pixel patterns, but you still verify measurement stability and avoid over-interpreting small absolute differences.
7.3 Using Blackbody References and Simple Substitutes
Thermal cameras report temperature by assuming the scene’s surfaces behave in predictable ways. A blackbody reference is the cleanest way to test that assumption because it provides a known temperature source with well-characterized infrared emission. In practice, you often won’t have a perfect blackbody, so this section also covers simple substitutes that behave close enough for day-to-day verification.
What a Blackbody Reference Does
A blackbody reference is a target that emits infrared energy according to its temperature. If you point your camera at it, the camera can compare what it measures against what you know is true. This helps you separate two problems:
- Camera behavior: whether the camera’s temperature readout is consistent.
- Setup behavior: whether your emissivity setting, distance, focus, and optics are causing the mismatch.
A useful mental model is: the camera is a translator, and the blackbody is the dictionary word with a known meaning.
Mind Map: Reference-Based Verification
Step-By-Step Procedure with a Blackbody
- Warm up the reference until its temperature stabilizes. Many references drift slightly at first, and your camera will faithfully report that drift.
- Set the camera to a fixed emissivity that matches the reference’s specification. If you don’t know the emissivity, use the reference’s recommended setting rather than guessing.
- Choose a measurement region that covers the camera’s effective spot size. If the reference fills only part of the image, the camera may mix reference radiation with background radiation.
- Focus carefully. Thermal focus matters because it changes how much of the reference energy lands on the sensor.
- Record at multiple temperatures. Use at least two setpoints (for example, a cool and a warm point). A single point can hide a scale error.
- Compute the difference between camera reading and reference temperature. Track both the average error and the spread across frames.
Example: Two-Point Check
- Reference setpoint: 30.0°C
- Camera reading (averaged over 10 frames): 29.2°C
- Difference: -0.8°C
Then:
- Reference setpoint: 60.0°C
- Camera reading (averaged over 10 frames): 59.0°C
- Difference: -1.0°C
Because the error is similar at both temperatures, the camera likely has a consistent offset rather than a nonlinear problem. That’s the kind of result you can correct for in your workflow (for example, by adjusting emissivity only if you have evidence it’s the cause, or by documenting the offset).
Simple Substitutes When You Don’t Have a Blackbody
A substitute should be stable, have reasonably high emissivity, and be easy to keep at a known temperature. The goal is not perfection; it’s repeatability.
Option A: High-Emissivity Coated Plate
Use a small metal plate coated with a high-emissivity coating (or a matte surface designed for thermal measurement). Heat it with a controlled source (like a hot plate) and measure its temperature with a contact thermometer attached to the back.
Best practice: insulate the back of the plate so the contact sensor and the front surface don’t drift apart.
Example:
- Plate surface target: matte black coating
- Contact thermometer on the back: 50.0°C
- Camera reading on the coated area: 49.4°C
- Difference: -0.6°C
If the difference stays within a narrow band across a couple of temperatures, the substitute is doing its job.
Option B: Boiling Water with Care
Water at a rolling boil is a convenient reference, but it’s only reliable if you control pressure and avoid superheating effects. At typical sea-level conditions, the boiling point is about 100°C, but altitude changes it.
Best practice: use a pressure-aware boiling point if you need accuracy, and keep the camera’s view consistent.
Example:
- Camera reading at the steam-facing surface: 99.2°C
- Contact thermometer near the liquid: 99.8°C
- Likely cause: emissivity and surface geometry differences between the camera’s target area and the thermometer’s location.
Option C: Ice-Water Slurry for a Low Point
A well-mixed ice-water slurry is a stable low-temperature reference near 0°C. It’s useful for checking whether your camera’s low end behaves sensibly.
Best practice: avoid measuring through glass or plastic that introduces reflections and emissivity changes.
Example:
- Slurry temperature: 0.0°C (assumed stable)
- Camera reading on the slurry surface: 1.1°C
- Likely cause: the camera may be seeing a mix of slurry and surrounding air reflections, or the emissivity setting may be off.
Mind Map: Choosing a Substitute
Practical Rules That Prevent Bad Conclusions
- Use the same region of interest each time. Changing the ROI changes the mix of emissivities and reflections.
- Average multiple frames only after the scene is stable. Averaging motion just averages blur.
- Treat emissivity as a variable, not a belief. If your substitute is high-emissivity, emissivity errors should shrink; if they don’t, your substitute or geometry is the problem.
Blackbody references give you a trustworthy baseline, while substitutes help you keep your measurements honest when you can’t have the ideal tool. The key is consistency: known temperature, controlled geometry, and recorded differences that tell you whether the camera, the setup, or the surface assumptions are responsible.
7.4 Building a Repeatable QA Routine for Inspections
A repeatable QA routine turns “looks about right” into “we can explain why it’s right.” The goal is not perfection; it’s consistency across days, operators, and locations.
QA Routine Overview
Start with a short checklist that you can run in under 10 minutes before any inspection. Then use a second checklist during the inspection to catch setup mistakes early. Finally, close with a documentation step that records the conditions that affect thermal readings.
A good routine has three layers:
- Instrument readiness: the camera and settings are stable.
- Measurement validity: emissivity, distance, and optics are appropriate.
- Evidence quality: images and notes are complete enough to reproduce the result.
Pre-Inspection Setup
-
Warm up and stabilize
- Turn the camera on and wait for it to reach its normal operating state.
- Example: If your camera has a “ready” indicator, use it. If it doesn’t, wait a consistent time every session.
-
Set measurement parameters intentionally
- Choose a palette and keep it consistent for the whole job.
- Set emissivity based on the surface type you expect, not what “looks right.”
- Example: For painted drywall, use the closest known emissivity value you have for that paint type. If you’re unsure, plan to verify with a reference target (see below).
-
Confirm optics and focus
- Wipe the lens and check focus on a high-contrast edge.
- Example: If you’re inspecting an electrical panel, focus on the metal edge of a breaker housing rather than a blurry background.
-
Run a quick reference check
- If you have a blackbody or reference target, capture one image and record the reading.
- If you don’t, use a consistent internal reference surface (for example, a known matte surface in the same room) and track changes rather than absolute values.
- Example: Photograph a matte calibration sticker on a test board at the start of each session and confirm it stays within your expected range.
In-Inspection QA Checks
Use these checks at the start of each area and whenever conditions change.
-
Distance and framing sanity check
- Ensure the target fills enough pixels for the camera’s measurement area.
- Example: If you’re measuring a small bearing housing, don’t measure from a wide shot where the housing occupies only a tiny portion of the frame.
-
Emissivity verification step
- If the surface is shiny, dusty, wet, or covered with unknown coatings, emissivity is likely wrong.
- Example: For a glossy metal pipe, place a small piece of matte tape or apply a small patch of known matte material, then measure that patch to confirm the camera’s emissivity behavior.
-
Reflections and window effects check
- Look for mirrored hot patterns that move when you change your angle.
- Example: If you see a “hot” reflection on a window, step to the side and re-check. If the pattern shifts, treat the reading as unreliable.
-
Motion and environmental variability check
- Wind, fans, and moving people can change the thermal scene between frames.
- Example: For HVAC inspections, capture images when airflow is steady, and note fan speed or damper position if it matters.
-
Repeat measurement for critical points
- Re-measure the same region after a short pause to confirm stability.
- Example: For an electrical hotspot, capture three images in sequence and confirm the hotspot location and approximate temperature trend match.
Post-Inspection Documentation
-
Record the minimum necessary metadata
- Camera model, emissivity setting, distance estimate, ambient temperature if available, and any reference target used.
- Example: In your notes, write: “Emissivity 0.95, distance ~1.5 m, matte tape patch used on pipe, ambient 22°C.”
-
Capture evidence that matches the measurement
- Include at least one wide shot for context and one close shot for measurement.
- Example: For a wall insulation check, include a frame showing the whole section and a second frame showing the specific edge or penetration.
-
Log anomalies and corrective actions
- If you changed emissivity, moved position, or re-focused, record what changed and why.
- Example: “Initial reading inconsistent due to glare; re-shot from angle with reduced reflection.”
Mind Map: QA Routine for Repeatable Inspections
Example: One Area, One Routine
You arrive at a mechanical room to inspect a cluster of pipes. You warm up the camera, set emissivity for matte insulation, and focus on a sharp pipe edge. You capture a reference image of a matte patch you keep on a small test card. Then you inspect each pipe section with consistent framing so the measurement area covers the same physical size. When you reach a shiny valve body, you apply a small matte tape patch and re-measure using the patch region. For each critical valve, you capture three images in sequence and confirm the hotspot stays in the same location. Afterward, you record emissivity, distance, and the fact that tape was used on the valve body, so the next person can reproduce the logic behind the numbers.
7.5 Interpreting Calibration Errors and When to Recheck
Calibration errors show up as patterns, not as random surprises. A good workflow treats them like clues: where the error appears, how it changes with distance or surface type, and whether it stays consistent across frames.
What Calibration Errors Look Like in Practice
Start by distinguishing three common “shapes” of error.
- Offset error: temperatures are consistently too high or too low across the scene. This often points to a reference mismatch (wrong emissivity assumption, wrong ambient reflection handling, or a blackbody/reference target issue).
- Scale error: the camera is closer at one temperature range and worse at another. This can happen when the correction model doesn’t match the operating conditions used during calibration.
- Spatial non-uniformity: different parts of the image disagree more than expected. This is frequently tied to non-uniform sensor response, lens contamination, or improper flat-field correction.
A quick sanity check is to compare two targets that should be similar. For example, two identical metal blocks at the same temperature should report close values. If one block is consistently off, the problem is likely emissivity or surface condition, not the camera.
A Mind Map for Interpreting Error Sources
Concrete Examples of Error Reasoning
Example: Emissivity mismatch masquerading as calibration drift
- Setup: You measure a painted surface and then a bare metal surface with the same emissivity setting.
- Observation: The bare metal reads much cooler than expected, while the painted surface looks reasonable.
- Interpretation: Bare metal reflects more infrared than paint. The camera is not “wrong” in a calibration sense; the emissivity input is wrong for that material.
- Action: Recheck emissivity settings and, if possible, use a reference patch (masking tape or a known high-emissivity coating) on the bare metal.
Example: Spatial non-uniformity from optics or correction
- Setup: You point the camera at a uniform target (a matte surface) and keep distance fixed.
- Observation: The center and edges differ by several degrees, and the pattern stays the same across frames.
- Interpretation: This points to non-uniform response or an optics-related issue like a smudge or uneven illumination.
- Action: Clean the lens, verify the camera’s correction mode, and repeat the uniform-target test.
Example: Offset error caused by reference temperature handling
- Setup: You use a reference target and set the reference temperature manually.
- Observation: Every measurement is consistently high by about the same amount.
- Interpretation: The reference temperature value is likely off, or the reference target wasn’t at equilibrium.
- Action: Let the reference stabilize, confirm the reference temperature input, and repeat.
When to Recheck and When Not To
Rechecking is worth it when the error could change decisions. It’s not worth it when the error is stable, understood, and documented.
Recheck now if any of these are true:
- The error shape changes after you change a single variable like distance, emissivity, or camera settings.
- You see a new spatial pattern (for example, edge-to-center differences appear after the camera was moved or the lens was touched).
- Two targets that should match begin to diverge in a way that exceeds your normal measurement spread.
- You suspect the reference wasn’t at equilibrium or the scene includes strong reflections you didn’t account for.
Recheck later if these are true:
- The bias is consistent across repeated tests with the same setup and the same surface types.
- The error is clearly tied to emissivity assumptions you can correct, and you already corrected them.
- The camera output is stable frame-to-frame and the only discrepancy is within your documented tolerance.
A Simple Decision Checklist
Use this checklist before you “trust the numbers.”
- Is the error consistent? If yes, it’s often offset or emissivity-related.
- Does it change with temperature level? If yes, suspect scale/correction mismatch.
- Does it vary across the image? If yes, suspect spatial non-uniformity or optics.
- Did anything change since the last good measurement? Distance, lens cleanliness, emissivity inputs, and reflections are the usual suspects.
Practical Recheck Procedure for One Person
- Choose one uniform matte target and one known material target.
- Keep distance and focus fixed.
- Verify emissivity inputs for each target.
- Capture a short set of frames and compute the spread.
- If the spread is small but the mean is off, adjust the likely input (emissivity or reference handling). If the spread is large or spatially patterned, clean optics and verify correction settings.
This approach turns calibration errors from a mystery into a set of testable causes. The goal is not perfection; it’s knowing which kind of mistake you’re looking at and whether it matters for the decision you’re making.
8. Heat Detection Systems Beyond Cameras
8.1 Infrared Thermometers and Their Measurement Constraints
Infrared thermometers measure temperature by detecting infrared energy from a target and converting it into a temperature estimate. Unlike thermal cameras, they usually report one spot or a small area, so setup details matter more than you might expect.
How They Measure
An infrared thermometer assumes the target behaves like a surface with a known emissivity. It also assumes the optics collect energy from a defined spot size, and that the instrument can separate target radiation from reflected and environmental radiation. If those assumptions are wrong, the reading can still look precise while being inaccurate.
The Big Constraint: Emissivity
Emissivity describes how efficiently a surface emits infrared radiation compared with an ideal blackbody. Many non-metal materials have emissivity values that are relatively stable, while shiny metals can have emissivity that varies with finish and angle.
Example: You point an IR thermometer at a polished aluminum pan. The thermometer might report a temperature close to the surroundings because the surface reflects infrared energy from nearby objects. If you apply a small patch of matte tape or paint made for temperature measurement and re-read, the emissivity assumption becomes more realistic and the reading often shifts toward the true surface temperature.
Practical rule: If you cannot justify the emissivity setting, treat the number as a clue, not a verdict.
Spot Size and Distance
Most IR thermometers specify a distance-to-spot ratio (often written as D:S). The instrument collects radiation from a circular spot that grows with distance. If the spot includes multiple materials, edges, or background objects, the reading becomes an average.
Example: Checking a motor housing at 1 m with a 12:1 instrument. If the housing feature you care about is smaller than the spot, the thermometer will “see” surrounding air, fins, or nearby components. The result can be lower or higher depending on what else is inside the spot.
Practical rule: Measure the target size relative to the spot, then back up or move closer until the spot comfortably fits the area you intend to measure.
Reflected Temperature and Ambient Effects
Even when emissivity is set correctly, the thermometer can still be influenced by reflections. Shiny surfaces reflect infrared radiation from the environment, including warm walls, sunlight, or nearby equipment.
Example: You measure a stainless-steel pipe near a sunlit wall. The pipe’s reading may track the wall’s temperature more than the pipe’s own temperature. If you shade the area or change the viewing angle so the thermometer “sees” less of the hot surroundings, the reading becomes more representative.
Practical rule: For reflective targets, control the environment or use a surface treatment that increases emissivity.
Atmospheric Absorption and Path Length
Infrared energy travels through air and can be absorbed or scattered. Many instruments compensate for typical conditions, but long distances and humid or dusty environments can still reduce signal quality.
Example: Measuring a distant electrical cabinet from across a workshop. If the air is hazy due to dust or steam, the reading may drift toward the instrument’s assumptions about the atmosphere. Moving closer or improving line-of-sight clarity often produces a more stable reading.
Practical rule: Keep the measurement distance as short as practical and avoid measuring through visible haze.
Focus, Angle, and Surface Geometry
Infrared thermometers are sensitive to viewing angle because emissivity and reflections change with angle. Some instruments also have limited effective field-of-view, so measuring at steep angles can cause the spot to include unintended regions.
Example: Measuring the underside of a flange. If you aim at a shallow angle, the spot may include both the flange and the darker background below, shifting the reading. Repositioning the thermometer to aim more directly can reduce that mixing.
Practical rule: Aim to keep the viewing angle consistent and avoid edges.
Response Time and Transient Conditions
IR thermometers can respond quickly, but the reading still depends on how quickly the surface temperature changes and how stable the target is. Moving targets, airflow, or intermittent heating can produce readings that vary with timing.
Example: Checking a component right after switching power on. If you take the reading immediately, you may capture a transient surface temperature that later settles. Waiting a consistent interval after power changes improves repeatability.
Practical rule: Use a consistent timing method when comparing measurements.
Mind Map: Measurement Constraints for Infrared Thermometers
Example: A Simple Measurement Workflow
- Confirm the target area is larger than the thermometer’s spot at your working distance.
- Set emissivity based on the surface type; if it is reflective, use a small matte patch.
- Avoid edges and keep the viewing angle consistent.
- If reflections are likely, shade the target or reposition to reduce reflected hot objects.
- Take readings after a consistent wait time if the surface is changing.
Case Study: Why Two Readings Disagree
A technician measures a bearing housing with an IR thermometer and gets 62°C. A second measurement, taken a minute later from farther away, shows 55°C. The farther position increases spot size, and the spot now includes cooler housing edges and nearby metal. The emissivity setting is unchanged, so the difference is explained by spot mixing rather than a sudden temperature drop. Moving closer and aiming at the same central area restores agreement.
8.2 Fixed IR Sensors for Monitoring and Alarm Use
Fixed infrared (IR) sensors watch a scene continuously and turn heat patterns into signals you can log, compare, and alarm on. Unlike a thermal camera, they usually measure one or a few defined fields of view, so the setup depends heavily on placement, aiming, and how you handle emissivity and reflections.
What Fixed IR Sensors Actually Measure
Most fixed IR sensors output a value related to radiated infrared energy from a target area. The sensor then converts that energy into a temperature estimate using assumptions about emissivity and atmospheric conditions. If the target’s surface properties change, the reported temperature can shift even when the real temperature stays the same. A simple way to think about it: the sensor is not “seeing temperature,” it is “seeing radiation,” and temperature is the translation.
Key design choices
- Field of view: The sensor averages energy across its view. If the view includes background or edges, the reading becomes a blend.
- Measurement mode: Some sensors report a temperature estimate; others provide raw signal or a relative value. Alarms often work best with consistent signal behavior.
- Update rate and filtering: Faster updates catch short events; filtering reduces false alarms from brief disturbances.
Placement and Aiming Best Practices
A fixed sensor is only as reliable as its geometry. Start by defining what “normal” looks like in the sensor’s view.
Practical placement rules
- Keep the target centered in the sensor’s field of view. If the target moves or the camera-like “frame” shifts, the sensor will follow the wrong pixels.
- Avoid shiny or reflective surfaces in the view. Reflections can add radiation from hot objects that are not the thing you’re trying to monitor.
- Control distance. If you must mount far away, use a sensor with a field of view that still covers the full target area.
- Plan for obstructions. Dust, insulation, and cable trays can drift into the view over time.
Example: Monitoring a motor enclosure
Suppose you want an alarm when a motor housing overheats. Mount the sensor so its field of view covers the housing surface, not the surrounding air gap. If the sensor also sees the metal bracket, the reading may rise when the bracket warms, even if the motor stays stable. Centering the housing and excluding nearby metal improves alarm meaning.
Emissivity Handling Without Making It Complicated
Emissivity is the biggest source of “why did the alarm trigger?” questions. Many fixed sensors let you set emissivity or choose a mode that compensates. The best practice is to match the sensor’s emissivity assumption to the actual surface.
Simple emissivity approach
- Use a consistent surface when possible. A painted or coated surface is often more stable than bare metal.
- If the surface changes, expect the sensor reading to change too. For example, a dusty surface can behave differently than a clean one.
Example: Detecting overheating on a pipe
A bare copper pipe reflects more than a painted pipe. If you set emissivity for copper but the pipe gets a thin film of dust, the sensor may report a higher temperature than reality. A practical mitigation is to apply a small, stable emissivity patch where the sensor looks, or to use a sensor mode that relies on relative changes rather than absolute temperature.
Alarm Logic That Reduces False Triggers
Alarms should respond to events, not noise. Use a combination of thresholds and time logic.
Recommended alarm structure
- Threshold: A temperature or signal level that indicates a problem.
- Persistence time: Require the condition to hold for a set duration.
- Hysteresis: Use separate “trip” and “reset” levels to prevent rapid toggling.
- Rate-of-change check: Optional, but useful when you expect gradual heating.
Example: Over-temperature alarm for an electrical cabinet
Set a trip threshold at a level above normal operation. Require the signal to stay above that level for, say, 30 seconds. Add hysteresis so the alarm resets only after the signal drops below a lower reset threshold. This prevents nuisance alarms caused by brief sunlight hits, door openings, or airflow changes.
Mind Map: Fixed IR Sensors for Monitoring and Alarm Use
Verification with Realistic Tests
Before trusting an alarm, verify it under conditions that resemble operation. Establish a baseline reading with the system running normally. Then create controlled changes: warm the target surface in a repeatable way, and confirm the alarm trips at the expected time and resets correctly.
Example: Testing a warehouse heat leak monitor
If you monitor a wall section for abnormal heat loss, test with a controlled heat source placed at the same location and orientation each time. Record the sensor output and confirm that the alarm triggers consistently when the target area is warmed, and does not trigger when only the background changes.
Common Failure Modes and How to Avoid Them
- Wrong field of view: The sensor includes background that changes with airflow or lighting.
- Emissivity mismatch: Surface condition differs from the sensor setting.
- Reflections: Nearby hot objects or sunlight add radiation to the view.
- No time logic: Instant alarms trigger on brief disturbances.
Fixed IR sensors can be dependable when you treat them like instruments with a defined viewpoint, not like magic thermometers. Once the geometry and emissivity assumptions are stable, the alarm behavior becomes predictable and easier to explain.
8.3 Pyrometers, Radiometers, and When Each Fits
A thermal camera gives you a picture. A pyrometer or radiometer gives you a number or a signal. The “when each fits” part comes down to what you need: a single temperature, a temperature over time, or a measurement that can be corrected with known conditions.
Pyrometers for Single-Point Temperature
A pyrometer measures infrared energy from a target and converts it to temperature using assumptions about emissivity and optics. Many pyrometers are designed for one spot, so you must control the measurement geometry.
Key practical idea: the target must fill the instrument’s field of view. If it doesn’t, you end up mixing the target with background temperatures.
Example: You want to check a bearing housing that runs hotter than the surrounding frame. If the bearing only covers half the spot size, the reading will drift toward the frame temperature. Fix it by moving closer, using a lens with a tighter spot, or measuring a larger hot area.
Best-fit situations:
- Quick checks where you only need one location.
- Moving targets where you can’t hold a camera steady.
- Environments where you want a simple alarm threshold.
Common gotcha: emissivity. If the surface is shiny or has a coating that changes, the pyrometer’s temperature can be biased. A simple workaround is to measure a small area with known emissivity (for instance, a matte tape patch) and compare readings.
Radiometers for Energy and Signal Measurement
A radiometer measures infrared power or radiance rather than directly reporting temperature. Some radiometers can be configured to estimate temperature, but the core strength is that they treat the measurement as energy first.
Key practical idea: radiometers are useful when you care about changes in heat flow or relative intensity, or when you plan to apply corrections yourself.
Example: In a thermal process, you want to compare how quickly two parts heat up under the same heater settings. A radiometer can provide a consistent signal trend even if the exact emissivity is uncertain, as long as the surfaces behave similarly.
Best-fit situations:
- Monitoring heat-up or cool-down curves.
- Comparing relative thermal behavior across multiple cycles.
- Measurements where you will apply calibration or correction logic.
Common gotcha: radiometers still depend on optics, distance, and spectral response. Two radiometers with different wavelength bands will not respond the same way to the same target.
Choosing Between Them
Use this decision logic:
- If you need one temperature value at a specific spot, choose a pyrometer.
- If you need energy or a signal for trends, comparisons, or correction workflows, choose a radiometer.
- If you need spatial context—where the heat is coming from—use a thermal camera instead.
Mind Map: Pyrometers Versus Radiometers
Example: Spot Size and Background Mixing
Scenario: A technician measures the temperature of a warm pipe near a cooler wall.
- The pyrometer has a spot size that requires the target to fill the circle.
- If the pipe is thinner than the spot, the reading blends pipe and wall.
Fix: Measure at a distance where the pipe fills the spot, or use a lens option that reduces spot size. Then verify by moving the sensor slightly left and right; a stable reading indicates you’re mostly seeing the intended target.
Example: Emissivity Handling with a Simple Patch
Scenario: A shiny metal surface gives inconsistent readings.
- Emissivity is lower for shiny surfaces, so the pyrometer may under-read or behave unpredictably.
- Apply a small matte patch (tape or paint) to create a more stable emissivity.
Result: The pyrometer reading becomes repeatable for that patch, which helps you confirm whether the measurement setup is behaving correctly. You can then decide whether the patch is acceptable for your use case or whether you need a different measurement approach.
Example: Radiometer Trend for Process Control
Scenario: Two heater settings produce different heating rates, but surface emissivity varies slightly between parts.
- A radiometer records signal over time.
- You compare the slope and timing of the curves rather than trusting an absolute temperature conversion.
Result: Even if absolute temperature is uncertain, the relative difference between settings is clear, and you can set operational thresholds based on consistent signal behavior.
Practical Checklist for “When Each Fits”
- What is the output you need: temperature or energy/signal?
- Can you control geometry so the target fills the measurement area?
- Do you know or can you manage emissivity and spectral response?
- Do you need spatial information, or is a point measurement enough?
When these answers line up, pyrometers and radiometers become straightforward tools: one for point temperature, the other for energy-based signals that you can interpret with care.
8.4 Designing Sensor Placement for Coverage and Sensitivity
Sensor placement decides what you can see and how confidently you can act on it. With thermal systems, “coverage” is about seeing the right surfaces, while “sensitivity” is about getting a measurable temperature difference instead of a vague gray blob.
Coverage Planning with Real Geometry
Start by sketching the space as simple shapes: walls, floors, equipment, and likely heat sources. Then mark where people or objects will be, because the camera or sensor can only measure what it can “view” through its line of sight.
A practical rule: place sensors so the target surfaces face the sensor as much as possible. If a surface is mostly edge-on, the measured temperature can swing because emissivity and reflections become harder to control.
Example: In a server room, place fixed IR sensors so they look at the tops and sides of racks rather than the floor. Floor views often capture reflections from lights and moving airflow, while rack faces give more stable thermal patterns.
Sensitivity Planning with Distance and Angle
Sensitivity depends on how much of the target’s temperature difference survives the measurement chain. Two placement variables dominate: distance and viewing angle.
- Distance: farther targets occupy fewer pixels (for cameras) or smaller spots (for thermometers). That increases uncertainty because each measurement mixes more background.
- Angle: steep angles increase the chance that you’re measuring a mix of target and surroundings, especially near edges.
Example: If you must monitor a conveyor belt, mount the sensor closer to the belt path rather than higher up “for convenience.” Higher mounting can widen coverage, but it often reduces the temperature contrast you need to detect early overheating.
Use Overlap to Reduce Blind Spots
Single-sensor coverage is rarely perfect. Overlap is how you recover when one sensor sees a partial view due to occlusion, glare, or a temporary change in airflow.
A good placement pattern is “two sensors per critical zone,” where each sensor can see most of the zone, but not necessarily all of it. When both agree, you can trust the reading more. When they disagree, you know to investigate placement or conditions.
Example: For a warehouse dock area, one sensor can monitor the door frame and another can monitor the interior wall near the seal. If the door is opened, the interior sensor may be affected first; the frame sensor helps confirm whether the change is real or just exposure to outside air.
Mind Map: Placement Decisions That Actually Matter
Placement Patterns with Concrete Examples
Pattern 1: Corner Coverage for Large Areas
Mount sensors near corners to maximize view of two walls and the area between them. This works when targets are distributed and you mainly need “something is wrong” detection.
Example: For a cold storage room, corner-mounted sensors can monitor wall panels and the air boundary near the door. Place them so the door opening doesn’t fully block the view during normal traffic.
Pattern 2: Face-On Monitoring for Small Hot Spots
For electrical panels, bearings, or motor housings, prioritize face-on views of the likely heat-generating components. If you can’t get face-on, increase overlap and reduce distance.
Example: For a motor control cabinet, mount sensors so they can see the motor housing and nearby cable runs. If the sensor only sees the cabinet door, the reading may reflect door temperature rather than internal load.
Pattern 3: Edge Monitoring for Leaks and Boundaries
When you care about boundaries—like insulation gaps or seal failures—place sensors to look across the boundary line, not just at one side. That way, the temperature transition is visible.
Example: For a building envelope check, mount sensors to view the wall surface near the suspected air leak path. If you only view the far side, the contrast can be too small to separate a real defect from normal wall variation.
A Simple Placement Checklist
Before final mounting, verify these items in order:
- The target surfaces are visible in normal operation with typical obstructions.
- The sensor sees enough of each target to avoid edge mixing.
- At least one additional sensor covers the same critical zone for cross-checking.
- The viewing angle is not so steep that reflections dominate.
- Mounting location avoids direct sunlight, heavy airflow jets, and condensation paths.
Example: Designing a Three-Sensor Layout
Suppose you need to monitor overheating risk in a small industrial room with three main machines.
- Sensor A: mounted to face Machine 1 directly, close enough to resolve small hot spots.
- Sensor B: mounted to face Machine 2, with slight overlap into Machine 1’s zone.
- Sensor C: mounted near the doorway to monitor Machine 3’s side where airflow changes are likely.
This layout gives you face-on sensitivity where it matters most, overlap where occlusion might occur, and a dedicated view for the machine most affected by changing conditions.
8.5 Integrating Multiple Sensors for Better Confidence
Single-sensor heat detection is like using one thermometer in a big room: it can be useful, but it can also lie to you in specific ways. Confidence improves when you combine sensors that “see” the same event from different angles, with different measurement principles, or at different locations. The goal is not to average everything blindly; it’s to detect when readings agree for the right reasons and when they disagree for the wrong ones.
Why Multiple Sensors Help
Thermal cameras report surface temperature based on assumptions about emissivity, reflections, and distance. Fixed IR sensors report temperature (or a proxy) based on their optics, filtering, and calibration. When you place them together, you can separate measurement issues from real heat changes.
A practical example: a window reflection can make a cold object look warm in a thermal camera. A nearby contact sensor on the frame, or a second IR sensor aimed at a non-reflective surface, will often show the mismatch immediately.
Integration Patterns That Work
Use one of these patterns, or combine them.
1) Camera Plus Point Sensors
A thermal camera provides spatial context, while point sensors provide repeatable time series.
- Place a point sensor on the most relevant surface area you can define clearly.
- Aim the camera so the point sensor location is visible in the image.
- Compare trends: if both rise at the same time, you likely have a real thermal event.
Example: During electrical maintenance, a camera shows a warm patch on a terminal. A fixed IR sensor mounted near the same terminal tracks temperature over time. If the camera shows a brief spike but the point sensor stays flat, the spike was likely a reflection or a focus/angle artifact.
2) Two IR Sensors with Different Views
Two sensors can confirm whether the heat is on the surface you care about or in the environment.
- Put sensors at different angles to the same target.
- If both sensors track the same temperature change, the event is more likely real.
- If only one sensor changes, check for reflections, obstructions, or emissivity differences.
Example: In HVAC duct inspection, one sensor sees a warm duct wall while the other sensor sees mostly reflected background. Agreement suggests a true duct temperature change; disagreement suggests optical issues.
3) IR Sensors Plus Non-IR Sensors
Add a sensor that measures something related but not identical to temperature.
Common pairings:
- IR temperature plus ambient air temperature and airflow direction.
- IR temperature plus humidity (for condensation risk).
- IR temperature plus vibration or current (for mechanical or electrical systems).
Example: A bearing may look warm in IR. If vibration increases at the same time, the heat is more likely caused by friction rather than sun loading or airflow changes.
Mind Map: Sensor Integration Logic
A Simple Confidence Scoring Method
You can turn agreement into a practical decision without complex math.
- Define the target and a time window (for example, 60 seconds).
- Check trend direction: rising, falling, or stable.
- Check timing: do changes start within a few seconds of each other?
- Check location: does the camera’s hot spot overlap the sensor’s aim area?
- Apply a rule set:
- High confidence: trend, timing, and location all match.
- Medium confidence: trend and timing match, but magnitude differs.
- Low confidence: trend conflicts or location doesn’t match.
Example: A thermal camera shows a hot spot near a motor housing. A point IR sensor aimed at the housing shows a rise starting 10 seconds later, and the hot spot overlaps the sensor’s region. Confidence is high. If the camera shows a hot spot but the point sensor stays steady, confidence drops to low and you investigate reflections, emissivity, or focus.
Example Setup: Electrical Terminal Monitoring
- Thermal camera: used to identify the suspect terminal and confirm the hot spot location.
- Two point IR sensors: one aimed at the terminal surface, one aimed at a nearby “control” surface that should stay similar.
- Optional ambient sensor: placed away from direct heat sources.
Workflow:
- Record a baseline with all sensors.
- Trigger the condition (for example, load change) while keeping the camera angle fixed.
- Confirm that the suspect sensor rises while the control sensor does not.
If both point sensors rise together, the heat may be coming from the environment or airflow rather than the terminal. If only the suspect sensor rises and the camera hot spot matches, you have stronger evidence of a localized thermal issue.
Practical Integration Checklist
- Mount sensors so their fields of view overlap the same physical area.
- Keep camera settings consistent during comparisons.
- Use the camera for “where,” sensors for “when,” and supporting sensors for “why it might change.”
- Treat disagreement as information: it usually points to emissivity, reflections, aiming, or obstruction rather than random error.
9. Practical Applications in Buildings, Industry, and Maintenance
9.1 Building Envelope Diagnostics for Insulation and Air Leaks
Thermal imaging is great at showing where heat is leaving, but building-envelope work is really about separating three things: insulation performance, air leakage, and surface effects like wet materials or reflective surfaces. A good workflow keeps those categories from blending into each other.
What You Are Looking For
Start by understanding the “shapes” heat loss tends to make.
- Insulation problems usually appear as broad, gently changing temperature regions. The pattern often follows construction geometry such as stud spacing, joists, or roof rafter lines.
- Air leaks tend to create sharper boundaries and streaks. You may see narrow vertical or horizontal lines where warm air escapes and mixes with cooler indoor air.
- Surface and moisture effects can mimic insulation loss. Wet drywall, damp sheathing, or cold metal fasteners can create localized cold spots that don’t behave like a uniform insulation gap.
Mind Map: Envelope Diagnostics Workflow
Preparation That Prevents False Conclusions
Thermal cameras measure temperature at surfaces, not “inside the wall.” If conditions are unstable, the image becomes a story about airflow timing rather than construction.
- Pick a day with a meaningful indoor–outdoor temperature difference. If the difference is small, the thermal contrast shrinks and small errors in emissivity or focus start to matter.
- Stabilize the space. Run HVAC normally, then wait for temperatures to settle. If you image right after changing setpoints, you’ll capture transient mixing.
- Control surface conditions. If a surface is recently cleaned, painted, or exposed to sun, its emissivity and surface temperature behavior can shift.
Step-by-Step: Finding Insulation Gaps
Example: Exterior wall with suspected missing insulation behind a window.
- Take an exterior wide shot to locate the window perimeter and adjacent wall areas.
- Move inward and capture close-ups of the wall around the window.
- Look for a broad, cooler region that extends beyond the window frame. If the cold area tracks stud spacing, it suggests insulation gaps or compression.
- Measure a few points on the cold region and compare to nearby insulated areas. The goal isn’t a single “correct” number; it’s consistency across the pattern.
Best practice: Use the same camera distance and focus for each close-up so the apparent sharpness doesn’t change between comparisons.
Step-by-Step: Identifying Air Leaks
Air leaks are often easiest to spot near penetrations: outlets, recessed lights, plumbing chases, attic hatches, and rim joists.
Example: Rim joist air leakage in a basement.
- Image the rim joist area from inside with the camera steady.
- Air leakage often shows as narrow, irregular cold bands that align with joist bays or the path of air movement.
- Compare the pattern to the framing layout. If the cold areas repeat at bay spacing, that’s a strong clue.
- Then verify with a targeted airflow check at suspected locations (for example, around gaps at sill plates or between sheathing and framing). Thermal images tell you where to look; airflow checks tell you what’s moving.
Best practice: Don’t assume every cold line is a leak. A metal fastener line can also look sharp. Use the “shape rule”: leaks usually create streaks or gradients that look like movement, while insulation loss tends to look more uniform.
Separating Moisture from Insulation
Moisture can make a surface colder because water conducts heat better than dry insulation materials.
Example: Cold patch on an interior wall near a bathroom.
- If the cold area is small and localized and doesn’t match stud spacing, treat it as a moisture candidate.
- Check for signs like discoloration, peeling paint, or damp drywall edges.
- Re-image after the area dries and conditions stabilize. If the thermal anomaly changes quickly, moisture is likely involved.
Practical Mind Map: Interpretation Rules

Reporting That Helps Someone Fix the Problem
A useful report includes more than pretty images.
- Mark regions of interest with simple labels like “window perimeter,” “rim joist bay,” or “electrical outlet area.”
- Record conditions: indoor/outdoor temperatures, time of imaging, and whether surfaces were shaded or sun-warmed.
- Note measurement assumptions such as emissivity settings used for common materials.
When you combine pattern recognition with verification, thermal imaging becomes a precise tool for insulation and air-leak diagnostics rather than a guessing game with colors.
9.2 Electrical Hot Spot Detection for Safer Maintenance
Electrical hot spots are places where heat is generated faster than it can be removed. Thermal imaging helps you find those places without dismantling everything first, but the camera does not “know” electricity. It measures surface temperature and patterns, so your job is to connect the temperature evidence to likely electrical causes.
What You Are Looking For
A true electrical hot spot usually shows up as a localized warm region at a connection: a terminal, splice, breaker lug, busbar joint, or cable termination. The pattern matters. A single point that is hotter than its neighbors is more suspicious than a whole panel that is uniformly warm.
A useful rule of thumb is to compare like with like. Compare one phase to another, one connection to another on the same type of component, and the same side of a connection if you can access both.
Safety First, Then Imaging
Before you image, confirm the work conditions. If the panel is energized, follow your site’s electrical safety procedures and use appropriate PPE. If you cannot safely access the area, you do not image it.
Also note the operating state. A panel that has just been switched on may show transient heating that later settles. If possible, capture images after the system has reached steady load.
Mind Map: Electrical Hot Spot Detection Workflow
Emissivity and Surface Reality
Thermal cameras report temperature based on emissivity. Electrical components often have coatings, oxidation, or bare metal. Bare shiny metal can reflect infrared from nearby hotter surfaces, making the reading misleading.
A practical approach is to treat emissivity as a controlled variable. If your camera allows emissivity adjustment, set it based on the surface type you observe. If you cannot confidently set emissivity, rely more on relative comparisons than absolute numbers.
Example: Two identical lugs on different phases show different temperatures. If one lug is visibly oxidized and the other is cleaner, emissivity differences can exaggerate the gap. In that case, take a second image from a slightly different angle to see whether the hot region stays put.
How to Image Connections Without Getting Fooled
- Get close enough to resolve the connection. If the hot spot is smaller than a few pixels, you will average it away.
- Avoid glare and reflections. Move your position and change the angle. Reflections tend to shift with viewpoint; true heating tends to remain at the same physical location.
- Capture a reference area. Include a nearby surface that should be similar in temperature, such as another lug on the same phase group.
- Use consistent settings. If you change palettes or measurement modes mid-job, you make comparisons harder.
Example: Panel with One Phase Running Hot
You inspect a distribution panel feeding three motor starters. On the thermal image, phase A shows a bright warm spot at a breaker lug. Phase B and C look similar.
Reasoning steps:
- The warm region is localized at a connection, not spread across the busbar.
- The location is consistent with a common failure mode: loose or degraded contact.
- The phase-to-phase comparison reduces the chance that the entire panel is simply warm.
Next actions:
- Re-image from a different angle to check whether the hot spot is stable in position.
- Photograph the visible connection and note any signs like discoloration or corrosion.
- Schedule maintenance to inspect and tighten or replace the connection according to your electrical procedure.
Example: “Hot Panel” That Is Not an Electrical Fault
In another case, the entire enclosure is warmer than expected, but the temperature map shows no sharp localized peaks at terminals. The warmest areas align with blocked airflow paths near the top vents.
Reasoning steps:
- Uniform heating suggests overall thermal conditions rather than a single resistive contact.
- Lack of localized connection peaks points away from a loose lug.
- The warmest regions match the airflow restriction pattern.
Next actions:
- Verify ventilation and clear obstructions.
- Re-image after airflow is restored and the system stabilizes.
Documentation That Helps Maintenance Actually Work
When you record a hot spot, include:
- The exact component location (breaker number, lug label, wire identifier).
- The operating state (load level, time since startup).
- The image set showing the hot spot and at least one comparison area.
- Any emissivity setting used and what surface you observed.
A good report makes it easy for someone else to stand in the same place, look at the same connection, and confirm the same pattern.
Quick Checklist for Safer Interpretation
- Is the heat localized at a connection?
- Does the hot spot stay in the same physical location across angles?
- Are other similar connections on the same phase group cooler?
- Could airflow, covers, or surface condition explain the pattern?
- Did you capture enough context to compare like with like?
Electrical hot spot detection is mostly disciplined comparison. The camera gives you temperature evidence; your reasoning turns that evidence into a maintenance decision.
9.3 Mechanical Issues Like Bearings, Friction, and Misalignment
Thermal imaging can show mechanical problems because friction turns motion into heat, and misalignment changes how loads travel through parts. The trick is to separate “heat that belongs to the machine” from heat that comes from the environment, the motor, or nearby hot surfaces.
What You’re Looking For
Start with the motion path. Bearings, couplings, belts, and gears all have characteristic heat patterns when they’re healthy versus when they’re struggling.
- Bearings: Heat often concentrates near the bearing housing or along one side of the support. A failing bearing may show a localized hot spot that grows over time.
- Friction in sliding contacts: You may see a narrow band or stripe where rubbing occurs, especially if the contact is intermittent.
- Misalignment: Misalignment tends to create heat at the interface where forces concentrate. Patterns can appear “off-center” relative to the expected load path.
A useful mindset: thermal images are maps of where energy is being spent, not proof of the exact failure mode. You still need a mechanical check.
Mind Map: Mechanical Heat Patterns and Checks
Bearings: From Normal Warmth to Trouble
Healthy bearings warm up during operation, but the pattern should be steady and modest. A bearing that’s failing often shows a hot region that becomes more intense as the machine runs.
Example: A conveyor motor runs for 20 minutes. The thermal image at minute 5 shows both bearing housings slightly warm. At minute 20, the drive-side bearing housing becomes noticeably hotter than the other side, with a concentrated area near the top quadrant. A quick mechanical check finds a rough feel when rotating the shaft by hand with power off, plus a slight looseness in the bearing seat.
Best practice: Compare both sides of the same machine. If only one bearing housing heats up, you’re more likely dealing with a localized mechanical issue than general electrical heat.
Friction: Spotting Rubbing and Contact Problems
Friction problems are often easier to see because the heat can trace the contact geometry. Look for a band, stripe, or patch that matches where two surfaces meet.
Example: A belt-driven pump shows a narrow hot line near the belt edge on one side of the pulley. The rest of the motor casing looks similar to baseline. The belt tension is adjusted, and the hot line reduces after a short run. The thermal pattern matched the rubbing location, which helped avoid chasing unrelated electrical causes.
Best practice: If the machine has intermittent motion, capture a short sequence. A single frame can miss the moment rubbing starts.
Misalignment: When Loads Go Where They Shouldn’t
Misalignment changes where forces concentrate. That can create uneven heating at couplings, bearing supports, or belt/pulley systems.
Example: A motor coupling shows a mild temperature increase on both sides at first. After a few minutes, the thermal image reveals a stronger hot region on one side of the coupling guard area. A mechanical inspection finds the coupling faces not parallel and the mounting shims uneven. After correcting alignment, the temperature difference between sides shrinks.
Reasoning: Misalignment doesn’t just “make things hotter.” It shifts load paths, so the heat tends to appear where contact stress rises.
How to Measure Without Getting Fooled
- Use consistent measurement points. Pick the same locations on the housing or guard each time.
- Avoid shiny metal for temperature readouts. If you must measure metal, use a consistent method such as a small, matte target or a surface treatment appropriate for the environment.
- Control operating conditions. Compare images at similar load and speed. A change in load can mimic a mechanical fault.
- Look for time behavior. A mechanical issue often shows a trend during a run, while ambient changes tend to be slower and more uniform.
Practical Mini-Workflow for Bearings, Friction, and Misalignment
- Step 1: Capture a baseline image with the machine at normal operating load.
- Step 2: Run for 10–20 minutes and capture another image at the same camera settings.
- Step 3: Compare left/right and center/off-center regions.
- Step 4: Inspect the corresponding mechanical interfaces: bearing seats, coupling faces, belt tracking, and fastener tightness.
- Step 5: Re-check after correction and confirm the thermal pattern moves toward symmetry or returns to baseline.
This approach keeps the thermal evidence tied to mechanical reality: heat shows where energy is being wasted, and the inspection confirms why.
9.4 Plumbing and HVAC Troubleshooting with Thermal Patterns
Thermal patterns help you separate “something is hot” from “something is insulated poorly” and “something is leaking.” The trick is to look for shape, not just color: edges, gradients, and repeating geometry often tell you more than a single hottest pixel.
What to Look for in Pipes and Ducts
Start by identifying the system type and what should be happening.
- Supply lines and supply ducts usually show warmer surfaces than the return side under steady operation.
- Returns often show cooler surfaces, but not always; mixing and recirculation can blur the difference.
- Condensation is a clue for cold surfaces below dew point, especially on refrigerant lines and chilled-water piping.
Use a simple rule: if the thermal pattern matches the physical layout, suspect heat transfer or insulation. If it doesn’t match, suspect flow, control, or a hidden obstruction.
Mind Map: Thermal Clues for Plumbing and HVAC
Example: Chilled Refrigerant Line with a “Cold Patch”
A technician notices a chilled line that should be uniformly cold, but the thermal image shows a cold patch that starts and stops abruptly. The patch edges align with a section of insulation that looks intact from a distance.
Reasoning steps:
- Check for dew point behavior. If the cold patch corresponds to where condensation starts or stops, the insulation is likely failing at that segment.
- Look for a step change. A sharp boundary suggests a localized insulation gap rather than gradual heat loss.
- Verify with a second angle. Reflections from nearby shiny surfaces can create false gradients; changing the camera angle helps confirm the patch is real.
Practical fix: replace or repair the insulation jacket at the boundary and ensure the vapor barrier is continuous. After repair, the thermal pattern should become smoother along the run.
Example: Heating Supply Pipe with a Temperature Drop After a Valve
During heating, a supply pipe shows warm temperatures up to a valve body, then a noticeable drop downstream. The drop is not gradual; it looks like a step.
Reasoning steps:
- Valve geometry matters. Thermal cameras often reveal valve internals as distinct shapes, so compare the pattern to the valve location.
- Step change suggests restriction. A partially closed valve or a stuck actuator can reduce flow enough to cool the downstream section.
- Rule out measurement artifacts. Confirm emissivity settings for the pipe surface and avoid measuring through glare from nearby metal.
Practical fix: inspect valve position and actuator operation, then confirm flow using the system’s normal indicators (pressure/temperature readings at the appropriate points). After correction, the downstream pipe should warm closer to the upstream level.
Example: Ductwork with Warm Duct Walls and Cool Supply Air
In a cooling season, the duct interior air may feel cool, but the duct walls appear warmer than expected. The thermal pattern shows warmer areas near joints and along seams.
Reasoning steps:
- Warm walls with cool air points to leakage or poor insulation. If conditioned air is escaping into a warmer space, the duct surface can warm.
- Seam-focused patterns are common. Gasket issues and loose connections often show up as repeating warm bands.
- Compare supply and return ducts. If only one side shows the anomaly, the problem is more likely localized to that duct run.
Practical fix: seal or repair joints and check insulation coverage. After repairs, the duct wall temperature should become more uniform along the affected run.
Quick Troubleshooting Workflow
- Identify the expected direction. Heating should warm supply surfaces; cooling should cool supply surfaces.
- Locate the pattern boundary. Step changes usually indicate valves, restrictions, or insulation breaks.
- Match the pattern to the layout. If it follows the pipe or duct path, suspect heat transfer or insulation. If it doesn’t, suspect control, mixing, or airflow.
- Verify after action. Re-image the same region with consistent camera settings to confirm the change is real.
Common Pitfalls That Create Misleading Patterns
- Emissivity mismatch on shiny metal can exaggerate gradients.
- Measuring through windows or dusty covers can blur edges and soften the “step” that signals a real issue.
- Transient operation can produce temporary patterns that look like faults; steady operation makes the thermal signature easier to interpret.
When you treat thermal images like maps of heat flow—shapes, boundaries, and continuity—you can narrow plumbing and HVAC problems to a short list that’s practical to inspect and fix.
9.5 Step-By-Step Inspection Examples with Measurement Notes
Example 1: Building Envelope Heat Loss Check
Goal: Find likely insulation gaps and air leaks, then record where and why.
Step 1: Set up repeatable conditions. Inspect on a day with a stable indoor temperature and minimal direct sun on the exterior. If sunlight hits one wall, you’ll measure reflections and heating, not heat loss.
Step 2: Choose camera settings and lock them. Use the same emissivity setting for all surfaces you plan to compare. Keep palette and span consistent so “brighter” means the same thing across images.
Step 3: Establish a baseline. Start with a wide shot of the whole facade. Look for broad temperature bands before chasing small spots.
Step 4: Inspect edges and transitions. Move to corners, window frames, and wall penetrations. These areas often show the strongest contrast because they combine different materials and airflow paths.
Measurement notes to write down:
- Distance to the wall and approximate spot size coverage.
- Emissivity used for each surface type (paint, brick, metal trim).
- Whether the wall is dry, since wet surfaces can change emissivity and apparent temperature.
Step 5: Verify with a simple check. After capturing images, repeat from the same position and angle. If the pattern changes dramatically, you may be seeing reflected heat sources or transient airflow.
Common pitfall: Setting emissivity to “generic” and then comparing a painted wall to bare metal trim. The camera will happily produce numbers that look precise while being inconsistent.
Example 2: Electrical Panel Hot Spot Screening
Goal: Identify components running hotter than expected without assuming the camera alone proves failure.
Step 1: Ensure safe access and stable load. Take images when the panel is under normal operating load. If you inspect right after switching off equipment, the hottest parts may cool faster than you can document.
Step 2: Use a consistent viewpoint. Stand at the same distance for each panel section. Angle changes can shift apparent temperature due to emissivity differences and reflections.
Step 3: Capture overview then detail. First photograph the entire panel. Then capture close-ups of bus bars, breakers, and cable terminations.
Measurement notes to write down:
- Ambient conditions and whether the panel door is open or closed.
- Any known recent maintenance or component replacements.
- The exact measurement method used: spot reading, area average, or both.
Step 4: Use area measurements for comparisons. A single spot can land on a screw head, label, or shiny surface. Area readings reduce the chance that one small reflective point dominates the result.
Step 5: Record the “why,” not just the “what.” Note whether the hot region aligns with a known connection point, a cable transition, or a breaker type. Thermal patterns are more useful when they map to physical structure.
Common pitfall: Measuring through a window or cover that reflects nearby heat. If reflections are likely, capture an additional image from a slightly different angle to see whether the hot region “moves” with reflections.
Example 3: Mechanical Bearing and Friction Check
Goal: Find abnormal friction or misalignment indicators on rotating equipment.
Step 1: Confirm the operating state. Inspect while the machine runs at a steady speed. Thermal changes from startup and shutdown can mimic faults.
Step 2: Control motion blur. Use the camera’s motion-handling mode if available and keep your stance stable. If the image is smeared, you’ll lose the ability to compare edges and hotspots.
Step 3: Focus on repeatable landmarks. Use the same frame location each time: motor housing, bearing bracket, and nearby fasteners.
Measurement notes to write down:
- Running speed or load condition at the time of capture.
- Whether the housing surface is painted, oily, or bare metal.
- The measurement region boundaries you used.
Step 4: Compare left-right or top-bottom. Bearings often show a consistent pattern relative to the housing. A localized hot spot near one side can indicate lubrication or alignment issues.
Step 5: Document a baseline for later. Capture at least one “normal” image set when the equipment is known to be healthy. Later comparisons become much more meaningful when the camera settings and measurement regions match.
Common pitfall: Cleaning the surface right before inspection. Removing oil can change emissivity and make the temperature look different even if the heat generation is unchanged.
Mind Map: Inspection Workflow and Measurement Notes
Quick Measurement Note Templates
Template A Building Envelope:
- Surface type and emissivity used
- Distance and camera angle
- Weather and sun exposure
- Noted locations: corners, window frames, penetrations
Template B Electrical Panel:
- Load condition and time since last change
- Door open/closed and any covers
- Measurement method: spot vs area
- Component mapping: breaker, bus bar, termination
Template C Mechanical Equipment:
- Speed/load state
- Surface condition: painted, oily, bare
- Region boundaries for comparisons
- Left-right or top-bottom hotspot location
10. Data Handling, Reporting, and Evidence-Grade Documentation
10.1 Capturing Metadata That Makes Results Defensible
Defensible thermal results depend on more than a good image. Metadata is the record that explains what was measured, under what conditions, and how the camera settings were chosen. When someone else reviews your work, they should be able to reproduce your setup well enough to reach the same conclusions.
What Metadata Should Cover
Start with a simple rule: if a setting could change the temperature numbers, it belongs in the record. For thermal cameras, that usually means emissivity, reflected temperature, distance, and atmospheric parameters. It also means the human choices: where you pointed, what you measured, and which frames you selected.
Include these categories in every report:
- Device identity: camera model, serial number, lens type, and firmware/software version.
- Measurement configuration: emissivity value, reflected temperature source, distance-to-target, and any atmospheric compensation settings.
- Optics and focus: focus mode, whether the lens was clean, and whether the image was corrected for focus or distortion.
- Scene context: ambient temperature and any relevant conditions like wind, direct sun, or recent heating.
- Acquisition details: frame rate, integration mode if applicable, palette or display mode, and which frame(s) were exported.
- Analysis choices: region-of-interest boundaries, spot size assumptions, and how you selected the hottest/coldest points.
A useful mental check is to ask, “If I changed only one thing, would the reported temperature change?” If yes, record it.
Mind Map: Metadata Checklist
Example: A Good Metadata Entry for a Building Inspection
Imagine you inspect a wall for insulation gaps. You capture an image and report a “hot” area. Without metadata, the number is just a number. With metadata, it becomes a measurement.
Example metadata fields you would record:
- Camera: FLIR-like model name, serial number, lens type.
- Firmware: version number.
- Emissivity: 0.95 (and the basis, such as “measured paint sample” or “assumed painted drywall”).
- Reflected temperature: 22°C from the camera’s reflected temperature setting, measured using a nearby reference surface.
- Distance: 2.5 m, measured with a tape.
- Atmospheric compensation: set to “ambient” with ambient 21°C.
- Focus: manual focus locked after initial framing.
- Acquisition: 30 Hz, exported the frame with the sharpest edges and minimal motion.
- ROI: polygon drawn around the suspected void area; extrema taken within that ROI.
- Scene notes: no direct sun on the wall during capture; HVAC running normally.
- Timestamp: local time with time zone.
This record lets a reviewer understand why the numbers are plausible and what assumptions were made.
Example: Metadata That Prevents a Common Emissivity Dispute
A frequent disagreement happens when someone later says, “Your temperature is wrong because emissivity was wrong.” You can’t eliminate emissivity uncertainty, but you can show you handled it.
Example scenario: you measured a metal pipe that looked dull but was actually coated.
- You set emissivity to 0.60 based on the coating type you observed.
- You note that the pipe surface was dry and not glossy.
- You record reflected temperature from the environment and the distance used.
- You include a second measurement on a nearby coated section and show the temperatures track consistently.
If the reviewer challenges emissivity, they can see exactly what you assumed and where you validated behavior.
Mind Map: Evidence Integrity Practices
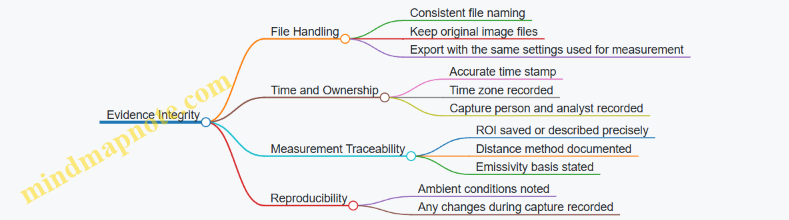
Practical Tips for Writing Metadata That People Can Use
- Record units for every numeric field. “Distance 2.5” is ambiguous; “Distance 2.5 m” is not.
- State the basis for emissivity and reflected temperature. “Assumed” is acceptable if you say what you assumed.
- Describe ROI selection so another person can draw the same region. “Around the hot spot” is vague; “ROI includes the full bright band excluding edges” is clearer.
- Keep the exported frame consistent with the analysis. If you analyze one frame and export another, the report becomes harder to trust.
When metadata is complete and consistent, the report can be checked. That is what makes it defensible.
10.2 Choosing Measurement Points, Areas, and Regions of Interest
Choosing where to measure is the difference between “a thermal image” and “evidence.” A good selection strategy makes your results repeatable, explains why you picked those spots, and reduces the chance that you measured a reflection, an edge, or a mixed-material surface.
Measurement Points
A measurement point is a single pixel-based target or a small cursor area. Use points when you need a reference value, such as comparing two fasteners or checking whether one cable is warmer than another.
Best practices
- Pick points on surfaces with stable emissivity. For example, a painted metal bracket usually behaves more consistently than shiny bare aluminum.
- Avoid edges and corners unless the goal is edge behavior. Edges often include mixed geometry and partial reflections.
- Use the same point locations across images. If you compare “before and after,” the camera settings and the target positions must match.
Example You inspect an electrical panel. Choose points on the flat face of three terminal blocks, not on the screw heads. Record the temperature for each point and note the emissivity setting used for the surface type.
Measurement Areas
An area measurement averages over a region, which helps when the scene has small texture variations or when you’re trying to reduce noise from tiny hotspots.
Best practices
- Size the area to cover the feature you care about, but not so large that it includes surrounding cooler or hotter zones.
- Keep the area inside the feature boundary. If the feature is a cable run, place the area on the cable insulation rather than straddling the cable and the mounting clip.
- Use consistent area shapes when comparing images. A rectangle that stays the same size and position is easier to reproduce than a freehand blob.
Example You check a roof penetration. Measure an area on the insulation surface directly around the penetration, excluding the metal flashing. The averaged value is more stable than a single point that might land on a seam.
Regions of Interest
A region of interest (ROI) is a named zone you analyze for patterns, not just a single number. ROIs are useful when you need to explain spatial behavior, like heat loss paths, airflow patterns, or localized defects.
Best practices
- Define ROIs by function, not by aesthetics. For instance, “north wall near the window” is clearer than “the darker area.”
- Use multiple ROIs when the scene has distinct materials. A wall with drywall, insulation, and framing should not be treated as one uniform region.
- Keep ROI boundaries away from transitions unless transitions are the subject. If you’re studying insulation failure, then include the transition; otherwise, exclude it.
Example You inspect a wall for insulation gaps. Create ROIs for the window frame perimeter and for the adjacent field of wall. Compare the average temperatures within each ROI to see whether the anomaly is localized to the frame.
Mind Map: Selecting Where to Measure
A Practical Selection Workflow
- Identify the question. Are you checking “which is hotter,” “how much hotter,” or “where the pattern is.” The question determines whether you need points, areas, or ROIs.
- List candidate surfaces. For each candidate, decide whether emissivity is stable and whether reflections are likely. A glossy surface under a bright light is a poor candidate for point measurements.
- Choose the smallest measurement that answers the question. If you only need a comparison between two fasteners, don’t average a whole panel.
- Validate boundaries. Zoom in and confirm the measurement region sits on the intended material. If the region crosses a seam, you’re measuring the seam.
- Plan for repeatability. Mark the ROI logic in your notes: where it starts, what it covers, and what it excludes.
Example: Three Levels of Measurement on One Scene
A technician inspects a motor housing with a suspected bearing issue.
- Point: Place a point on the center of the housing where the surface is matte and unobstructed.
- Area: Use an area around the suspected warm patch, sized to include the patch but exclude nearby fins.
- ROI: Create an ROI covering the entire motor side panel to compare the warm patch location relative to the motor’s geometry.
This layered approach prevents a common mistake: concluding “the motor is hot” from a single point that happened to land on a reflection or a different material.
Quick Checklist for Good Measurement Choices
- The measurement location matches the question.
- The region avoids edges unless edges are the target.
- The region stays on one material type.
- The region size and position are consistent across images.
- The notes include emissivity assumptions and what was excluded.
10.3 Export Formats, Image Compression, and What Changes Data
Thermal cameras can export images in several formats, but the format choice affects more than file size. It can change how pixel values are stored, how metadata survives, and whether your measurement workflow stays reproducible.
What “Export” Can Mean in Thermal Work
Export usually comes in two flavors: a visible-looking image and a measurement-capable file. A palette image (often JPEG or PNG) is mainly for viewing. A radiometric file (often proprietary or radiometric-capable formats) preserves temperature-related data so you can re-run analysis later.
Practical rule: If you might need to change emissivity, temperature range, or measurement regions after the fact, prioritize radiometric exports. If you only need documentation for a report, a palette image may be enough.
Common Image Formats and Their Effects
JPEG
- Uses lossy compression, which can blur fine gradients.
- Can introduce block artifacts that make small hot/cold transitions harder to interpret.
- Typically stores limited measurement metadata.
PNG
- Uses lossless compression, preserving pixel values for the rendered image.
- Still usually stores only the palette image, not raw radiometric data.
- Larger files than JPEG, but safer for visual comparison.
Radiometric or Measurement-Capable Exports
- Preserve temperature-related information and often calibration parameters.
- Allow re-measuring regions of interest without starting from a “pretty picture.”
- File format and metadata structure vary by manufacturer, so keep the original export alongside any report images.
Compression: What Gets Smaller and What Gets Lost
Compression can affect three things: pixel values, color mapping, and metadata.
- Pixel values: Lossy compression can alter subtle differences between neighboring pixels. In thermal images, those differences often represent real temperature gradients.
- Color mapping: A palette image is a mapping from values to colors. If the export stores only the mapped colors, you lose the original numeric basis.
- Metadata: Some exports keep camera settings (emissivity, distance, reflected temperature, atmospheric parameters). Others drop them, leaving you with an image that looks right but can’t be reinterpreted.
Example: You export a scene as JPEG for a report and later realize the emissivity was set incorrectly. If the JPEG only contains palette colors, you cannot recover the original numeric temperature basis. If you exported radiometric data, you can correct emissivity and regenerate the measurement.
Mind Map: Export Decisions That Protect Measurement Integrity
Example Workflows That Stay Consistent
Workflow A: Report-Only Documentation
- Export a PNG of the rendered image.
- Use the same palette and temperature range settings for all images in the report.
- Capture measurement screenshots only if they are clearly labeled with the measurement settings.
Workflow B: Evidence-Grade Measurement
- Export the radiometric file for each scene.
- Export a PNG for the report from the radiometric source.
- Store both files with matching names so the report image can always be traced back to the measurement file.
Choosing Settings for Exports
- Temperature range and palette: If you change the range, the same scene can look different even when the underlying data is unchanged. Keep the range consistent for comparisons.
- Region of interest: If the export supports it, store ROIs with the measurement file. If not, record ROI coordinates or describe them precisely in the report.
- File naming: Include date, asset identifier, and camera settings summary when possible. A good name reduces the chance of mixing images from different emissivity settings.
What Changes Data in Real Life
Compression and format choice can change what you can claim:
- A JPEG can be good for quick sharing, but it is not reliable for fine gradient comparisons.
- A PNG is better for visual consistency, but it still may not support re-measurement.
- A radiometric export is the only safe basis for changing measurement settings after the fact.
Bottom line: Treat palette images as presentation and radiometric exports as the measurement record. When you export, decide which job the file must do, then choose the format that can actually do it.
10.4 Writing Clear Findings from Thermal Evidence
Thermal images are persuasive only when the reader can reproduce the conditions and understand what the numbers mean. Clear findings start with a short statement of what was observed, then explain how the measurement was made, and end with a practical interpretation tied to the evidence.
What a Clear Finding Looks Like
A good finding has four parts:
- Observation: What changed in the scene, where it happened, and how it compares to nearby areas.
- Measurement Context: Distance, emissivity setting, reflected temperature handling, and any relevant camera settings.
- Interpretation: What the thermal pattern most likely indicates, stated as a reasoned conclusion rather than a guess.
- Actionable Recommendation: What to do next, phrased as a decision the reader can take.
A simple template keeps you from mixing evidence with assumptions.
- Finding: “The area around the panel seam is warmer than the adjacent surfaces.”
- Evidence: “Region of interest shows a temperature difference of X °C under the same palette and span.”
- Context: “Emissivity set to Y; camera held at Z meters; focus confirmed; no window reflections observed.”
- Conclusion: “The pattern is consistent with increased heat transfer at the seam.”
- Next Step: “Inspect the seam insulation and fasteners; verify with a second angle measurement.”
Mind Map: Finding Structure
Mind Map: Evidence That Supports Interpretation
Example: Electrical Panel Finding
Finding: “Two conductor terminations show higher temperatures than the surrounding bus area.”
Evidence: “In image IMG_0142, the ROI around Termination A averages 62.4 °C while the adjacent bus averages 49.1 °C, giving a 13.3 °C difference. The hot region is spatially localized rather than spread across the entire panel.”
Measurement Context: “Camera distance was 1.2 m, focus confirmed on the panel face, emissivity set to 0.95, and the palette span was set to 20–80 °C. No direct reflections from nearby lights were visible on the panel surface.”
Interpretation: “A localized hot spot at a termination is consistent with increased electrical resistance at that contact point, because the thermal pattern does not match a general panel temperature shift.”
Recommendation: “Verify torque and contact condition with appropriate safety procedures. Capture a second image from a slightly different angle after inspection to confirm the hot spot remains at the same physical location.”
Example: Building Envelope Finding
Finding: “A vertical strip near the window frame is cooler than the surrounding wall surface.”
Evidence: “In image IMG_0301, the strip averages 18.2 °C while the adjacent wall averages 21.0 °C, a 2.8 °C difference. The cooler region aligns with the frame edge across multiple frames.”
Measurement Context: “Emissivity set to 0.90 for painted drywall, distance 2.5 m, and the camera was held steady to avoid motion blur. Outdoor wind was light, and the interior area was occupied but not actively heated during capture.”
Interpretation: “The consistent cooler strip along the frame edge suggests reduced insulation performance or air leakage at that interface, since the pattern follows the construction boundary rather than random surface variation.”
Recommendation: “Check insulation continuity and air sealing at the frame perimeter. Repeat the measurement after corrective work using the same distance and emissivity setting to compare like-for-like.”
Common Mistakes to Avoid
- Leaving out emissivity: Without it, the temperature number is hard to trust, even if the picture looks convincing.
- Using only “hotter/colder”: Relative language is fine, but include a temperature difference or a clearly defined pattern.
- Blending context into interpretation: Keep “what we did” separate from “what it means.”
- Changing settings between images: Before/after comparisons become confusing when spans, palettes, or emissivity values differ.
Quick Checklist Before You Submit
- I can point to the exact location of the issue.
- I included at least one numeric comparison or a clearly defined pattern.
- I documented distance, emissivity, and any reflection concerns.
- My conclusion explains why the pattern fits the likely mechanism.
- My recommendation tells the reader what to check next and how to verify it.
10.5 Creating Before-After Comparisons with Consistent Settings
Before-after comparisons work only when the camera and the scene are treated like a controlled experiment. The goal is not to make the “after” image look better; it’s to make the difference measurable.
The Consistency Checklist
Start with a short checklist you can reuse every time:
- Same camera settings: lock measurement mode, palette, emissivity setting, reflected temperature/ambient compensation mode, and any correction toggles.
- Same optics and framing: use the same lens, the same distance, and the same camera position. If you can’t keep distance, keep the camera-to-target geometry consistent and document it.
- Same focus and image quality: refocus if anything changes in the scene. Verify sharpness on edges of the area you will compare.
- Same environmental conditions: avoid comparing images taken after rain, direct sun changes, or HVAC cycling unless those changes are part of the test.
- Same measurement regions: define the same ROI shape and size for both images. If you use a spot meter, use the same spot location relative to a fixed feature.
A practical habit: take a “setup photo” in visible light (or a phone photo through the same framing) so you can confirm you returned to the same viewpoint.
Mind Map: What Must Stay the Same
Choosing a Display Range That Doesn’t Lie
Many cameras let you auto-scale the color range. Auto-scaling can make two images look different even when the underlying temperatures are similar. For comparisons, prefer a fixed span (or a fixed min/max) so the same color corresponds to the same temperature range.
If your camera only offers auto-scaling, you can still reduce confusion by:
- capturing both images with the same palette,
- keeping the same scene framing,
- and using the camera’s numeric temperature readouts for the ROI rather than relying on color alone.
Example: Insulation Patch Around a Window
Goal: Verify whether an insulation repair reduced heat loss.
- Before capture
- Set emissivity to match the window frame material (or the surface you will measure).
- Fix the display range so the window frame and surrounding wall occupy similar color levels.
- Mark the ROI: a rectangle that covers the same area of the frame edge.
- After capture
- Return to the same camera position and distance.
- Keep the same emissivity and compensation settings.
- Use the same ROI rectangle coordinates relative to a visible reference edge.
What to record:
- ROI average temperature (or max/min if that’s your metric),
- the temperature difference between before and after,
- and any notes about surface changes (for example, the patch area was newly covered and may have different emissivity).
Common mistake: measuring the bare patch material in the after image but measuring painted frame in the before image. Even if the repair is correct, emissivity differences can shift the reported temperature.
Example: Electrical Connection Hot Spot Check
Goal: Confirm a tightened connection reduced localized heating.
- Before capture
- Use the same spot location on the connector body.
- Fix the display range and keep the same measurement mode.
- Capture while the equipment is operating in the same load state.
- After capture
- Repeat under the same load and airflow conditions.
- Keep the same spot location and ROI size.
What to record:
- spot temperature at the same physical point,
- the surrounding ROI trend (for example, does the gradient shrink or just move?),
- and whether the camera was held at the same angle.
Common mistake: taking the after image after the load changes. A cooler system can make the connector look better even if the connection is unchanged.
A Simple Comparison Workflow
Use this sequence every time:
- Lock settings: set emissivity, compensation, palette, and fixed range.
- Define measurement: choose ROI/spot and mark it by reference features.
- Capture before: record time, load state, and any visible surface changes.
- Perform the change: repair, adjustment, or cleaning.
- Capture after: return to the same viewpoint and re-check focus.
- Compare numbers first: compute ROI temperature differences; use the color image as context.
Mind Map: Evidence Quality Checks
When you follow this, the before-after pair becomes a measurement, not a guess. The images may look different because the temperatures changed, but they should not look different because the camera or setup changed.
11. Troubleshooting Common Problems in Thermal Work
11.1 Low Contrast Scenes and How to Improve Detectability
Low contrast is what happens when the temperature difference between objects is small compared to the camera’s noise, the scene’s reflections, or the way the camera scales colors. The camera may still be measuring correctly, but your eyes (and your palette) can’t tell what matters.
Why Low Contrast Happens
- Small temperature differences: If a pipe is 31°C and the surrounding air is 29°C, the thermal camera has to separate a tiny signal from everything else.
- Non-uniform surfaces: Dust, paint, or wetness can change emissivity across the same object, creating patchy readings that hide the real pattern.
- Reflections and background influence: Shiny or glossy surfaces can reflect a warmer or cooler environment, reducing the apparent contrast of the object itself.
- Atmospheric and distance effects: Heat can be absorbed or scattered, especially over long paths, flattening gradients.
- Display scaling choices: Some cameras auto-scale the palette per frame, which can make subtle differences look inconsistent.
Improve Detectability with Practical Adjustments
1. Stabilize the scene and the camera
- Use a tripod or brace your elbows against a wall.
- Wait for wind to settle when measuring outdoors.
- If the camera offers a “hold” or “average” mode, use it to reduce frame-to-frame flicker.
Example: You’re checking a ceiling for a warm air leak. The first image looks flat because the camera is moving slightly. After bracing and holding still for 3–5 seconds, the warm boundary becomes a consistent band instead of a speckled mess.
2. Use the right measurement mode and scaling
- Prefer a fixed span or manual range when available.
- Turn off auto-ranging if it causes the palette to “breathe” between frames.
- Choose a palette that preserves small differences; some palettes exaggerate extremes and compress mid-tones.
Example: A motor housing shows barely different colors from the background. With auto-scaling on, the housing alternates between “almost same” and “noticeably different.” With a fixed range set around the expected temperatures, the housing stays consistently distinguishable.
3. Improve emissivity control
- If you can’t set emissivity accurately, at least make it consistent across the region you’re comparing.
- For rough, matte surfaces, emissivity is often more predictable than for polished metal.
- For shiny surfaces, apply a small patch of matte tape or paint where allowed, then measure that patch to confirm the camera’s behavior.
Example: You’re inspecting a stainless steel panel for a hot spot. The panel looks uniformly warm because reflections dominate. After placing a small matte marker on the suspected area, the thermal contrast becomes clearer, and the hot spot appears where you expected.
4. Reduce reflections and background contamination
- Change your angle slightly so the camera is not “looking into” a strong reflection source.
- Avoid measuring through windows or glossy covers when possible.
- If you must measure near reflective surroundings, include them in your interpretation instead of assuming the object alone drives the reading.
Example: A window-mounted electrical cabinet seems to have no thermal signature. The cabinet’s surface reflects a warm room light. By shifting position to reduce the reflection path, the cabinet’s true temperature pattern becomes visible.
5. Get closer or adjust the optics
- If your camera supports it, use a lens or zoom that fills more of the frame with the target.
- Keep the target large enough that the camera’s minimum resolvable detail isn’t being wasted on background.
Example: A small bearing shows no clear hotspot at long range. Moving closer so the bearing occupies more pixels turns a flat patch into a distinct warmer region.
6. Choose the right measurement strategy for small differences
- Instead of relying on a single pixel or tiny spot, use a region of interest and compare areas.
- Look for gradients: even when absolute temperatures are close, the direction of change can be meaningful.
Example: Two adjacent sections of ductwork differ by only a couple degrees. A single spot read varies too much. A region-based average shows one section consistently higher, which is enough to guide the next inspection step.
Mind Map: Low Contrast Detectability Checklist
Quick Field Example Workflow
- Take a steady image and note whether the palette changes between frames.
- Switch to a fixed temperature range around the expected values.
- If the target is shiny, add a small matte marker and re-check contrast.
- Adjust your viewing angle to reduce reflections.
- If the target is small in the frame, move closer or change optics.
- Use a region average and compare against a nearby reference area.
When these steps work, the “flat” scene stops being flat for a reason you can explain: less noise from motion, less confusion from scaling, fewer reflection artifacts, and more pixels devoted to the thing you’re trying to measure.
11.2 Reflections, Glare, and Window Effects That Distort Readings
Thermal cameras measure infrared energy coming from the scene. When that energy bounces off shiny surfaces or passes through glass, the camera may record a mix of the target’s emission and other sources. The result is a temperature that looks plausible but is not the temperature you think you measured.
How Reflections Change What the Camera Sees
A reflection happens when a surface is not purely “emitting.” For many real materials, especially metals, glossy paint, and polished plastics, a portion of incoming infrared radiation reflects. If you point the camera at a warm object behind a reflective surface, the camera can “see” the warm object indirectly.
Example: A stainless-steel handrail near a heater. The rail may appear hotter than the surrounding wall because it reflects the heater’s radiation. If you switch to a matte surface nearby (like a painted wall), the temperature difference becomes more realistic.
Practical check: Move your position slightly left and right while keeping focus and distance similar. If the apparent temperature of the reflective area changes noticeably with viewpoint, reflections are likely involved.
Glare from Hot or Bright Sources
Glare is often caused by strong infrared sources in the camera’s field of view, such as sunlit surfaces, hot lamps, or machinery with high contrast. Even if the target is correct, glare can raise the background level and reduce contrast, making edges and hot spots harder to interpret.
Example: Inspecting an electrical panel through a partially open door. A bright, hot component inside the panel can dominate the scene, making nearby connections look uniformly warm. The camera is not “wrong,” but the scene is dominated by one intense source.
Practical check: Reframe so the intense source occupies less of the image. If the suspected hot spot’s temperature drops while the intense source remains in view, you were likely seeing glare influence.
Window Effects When You Must Measure Through Glass
Windows and protective covers can distort thermal measurements in multiple ways: they may reflect infrared, absorb some wavelengths, and sometimes create internal reflections between glass layers. Even “low-emissivity” coatings can strongly affect what passes through.
Example: Measuring a motor’s surface temperature through a clear polycarbonate guard. The camera may show a cooler motor than reality because the guard blocks part of the infrared signal. In other cases, it may show a warmer motor because the guard reflects the environment.
Practical check: Compare two views: one through the window and one with the camera positioned so it can see the target directly (even briefly). If direct view and through-window view disagree consistently, treat the through-window reading as unreliable for absolute temperature.
Mind Map: Reflection, Glare, and Window Distortion Paths
A Simple Decision Workflow
- Is the surface shiny? If yes, assume reflections are possible.
- Does the reading change with viewpoint? If yes, reflections are likely.
- Is there glass or a protective cover? If yes, expect absorption and reflection.
- Is there a strong hot object or bright sun in frame? If yes, glare can dominate contrast.
- Can you reframe or reposition? If yes, use it to isolate the target from interfering sources.
Case Example: Troubleshooting a “Too Hot” Reading
A technician measures a pipe behind a glass inspection window and gets a temperature 15–20°C higher than expected. The pipe surface is matte, but the window is clean and reflective.
- First, they take a photo of the scene and note that a warm wall area occupies a large portion of the window reflection.
- Next, they move a few steps sideways. The pipe’s apparent temperature shifts, while the warm wall reflection shifts in the opposite direction.
- Finally, they reframe so the warm wall reflection is minimized. The pipe temperature drops toward the expected range.
The key insight is that the camera likely recorded a blend of pipe emission and reflected radiation from the warm wall. The reading was not random; it followed the geometry of reflections.
What to Record in Your Notes
When reflections or window effects are involved, document the conditions that control them: whether the target surface is shiny, whether the camera viewpoint changed the apparent temperature, whether the measurement was through glass, and what major hot objects or bright areas were in frame. This turns “the camera looked weird” into a traceable explanation.
11.3 Emissivity Uncertainty and How to Reduce It
Emissivity is the fraction of infrared energy a surface emits compared to an ideal blackbody at the same temperature. Thermal cameras often ask you to enter emissivity so they can convert measured radiation into a temperature. The catch: emissivity is not a single universal number for a material. It changes with surface finish, oxidation, coatings, and even how dusty or wet the surface is. When emissivity is wrong, the camera can still produce a nice-looking image, but the reported temperature can drift in a predictable way.
Why Emissivity Errors Show Up as Temperature Errors
If emissivity is set too high, the camera assumes the surface emits more than it actually does. To match the measured radiation, it will typically report a lower temperature than the true one. If emissivity is set too low, the opposite happens: the camera attributes more of the signal to emission than is appropriate and tends to report a higher temperature. The size of the error depends on how reflective the surface is and how much of the camera’s view is filled by other objects.
A practical way to think about it: emissivity uncertainty matters most when the surface is reflective (low emissivity) and when the camera is “seeing” a warm or cold background through reflections. A matte painted wall is usually forgiving; shiny metal is not.
Mind Map: Emissivity Uncertainty Sources and Fixes
Concrete Examples That Reveal the Pattern
Example: Painted pipe vs. polished steel
- A painted pipe with a dull surface often has emissivity around 0.9. If you enter 0.85 instead of 0.9, the temperature error is usually modest.
- A polished steel bracket might have emissivity closer to 0.2–0.4. If you enter 0.9 by mistake, the camera will treat reflections as emission and the reported temperature can be wildly off.
Example: Same object, different background Imagine a shiny tool resting near a warm machine. The camera sees not only the tool’s own emission but also reflected radiation from the machine. If you change the background temperature (move the tool or change the environment), the “true” emissivity hasn’t changed, but the effective measurement changes. That’s why emissivity and reflected temperature settings are linked in real work.
How to Reduce Emissivity Uncertainty in the Field
1) Prefer emissivity-friendly targets When you need accurate temperature numbers, don’t fight the surface. Apply a small patch of high-emissivity tape or a matte paint dot to the measurement area. This creates a known emissivity region and reduces sensitivity to the original finish. Keep the patch small enough to match your spot/area selection, and measure after the patch reaches thermal equilibrium.
2) Use a two-step verification instead of guessing Pick two points on the same surface that should be at the same temperature (for instance, two spots on a uniformly heated plate). If the camera reports different temperatures, emissivity is likely wrong or the points have different surface conditions. Adjust emissivity until the readings converge. This doesn’t require knowing the “correct” emissivity from a catalog; it uses internal consistency.
3) Control reflections by changing the viewing geometry For reflective surfaces, angle matters. If you can, measure closer to normal incidence (camera roughly perpendicular to the surface). This reduces the amount of reflected background entering the measurement. Also avoid measuring through windows or glossy covers unless you account for their emissivity and reflections.
4) Standardize distance and spot selection Emissivity uncertainty gets worse when your measurement area includes edges, dust, or mixed materials. Use the camera’s spot/area guidance to ensure the region you care about fully fills the measurement area. If the spot includes a cooler edge, the camera will “average” the radiation and your emissivity adjustment will compensate for the wrong cause.
5) Treat emissivity like a setting you validate, not a fact you copy Even if you have a typical emissivity value for a material, validate it with a quick check: compare the camera reading to a contact measurement on a small, representative area. If you can’t use a contact sensor, use the convergence method described above. The goal is not perfect truth; it’s reducing avoidable error.
Quick Checklist for Lower Emissivity Uncertainty
- Is the surface matte or reflective?
- Does the measurement area fully fit the camera’s spot/area?
- Are reflections from warm/cold surroundings likely?
- Can you add a small high-emissivity patch to the exact spot?
- Do repeated points on the same surface agree?
When emissivity is uncertain, the camera can still be useful. The trick is to make the measurement less dependent on unknown surface behavior by using controlled patches, consistent geometry, and internal checks. That turns emissivity from a guessing game into a manageable variable.
11.4 Motion Blur, Wind, and Environmental Variability
Thermal cameras can look sharp while still producing misleading temperature readings. Motion blur and environmental variability mainly affect two things: how consistently the camera samples the scene, and how much the scene’s heat is changing while you measure it.
Motion Blur and Integration Time
Most thermal cameras integrate signal over a short time window. If the scene moves during that window, the camera averages different positions and different temperatures into one frame. The result is a “smeared” thermal pattern and, sometimes, a temperature that lands between the true values.
A practical example: you inspect a rotating motor housing. If you pan with the camera while the motor spins, the hot regions smear into a wider band. The band may look like a larger fault area, even if the underlying heat source stayed the same size.
Best practices that are easy to try:
- Use a steady stance and pause before capturing. Treat the capture like taking a photo with a slow shutter.
- If your camera offers a motion mode or higher frame rate, use it for moving targets.
- Capture multiple short sequences instead of one long sweep. Compare frames to see whether features stay in place.
A quick check: look for edges that “lag” behind the object’s outline. If the thermal boundary trails the physical boundary, motion is likely involved.
Wind Effects on Heat Flow
Wind changes how quickly heat leaves a surface. That matters because thermal imaging measures surface temperature, not the internal cause directly.
Example: you measure a warm pipe near a drafty doorway. Without wind, the pipe surface may hold a stable temperature long enough to measure. With wind, the same pipe cools faster, and the thermal pattern shifts between frames.
Wind can also create alternating hot and cool bands on fins, louvers, or grilles. Those bands are not necessarily multiple heat sources; they can be the same heat source viewed under changing cooling conditions.
Best practices:
- Measure in calmer moments when possible, or note wind direction and strength.
- Avoid aiming directly into airflow. If you must, take a short burst of images and focus on the most repeatable region.
- When comparing “before and after,” keep the airflow conditions as similar as you can.
Environmental Variability That Changes the Scene
Environmental variability includes ambient temperature changes, humidity, sun loading, and surface wetness. Even when the camera is perfectly focused, the scene can be changing faster than your measurement.
Concrete examples:
- Sun on a roof: a patch that looks uniformly warm can develop gradients as clouds pass or as the sun angle changes.
- Wet surfaces: water films can cool a surface quickly and also change how heat spreads across it, producing cooler-than-expected readings.
- Cold drafts: a wall near a vent may show a moving cold edge as air currents shift.
To keep measurements meaningful, treat the environment like part of the setup. Record what you can observe: recent weather changes, whether surfaces are wet, and whether there is airflow.
How to Separate Camera Issues from Scene Changes
Sometimes the camera is fine and the scene is the problem. Use a simple decision approach:
- If the thermal feature moves relative to the physical object, suspect motion blur or camera handling.
- If the feature stays aligned but its intensity changes between frames, suspect wind or environmental variability.
- If both alignment and intensity change, assume multiple factors and reduce variables.
A simple workflow for repeatability:
- Frame the target and hold still.
- Capture 3–5 consecutive frames without changing distance or angle.
- Note whether the shape stays consistent. Then note whether temperatures drift.
- If drift is large, wait for conditions to stabilize or choose a less affected area.
Mind Map: Motion Blur, Wind, and Environmental Variability
Example: Inspecting a Heat Source Near a Vent
You suspect a warm electrical enclosure is overheating. The enclosure sits near a supply vent.
Step-by-step:
- Hold the camera still and capture five frames.
- If the warm region’s outline stays in the same place but its intensity rises and falls, wind from the vent is likely changing surface cooling.
- If the warm region’s outline smears or shifts relative to the enclosure edges, motion blur is likely from camera movement or integration during handling.
- To improve confidence, re-measure after pausing airflow if safe, or aim at a part of the enclosure less exposed to direct airflow.
This approach keeps you from blaming the camera for what is really a changing heat-loss environment.
11.5 When the Camera Is Fine but the Setup Is Not
A thermal camera can be perfectly healthy and still produce misleading temperatures. In practice, most “camera problems” are setup problems: the scene doesn’t match the camera’s assumptions, or the measurement geometry makes the camera’s job harder than it looks.
The Setup Checks That Catch Most Errors
Start with the simplest question: “Is the camera measuring the surface I think it is?” If the answer is uncertain, fix that before touching emissivity or temperature settings.
- Confirm focus and alignment
- Example: You measure a pipe elbow and see a sharp hot line along the edge. If the camera is slightly out of focus, that hot line can be an artifact from contrast spreading across pixels.
- Quick test: Move the camera a few centimeters closer or farther while watching whether the temperature pattern “snaps” into clarity. If it does, focus and distance are part of the problem.
- Verify emissivity assumptions
- Example: A shiny metal bracket looks cooler than the surrounding wall. If you set emissivity too low, the camera will treat reflected energy as if it were coming from the object itself.
- Quick test: Cover half the target with matte tape (or a purpose-made emissivity patch) and compare the two halves. The covered side should report closer to the real surface temperature behavior.
- Control reflections and windows
- Example: Measuring through a glass window shows a “mirror” of the room lights or sky. The camera is not wrong; it is measuring what the glass reflects.
- Quick test: Tilt the camera slightly left and right. If the apparent temperature pattern shifts dramatically with angle, reflections are dominating.
- Check distance and spot size limits
- Example: You measure a small electrical terminal from far away, but the reported temperature matches the nearby cable instead.
- Quick test: Use the camera’s spot/IFOV guidance to ensure the measured area is fully filled by the target. If the target is smaller than the measurement footprint, you’re averaging with neighbors.
- Account for airflow and transient conditions
- Example: A vent blowing across a surface creates alternating hot and cool bands. The camera captures a moment, not a stable average.
- Quick test: Pause airflow if possible, or take multiple frames and compare whether the pattern stabilizes.
A Practical Mind Map for Setup-First Troubleshooting
Mind Map: Setup-First Troubleshooting
Example: Electrical Connection with “Perfect” Camera Settings
You inspect a junction and see a hot spot at the edge of the terminal, not the center. The camera reports a stable temperature over several frames.
- Step 1: Check geometry. The terminal is small, and the camera is at a distance where the measurement footprint includes nearby insulation.
- Step 2: Confirm by reframing closer. If the hot spot moves to the actual center of the terminal as you get closer, the earlier reading was area averaging.
- Step 3: Only then consider emissivity. If the terminal is coated or oxidized, emissivity may still be off, but geometry errors usually explain edge-only hotspots.
Example: Wall Inspection with Angle-Dependent Results
You scan a wall for insulation issues. One section looks warmer, but when you shift your stance, the warm region shrinks and relocates.
- Step 1: Test reflections by changing viewing angle. Angle sensitivity strongly suggests reflected energy is being captured.
- Step 2: Reduce reflection sources. Move away from shiny surroundings, avoid measuring through glass, and keep the camera’s line of sight consistent.
- Step 3: Re-check emissivity after reflections are controlled. If the warm region becomes stable, emissivity can be tuned with less confusion.
Example: “Low Reading” on a Wet Surface
A concrete slab appears cooler than expected. The camera seems to show consistent values.
- Step 1: Consider surface condition. Wet surfaces can have different emissivity than dry ones, and water can create a thin film that changes how energy is emitted.
- Step 2: Use a matte patch test on a small area. If the reading rises or changes in a predictable way on the patched region, emissivity and surface state are the setup issues.
The key idea is simple: treat the camera as a measurement instrument with assumptions. When the setup violates those assumptions—geometry, emissivity, reflections, or transient conditions—the camera will faithfully report the wrong thing. Fix the setup first, then refine settings.
12. Hands-On Learning with Guided Experiments
12.1 Experimenting With Emissivity Using Simple Materials
Emissivity is the “how much you radiate” setting that helps a thermal camera convert infrared energy into a temperature. If you set emissivity wrong, the camera can still produce a nice-looking image while reporting a misleading temperature. The goal of this experiment is simple: learn how emissivity changes the reported temperature using materials you can find at home or in a workshop.
What You Need
- A thermal camera with an emissivity setting (manual or adjustable).
- A stable scene: same camera position, same distance, minimal movement.
- Simple surfaces with different emissivities: matte black tape, bare metal (like aluminum or steel), glossy plastic, and a piece of painted cardboard.
- A way to warm the surfaces consistently: a hair dryer on low, a warm water bath for small items, or a heat source you can keep at a steady distance.
- Optional but helpful: a small piece of white paper and a smartphone timer.
Safety and Setup Rules
Pick one distance and keep it. Thermal measurements are sensitive to geometry, so changing your stance mid-test makes emissivity effects harder to see. Let the camera warm up if it has a startup period. Use the same measurement method each time: either a spot on the center of each surface or a small region of interest.
Step 1: Create a Controlled Comparison
Choose four surfaces and place them on the same background so they share similar ambient conditions. For example:
- Matte black tape on a scrap card
- Bare metal plate
- Painted cardboard
- Glossy plastic lid
Warm all surfaces for the same amount of time. A practical approach is to warm them together, then start your measurements immediately. If you can’t warm them together, warm one, measure, then repeat the same timing for the others.
Step 2: Use a “Same Temperature” Assumption Carefully
You are not trying to prove the camera is perfect. You are testing how emissivity settings affect the camera’s reported temperature. Start by setting emissivity to a common default (often 0.95) and record the reported temperature for each surface.
Then change emissivity for one surface at a time while keeping everything else constant. For instance, keep the matte black tape at emissivity 0.95 and adjust the metal surface emissivity across a few values.
A simple set of emissivity values to try for comparison is 0.2, 0.5, 0.8, and 0.95. Many cameras accept a continuous range; if yours uses presets, use the closest options.
Step 3: Record Results in a Way That Shows the Pattern
Use a small table so you can see trends. Example structure:
- Surface name
- Emissivity setting
- Reported temperature
- Notes about reflections or glare
If the metal surface shows a large temperature swing as emissivity changes, that’s the expected behavior. Matte black tape should change less because it behaves closer to a high-emissivity surface.
Step 4: Interpret What You See
Here’s the reasoning you should apply while looking at your numbers:
- High-emissivity surfaces (matte black tape, paint) make the camera’s temperature less sensitive to emissivity errors.
- Low-emissivity surfaces (bare metal, glossy finishes) reflect more of the surroundings, so the camera’s temperature depends strongly on the emissivity setting and the reflected environment.
- If two surfaces look equally hot in the thermal image but report different temperatures, emissivity and reflections are usually the reason.
Example: A Quick Mini-Test with Four Surfaces
- Warm the surfaces for 30 seconds with the hair dryer from the same angle.
- Measure each surface at the center.
- Set emissivity to 0.95 for all surfaces and note temperatures.
- Now set emissivity to 0.2 for the bare metal and re-measure.
- Compare the metal’s reported temperature before and after.
You should typically see the metal’s reported temperature shift more than the matte tape’s. That difference is your evidence that emissivity is not a cosmetic setting.
Mind Map: Emissivity Experiment Logic
Practical Tips That Make the Results Cleaner
- Avoid measuring near edges; edges often include mixed emissivity and reflections.
- If the metal surface is shiny, try a small patch of matte tape on it and compare. The taped patch should behave more predictably.
- Keep the background stable. Reflections from the environment can change the camera’s interpretation of low-emissivity surfaces.
When you finish, you should be able to look at a surface and predict whether emissivity errors will matter. Matte finishes usually behave like forgiving students; bare metal behaves like the one who grades you based on the room lighting.
12.2 Distance and Spot Size Tests for Understanding Limits
Thermal cameras report temperature for a target area, not for a single point. As distance increases, the camera’s field of view spreads, so the “spot” you think you’re measuring becomes a larger patch that may include multiple materials with different emissivities. Distance and spot size tests help you see where your measurements stop being trustworthy.
What You Are Testing
You are testing two linked behaviors:
- Angular coverage: how much of the scene each pixel (or each measurement region) covers.
- Measurement contamination: how much of that region is filled by the intended target versus background.
A simple way to remember it: if your target is smaller than the camera’s effective measurement area, you are not measuring the target—you are averaging it with whatever surrounds it.
Mind Map: Distance and Spot Size Limits
Test Setup That Produces Clear Results
Use a target with a stable temperature and a background that is clearly different. Two practical options:
- A small metal plate (or a piece of tape on a surface) placed on a cooler surface.
- A heated object (like a warm tool) placed on a cooler bench.
Pick a target size that is noticeably smaller than the camera’s expected measurement area at longer distances. If you don’t know the spot size yet, start with a target that is small enough to plausibly be “too small” at the far end.
Keep these constant during the test:
- Camera position and angle
- Focus mode and focus adjustment
- Emissivity setting
- Distance measurement method (tape measure or marked rail)
- Measurement region size (spot vs area)
If your camera offers a spot size diagram or a distance-to-spot chart, use it to choose distances—but still run the test, because real scenes include edges, reflections, and focus limits.
Procedure: The Three-Distance Method
- Choose three distances: short, medium, long. For example: 0.5 m, 1.0 m, 2.0 m.
- Center the target in the measurement region at each distance.
- Record the reported temperature and a quick visual note about how much of the region is filled by the target.
- Repeat at the same distances with the target shifted so only part of the region is filled.
The centered case shows how well the camera isolates the target. The shifted case shows how quickly background starts to influence the reading.
Example: Small Target on a Cooler Background
Imagine a 10 mm diameter target on a surface that is 10°C cooler than the target. At short distance, the camera’s measurement region might fit mostly on the target, so the reported temperature might be close to the target temperature. At longer distance, the region grows and begins to include the cooler surroundings.
What you’ll likely see:
- Centered: reported temperature gradually moves toward the background as distance increases.
- Shifted: reported temperature changes more sharply because the region includes more background.
A useful observation is the point where the reading stops behaving like “target temperature” and starts behaving like “average of target and background.” That distance is your practical limit for that target size and framing.
Example: Edge Behavior and Focus
If the target is near the edge of the measurement region, focus matters. A slightly out-of-focus image softens edges, which increases mixing. Repeat the same distance test with focus locked and then with focus adjusted. If the temperature readings change noticeably when focus changes, treat that as a warning: your measurement is sensitive to edge blur, so you need more margin around the target.
Practical Rules You Can Use Immediately
- Fill the measurement region: keep the target larger than the effective spot/area by a visible margin.
- Use framing margins: if the target nearly touches the region boundary, assume background influence.
- Record distance and framing: two inspections at the same temperature can differ if the target-to-region fit differs.
Quick Checklist for Your Notes
- Target size and material
- Background temperature difference (even approximate)
- Distances tested
- Emissivity setting used
- Focus state
- Centered vs shifted results
- The distance where readings start drifting toward the background
12.3 Measuring Reflected Temperature with Controlled Surfaces
Thermal cameras often report a “temperature” that depends on both emitted energy from the target and energy reflected from the surroundings. When the target is shiny or has low emissivity, reflected energy can noticeably skew the reading. The goal of this section is to measure and control that reflected component using simple, repeatable surfaces.
Why Reflections Matter in Practice
Imagine aiming at a polished metal plate. The camera sees the plate’s own emission, but it also “sees” the room’s warmer or cooler objects bouncing off the surface. If you change the room temperature or move a warm wall reflection, the reported temperature can change even if the metal plate stays the same.
A useful mental model is: the camera’s temperature estimate is a mix of emitted and reflected contributions. You can’t remove reflections entirely, but you can measure them by controlling what the surface reflects.
Controlled Surface Setup
Use a target surface whose emissivity you can treat as stable for the short test. Two practical options are:
- Matte reference patch: a piece of matte black tape or matte paint on a flat surface. It reflects little, so it behaves closer to “emission-dominant.”
- Reflective test patch: a clean metal plate or glossy painted surface. It reflects more, so it behaves closer to “reflection-dominant.”
Place both patches in the same scene, at the same distance and angle from the camera. Keep the camera settings fixed: same palette, same emissivity setting mode, same distance/spot assumptions, and same focus.
Now control the surroundings that the reflective patch can “see.” You can do this by using a reflective background panel behind the target (for example, a flat board with a known temperature surface) and by keeping the rest of the room unchanged.
Mind Map: Reflection Measurement Workflow
Step-by-Step Example with Two Background Temperatures
Scenario: You want to estimate the reflected temperature affecting a shiny metal patch.
- Choose a reflective patch: a small polished metal area. Adjacent to it, place a matte black tape patch on the same plane.
- Set the camera: keep focus and distance constant. If the camera allows emissivity entry, set emissivity to the reflective patch’s approximate value (even if imperfect, keep it consistent for the test).
- Establish a baseline background: place a flat board behind the patches. Let it reach a stable temperature (for example, a board warmed by a lamp or cooled by contact with a cold surface). Record the board temperature using a contact thermometer.
- Capture readings: take one thermal image and read the temperature for both patches. The matte patch should stay relatively stable across background changes; the metal patch should shift.
- Change only the background: replace the board with another at a different stable temperature. Repeat the capture.
- Compare shifts: compute the difference in the metal patch reading between the two background conditions. The direction of the change tells you whether the camera is being pulled toward the warmer or cooler reflected scene.
Concrete reasoning: If the metal patch reading increases when the background board warms, the camera is incorporating reflected energy from that board. The magnitude of the change depends on how reflective the surface is and how much of the board is visible in the camera’s line of sight.
Turning Measurements into a Reflected Temperature Estimate
A practical approach is to treat the reflected component as coming from the “dominant visible background” and estimate its effective temperature from the background you controlled.
- If the reflective patch mostly “sees” the board, then the reflected temperature is close to the board temperature.
- If it also sees other objects (walls, floor, your hands), the effective reflected temperature becomes a weighted average.
To reduce weighting ambiguity, use a simple background panel that fills most of the reflective patch’s field of view. For a small patch, move the panel closer so it occupies more of what the surface reflects.
Example: Checking Whether Your Setup Is Actually Controlled
If you want to verify that the reflected component is truly dominated by your panel:
- Keep the panel temperature constant.
- Move your hand or a warm object slightly near the panel edge.
- If the metal patch reading changes noticeably, your reflective patch is picking up that extra reflection.
Then fix the setup by repositioning the panel so it blocks the unwanted reflections, or by keeping the scene static during captures.
Common Pitfalls and How to Avoid Them
- Changing camera settings between shots: emissivity and measurement mode can alter how the camera blends reflected and emitted energy.
- Angle differences: reflections are directional. Even small camera repositioning can change what the surface reflects.
- Unstable background temperature: if the board temperature is still drifting, the metal patch reading will drift too, and you’ll mistake drift for reflection sensitivity.
Quick Checklist for Controlled Reflected Temperature Tests
- Fix camera position, focus, and settings.
- Use a matte patch on the same plane to confirm stability.
- Use a large, simple background panel that fills the reflective view.
- Change only one variable at a time: background temperature.
- Capture and compare readings immediately after stabilization.
When you do this carefully, you can treat reflected temperature as a measurable input rather than an annoying unknown. The camera still estimates temperature from physics and assumptions, but your controlled scene makes those assumptions testable.
12.4 Building a Repeatable Inspection Routine from Start to Finish
A repeatable routine is mostly about controlling variables. Thermal cameras are sensitive to setup details, so the goal is not “perfect conditions,” but consistent conditions that let you compare results.
1) Pre-Inspection Setup That You Can Repeat
Start by recording the basics before you aim the camera. Write down the camera model, lens, and any measurement mode you plan to use (spot, area, or full-frame). Then note the scene constraints: distance to the target, whether the target is behind glass, and whether the surface is likely reflective.
Next, set emissivity intentionally. If you do not know the emissivity, choose a reasonable default only after you decide how you will verify it. A simple approach is to carry a small set of reference materials (for example, matte tape or a known coating) and use them to confirm your measurement workflow.
Finally, stabilize the camera. Let it sit for a minute or two so internal temperature settles, and avoid touching the lens. If you are moving between rooms, keep the camera in a consistent orientation and avoid sudden drafts across the lens.
2) Scene Preparation and Measurement Planning
Before taking images, decide what you will measure and why. If you are checking an electrical panel, you care about relative hot spots and their growth over time. If you are checking insulation, you care about temperature gradients and edge behavior.
Plan your measurement points. Use a simple rule: pick one reference region that should be stable (ambient-like surface) and one region that is the suspected issue. Then choose a third region to catch “it depends” cases, such as a nearby surface with different material or finish.
If the target is small, confirm that it fills enough pixels. If it is large, confirm that your regions of interest do not mix multiple materials with different emissivity.
3) Capture Workflow That Minimizes Confusion
Use a consistent capture sequence every time:
- Take a wide shot to establish context.
- Take a focused shot at the planned distance.
- Take a measurement shot with the same palette and same measurement settings.
- Repeat after a short interval if the process is time-dependent (for example, after the system has been running long enough to reach a steady state).
Keep your camera settings stable. Changing palette or measurement mode can make images look different even when the underlying data is similar. If you must change settings, do it once, then document the change.
When you capture, include at least one image where the suspected area is not centered. This helps later when you need to understand what else was in the frame.
4) Emissivity Handling with Simple Verification
Emissivity is the most common reason two inspections disagree. Treat it like a controlled variable.
If you can access the surface, apply a small matte reference patch to a representative spot. Measure the patch and compare it to the surrounding area. If the patch reading aligns with your expectation for the surface temperature, you have a practical emissivity anchor.
If you cannot apply a patch, use a conservative emissivity and rely on relative comparisons rather than absolute temperature claims. For example, you can still track whether a component is getting hotter relative to a nearby stable region.
5) Quality Checks During the Walkthrough
Before leaving the area, verify three things:
- Focus is sharp on the measurement region.
- The region of interest does not include mixed materials.
- Reflections are not dominating the reading.
A quick reflection check is to slightly change your viewing angle and see whether the “hot” region shifts in a way that suggests glare rather than heat flow. If it shifts, you need a different angle, a different surface treatment, or a different measurement approach.
6) Documentation That Makes Results Comparable
Record the following every time:
- Distance to target and approximate framing.
- Emissivity setting used.
- Reflected temperature setting if your camera uses it.
- Ambient conditions that matter for your site (for example, whether doors are open, whether airflow is strong).
- The exact regions of interest used for spot or area measurements.
Write findings in a consistent structure: what you saw, where you saw it, how you measured it, and what you compared it against. Avoid turning images into guesses. If you cannot explain the pattern with your measurement setup, say so and adjust the setup.
7) Mind Map for the Routine
Mind Map: Repeatable Thermal Inspection Routine
8) Example Routine for an Electrical Panel
You arrive with the camera already warmed up. You set emissivity based on the panel finish and plan two regions: one on the suspected connector and one on a nearby metal surface that should behave similarly.
You capture a wide shot to show the panel layout, then move to your planned distance and capture a focused shot. You keep the same palette and measurement mode for all images in this panel. If the connector area looks unusually reflective, you shift your viewing angle slightly and confirm the hot region stays in the same physical location.
Before leaving, you document emissivity, distance, and the exact ROI boundaries. Your findings state whether the connector is hotter than the reference region and whether the pattern matches what you would expect from heat concentration at a connection.
9) Example Routine for a Building Wall Check
You choose a reference region on the same wall material and a suspected region near a seam or penetration. You capture a wide shot, then a focused shot at a consistent distance.
If the wall finish is mixed or glossy, you apply a small matte reference patch to a representative area and use it to anchor your emissivity choice. You then capture the measurement shot with the same settings.
Your documentation emphasizes temperature gradients and edge behavior rather than a single absolute number. You compare the suspected region to the reference region using the same ROI shape and size so the comparison is fair.
12.5 Interpreting Results From Multiple Scenarios Without Guesswork
When you test thermal setups across different scenes, the temptation is to “read the picture” and then rationalize the outcome. A better approach is to treat each scenario as a controlled experiment: keep the measurement rules consistent, record the conditions that change, and use a decision path that tells you what to trust.
Mind Map: Scenario Interpretation Workflow
A Practical Decision Path
Use this sequence every time you compare scenarios.
-
Confirm the camera is behaving the same way. If emissivity, focus, or measurement range changed between scenarios, you can’t compare absolute temperatures directly. You can still compare patterns, but you must label the comparison as “pattern-based.”
-
Check whether the image is stable. Look at at least a short burst of frames. If the hot region shifts shape while the scene is otherwise steady, motion or integration effects are likely. In that case, rely on the most repeatable region, not the most dramatic frame.
-
Test whether edges act like edges. Thermal images often show strong gradients at boundaries. If a boundary looks smeared or haloed, it may be emissivity mismatch, focus error, or reflections. A real thermal boundary tends to stay aligned with the physical edge across frames.
-
Separate “temperature” from “contrast.” Two scenarios can have the same contrast pattern but different absolute temperatures due to emissivity or reflected temperature. If your goal is “which area is hotter,” contrast can be more reliable than the numeric value.
Example: Same Object, Different Surfaces
Scenario A: You measure a painted metal plate with emissivity set to 0.95. The plate shows a smooth gradient from left to right.
Scenario B: You measure the same plate after wiping it with a cloth that leaves a slightly glossy film. You keep emissivity at 0.95.
What to look for:
- If the numeric temperature jumps but the gradient shape stays similar, the change is likely emissivity or reflections, not a real change in heating.
- If the hot region becomes patchy or “moves” with viewing angle, reflected temperature is probably contributing.
A no-guesswork response:
- Re-measure with emissivity adjusted to match the new surface finish, or place a small reference patch (same material) and compare relative readings.
- If you can’t confidently set emissivity, report the result as relative: “Area 1 is hotter than Area 2 by X contrast units,” rather than “Area 1 is Y °C.”
Example: Different Distances, Same Target
Scenario A: Camera at 1 meter, target fills a large portion of the frame.
Scenario B: Camera at 5 meters, target occupies a small portion.
What to look for:
- If the target temperature appears to drift toward the background, spot size and minimum measurable area are likely reducing measurement fidelity.
- If the edges blur and the center value becomes less distinct, you’re seeing averaging over a larger effective area.
A no-guesswork response:
- Compare the target’s relative contrast to a nearby reference region in both scenarios.
- If the contrast collapses at distance, treat the absolute number as low confidence and document the distance and target size.
Example: Indoor Air Movement vs Real Heating
Scenario A: A warm object is measured in still air.
Scenario B: The same object is measured near a vent or with a fan running.
What to look for:
- Real heating changes the thermal pattern in a way that persists across frames.
- Air movement often changes the pattern quickly, producing shifting boundaries or alternating hot/cool regions.
A no-guesswork response:
- Use a short frame sequence and identify which features remain stable.
- If the pattern changes faster than your ability to capture consistent frames, you can’t conclude “the object cooled” or “the object warmed.” You can only conclude “the apparent surface temperature distribution is sensitive to airflow.”
Mind Map: Confidence Scoring
A Simple Reporting Template
When you finish comparing scenarios, write three lines:
- What changed: distance, surface finish, airflow, or camera settings.
- What stayed consistent: edge alignment, stable hot region, or contrast ranking.
- What you can claim: relative comparison, approximate absolute value, or “cannot be concluded” due to a specific measurement limitation.
This keeps your interpretation tied to observable behavior instead of wishful thinking. It also makes your results easier to reproduce, which is the least glamorous but most useful kind of quality control.