Iron-Air Battery Storage
1. Fundamentals of Iron-Air Battery Chemistry and Cell Operation
1.1 Core Electrochemical Reactions in Iron-Air Cells
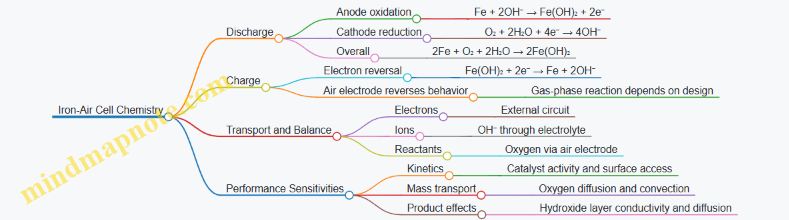
Iron-air cells store energy by converting between chemical energy in iron and electrical energy through electrochemical reactions at two electrodes: an iron electrode (anode during discharge) and an air electrode (cathode during discharge). The “air” side is not just oxygen; it is a controlled electrochemical interface where oxygen, electrons, and ions meet in the right proportions.
Discharge Reaction Pathway
During discharge, the iron electrode releases electrons through oxidation. In a typical alkaline iron-air design, the overall discharge can be represented as:
- Anode (iron oxidation):
- Fe + 2OH⁻ → Fe(OH)₂ + 2e⁻
- Cathode (oxygen reduction):
- O₂ + 2H₂O + 4e⁻ → 4OH⁻
- Overall reaction (combined):
- 2Fe + O₂ + 2H₂O → 2Fe(OH)₂
A practical note: the exact iron hydroxide product and its form depend on local conditions like current density, electrolyte concentration, and temperature. That’s why cell performance is sensitive to operating conditions even when the “headline” chemistry looks simple.
Charge Reaction Pathway
Charging reverses the direction of electron flow. The cell forces electrons back into the iron electrode, reducing iron hydroxide toward metallic iron while oxygen is driven to the air side where it is consumed or evolved depending on the operating regime.
- Anode during charge (iron reduction):
- Fe(OH)₂ + 2e⁻ → Fe + 2OH⁻
- Cathode during charge (oxygen side):
- The air electrode reaction reverses in a way that depends on gas handling and catalyst behavior.
In system terms, this means the air side must support both discharge oxygen reduction and charge-side oxygen evolution or related gas-phase behavior without flooding, drying out, or accumulating unwanted species.
Where Ions and Electrons Actually Go
Electrons travel through the external circuit, but ions travel through the electrolyte. The electrolyte’s job is to carry hydroxide (OH⁻ in alkaline systems) between electrodes so charge balance is maintained.
A useful mental model is a “three-way handshake” at each electrode:
- Electrons arrive via the metal current collector.
- Ions arrive through the electrolyte.
- Reactant arrives from the gas or solid phase.
If any party arrives late—say, oxygen transport is slow or ion concentration near the electrode drops—voltage increases during discharge (more losses) and charging becomes harder.
Key Loss Mechanisms Tied to Reaction Steps
Even when the chemistry is correct, real cells lose efficiency due to reaction kinetics and transport limits.
- Kinetic limitations: The cathode needs a catalyst surface where oxygen reduction can proceed at reasonable rates. If the catalyst is underperforming or blocked, the cell voltage shifts.
- Mass transport limitations: Oxygen must diffuse and convect through the air electrode structure. At higher current, oxygen utilization can become incomplete, leaving unreacted oxygen and raising polarization.
- Product layer effects: Iron hydroxide can form a layer that changes local conductivity and diffusion paths. This affects how easily ions reach the reaction front.
Example: Current Density and Oxygen Supply
Suppose you run a cell at a higher current density than its oxygen supply can support. The cathode reaction still “wants” to reduce oxygen, but oxygen availability near the catalyst drops. The cell responds by increasing cathode overpotential, so the measured discharge voltage falls. If you then increase air flow or improve gas distribution, oxygen concentration at the catalyst recovers and voltage improves—because the reaction steps are no longer starved.
Mind Map: Core Reaction Logic
Practical Takeaway
The core reactions are straightforward on paper, but the cell’s voltage is governed by how efficiently each reaction step is supplied: electrons through conductors, ions through electrolyte, and oxygen through the air electrode. When those supplies are aligned with the applied current, the cell behaves predictably; when they are not, losses show up immediately as polarization.
1.2 Discharge Pathways and Charge Transfer Mechanisms
Iron-air cells convert chemical changes into electrical current through a chain of events: electrons move through an external circuit, ions move through the electrolyte, and oxygen participates at the air electrode. In practice, “discharge pathway” means which chemical species are created and consumed, where they travel, and what physical interfaces control the rate.
Discharge Pathways from Iron Oxidation to Oxygen Reduction
At the iron electrode during discharge, iron is oxidized. A simplified view is that solid iron turns into iron-containing ions in the electrolyte, releasing electrons to the external circuit. Those electrons return to the air electrode, where oxygen is reduced. The overall cell reaction is the sum of these half-reactions, but the real story is in the interfaces.
A useful mental model is to track three regions:
- Iron electrode surface: where iron oxidation creates ionic species.
- Electrolyte bulk: where ions migrate and concentration gradients form.
- Air electrode surface: where oxygen reduction consumes oxygen and produces reaction products.
If any region becomes slow, the cell voltage drops. For example, if oxygen access is limited, the air electrode cannot sustain the required reduction rate, so the cell “runs out of oxygen” locally even if the tank is full.
Charge Transfer at Interfaces and the Role of Overpotential
Electron flow is easy to describe, but charge transfer at the electrode surfaces is where losses live. Two mechanisms matter most:
- Charge-transfer kinetics: how quickly electrons can be transferred across the electrode/electrolyte boundary.
- Mass transport: how quickly reactants and products can reach or leave the active sites.
The voltage you measure during discharge is lower than the ideal equilibrium voltage because the cell needs extra driving force, called overpotential, to push reactions at finite rates. Overpotential is not one single thing; it is the sum of contributions from kinetics and transport.
A practical example: imagine increasing discharge current. The iron oxidation rate rises, so ionic species concentration near the iron surface changes faster than the electrolyte can homogenize. Meanwhile, oxygen reduction must also accelerate, requiring more oxygen flux through the air electrode. The cell voltage typically falls because both kinetics and transport are being pushed beyond comfortable limits.
Ion Transport Pathways Through the Electrolyte
Ions created at the iron electrode must migrate to the air side to maintain charge balance. The electrolyte provides ionic conductivity, but it also introduces limitations:
- Ohmic resistance: the electrolyte resists ionic current, causing a voltage drop proportional to current.
- Concentration polarization: reactant depletion and product buildup near electrodes create local concentration differences.
A concrete way to see this is to consider a “thick” electrolyte layer versus a “thin” one. A thicker path increases ohmic drop and slows ion redistribution, which increases polarization. Designers therefore aim for electrolyte configurations that keep ionic path lengths short while still allowing stable operation and manageable water balance.
Oxygen Participation at the Air Electrode
Oxygen reduction requires oxygen to reach catalytic sites and to be converted into the appropriate reaction products. The air electrode is not just a catalyst; it is a structure that manages gas transport, liquid contact, and electrical pathways.
During discharge, oxygen consumption creates a gradient in oxygen partial pressure across the air electrode. If the gas transport path is too restrictive, oxygen concentration near the active sites falls, and the reaction rate can no longer match the demanded current. The result is a steeper voltage decline at higher currents.
A simple example: if airflow is reduced, oxygen delivery slows. The cell may still discharge at low current, but at higher current the air electrode becomes the bottleneck. You can often diagnose this by observing that voltage sag correlates strongly with current and with indicators of air-side limitation.
Coupling Between Iron and Air-Sides
Even though iron oxidation and oxygen reduction are separate half-reactions, the cell behaves like a coupled system. The iron side sets the rate at which electrons and ionic species are produced; the air side sets the rate at which oxygen can be consumed and reaction products can be formed. The electrolyte links them through ion transport.
When the demanded current exceeds what either side can support, the imbalance shows up as increased overpotential. In a well-designed system, the limiting step shifts gradually with operating point rather than abruptly, which helps maintain predictable performance.
Mind Map: Discharge Pathways and Charge Transfer Mechanisms
Example: Tracing a Discharge Bottleneck
Suppose a cell is discharged at two current levels, I1 and I2, with I2 > I1. At I1, the voltage drop is moderate and stable. At I2, the voltage falls more than expected.
A systematic check is to ask which pathway is most stressed:
- If voltage sag increases sharply with current, kinetic or transport limits are likely.
- If changing airflow reduces the sag, the air electrode is probably limiting oxygen access.
- If sag persists even with improved airflow, the limitation may be on the iron side or in the electrolyte, such as increased polarization from ion redistribution limits.
This approach keeps the analysis grounded: you are not guessing chemistry, you are matching observed voltage behavior to the pathway that cannot keep up with the required charge transfer.
Diagram: Discharge Charge Transfer Flow
    flowchart TD
  A[Iron Electrode Surface] -->|Iron oxidation| B[Iron ions in Electrolyte]
  B -->|Ion migration| C[Electrolyte Bulk]
  C -->|Ion participation| D[Air Electrode Surface]
  E[External Circuit] -->|Electrons return| D
  D -->|Oxygen reduction consumes O2| F[Reaction Products]
  F -->|Remain in electrolyte| C
  A -->|Electrons to circuit| E
1.3 Role of Electrolyte Composition and Water Management
Iron-air cells live or die by what’s in the electrolyte and how water moves through the system. The electrolyte is not just a “conductor”; it sets reaction pathways, controls ionic strength, buffers pH, and determines how quickly corrosion products accumulate. Water management then decides whether the cell stays in a workable operating window or drifts into poor conductivity, flooding, or dry-out.
Electrolyte Composition Fundamentals
Start with the job description. During discharge, iron is oxidized and oxygen is reduced at the air electrode. Both processes rely on ions moving through the electrolyte and on maintaining suitable chemical conditions near each electrode surface.
A practical electrolyte choice typically balances five constraints:
-
Ionic conductivity: Higher ionic strength reduces ohmic losses. Example: if conductivity drops by 30%, the same current produces more voltage loss, which looks like “lower capacity” even if the iron is still available.
-
pH stability: The air electrode reaction is sensitive to pH and carbonate formation. Example: if CO₂ dissolves and forms carbonate, the effective chemistry shifts and performance can sag over days rather than minutes.
-
Solubility and precipitation behavior: Corrosion products and side products can precipitate, blocking pores and increasing resistance. Example: a small change in concentration can push a salt from “mostly dissolved” to “mostly stuck,” turning a smooth voltage curve into a jagged one.
-
Material compatibility: Pumps, seals, current collectors, and housings must tolerate the electrolyte without rapid degradation.
-
Water activity control: Electrolyte composition affects how strongly water is held, which matters for evaporation and for maintaining consistent hydration at membranes or separators.
Water Management as a System, Not a Tank
Water management covers three coupled flows: water consumed or produced by electrochemistry, water transported by diffusion and convection, and water lost to evaporation or venting.
A useful way to think about it is to track water balance at the cell stack level:
- If water is too low: ionic pathways thin, local resistance rises, and the air electrode can become less effective because the electrolyte film near the catalyst dries.
- If water is too high: the air side can flood or the electrolyte can migrate where it shouldn’t, increasing mass-transport limits and reducing oxygen utilization.
A simple operational example: suppose you run a steady discharge for 8 hours at a fixed current. If the electrolyte concentration increases steadily, you likely have net water loss or insufficient replenishment. If instead concentration decreases, you may be adding water too aggressively or experiencing dilution from leaks or condensation.
Concentration Control and Its Practical Levers
Most systems manage concentration indirectly by controlling water addition and by limiting uncontrolled losses.
Common levers include:
- Make-up water dosing: Add water based on measured conductivity, density, or concentration proxies. Example: calibrate conductivity to concentration once, then use it to decide dosing intervals.
- Temperature management: Conductivity and solubility depend on temperature. Example: if you dose at a higher temperature than you operate, you can overshoot concentration when the stack cools.
- CO₂ and impurity control: Carbonate formation changes both chemistry and water balance. Example: keep electrolyte handling closed and minimize headspace exposure during maintenance.
- Membrane or separator hydration: If the design uses a separator that relies on hydration, water gradients across it can dominate performance.
Local Effects Near Electrodes
Even if the bulk electrolyte looks fine, local conditions can differ. Near the iron electrode, reaction products and hydroxide concentration gradients can form. Near the air electrode, oxygen availability and electrolyte film thickness interact.
This is why “bulk concentration” alone is not enough. A cell can show acceptable average conductivity while still suffering from poor wetting at the air electrode. The fix is usually not a chemistry change first; it’s improving water distribution and air-side humidity control so the catalyst stays properly wetted.
Mind Map: Electrolyte Composition and Water Management
Example Workflow for Stable Operation
- Measure baseline: Record stack temperature, electrolyte conductivity (or density), and air-side humidity/pressure conditions.
- Run a controlled discharge: Hold current constant and log voltage and electrolyte proxy values.
- Interpret trends:
- Conductivity rising steadily suggests net water loss.
- Conductivity falling suggests dilution or unintended water ingress.
- Adjust one lever at a time: Dose make-up water in small increments, then repeat the discharge window.
- Validate with voltage shape: A healthy cell maintains a smoother voltage curve; a struggling cell often shows early voltage sag or increasing internal resistance.
When electrolyte composition and water management are treated as a coupled control problem, the cell stops behaving like a chemistry experiment and starts behaving like an energy system: predictable, measurable, and serviceable.
1.4 Cell Components and Their Functional Interfaces
An iron-air cell is a stack of parts that must agree on three things: where electrons travel, where ions travel, and where oxygen gets used. When those “routes” line up, the cell behaves predictably; when they don’t, you get symptoms like uneven utilization, rising internal resistance, or electrolyte loss.
Core Components and Their Jobs
Iron Anode (Active Material Side) The anode holds the iron in a form that can participate in the electrochemical reaction. Its job is to provide a large, accessible surface while maintaining mechanical stability. In practice, the anode is often a porous structure or a packed electrode so that electrolyte can wet the reaction sites.
Air Cathode (Oxygen Reaction Side) The air cathode supplies a pathway for oxygen to reach catalytic sites and for electrons to reach the current collector. It must balance gas transport and liquid contact: too dry and oxygen can’t dissolve or reach the catalyst; too wet and pores flood, blocking gas flow.
Electrolyte (Ion Conduction Medium) The electrolyte carries ions between anode and cathode. Its composition and concentration determine conductivity and reaction kinetics, while its water content strongly affects both performance and longevity. Think of the electrolyte as the “shared lane” that ions use, not the place where electrons go.
Separator or Membrane (Ions Allowed, Mixing Reduced) A separator prevents direct shorting and reduces unwanted mixing of reactants and products. It also helps manage where electrolyte sits, which matters for maintaining consistent cathode wetting. The best separator is the one that blocks electrons effectively while adding minimal resistance to ion flow.
Current Collectors and Bipolar Interfaces Current collectors collect electrons from the active electrodes and distribute them to external wiring or neighboring cells. Their interface quality matters: small contact resistance at many points can become a large loss at system scale. Surfaces must be designed for stable contact under compression and thermal cycling.
Gaskets, Seals, and Flow Hardware Seals prevent electrolyte leakage and air bypass. Flow hardware—manifolds, channels, and distribution plates—ensures oxygen reaches the cathode uniformly and electrolyte is contained where it belongs. Even when electrochemistry is perfect, poor sealing turns into performance drift because the cell’s internal “map” changes over time.
Functional Interfaces That Make or Break Performance
Anode–Electrolyte Interface This interface controls wetting and ionic access. A practical best practice is to ensure the anode is fully wetted during commissioning and to avoid trapped air pockets. Example: if the anode is porous and you fill the electrolyte slowly, bubbles can cling to pores; the cell then shows lower capacity until the bubbles clear.
Cathode–Electrolyte–Gas Triple Interface The cathode needs a three-way contact region where oxygen, electrons, and ions meet. If the cathode is too flooded, oxygen transport becomes the bottleneck; if it’s too dry, ionic pathways break down. Example: during operation at higher current, cathode drying can occur faster than at low current, so the cell voltage rises even though the anode still has unused iron.
Separator–Electrode Interfaces The separator must maintain intimate contact without creating channels for bypass. Example: if the separator wrinkles or shifts during assembly, you may see localized current paths that increase degradation and reduce effective utilization.
Current Collector–Electrode Contact Contact resistance depends on pressure, surface roughness, and corrosion products. A simple diagnostic is to compare voltage drop across modules at the same current; a module with higher drop often has a contact issue rather than an electrochemical issue.
Air Path Interfaces Air distribution plates and seals must prevent leaks that bypass the cathode. Example: a small leak can reduce oxygen utilization and increase fan power without improving capacity, because oxygen is leaving the system without doing work.
Mind Map: Cell Components and Interfaces
Putting It Together with a Simple Assembly Logic
A useful way to reason about the stack is to trace three “flows” simultaneously: ions through electrolyte and separator, electrons through current collectors and interconnects, and oxygen through the air path to the cathode pores. When you assemble, you’re not just stacking parts—you’re aligning these flows so they overlap in the right regions.
Example: if you notice strong voltage rise at high discharge rates, check whether oxygen access is limited (air path and cathode wetting), whether ionic resistance increased (separator contact or electrolyte condition), or whether electrical contact worsened (interconnect pressure or corrosion). The component map above tells you where to look first, without guessing.
1.5 Performance Metrics for Storage Systems and Cells
Performance metrics connect what happens inside an iron-air cell to what operators see at the grid meter. A good metric set answers three questions: How much energy is available? How fast can it be delivered or absorbed? How reliably does it keep doing that over time?
Energy Capacity Metrics
Nameplate capacity is the theoretical energy based on active materials and design stoichiometry. Usable capacity is what you actually get under defined operating limits, such as maximum current, minimum allowable voltage, and electrolyte concentration bounds.
A practical example: if a cell stack is rated for 10 kWh at a discharge current that keeps the air electrode from starving, you might still see only 8.5 kWh when you run at a higher current because oxygen access becomes the bottleneck. That’s why capacity must always be tied to a test profile.
Key metrics:
- Specific energy: Wh per kg of cell materials (useful for comparing designs).
- System energy: kWh at the inverter output, including balance-of-plant losses.
- Depth of discharge window: the allowed state-of-charge range that avoids unacceptable voltage or concentration excursions.
Power and Rate Metrics
Power capability depends on current limits and voltage behavior. For iron-air, voltage drops with increasing current due to kinetic limits, ohmic resistance, and mass transport constraints.
Use power rating at a voltage threshold rather than current alone. Example: a stack might tolerate 200 A, but if the voltage falls below the inverter’s minimum operating point, the delivered power is lower than expected.
Key metrics:
- C-rate: normalized current relative to capacity (e.g., 0.1C for long discharge).
- Voltage-current curve: shows how much voltage you lose as you push power.
- Efficiency vs. load: efficiency is not constant; it changes with operating point.
Efficiency Metrics
Efficiency should be separated into pieces so you can find the cause of losses.
- Round-trip efficiency (RTE): energy out divided by energy in over a full cycle.
- Coulombic efficiency: fraction of charge recovered during charge compared to discharge; it reflects side reactions and losses of active species.
- Energy efficiency: accounts for voltage differences between charge and discharge.
Concrete example: if coulombic efficiency is high but energy efficiency is low, the issue is likely voltage losses (resistive or kinetic). If energy efficiency is high but coulombic efficiency is low, you’re losing charge without a large voltage penalty—often a sign of parasitic consumption.
Cell and Stack Performance Metrics
Cell-level metrics help you diagnose where the system is losing performance.
- Open-circuit voltage (OCV) and its drift: indicates changes in electrolyte state and electrode conditions.
- Overpotential components: separating ohmic drop from activation and mass-transport losses clarifies whether to improve conductivity, catalysts, or gas access.
- Internal resistance trend: rising resistance usually shows up as steeper voltage sag at the same current.
A simple diagnostic workflow: run a short discharge pulse at several currents, record voltage response, and compare the slope over time. If the slope increases while OCV stays similar, resistance or transport is degrading rather than the bulk state.
System-Level Metrics
System metrics include the parts that don’t live inside the electrochemistry.
- Inverter efficiency and clipping: if the inverter limits output, the grid sees less power than the stack can provide.
- Auxiliary load: pumps, blowers, and controls consume energy; report efficiency with and without auxiliary power so comparisons are fair.
- Thermal stability: temperature affects kinetics and viscosity; track temperature bands and correlate them with voltage and efficiency.
Example: two systems with identical cell performance can differ in RTE because one design runs pumps harder to maintain air distribution.
Degradation Metrics
Degradation is measured by how capacity and efficiency change with cycles or time.
- Capacity retention: percentage of initial usable capacity after N cycles or M hours.
- Voltage fade: increasing voltage loss at a fixed current, often tied to resistance growth or electrode changes.
- Efficiency fade: increasing losses even if capacity seems stable.
- Failure modes with signatures: for instance, air-side starvation often shows up as earlier voltage collapse at high current.
Measurement Practices That Keep Metrics Honest
Metrics only mean something when the test conditions are controlled and documented.
- Define the operating window: current, temperature, pressure, and electrolyte limits.
- Use consistent rest periods: OCV and concentration recovery depend on how long you wait.
- Report auxiliary power explicitly: otherwise RTE comparisons can be misleading.
- Separate cycle types: shallow cycling and deep cycling stress different mechanisms.
Example: if you compare two stacks after one is cycled daily between 20% and 40% state-of-charge and the other between 80% and 100%, you might see different degradation rates even if the chemistry is identical. The metric set must match the duty cycle.
A Metric Set You Can Use Immediately
For a cell or stack acceptance test, a coherent minimum set is:
- Usable capacity at a defined discharge profile.
- Power capability at a defined voltage threshold.
- Coulombic and energy efficiency for at least one full cycle.
- Capacity retention over a defined number of cycles.
- Voltage-current curve snapshots to track resistance or transport changes.
This set moves from “how much” to “how fast,” then to “how efficiently,” and finally to “how long,” which is exactly the order operators need when deciding whether a system is ready for real grid service.
2. System Architecture for Long-Duration Energy Storage
2.1 Power Conversion Chain from Battery Output to Grid Interface
An iron-air battery stack produces direct current (DC) at a voltage that depends on state of charge, temperature, and current draw. The grid, in contrast, expects alternating current (AC) with tightly controlled voltage and frequency. The power conversion chain is the set of stages that turns “stack DC” into “grid-ready AC,” while keeping losses low, protections fast, and measurements trustworthy.
Define the Electrical Boundary Conditions
Start by writing down what the grid interface demands: AC voltage level, frequency, allowable power factor range, and ride-through behavior during disturbances. Then map those requirements backward to the battery side. For example, if the inverter needs a minimum DC bus voltage to produce rated AC power, the system must ensure the stack can maintain that bus voltage across the operating state-of-charge window. A practical best practice is to choose a target “conversion headroom” so the inverter does not run at its edge during normal dispatch.
DC Collection and Busbar Stage
The stack output is collected through current-carrying conductors and switching elements into a DC bus. This stage is where many real-world losses hide: contact resistance, uneven current sharing, and thermal hotspots. Use short, wide conductors where possible, and design busbar layouts to minimize loop area and stray inductance. A simple example: if two parallel strings feed a common bus, ensure their conductor lengths and contact resistances are matched closely enough that current splits predictably; otherwise, one string runs hotter and ages faster.
Include a DC disconnect and fusing strategy sized for the maximum fault current and the inverter’s operating limits. Even if the battery chemistry limits fault energy, the wiring and capacitors can still produce damaging currents. Fast DC protection is not optional; it is part of the conversion chain’s job.
DC Filtering and Energy Buffering
Between the DC bus and the inverter, add filtering and energy buffering to smooth current ripple and protect sensitive electronics. DC-link capacitors reduce voltage dips during inverter switching and provide short-term energy during transient events. The tradeoff is straightforward: more capacitance lowers ripple but increases inrush current and physical size. A practical approach is to size capacitors based on allowable DC bus ripple and inverter control bandwidth, then verify with transient simulation and commissioning tests.
Inverter Stage for Grid-Compatible AC
The inverter converts DC to AC using controlled switching (typically IGBT or MOSFET-based power modules). Its control system shapes the output current so the grid sees the requested active power and, if supported, reactive power. The inverter must also synchronize to grid voltage phase and enforce current limits during abnormal conditions.
A concrete example helps: suppose the operator requests 1 MW discharge at unity power factor. The inverter control computes the required current magnitude from the grid voltage and then modulates switching so the current waveform tracks a sinusoid with low harmonic content. If the grid voltage sags, the inverter may need to reduce current to stay within its current limit while still meeting protection rules.
Grid Interface Protection and Synchronization
After the inverter, the power flows through AC filtering (if used), metering, and protective devices before reaching the grid interconnection point. Key elements include:
- AC contactor or breaker for safe isolation.
- Anti-islanding protection to prevent energizing the grid during outages.
- Overcurrent and ground-fault protection sized for inverter behavior.
- Synchronization and interlock logic so the system connects only when voltage and phase conditions are acceptable.
A best practice is to treat protection coordination as a design deliverable, not a checklist item. Inverter current limiting, breaker trip curves, and sensor response times must agree on what “fault cleared” means.
Measurement, Control, and Data Integrity
Reliable measurements are part of conversion. The inverter needs accurate DC bus voltage, DC current, AC voltage, AC current, and temperature signals. Use calibrated sensors and implement plausibility checks to catch wiring errors or sensor drift. For example, if DC current reading is inverted due to polarity wiring, the control loop can command the wrong direction of power flow; a simple sign-consistency check during commissioning prevents that.
System-Level Example Walkthrough
Consider a discharge event:
- The stack controller requests a target DC current.
- The DC collection stage routes current to the DC bus with controlled switching and protection.
- The DC-link capacitors buffer switching transients.
- The inverter control converts the DC bus into AC current at the grid’s phase.
- Grid protection verifies conditions and ensures safe isolation if limits are exceeded.
Each stage has a “contract” with the next: voltage/current ranges, response times, and fault behavior. When those contracts are explicit, commissioning becomes methodical instead of mysterious.
Mind Map: Power Conversion Chain Overview
Example: Choosing DC Bus Headroom
If the inverter requires a minimum DC bus voltage of 600 V to deliver rated power, and the stack can drop to 520 V at low SOC, the design must either widen the operating SOC window or include a DC/DC stage or configuration that maintains the bus above 600 V. A practical method is to plot stack voltage versus SOC at expected temperatures, then overlay inverter minimum bus voltage and allowable ripple to select a safe operating region.
2.2 Energy Conversion Chain From Electrochemical State to Usable Energy
An iron-air battery stores energy as chemical potential in the iron electrode and the electrolyte, while the air electrode provides oxygen during discharge. Turning that stored chemical state into usable electrical energy requires a chain of conversions and measurements. Think of it as three layers: electrochemical state, electrical output, and grid-ready power.
Electrochemical State Variables That Control Output
The electrochemical state is summarized by quantities that determine voltage and available capacity. The most practical ones are:
- State of charge proxy: Often tracked indirectly because the chemistry is distributed across the electrode and electrolyte. A common approach is to estimate it from current history and measured voltage.
- Electrolyte concentration and temperature: These affect reaction kinetics and ohmic resistance, shifting the cell voltage even at the same charge level.
- Gas-side conditions: Oxygen availability at the air electrode influences polarization losses. If oxygen transport is constrained, voltage drops under load.
A useful best practice is to treat these as “knobs” that the control system can infer from sensors. For example, if voltage sag increases at higher current while temperature is stable, the likely culprit is air-side limitation rather than electrolyte resistance.
From Cell Voltage to Stack Power
Each cell produces a voltage that depends on the electrochemical state and internal losses. The usable electrical output comes from converting that cell voltage into power through interconnection and power electronics.
-
Cell and stack electrical model
- The cell voltage can be viewed as an ideal term minus losses: internal resistance (ohmic) plus additional polarization from reaction and transport limits.
- Losses rise with current, so the same state of charge yields different terminal voltage at different loads.
-
Series and parallel arrangement
- Series increases voltage to reach inverter-friendly levels.
- Parallel increases current capability and must be balanced to avoid uneven current sharing.
-
Power electronics interface
- A DC bus collects stack power.
- An inverter or bidirectional converter shapes current and voltage to match grid requirements.
Example: Suppose a stack is built to deliver 600 V DC. At a moderate discharge current, the stack terminal voltage is 580 V due to internal losses. The bidirectional converter then boosts or regulates to maintain the DC bus at 600 V for the inverter. If the converter has limited headroom, the control system may reduce current to prevent the bus from collapsing.
Energy Accounting from Electrical Measurements
Usable energy is not just “what the chemistry can provide.” It is what the system delivers while staying within constraints.
- Instantaneous power is computed from measured DC bus voltage and current.
- Delivered energy is the time integral of that power, corrected for converter efficiency and auxiliary loads.
- Round-trip efficiency depends on both electrochemical losses and balance-of-plant consumption (pumps, blowers, controls).
A practical approach is to define energy accounting boundaries clearly. For instance, if you measure only stack output, you may overestimate system performance because you ignore blower power and pump power. If you measure at the AC grid interface, you include those loads automatically.
Control Loops That Translate State into Dispatch
Dispatch requires the system to choose a current setpoint that respects electrochemical limits and maintains grid stability.
- Outer loop: Tracks requested power or state-of-charge target and sets a current command.
- Inner loop: Regulates converter behavior to achieve the commanded current while monitoring voltage limits.
- Constraint handling: Limits may include maximum current to avoid excessive polarization, minimum voltage to protect air-side conditions, and temperature bounds to keep electrolyte resistance predictable.
Example: During a long discharge, the same current command can cause increasing voltage drop as the electrolyte warms or cools and as oxygen utilization changes. A stable control strategy uses measured voltage and temperature trends to adjust current so the system stays within allowable operating windows.
Mind Map: Energy Conversion Chain
Putting It Together with One End-to-End Example
Consider a discharge request of 500 kW for several hours.
- The estimator uses voltage, current, and temperature to infer the electrochemical state.
- The controller converts the power request into a current setpoint based on the stack voltage model and present losses.
- The converter regulates the DC bus so the inverter can deliver stable AC power.
- Energy delivered is computed from measured grid-side power, while system efficiency is computed by comparing grid energy to stack chemical energy proxies and subtracting auxiliary consumption.
If the air electrode becomes oxygen-limited, voltage falls faster than expected. The controller detects the mismatch between predicted and measured voltage behavior and reduces current to maintain safe operating conditions, ensuring the delivered energy remains accurate and the system does not “spend” capacity on avoidable losses.
2.3 Modular Stack Layout and Balance of Plant Integration
A modular iron-air stack is built from repeatable electrochemical units that share the same mechanical and fluid interfaces. The goal is simple: make each module easy to assemble, test, replace, and scale without redesigning the entire plant. In practice, “modular” only works if the stack layout and the balance of plant (BoP) agree on interfaces: where current enters, where electrolyte flows, how air is delivered, and how measurements are routed.
Module Boundaries and Interface Rules
Start by defining hard boundaries. A module should include the electrochemical stack hardware plus immediate flow paths, but it should not include site-specific plumbing runs. This keeps module testing meaningful.
Common interface rules that prevent headaches:
- Electrical interface: a fixed busbar pattern and connector standard so current distribution stays consistent across modules.
- Fluid interface: standardized inlet/outlet ports with known pressure drops so pump sizing remains predictable.
- Air interface: a defined air plenum volume and flow measurement location so oxygen utilization can be compared module-to-module.
- Instrumentation interface: a wiring harness that maps sensors to a consistent channel order.
A practical example: if each module has a 2 kW electrical rating at a target current density, you can scale to 20 kW by repeating ten modules. But only if each module sees the same electrolyte flow per active area and the same air stoichiometry range.
Mechanical Layout for Repeatable Assembly
A typical modular layout uses a stack frame that holds multiple electrochemical cells in series, then groups those series strings into modules. The module frame provides:
- Compression control to maintain contact pressure over time.
- Service access to remove a module without disturbing adjacent modules.
- Alignment features so electrode stacks and manifolds seat consistently.
Best practice: design for “drop-in replacement.” If a module is removed, the remaining modules should not require re-torquing or re-leveling. That means using alignment pins, repeatable gasket surfaces, and consistent manifold mating geometry.
Electrolyte Manifolding and Flow Balancing
BoP integration is where modularity is won or lost. Electrolyte flow must be balanced so each module experiences the intended velocity and residence time.
A systematic approach:
- Choose a target flow per active area based on cell-level testing.
- Estimate pressure drop for the module internal channels and the manifold segments.
- Select a balancing method: orifice plates, flow restrictors, or variable-speed pumping with closed-loop control.
Example: Suppose module internal pressure drop is 12 kPa at the target flow. If manifold segments add 3 kPa differences between modules, the flow split can drift noticeably. Adding fixed restrictors sized to dominate the manifold variation keeps flows closer to target without complex controls.
Air Distribution and Oxygen Utilization Consistency
Air distribution affects both performance and degradation mechanisms. In a modular system, the air side should be designed so each module receives comparable oxygen availability.
Key practices:
- Place flow measurement at a location that reflects the module’s actual air path, not just the upstream supply.
- Use plenum volumes that smooth short-term fluctuations from fans or blowers.
- Ensure condensation management so water does not pool and block air electrode pathways.
Example: If one module’s air path has a slightly higher resistance, it may run at lower stoichiometry. That can show up as a higher voltage under load and faster capacity fade. A simple check is to compare module air flow and voltage curves at the same dispatch point.
Electrical Integration and Current Sharing
Modules connected in parallel must share current predictably. The stack layout should minimize unequal contact resistances.
Practical methods:
- Use symmetrical busbar routing so each module sees similar conductor lengths and contact points.
- Implement current sensing per module string or per group, not only at the inverter output.
- Use tight connector quality control during assembly, since small variations in contact resistance can dominate at high current.
Example: If two modules differ by 2 mΩ in effective contact resistance, at 500 A that is a 1 V difference. That is enough to shift current distribution and create uneven heating.
Control and Data Integration Across Modules
Modularity requires consistent control signals and data mapping. A clean pattern is:
- Local module sensors for temperature, voltage, and flow.
- Central controller that applies dispatch setpoints and enforces safety interlocks.
- A standardized state model so the system can interpret “module ready,” “module limited,” and “module fault” the same way.
Example: If a module’s electrolyte temperature rises above a threshold, the controller can reduce its effective current contribution by adjusting the dispatch profile or isolating the module, depending on the electrical topology.
Mind Map: Modular Stack Layout and BoP Integration
Example Walkthrough for a 10-Module System
Imagine a plant with ten identical modules, each designed and tested at the same current density and flow targets. The BoP is integrated by:
- routing electrolyte from a common pump to a manifold that includes fixed restrictors sized to overcome manifold variation,
- supplying air through a plenum and measuring flow at a consistent point before each module branch,
- connecting modules with symmetrical busbars and verifying contact resistance during commissioning,
- mapping sensor channels so the controller can compare module behavior at the same dispatch step.
When these pieces match, scaling becomes repetition rather than reinvention. The stack still has chemistry and physics to obey, but the system behaves like a predictable machine instead of a collection of one-off parts.
2.4 Thermal and Hydraulic Subsystems for Stable Operation
Iron-air stacks behave like a system of coupled “thermo-fluid-electrochemistry.” Temperature affects reaction rates and membrane behavior; flow affects oxygen delivery and electrolyte transport; both affect how evenly the cell stack performs. The goal of thermal and hydraulic design is simple: keep the stack inside its operating window while delivering the right reactant and electrolyte conditions to every cell, every time.
Thermal Foundations for Stable Stack Behavior
Start with what you can measure and control. Temperature is usually managed at two levels: (1) stack-level heat removal and (2) local hot-spot prevention.
Heat sources come from electrical losses (ohmic resistance, contact resistance) and from any inefficiencies in pumps, blowers, and auxiliary heaters. A practical rule is to treat the stack as having a “heat generation map” rather than a single heat value. Uneven current distribution creates uneven heat, which then changes local viscosity and flow resistance, which then worsens distribution. Thermal design breaks that feedback loop.
A typical approach uses a liquid cooling plate or manifold that spreads heat across the stack. The hydraulic design of the cooling loop matters because poor distribution creates temperature gradients even if the total flow rate is correct. Use multiple parallel channels or a serpentine layout with attention to pressure drop symmetry.
Example: If the stack has 20 cooling channels and you feed them from one side, the first channels may run warmer because the pressure head drops along the manifold. Fix it by using a balanced inlet manifold, or by increasing channel count and reducing per-channel flow resistance so the manifold pressure variation becomes less significant.
Temperature control should be stable, not just accurate. Use a control loop that accounts for thermal inertia. If you use a fast-acting valve on a system with large thermal mass, you can get oscillations: temperature swings cause viscosity changes, which change flow, which changes heat removal. A slower control strategy with measured stack inlet and outlet temperatures usually behaves better.
Hydraulic Subsystems for Electrolyte and Air-Side Stability
Hydraulics in iron-air systems usually includes electrolyte circulation, air distribution, and sometimes cooling loop circulation. For stable operation, you must ensure that flow is consistent across the stack and that pressure levels prevent unwanted mixing or ingress.
Electrolyte circulation has two jobs: deliver ions uniformly and remove heat. The electrolyte path should minimize dead zones where concentration and temperature can drift. Use smooth internal surfaces and avoid sharp expansions that trap bubbles or create stagnant layers.
Air handling is not just “more flow equals better.” Oxygen utilization depends on how evenly air contacts the air electrode and how water is managed. Too little flow starves the electrode; too much flow can increase drying and push water balance out of range.
Example: Suppose one stack section receives 30% more air than another due to manifold imbalance. The high-flow section may run drier and show higher voltage loss, while the low-flow section may show oxygen starvation. The result is a stack-level average that looks acceptable but a cell-level spread that accelerates degradation. Fix it by designing the air manifold for equal pressure drop across branches.
Coupling Thermal and Hydraulic Design
Thermal and hydraulic are coupled through viscosity, density, and membrane hydration. As temperature rises, viscosity drops, which reduces hydraulic resistance and can increase flow for a fixed pump setting. If your control system assumes constant resistance, you can get unintended flow changes.
To manage coupling, design around measurable signals: pump speed, differential pressure across flow restrictors, and stack inlet/outlet temperatures. Differential pressure is especially useful because it reflects flow resistance changes caused by fouling, scaling, or gas-liquid interactions.
Example: If differential pressure across the electrolyte loop slowly declines over weeks, you may be seeing scale formation that changes flow paths or a seal leak that bypasses a restriction. A simple diagnostic is to compare pressure drop at the same pump speed and temperature setpoint. If the relationship shifts, investigate the hydraulic path.
Sizing and Control Practices That Prevent Instability
- Pressure Drop Budgeting: Allocate allowable pressure drops across manifolds, channels, and filters. Keep the stack distribution elements a meaningful fraction of total drop so small manifold variations do not dominate.
- Flow Measurement Placement: Measure where flow is representative of the stack, not where it is affected by local turbulence. For electrolyte, a measurement near the stack inlet after straightening sections helps.
- Thermal Sensor Coverage: Place sensors to detect gradients, not just average temperature. A common pattern is inlet and outlet plus at least one mid-stack location.
- Control Loop Separation: Use separate loops for temperature and flow when possible. If you must couple them, include feedforward from pump speed and blower speed.
Mind Map: Thermal and Hydraulic Subsystems for Stable Operation
Integrated Example Workflow for Commissioning
During commissioning, verify thermal-hydraulic consistency before chasing electrochemical performance. First, run the cooling loop and confirm that stack temperature rise matches expected heat removal. Next, set electrolyte circulation to a target differential pressure and confirm stable flow across operating temperatures. Then, run air distribution tests at fixed blower settings and verify that pressure drop across air branches is balanced. Only after these checks should you adjust electrochemical operating points, because thermal-hydraulic instability can masquerade as electrochemical issues.
A stable system is one where small changes in setpoints produce predictable responses. If a change in pump speed causes a disproportionate temperature shift, or if a change in blower speed causes a large differential pressure shift, you likely have a distribution or control coupling problem that should be corrected before continuing.
2.5 Metering Controls and Data Logging for Commissioning
Commissioning is where “it works on the bench” becomes “it works on the grid.” Metering and data logging are the bridge: they confirm that the iron-air stack, air handling, and power electronics are behaving consistently, and they provide the evidence you’ll use when something drifts.
Foundational Metering Concepts for Commissioning
Start by separating what you measure into three categories.
- Electrical metering verifies energy flow. Measure stack voltage, stack current, and DC bus voltage at a minimum. If you have multiple stacks or strings, measure at each aggregation point so you can detect imbalance.
- Process metering verifies the chemistry and transport conditions. Typical signals include electrolyte temperature, electrolyte flow rate, electrolyte level or density proxy, air pressure, air flow rate, and humidity or dew-point proxy if available.
- System metering verifies the grid interface. Measure AC power, grid voltage, grid frequency, and inverter or PCS status signals.
A practical rule: every control action should have at least one measurement that can confirm it had the intended effect. If you command an air blower speed but only log blower RPM, you miss the real outcome. Log air flow or pressure at the air electrode manifold too.
Control Loops and Commissioning-Ready Logic
Commissioning controls should be conservative and observable. Use a staged approach.
- Stage 1: Safe enablement. Confirm interlocks, sensor plausibility, and isolation states. For example, if a temperature sensor reads below a physically reasonable threshold, block charging and log the reason.
- Stage 2: Open-loop characterization. Run at fixed setpoints long enough to see steady behavior. Record how voltage responds to current and how process variables respond to pump or blower commands.
- Stage 3: Closed-loop operation. Enable control loops only after you can explain the measured responses. If the electrolyte temperature loop hunts, you’ll see it in the logged temperature trace and can adjust gains or limits.
For metering, commissioning-ready logic includes:
- Plausibility checks such as range limits, rate-of-change limits, and cross-sensor consistency. Example: if electrolyte flow is commanded to increase but flow meter stays flat, flag a likely valve or sensor fault.
- Time alignment so electrical and process data share a common timestamp. Without alignment, you’ll “solve” problems that are actually measurement timing artifacts.
- Unit consistency enforced in software and verified in commissioning. A flow meter reported in mL/min instead of L/min can quietly ruin your interpretation.
Data Logging Design That Supports Debugging
Logging is not just storage; it’s a debugging tool. Design it around questions you’ll ask during commissioning.
- Sampling rates: log fast-changing electrical signals (current, voltage) frequently enough to capture transients; log process signals at a slower but still responsive rate. If you sample temperature too slowly, you’ll miss the moment a control loop overshoots.
- Event logging: record discrete events like “charge enabled,” “air blower started,” “interlock cleared,” and “fault latched.” These events let you segment long runs into meaningful intervals.
- Metadata: store configuration values used during the run, such as current limits, ramp rates, and sensor calibration constants.
A simple example workflow: during a controlled charge step, you should see current ramp, voltage response, electrolyte temperature response, and air flow response in the same time window. If one of those traces is missing or delayed, fix the logging before you adjust control parameters.
Mind Map: Metering and Logging for Commissioning
Example Commissioning Checks Using Logged Data
Example 1: Energy accounting sanity check. During a 30-minute discharge at a near-constant current, integrate current over time to estimate delivered charge, then compare with the energy computed from measured voltage and current. If the difference is large, check for timestamp misalignment, scaling errors, or sensor offset.
Example 2: Air side response verification. Command a step increase in blower speed. In the logs, air flow or manifold pressure should rise within a predictable delay. If electrical voltage changes but air flow does not, you likely have a control-to-actuator mismatch or a stuck valve.
Example 3: Sensor plausibility under real conditions. During operation, electrolyte temperature should change gradually. If the temperature trace jumps sharply while flow and current remain steady, treat it as a sensor fault and verify wiring and filtering settings.
Commissioning Deliverables for Metering and Logging
Finish this section with concrete outputs:
- A metering list mapping each control input to its confirming measurement.
- A logging specification listing signal names, units, sampling rates, timestamp source, and event triggers.
- A commissioning test script that uses the logs to verify energy accounting, control response, and fault detection.
When these deliverables exist, commissioning becomes repeatable. You’re not guessing why a system behaved oddly; you’re reading the system’s own record.
3. Materials Selection and Electrode Design for Cost and Durability
3.1 Iron Electrode Forms and Tradeoffs in Reactivity and Cost
Iron is the “workhorse” in an iron-air cell: it supplies electrons during discharge and must survive repeated cycling without turning into a pile of unusable sludge. The electrode’s physical form controls three practical things: how fast iron can react, how evenly it reacts, and how much it costs to make and maintain.
Core Idea: Surface Area and Transport Limits
Reactivity is largely governed by available iron surface and how easily ions and electrolyte can reach that surface. In a simple mental model, the cell has two bottlenecks: (1) electrochemical reaction at the iron surface and (2) transport of electrolyte species and removal of reaction products. If you choose a form with high surface area but poor transport, you get fast initial discharge followed by early performance collapse. If you choose a form with low surface area but excellent wetting and transport, you get steadier output but less peak power.
Common Iron Electrode Forms
1) Iron powder and particulate beds Iron powder offers high surface area per unit mass, which can improve discharge rate. The tradeoff is mechanical and chemical: powders can compact, separate from current collectors, or form uneven reaction zones. A practical best practice is to design the electrode so particles remain well wetted and mechanically supported, for example by using a porous scaffold or a binder system that maintains contact under cycling.
Example: If you load a powder bed into a current-collecting frame and the electrolyte channeling is poor, the top layer may react quickly while the lower layers stay underutilized. You can often see this as a voltage curve that drops early and then flattens, even though iron remains present.
2) Iron foam and porous metal structures Foams provide interconnected pathways for electrolyte access and gas-side separation, which helps transport. They also reduce the “contact loss” problem common in loose powders. The tradeoff is manufacturing cost and variability: foam pore size and thickness strongly affect both wetting and effective surface area.
Example: A foam with very large pores may be easy to wet but can reduce effective surface area, lowering power. A foam with very small pores may increase surface area but can trap reaction products, raising internal resistance.
3) Iron plates, sheets, and expanded metal Dense forms are straightforward to fabricate and can be inexpensive per kilogram. They also tend to be mechanically robust. The tradeoff is that reaction is limited by surface area and by how reaction products block the surface. To improve utilization, designers often increase effective surface area using surface roughening, perforations, or expanded metal geometry.
Example: A smooth plate may show good early performance but quickly develops a passivating layer. Adding controlled roughness or using expanded metal can delay that transition by maintaining more active sites and reducing product coverage.
4) Iron-based composites and structured electrodes Composites combine iron with a supporting matrix or conductive network. The goal is to keep iron accessible while maintaining electrical contact and mechanical integrity. The tradeoff is added materials and process complexity, which can raise cost even if the iron mass is reduced.
Example: A composite that uses a conductive scaffold can reduce contact resistance, but if the scaffold chemistry is incompatible with the electrolyte, it may corrode faster than the iron, shifting the failure mode.
Tradeoffs That Matter in Real Cells
Reactivity vs. utilization High surface area increases initial reactivity, but utilization depends on whether electrolyte can reach fresh iron throughout discharge. A form that reacts uniformly tends to deliver more of its theoretical capacity.
Cost vs. lifetime The cheapest electrode form is not always the lowest cost per delivered kilowatt-hour. If a low-cost form fails early or requires frequent replacement, the effective cost rises.
Electrical contact vs. mechanical stability Poor contact resistance can dominate performance even when chemistry is favorable. Mechanical design should prevent delamination, cracking, or compaction that interrupts current pathways.
Product management Reaction products can accumulate and increase resistance. Electrode forms that provide channels for product removal typically sustain performance longer.
Mind Map: Iron Electrode Forms and Tradeoffs
Practical Selection Workflow
Start by defining the operating target: desired power level and expected discharge duration. Then choose an electrode form that matches the dominant bottleneck. If you need higher power, prioritize forms that maintain accessible surface area and low internal resistance. If you need long, steady discharge with minimal replacement, prioritize forms that resist contact loss and manage reaction products. Finally, validate with a simple diagnostic: compare voltage behavior early vs late in discharge to infer whether the limitation is surface reaction, transport, or contact resistance.
Example: If voltage drops sharply at the beginning and then recovers slightly, you likely have good initial surface access but rapid product buildup or local depletion. If voltage is stable early but collapses near mid-discharge, you likely have transport or wetting limitations that prevent deeper iron utilization.
3.2 Air Electrode Catalysts and Support Materials for Practical Use
Iron-air cells live or die by the air electrode: it must reduce oxygen efficiently while staying mechanically stable, wettable, and tolerant of real-world air (humidity, dust, and occasional surprises). The catalyst provides the reaction sites; the support materials keep those sites accessible to oxygen and electrolyte ions without turning the electrode into a clogged sponge.
Core Catalytic Requirements
Start with what the catalyst must accomplish during discharge. It should (1) promote oxygen reduction at useful potentials, (2) resist corrosion in the alkaline electrolyte environment, (3) maintain activity as pores fill with reaction products and as surfaces age, and (4) work with the chosen air-side transport design, whether that means forced airflow or passive diffusion.
A practical way to reason about catalyst performance is to separate kinetics from mass transport. If the electrode is well-designed, the measured voltage loss mostly reflects reaction kinetics. If the electrode is poorly designed, oxygen supply becomes the bottleneck and the catalyst looks “bad” even when it isn’t. That’s why catalyst choice and support structure must be engineered together.
Catalyst Families and How They Behave
In alkaline iron-air systems, oxygen reduction typically involves a sequence of steps that can proceed through different intermediates. Catalysts are chosen to steer these steps toward faster overall rates.
-
Transition-metal catalysts (often oxides, hydroxides, or mixed phases) can offer strong activity and reasonable stability. Their surfaces can evolve during operation, so the initial “as-made” state is less important than the stable working state.
-
Noble-metal catalysts can be highly active but may be limited by cost and long-term corrosion concerns. In practical designs, they are often used sparingly or as small fractions blended into a cheaper matrix.
-
Carbon-supported catalysts can improve electronic pathways, but carbon corrosion in alkaline, oxygen-rich conditions can reduce lifetime. If carbon is used, it must be protected by the surrounding chemistry and by careful electrode architecture.
A useful best practice is to specify catalyst performance in terms of current density at a defined oxygen utilization and humidity range, not just in terms of onset potential. Two catalysts with similar onset can diverge badly under realistic current loads.
Support Materials That Keep Catalysts Working
The support is not a passive scaffold. It determines how oxygen, electrolyte, and electrons meet at the reaction sites.
Carbon and conductive networks. Conductivity matters because oxygen reduction is an electrochemical process that needs electron transfer. A conductive network should be continuous enough to avoid “dead zones,” yet porous enough to avoid flooding. A common practical approach is to use a conductive scaffold that forms percolation paths, then coat or anchor catalyst particles onto it.
Binders and ion-accessible phases. Binders hold the electrode together and influence wetting. If the binder is too hydrophobic, electrolyte cannot reach the catalyst; if it is too hydrophilic, the electrode floods and oxygen transport collapses. The binder should also resist swelling and cracking under cycling.
Porosity and pore-size distribution. Oxygen must diffuse through gas-filled pores while ions move through wetted regions. A bimodal pore structure often helps: larger pores for gas transport and smaller pores for electrolyte contact. The goal is to maintain a stable three-phase boundary during operation.
Hydrophobic treatments. Many air electrodes use controlled hydrophobicity on the gas-facing side to delay flooding. The trick is to treat the right surface region rather than the entire electrode, so the catalyst still sees electrolyte.
Anchoring Strategies for Practical Durability
Catalyst particles can detach under airflow shear, thermal cycling, or repeated wetting and drying. Anchoring strategies reduce this risk.
- Direct growth or in-situ formation: Catalyst phases form on the support during preparation or early operation, improving adhesion.
- Surface functionalization: Introducing chemical groups on the support can increase binding strength and reduce particle migration.
- Composite layering: A catalyst layer can be deposited onto a stable conductive substrate, with a graded interface that reduces stress.
A simple example: if you observe a rapid drop in performance after a few discharge cycles, check whether catalyst particles are migrating into the electrolyte. If they are, the support may be too smooth, the binder too weak, or the catalyst layer too thick.
Mind Map: Catalyst and Support Design Logic
Example: Designing a Catalyst Layer That Doesn’t Flood
Suppose you start with a catalyst powder mixed into a binder and pressed onto a conductive substrate. Initial tests show good performance at low current, but at higher current the voltage drops sharply and recovers slowly after rest. That pattern often indicates flooding or oxygen starvation.
A practical fix is to re-balance the electrode’s wetting profile. Apply hydrophobic treatment primarily to the gas-facing region, then keep the catalyst layer and its immediate backing more ion-accessible. Also reduce catalyst layer thickness so oxygen can reach the reaction sites without forcing the entire structure to become liquid-filled.
After changes, verify with a simple operational check: run a constant current discharge while monitoring pressure drop across the air path and cell voltage. If pressure drop rises while voltage collapses, oxygen transport is likely constrained; if voltage declines uniformly without transport symptoms, the issue is more likely catalyst activity or electronic connectivity.
Example: Interpreting Catalyst vs Support Problems
If two electrodes use the same catalyst but one performs worse, the catalyst is not automatically the culprit. If the worse electrode shows higher internal resistance and slower recovery after rest, suspect poor electronic percolation or binder-induced contact loss. If it shows strong performance at low current but fails at moderate current, suspect pore structure and flooding control rather than intrinsic catalytic activity.
In practice, the most reliable workflow is to test catalyst loading, then test support porosity and wetting, and only then compare catalyst chemistries. That order prevents you from blaming the catalyst for a support problem wearing a catalyst-shaped costume.
3.3 Separator and Membrane Materials for Ion Transport and Longevity
Iron-air cells depend on a separator/membrane to do three jobs at once: keep the electrolyte where it belongs, provide an ion path that supports current, and survive the chemical and mechanical stress of repeated cycling. The trick is that improving one job often makes another worse, so material choice is mostly about balancing transport, stability, and manufacturability.
Foundational Requirements for Ion Transport
Start with what “ion transport” means in practice. During discharge, ions must move through the electrolyte-filled region while electrons travel through the external circuit. A separator that blocks electronic conduction forces current to follow the intended path. At the same time, the separator must not create a large concentration gradient that starves the reaction sites.
A useful mental model is resistance in series: ionic resistance through the membrane region plus interfacial resistances at the membrane-electrode boundaries. If you reduce membrane thickness, you lower ionic resistance, but you also reduce mechanical robustness and increase the chance of pinholes. If you increase porosity to help wetting, you may improve ionic conductivity, but you can also increase crossover of reactive species and accelerate degradation.
Separator vs Membrane Roles
In many designs, the “separator” is a physical barrier that maintains spacing and prevents shorting, while the “membrane” is the ion-selective or ion-conducting layer that governs transport. In iron-air systems, the separator often must tolerate wetting, swelling, and chemical attack. The membrane layer, if present, is typically chosen to reduce electronic leakage and stabilize the electrolyte environment near the electrodes.
A practical example: if your separator is only a porous polymer sheet, it may wet quickly and conduct ions, but it can allow unwanted electronic pathways if the electrode stack compresses and creates contact bridges. Adding a thin ion-conducting layer can restore electronic blocking without making the whole structure thick.
Material Families and Their Tradeoffs
Polymeric separators are common because they can be manufactured as thin films and are relatively low cost. Their strengths are processability and predictable mechanical behavior. Their weaknesses are chemical stability in alkaline or reactive electrolytes, especially under temperature swings and local pH gradients.
Inorganic or composite separators often improve chemical and thermal stability. They can resist swelling and maintain pore structure longer. The tradeoff is that they may be harder to fabricate into thin, defect-free layers, and they can introduce higher interfacial resistance if surface chemistry is not tuned for wetting.
Composite membranes combine a stable scaffold with an ion-conducting phase. For example, a porous support can provide mechanical strength while a thin ion-conducting coating reduces electronic leakage. The coating must adhere under cycling; otherwise, it delaminates and you lose both transport control and barrier function.
Longevity Failure Modes to Design Against
Longevity is mostly about preventing the separator from changing its job. Common failure modes include:
- Pore clogging from precipitates or reaction byproducts that block ion pathways.
- Chemical embrittlement where polymer chains break, increasing brittleness and crack formation.
- Swelling and dimensional drift that distorts compression and creates local gaps or contact bridges.
- Pinholes and microcracks that enable electronic leakage or increase crossover.
- Interfacial degradation where the membrane-electrode contact resistance grows due to poor wetting or surface fouling.
A concrete example of interfacial degradation: if the membrane surface becomes more hydrophobic over time, the electrolyte film thins. The cell still has electrolyte in bulk, but the reaction zone near the electrode becomes starved, raising voltage losses even when the bulk chemistry looks unchanged.
Design Controls That Make Materials Behave
Material choice is necessary but not sufficient. Several controls determine whether the separator/membrane performs as intended.
- Thickness control: target a thickness that keeps ionic resistance low while maintaining defect tolerance.
- Wetting strategy: ensure the separator is conditioned so electrolyte spreads quickly and uniformly.
- Surface treatment: adjust surface energy or add a thin interlayer to reduce contact resistance.
- Compression management: maintain uniform stack pressure so the membrane does not experience stress concentrations.
- Impurity control: filtration and handling reduce precipitate formation that clogs pores.
Mind Map: Separator and Membrane Materials
Example: Choosing a Separator for Stable Contact Resistance
Suppose you compare two separator options for a prototype stack. Option A is a thin porous polymer sheet that wets easily at startup. Option B is a composite with a stable scaffold and a thin ion-conducting layer.
During early testing, Option A may show lower initial voltage because its ionic resistance is low. After several cycles, you notice voltage increases that correlate with higher interfacial resistance, even though bulk electrolyte composition remains within spec. The likely cause is surface fouling or loss of electrolyte film continuity at the polymer surface. Option B starts slightly higher in initial resistance but maintains a steadier voltage curve because the composite layer preserves wetting and electronic blocking under compression.
The takeaway is simple: longevity is often won at the interfaces, not just in the bulk material. A separator that keeps the electrolyte where it needs to be, while resisting chemical and mechanical change, tends to produce more predictable performance.
Example: Interpreting Separator Performance Tests
When you run acceptance tests, treat them like diagnostics rather than pass-fail trivia. Track ionic resistance proxies (such as voltage at a fixed current and temperature) over repeated cycles. If resistance rises quickly, suspect wetting loss, pore clogging, or interfacial fouling. If resistance jumps suddenly after a mechanical event, suspect microcracks or compression-induced contact bridges. If performance degrades gradually with temperature exposure, suspect chemical embrittlement or slow swelling.
A good separator/membrane is boring in the best way: it keeps transport stable, keeps electronic leakage low, and keeps the stack geometry from turning into a surprise experiment.
3.4 Corrosion Control Strategies for Structural Materials
Iron-air stacks live in a wet, chemically active environment: electrolyte splashes, humid air, and occasional leaks are part of the operating reality. Corrosion control is therefore not a single trick; it is a chain of choices that reduce exposure, slow reaction rates, and prevent corrosion from spreading when something goes wrong.
Start with Failure Modes and Corrosion Types
Begin by mapping where corrosion can start and how it propagates. In iron-air systems, the most common structural risks are:
- Uniform corrosion on wetted surfaces where the chemistry is relatively even.
- Crevice corrosion under gaskets, overlaps, and trapped electrolyte.
- Pitting corrosion on stainless or coated metals when local breakdown occurs.
- Galvanic corrosion when dissimilar metals share an electrolyte path.
- Erosion-corrosion near pumps, elbows, and high-velocity flow.
A practical best practice is to treat each component as a “corrosion zone” with a defined exposure: splash-wet, condensation-wet, air-only, or immersion. Then you choose materials and details that match that zone.
Material Selection with Electrolyte Compatibility in Mind
Structural materials should be chosen for the specific electrolyte environment, not just general corrosion resistance. For example, if a component can contact electrolyte during maintenance, it should be rated for that contact rather than “water-like” assumptions.
A simple rule that saves money: avoid relying on coatings as the only barrier for parts that are frequently handled, inspected, or likely to be scratched. Coatings are excellent when paired with good design details that prevent mechanical damage.
When dissimilar metals are unavoidable, isolate them electrically and physically. Use non-conductive gaskets, insulating washers, and compatible fasteners so there is no continuous electrolyte bridge between metals.
Design Details That Prevent Crevices and Trapped Electrolyte
Corrosion often wins in the small spaces. Crevice-prone details include overlapping plates, poorly drained low points, and gasket geometries that trap liquid.
Use these integrated practices:
- Drain paths: ensure every wetted pocket can drain fully.
- Seal geometry: design gaskets so liquid cannot sit behind them.
- Surface finish: smooth transitions reduce sites where electrolyte stagnates.
- Fastener strategy: avoid “wet crevice stacks” where multiple layers clamp electrolyte.
A concrete example: if a manifold has a dead-end pocket for a sensor port, add a small drain or redesign the port so the lowest point is always a drainable location.
Coatings and Linings as a System, Not a Sticker
Coatings work best when the surface preparation and application quality are controlled. Treat coating performance as a manufacturing process requirement.
Key practices:
- Surface preparation specification: define cleaning and roughness targets.
- Holiday testing: verify coating integrity before assembly.
- Edge protection: coat cut edges and weld seams with compatible systems.
- Repair procedure: define how field scratches are repaired and how repaired areas are verified.
Example: a painted exterior panel that sees occasional splash should have a coating system that includes edge sealing. Without edge sealing, the first chip becomes a corrosion starter under the coating.
Cathodic Protection and Corrosion Inhibitors Where Appropriate
Cathodic protection can reduce corrosion rate by shifting the metal potential. It is most useful when you can control electrical connections and maintain stable conditions.
Corrosion inhibitors can also help, but they must be compatible with electrolyte chemistry and not interfere with cell operation. The best practice is to treat inhibitors as a controlled chemical addition with monitoring, not a “set and forget” additive.
Monitoring, Inspection, and Leak-Driven Response
Corrosion control is incomplete without detection. Install inspection points and plan for routine checks.
Use a layered approach:
- Visual inspection for coating damage and wetting patterns.
- Thickness measurements for critical structural members.
- Coupon monitoring in representative wet zones.
- Leak response procedures that include neutralization and cleaning, not just wiping.
Example: if a small leak is detected at a flange, the response should include removing residual electrolyte from crevices and checking for under-coating corrosion, because corrosion can start before the leak is fully repaired.
Mind Map of Corrosion Control Strategy
Mind Map: Corrosion Control Strategies for Structural Materials
Case Example for Integrated Application
Consider a structural frame that supports a stack and is exposed to occasional electrolyte drips. The integrated solution is: choose a structural alloy or coating system rated for splash-wet exposure, design the frame with drainable geometry, isolate any dissimilar fasteners, and specify coating edge sealing plus a repair-and-verify method. Then add a simple inspection routine that checks coating damage and wetting patterns after maintenance. This combination prevents small defects from becoming corrosion hotspots.
3.5 Manufacturing Considerations for Repeatable Electrode Quality
Repeatable iron-air electrode performance starts on the factory floor, not in the lab. In practice, “repeatable” means the same active material distribution, the same pore structure, and the same surface chemistry from batch to batch—so the cell’s voltage curve and capacity don’t wander just because the calendar did.
Define Quality Targets Before You Touch Materials
Start by translating electrochemical needs into measurable manufacturing specs. For iron electrodes, targets often include areal capacity, thickness uniformity, and corrosion-resistant binder distribution. For air electrodes, targets include catalyst loading per area, gas diffusion layer porosity, and wetting behavior under electrolyte exposure.
A useful approach is to build a simple “spec-to-signal” map: each manufacturing variable should connect to a cell-level signal you can measure. Example: if catalyst ink viscosity drifts, you may see higher initial polarization and faster performance drop because oxygen access becomes less uniform.
Incoming Material Control That Actually Prevents Variability
Incoming powders and membranes are the first source of batch-to-batch differences. Set acceptance criteria for particle size distribution, moisture content, and impurity levels that affect corrosion or catalytic activity.
Example: if iron powder arrives with higher moisture, it can change slurry rheology and cause streaky deposition. A practical fix is to require moisture measurement on receipt and to standardize drying time and temperature before mixing.
Slurry and Ink Preparation with Controlled Chemistry
Electrode fabrication often uses slurries or inks. Repeatability depends on controlling solids fraction, mixing energy, and chemistry order.
Best practice: add components in a fixed sequence and record the time between additions. If you change the order, you can change how binders coat particles, which later changes both mechanical integrity and electrochemical contact.
Example: prepare two iron slurries with identical solids fraction but different mixing times. The longer-mixed slurry may show better dispersion yet produce a denser film after coating, reducing effective porosity and increasing mass-transport resistance.
Coating, Pressing, and Drying That Preserve Structure
Coating methods include doctor blading, slot-die coating, and spraying. Each method is sensitive to viscosity, substrate surface energy, and drying kinetics.
Drying is a common hidden variable. Too fast drying can trap solvent gradients and create microcracks; too slow drying can cause binder migration and uneven thickness.
Example: if you dry at a constant temperature but airflow varies across a production run, the same recipe can yield different pore structures. Monitoring exhaust humidity and using controlled airflow reduces this.
Calendering and Compression with Mechanical Consistency
Compression steps tune porosity and contact resistance. Repeatability requires controlling pressure, dwell time, and roll temperature.
A practical check is to measure thickness and density at multiple points across a panel. If density varies with position, you likely have uneven web tension or roll alignment.
Air Electrode Catalyst Layer Uniformity
Air electrodes are especially sensitive to catalyst distribution because oxygen must reach active sites through a tortuous path.
Best practice: use in-process mass-per-area checks and cross-sectional imaging on sample coupons. If you see catalyst “islands,” you can often trace it to ink drying before full leveling or to surfactant content that changes wetting.
Membrane and Separator Integration Without Damage
Membranes and separators must be aligned and bonded without wrinkles, pinholes, or chemical contamination.
Example: a small misalignment can create local electrolyte bypass paths, which later appear as abnormal current distribution. Use alignment fixtures and verify bond integrity with simple peel or pressure tests before full cell assembly.
In-Process Inspection and Statistical Process Control
Repeatability improves when you measure during production, not only after. Use a layered inspection plan:
- Dimensional checks: thickness, width, and mass per area
- Surface checks: visual defects and coating streaks
- Material checks: moisture, density, and selected chemical markers
Statistical process control helps you catch drift early. Track key variables with control charts and define “stop-and-fix” thresholds.
Post-Fabrication Conditioning and Pre-Assembly Handling
Electrodes often require conditioning to stabilize wetting and remove residual solvents. Handling matters too: fingerprints, dust, and mechanical abrasion can change surface properties.
Best practice: standardize storage time limits and packaging that prevents moisture uptake. Label lots clearly so you can trace any performance anomaly back to a specific fabrication window.
Mind Map: Repeatable Electrode Quality
Example Workflow for One Production Lot
A repeatable workflow can be as simple as a checklist with measurements. For each lot, record incoming moisture, slurry mixing time, coating thickness map, drying airflow settings, and final mass per area. Then sample coupons for density and surface inspection.
If a lot fails thickness uniformity, do not “average it out” by adjusting later steps. Instead, correct the root cause: web tension, doctor blade gap, drying airflow, or compression alignment. This keeps the process stable and prevents the same failure mode from returning in a different disguise.
4. Electrolyte Engineering and Water Management
4.1 Electrolyte Chemistry Selection and Compatibility Constraints
Choosing an iron-air electrolyte is mostly about matching chemistry to hardware. The electrolyte must support the intended ion transport, stay stable under the cell’s redox conditions, and not attack the materials that hold everything together. In practice, you select a target electrolyte first (what ions and concentration range you want), then verify compatibility with every wetted surface: membranes, gaskets, current collectors, pumps, seals, and air-side components that can get splashed.
Electrolyte Roles in an Iron-Air Cell
An iron-air cell needs three electrolyte jobs. First, it provides the ions that move between electrodes so charge can flow without dragging electrons through the wrong places. Second, it buffers the chemical environment so the iron electrode reactions proceed at reasonable rates. Third, it manages water, because many electrolyte formulations change concentration as water is consumed or produced during cycling.
A concrete way to think about this: if your electrolyte is like a “traffic medium,” then ion type is the lanes, concentration is the lane width, and water balance is the road surface. If any of those are off, the cell may still run briefly, but efficiency and lifetime will suffer.
Compatibility Constraints That Actually Matter
Start with the membrane or separator. If the separator is designed for a specific ion (for example, hydroxide-conducting versus other ion-conducting chemistries), the electrolyte must supply that ion in the right form and concentration. A mismatch can show up as high internal resistance, uneven current distribution, or rapid performance drift.
Next, consider corrosion and scaling. Iron systems are sensitive to impurities and to local pH gradients. Even if the bulk electrolyte is “correct,” small regions near the electrodes can become chemically different due to mass transport limits. Those gradients can accelerate corrosion of structural metals and promote precipitation on membranes or electrodes.
Then check mechanical compatibility. Elastomers and polymer seals often swell, harden, or crack depending on solvent content, pH, and temperature. A seal that survives a static soak may fail under flow and pressure cycling, so compatibility testing must include representative shear and pressure conditions.
Finally, verify that the electrolyte does not poison catalysts on the air electrode. Trace contaminants can adsorb on catalytic sites and reduce oxygen reduction or evolution rates. This is why electrolyte purity and handling procedures are part of chemistry selection, not an afterthought.
Selection Workflow from Basics to Constraints
- Define the target operating window: temperature range, current density range, and expected depth of discharge. These determine allowable concentration changes and acceptable water balance behavior.
- Choose the ion system: pick the electrolyte chemistry that supports the required ion transport through the separator and enables the iron electrode reaction pathway.
- Set concentration targets: select a nominal concentration and a safe operating band. The band should account for concentration drift during cycling and for dilution or evaporation during maintenance.
- Screen wetted materials: list every material that contacts electrolyte. For each, check chemical resistance to the chosen pH and ionic species, and confirm it tolerates the temperature and flow regime.
- Run compatibility tests: perform soak tests for chemical attack, flow-through tests for leaching and scaling, and electrochemical tests for performance stability.
A practical example: suppose you plan to operate at a higher temperature to reduce viscosity and improve mass transport. That can also increase corrosion rates and accelerate seal aging. Your selection must therefore treat temperature as a chemistry constraint, not a separate engineering choice.
Mind Map: Electrolyte Chemistry Selection and Compatibility
Example: Concentration Band and Water Balance
Imagine two electrolyte formulations that both “conduct ions,” but one tolerates concentration swings better. If formulation A allows the electrolyte to remain within its effective concentration band during cycling, the separator resistance stays stable and the cell voltage curves remain smooth. Formulation B might start in-range but drift out of range as water content changes, increasing resistance and promoting precipitation.
A simple operational check is to track electrolyte concentration and cell voltage together. If voltage rises while current is held constant, and concentration measurements show drift toward the edge of the band, you likely have a water balance or solubility constraint rather than an electrical fault.
Example: Impurities and Leaching
Even when the electrolyte recipe is correct, impurities can come from storage tanks, transfer hoses, or poorly cleaned mixing equipment. If you observe a gradual decline in air-side performance while iron-side behavior looks stable, suspect catalyst poisoning or air-side contamination. The fix is usually procedural: tighten filtration, control storage time, and ensure wetted surfaces are compatible and clean.
Compatibility Summary You Can Use in Design Reviews
When selecting electrolyte chemistry, treat compatibility as a checklist tied to measurable outcomes: separator resistance stability, absence of precipitation under flow, seal integrity under pressure cycling, and stable air-side electrochemical behavior. If any item fails, adjust chemistry, concentration band, or materials—because “it runs” is not the same as “it lasts.”
4.2 Concentration Control And Its Impact on Cell Performance
Iron-air cells rely on electrolyte composition to carry ions between electrodes and to keep the oxygen reduction and iron oxidation reactions moving at the intended rates. Concentration control is not just about hitting a target number; it is about maintaining a stable chemical environment while the cell continuously consumes and redistributes species during cycling.
Foundational Concepts of Electrolyte Concentration
Electrolyte concentration sets the ionic conductivity and the chemical activity of reactive species. In practice, that means it influences:
- Ohmic losses: Lower conductivity increases voltage drop at a given current.
- Reaction kinetics: The availability of ions near the electrode surfaces affects how quickly reactions proceed.
- Mass transport behavior: Viscosity and diffusion coefficients change with concentration, altering how quickly products and reactants move.
A useful mental model is to treat the cell voltage as a sum of several terms: equilibrium voltage, kinetic overpotentials, and ohmic losses. Concentration mainly shifts the kinetic and ohmic terms, and it can also change how evenly current distributes across the electrode.
What Changes Concentration During Operation
During discharge, the electrolyte composition evolves because reactions and side processes alter the local chemistry. Even if the bulk tank concentration is controlled, the near-electrode region can deviate due to:
- Electrolyte depletion or enrichment near surfaces from finite mixing.
- Gas-liquid interactions that affect local transport and wetting.
- Impurities that accumulate or precipitate depending on concentration and temperature.
If the cell is operated with limited circulation or poor mixing, the bulk concentration may look fine while the electrodes experience a different effective concentration. That mismatch shows up as rising voltage at constant current and uneven temperature patterns.
Control Targets and How to Measure Them
A practical control strategy uses measurable proxies that correlate with concentration:
- Specific gravity or density for bulk concentration tracking.
- Conductivity as a fast indicator of ionic strength.
- pH and titration when the chemistry includes multiple acid-base species.
- Temperature compensation for all concentration-related sensors.
Best practice is to calibrate sensors against prepared standards and to log both sensor readings and operating conditions. For example, a conductivity reading at 30°C is not directly comparable to one at 45°C without compensation.
Bulk Control Versus Local Control
Bulk control aims to keep the tank concentration within a narrow band. Local control aims to prevent near-electrode gradients.
- Bulk control example: If density drifts downward during extended discharge, you can add a concentrated make-up solution or reduce dilution from water addition. The key is to adjust based on measured drift rate, not just the current reading.
- Local control example: If voltage rises faster than density changes, you may have insufficient circulation. Increasing flow rate or improving mixing can reduce concentration gradients even when the tank concentration is correct.
A simple diagnostic is to compare voltage versus current and temperature versus current. If voltage increases while temperature stays relatively uniform, concentration or conductivity is often the culprit. If temperature hotspots appear, local transport or wetting issues may be dominating.
Advanced Details: Coupling with Water Balance
Concentration control is tightly coupled to water management. Adding water changes concentration immediately, but it also affects viscosity, gas solubility, and ion mobility. Conversely, removing water by evaporation or consumption shifts concentration upward.
A robust approach treats concentration and water balance as a coupled system:
- Use scheduled water additions only when sensor trends indicate net water loss.
- Use make-up electrolyte additions when concentration drift indicates net consumption of ionic species.
- Avoid “chasing” short-term noise by applying smoothing and minimum adjustment intervals.
Mind Map: Concentration Control Pathways
Example: Interpreting a Concentration Drift
Suppose a cell is held at 50 A for 6 hours. Density decreases by 0.5% while conductivity decreases by 0.8% after temperature compensation. Voltage at the end of the period is 120 mV higher than at the start.
A reasonable interpretation is that the electrolyte became less conductive, increasing ohmic losses. The next step is to check whether circulation flow remained constant and whether temperature stayed within a narrow band. If both are stable, the simplest fix is to correct bulk concentration using make-up electrolyte based on the measured density trend, then re-run the same current profile to confirm the voltage returns.
Example: When Bulk Looks Fine but Performance Doesn’t
In another case, density and conductivity remain within target bands, yet voltage rises steadily. Temperature is uniform, suggesting no major thermal runaway or localized boiling. The likely cause is a near-electrode concentration gradient from insufficient mixing or flow distribution.
A practical adjustment is to increase circulation slightly and verify that flow reaches all stack zones. If the voltage stabilizes after improving distribution, concentration control was effectively achieved locally even though bulk concentration never moved.
Practical Best Practices for Concentration Control
- Control concentration using trend-based adjustments rather than single-point corrections.
- Always apply temperature compensation to conductivity and density-derived concentration.
- Separate bulk drift from local gradient symptoms using voltage and temperature patterns.
- Treat water additions as part of the same control loop, not an independent habit.
- Log operating conditions so you can distinguish chemistry effects from flow and temperature effects.
4.3 Water Balance Methods for Stable Electrochemical Operation
Iron-air cells live and die by water management. In practice, “water balance” means keeping the electrolyte concentration and hydration state within a narrow band so ionic conductivity stays high and side reactions don’t run away. The goal is not perfect accounting down to the last drop; it’s repeatable control that tolerates real-world variability like temperature swings, imperfect seals, and air-side humidity.
Water Balance Foundations
Start with the simplest mental model: water moves between three places—electrolyte bulk, gas phase (air electrode exhaust), and any surfaces where condensation or evaporation can occur. During discharge, water is consumed or produced depending on the exact chemistry and operating conditions, while evaporation and crossover can shift concentration even if the electrochemical reaction itself were perfectly known.
A stable operating window typically requires:
- Electrolyte concentration staying near the target range.
- Electrolyte level staying within a defined band so electrodes remain properly wetted.
- Minimal dilution from leaks or excessive water carryover.
A practical best practice is to define two control variables: (1) electrolyte concentration proxy (often via density or conductivity) and (2) electrolyte inventory (often via mass or level). Then you measure both often enough that you can correct before performance drifts.
Measurement Strategy That Actually Works
Use a measurement stack that matches the physics:
- Concentration proxy: electrolyte density (hydrometer or densitometer) or conductivity with temperature compensation.
- Inventory proxy: tank mass (load cells) or level sensors calibrated to the actual geometry.
- Temperature tracking: every concentration measurement must be corrected for temperature because conductivity and density both shift.
Example: If density reads low after a hot day, you might assume “more water entered,” but you could also be seeing temperature effects. Correct density to a reference temperature first, then decide whether to add or remove water.
Mass Balance Control Loop
A robust method is to treat the system as a controlled mass balance. You track water additions and removals, and you reconcile them with measured inventory changes.
Core equation (conceptual):
- Change in electrolyte mass ≈ (water added) − (water removed) − (net losses to gas/structure) + (net leaks)
In an engineered system, net leaks are minimized by design, so the remaining terms are mostly controlled by your operating procedures.
Best practice: log water additions/removals alongside operating hours, current, and air flow. When you later see a concentration drift, you can tell whether it correlates with a specific operating mode (like high air flow during long discharge) or with a maintenance event.
Water Removal and Addition Methods
Water balance is usually corrected through one of three actions: add water, remove water, or adjust operating conditions to reduce unintended transfer.
- Add water carefully
- Use deionized water to avoid introducing ions that can change conductivity and corrosion behavior.
- Add slowly with mixing so you don’t create local concentration gradients.
- Re-measure concentration after mixing reaches equilibrium.
Example: After commissioning, you may start slightly concentrated. Add small increments, wait for stabilization, then confirm density and conductivity are back in range.
- Remove water when dilution accumulates
- Use controlled evaporation or a dedicated purge/condensation recovery path if the design includes it.
- Removal should be tied to measured concentration drift, not just time.
Example: If density keeps trending downward during high-load operation, you can increase condensation recovery efficiency or reduce water carryover by tuning air-side humidity management.
- Adjust operating conditions to reduce transfer
- Air-side humidity and flow affect how much water leaves with exhaust or condenses in the wrong places.
- Temperature gradients drive condensation and evaporation, so insulation and consistent thermal control matter.
Example: If exhaust lines are cooler than the cell stack, condensation can form and then drip unpredictably. Warming the lines to reduce condensation can stabilize water inventory without touching chemistry.
Advanced Details Without the Headaches
Electrolyte stratification: If the electrolyte isn’t well mixed, concentration can vary by height. A sensor at one location may look stable while another region drifts.
- Best practice: ensure mixing during correction events and verify with multiple sampling points during early commissioning.
Dynamic operating effects: Water balance can lag behind current changes. A short high-current test might not show the full drift until later.
- Best practice: run correction decisions based on trends over a defined window (for example, several charge/discharge cycles), not a single reading.
Air-side carryover: Water can be physically entrained in the gas stream.
- Best practice: use droplet separation where appropriate and monitor condensate volume as a diagnostic signal.
Mind Map: Water Balance Methods
Worked Example: Stabilizing After a Concentration Drift
Suppose density readings show a consistent downward trend over several cycles, even after temperature correction. First, check inventory: if level or mass also decreased, the system likely lost water to gas/structure. Next, check condensate volume and exhaust humidity; a higher condensate rate supports that conclusion. Then choose the smallest effective correction: increase condensation recovery or reduce air-side water carryover, and add deionized water only after confirming that the drift mechanism is addressed. Finally, confirm stability by observing that density returns to target and stays there through the next few cycles.
This approach keeps water balance grounded in measurements and cause-and-effect, so the cell doesn’t have to “guess” its way back to stability.
4.4 Impurity Sources and Mitigation Through Filtration and Handling
Iron-air cells are picky about what they let into the electrolyte and what they allow to stay in it. Impurities matter because they can (1) consume active species, (2) poison catalysts on the air side, (3) accelerate corrosion of structural parts, and (4) create deposits that block ion transport. The goal of filtration and handling is not “clean everything forever,” but to keep impurity levels low and stable enough that performance stays predictable.
Where Impurities Enter the System
Start with a simple inventory: impurities come from feedstock, from equipment surfaces, and from the environment.
- Feedstock impurities: Iron salts can carry trace metals (e.g., copper, nickel, chromium) and anions (chloride, sulfate) depending on source and grade. Even small chloride levels can increase corrosion risk.
- Water and make-up electrolyte: If water quality varies, dissolved ions and dissolved gases change. A practical example is switching from one water supplier to another; the cell may show a gradual voltage shift over days.
- Air-side contaminants: Dust, aerosols, and oil mist from compressors or blowers can reach the air electrode. These particles can foul gas diffusion layers and reduce oxygen utilization.
- Cross-contamination during maintenance: Residual cleaning agents, sealant residues, or metal shavings from repairs can end up in the electrolyte.
- Wear and corrosion products: Even with good materials, some dissolution occurs. Corrosion products can later act as nucleation sites for scale.
A useful mental model is “impurities are either dissolved, suspended, or deposited.” Filtration targets suspended particles; handling targets dissolved and reactive contaminants; both together reduce deposits.
What Impurities Do Inside the Cell
Impurities rarely cause one effect only.
- Catalyst poisoning: Trace metals or sulfur-containing species can reduce catalytic activity on the air electrode. You’ll often see higher polarization at the same current.
- Increased corrosion rate: Chloride and certain metal ions can break down protective films on structural materials.
- Scale and sludge formation: Hard-to-remove ions can combine with iron species to form insoluble solids. These solids increase internal resistance and can trap electrolyte.
- Gas-side fouling: Fine particles can clog pores in diffusion layers, raising pressure drop and reducing effective oxygen access.
A practical diagnostic approach is to compare trends: if voltage drops while temperature stays stable, suspect air-side fouling or catalyst effects; if voltage drifts with changes in conductivity or turbidity, suspect electrolyte contamination or precipitation.
Filtration Strategy That Matches Impurity Form
Filtration works best when you choose it based on particle size and chemistry.
- Pre-filtration for suspended solids: Use a coarse filter early in the process to protect finer stages. Example: if you observe visible haze in make-up electrolyte, start with a 50–100 µm stage before any tighter filter.
- Fine filtration for colloids: Colloidal particles can pass coarse filters. A tighter stage reduces turbidity but increases pressure drop, so size the filter housing and flow path to avoid starving the system.
- Cartridge selection for chemical compatibility: Filter media must resist the electrolyte’s pH and ionic strength. A common failure mode is media degradation that releases fibers or fines.
- Staged filtration during filling and top-up: Treat initial fill as a “cleaning moment.” For top-ups, use smaller, consistent filtration to prevent introducing new contaminants.
A simple rule: if you can see it, remove it early; if you can’t see it, measure it (turbidity, conductivity, or particle counts) and then choose the next filtration step.
Handling Practices That Prevent Re-Contamination
Even perfect filters can’t fix sloppy handling.
- Dedicated transfer lines: Use separate hoses and pumps for electrolyte and for cleaning solutions. Labeling is not bureaucracy; it prevents one wrong connection from turning into a week of troubleshooting.
- Closed transfer and covered storage: Keep electrolyte covered to reduce dust ingress and airborne aerosols.
- Controlled make-up procedures: Add make-up electrolyte slowly with mixing to avoid local concentration spikes that can trigger precipitation.
- Clean-in-place discipline: Rinse until conductivity and pH stabilize, then verify with a simple sample check before returning the line to service.
- Batch tracking: Record source, lot, and filtration settings for each make-up batch. When performance changes, you can trace it to a specific input.
Monitoring and Acceptance Checks
Filtration and handling become effective when you verify outcomes.
- Turbidity checks: A quick turbidity measurement on incoming make-up can catch contamination before it reaches the stack.
- Conductivity and pH: Track these to detect dissolved-ion shifts. Example: if conductivity rises after a maintenance event, investigate whether rinse water or cleaning residues were not fully removed.
- Visual inspection for haze or sediment: Simple, but powerful. If sediment appears in a sample vial, filtration alone may not be enough; you may need to adjust chemistry or improve mixing.
- Air-side cleanliness indicators: Monitor pressure drop across air paths; a rising trend often signals particulate fouling.
Mind Map: Impurity Control Workflow
Example: Preventing Chloride-Driven Corrosion
Suppose a site switches to a new water source for make-up. Within a few days, operators notice faster-than-usual corrosion signs and a gradual change in cell voltage behavior. The first step is to sample incoming make-up and compare conductivity and a simple chloride indicator test. If chloride is higher, tighten filtration where relevant and, more importantly, correct the make-up source or treatment so the electrolyte chemistry returns to the established baseline. This is a handling-and-input fix, not a “more filtration” fix, because dissolved chloride won’t be removed reliably by particle filtration.
Example: Fixing Air Electrode Fouling from Compressor Oil Mist
A blower replacement introduces a small oil mist issue. The air electrode sees fine aerosols that don’t look dramatic, but pressure drop across the air path rises over a week and oxygen utilization falls. The mitigation sequence is: verify air-side cleanliness, inspect and replace air filters upstream, and check whether any oil residues reached the electrolyte via condensation pathways. Then enforce closed air handling and routine filter inspection intervals tied to pressure drop thresholds.
4.5 Electrolyte Conditioning Procedures for Start Up and Maintenance
Electrolyte conditioning is the set of steps that brings the electrolyte to a known, stable chemical and physical state before you ask the cell stack to do real work. In iron-air systems, “known state” mainly means correct concentration, controlled water content, and low levels of contaminants that would otherwise slow reactions or accelerate corrosion. Think of it as calibrating the fluid, not just filling a tank.
Conditioning Goals and What “Good” Looks Like
Start-up conditioning aims to:
- Bring electrolyte concentration to the target range with minimal gradients.
- Stabilize water balance so the separator and air electrode do not swing between too dry and too wet.
- Remove or neutralize impurities introduced during manufacturing, transport, or prior maintenance.
- Verify that pumps, filters, and sensors are reading consistently.
A practical acceptance checklist uses measurable signals: concentration from titration or inline conductivity-to-concentration mapping, water content indicators (often via density and/or conductivity trends), and impurity proxies such as turbidity and filter loading.
Mind Map: Electrolyte Conditioning Workflow
Start-Up Procedure from Empty System to Ready State
Pre-Checks That Prevent “Mystery Chemistry”
Before any electrolyte touches the system, confirm that wetted surfaces are clean and compatible. Residual cleaning agents can change effective concentration and create local pH shifts. If you use inline sensors, verify their calibration with the same electrolyte batch or a validated standard. Also inspect hoses and fittings for dry-start damage; a tiny leak can look like “slow performance loss” later.
Example: If your conductivity sensor was calibrated with a different temperature than the tank will operate at, you may correct concentration incorrectly. The fix is simple: either calibrate at the expected operating temperature or apply the manufacturer’s temperature compensation consistently.
Fill and Circulate with Controlled Mixing
Fill the tank and circulate through the loop at a low-to-moderate flow rate to avoid introducing air pockets. Use a venting step at the highest points in the loop. Trapped air can cause local oxygen exposure and uneven wetting, which then shows up as early voltage irregularities.
Example: During commissioning of a modular stack, operators sometimes fill one module’s loop first. If the other modules remain dry, the electrolyte can stratify in the tank. A short recirculation with the full loop connected prevents concentration gradients.
Adjust Concentration Using Measured Corrections
Conditioning should be based on measurements, not on “how much you added.” Take representative samples from the tank after mixing has stabilized. Correct concentration in small increments, allowing time for equilibration before re-sampling.
Example: Suppose titration shows concentration 3% low. Add the calculated correction volume, but do not immediately start the stack. Wait for mixing time, then sample again. If you skip the wait, you may overshoot and later spend time correcting back.
Stabilize Water Balance Through Temperature and Hold Time
Water content affects ionic transport and electrode wetting. Conditioning should therefore include a temperature stabilization step and a hold period where the electrolyte circulates without aggressive electrochemical loading. Monitor density and conductivity trends; they should settle rather than drift.
Example: If density keeps decreasing while conductivity rises during the first hour, you likely have ongoing temperature equilibration or incomplete mixing. Start-up should pause until the trend flattens, because early electrochemical operation will amplify any imbalance.
Filter and Polish to Reduce Contaminant Effects
Run filtration during conditioning, not only during operation. Start with coarse filtration to remove larger particulates, then use finer polishing if differential pressure and turbidity indicate fine contamination. Track differential pressure across filters; a sudden rise can signal precipitation or trapped air.
Example: After maintenance, a filter differential pressure spike can indicate that a seal fragment or gasket material entered the loop. Conditioning should include a flush-through step before returning to normal circulation.
Verification Run with Low-Current Diagnostics
Before full dispatch, perform a short low-current test to confirm that voltage response is stable and that there are no abnormal signs such as persistent oscillations or unexpected temperature rise. Compare the results to a baseline from the same stack design.
Example: If the cell voltage is consistently lower than baseline at the same current, it can indicate concentration mismatch or sensor scaling error. If voltage is noisy, suspect air entrainment or uneven wetting.
Maintenance Conditioning Triggers and Actions
Maintenance conditioning should be triggered by evidence, not by calendar alone. Use these common triggers:
- Differential pressure across filters increases beyond your established threshold.
- Concentration readings drift while temperature is stable.
- Performance drops at the same current and temperature.
Actions follow the same logic as start-up: flush lines if needed, replace filters and any degraded seals, re-check concentration and water balance, then run a brief verification cycle.
Example: If concentration drift is detected after a seal replacement, the most likely cause is incomplete mixing after the refill. The corrective action is to re-circulate and re-sample until measurements converge, rather than immediately adjusting chemistry again.
5. Air Handling Design for Efficient Oxygen Access
5.1 Air Electrode Gas Transport Requirements and Flow Regimes
Iron-air cells need oxygen to reach the air electrode at the right rate, with the right humidity, and with minimal pressure loss. Gas transport is not just “getting air in”; it is managing three coupled resistances: (1) bulk flow through the air path, (2) diffusion and convection inside the electrode structure, and (3) interfacial mass transfer at the catalyst surface. When any one of these becomes limiting, voltage drops show up as higher overpotential—often before you notice anything else.
What “Good Transport” Means in Practice
Start with the oxygen demand implied by current. A simple rule of thumb: higher current means more oxygen consumption per unit time. If oxygen supply cannot keep up, the local oxygen partial pressure near the catalyst falls, and the cell behaves as if it has “run out of air,” even though the tank is full.
A second requirement is water management. The air electrode and gas path must avoid both flooding and excessive drying. Flooding blocks pores and increases transport resistance; excessive drying can shift electrolyte behavior and raise internal resistances. The goal is stable humidity at the electrode interface, not maximum dryness.
Finally, pressure drop matters because it sets the energy cost and the ability to maintain flow under changing conditions. A design that works at one flow rate but collapses under real operating variability is a design that will disappoint during commissioning.
Flow Regimes and Why They Matter
Gas flow regimes describe how momentum and mixing behave in the air path and how that behavior translates into oxygen delivery.
- Laminar-like flow tends to have predictable velocity profiles but limited mixing. Oxygen concentration gradients can persist, especially in long or narrow channels.
- Transitional flow improves mixing and reduces stagnant zones, but it can be sensitive to small geometry changes.
- Turbulent flow increases mixing and helps homogenize oxygen concentration, but it also increases pressure drop and can drive unwanted condensation patterns if humidity is not controlled.
In many air-electrode designs, the air path is engineered so that the bulk flow is not the only transport mechanism. The electrode itself is porous, so diffusion through pores and convection within the pore network often dominate near the catalyst. That means you can’t judge performance by the air duct alone.
System-Level Transport Requirements
Think in terms of “supply versus demand” and “resistance versus operating point.”
- Oxygen partial pressure at the electrode: Maintain sufficient oxygen fraction and avoid local depletion. A practical check is to ensure the design oxygen utilization per pass stays in a range that does not create steep gradients across the electrode.
- Mass transfer coefficient: This captures how effectively oxygen moves from the gas phase to the catalyst surface. It depends on flow velocity, pore structure, and humidity.
- Pressure drop budget: Allocate allowable pressure loss across the manifold, channels, and electrode housing. If the blower can’t maintain the target flow under worst-case conditions, the cell will operate in a transport-limited regime.
- Humidity stability: Control condensation risk by managing temperature differences and by ensuring the gas path does not become a cold trap.
Electrode-Level Transport Mechanisms
Within the electrode, oxygen must travel through a porous medium. Two effects typically compete:
- Diffusion through pores: Slower but reliable when pores remain open.
- Convection through the pore network: Faster when flow paths are well-connected and not blocked.
Flooding reduces effective pore connectivity, pushing the system toward diffusion-only transport. That raises the concentration polarization and makes voltage more sensitive to current.
Mind Map: Gas Transport Requirements and Flow Regimes
Example: Choosing a Flow Target Without Guessing
Suppose you plan to run at a fixed current and you can vary blower flow. If the cell voltage changes noticeably when you increase flow by a modest amount, you are likely in a regime where oxygen delivery is not fully saturated. You can treat this as a diagnostic: increase flow until the voltage-current curve stops improving significantly. That plateau indicates the transport resistance has moved away from bulk supply and toward electrode interfacial behavior.
Now add humidity constraints. If increasing flow also changes temperature or dew point enough to cause condensation, you may see voltage improve briefly and then degrade as pores flood. The correct flow target is therefore the one that achieves the voltage plateau while keeping humidity conditions stable at the electrode.
Example: Recognizing Flooding Through Flow Behavior
If you observe that higher flow initially helps but then performance collapses at sustained operation, flooding is a likely cause. Higher flow can increase liquid carryover or wetting in the electrode housing, blocking pores. A useful operational check is to compare voltage recovery after a controlled reduction in flow and stabilization time; rapid recovery suggests transport blockage rather than irreversible catalyst loss.
Practical Design Takeaways
Design the air path and electrode together. Bulk flow regime influences mixing, but the porous electrode determines whether oxygen can reach the catalyst without concentration gradients and without pore blockage. Treat pressure drop and humidity as first-class constraints, not afterthoughts. When you validate with controlled flow and current steps, you can map whether the system is supply-limited, diffusion-limited, or flooding-limited—each with a distinct signature in how voltage responds.
5.2 Humidity Control and Condensation Avoidance in Air Paths
Humidity control in an iron-air system is mostly about preventing liquid water from forming inside the air path. Condensation is the enemy because it blocks oxygen transport, dilutes local gas composition, and can create unwanted electrolyte carryover routes. The goal is simple: keep the air electrode environment above the local dew point and keep water where it belongs—either in the electrolyte reservoir or in a controlled drain.
Foundational Concepts That Drive Design
Water in the air stream exists as vapor and, when conditions allow, as liquid droplets. The dew point is the temperature at which the vapor in a gas mixture begins to condense. In practice, condensation happens when the air temperature drops below the dew point somewhere along the flow path, such as across a cold manifold wall, near a heat exchanger, or at a throttling section where local cooling occurs.
Two design levers matter most:
- Temperature management: reduce cold spots and avoid sharp thermal transitions.
- Moisture management: control inlet humidity and remove water before it accumulates.
A useful mental model is to treat the air path like a “temperature gradient plus a moisture budget.” If the moisture budget is too large for the available temperature margin, droplets appear.
Air Path Moisture Budget and Where Water Comes From
Even if the inlet air is dry, water can enter the system through several paths:
- Ambient humidity: outdoor air often carries enough moisture that dew point can be close to operating temperatures.
- Electrochemical and thermal effects: the stack can cool or heat the air locally, shifting dew point relative to wall temperature.
- Leaks and mist carryover: small leaks or aerosol formation can deposit water in ducts.
Best practice is to assume moisture will show up somewhere and design for it. That means planning for drainage, not just “hoping it stays dry.”
Temperature Control Strategies That Prevent Dew Point Crossings
Start by mapping likely cold surfaces. Manifolds, fittings, and sections near insulation breaks are common suspects. Then apply these practices:
- Insulate and thermally couple: keep air-path walls closer to the bulk air temperature to reduce local wall cooling.
- Avoid abrupt expansions: sudden flow area changes can create local pressure drops and temperature shifts.
- Use gradual bends and smooth transitions: they reduce turbulence-driven mixing that can cool gas near walls.
A practical example: if your air path includes a long run of uninsulated tubing, the outer wall can cool toward ambient. Even when the bulk air is warm, the wall may cross the dew point and form droplets. Adding insulation to the tubing and fittings often fixes the issue without changing the fan.
Humidity Control Strategies That Keep the Moisture Budget Small
Humidity control can be passive or active.
- Passive inlet conditioning: if the system draws from a humid environment, consider using a desiccant or a simple pre-drying step at commissioning. The aim is to lower inlet dew point so the air path has more temperature margin.
- Active control using sensors: place humidity and temperature sensors at the inlet and near the most vulnerable section. Use the readings to adjust flow rate or conditioning duty.
A concrete workflow: measure inlet temperature and relative humidity, compute dew point, then compare it to the minimum expected wall temperature. If the margin is small, increase insulation coverage or reduce the time air spends in cold regions by rerouting or changing flow path geometry.
Condensation Management Through Drainage and Geometry
Even with good control, some water may appear. The design should move it away from oxygen transport surfaces.
- Slope ducts toward drains: ensure low points exist only where a drain is installed.
- Use drip legs and condensate traps: place them where droplets are likely to form, not where they would be swept into the air electrode.
- Keep drains accessible: a drain that cannot be serviced becomes a future mystery.
Example: a horizontal manifold with no slope can collect a thin film of water. That film can spread across internal surfaces and reduce effective gas diffusion. Adding a slight slope and a drain at the lowest point prevents pooling.
Instrumentation That Turns “Dry Enough” Into Measurable Control
To avoid guesswork, instrument the air path with:
- Temperature sensors at inlet, near the air electrode, and at the most thermally sensitive manifold section.
- Humidity measurement at inlet and at least one downstream location.
- Differential pressure across the air electrode region to detect water blockage indirectly.
A simple diagnostic: if humidity rises downstream while differential pressure increases, you likely have condensation or water accumulation reducing flow area. If humidity rises but pressure stays stable, the issue may be mixing or sensor placement rather than blockage.
Mind Map: Humidity Control and Condensation Avoidance
Example: A Systematic Fix for Repeated Condensation
Suppose condensation appears during morning start-up when ambient air is cooler and more humid. The first step is to compare inlet dew point to the minimum measured air-path wall temperature during start-up. If the wall is below dew point, insulation and thermal coupling are the priority. Next, check whether the air path has any low points without drains. If droplets are pooling, add slope and a condensate trap at the lowest section. Finally, verify with differential pressure trends: if pressure spikes after condensation begins, the water is likely interfering with oxygen diffusion, and the drainage changes should reduce both the droplet evidence and the pressure rise.
The best designs treat condensation as a controllable event rather than a surprise. When temperature margin, moisture budget, and drainage are aligned, the air path stays dry where it matters and wet where it can be managed.
5.3 Pressure Drop Management and Fan or Blower Sizing
Iron-air stacks depend on steady oxygen delivery to the air electrode. In practice, the air path is a chain of resistances: inlet filters, manifolds, flow channels, humidification or dehumidification elements, and exhaust. Pressure drop matters because it determines the fan or blower power and because uneven pressure across the stack can create uneven oxygen utilization.
Start with the foundational idea: pressure drop is the “cost” of pushing air through restrictions. For most components in this chapter, the relationship between flow rate and pressure drop is approximately quadratic, meaning doubling flow can increase pressure drop by about four times. That nonlinearity is why sizing with a comfortable margin is cheaper than trying to fix it later with oversized fans or throttling.
Pressure Drop Accounting from Inlet to Electrode
Treat the air system as series elements. Total pressure drop is the sum of each element’s drop at the operating flow.
- Inlet and filtration: Filters add resistance that rises as they load with dust. A good practice is to size the fan for the “dirty” filter condition, not the clean one.
- Manifolds and distribution plates: These create pressure gradients if flow paths differ in length or cross-section. Even small geometric asymmetries can cause noticeable flow imbalance.
- Flow channels and air electrode backing: The electrode backing and channel surfaces dominate resistance when designed for uniform distribution.
- Exhaust and any condensate handling: Condensate can partially block passages, increasing pressure drop and reducing oxygen delivery.
A practical workflow is to measure or estimate each element’s pressure drop curve versus flow, then sum them. If you only have one operating point, you can still proceed by assuming a quadratic trend and validating it with a single additional measurement.
Flow Uniformity and Why Pressure Drop Is Not Just About Power
Uniform oxygen utilization requires similar local flow conditions across cells or stacks. If one region has lower resistance, it will take more flow, leaving other regions oxygen-starved. The result is not only lower average performance; it can also increase degradation in the starved regions due to operating outside intended electrolyte and air-side conditions.
A simple rule of thumb is to design the distribution so that the pressure drop across the “distribution network” is a meaningful fraction of the total available pressure. If the distribution network drop is too small, small manufacturing tolerances dominate the flow split. If it is too large, the fan must work harder than necessary.
Fan or Blower Sizing with a Real Operating Point
Sizing is easiest when you define an operating point that matches the stack’s oxygen demand. Oxygen demand depends on current draw, air electrode utilization targets, and acceptable humidity and temperature ranges. Once you know the required air flow rate, you can determine the required static pressure.
Use the fan curve concept: a fan provides a pressure that decreases as flow increases. The system curve rises with flow because pressure drop increases through the air path. The operating point is where the two curves intersect.
Key sizing practices:
- Include margin for filter loading and condensate. A common approach is to add a pressure margin so the fan can maintain flow when the filter is partially loaded.
- Avoid operating at the edge of the fan’s efficiency island. Efficiency drops when you run far from the fan’s intended operating region, and power consumption becomes a direct penalty.
- Account for altitude and temperature. Air density changes affect volumetric flow and fan performance.
Condensation and Pressure Drop Coupling
Humidity control is not separate from pressure drop. When air cools below its dew point, water forms and can block small passages. That blockage increases pressure drop and reduces flow, which then reduces oxygen delivery and can push the system into a less stable operating regime.
Mitigation is mostly mechanical and operational:
- Keep air paths insulated where temperature gradients are likely.
- Ensure drainage paths exist where condensate can form.
- Use sensors to detect rising pressure drop trends that correlate with wetting.
Example: Sizing a Blower for a Stack Air Path
Assume you need 0.8 m³/s of air at the stack inlet. You estimate pressure drops at that flow:
- Filter: 120 Pa
- Manifold and distribution: 180 Pa
- Flow channels and electrode backing: 420 Pa
- Exhaust and condensate handling: 90 Pa
Total system pressure drop is 120 + 180 + 420 + 90 = 810 Pa.
Now add a margin for filter loading and minor wetting, say 20%, giving 972 Pa required static pressure.
Select a blower whose fan curve can deliver 0.8 m³/s at about 1,000 Pa with acceptable efficiency. If the blower only reaches 900 Pa at that flow, you have two options: increase fan speed (if allowed) or reduce system resistance (for example, by improving channel uniformity or reducing unnecessary bends). Throttling after the fan is usually a last resort because it wastes energy.
Mind Map: Pressure Drop Management and Fan Sizing
Quick Checks That Prevent Common Failure Modes
- If measured pressure drop rises faster than expected with time, suspect filter loading or partial wetting.
- If oxygen utilization varies across the stack, suspect distribution imbalance rather than insufficient total flow.
- If the fan runs hot or draws more power than predicted, verify that the operating point matches the fan curve intersection and that dampers or throttles are not quietly doing the work of a poorly sized system.
5.4 Gas Distribution Manifolds and Leak Tightness Practices
Iron-air cells depend on a steady, controllable oxygen supply. In practice, the “air side” is a small ecosystem: manifolds spread flow evenly, seals prevent electrolyte mist from escaping, and leak-tightness keeps oxygen utilization measurable instead of guesswork. This section explains how to design manifold layouts that distribute gas predictably, then how to verify and maintain leak tightness with methods you can repeat during commissioning and routine service.
Foundational Concepts for Manifold Behavior
A manifold’s job is to convert a blower’s uneven pressure and flow into a uniform oxygen delivery across multiple air electrodes. Uniformity is mostly about pressure drop distribution. If one branch has lower resistance, it will steal flow, starving other branches and skewing cell voltages.
A practical rule: design so that the pressure drop across the manifold branches is large compared with the pressure variation you expect from blower control. For example, if your blower control can swing supply pressure by ±5%, aim for branch pressure drops on the order of 20–30% of the nominal supply-to-electrode differential. That way, small supply changes don’t translate into big branch imbalances.
Manifold Layout Principles
Start with a clear flow path: blower outlet → air conditioning (if used) → inlet manifold → branch lines → air electrode plenums → exhaust manifold → exhaust or recirculation loop. Keep the layout symmetric whenever possible.
Key practices:
- Use equal-length branch runs where feasible. If you cannot, compensate with additional restriction (a calibrated orifice or fixed flow restrictor) so each branch sees the same effective resistance.
- Avoid sharp area changes near branch takeoffs. Sudden expansions or contractions create local turbulence that can shift flow distribution.
- Place measurement points where they represent the system, not a corner. A common approach is to measure supply manifold pressure and one representative branch pressure, then infer distribution stability.
- Plan for condensate. If humidity is high, water can collect in low points. Provide drain features at the lowest locations and keep branch takeoffs above likely condensation zones.
Leak Tightness Targets and Why They Matter
Leaks do two harmful things at once: they reduce oxygen delivery efficiency and they introduce uncontrolled paths for electrolyte mist or humid air. Even small leaks can distort oxygen utilization calculations and complicate troubleshooting.
Define targets in terms of measurable outcomes. For example, you can set acceptance criteria based on a maximum allowable pressure decay over a fixed time window for a sealed test volume, plus a maximum allowable mist detection rate during a controlled run.
Sealing Strategy Across Interfaces
Manifolds include multiple interface types: flange joints, gasketed covers, threaded fittings, and penetrations for sensors or drains. Treat each interface as a separate risk.
Best practices:
- Choose gasket materials compatible with electrolyte exposure and the expected temperature range. A gasket that survives chemical contact but swells under humidity can still fail.
- Use torque-controlled assembly. Over-tightening can deform gasket surfaces; under-tightening leaves microchannels.
- Prefer double barriers for penetrations that cross from wet to dry zones. For instance, a sensor port can use a primary seal plus a secondary O-ring or sealant layer.
- Keep sealants out of flow paths. Loose sealant fragments can clog restrictors or foul air electrode surfaces.
Pressure Testing and Leak Detection Workflow
A systematic commissioning sequence prevents “fixing” leaks that were never found.
- Static integrity test: isolate the manifold section and apply a controlled pressure (or vacuum) within safe limits. Record pressure decay over a defined interval.
- Soapy solution or tracer check: for suspected joints, use a method that can localize leaks without contaminating sensitive areas.
- Functional run verification: during a low-to-moderate load operation, monitor manifold pressure stability and compare branch behavior. If one branch voltage drifts while others remain stable, suspect a leak or a restriction imbalance.
A simple example: suppose a multi-branch manifold shows a consistent voltage drop on one electrode group. First confirm that branch pressure is similar to its neighbors. If it is, the issue may be electrode performance; if it is lower, check for a leak at that branch’s connection or a partially blocked restrictor.
Maintenance Practices That Prevent Recurring Leaks
Leaks often return after service because the system is reassembled slightly differently each time. Reduce variability:
- Mark gasket orientation and mating surfaces so parts go back the same way.
- Replace gaskets on disassembly when the design allows. Reusing compressed gaskets is a common source of “mystery” leaks.
- Inspect for corrosion at fasteners. Corroded threads can prevent consistent torque.
- Document torque values and test results per manifold section so you can spot drift between service cycles.
Mind Map: Gas Distribution Manifolds and Leak Tightness Practices
Example: Designing a Four-Branch Manifold That Stays Balanced
Imagine a stack with four air electrode groups fed from one inlet manifold. You choose branch lines with equal length and add fixed restrictors so each branch has the same total resistance. During commissioning, you run a static pressure decay test on the manifold section and pass it. Then, during a low-load functional run, you compare branch pressures: if one branch shows a lower pressure than the others by more than your tolerance, you inspect that branch’s restrictor and connection first. If the restrictor is clear but the joint shows mist during a localized check, you re-seat the gasket with torque control and re-run the static test.
This approach keeps the system’s behavior explainable: either the branch resistance matches the design, or the test results point to where it doesn’t.
5.5 Monitoring Oxygen Utilization and Diagnosing Air-Side Limits
Oxygen utilization is the fraction of supplied oxygen that actually participates in the air electrode reaction during discharge. In practice, you monitor it indirectly through stack voltage behavior, air-side flow and pressure signals, and electrolyte conditions that affect reaction kinetics. The goal is not to chase a single number, but to detect when the air side stops being “in supply” and starts being “in the way.”
Foundational Signals That Connect Oxygen to Performance
Start with three measurements that are easy to obtain and hard to misinterpret:
- Air flow rate at the inlet and, if possible, differential flow across the air distribution.
- Inlet and outlet oxygen partial pressure or a proxy such as humidity and total pressure with a calibrated oxygen fraction assumption.
- Stack voltage and current at steady operating points.
A simple operational check is to hold current constant and step the air flow in small increments. If voltage improves with more flow at the same current, oxygen access is limiting. If voltage barely changes, you are likely limited by something else such as electrolyte transport, catalyst activity, or electrical losses.
Oxygen Utilization Calculation That Stays Practical
For a first-pass utilization estimate, compute the oxygen molar feed from measured dry-air flow and oxygen fraction, then compare it to oxygen consumption inferred from the cell’s electrochemical current.
- Electrochemical oxygen demand follows Faraday’s law. For the overall reaction, oxygen consumption is proportional to charge passed.
- Oxygen feed comes from air flow and oxygen concentration.
Because real systems have humidity, leaks, and imperfect mixing, treat the result as a diagnostic index rather than a lab-grade accounting. A useful rule: if utilization rises when you increase flow, the system was previously oxygen-starved; if utilization stays flat while voltage worsens, the air side may be choking or uneven.
Mind Map: Oxygen Utilization Monitoring and Diagnosis
Diagnosing Oxygen-Starved Operation
Oxygen-starved conditions show up as a consistent pattern: at fixed current, increasing air flow reduces voltage loss. You can confirm with a utilization index that increases with flow until it plateaus.
Example: During a discharge test, the stack runs at 200 A. At 1.0× nominal air flow, the voltage sag is large. When you raise flow to 1.2×, voltage improves and the utilization index increases. When you raise flow further to 1.4×, voltage changes little and utilization plateaus. That plateau marks the point where oxygen access is no longer the bottleneck.
Best practices here are boring but effective: keep current constant during comparisons, allow the system to reach steady temperature, and log at least several minutes of data per flow setpoint so you don’t confuse transient mixing with true limitation.
Diagnosing Air-Side Choking and Pressure-Drop Limits
Choking is different from oxygen starvation. In choking, the system cannot move additional air even if you command it. Pressure drop across the air path rises quickly, and voltage may worsen because the electrode experiences non-uniform gas transport.
Example: You command air flow from 1.0× to 1.3× nominal. The flow sensor reports only a small increase, while differential pressure climbs. Voltage loss increases slightly. This combination suggests restriction in filters, valves, or manifolds. A quick check is to compare inlet pressure, outlet pressure, and flow sensor readings for consistency; if the flow sensor is “happy” but pressure drop indicates restriction, suspect a clogged component or a partially closed valve.
Diagnosing Distribution Problems Across Modules
Even when total flow is correct, poor distribution can leave parts of the air electrode underfed. If your system has multiple modules or zones, compare utilization indices and voltage behavior per zone.
Example: Two adjacent modules share the same air manifold. Module A shows strong voltage improvement with increased flow; Module B shows little change. That asymmetry points to uneven manifold flow, a leak that bypasses one zone, or a blockage in one branch. The fix is usually mechanical: verify manifold balancing orifice settings, inspect gaskets, and confirm that branch lines have similar pressure drops.
Diagnosing Condensation and Flooding on the Air-Side
Condensation reduces effective gas transport by blocking pores and changing local reaction conditions. Flooding often appears as humidity spikes, pressure-drop oscillations, and increased voltage noise.
Example: During a humid day, the outlet humidity rises and differential pressure starts to oscillate every few minutes. Voltage noise increases even though current is steady. Reducing inlet humidity or adjusting temperature control can stabilize the air path. If the oscillations persist, inspect for water accumulation in low points and verify that drains are functioning.
Operational Checklist for Limit Detection
Use a repeatable sequence during commissioning and routine checks:
- Sensor sanity: confirm flow and pressure signals move together logically.
- Steady-state sweep: step air flow at constant current and temperature.
- Sensitivity test: note voltage-flow slope and pressure-drop slope.
- Utilization index trend: look for plateau versus monotonic rise.
- Air-side symptom match: map the observed pattern to oxygen-starved, choking, distribution, or flooding.
When you record these patterns consistently, diagnosing air-side limits becomes less about guessing and more about matching signatures. The air system is usually telling the truth; the trick is listening with the right combination of measurements.
6. Electrical Design for Safe High Current Operation
6.1 Cell Interconnection Topologies and Current Sharing Practices
Iron-air stacks are usually built from many cells that must behave like one electrical unit. The hard part is that cells rarely match perfectly: internal resistance varies with electrolyte condition, air-side wetting, and manufacturing tolerances. Interconnection topology and current-sharing design decide whether those differences stay small or grow into uneven aging.
Foundational Concepts for Current Sharing
Current sharing is about how the same stack current distributes across parallel paths. If one path has lower resistance, it takes more current, heats more, and often degrades faster—so the imbalance can amplify. The goal is to make the electrical network “forgiving” so that small cell differences do not translate into large current differences.
Two quantities guide design: (1) the cell’s effective resistance under operating conditions, and (2) the voltage spread between cells at the same state of charge. In practice, you can’t measure resistance directly in the field, but you can observe voltage behavior at a fixed current and compare cell-to-cell voltage dispersion.
Series, Parallel, and Hybrid Topologies
Series-only stacks are simplest: cells are connected end-to-end so the same current flows through every cell. This guarantees current equality, but it increases voltage and makes the stack sensitive to any single weak cell that limits performance.
Parallel-only banks share current, but they require careful balancing because voltage differences drive current redistribution. Without mitigation, one branch can dominate.
Hybrid series-parallel is the common compromise: cells are grouped into series strings to control voltage, and those strings are paralleled to reach the desired current rating. The current-sharing problem then shifts to the string level.
String-Level Current Sharing Practices
A practical approach is to design each parallel string to be as electrically similar as possible. That means equalizing: (a) number of cells per string, (b) conductor lengths and cross-sections, and (c) contact resistances at string junctions.
A simple rule of thumb: treat every milliohm of unintended series resistance as a “hidden knob” that changes how current splits. If one string has longer busbars or more joints, it will likely carry less current at the same stack voltage.
To reduce sensitivity, use symmetrical busbar routing. Keep the physical layout mirrored so that thermal gradients and conductor resistance are similar. Also minimize the number of bolted joints in the high-current path; each joint adds contact resistance that can vary with torque and surface condition.
Cell-Level Current Sharing Practices
When cells are paralleled directly (less common in large stacks), you need explicit current balancing. Two techniques are widely used:
-
Intrinsic resistance balancing: add small, controlled series resistances so current differences create compensating voltage drops. The resistors can be implemented as busbar geometry (intentional length/width) or as discrete elements designed for the current and temperature.
-
Active balancing: measure each cell voltage and adjust current with power electronics. This is more complex and usually reserved for smaller systems or special configurations.
For iron-air stacks, intrinsic balancing is often preferred because it is passive and robust. The key is to choose a balancing resistance large enough to dominate over mismatch, but small enough to avoid excessive losses.
Voltage Monitoring and Diagnostic Logic
Even with good design, you need a way to detect imbalance early. A useful diagnostic is to track cell voltage dispersion at a fixed operating point. For example, during a steady discharge at a defined current, record each cell’s voltage and compute max-min spread.
If dispersion grows over time, it can indicate air-side flooding/drying differences, electrolyte stratification, or contact degradation. If dispersion appears immediately after commissioning, it often points to assembly or busbar mismatch.
Mind Map: Interconnection and Sharing
Example: Designing a Two-String Parallel Stack
Suppose you need a stack current of 200 A. You build two identical series strings rated for 100 A each, then parallel them.
Best practice steps:
- Use the same number of cells per string.
- Route the main busbars with equal lengths from the common node to each string.
- Ensure the same number of joints and the same joint type on both strings.
- During commissioning, run a short steady discharge at a moderate current and measure string voltages. If one string voltage is consistently lower by more than expected from measurement noise, it likely has lower series resistance and will carry more current.
If you observe imbalance, the first fixes are mechanical and electrical: re-check joint torque, verify conductor lengths, and confirm that the busbar layout is truly symmetric. Only after that should you consider adding controlled series resistance to the higher-current string path to restore balance.
Example: Passive Balancing with Intentional Series Resistance
If two cells are paralleled directly and their effective resistances differ, you can add a small series resistor to each cell path. Choose the resistor so that at the target current, the voltage drop across the balancing element is larger than the voltage difference caused by expected mismatch.
For instance, if you expect a 5 mV difference between cells at operating current and you want the balancing element to dominate, you might target a balancing drop of 20–30 mV at that current. This makes the current split less sensitive to cell-to-cell variation, at the cost of some extra heat in the balancing resistors.
6.2 Busbar Layout and Contact Resistance Reduction Techniques
Busbars are the “highway system” for current leaving the stack. In iron-air systems, the current can be steady for long periods, so small resistances turn into noticeable voltage loss and heat. The goal is simple: keep current paths short, keep current evenly shared, and keep every interface tight, clean, and mechanically stable.
Foundational Concepts for Low-Resistance Current Paths
Start with the resistance you can’t ignore: contact resistance. Even when the busbar material is low-resistance, a loose interface can dominate the total. Treat every joint—bolt-to-busbar, busbar-to-shunt, shunt-to-cell lead—as a potential bottleneck.
A practical rule: design for uniform current distribution before you optimize materials. If one parallel path carries more current, it will heat more, which increases resistance, which increases current imbalance. That loop is why “good enough” layouts sometimes underperform.
Layout Principles That Prevent Uneven Current Sharing
Use a star-like approach only when currents are small. For high currents, prefer a busbar topology that mirrors the stack’s electrical symmetry. If the stack has multiple cell strings, route busbars so each string sees the same conductor length and the same number of joints.
Keep conductor runs straight and avoid unnecessary bends. Every bend adds mechanical stress and can create micro-gaps at joints after thermal cycling. If you must route around equipment, use smooth radii and support the busbar so it doesn’t “hang” between connection points.
Thermal layout matters too. Place joints where they can be inspected and where airflow or heat sinking is predictable. A joint buried under wiring can be electrically fine and mechanically neglected, which is how problems grow quietly.
Contact Resistance Reduction at Every Joint
Contact resistance is strongly affected by surface condition, contact pressure, and contact area. The most common failure mode is not corrosion alone; it’s insufficient pressure or contamination that prevents real metal-to-metal contact.
-
Surface preparation: Remove oxides and residues before assembly. Use a consistent cleaning method and avoid touching cleaned surfaces with bare hands.
-
Joint pressure: Use torque values that match the hardware and conductor material. Under-torqued joints can loosen under vibration and thermal expansion; over-torqued joints can deform surfaces and reduce effective contact area.
-
Contact area: Use overlapping interfaces sized for the current density you expect. Larger contact area reduces current crowding at the interface.
-
Material pairing: Choose compatible metals for busbars and fasteners to reduce galvanic effects. If dissimilar metals are unavoidable, use appropriate coatings or interlayers designed for electrical contact.
-
Spring behavior: For systems that cycle temperature, include design features that maintain pressure over time, such as Belleville washers or controlled clamping stacks.
Mechanical Stability That Survives Thermal Cycling
A low-resistance joint is not just an electrical interface; it’s a mechanical assembly. Provide rigid supports so busbars don’t flex during operation. If the busbar can move, the joint will micro-slip, which increases resistance and accelerates wear.
Use insulating standoffs and supports rated for the operating environment. Ensure that cable and harness forces do not pull on busbar terminals. A simple check during assembly: after tightening, gently apply force to nearby cables and confirm the busbar does not shift.
Instrumentation and Shunt Placement for Accurate Measurements
Voltage drop measurements are only useful if you measure where the loss happens. Place voltage sense leads close to the current-carrying surfaces, not at the far end of a harness. For shunts, mount them so the current enters and exits symmetrically, and route sense wires separately from high-current conductors to reduce noise.
If you use four-wire (Kelvin) sensing, keep the sense connections tight and protected from moisture. A “perfect” busbar with a sloppy sense connection will still report misleading performance.
Mind Map: Busbar Layout and Contact Resistance
Example: Designing a Parallel Busbar for Four Cell Strings
Assume four cell strings each need 500 A. If you route one string with a 0.3 m busbar run and another with 0.6 m, the longer path has roughly double the conductor resistance, even before considering joints. The result is that the longer path runs hotter, which increases resistance further.
A better approach is to set the busbar lengths equal by design: mirror the routing so each string has the same conductor length, the same number of joints, and the same clamping style. Then use identical joint hardware and torque procedures for all four interfaces. Finally, measure voltage drop across each string at commissioning using sense leads placed at the joint surfaces.
Example: Fixing a Hot Joint Without Guessing
If a joint runs hotter than neighbors, don’t immediately replace parts. First, verify torque marks and check for visible contamination or oxide at the interface. Next, confirm that the busbar is supported so it cannot flex at that joint. Then re-clean and reassemble with the same hardware, using controlled clamping pressure.
After rework, log the voltage drop across the joint at a fixed current. A successful repair shows a measurable reduction in voltage drop and a temperature profile that matches nearby joints under the same operating load.
6.3 Protection Systems for Overcurrent Ground Fault and Isolation
Iron-air systems combine high DC currents, conductive plumbing, and wet electrolyte handling. Protection has to do two jobs at once: stop electrical hazards quickly and keep the battery from continuing to stress damaged components. The goal is not just “trip and pray,” but predictable behavior that operators can verify during commissioning.
Foundational Concepts for Protection Design
Start with what must be detected and what must be isolated. Overcurrent covers conditions where current exceeds what the stack and conductors can safely carry. Ground fault covers unintended current paths to chassis, piping, or earth. Isolation covers the ability to disconnect the battery from the rest of the electrical system so maintenance is safe and so faults do not propagate.
A practical rule: design protection around energy and time. A short circuit is a time-limited event with high peak current; a ground fault can persist long enough to heat insulation and corrode structures; isolation failures can keep a “dead” system still energized through leakage paths.
Protection Philosophy and Layering
Use layered protection so no single device must be perfect. Layer 1 is fast current interruption for severe electrical faults. Layer 2 is selective detection for ground faults and abnormal leakage. Layer 3 is isolation verification and interlocks so maintenance states are enforced.
Example: if a busbar contact loosens, Layer 1 should clear the high-current fault within milliseconds. If electrolyte contamination creates a conductive path to a grounded enclosure, Layer 2 should detect the leakage and trip before insulation damage accumulates. If an operator opens a maintenance disconnect, Layer 3 should confirm isolation and block re-energization.
Overcurrent Protection
Overcurrent protection typically combines fuses or circuit breakers with coordination logic. Choose trip curves that match the expected operating current and the thermal limits of cables and stack interconnects.
Best practice: coordinate upstream and downstream devices so only the smallest section trips. For instance, protect each stack module with its own breaker, then protect the module feeders with a higher-level breaker. During commissioning, verify selectivity by injecting faults at different locations and confirming the intended device clears.
Example: a module breaker trips when a short occurs inside one module. The main feeder breaker remains closed, limiting downtime and keeping the rest of the battery available.
Ground Fault Detection
Ground fault detection needs to distinguish between intentional grounding (if any) and accidental leakage. In many battery systems, the DC side is either isolated from earth or grounded through a controlled method. The protection scheme must match that grounding strategy.
Common approach: measure insulation resistance indirectly by using a DC ground-fault monitor that senses imbalance between positive and negative conductors relative to earth. Set thresholds based on measured baseline leakage under normal conditions.
Best practice: establish a commissioning baseline. Record leakage current and insulation resistance at multiple temperatures and electrolyte levels. Then set alarm and trip thresholds with enough margin to avoid nuisance trips.
Example: during normal operation, leakage current stays below 2 mA. An alarm triggers at 5 mA to prompt inspection, while a trip occurs at 10 mA to prevent heating and corrosion.
Isolation and Interlock Verification
Isolation is more than opening a switch. It includes proving that the battery is electrically separated and that stored energy is discharged.
Use three checks:
- Physical separation via maintenance disconnects or contactors.
- Electrical confirmation using voltage presence detection on both sides of the isolation boundary.
- Discharge assurance by monitoring that DC bus voltage falls below a safe threshold.
Best practice: interlock the maintenance state with control logic. When isolation is confirmed, enable maintenance mode; when isolation is removed, block maintenance mode and require operator acknowledgment.
Example: an operator opens the maintenance disconnect. The system verifies zero voltage on the battery side and confirms discharge within a defined time window. Only then does the control system allow access-permission signals.
Fault Clearing, Signaling, and Operator Actions
Protection must communicate clearly. When a trip occurs, log the event with the measured currents, ground-fault level, and the device that operated. Provide a short, actionable message: “Overcurrent cleared module feeder breaker; inspect busbar contact and torque points.”
Avoid ambiguous states like “general fault.” Instead, map each trip to a likely cause category and a standard inspection checklist.
Example: a ground-fault trip triggers an inspection of electrolyte containment, cable insulation, and enclosure bonding continuity before any reset.
Mind Map: Protection System Coverage
Example Protection Sequence for a Realistic Scenario
Assume a conductive leak forms between a DC conductor and an equipment enclosure due to electrolyte spill on a cable gland.
- Ground fault monitor detects leakage imbalance and raises an alarm when leakage exceeds the alarm threshold.
- If leakage continues to rise, the monitor issues a trip command to open the relevant feeder breaker.
- Overcurrent protection remains available as a backup if the leak evolves into a higher-current fault.
- After the breaker opens, the system enters isolation verification: it checks that bus voltage is below the safe threshold and confirms the maintenance disconnect state before allowing any reset or access.
This sequence prevents the system from continuing to energize a fault path while still giving operators a structured path to diagnose the cause.
Commissioning Checks That Prevent “Surprise Trips”
Before normal operation, verify sensor calibration, confirm trip curves with test currents, and confirm ground-fault thresholds against measured baseline leakage. Then validate that isolation interlocks block re-energization when voltage is present and allow re-energization only after discharge is confirmed.
If you do these checks, protection becomes a tool for diagnosis rather than a source of mystery. The stack can still be tough, but the behavior around faults becomes predictable.
6.4 Instrumentation for Voltage Current and Temperature Sensing
Iron-air stacks behave like a chemistry-driven power source: electrical signals tell you what the system is doing right now, while temperature signals tell you whether the chemistry is staying inside its comfort zone. Good instrumentation is therefore less about “more sensors” and more about choosing the right measurements, placing them correctly, and interpreting them consistently.
Foundational Measurements and What They Mean
Voltage is the stack’s electrical “summary.” For iron-air, the terminal voltage is influenced by current, electrolyte conditions, air-side limitations, and internal resistances. A single voltage reading is useful, but a voltage profile across operating points is what helps you separate normal behavior from trouble.
Current is the driver of electrochemical reaction rate. In practice, current measurement accuracy matters because it feeds efficiency calculations, state estimation, and protection thresholds. If current is wrong, everything downstream becomes confidently incorrect.
Temperature is the system’s early warning system. Temperature affects reaction kinetics, electrolyte conductivity, viscosity, and component tolerances. It also changes sensor readings themselves, so temperature measurement is both a process variable and a calibration input.
Sensor Types and Selection Logic
For voltage sensing, use differential measurement across the stack terminals or across well-defined sub-assemblies (for example, a stack section). Differential sensing reduces noise pickup from high-current conductors.
For current sensing, prefer a method that matches the installation constraints:
- Shunt-based sensing gives direct current proportional voltage but must be sized for power dissipation and thermal rise.
- Hall-effect sensing avoids shunt heating but can introduce offset drift and bandwidth limits.
- Rogowski coils work well for fast transients but require careful integration and calibration.
For temperature sensing, choose sensors that match the thermal gradients you expect. In stacks, gradients can be sharp near current collectors and electrolyte flow paths.
Best practice example: If your stack has multiple electrolyte zones, place temperature sensors at the inlet, outlet, and one mid-zone location. Then compare the mid-zone temperature to the average of inlet and outlet. A persistent mid-zone offset often indicates flow maldistribution or local resistive heating.
Placement Strategy That Prevents “Measurement Lies”
Voltage sensors should be connected to the same electrical points used for the control reference. Avoid measuring voltage through long sense leads that pick up magnetic fields from nearby busbars.
Current sensors should be placed where the conductor geometry is stable and predictable. If you must route around obstacles, keep the sensing element aligned with the conductor and avoid sharp bends near the sensor.
Temperature sensors should be mounted with consistent thermal contact. A sensor that is loosely coupled to a metal surface can read “electrically calm” while the chemistry is actually running hot.
Best practice example: When attaching a temperature sensor to a busbar or current collector, use a repeatable mounting method (for example, a clamp with thermal interface material) and document the torque or compression method. During commissioning, verify repeatability by comparing readings from two sensors mounted using the same procedure.
Signal Conditioning and Accuracy Budgeting
High-current systems generate electrical noise, so treat the instrumentation chain as a system:
- Sensor output (voltage/current/RTD/thermistor)
- Wiring and shielding (twisted pairs, shield termination strategy)
- Signal conditioning (amplifiers, filters, isolation)
- Analog-to-digital conversion (resolution, sampling rate)
- Calibration and scaling (gain/offset, temperature compensation)
Integrated example: Suppose you need ±1% current accuracy for efficiency calculations. If the current sensor is ±0.5% and the ADC scaling adds ±0.3%, your wiring and calibration must stay within the remaining margin. This is why an “accuracy budget” prevents late-stage surprises.
Temperature Measurement for Control and Protection
Temperature instrumentation should support two distinct functions:
- Control feedback to keep operation stable (for example, limiting current when electrolyte temperature rises).
- Protection thresholds to trigger safe actions (for example, stopping operation if a sensor exceeds a hard limit).
To avoid nuisance trips, use a combination of filtering and logic. A simple moving average can reduce noise, but it also delays response. A better approach is to filter for display while using less-filtered signals for protection, with a short time window.
Best practice example: If your protection needs to react within 2 seconds, do not apply a 10-second average to the protection path. Use a short window (for example, 0.5–1 second) and require the condition to persist for a minimum duration.
Mind Map: Instrumentation Chain and Responsibilities
Commissioning Checks That Confirm the Whole Chain
Commissioning should verify not only that sensors read “something,” but that they read the right something.
Voltage check: Apply a known current step and confirm that the voltage response is monotonic and consistent with expected internal resistance trends.
Current check: Cross-check the current sensor reading against a secondary reference instrument during a controlled test. If the difference changes with temperature, investigate sensor drift or thermal coupling.
Temperature check: Compare inlet and outlet sensors during a steady operating point. If the temperature rise is near zero while current is significant, suspect sensor placement, flow issues, or wiring errors.
Example: During a commissioning run, you notice that one temperature sensor always reads 3–5°C higher than the others at the same location. Instead of adjusting thresholds immediately, verify mounting compression and thermal interface consistency. Often the “fault” is mechanical repeatability, not electronics.
6.5 Commissioning Tests for Electrical Continuity and Safety Compliance
Commissioning electrical safety is about proving that the system does what the design says it does, every time, under the conditions you can reproduce on site. For an iron-air stack system, that means verifying continuity paths, insulation integrity, protective device behavior, and safe operation of interlocks before you ever ask the power electronics to deliver energy.
Commissioning Scope and Test Order
Start with the lowest-risk checks that reveal wiring mistakes early, then move toward higher-energy tests. A practical order is: (1) visual inspection and labeling, (2) continuity and bonding verification, (3) insulation resistance and dielectric checks, (4) protective earth integrity under load paths, (5) functional checks of interlocks and shutdown circuits, and (6) verification of protection settings using simulated faults.
A simple rule: if a test depends on a previous wiring state, do it after you confirm that state. For example, insulation resistance testing should occur before energizing any electronics, because a miswired conductor can make a “safe” reading look safe while still being wrong.
Visual Inspection and Documentation Checks
Before instruments come out, confirm that every conductor is terminated to the correct terminal and that torque marks match the approved procedure. Verify that cable glands are seated, strain relief is present, and that conductor colors or markings are consistent with the single-line diagram.
Example: If the stack temperature sensor return is mistakenly landed on a chassis ground lug, the system may still power up, but safety logic can behave unpredictably. Visual checks catch this before electrical tests mask the issue.
Continuity and Bonding Tests
Continuity tests confirm that current can return through the intended paths and that exposed conductive parts are bonded to protective earth.
What to test
- Protective earth continuity from each exposed metal part to the main earth bar.
- Bonding continuity between frames, enclosures, and any conductive piping that is part of the electrical protective system.
- Continuity of equipotential bonding conductors.
How to do it Use a low-resistance ohmmeter or continuity tester with a defined current source. Record resistance values and compare them to acceptance limits set by the design and cable size.
Example: If a cabinet door is bonded through a flexible strap, measure continuity with the door in the closed position and again with it opened to ensure the strap geometry does not break the path.
Insulation Resistance and Dielectric Integrity
Insulation resistance testing checks that conductors are not unintentionally connected through insulation breakdown or moisture paths.
Insulation resistance test targets
- Power conductors to protective earth.
- Control wiring to power circuits where separation is required.
- Any galvanically isolated circuits to their intended reference.
Dielectric checks Where specified, perform dielectric withstand tests on sections that are safe to test without damaging sensitive electronics. If the design includes surge protection devices or electronics that cannot tolerate test voltages, isolate them using approved disconnect points.
Example: If a measurement circuit includes a surge suppressor, it may clamp during a dielectric test and produce a misleading failure. The fix is not “try again,” but to isolate the protected section per the test plan.
Protective Device and Interlock Verification
Safety compliance requires that protective devices operate as intended and that interlocks prevent unsafe states.
Protective device checks
- Verify correct installation of fuses, breakers, and residual current devices.
- Confirm trip curves and settings match the commissioning sheet.
- Perform functional tests using simulated conditions rather than relying on uncontrolled faults.
Interlock checks
- Door interlocks and access switches prevent operation when panels are open.
- Emergency stop circuits de-energize outputs and place the system into a safe state.
- Interlocks tied to air handling or electrolyte handling prevent operation if critical subsystems are not in a safe configuration.
Example: If an emergency stop is wired to stop the inverter but not to disable the contactor feeding the stack, you can still have hazardous voltage present. Commissioning should verify both the control action and the physical isolation state.
Functional Continuity Under Operating Conditions
Some continuity issues only appear when components move or heat up. Verify that bonding straps, cable routing, and terminal integrity remain acceptable after mechanical movement.
Practical checks
- Re-check continuity after torque verification.
- Confirm that cable strain relief does not pull conductors when the enclosure is closed.
- Validate that temperature sensors and wiring harnesses do not share unintended return paths.
Example: A harness tie-down placed too close to a sharp edge can chafe insulation. Continuity might still pass, but insulation resistance will fail later. Doing both tests in sequence prevents that trap.
Acceptance Criteria, Records, and Sign-Off
Commissioning is only complete when results are traceable. Maintain a commissioning log that includes instrument identifiers, calibration dates, test parameters, measured values, and pass/fail outcomes.
Use a consistent template so reviewers can spot anomalies quickly. If a reading is near the limit, record the exact value and the measurement conditions, including cable temperature and lead placement.
Mind Map: Electrical Commissioning Tests
Example Commissioning Checklist for One Cabinet
- Confirm cabinet labeling matches the single-line diagram.
- Measure protective earth continuity for each exposed metal part.
- Measure bonding continuity between cabinet frame and earth bar.
- Perform insulation resistance tests for power to earth and control to power.
- Verify emergency stop de-energizes the stack contactor and disables outputs.
- Verify door interlock prevents enabling commands.
- Record all measured values, instrument IDs, and acceptance limits.
A commissioning log that reads like this makes audits easier and reduces the chance that “it worked once” becomes the standard of proof.
7. Control Systems for Stable Dispatch and Efficient Operation
7.1 Control Objectives for Long-Duration Energy Storage
Long-duration storage control has one job that everything else supports: keep the system inside safe, efficient operating boundaries while delivering the requested energy over hours to days. For iron-air systems, that means coordinating electrical output, air access, electrolyte condition, and thermal behavior so the cell stack does not “pay” for control mistakes with accelerated degradation.
Control Objectives That Matter
-
Meet power and energy requests with predictable timing. The grid operator asks for a power profile; the storage system must translate that into current, air flow, and electrolyte conditions that produce the intended energy. A practical example is a 12-hour discharge at a flat 50 kW: the controller should hold current and voltage within limits so the delivered energy stays close to 600 kWh even if temperature drifts.
-
Protect cell health by respecting voltage, current, and reactant limits. Iron-air performance depends on maintaining workable electrochemical conditions. If current is too high, voltage rises and losses increase; if air access is too low, the air electrode becomes starved. A simple rule-of-thumb example: if stack voltage climbs above a configured threshold while air flow is already at its maximum, the controller should reduce current rather than keep pushing.
-
Maintain electrolyte and water balance. Electrolyte concentration and water content affect conductivity and reaction pathways. Control should prevent slow drift that only shows up after many cycles. For example, during a long discharge, the controller can monitor conductivity and temperature and adjust charge/discharge tapering so the electrolyte does not cross a concentration band.
-
Keep thermal conditions stable. Heat affects reaction rates, viscosity, and component longevity. Even if the system is not actively cooled, the controller should account for temperature rise and adjust current to avoid overheating. Example: if a temperature sensor near the stack rises faster than expected, the controller can reduce power for a short interval to let the system re-stabilize.
-
Ensure safe operation through fast fault response. Control objectives include detecting abnormal states and moving to a safe mode quickly. Example: if differential pressure across the air path spikes, indicating blockage or severe restriction, the controller should stop discharge and alert operators rather than continuing with insufficient oxygen.
From Objectives to Measurable Targets
Each objective needs measurable signals and explicit boundaries.
- Power tracking: measured DC power, AC power after conversion, and ramp rate limits.
- Electrochemical limits: stack voltage bounds, current bounds, and allowable rate-of-change.
- Air-side limits: air flow setpoint, oxygen utilization indicators, and pressure drop.
- Electrolyte limits: conductivity, temperature, and any derived concentration estimate.
- Thermal limits: stack and coolant or ambient temperature gradients.
- Safety states: interlock conditions such as isolation status, pump availability, and sensor plausibility.
A useful mental model is “control loops with guardrails.” The main loops aim for performance; guardrails prevent the system from chasing setpoints when the plant cannot physically deliver them.
Mind Map: Control Objectives for Long-Duration Storage
Example: Coordinated Control During a Long Discharge
Assume a target of 50 kW for 12 hours. The controller can operate in three layers.
-
Setpoint layer: Convert 50 kW into a current command using a calibrated power-to-current relationship that accounts for temperature. If the system is warmer than expected, the mapping shifts so current does not overshoot.
-
Constraint layer: Apply guardrails. If stack voltage approaches the upper limit, reduce current gradually. If air flow reaches its maximum and voltage still rises, treat it as air-side limitation and reduce power more aggressively.
-
Health layer: Monitor electrolyte and thermal drift. If conductivity trends indicate concentration leaving the allowed band, adjust the discharge profile by tapering current rather than holding it constant.
This layered approach prevents a common failure mode: the system looks like it is “following the schedule” while quietly violating the conditions that keep the stack efficient and durable.
Example: Fault Handling Without Confusing Operators
Consider a sensor plausibility fault where air pressure readings become inconsistent. The controller should not guess. Instead, it can:
- Verify sensor consistency using redundant signals such as pump status and measured flow.
- If plausibility fails, transition to a safe state by stopping discharge and placing the system in a controlled idle.
- Log the event with the exact guardrail that triggered the transition, such as “air-side restriction suspected due to pressure drop anomaly.”
Clear fault semantics matter because long-duration systems are often unattended for long stretches. The control objectives therefore include producing actionable state information, not just stopping the process.
Summary of the Objective Set
A complete control objective set for long-duration iron-air storage is: track requested power and energy, respect electrochemical and air limits, maintain electrolyte and thermal stability, and respond to faults quickly and deterministically. When these objectives are expressed as measurable targets with guardrails, the system can operate for hours without turning every deviation into a slow, expensive problem.
7.2 State Estimation Using Measured Quantities and Calibration
State estimation answers a practical question: given sensor readings, what is the cell stack’s actual condition right now? For iron-air systems, the “state” is not just voltage; it includes electrolyte condition, air-side utilization, and internal losses that change with operating point. A good estimator uses measured quantities, calibrated relationships, and simple physical constraints so it behaves sensibly when sensors disagree.
Foundational Quantities and What They Mean
Start with the measurements you can trust and the states you want.
- Electrical measurements: stack voltage, current, and temperatures at least at the electrolyte and air electrode sides. These help separate reversible behavior from losses.
- Hydraulic and air-side measurements: electrolyte flow rate, air flow rate, and pressure differential across the air electrode. These influence mass transport and water balance.
- Derived quantities: instantaneous power, cumulative ampere-hours, and estimated electrolyte concentration proxies.
A useful mental model is to treat the stack voltage as:
- Open-circuit contribution (linked to state of charge and electrolyte condition)
- Activation and ohmic losses (linked to temperature, current density, and contact resistances)
- Mass-transport limits (linked to air utilization, flow, and water management)
Calibration Strategy That Actually Sticks
Calibration turns “sensor readings” into “state-relevant signals.” Do it in layers.
- Sensor calibration: verify scaling and offset for current shunts, voltage dividers, temperature probes, and flow meters. A 1% current error becomes a 1% energy error after long discharge.
- Thermal calibration: map probe readings to effective stack temperatures. If probes sit in different thermal zones, include a correction based on steady-state tests.
- Electrochemical mapping: build a relationship between measured voltage and state variables under controlled conditions.
A concrete example: run a set of controlled discharges at two temperatures (say 20°C and 35°C) and two air flow rates. For each condition, record voltage vs. cumulative ampere-hours. You will see that the same ampere-hour count can produce different voltage due to mass transport and temperature. Store those differences as calibration surfaces rather than one-line formulas.
Estimation Workflow from Measurements to State
Use a structured pipeline so each step has a reason to exist.
-
Preprocess measurements
- Apply filtering that respects dynamics: current can be averaged over short windows, but flow and pressure may need slower filtering to avoid chasing noise.
- Reject obvious outliers using range checks and rate-of-change limits.
-
Compute operating point
- Convert current to current density using active area.
- Convert flow readings to normalized utilization metrics (for example, air flow per unit stack area).
-
Estimate reversible component
- Use a calibrated open-circuit curve or a reduced model that maps state of charge and electrolyte condition to a reversible voltage.
- If you lack direct electrolyte concentration measurement, use temperature and voltage residuals to infer it.
-
Estimate losses and correct the state
- Compute residual voltage: measured voltage minus predicted reversible voltage.
- Attribute residual to ohmic and mass-transport terms using calibration coefficients.
- Update the state estimate so the predicted voltage matches the measured one.
-
Enforce constraints
- State of charge must stay within bounds.
- Electrolyte condition must remain consistent with water balance constraints implied by air utilization and flow.
Mind Map: the Estimation Logic
Example: Estimating State of Charge During a Variable Load
Assume you run a discharge that changes current every 10 minutes. You measure stack voltage, current, and temperatures continuously.
-
Step A: Coulomb counting as the backbone Integrate current to get ampere-hours removed. This gives a baseline state of charge trajectory.
-
Step B: Correct for temperature and air-side effects At each current step, compare measured voltage to the calibrated voltage expected at that temperature and air flow. If voltage is lower than expected, it often indicates stronger mass-transport limitation or higher internal resistance than the calibration assumed.
-
Step C: Update the state using residuals Adjust the state estimate so the model’s predicted voltage matches the measured one. The key is that you do not throw away coulomb counting; you treat it as a prior and let voltage residuals correct the drift.
-
Step D: Validate with sanity checks If the estimator claims the state of charge jumped upward during discharge, that violates constraints. In that case, the most likely issue is a sensor scaling error or a flow measurement dropout.
Confidence and Failure Modes You Should Plan For
A practical estimator reports confidence, not just numbers.
- High confidence when sensors agree and the operating point stays within the calibration envelope.
- Reduced confidence when air flow or pressure is missing, because mass-transport terms become underdetermined.
- Hard fallback to coulomb counting when voltage residuals become inconsistent across temperatures, which can happen if a contact resistance changes abruptly.
The goal is simple: the estimator should fail in a predictable way, not in a mysterious one. When it cannot infer enough, it should say so by lowering confidence and relying more heavily on the most robust measurement path.
7.3 Charging and Discharging Profiles for Operational Stability
Operational stability in an iron-air system comes from matching the electrical profile to what the cell can do chemically and mechanically. A “good” profile is not just about hitting a target power; it also keeps voltage within workable limits, manages electrolyte concentration and water balance, and avoids air-side starvation or flooding. The goal is repeatable behavior across many cycles, not a single impressive run.
Foundational Constraints That Shape Profiles
Start with three constraints that directly determine charge and discharge shapes.
- Voltage window and rate limits: If you push current too high, the cell voltage moves toward polarization limits and efficiency drops. On charge, excessive current can increase side reactions and worsen water balance.
- Electrolyte concentration and water balance: Iron-air operation changes species concentrations and consumes or produces water depending on the exact chemistry and operating conditions. Profiles must allow the system to stay near the intended operating concentration.
- Air electrode oxygen availability: The air side must supply oxygen at a rate consistent with the current. Starvation raises overpotential; excess flow can waste energy and complicate humidity control.
A practical best practice is to treat the profile as a set of “guardrails” rather than a single ramp. You define maximum current, maximum allowable voltage deviation, and minimum air-side conditions, then shape the power command to stay inside those guardrails.
Mind Map: Profile Building Blocks
Discharge Profiles That Reduce Polarization Surprises
A common stable discharge profile uses a controlled ramp, a main constant-current region, and a voltage-limited taper.
- Ramp up: Increase current gradually (for example, 10–20% of the final current per minute) to avoid sudden polarization and to let temperature and electrolyte gradients settle.
- Main region: Hold a constant current until the cell voltage approaches the lower limit you set for protection and efficiency.
- Taper: When voltage nears the limit, reduce current rather than abruptly stopping. This keeps the cell in a region where oxygen utilization and ionic transport remain reasonably balanced.
Example: Suppose your target discharge is 4 hours at 1C-equivalent current (whatever your system defines as the reference). You set a 15-minute ramp from 0.2C to 1.0C, then hold 1.0C for 3 hours. If voltage drops to the lower guardrail at the 3-hour mark, you taper down to 0.6C for the remaining hour. The taper often improves usable capacity consistency because it prevents “cliff” behavior when the cell approaches its transport limits.
Charging Profiles That Avoid Water Imbalance
Charging is usually more sensitive to stability because the system can accumulate imbalance if you charge too aggressively or too long at high current.
A stable charging profile often includes:
- Initial current ramp: Similar to discharge, ramp current to reduce transient gradients.
- Constant-current hold: Charge at a moderate current until the voltage approaches the upper guardrail.
- Voltage-limited taper: Reduce current as voltage rises, keeping the cell from spending too much time at high overpotential.
- Optional rest: A short rest period after charging can help the system re-equilibrate concentration gradients before the next discharge.
Example: For a daily cycle, you might charge for 2.5 hours. You ramp from 0.3C to 0.8C over 20 minutes, hold 0.8C for 1.5 hours, then taper to 0.5C for the final 50 minutes as voltage approaches the upper limit. If your monitoring shows electrolyte concentration drifting high, you shorten the final taper duration rather than increasing current earlier.
Air Scheduling That Matches Current Without Waste
Air flow should track the discharge and charge current. A stable approach is to use a baseline flow schedule tied to current, then adjust based on measured pressure drop and humidity.
- During ramp phases, increase air flow slightly ahead of current to prevent oxygen starvation.
- During constant-current holds, keep air flow near the value that maintains stable pressure drop.
- During taper, reduce air flow proportionally to avoid unnecessary fan power while still preventing oxygen limitation.
Example: If your system uses a blower with measurable pressure drop across the air electrode, you can set a target pressure drop range. When current rises, you increase blower speed until pressure drop enters the target band. If pressure drop rises too much, you likely have condensation or partial blockage; reduce current or airflow and check humidity control.
Control Logic for Operational Stability
Profiles become robust when the control system enforces guardrails continuously.
- Voltage-limited tapering: If voltage crosses a threshold, current is reduced smoothly using a rate limit so the system doesn’t oscillate.
- Minimum air-side conditions: If air flow or pressure drop falls below a minimum, the controller reduces current to match oxygen availability.
- Temperature-aware behavior: If temperature rises beyond your stable range, reduce current and extend soak time rather than forcing the same energy into the cell.
A simple control principle is: when multiple constraints are active, the controller should follow the most restrictive one. That prevents “fighting” between voltage control and air control.
Mind Map: Example Profile Parameters
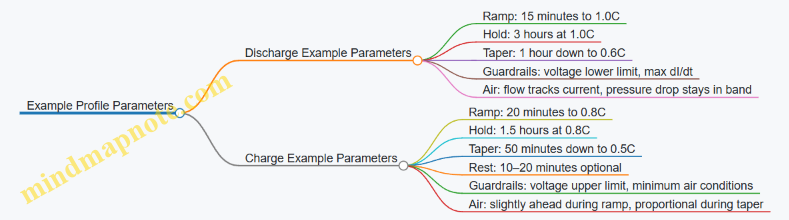
Practical Commissioning Checks for Profile Tuning
After you implement a profile, validate it with repeatable tests.
- Repeatability test: Run the same cycle profile multiple times and compare end-of-discharge voltage and delivered energy. Large variation usually indicates air-side instability, concentration drift, or insufficient ramp control.
- Guardrail hit analysis: Track how often the controller enters taper mode. If taper triggers early, your constant-current level is too aggressive for the current operating conditions.
- Water balance sanity check: Compare electrolyte level and concentration trends before and after charging. If the system consistently drifts, adjust taper duration and current magnitude rather than only changing ramp rates.
A stable profile is the one that keeps the system inside its comfort zone while still delivering the required energy. The controller’s job is to make that comfort zone practical, cycle after cycle.
7.4 Fault Detection Logic for Electrolyte Air and Electrical Signals
Fault detection in an iron-air system is really two jobs: (1) decide whether the signals you see are physically plausible, and (2) decide whether the system should change behavior to protect hardware and keep dispatch predictable. The trick is to separate “sensor weirdness” from “process trouble,” because the right response depends on which one you’re dealing with.
Foundational Signal Expectations
Start with what should be true during normal operation.
- Air-side plausibility: As load increases, oxygen utilization rises and the air electrode potential shifts in a consistent direction. If air flow is commanded higher but oxygen-related indicators do not move, you likely have a transport problem (blocked path, leak, stuck valve) or a sensor mismatch.
- Electrolyte-side plausibility: Electrolyte temperature and conductivity (or proxy measurements) should change smoothly. Sudden jumps usually indicate a sensor fault, a pump cavitation event, or a mixing failure.
- Electrical plausibility: Cell voltage should follow current with a predictable slope. If voltage collapses while current is stable, suspect contact resistance changes, wiring faults, or a measurement range issue.
A practical best practice is to define operating envelopes: allowable ranges for flow, temperature, and voltage slope at each power level. You don’t need perfect physics; you need consistent boundaries that reflect your commissioning data.
Signal Conditioning and Time Alignment
Before logic, make signals comparable.
- Filter with intent: Use a short moving average for flow and temperature to reduce noise, but keep enough responsiveness to catch real faults. A common mistake is filtering too aggressively, which delays detection until damage is already done.
- Time alignment: Ensure air flow, pressure, and electrical measurements are sampled on the same time base. If your controller reads flow 2 seconds late, your “flow vs. voltage” correlation will look wrong even when the system is fine.
Layered Detection Strategy
Use layered checks so you can pinpoint the fault class.
Range and Rate Checks
These are the fastest and catch many issues.
- Range check: Flow command vs. measured flow must stay within a tolerance band. Example: if commanded 30 L/min and measured stays at 5 L/min for more than 10 seconds, flag an air transport fault.
- Rate check: Voltage slope (dV/dI) should not jump abruptly. Example: during a steady current plateau, if voltage drops by 200 mV within one sampling window, treat it as a measurement or contact fault.
Cross-Consistency Checks
Now compare different signals that should move together.
- Air-electrical coupling: When current increases, the air electrode overpotential should generally increase in a way that matches your baseline curve. If current rises but the expected voltage response is missing, suspect air-side starvation or a sensor mismatch.
- Pressure-flow relationship: If pressure drop rises while flow is flat, you likely have blockage or a failing blower. If flow rises while pressure drop falls, suspect a leak or bypass.
Model-Based Residuals
A simple residual model is enough.
- Build a baseline mapping from operating point to expected voltage and temperature behavior using commissioning tests.
- Compute residuals: residual = measured − expected.
- Example: if residual voltage stays near zero but air flow is out of range, the electrical side may be healthy while the air path is not.
Decision Logic and Response Actions
Detection is not the same as action. Define actions by severity.
- Advisory: One sensor out of range briefly; log and continue if other signals remain consistent.
- Protective: Air flow mismatch persists; reduce power command and hold current ramp limits.
- Trip: Electrical anomalies indicating unsafe conditions, such as sustained abnormal voltage slope or evidence of contact failure.
A clean approach is to implement a fault state machine with hysteresis. Example: require 3 consecutive windows of failure before entering “Protective,” and require 5 consecutive windows of recovery before clearing. This prevents rapid toggling when conditions hover near thresholds.
Mind Map: Fault Detection Logic
Example Scenarios with Concrete Logic
Example: Air Flow Stuck Low During Load Increase
- Observation: Current ramps up; measured flow remains near minimum; pressure drop rises.
- Layer 1: Flow range check fails persistently.
- Layer 2: Pressure-flow relationship indicates blockage rather than leak.
- Layer 3: Voltage residual shows starvation signature compared to baseline.
- Action: Enter Protective state, limit current ramp, and keep logging until flow recovers.
Example: Voltage Drop Without Air-Side Change
- Observation: Current steady; voltage drops sharply; flow and pressure remain stable.
- Layer 1: Voltage rate check fails.
- Layer 2: Cross-consistency with air signals does not show starvation.
- Classification: Electrical measurement or contact issue.
- Action: Trip or switch to a conservative mode, depending on how quickly the voltage slope normalizes.
Example: Temperature Spike with Normal Electrical Response
- Observation: Electrolyte temperature jumps; voltage residual remains small.
- Layer 1: Temperature rate check fails.
- Layer 2: Electrical coupling remains consistent, suggesting sensor or local mixing issue.
- Action: Advisory if electrical safety margins remain intact; otherwise Protective if temperature affects electrolyte stability.
Implementation Notes That Prevent False Alarms
- Use persistence timers for any fault that could be caused by transient behavior.
- Separate sensor plausibility from process plausibility by requiring at least one cross-consistency check to agree.
- Keep thresholds tied to commissioning data and update them only when you change hardware or operating constraints.
When the logic is layered and stateful, you get a system that doesn’t just shout “fault,” but explains what kind of mismatch it detected and what it did about it—without guessing wildly.
7.5 Human Machine Interface Dashboards and Operator Procedures
An iron-air system is a stack plus a lot of plumbing, so the dashboard must answer two questions quickly: “Is it safe?” and “Is it doing what we asked?” Operator procedures then translate those answers into repeatable actions.
Operator Goals and Information Hierarchy
Start with a strict hierarchy: safety alarms first, then system health, then performance. For example, if air-side pressure drops while electrolyte temperature rises, the operator should see a single primary alarm that explains the likely coupling (air starvation can raise overpotentials and heat). Secondary panels can show the supporting signals without forcing the operator to interpret them under stress.
Recommended dashboard layout
- Top bar: system mode (idle, charge, discharge, maintenance), interlocks status, and a single “ready” indicator.
- Alarm strip: color-coded severity, alarm text, and a short “operator action” line.
- Health tiles: electrolyte temperature, air pressure, flow rate, stack voltage, cell balancing status.
- Trends panel: last 2–4 hours of key variables with event markers for mode changes.
- Procedure panel: context-sensitive checklist that matches the current mode.
Mind Map: Dashboard Signals and Actions
Start-Up Procedure That Matches the Dashboard
A good start-up checklist prevents “half-ready” operation. Use the dashboard’s interlock status to gate each step.
Example start-up sequence
- Prechecks: confirm air path valves are in the commanded position and pumps show expected flow. If flow is zero, do not proceed; the dashboard should show “Pump flow mismatch” as the primary alarm.
- Electrolyte conditioning: verify temperature is within the allowed band. If temperature is low, the operator should see a “Hold until temperature stable” instruction rather than a manual guess.
- Electrical enable: ramp current setpoint only after isolation checks pass. The operator should see a ramp progress bar tied to measured current.
- Mode confirmation: once in charge or discharge, the trends panel should mark the transition so later anomalies can be correlated.
Normal Operation: What Operators Should Actually Watch
Operators should not stare at raw numbers. They should watch deviation and consistency.
Example: air-side flow drift
- Symptom: flow rate slowly decreases while stack voltage rises at constant current.
- Dashboard response: show “Air starvation trend” with a suggested action: inspect filter differential pressure and confirm blower speed control.
- Procedure action: pause dispatch, keep system in a safe mode, and run the filter check routine.
Example: cell voltage spread widening
- Symptom: cell voltage spread increases beyond the configured band.
- Dashboard response: “Balancing out of tolerance” with the likely cause category (contact resistance, local electrolyte distribution, or air distribution imbalance).
- Procedure action: reduce current to the last stable setpoint, then perform a controlled inspection step (verify sensor calibration first, then check distribution hardware).
Troubleshooting with Clear Decision Points
Troubleshooting should be a branching checklist, not a free-form conversation.
Example decision tree
- If overtemperature alarm triggers:
- Check air pressure and flow first.
- If air is normal, check pump performance and electrolyte temperature sensor plausibility.
- If both look normal, stop and escalate; don’t keep “testing” with dispatch.
- If electrical isolation fault triggers:
- Immediately command safe shutdown.
- Verify insulation monitoring readings and confirm no active high-voltage contactors.
Shutdown and Post-Run Verification
Shutdown should leave the system in a state that reduces corrosion and makes the next start predictable.
Example shutdown checklist
- Ramp current to zero and confirm stack voltage settles.
- Maintain air-side conditions only if the procedure requires it for drying or stabilization; otherwise close valves to the safe position.
- Stop pumps after electrolyte temperature reaches the allowed threshold.
- Record a short “post-run note” tied to the event markers: what mode, what alarms (if any), and what operator actions were taken.
Operator Procedure Quality Checks
To keep procedures usable, each checklist item should include: the expected measurement range, the action if out of range, and the next step. A procedure that says “check the system” is not a procedure; it’s a suggestion. The dashboard should therefore mirror the checklist wording so operators can move from alarm to action without translating.
A final practical touch: include a “last successful start” summary on the procedure panel. If the operator sees the same permissive failures again, they can compare current readings to the last known-good pattern and avoid repeating the same detour.
8. Mechanical Integration and Balance of Plant Engineering
8.1 Mechanical Layout for Stacks Pumps Valves and Piping
A good mechanical layout makes the stack behave like a predictable machine: fluids go where they should, air paths stay dry and controlled, and maintenance doesn’t require a contortionist. Start with the simplest rule: keep the stack as the fixed reference, then route everything else to minimize bends, trapped volumes, and hard-to-reach joints.
Foundational Layout Principles
Define the stack service envelope. Leave straight access lanes for lifting, inspection, and gasket replacement. A practical target is to ensure you can remove a module without disconnecting more than one adjacent subsystem.
Choose a consistent flow direction. For electrolyte, pick a direction that supports venting and draining. For air, pick a direction that supports condensation management. Then keep that direction through the piping run so you don’t end up with “mystery low points” where liquid collects.
Separate wet and dry zones. Keep electrolyte piping and air piping physically separated to reduce cross-contamination risk. Use different routing trays or at least different cable and sensor harness paths so leaks don’t become electrical surprises.
Mechanical Subsystems and Their Interfaces
Stacks and manifolds. The stack typically interfaces with inlet and outlet manifolds that distribute electrolyte evenly across cells. Uneven distribution shows up as local overpotential and accelerated wear, so manifold geometry matters. Use smooth internal transitions and avoid sudden area changes.
Pumps and their placement. Place pumps close enough to reduce suction losses but far enough to allow service access. For positive-displacement or diaphragm-style pumps, ensure the suction line has stable pressure and no air ingestion. For centrifugal pumps, ensure net positive suction head is respected by design, not by hope.
Valves and isolation strategy. Every maintenance action should have a clear isolation boundary. Use a valve set that supports three modes: normal operation, controlled draining, and controlled purging. If you can’t drain a section without dismantling piping, the layout will eventually force that.
Piping and fittings. Prefer straight runs with gentle bends. Use unions or flanged joints at service points, and keep threaded joints out of areas where leaks would be hard to detect. Support piping so loads don’t transfer into the stack ports.
Electrolyte Piping Layout Logic
Plan the electrolyte circuit around four functional segments: supply, distribution, return, and service. The supply segment includes filtration and conditioning connections. The distribution segment is the stack inlet manifold. The return segment includes the stack outlet manifold and any heat exchange interface. The service segment includes drain, flush, and sampling.
Example: drainable loop. Suppose you need to replace a filter. If the filter sits on the supply line, add isolation valves upstream and downstream of the filter and include a drain valve at the lowest point of the filter housing. During service, you close both isolation valves, open the drain, and remove the filter without spilling electrolyte into the pump bay.
Avoid trapped volumes. Any horizontal run that ends in a dead-end pocket becomes a future “where did the liquid go?” problem. Use slope and add vents or drains at the ends of runs that would otherwise trap air or liquid.
Air Path Mechanical Layout Logic
Air routing is about oxygen access and water control. Keep air lines sized to limit pressure drop and avoid condensation traps.
Example: condensation-safe routing. If the air inlet comes from a blower above the stack, route the line downward to the stack with a controlled slope. Add a low-point drain or drip leg where condensation would naturally collect. Then ensure the drip leg doesn’t interfere with oxygen delivery by keeping it outside the main distribution manifold.
Leak-tightness and sealing. Use gaskets and seals rated for the operating environment and ensure the mechanical layout doesn’t twist flanges during installation. A small misalignment can create a persistent leak that looks like “performance drift” during testing.
Advanced Details That Prevent Common Failures
Thermal expansion allowances. Stacks and piping expand differently. Include flexible couplings or expansion loops where needed, and anchor piping so it can move without stressing stack ports.
Vibration isolation. Pumps transmit vibration. Mount pumps on vibration-damping bases and use flexible connectors where appropriate, but keep flexible sections short so they don’t become sagging reservoirs.
Instrumentation mounting. Place pressure and temperature sensors where the reading represents the intended fluid state. For example, mount pressure taps upstream of the stack manifold so you can interpret differential behavior without mixing effects from the manifold.
Mind Map: Mechanical Layout Components and Decisions
Example Layout Walkthrough
Imagine a compact containerized system. The stack sits centered on a rigid base. Electrolyte supply enters from one side through a filter skid, then passes isolation valves before reaching the stack inlet manifold. The return exits the stack and routes to a heat exchange interface, then to the pump suction. The pump discharge goes back to the supply line through a second isolation valve set. Drains are placed at the lowest points of the filter housing, the stack manifold region, and the heat exchange interface so each component can be serviced independently.
On the air side, the blower connects to an air inlet manifold that feeds the stack air electrode region. A drip leg sits at the lowest point of the air run, with a drain valve accessible from the service lane. Pressure taps are placed upstream of the stack air manifold and at the stack outlet so you can interpret whether pressure drop changes come from the air electrode region or from upstream piping.
This layout approach keeps the system testable, serviceable, and readable. When something changes, you can trace it to a segment instead of guessing across the whole machine.
8.2 Materials Compatibility for Pumps Seals and Tubing
Iron-air systems move electrolyte through pumps, valves, and tubing while also exposing seals to wet chemistry, pressure cycles, and occasional air-side moisture. Compatibility is less about “will it corrode” and more about whether materials keep their shape, sealing force, and surface behavior long enough to meet the project’s service plan.
Start with the Fluid Reality
Begin by listing the actual electrolyte conditions the hardware will see: temperature range, concentration, dissolved impurities, dissolved gases, and whether any cleaning or flushing fluids are used during maintenance. A practical example: if the electrolyte is periodically diluted for water balance, elastomers that survive the normal concentration may swell during the dilution step and then fail when the concentration returns.
Next, map the fluid to the failure modes you care about:
- Chemical attack: swelling, softening, embrittlement, or leaching.
- Electrochemical effects: accelerated corrosion on metals when current paths exist.
- Mechanical wear: seal face abrasion from particles or cavitation.
- Thermal aging: loss of elasticity after repeated warm cycles.
A good rule of thumb is to treat seals and tubing as a coupled system: a tubing material that sheds particles can shorten seal life even if the seal compound is chemically compatible.
Pumps: Where Compatibility Gets Specific
Pumps typically combine wetted metals (housing, impeller), elastomeric components (O-rings, seals, diaphragms), and polymer tubing or hoses at the inlet and discharge.
For wetted metals, compatibility means more than corrosion resistance. You also want predictable surface roughness and stable oxide layers so that corrosion products don’t become abrasive debris. If you use dissimilar metals, ensure the design avoids galvanic couples in the electrolyte. A simple example: pairing a stainless wetted part with a carbon-steel fastener can create a localized corrosion cell around the fastener head, which then sheds rust-like particles into the seal region.
For elastomeric pump seals, compatibility is mostly about swelling and compression set. Swelling increases leakage risk by changing dimensions; compression set reduces sealing force after time under load. If your pump cycles frequently, choose materials that tolerate repeated compression without hardening.
Seals: Selecting by Mechanism, Not Guesswork
Seal selection should follow the sealing mechanism:
- Static seals (gaskets, O-rings): focus on chemical swelling and long-term compression set.
- Dynamic seals (shaft seals, mechanical seals): add wear resistance, friction stability, and tolerance to minor misalignment.
A practical example for static seals: if the system is shut down and the electrolyte sits for weeks, the seal material may absorb electrolyte and then relax. When the pump restarts, the seal may not re-establish the original contact pressure, causing slow seepage that looks like “mysterious” wetness.
For dynamic seals, pay attention to the interface environment. If cavitation occurs at the pump inlet, micro-bubbles collapse near the seal faces and can erode elastomer surfaces or damage seal faces. Compatibility includes ensuring the pump inlet conditions prevent cavitation, not just choosing a chemically resistant elastomer.
Tubing and Hoses: Chemical Resistance Meets Flow Reality
Tubing compatibility depends on both chemistry and mechanical behavior under pressure and temperature. Common issues include:
- Permeation: slow migration of electrolyte components through polymer walls.
- Stress cracking: failure under combined chemical exposure and tensile stress.
- Particle shedding: internal surface degradation that increases seal wear.
A concrete example: a flexible hose that is chemically acceptable may still fail early if it is repeatedly bent near fittings. The bend concentrates stress, and the electrolyte can penetrate micro-voids, leading to localized cracking.
Compatibility Mind Map
Mind Map: Materials Compatibility for Pumps Seals and Tubing
Integrated Examples That Tie It Together
Example 1: Static O-Ring at a Manifold A manifold uses an O-ring to seal a wetted joint. The electrolyte is stable during operation, but during maintenance the system is flushed with a more dilute solution. The O-ring material shows acceptable performance in a short chemical exposure test, yet fails after repeated flush cycles because swelling during dilution increases compression set and reduces sealing force. Fix: verify compatibility across the full maintenance chemical range and include soak tests that mimic shutdown duration.
Example 2: Pump Seal Wear from Tubing Debris A pump seal wears faster than expected. The seal compound is chemically compatible, but the inlet tubing has internal surface degradation that releases fine particles. Those particles become abrasive at the seal interface, accelerating wear. Fix: inspect tubing interior condition, add filtration where appropriate, and confirm that the seal’s wear life matches the expected particle environment.
Practical Validation Steps
Before installation, validate compatibility with tests that reflect the real duty cycle. Use three layers: (1) chemical exposure or soak tests at operating temperature, (2) pressure and cycling tests for seals and tubing, and (3) a debris check after initial runs to confirm that corrosion products or polymer shedding are not entering the seal zone. When results disagree with expectations, treat it as a system clue: the chemistry may be fine, but the mechanical environment or maintenance procedure may be the culprit.
8.3 Leak Detection Methods and Containment Design
Iron-air systems mix reactive electrolyte, water, and an air stream that can carry humidity and oxygen. A leak is rarely just “a small problem”; it changes local chemistry, creates corrosion paths, and can shift air-side performance. Good detection and containment start with clear leak pathways, then use layered sensing so you catch both slow drips and sudden releases.
Foundational Leak Pathways and Failure Modes
Begin by mapping where leaks can physically occur:
- Electrolyte side: seals at pump shafts, valve stems, threaded joints, and stack manifold interfaces.
- Air side: gasketed air manifolds, electrode housing seams, and pressure relief paths.
- Common interfaces: areas where air and electrolyte are separated by membranes or structural barriers.
A practical best practice is to label each joint with three attributes: fluid type, pressure direction, and consequence. For example, a joint that sees electrolyte under positive pressure and sits above electrical buswork gets a higher consequence rating than a low-pressure drain connection.
Containment Design Principles
Containment is about buying time and limiting spread. Use a hierarchy:
- Primary containment: the stack and fluid circuit itself, built to spec and assembled with correct torque and gasket selection.
- Secondary containment: trays, bunds, and sealed enclosures that can hold a defined spill volume.
- Tertiary containment: room-level barriers and drainage routing that prevents electrolyte from reaching unintended areas.
A simple example: place a catch tray under the pump skid and route it to a dedicated drain tank with a level sensor. If a seal starts to weep, the system detects rising level in the drain tank instead of waiting for corrosion to show up elsewhere.
Containment also needs drainage logic. If you allow pooled electrolyte to sit in a low spot, you create a persistent corrosion environment and make leak localization harder. Slope trays toward a monitored drain and keep the drain closed during normal operation.
Leak Detection Methods by Layer
Layered detection reduces the chance that one sensor misses a particular leak size or location.
Visual and Mechanical Indicators
- Sight glasses and inspection ports for accessible manifolds.
- Drip indicators on valve bodies and pump seals.
- Absorbent pads placed at known leak-prone points, paired with a simple “pad changed” check.
Example: install absorbent pads around a valve stem and schedule a quick inspection during routine maintenance. If the pad shows electrolyte staining, you know the leak is on the valve body, not the downstream piping.
Level and Mass Balance Monitoring
- Tank level monitoring for electrolyte supply and drain tanks.
- Make-up rate tracking: compare expected consumption to measured additions.
- Flow mismatch checks: if pump discharge flow and return flow diverge beyond a threshold, a leak or blockage is likely.
Example: if the system expects 0.5 L/day of make-up based on measured evaporation and you suddenly see 2.0 L/day, the control logic flags a leak investigation even if no single sensor trips.
Conductivity and pH Sensing in Secondary Containment
Secondary containment can be instrumented with conductivity or pH sensors. Electrolyte typically differs from water or air-condensate, so these sensors can distinguish “wet but harmless” from “wet and chemically active.”
Example: a tray under the stack has a conductivity sensor. Condensation may wet the tray during humid operation, but it usually has low conductivity. When electrolyte reaches the tray, conductivity rises sharply and the system logs the event with time and operating state.
Pressure and Vacuum Signatures
Air-side leaks can be detected by monitoring pressure decay or flow anomalies.
- If the system uses controlled air flow, a leak often increases required fan power or changes oxygen utilization behavior.
- If a section is isolated and held at a set pressure, a leak shows up as a faster-than-expected pressure drop.
Example: during a short maintenance mode, isolate an air manifold and hold 5 kPa for 10 minutes. If pressure drops 2 kPa in that window instead of the normal 0.3 kPa, you have a leak in that isolated segment.
Electrical and Corrosion-Path Indicators
Electrolyte leaks can create conductive paths. Use this carefully and safely:
- Insulation resistance monitoring between battery terminals and grounded structures.
- Corrosion coupons in secondary containment zones to confirm exposure.
Example: if insulation resistance trends downward while conductivity in trays stays low, the leak may be small but reaching a hidden crevice. The trend helps you prioritize disassembly at the right time.
Localization and Response Workflow
Detection is only useful if it leads to a repeatable response.
- Confirm: verify sensor readings against operating mode to avoid false alarms.
- Classify: electrolyte-side vs air-side vs common interface.
- Isolate: close valves, switch to bypass where available, and reduce pressure differentials.
- Locate: use the containment layer that triggered first, then inspect the nearest joints and gaskets.
- Repair and verify: replace suspect seals, re-torque joints, and run a short verification test that matches the original detection method.
Example: a conductivity spike in the stack tray triggers first. The workflow isolates the electrolyte loop, checks pump seal drip indicators, then inspects the manifold gasket closest to the tray sensor. After replacement, the system runs a controlled hold to confirm conductivity returns to baseline.
Mind Map: Leak Detection and Containment
Example Integration: A Practical Setup
A cohesive setup uses one containment sensor and one balance check. For instance, instrument the secondary tray under the stack with a conductivity sensor, and also monitor electrolyte make-up rate. If conductivity rises, you investigate the stack tray region first. If make-up rate rises without conductivity changes, you look for leaks outside the tray footprint, such as a valve body or a hidden joint in the pump skid area.
This combination keeps the system grounded: it doesn’t rely on a single sensor, and it turns measurements into a clear inspection path.
8.4 Maintenance Access Planning and Serviceable Component Layout
Maintenance access planning is the quiet difference between “we can fix it” and “we have to wait.” In an iron-air system, the parts that need attention most often are the ones that sit at the boundaries: where air meets the cell, where electrolyte moves through pumps and seals, and where electrical connections carry high current. Good layout makes routine checks fast, makes failures diagnosable, and keeps replacement work from turning into a full disassembly.
Foundational Access Rules That Prevent Future Pain
Start with three rules.
-
Access follows the failure mode. If a component can clog, leak, foul, or drift, ensure you can reach it without disturbing the entire stack. For example, air electrode fouling is usually diagnosed through pressure drop and voltage behavior; the layout should let you inspect or service the air distribution path without draining the whole electrolyte loop.
-
Serviceability beats compactness. A tight compartment forces awkward tool angles and increases the chance of damaging gaskets or wiring. Leave straight-line clearance for common tasks like removing a filter element, pulling a sensor, or swapping a valve actuator.
-
Every “hidden” connection must have a maintenance story. If a hose, cable, or busbar joint is behind a panel, define how it will be reached, what must be removed first, and how it will be reassembled with correct torque and seal condition.
A practical example: if you route electrolyte tubing through a narrow service chase, plan for a “swap path” that allows replacing a pump without cutting tubing. That means using unions or flanged interfaces at the pump boundary.
Serviceable Component Layout Principles
Design the layout around a small set of service zones.
-
Cell Service Zone: Keep access to cell module connections, venting interfaces, and any removable covers. Use labeling that matches the electrical and hydraulic schematics, so a technician can trace a symptom to a physical location.
-
Air Path Service Zone: Place filters, humidification elements, and flow meters where they can be removed without disturbing the manifold. If condensation is possible, ensure drains and inspection points are reachable.
-
Electrolyte Loop Service Zone: Group pumps, strainers, and valves so that a failed pump can be isolated and removed while leaving the rest of the loop intact. Put seals and O-rings where they can be inspected and replaced without reworking the entire piping run.
-
Electrical Service Zone: Route busbars and contactors so that inspection and torque checks are possible. Avoid burying high-current joints behind permanent structures. If you must use covers, make them removable with consistent fastener types.
A helpful rule of thumb: if a component is likely to be replaced during the system’s planned maintenance interval, it should be reachable from a standing position with standard tools.
Maintenance Workflow Mapping
Translate layout into a repeatable workflow. A good workflow answers: what gets isolated, what gets drained, what gets disconnected, and what gets verified.
Example workflow for a pump replacement
- Isolate the pump using upstream and downstream valves.
- Confirm pressure is relieved using a gauge port.
- Drain only the pump section via a local drain valve.
- Disconnect electrical leads using a labeled connector or terminal block access.
- Remove the pump using a clear lifting path.
- Replace seals and verify alignment before reconnecting.
- Run a short leak check and confirm flow rate matches the expected range.
This workflow depends on layout decisions: local drain valves, isolation valves near the pump, and electrical access that doesn’t require removing unrelated panels.
Mind Map: Access Planning to Service Execution
Advanced Details That Make Access Actually Work
1. Tooling clearance and reach envelopes. Plan for the largest expected service tool, not the smallest. If a technician must use a torque wrench, ensure the wrench can swing through a safe arc without hitting nearby piping.
2. Fastener strategy. Use consistent fastener sizes and avoid mixing hidden specialty hardware across panels. If a panel requires unusual tools, it will eventually be delayed, and then it becomes “the panel we don’t open.”
3. Cable and hose slack. Provide service loops and slack so that components can be removed without stressing connectors. For hoses, include enough length to pull the component out while keeping routing intact.
4. Labeling that survives maintenance. Labels should be placed where they remain visible after covers are removed. Match label IDs to the maintenance checklist and the schematic node names.
5. Reassembly aids. Use alignment features for gaskets and flanges so that reassembly is repeatable. A simple alignment pin can prevent a slow leak that only shows up after the system is back in service.
Integrated Example Layout Decision
Suppose you need to service an air-side filter. If the filter is mounted behind the air manifold cover, you might be forced to remove the manifold to access it. Instead, mount the filter in the Air Path Service Zone with a removable cartridge housing and a clear extraction direction. Add an inspection port for differential pressure readings. The result is a maintenance task that isolates the filter, removes it, and verifies pressure drop without disturbing the cell stack or electrolyte loop.
Practical Checklist for Planning
- Identify the top five maintenance actions and map each to a physical access path.
- For each action, define isolation points, drain scope, and verification steps.
- Confirm that covers, panels, and fasteners can be removed and replaced without disturbing unrelated components.
- Validate that electrical and hydraulic connections have slack and labeling for safe reconnection.
- Ensure every service zone has a clear “replacement path” for the most likely failure component.
8.5 Vibration Noise and Structural Support Considerations
Iron-air stacks and their balance-of-plant equipment can generate vibration from pumps, fans, air distribution, and mechanical linkages. Even when the battery chemistry is steady, the mechanical system can still “write” noise into the environment and “write” wear into bearings, seals, and electrical connections. The goal is to keep vibration low enough that it does not amplify into misalignment, leaks, or intermittent sensor readings.
Foundations of Vibration Sources and Transmission Paths
Start by separating generation from transmission. Generation is where energy enters the structure: rotating machinery, pulsating flow, and air-side pressure fluctuations. Transmission is how that energy travels: through mounting points, pipe supports, cable trays, and the stack frame.
A practical way to map this is to list each moving component and its likely excitation frequency. For example, a blower with a 30 Hz rotational component can create tonal noise near 30 Hz and its harmonics. If a pump has a diaphragm or gear mechanism, it may add broadband energy. Then check where the structure can resonate. A stack frame that is too flexible can act like a loudspeaker, while a rigid frame can shift stress into fasteners and seals.
Structural Support Design Principles
Use a “stiff where it must be, compliant where it can be” mindset. Mount the stack so it is stable under static loads and resistant to racking, but avoid making every connection rigid in every direction.
Key practices:
- Define load paths early. The stack should transfer weight into base rails, not into piping. If piping carries stack load, vibration will turn into fatigue at joints.
- Use isolation where excitation is high. Place vibration isolators under pumps and blowers when space allows. Keep isolators sized so they do not bottom out during startup or maintenance.
- Control alignment at interfaces. Air manifolds and electrolyte plumbing should be aligned before tightening. Misalignment forces the structure to “fight” itself during thermal expansion and vibration.
- Add damping intentionally. Steel frames can ring. Adding constrained-layer damping pads or using thicker sections at known resonant panels reduces ringing without changing the whole design.
A simple example: if a blower is mounted directly to the same plate that supports the stack, the plate can couple blower vibration into the stack frame. Moving the blower to a separate subframe with isolators often reduces transmitted vibration more effectively than adding mass to the stack frame.
Pipe and Air Path Support Practices
Pipes and ducts are vibration amplifiers when they are under-supported or allowed to move freely at the wrong points.
- Support spacing. Use manufacturer guidance for maximum span and add intermediate hangers where needed. Long spans behave like beams and can resonate.
- Use spring hangers or snubbers appropriately. For thermal expansion, allow controlled movement while preventing excessive sway. Snubbers limit motion during transient events.
- Avoid rigidly coupling dissimilar components. A rigidly clamped duct connected to a flexible blower outlet can create stress at the connection. Use flexible couplings rated for the medium and temperature.
- Check for flow-induced vibration. Pulsating flow can excite resonances in long runs. If you see periodic noise that matches pump cycles, shorten runs, add damping, or adjust support locations.
Concrete example: a long air duct with a single support near the blower can develop a “standing wave” pattern. Adding a second support near the middle and using a short flexible section at the blower connection can reduce both noise and stress at the duct joints.
Electrical and Sensor Integrity Under Vibration
Vibration can cause intermittent electrical contact even if the battery is electrically healthy.
- Strain relief for cables. Route cables with gentle bends and secure them to prevent fretting at connectors.
- Connector selection and torque discipline. Use connectors rated for vibration and apply torque to the specified value. Over-torquing can crack housings; under-torquing can loosen under cyclic loads.
- Separate power and signal paths. Keep signal cables away from high-current busbars where vibration-driven micro-motion can worsen noise pickup.
- Mount sensors to stable reference points. If a temperature sensor is mounted on a vibrating panel, it will report “mechanical temperature” effects rather than true process temperature.
Measurement and Acceptance Checks
Treat vibration like a commissioning variable, not a maintenance surprise.
- Baseline measurements. Record vibration spectra at idle and during typical operating modes for each major machine.
- Use accelerometers at multiple points. Measure near pump mounts, duct hangers, and the stack frame. If the stack frame shows high amplitude at a frequency matching blower rotation, coupling is likely.
- Track trends. A gradual increase in a specific harmonic often indicates bearing wear, loose mounts, or changes in alignment.
- Define pass criteria. Set thresholds based on equipment ratings and acceptable noise levels for the site. If you do not have vendor limits, use relative criteria from baseline and require corrective action when values exceed a chosen margin.
Mind Map: Vibration Noise and Structural Support Considerations
Example Workflow for a Typical Installation
- List components and expected excitation frequencies from motor speed and pump cycle characteristics.
- Inspect mounting and support layout to ensure the stack is not load-bearing through piping.
- Add or adjust supports on ducts and pipes using span guidance and check for resonance-prone long runs.
- Introduce isolation at the source by mounting pumps and blowers on a subframe when coupling into the stack frame is observed.
- Commission with vibration measurements at key points and compare idle versus operating spectra.
- Lock in cable management and connector torque so vibration does not become an intermittent electrical issue.
This approach keeps the mechanical system quiet enough to protect seals, sensors, and connections, while also making the vibration behavior measurable and fixable during commissioning.
9. Performance Testing Methods and Acceptance Criteria
9.1 Test Plans for Cell Module and System Level Verification
A good test plan starts with a simple promise: every measurement has a purpose, every pass/fail rule is tied to a requirement, and every test leaves behind data you can use later. For iron-air battery storage, that means verifying electrochemistry, fluid and air handling, electrical safety, and control behavior—first at the cell-module level, then at the full system level.
Test Objectives and Verification Scope
Begin by listing what “verified” means for your project. Typical objectives include:
- Capacity verification: confirm usable energy under defined discharge profiles.
- Efficiency verification: quantify round-trip efficiency components, not just overall energy.
- Power capability verification: confirm voltage response and current limits at multiple loads.
- Stability verification: check performance drift across repeated cycles.
- Safety verification: confirm protections trigger correctly and limits are respected.
A practical approach is to map each objective to a measurable requirement and then to a test. For example, if you require stable operation at a target current density, you test voltage regulation and air-side oxygen utilization at that current, not just at a nominal point.
Foundational Test Philosophy
Use a staged plan so you don’t waste time chasing system-level symptoms that originate in module-level issues.
- Baseline characterization: establish “as-built” performance.
- Subsystem stress: verify air, electrolyte, and electrical paths separately.
- Integrated cycling: validate the full chain under realistic profiles.
- Acceptance verification: confirm compliance with pass/fail criteria.
A small but effective best practice is to run a “dry run” of the test procedure with no electrochemical operation—just valves, pumps, sensors, and data logging. It catches wiring mistakes and control logic gaps before you introduce chemistry.
Mind Map: Test Plan Structure
Module Level Verification Plan
Module tests should isolate the cell stack behavior while still exercising the module’s air and electrolyte interfaces.
Electrochemical and Electrical Checks
- Open-circuit and polarization: measure baseline voltage and polarization curves at controlled conditions.
- Current-step response: apply step changes in current and verify voltage settling time and overshoot limits.
- Coulombic consistency: compare integrated current over time to measured capacity endpoints.
Example: If a module shows a voltage drop that recovers slowly after a current step, you log the time constant and correlate it with air flow and electrolyte circulation rates. That turns a vague symptom into a diagnosis.
Air-Side Checks
- Flow uniformity: verify that oxygen delivery is consistent across the module.
- Humidity and condensation control: confirm that water management stays within limits during operation.
- Pressure drop monitoring: ensure filters and manifolds do not drift into flow restriction.
Example: During a controlled discharge at fixed current, record air inlet pressure, outlet pressure, and stack differential pressure. If differential pressure rises while performance falls, you treat it as a flow-path issue, not an electrochemistry mystery.
Electrolyte Side Checks
- Concentration and level stability: verify electrolyte properties remain within defined bounds.
- Pump performance: confirm flow rate and cavitation-free operation.
- Leak and contamination checks: validate seals and ensure sensor readings are plausible.
Example: If conductivity readings drift during a test, you compare it to pump speed and temperature logs. A temperature-driven conductivity shift is common; a true concentration shift is not.
Module Cycling and Degradation Diagnostics
- Repeat cycles: run at least enough cycles to establish a trend line for voltage and capacity.
- Endpoint definition: use consistent cutoff criteria so comparisons remain fair.
- Diagnostic overlays: compare voltage curves across cycles to identify whether losses concentrate near the start, middle, or end of discharge.
System Level Verification Plan
System tests validate the full chain: module(s) plus power electronics, thermal/hydraulic subsystems, controls, and protections.
Power Conversion Chain
- Inverter or converter response: verify that commanded power translates to actual current and voltage.
- Efficiency accounting: separate electrical conversion losses from battery losses using synchronized measurements.
Example: If grid power commands are met but battery current differs, you check current sensing calibration and converter control loops before touching chemistry settings.
Controls and Dispatch
- State estimation sanity: verify that estimated state variables track measured endpoints.
- Dispatch profile execution: run the same charge/discharge schedule used in operational planning.
- Fault detection: trigger representative faults and confirm safe shutdown or fallback behavior.
Example: For a simulated air-side fault, confirm the system reduces current according to the defined derating curve rather than continuing until a hard cutoff.
Thermal and Hydraulic Stability
- Temperature gradients: ensure sensors show acceptable spread and no runaway behavior.
- Flow stability: verify pump control maintains target flow under load changes.
Data, Calibration, and Pass-Fail Criteria
Every test should include:
- A measurement plan listing sensor locations, sampling rates, and units.
- Calibration traceability for critical sensors like voltage, current, pressure, flow, and temperature.
- Acceptance thresholds tied to requirements, not convenience.
A simple rule: if a pass/fail decision depends on a sensor, that sensor must be calibrated and its uncertainty documented.
Reporting and Corrective Actions
Close the plan with a report structure that makes deviations actionable:
- test summary and configuration
- raw data links or attachments
- processed plots (voltage curves, differential pressure, flow and temperature)
- deviations with likely causes grounded in logged variables
- corrective actions and re-test triggers
A slightly playful but useful habit is to include a “what we learned” section per test stage. It prevents the team from repeating the same confusion in the next run.
9.2 Efficiency Measurements Including Round Trip Metrics
Efficiency is easiest to measure when you separate what you mean by “energy in” and “energy out.” For iron-air systems, that separation matters because electrical losses, auxiliary loads, and electrochemical conversion all stack together. A clean measurement plan starts with a single, consistent definition of round trip efficiency (RTE) and then accounts for what is included.
Core Definitions and What They Include
Start with three quantities measured over the same time window:
- Energy in (E_in): Electrical energy delivered to the system during charging, typically from the grid-side meter.
- Energy out (E_out): Electrical energy delivered during discharging, again from the grid-side meter.
- Auxiliary energy (E_aux): Energy used by pumps, blowers, controls, heaters, and any other non-battery loads.
Then define:
- Round Trip Efficiency (RTE): \(RTE = E_{out} / E_{in}\).
- Battery-Only Efficiency (optional): If you can measure battery terminals separately, compute \(E_{out,bat} / E_{in,bat}\) to isolate electrochemical and internal electrical losses.
A practical rule: if your goal is grid economics, use grid-side meters for RTE. If your goal is diagnosing cell behavior, use battery-terminal efficiency as a companion metric.
Measurement Setup That Doesn’t Lie
Use meters with synchronized timestamps and known accuracy classes. Record at a fixed sampling interval (for example, 1 s or 10 s) and integrate power over time to get energy. Make sure the measurement window begins after steady-state conditions are reached and ends before the system transitions into a different operating mode.
Include auxiliary loads in the grid-side RTE automatically. For battery-only efficiency, measure current and voltage at the battery terminals with sufficient bandwidth to capture control-induced ripple. If you cannot measure terminals directly, approximate battery-only efficiency by subtracting measured auxiliary power from grid power, but only if auxiliary power is stable and well-characterized.
Stepwise Test Procedure for Round Trip Metrics
- Choose a discharge depth and duration. Pick a target state-of-charge swing that matches your intended use case, such as a full discharge at a defined C-rate or a long-duration discharge at a fixed power.
- Charge to the same endpoint each cycle. Use a consistent termination condition such as a target state-of-charge estimate or a fixed charge energy limit.
- Rest periods if needed. If the system requires a rest to stabilize temperature or electrolyte distribution, include it consistently in every cycle. Excluding rests in one test and including them in another will change RTE.
- Discharge under the same load profile. Keep power setpoints and ramp rates consistent. If the discharge is power-controlled, log the actual delivered power, not just the setpoint.
- Compute RTE and report the window. Use the same integration boundaries for E_in and E_out.
A small example: suppose a grid meter shows 120 kWh delivered during charging and 92 kWh delivered during discharging. Then RTE is 92/120 = 0.767, or 76.7%.
Decomposing Losses Without Overcomplicating
RTE can be interpreted as the product of multiple efficiencies:
- Power conversion efficiency: losses in inverters and DC-AC/DC-DC stages.
- Auxiliary efficiency: energy spent on pumps and air handling.
- Electrochemical efficiency: conversion losses inside the cell stack.
- Thermal management losses: energy used to maintain operating conditions.
You can estimate contributions by measuring each stage’s power. For example, if inverter efficiency is 96% at the operating point and auxiliary loads average 6 kW during a 10-hour cycle, you can compute how much of the 120 kWh input is “spent” before it even reaches electrochemical conversion.
Mind Map: Round Trip Efficiency Measurement
Reporting Metrics That Help Engineers Actually Use the Numbers
A useful RTE report includes more than a single percentage. Include:
- State-of-charge swing used for the cycle.
- Discharge duration and average power (because efficiency changes with operating point).
- Temperature range during charge and discharge.
- Auxiliary load profile (average kW and whether it changes with air flow or pump speed).
- Uncertainty estimate from meter accuracy and integration resolution.
If you run multiple cycles, report mean RTE and the spread. A tight spread suggests stable operation; a wide spread often points to inconsistent endpoints, varying auxiliary control behavior, or measurement window mismatch.
Example: Comparing Two RTE Runs
Run A charges with a higher auxiliary air flow and reaches the same discharge endpoint. Grid energy in is 120 kWh and out is 92 kWh, so RTE is 76.7%. Run B uses a lower air flow, still reaches the same endpoint, and shows 118 kWh in and 92 kWh out, so RTE is 92/118 = 78.0%.
The difference is not magic; it’s energy allocation. The system delivered the same usable discharge energy but spent less energy on auxiliary operation during charge. That’s exactly the kind of insight RTE should provide when measured consistently.
9.3 Capacity Determination Under Realistic Operating Conditions
Capacity is not just a nameplate number. For iron-air systems, it depends on how the cell is actually driven: current profile, air access, electrolyte condition, temperature, and how you define “done.” A realistic capacity test therefore starts with a clear stopping rule, then reproduces the operating chain you expect in the field.
Define Capacity in Operational Terms
Start by choosing what you mean by capacity. In practice you will report at least two values:
- Energy capacity in kWh at a specified power and efficiency assumption.
- Usable capacity in Ah or kWh between a start state and an end state.
A common stopping rule is a voltage limit at the stack terminals (for example, end-of-discharge when voltage drops below a threshold under the test current). For iron-air, you also need a rule for air-side limits, because oxygen access can become the bottleneck even when the electrolyte still has charge.
Best practice example: If your dispatch uses a 2-hour discharge at a fixed current, define capacity using that same current and the same voltage cutoff. If your dispatch uses a variable load, define capacity using the same load shape and compute energy by integrating measured power.
Build a Realistic Test Profile
Realistic operating conditions include more than “constant current.” Use a profile that matches your expected duty cycle:
- Current shape: constant, stepwise, or ramped.
- Rest periods: short pauses can change concentration gradients and gas distribution.
- Temperature: either controlled or recorded tightly enough to interpret results.
Best practice example: For a grid application that cycles daily, include a short rest after charge before discharge. If you skip it, you may overestimate capacity because the system is still “settling” from the charge.
Prepare the Cell State and Verify It
Capacity depends strongly on initial state. Before testing, record:
- Electrolyte concentration and temperature.
- Stack and air-side pressures/flows.
- Any recent maintenance actions that could shift performance.
Then run a short “stabilization” segment at the test conditions to confirm that measurements are steady. This prevents you from mistaking transient behavior for true capacity.
Best practice example: If the air flow controller has hysteresis, the first few minutes can show unstable oxygen utilization. Stabilize long enough that voltage and current are consistent before you start the capacity timer.
Measure the Right Quantities
To determine capacity without guessing, measure both electrical and limiting-side indicators:
- Electrical: stack voltage, current, and temperature at defined points.
- Air side: flow rate, pressure drop, and humidity or condensation indicators if available.
- Electrolyte side: temperature and any proxy for concentration changes.
Compute capacity using measured current and time for Ah, and integrate power for kWh. Always log sampling rate and sensor calibration status.
Best practice example: If you only log voltage and current, you might conclude “electrolyte ran out” when the real cause was air starvation. Adding flow and pressure drop data lets you separate those failure modes.
Use Acceptance Criteria That Match the Use Case
Capacity determination should include criteria for whether the test is valid and whether the result is acceptable:
- Validity checks: stable temperature band, stable air flow within tolerance, no sensor dropouts.
- End-of-test criteria: voltage cutoff reached, air-side limit reached, or a maximum time limit.
- Repeatability: at least two runs with the same start state.
Best practice example: If the first run ends early due to an air-side restriction, do not average it with later runs. Fix the restriction or adjust the test conditions, then retest.
Mind Map: Capacity Determination Workflow
Example: Two-Hour Dispatch Test with Air-Side Awareness
Assume a planned discharge is 2 hours at a fixed current. You set a voltage cutoff that corresponds to your operational minimum. During the test you keep air flow at the same setpoint used in operation and log flow and pressure drop.
- If voltage reaches the cutoff at 1.6 hours while flow and pressure drop remain stable, the limiting mechanism is likely electrochemical exhaustion or electrolyte condition.
- If voltage declines faster while pressure drop rises or flow cannot be maintained, the limiting mechanism is likely oxygen access.
In both cases you report capacity using the same stopping rule, but you also record the limiting mechanism so the result is actionable. That’s the difference between “a number” and “a usable number.”
Example: Variable Load Capacity Using Power Integration
For a variable load profile, you compute energy by integrating measured power over time rather than assuming a constant efficiency. You still apply the same end-of-test rule, such as a voltage cutoff, but the capacity reflects the actual dispatch shape.
If the system hits the voltage cutoff during a high-load segment, the test ends immediately. This prevents the common mistake of continuing the timer and then retroactively “correcting” the result.
Practical Summary
Realistic capacity determination is a controlled experiment with operational intent: define stopping rules, reproduce the dispatch shape, stabilize initial conditions, measure the likely limiting sides, and enforce validity and repeatability checks. When you do that, capacity becomes a reliable input to system design and operation rather than a guess with a spreadsheet.
9.4 Degradation Diagnostics Using Voltage Curves and Trends
Voltage curves are the storage system’s “body language.” When iron-air cells age, the shape of the discharge voltage changes before the system fully fails. The goal of degradation diagnostics is to separate three things: normal operating variation, reversible effects (like temperature and electrolyte condition), and irreversible loss (like electrode or air-side degradation).
Foundational Measurements That Make Curves Comparable
Start by standardizing what you plot. Use the same current density, the same discharge duration window, and the same temperature band. If you cannot hold temperature constant, record it and normalize later.
A practical baseline workflow:
- Run a controlled discharge at a fixed current density (for example, 0.5 A/cm²) from a defined starting state of charge.
- Record cell voltage at a consistent sampling interval (for example, every 5 seconds) and log stack temperature and air flow rate.
- Repeat the same test after maintenance and after any electrolyte handling.
Then compare curves using two views:
- Instantaneous curve shape: voltage vs. time or voltage vs. capacity.
- Trend metrics: single numbers derived from the curve that track change over months.
Voltage Curve Features That Signal Specific Degradation Modes
A discharge curve typically has regions: an initial drop, a mid-region that looks fairly steady, and a late-region where voltage falls faster. Degradation often shows up as a systematic shift in one region.
Common diagnostic cues:
- Higher initial voltage drop: often points to increased internal resistance or contact issues. If the initial drop grows while the mid-region stays similar, suspect electrical or ionic pathway resistance.
- Mid-region sag: suggests slower kinetics or catalyst/electrode activity loss. If the curve becomes “flatter downward” across the middle, the cell is struggling to sustain the reaction.
- Earlier late-region collapse: indicates reduced usable capacity, often tied to air-side limitations, electrolyte depletion/imbalance, or electrode utilization limits.
- Curve widening between repeated tests: suggests unstable operating conditions, measurement drift, or inconsistent air flow distribution.
Mind Map: From Raw Curves to Root Causes
Trend Metrics That Turn Curves into Decisions
Instead of relying on a single curve, compute metrics that are stable and easy to compare.
Suggested metrics:
- Initial drop: voltage at 10 seconds minus voltage at 60 seconds (or similar fixed window). Track its change.
- Mid-region slope: linear fit slope over a capacity window where the curve is relatively smooth.
- Knee capacity: capacity at which voltage falls below a chosen threshold relative to the mid-region trend.
- End voltage at fixed capacity: voltage when the cell reaches a fixed delivered capacity, not a fixed time.
Example: Suppose end voltage at 20 Ah/cm² drops by 80 mV over three months. If initial drop increases by 40 mV but mid-region slope is unchanged, the likely culprit is resistance growth rather than reaction kinetics. If mid-region slope worsens while initial drop stays stable, the issue is more likely kinetic or air-side mass transport.
Systematic Diagnostic Procedure with an Integrated Example
-
Confirm test comparability
- If temperature differs by more than your tolerance (for example, 3°C), normalize voltage using the recorded temperature and re-check the curve shape.
- Verify air flow rate was within the target band.
-
Extract curve features
- Mark the initial drop, mid-region slope window, and knee region on each curve.
-
Check repeatability first
- If two consecutive tests on the same day produce different knee positions, treat the difference as operational variability until instrumentation and air distribution are verified.
-
Correlate with logs
- If air flow pressure rises while knee capacity falls, air-side restriction is a strong candidate.
- If electrolyte concentration readings drift and end voltage falls without a mid-region slope change, electrolyte imbalance becomes more likely.
-
Validate with a targeted follow-up test
- For suspected resistance growth, run the same discharge at a slightly lower current density. If voltage improves proportionally with current reduction, resistance is likely.
- For suspected mass transport limitation, increase air flow while holding current constant. If the knee shifts to higher capacity, air-side limitation is implicated.
Example scenario: After a maintenance event dated 2024-03-15, the next discharge shows a larger initial drop and an earlier knee, but the mid-region slope is only slightly worse. The combined pattern points to both increased resistance (initial drop) and reduced usable capacity (earlier knee). The next step is to inspect electrical contacts and verify air distribution, then repeat the discharge with controlled air flow to confirm which change moves the knee.
Mind Map: Validation Checks Before Root Cause
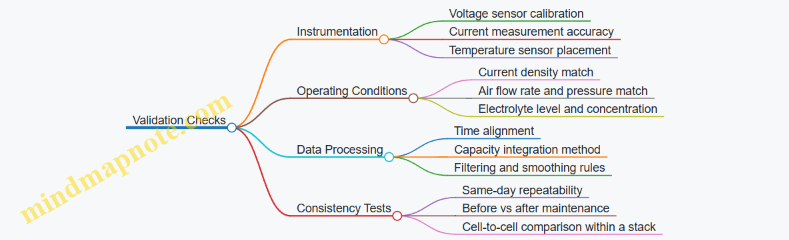
Practical Acceptance of Diagnostic Confidence
A good diagnostic conclusion is specific and bounded. State what changed (which curve region), what did not (which metric stayed stable), and what evidence supports the hypothesis (correlation with air or electrolyte logs, and response to targeted follow-up tests). When multiple metrics shift together, treat the result as a ranked list of likely causes rather than a single verdict. This keeps maintenance actions grounded in what the curves actually show.
9.5 Acceptance Documentation for Handover and Warranty Support
Acceptance documentation turns commissioning results into something usable: a clear record of what was built, how it was tested, and what to do when something behaves oddly. For iron-air systems, the goal is especially practical because performance depends on electrolyte condition, air-side behavior, and careful electrical protection.
What Acceptance Documentation Must Prove
Start with three foundational proofs, each tied to a measurable artifact.
- The system was built to the approved design. Include a configuration snapshot: stack layout, rated current and voltage, air-path components, electrolyte tanks and pumps, sensors installed, and control firmware version.
- The system performed within defined limits under acceptance tests. Provide test reports with pass/fail criteria, measured values, and uncertainty notes where relevant.
- The system can be operated and maintained safely. Deliver operating procedures, safety checklists, and a maintenance plan that matches the installed hardware.
A simple way to keep this systematic is to map every document to one of the three proofs, so no page exists “just because.”
Document Set Structure
Use a consistent folder structure so handover is not a scavenger hunt.
- Project Record: as-built drawings, bill of materials, wiring diagrams, sensor lists, and control logic descriptions.
- Test and Commissioning Pack: pre-start checks, functional tests, performance tests, and safety tests.
- Operations Pack: normal operating procedures, start-up and shutdown sequences, alarm response steps, and logging requirements.
- Maintenance Pack: inspection intervals, electrolyte handling steps, air-path cleaning or replacement criteria, and calibration schedules.
- Warranty and Support Pack: warranty terms summary, spares list, escalation contacts, and troubleshooting decision trees.
Integrated Handover Workflow
Handover works best when it follows the same order as commissioning.
- As-built verification meeting: confirm installed components match the as-built record; resolve any “temporary” items before final sign-off.
- Evidence review: walk through each acceptance test report and show how it ties to the acceptance criteria.
- Operator training session: use the operations pack to run a supervised start-up and a controlled shutdown.
- Support readiness check: confirm the warranty pack includes the exact information needed for troubleshooting without guessing.
A good acceptance binder includes a one-page “system identity card” at the front: site name, serial numbers, firmware versions, and a link between each sensor tag and its measured quantity.
Mind Map: Acceptance Documentation Coverage
Acceptance Criteria Evidence That Actually Helps
For each test, include the minimum evidence set: objective, setup, procedure, results, and interpretation.
- Objective: what was being verified, such as stable voltage under a defined current profile.
- Setup: sensor calibration status, flow rates or pressure setpoints, and environmental conditions.
- Procedure: the exact sequence used, including any soak times.
- Results: time-series plots or summarized metrics, plus pass/fail against the acceptance limits.
- Interpretation: a short note explaining what the results mean for operation, not a long story.
Example: if air-side oxygen utilization was limited by humidity or condensation risk, the report should state the observed symptom, the corrective action taken during commissioning, and the operational constraint that operators must follow.
Warranty Support Pack Contents
Warranty support should reduce back-and-forth by making troubleshooting reproducible.
Include:
- System identity card with serial numbers, stack/module identifiers, and sensor tags.
- Recommended diagnostic workflow that starts with safe checks (power isolation status, sensor plausibility, and alarm logs) before deeper inspection.
- Spare parts list with part numbers, quantities, and typical replacement triggers.
- Escalation template for field teams: what to capture (log files, alarm codes, electrolyte condition notes, and last maintenance date).
Example: if a voltage curve shows a sudden shift, the workflow should instruct operators to capture the last 24 hours of dispatch logs, confirm electrolyte concentration readings were within the expected range, and verify air-path flow or pressure readings before contacting support.
Final Sign-Off Checklist
Before signatures, confirm the binder is complete and consistent.
- Every acceptance test has a report with pass/fail and stored raw data references.
- Every alarm mentioned in the operations pack is mapped to a documented response.
- Every maintenance task has a safety note and a “stop conditions” section.
- Warranty pack includes the exact information support needs to reproduce the issue.
When these items are satisfied, handover becomes a controlled transfer of knowledge, not a transfer of uncertainty.
10. Safety Engineering and Compliance for Iron-Air Installations
10.1 Hazard Identification for Electrolyte Handling and Storage
Iron-air systems depend on electrolyte chemistry and water balance, so the main hazards come from what the electrolyte is, how it’s moved, and what happens when it meets air, skin, or incompatible materials. Hazard identification should start with a simple question: “What can go wrong during normal handling, maintenance, and abnormal events?” Then you map each failure mode to controls that are practical on a real site.
Step 1: Define Hazard Boundaries and Inventory
Start by listing every electrolyte-related item that can contact people or the environment: bulk tanks, day tanks, transfer hoses, pumps, filters, spill trays, secondary containment, and sampling ports. For each item, record the electrolyte concentration range, temperature range, and any additives used for corrosion control or water management. A useful best practice is to label containers with the exact concentration and date of last conditioning, because “same chemical name” does not mean “same hazard.”
Example: If your electrolyte is a concentrated alkaline solution, the hazard is not just “corrosive.” The severity depends on concentration and temperature. A hot, concentrated sample taken during commissioning can cause faster tissue damage than a cool, diluted sample.
Step 2: Identify Exposure Routes and Severity
There are three common exposure routes: skin/eye contact, inhalation of mist or vapors, and ingestion. Add a fourth route for operational reality: contact through contaminated tools and surfaces. Severity depends on concentration, contact time, and whether the electrolyte can react with air or metals.
Best practice: treat sampling as a high-risk task. Sampling ports often bypass normal transfer controls, and they encourage “quick checks” that shorten PPE time. Make sampling procedures include a fixed PPE set, a spill kit location, and a defined waste container.
Step 3: Map Handling Activities to Failure Modes
Break the work into activities: receiving electrolyte, storing it, transferring it to the system, circulating it during operation, draining it for maintenance, and cleaning. For each activity, list failure modes such as leaks, overpressure, hose rupture, wrong concentration transfer, incompatible cleaning agents, and blocked vents.
Example: A transfer hose left unrestrained can whip if a quick-connect fails. The hazard is not only the chemical release; it’s also mechanical injury plus splashing that reaches eyes. Restraint clips and drip trays reduce both hazards at once.
Step 4: Consider Storage-Specific Hazards
Storage hazards include tank corrosion, pressure buildup from blocked vents, and precipitation or stratification that changes concentration at the outlet. Secondary containment must be sized for the largest credible release, and it must be compatible with the electrolyte.
Best practice: verify compatibility before the first fill. A common mistake is using generic sealants or coatings that look fine during a visual inspection but degrade under chemical exposure.
Step 5: Include Abnormal Events and Maintenance Tasks
Abnormal events include power loss to pumps, valve mispositioning, and emergency shutdown. Maintenance tasks include filter changes, gasket replacement, and pump seal servicing. These are hazard multipliers because they create openings in the system.
Example: When changing a filter, the electrolyte may be under residual pressure or trapped in the housing. A controlled depressurization step plus a catch container prevents “surprise spray,” which is the fastest route to eye injury.
Mind Map: Electrolyte Hazard Identification
Step 6: Turn Hazards into Actionable Controls
Hazard identification is only useful if it produces a control list that matches the failure modes. For each hazard, specify: the engineering control (containment, ventilation, compatible materials), the administrative control (labels, checklists, concentration verification), and the emergency control (spill response steps and first aid readiness).
Best practice: use a “task-to-control” checklist for the top five tasks that create the most exposure opportunities: receiving, transfer connection, sampling, filter change, and draining. Each checklist should include a pre-task confirmation step and a post-task surface check.
Example: For sampling, the checklist can require confirming the sampling valve position, using a catch container, wearing eye protection, and wiping the sampling port exterior after the sample is taken. That last step prevents the “clean-looking but contaminated” scenario that causes later skin contact.
Step 7: Document and Verify
Record hazards in a structured format that links activity → failure mode → exposure route → control. Then verify controls through walkdowns and dry runs, especially for valve sequences and depressurization. A control that exists on paper but is missing from the work area is effectively not a control.
Example: If secondary containment is present but the spill kit is stored elsewhere, the hazard remains. Verification should include physically locating the kit, confirming eyewash access, and checking that waste containers are compatible and labeled before work begins.
10.2 Electrical Safety Practices for High Current Systems
High-current systems fail in ways that are fast, local, and sometimes quiet until they aren’t. Electrical safety for an iron-air installation starts with understanding what can go wrong at the cell stack and power conversion interfaces, then building layered controls that reduce both the likelihood and the consequences.
Foundational Concepts That Drive Safe Design
Energy, Current, and Fault Severity
A high-current fault is not just “more current.” It is more heat, more magnetic forces, and more arc energy. For example, a loose busbar connection can look fine at low current but heat up under load, eventually carbonizing insulation and creating a path for arcing. The safety practice is to treat every conductor and connection as a potential heater and arc source.
Electrical Isolation and Touch Safety
Touch safety is about preventing hazardous voltage on accessible metal parts. In practice, you design for two barriers: insulation that prevents contact and protective grounding that ensures any accidental contact trips protection quickly. If you rely on only one barrier, you are betting the farm on perfect assembly.
Layered Protection Strategy
Protective Devices and Coordination
Use protective devices that match the fault modes you expect: fuses or breakers for overcurrent, ground-fault detection where applicable, and fast isolation for short circuits. Coordination means the device closest to the fault clears first, without leaving upstream equipment to absorb the arc.
Example: If a stack module develops a short, a module-level fuse should open before the main breaker sees enough energy to damage buswork. During commissioning, verify trip curves with test equipment or documented settings, not by “it should work.”
Physical Barriers and Arc Containment
Enclosures, covers, and insulated barriers reduce the chance that a fault becomes a human contact event. Arc containment is different from “a box around it.” It is about preventing arc propagation and directing energy away from service personnel.
Example: If busbars are routed near maintenance access, add insulated barriers and ensure the enclosure can withstand internal fault pressure without opening gaps that expose live parts.
Segregation of Live Conductors
Separate high-voltage or high-current sections from low-voltage control wiring to reduce coupling and nuisance trips. Even when voltage levels are not extreme, shared routing can create induced currents that confuse sensors and protection logic.
Safe Installation Practices
Torque, Contact Quality, and Maintenance Discipline
Most high-current failures start as “small contact problems.” Use specified torque procedures, clean mating surfaces, and controlled assembly tools. Record torque values and inspection results.
Example: During installation, mark fasteners with tamper-evident paint and log torque. During routine maintenance, re-check contact resistance at representative points. If resistance rises, treat it as a safety issue, not a performance issue.
Cable Management and Strain Relief
Cables should not be pulling on terminals. Provide strain relief so vibration and thermal cycling do not loosen connections.
Example: Route flexible leads with service loops and secure them so that movement during maintenance does not stress crimped ends.
Grounding, Bonding, and Verification
Protective Grounding Layout
Bond all exposed conductive parts to a protective earth conductor sized for fault clearing. Keep the grounding path short and low impedance.
Verification Tests
Perform continuity checks and insulation resistance tests before energization. After installation, verify that protective earth connections are intact and that no conductive parts are left floating.
Example: If an enclosure is mounted on non-conductive pads, you still need a deliberate bonding path. A continuity test catches the “it looks grounded” mistake.
Operational Safety Procedures
Lockout, Tagout, and Stored Energy Awareness
Even when the system is “off,” capacitors and power electronics can hold charge. Use a written lockout/tagout procedure that includes discharge verification.
Example: Before opening a cabinet, measure voltage at the relevant terminals and confirm it is below the safe threshold defined in your procedure.
Safe Work Boundaries
Define approach distances and restricted zones around energized parts. Use signage and physical access control so the boundary is not a suggestion.
Example: If maintenance requires proximity to busbars, require a permit-to-work and ensure the cabinet is in the correct state with verified isolation.
Instrumentation for Safety
Sensing That Supports Protection
Protection needs measurements that are reliable under fault conditions. Use current sensing and temperature sensing where they can prevent damage that becomes a safety hazard.
Example: If a busbar temperature sensor shows a rising trend during operation, treat it as an early warning for contact degradation and investigate before it becomes an arc event.
Monitoring and Alarm Thresholds
Set alarms to prompt action before protective devices must intervene. Alarms should be actionable, not decorative.
Mind Map: Electrical Safety Practices
Practical Checklist for High Current Cabinets
- Confirm protective device settings and coordination are documented and verified.
- Inspect torque marks, contact surfaces, and cable strain relief.
- Verify protective earth continuity and insulation resistance before energization.
- Ensure enclosures and barriers prevent access to live parts during normal work.
- Use lockout/tagout with measured discharge verification.
- Validate that alarms trigger investigation before protection must clear a fault.
These practices work together: mechanical integrity prevents the first fault, electrical protection limits fault energy, and procedures prevent people from becoming the path that completes the circuit.
10.3 Ventilation and Air Path Safety Measures
Iron-air systems move oxygen through a controlled air path, and that air path can become a safety topic for two reasons: (1) oxygen availability changes reaction rates and heat generation, and (2) leaks can spread electrolyte mist or corrosive vapors into occupied areas. Ventilation is therefore not just “more airflow”; it is a planned way to keep air composition, pressure, and exposure routes under control.
Foundational Concepts for Safe Air Path Design
Start with pressure relationships. If the air path sits at higher pressure than the surrounding enclosure, leaks tend to push outward. If it sits lower, leaks tend to pull inward, which is usually easier to manage with filtration and containment. A practical best practice is to define a pressure hierarchy: battery enclosure slightly negative relative to the room, air-handling ductwork near-neutral, and any service compartments isolated with controlled exhaust.
Next, treat airflow as a measurable system variable. Ventilation should be sized for worst-case operating conditions such as maximum fan speed, maximum electrolyte circulation, and the highest expected oxygen flow. Then verify it with commissioning measurements: differential pressure across boundaries, air change rate in enclosures, and exhaust flow at the duct termination.
Finally, separate “air for reaction” from “air for safety.” The air electrode needs oxygen and humidity control, while the safety ventilation needs reliable removal of any accidental mist. Mixing these goals leads to confusing controls and harder troubleshooting.
Ventilation Architecture and Boundary Control
Use three layers of protection that work together.
- Primary containment: sealed stack and duct joints with leak-tight gaskets and properly torqued fasteners.
- Secondary containment: an enclosure around the stack and air-handling components, designed to be slightly negative.
- Tertiary exhaust: a dedicated exhaust path that captures air from the most likely leak zones.
A simple rule for exhaust placement: pull air from where leakage would first collect. For mist, that is typically near low points and corners where droplets can settle. For gas-phase contaminants, it is often near the highest concentration region, which depends on airflow patterns. Use smoke tests during commissioning to confirm that air moves toward the exhaust rather than toward doors, cable trays, or operator breathing zones.
Air Path Components That Affect Safety
Air paths include ducts, manifolds, valves, filters, and humidification or dehumidification elements. Each component can create a failure mode.
- Filters: A clogged filter can reduce oxygen delivery and increase pressure upstream, which may force leakage through weak joints. Install differential pressure indicators and set maintenance triggers.
- Valves and dampers: Stuck-open behavior can defeat isolation. Use position feedback and interlocks so the safety exhaust cannot be “off” while the air path is active.
- Humidification control: Condensation in ducts can carry electrolyte residues. Insulate cold sections, slope ducts to drain where appropriate, and ensure drains route to a controlled collection point.
Monitoring and Interlocks That Prevent Unsafe States
Ventilation safety should be enforced by logic, not by good intentions. At minimum, monitor differential pressure between enclosure and room, and monitor exhaust fan status. Then implement interlocks such that:
- If enclosure pressure rises above the allowed threshold, the system transitions to a safe operating mode or stops oxygen flow.
- If exhaust flow is lost, oxygen delivery is inhibited immediately.
- If a filter differential pressure exceeds its limit, the system either reduces load or halts until maintenance is performed.
A useful commissioning habit is to log ventilation signals alongside stack voltage and current. If a ventilation alarm occurs, you can correlate it with changes in cell behavior and confirm whether the alarm is a true safety event or a nuisance caused by maintenance activity.
Example: Designing Ventilation for a Small Pilot Enclosure
Assume a pilot enclosure contains the stack and air-handling unit. The enclosure is set to a target differential pressure of -5 Pa relative to the room. Two exhaust inlets are placed near the lowest duct section and near the air-handling manifold. During commissioning, smoke is released at the manifold joint while the exhaust fan runs; the smoke should move toward the inlets without crossing toward the door.
Next, the system runs at maximum oxygen flow for a short test window. Differential pressure is recorded continuously, and exhaust flow is checked against the design value. Finally, a simulated filter restriction is introduced to confirm that the differential pressure alarm triggers the intended safe response.
Mind Map: Ventilation and Air Path Safety Measures
Practical Checklist for Field Readiness
Before energizing the system, verify that exhaust fans are functional, dampers move to the correct positions, differential pressure sensors are calibrated, and duct joints are leak-checked. During operation, confirm that alarms correspond to measurable conditions and that maintenance actions restore ventilation performance, not just silence the alarm.
10.4 Fire Protection Planning And Emergency Shutdown Procedures
Fire protection for iron-air battery storage is mostly about controlling three things: ignition sources, fuel availability, and how quickly you can put the system into a safe state. The “safe state” should be defined in engineering terms, not vibes: isolate electrical energy, stop reactive gas exchange, prevent electrolyte release from spreading, and keep occupants from being exposed to corrosive mist or hydrogen-like off-gassing.
Foundational Fire Hazards to Plan For
Start with a hazard map that ties each risk to a specific component and failure mode. For example, electrolyte handling can create a corrosive spray hazard even when there is no fire. Air-side equipment can create ignition risk if hot surfaces or electrical faults exist near flammable contaminants. Electrical sections can arc if insulation degrades or if water ingress creates unintended conductive paths.
A practical way to structure this is to classify hazards by “what burns” and “what spreads.” In iron-air systems, the electrolyte is typically not treated as a fuel, but it can still worsen outcomes by corroding seals, undermining containment, and increasing leakage pathways. Therefore, fire protection planning should include both thermal fire response and chemical release control.
Fire Protection Planning Workflow
- Define protected zones: stack enclosure, electrolyte containment area, air handling ducting, electrical cabinets, and control room.
- Set detection strategy: smoke/heat where appropriate, plus leak detection for electrolyte and abnormal pressure/flow on air paths.
- Choose suppression and isolation: suppression for electrical cabinets and enclosure fires, and isolation for air and electrolyte circuits.
- Write shutdown actions as a sequence: actions should be ordered to avoid creating new hazards, such as stopping ventilation before isolating a leak.
- Validate with drills: run tabletop exercises and at least one controlled functional test of shutdown interlocks.
Emergency Shutdown Procedure Design
Emergency shutdown should be deterministic. Operators should not have to interpret the situation under stress; the system should interpret it.
Core shutdown objectives
- De-energize: open main contactors and isolate battery modules from the PCS.
- Stop reactive exchange: close air valves or dampen oxygen supply to the air electrode path.
- Control electrolyte movement: stop pumps, close isolation valves, and ensure any remaining electrolyte drains to a safe containment volume.
- Maintain safe ventilation: keep exhaust running if it is needed to prevent accumulation of corrosive mist.
Interlock examples
- If a cabinet temperature sensor exceeds a threshold, trigger cabinet isolation and suppression release.
- If electrolyte leak sensors detect liquid above a set level, stop pumps, close valves, and switch ventilation to a higher duty mode.
- If an air-side pressure anomaly indicates blockage or runaway flow, stop air circulation and move to a conservative state.
Mind Map: Fire Protection and Shutdown Logic
Example Emergency Shutdown Sequence
Scenario: electrolyte leak detected inside the stack enclosure with rising enclosure humidity and a nearby electrical cabinet temperature trending upward.
- Immediate system action: open battery-to-PCS contactors and stop electrolyte pumps.
- Isolation: close air-side valves to reduce oxygen availability at the air electrode.
- Containment: route remaining electrolyte to the designated sump via gravity drain valves.
- Ventilation: keep exhaust running at elevated duty to reduce corrosive mist concentration.
- Suppression readiness: if cabinet temperature crosses the fire threshold, release suppression and keep electrical isolation active.
- Operator confirmation: require a manual reset after inspection of leak sensors, valve positions, and cabinet integrity.
This sequence avoids a common mistake: shutting down ventilation too early. If mist is present, the system should reduce exposure while it isolates the source.
Emergency Shutdown Documentation and Training
Your shutdown procedure should fit on one page per role: operator, maintenance technician, and emergency responder liaison. Include the exact signals that trigger each action, the expected valve and contactor states, and the inspection checklist before reset.
A small but effective practice is to define “reset gates.” For example, reset is blocked until leak sensors read dry, air valves report closed, and cabinet temperature returns below a safe threshold. That turns “we think it’s fine” into “the system confirms it’s safe.”
Example: Reset Gate Checklist
- Electrolyte leak sensors: dry state confirmed
- Air valves: closed position verified
- Main contactors: open and interlock latched
- Ventilation: returned to normal after enclosure clears
- Visual inspection: no active dripping at manifold joints
When these gates are explicit, emergency shutdown becomes a controlled process rather than a guessing game with a stopwatch.
10.5 Training Checklists and Safety Signage for Field Operations
Field operations for iron-air battery systems succeed when people can answer three questions quickly: What is normal? What is not normal? What do I do next? Training checklists and safety signage should be built around those answers, then reinforced with short, repeatable drills.
Training Foundations for Field Teams
Start with role-based training so each person learns only what they must use. A technician who opens air-path panels should not need the same depth as an operator who manages dispatch setpoints, but both should understand the same safety boundaries.
Core concepts to cover in the first session
- Energy storage reality: treat the system as having stored energy even when power is “off,” because control states and residual conditions can still create hazards.
- Electrolyte handling rules: identify what “clean, contained, and labeled” means in practice, including spill response steps and PPE selection.
- Air-path hazards: recognize that oxygen access and humidity management can create condensation, corrosion, and unexpected flow conditions.
- Electrical boundaries: understand where high current exists, how interlocks behave, and why bypassing them is never a “quick fix.”
Example drill: During a 15-minute exercise, a trainee performs a simulated “pre-start” walkdown using a checklist card. The instructor intentionally introduces one abnormal cue, such as a missing label or an unexpected pressure reading. The trainee must stop, report, and follow the escalation path.
Field Checklists That Actually Get Used
Checklists should be short enough to read under stress and specific enough to prevent guesswork. Each item should have an observable condition and a clear action.
Pre-Start Checklist
- Verify signage is present and legible at access points.
- Confirm lockout/tagout status matches the work scope.
- Check electrolyte containment integrity, including visible wetness and hose routing.
- Confirm air-path components are seated and seals are intact.
- Validate sensors are connected and readings are within expected ranges.
- Perform a quick “no tools left behind” sweep around covers and panels.
During-Operation Checklist
- Monitor electrolyte level or concentration indicators per site procedure.
- Track air flow or pressure drop trends; treat sudden changes as a stop-and-check trigger.
- Watch temperatures at defined points; investigate outliers rather than averaging them away.
- Confirm alarms are acknowledged and logged with time and operator action.
Shutdown and Maintenance Checklist
- Execute controlled shutdown steps in the specified order.
- Maintain containment and ventilation requirements during access.
- Use a spill kit only after confirming the correct response plan for the specific electrolyte condition.
- Document component status before reassembly to avoid “mystery failures.”
Example: If an air-path pressure drop increases by more than the site threshold, the operator pauses dispatch, checks for blocked intake or condensation, verifies fan/blower operation, then escalates if the trend persists after corrective actions.
Safety Signage That Matches the Checklist
Signage should mirror the checklist language so people do not translate between documents during emergencies. Use consistent icons and placement: near access points, at isolation locations, and at the control interface.
Minimum signage set
- PPE requirements at electrolyte access areas.
- High voltage and high current warning at electrical cabinets and stack access zones.
- Lockout/tagout reminder at isolation switches and disconnects.
- Air-path caution near manifolds and any venting routes.
- Spill response instructions with the exact first steps and who to call.
- Emergency stop and escalation route posted at the operator station.
Example wording: “Stop work if labels are missing or unreadable. Report to supervisor before proceeding.” This prevents silent drift into unsafe assumptions.
Mind Map: Training and Signage Integration
Advanced Details Without Making It Complicated
To reduce training drift, use a “one-page rule” for each checklist: one page per task, with the same headings every time. Keep a sign-off section that records the trainee’s demonstration of the drill, not just attendance.
Example sign-off: “Trainee demonstrated pre-start walkdown, identified one abnormal cue, and followed escalation steps without prompting.” This makes competence measurable.
Finally, schedule refresher sessions around the same checklist structure. A refresher should change one variable—like a different alarm scenario—while keeping the checklist format identical, so the team practices recognition and decision-making rather than re-learning layout.
11. Cost Modeling and Practical Procurement for Ultra-Low-Cost Systems
11.1 Cost Drivers for Materials Manufacturing and Assembly
Cost for iron-air battery storage is mostly a story about what you buy, what you machine, and what you have to assemble without making a mess. The goal in this section is to map those cost drivers from raw materials to finished modules, then show how practical manufacturing choices change the bill.
Foundational Cost Logic from Materials to Modules
Start with the simplest accounting chain: material cost becomes component cost, component cost becomes module cost, and module cost becomes system cost. For iron-air, the “material” bucket is not just iron and electrolyte; it also includes membranes, catalysts, current collectors, seals, and the hardware that keeps air and electrolyte in their assigned places.
A useful rule of thumb is to separate costs into three buckets:
- Consumables and replaceables: items that wear out or get consumed during operation or maintenance.
- Core electrochemical materials: iron electrode, air electrode catalyst layers, electrolyte, and ion-transport membranes.
- Manufacturing and assembly: steps that turn materials into repeatable parts, including forming, coating, curing, stacking, and leak testing.
If you only optimize one bucket, the other two will still show up in the final number. For example, a cheaper membrane that increases failure rate can raise assembly labor and warranty costs.
Materials That Dominate Direct Cost
Iron electrode materials often look straightforward, but cost depends on how the iron is prepared. If the process requires fine particle control, tight moisture handling, or expensive binders, the “cheap iron” assumption stops being true. The manufacturing driver is yield: how much usable electrode material survives processing.
Air electrode catalysts can dominate cost per square meter even when used in thin layers. The driver is not only catalyst price; it is how consistently the catalyst layer adheres and performs after drying and compression. Poor adhesion increases rework and scrap.
Membranes and separators affect both electrochemistry and manufacturing throughput. A membrane that is easy to handle and tolerant of minor process variation reduces assembly time and reduces the number of rejects.
Electrolyte salts and additives contribute to cost, but the bigger driver is purity and conditioning. Higher purity can reduce downstream filtration time and reduce the chance of clogging during operation.
Manufacturing Steps That Drive Labor and Scrap
Assembly cost is rarely proportional to the number of parts. It is proportional to how long it takes to make parts align, seal, and pass tests.
Key manufacturing steps include:
- Electrode preparation and coating: mixing, coating thickness control, drying, and curing.
- Membrane and separator handling: cutting, surface preparation, and avoiding pinholes.
- Stacking and compression: aligning current collectors and ensuring uniform pressure.
- Sealing and leak prevention: gasket selection, torque control, and curing schedules.
- Electrolyte filling and conditioning: fill time, degassing or conditioning steps, and verification.
- Air-side preparation: ensuring gas distribution surfaces are clean and unobstructed.
- Testing and acceptance: electrical checks, pressure/leak tests, and baseline performance.
Each step has a cost lever: cycle time, yield, and test pass rate.
Mind Map: Cost Drivers
Example: How One Process Change Moves the Cost
Imagine two electrode coating approaches for the air electrode catalyst layer.
- Approach A uses a slower drying schedule to improve adhesion. It reduces rework but increases cycle time.
- Approach B dries faster to increase throughput. It raises the defect rate, so more modules fail baseline tests and require rework.
If you only compare catalyst cost, Approach B looks better. But when you include scrap and rework labor, Approach A can win because fewer modules are discarded and fewer technicians spend time troubleshooting.
A practical way to quantify this is to compute an effective cost per passed module:
- Effective module cost = (materials + labor + overhead + test time + rework cost) / (number of modules that pass).
That denominator is where manufacturing reality lives.
Example: Yield as the Hidden Multiplier
Suppose a membrane cutting step has a 92% yield. If you need one membrane per module, then 8% of modules lose their membrane and must be rebuilt. If the membrane is expensive and the assembly is time-consuming, that 8% becomes a large fraction of total cost.
Improving yield from 92% to 96% can reduce the number of rebuilt modules by half of the original loss. The improvement might come from better cutting fixtures, tighter handling procedures, or improved membrane flatness control.
Practical Checklist for Cost Driver Analysis
When you analyze a manufacturing plan, capture these items for each major component and step:
- Unit material cost and expected scrap rate.
- Cycle time and labor hours per module.
- Test pass rate and rework paths.
- Traceability effort needed to keep defects from becoming mysteries.
This turns cost from a vague estimate into a set of controllable variables. In iron-air systems, the cheapest material is rarely the cheapest module; the cheapest module is the one that passes tests with minimal rework while staying consistent across production batches.
11.2 Estimating Balance of Plant Costs and Installation Labor
Balance of plant (BoP) is where many projects quietly spend money: pumps, piping, air handling, controls hardware, enclosures, electrical terminations, civil work, and the labor to make everything actually work together. A good estimate starts with a clear boundary: what counts as BoP versus what is inside the iron-air stack package, and what is included in “installed” versus “delivered.” If you skip that boundary, you will end up double-counting or, worse, missing entire work scopes.
Foundational Cost Categories
BoP estimates are easiest when you group costs by how they are built on site.
- Mechanical and fluid systems: electrolyte tanks, pumps, filters, valves, manifolds, heat exchangers if used, and piping supports.
- Air systems: blowers or fans, ducting, humidification or dehumidification elements if required, air distribution manifolds, and leak-tight fittings.
- Electrical and instrumentation: wiring, conduit, junction boxes, sensors, PLC I/O modules, power distribution gear, and commissioning wiring checks.
- Controls and communications: local control cabinets, HMI panels, SCADA gateway hardware, and network cabling.
- Civil and structural: foundations, anchor bolts, housekeeping pads, cable trays, and structural steel for enclosures.
- Enclosures and safety systems: ventilation, spill containment, eyewash or wash stations where required, fire detection, and emergency shutdown hardware.
- Installation labor and testing: lifting, alignment, torqueing, pressure testing, insulation, functional tests, and documentation.
A practical best practice is to create a “scope matrix” with rows for each BoP subsystem and columns for labor, materials, and testing. Even a simple spreadsheet prevents the classic mistake of treating testing as an afterthought.
Estimation Method That Stays Grounded
Use a bottom-up approach for labor and a hybrid approach for materials.
- Labor: estimate man-hours by task and crew type, then apply labor rates and productivity factors.
- Materials: estimate quantities from a bill of materials or from sizing rules, then apply unit costs.
- Testing and commissioning: estimate as a separate line item with its own labor and consumables.
Example: Turning Subsystems into Labor Tasks
Suppose you are installing a modular iron-air system with multiple stack modules, each requiring electrolyte connections and air manifold connections.
- Mechanical installation tasks: set modules, align frames, install gaskets, connect piping spools, install supports, and verify clearances.
- Fluid system tasks: assemble valves and fittings, install filters, perform leak checks, and run pressure tests.
- Air system tasks: mount blowers, connect ducting, pressure test air paths, and verify flow measurement points.
- Electrical tasks: terminate power cables, connect sensor harnesses, label wiring, and verify insulation resistance.
- Controls tasks: mount cabinets, wire I/O, configure interlocks, and run point-to-point checks.
If you estimate labor only as “install system,” you lose the ability to explain why labor changes with site conditions. If you estimate by tasks, you can adjust for access constraints, lifting method, and commissioning duration.
Productivity Factors and Site Conditions
Labor productivity depends on site realities: crane availability, laydown space, weather windows, and how quickly civil work is completed. A simple way to handle this is to apply a productivity multiplier to the base man-hours.
- Good access: multiplier near 1.0
- Limited access or complex routing: multiplier 1.1–1.3
- Delays due to civil readiness: treat as schedule risk and reflect it in labor overlap assumptions
For example, if piping routing requires additional supports because the cable trays are already installed, you should add both material and labor for support fabrication and installation.
Installation Labor Line Items That People Forget
Include these explicitly:
- Pre-assembly and kitting: preparing hoses, fittings, and cable harnesses to reduce on-site time.
- Torqueing and gasket management: tracking torque specs and gasket condition.
- Labeling and documentation: as-built wiring labels and tag verification.
- Spill containment checks: verifying drains, seals, and absorbent kit placement.
- Functional testing labor: running controlled sequences at low power before full-load tests.
These tasks are small individually, but they add up and are often the first to be cut when budgets tighten.
Mind Map: BoP Cost and Labor Estimation Workflow
Integrated Example: A Mini BoP Estimate Structure
Start with a cost summary template:
- Mechanical and fluid materials: tanks, pumps, valves, piping spools, supports
- Mechanical and fluid labor: module set, piping install, pressure tests
- Air system materials: blower, ducting, manifolds, fittings
- Air system labor: mount, connect, air-path leak checks
- Electrical and instrumentation materials: cables, conduit, sensors
- Electrical and instrumentation labor: terminations, labeling, insulation tests
- Controls materials: cabinets, PLC I/O, HMI, network hardware
- Controls labor: wiring, configuration, interlock verification
- Civil and structural: foundations, steel, cable trays
- Safety and enclosures: ventilation, detection, shutdown hardware
- Commissioning labor: functional tests and documentation
Then attach assumptions to each line item: access constraints, expected number of modules, test durations, and whether commissioning is included in the labor estimate or treated separately.
A final sanity check is to compare total BoP labor hours against the number of connection points and test steps. If the labor seems too low, it usually means you missed either pre-assembly, labeling, or commissioning testing time.
11.3 Modeling Energy Capacity and Power Capacity Sizing
Sizing an iron-air storage system means separating two ideas that often get mixed up: energy capacity (how long you can deliver) and power capacity (how much you can deliver at once). A clean model keeps those roles distinct, then ties them together through efficiency, operating limits, and dispatch rules.
Foundational Definitions and Units
Energy capacity is measured in MWh (or kWh). Power capacity is measured in MW (or kW). If a system can deliver 2 MW for 6 hours, that’s 12 MWh of usable energy. In sizing, you usually start from a required dispatch profile and work backward to the required electrochemical energy.
A practical modeling rule: compute required electrical energy at the grid first, then inflate it by losses to get required stored energy.
Step 1: Dispatch Requirements to Electrical Energy
Define a dispatch block schedule. For each interval i with duration \(\Delta t_i\), required grid power \(P_{grid,i}\) gives required grid energy:
\[ E_{grid} = \sum_i P_{grid,i} \Delta t_i \]
Example: Suppose you need 1.5 MW for 2 hours, then 0.5 MW for 3 hours.
- \(E_{grid} = 1.5\times2 + 0.5\times3 = 3 + 1.5 = 4.5\) MWh.
If your dispatch includes ramps, model them as short intervals or use an average power over the ramp window.
Step 2: Losses and Usable Energy Mapping
Electrical energy delivered is lower than stored energy because of round-trip and conversion losses. For sizing, it’s often clearer to use an effective discharge efficiency \(\eta_{dis}\) and an effective charge efficiency \(\eta_{ch}\), then combine them if you’re modeling a full cycle.
For a discharge-only requirement (you already assume the system is charged), use: \[ E_{stored,usable} \ge \frac{E_{grid}}{\eta_{dis}} \]
For a full cycle requirement (you care about both charge and discharge), use round-trip efficiency \(\eta_{rt}=\eta_{ch}\eta_{dis}\): \[ E_{stored,usable} \ge \frac{E_{grid}}{\eta_{rt}} \]
Example: If \(\eta_{dis}=0.85\) and \(E_{grid}=4.5\) MWh, then \(E_{stored,usable} \ge 5.29\) MWh.
Step 3: Power Limits and Electrochemical Constraints
Power capacity is constrained by more than the inverter. In iron-air systems, limits come from current density, air-side mass transport, electrolyte conductivity, and thermal management. In a model, represent these as a maximum allowable discharge power \(P_{max,dis}\) and maximum allowable charge power \(P_{max,ch}\).
A simple sizing check:
- Ensure \(P_{grid,i} \le P_{max,dis}\) for all discharge intervals.
- Ensure the required charging energy can be delivered within available charging windows without exceeding \(P_{max,ch}\).
If you need 2 MW but the stack can only sustain 1.6 MW without violating air flow limits, you must either increase stack area (more cells in parallel) or accept a longer discharge duration.
Step 4: Convert Usable Energy to Nameplate Capacity
Usable energy is not the same as nameplate energy because you must keep the system away from hard limits (for example, minimum electrolyte concentration, maximum allowable state-of-charge, or air utilization ceilings). Represent this with a usable fraction \(f_{usable}\): \[ E_{nameplate} = \frac{E_{stored,usable}}{f_{usable}} \]
Example: If \(f_{usable}=0.9\), then \(E_{nameplate} = 5.29/0.9 = 5.88\) MWh.
Power nameplate can similarly include a derating factor \(f_{power}\) for conservative operation: \[ P_{nameplate} = \frac{P_{required}}{f_{power}} \]
Mind Map: Energy and Power Sizing Logic
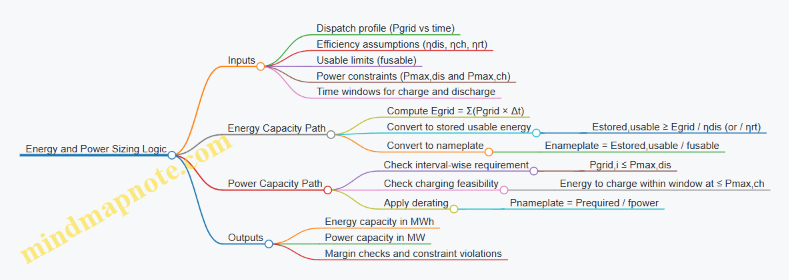
Step 5: Integrated Example with Both Constraints
Assume you need 4.5 MWh at the grid as earlier. Let \(\eta_{dis}=0.85\), \(f_{usable}=0.9\), and the dispatch peak is 2.0 MW.
-
Energy sizing: \(E_{stored,usable}=4.5/0.85=5.29\) MWh, so \(E_{nameplate}=5.29/0.9=5.88\) MWh.
-
Power sizing: if the stack’s sustainable discharge limit is 1.8 MW, you cannot meet the 2.0 MW peak without adding parallel capacity. If you derate with \(f_{power}=0.95\), then \(P_{nameplate}=2.0/0.95=2.11\) MW.
-
Consistency check: verify that with 2.11 MW nameplate, the system can still deliver the required duration without hitting energy limits earlier than planned.
Step 6: Modeling Practices That Prevent Silent Errors
Use three guardrails in the model:
- Interval accounting: always compute energy from \(P\times\Delta t\), even when power is constant.
- Separate limits: enforce power limits per interval and energy limits across the whole dispatch.
- Unit discipline: keep MWh and MW distinct; convert hours explicitly.
When these are in place, the sizing result becomes explainable: energy tells you “how long,” power tells you “how hard,” and the constraints tell you where the system must be expanded.
11.4 Life Cycle Cost Inputs Including Replacement and Consumables
Life cycle cost (LCC) is where “cheap per kWh” claims either earn their keep or quietly fall apart. For iron-air battery storage, the inputs that matter most are the ones that repeat: replacements, consumables, and the labor and downtime needed to keep the system within spec. A good LCC model starts with a simple rule: every cost line item must map to a physical cause you can measure.
Core Cost Inputs That Repeat over Time
-
Electrolyte consumables and conditioning
- What to include: make-up electrolyte, water additions if your water balance requires it, filtration media changes, and any conditioning chemicals used during maintenance cycles.
- Example: If your operating procedure requires adding 0.5% electrolyte volume per month to maintain concentration, and the electrolyte costs $X per liter, then annual consumable cost is 0.005 × system electrolyte volume × 12 × $X.
-
Air-side consumables
- What to include: air filters, desiccant or humidity-control media (if used), and any gasket or seal materials replaced during air-path service.
- Example: If a filter element is rated for 3,000 operating hours and you run 6,000 hours per year, you plan for two replacements annually. Multiply by installed filter cost plus labor.
-
Stack and membrane replacements
- What to include: replacement membranes/separators, electrode refurbishments if your design supports it, and any stack-level service kits.
- Example: If a membrane replacement is scheduled at 5 years based on voltage drift thresholds, then the annualized cost is (membrane kit cost + labor) ÷ 5. This is not “guessing”; it’s converting a maintenance interval into a yearly budget.
-
Balance of plant replacements
- What to include: pumps, blowers, valves, sensors, and power electronics service parts. Even if the battery stack is long-lived, the rest of the system still ages.
- Example: If a blower has a mean time to failure of 20,000 hours and you operate 8,000 hours per year, you expect roughly one blower replacement every 2.5 years. Use that interval to spread cost.
-
Labor and downtime
- What to include: scheduled maintenance labor, emergency call-outs, and the cost of lost availability during service.
- Example: If maintenance takes 10 hours and your revenue model values availability at $Y per hour, then downtime cost per event is 10 × $Y. If you don’t have a revenue model, use a conservative internal cost of unserved energy or grid service penalties.
Turning Maintenance Logic into LCC Numbers
Start with a maintenance schedule that is tied to measurable indicators.
- Condition-based triggers: voltage curve deviation, pressure drop across air filters, pump current changes, and electrolyte concentration drift.
- Interval-based actions: filter swaps at fixed operating hours, annual inspections, and periodic seal checks.
Then convert each action into a cost line:
- Event cost = parts + labor + disposal/handling + any downtime cost.
- Annual cost = event cost × events per year.
- Life cycle cost = sum of annual costs over the project life, optionally discounted if your finance model uses discounting.
Mind Map: Life Cycle Cost Inputs
Example: Building a Replacement and Consumables Table
Assume a 10-year project life and a system that runs 7,000 hours per year.
- Air filter replacements: rated for 3,500 hours → 2 replacements per year.
- Filter event cost: $600 parts + 3 hours labor at $80/hour → $840 per event.
- Annual filter cost: 2 × $840 = $1,680.
For electrolyte make-up:
- Electrolyte volume: 2,000 liters.
- Make-up rate: 0.3% per month.
- Annual make-up volume: 2,000 × 0.003 × 12 = 72 liters.
- Annual electrolyte cost: 72 × $X per liter.
For membrane replacement:
- Replacement interval: 6 years based on voltage drift thresholds.
- Membrane kit + labor: $18,000.
- Annualized membrane cost: $18,000 ÷ 6 = $3,000.
Finally, add balance of plant replacements using the same interval logic from operating hours or observed wear metrics. The result is a cost model where each number has a physical basis and a maintenance action behind it.
Common Input Mistakes to Avoid
- Mixing “consumables” and “replacements”: consumables are consumed continuously or frequently; replacements are discrete events that restore function.
- Ignoring labor and downtime: parts-only models often understate real costs by a wide margin.
- Using a single average interval: if triggers vary by operating regime, represent separate intervals for different duty cycles rather than averaging everything into one number.
A clean LCC input set ends with traceability: if someone asks why a cost line exists, you can point to the maintenance trigger, the event frequency, and the unit cost used to compute it.
11.5 Procurement Documentation for Bid Evaluation and Quality Control
Procurement documentation is where good intentions meet measurable requirements. For iron-air battery storage, the goal is simple: make it hard to win a bid with vague promises, and easy to verify that delivered hardware matches what was tested and modeled.
Bid Package Foundations
Start with a requirements baseline that ties directly to system outcomes. Include a one-page “requirements map” that links each performance requirement to a verification method. For example, if the system must deliver a specified energy over a defined duration, the bid must state how capacity will be measured and what test conditions will be used.
Then define the scope boundaries clearly. Specify what the supplier provides versus what the project provides: site utilities, air handling ducting, electrical switchgear, control room integration, and commissioning labor. A common failure mode is when bidders assume the project will supply critical interfaces, leading to late change orders.
Evaluation Criteria That Actually Evaluate
Use weighted criteria that reflect both performance and build quality. A practical structure is:
- Technical compliance: Does the design meet stated electrical, thermal, and operational constraints?
- Verification plan: Are test methods credible, repeatable, and aligned with acceptance criteria?
- Quality management: Is there a documented process for incoming inspection, traceability, and nonconformance handling?
- Manufacturing evidence: Are there records showing yield, rework rates, and component qualification?
- Delivery and commissioning readiness: Are schedules realistic, and are dependencies identified?
Example: If the bid claims long cycle life, require the bidder to provide the basis for that claim—such as how degradation will be monitored during acceptance testing and what data will be delivered at handover.
Mandatory Submittals for Bid Response
Require bidders to submit documents that let you verify both design intent and manufacturing control. Minimum set:
- Bill of Materials with traceability: Part numbers, material grades, and supplier names for critical components.
- Design description: Stack layout, air path architecture, electrolyte containment approach, and electrical interconnection scheme.
- Test and inspection plan: What will be tested at factory, what will be tested on site, and what instruments and calibration standards will be used.
- Quality plan: Incoming inspection criteria, sampling approach, and acceptance thresholds.
- Commissioning procedure outline: Step sequence, hold points, and rollback actions if limits are exceeded.
- As-built documentation list: What drawings and records will be delivered at completion.
A helpful trick: include a “document-to-requirement matrix” where each requirement number maps to the exact submittal section that proves compliance.
Quality Control During Manufacturing
Quality control should be planned as a sequence of gates rather than a single final inspection. Define hold points for:
- Incoming materials: Verify electrolyte-related materials, seals, membranes, and catalysts meet specified tolerances.
- Electrode and stack assembly: Confirm dimensions, surface preparation steps, and bonding or sealing methods.
- Leak integrity and air path checks: Use defined test pressures and acceptance limits.
- Electrical continuity and insulation resistance: Record results with instrument IDs.
- Functional pre-tests: Run controlled charge/discharge cycles to validate baseline behavior.
Example: For air handling, require bidders to specify how they will detect and quantify condensation risk in the air path during pre-tests, including what sensors or proxies will be used.
Acceptance Testing and Evidence Package
Acceptance criteria must be measurable and unambiguous. Provide thresholds for:
- Capacity and efficiency under specified operating conditions.
- Voltage behavior across the defined operating window.
- Thermal stability within allowable gradients.
- Operational limits such as maximum pressure drop and acceptable flow ranges.
Also require an evidence package at delivery: raw test data, summarized results, calibration certificates, and a nonconformance log. If a test fails, require a documented root-cause process and a re-test plan with what changes will be made.
Mind Map: Bid Evaluation and Quality Control Flow
Example: Document-to-Requirement Matrix Entry
Requirement: Energy delivered at rated duration
- Bid submittal section: Test and inspection plan → “Capacity verification”
- Verification method: Controlled discharge at specified current profile
- Acceptance threshold: Minimum delivered energy after stabilization period
- Evidence delivered: Raw voltage/current logs, temperature logs, and summary report
This format prevents the classic mismatch where a bidder describes a test conceptually but cannot produce the data you need.
Example: Quality Gate Checklist Snippet
- Hold point: Stack assembly completed
- Checks: Seal integrity method documented, torque specs recorded, dimensional inspection results attached
- Pass criteria: Within tolerance ranges; no unapproved material substitutions
- If fail: Quarantine unit, document deviation, rework steps approved before continuation
Procurement Timeline and Traceability Discipline
Set a schedule with explicit submittal deadlines and review windows. For instance, require the first quality plan review by 2026-03-07, and require final acceptance test procedures before factory pre-tests begin. Tie each review to a decision: approve, request clarification, or reject.
Traceability is the thread that ties everything together. Ensure every critical component has a link from procurement records to manufacturing batch records to test evidence, so that when something looks off, you can find the exact “where and when,” not just the “what.”
12. Deployment Playbooks for Renewable Grid Applications
12.1 Site Requirements Including Space Utilities and Environmental Limits
A good iron-air installation starts with boring constraints: where the equipment fits, what services it can use, and what the environment will do to it. Treat these as design inputs, not afterthoughts, because they shape stack layout, air handling, plumbing runs, and the control room footprint.
Site Space Planning and Layout
Begin with a block diagram of the physical flow: electrolyte storage and conditioning, stack modules, air supply and exhaust, pumps and piping, and electrical rooms. Then convert that into a layout that supports safe access.
Best practice: plan for maintenance reach before you finalize wall distances. For example, if a stack module requires a crane lift, measure the clear height and the crane path early. A practical rule is to reserve a straight-line service corridor from the access door to the module bay, with enough width for a person plus tools plus a small spill kit.
Example: Suppose you need 12 modules arranged in two rows. If each module bay needs 1.2 m for access and the aisle must allow a cart, you might allocate 2.4 m total aisle width plus side clearances. That decision affects where air manifolds and cable trays can run without tight bends.
Utility Requirements for Power Water and Air
Iron-air systems typically need electrical power for pumps, blowers, controls, and heaters (if used). They also need water-related services for electrolyte handling and for any cooling or humidity control strategy.
Power: Identify the maximum simultaneous load during commissioning. Pumps and blowers can peak together while controls and heaters start up. Size the electrical service for the worst-case combination, not the average.
Water and drains: Map every water touchpoint: electrolyte makeup, rinse steps, leak capture, and any cooling loops. Then specify where the drains go and what the drain chemistry might be during normal operation and during maintenance.
Air: Even though the system uses ambient oxygen, it still needs controlled air movement. That means power for blowers and a path for exhaust or venting that does not create nuisance conditions.
Example: If your site has limited floor space for a water tank, you can place electrolyte conditioning near the stack bay to reduce piping length. But shorter piping increases the importance of leak containment because any spill has less distance to spread.
Environmental Limits for Temperature Humidity and Dust
Environmental limits are not just about comfort; they affect electrolyte behavior, air electrode performance, and corrosion risk.
Temperature: Define an operating band for the stack and for the air handling components. If the site can drop below the minimum, you need insulation, heat tracing, or a controlled enclosure. If the site can exceed the maximum, you may need shading, ventilation, or heat rejection capacity.
Humidity and condensation: Air paths can accumulate moisture when temperature gradients exist. Condensation can block flow paths and change local chemistry. Design the air route to minimize cold spots and include drainage where appropriate.
Dust and particulates: Air intakes should include filtration sized for the expected dust load. Filtration adds pressure drop, which increases blower power and can reduce oxygen utilization if not accounted for.
Example: A site near unpaved roads may require a higher-grade intake filter and more frequent filter checks. If you ignore that, the system may appear to “underperform” because oxygen access becomes inconsistent.
Site Drainage Containment and Spill Management
Plan containment as if you will eventually have a spill, because maintenance always creates opportunities for small leaks. Use secondary containment under tanks and critical equipment, and route captured liquid to a controlled collection point.
Best practice: separate clean and contaminated drainage. For instance, keep stormwater away from electrolyte collection areas so you do not dilute captured material and complicate disposal.
Example: If electrolyte storage sits in a bunded area, ensure the bund has a drain valve that normally stays closed and can be opened only to transfer collected liquid to a designated container.
Noise and Vibration Considerations
Blowers and pumps can create noise and vibration that affect nearby operations and compliance requirements. Treat this as a layout and mounting problem first.
Best practice: place noisy equipment away from occupied buildings and use vibration isolation mounts. Then verify that cable trays and pipe supports do not transmit vibration into the structure.
Example: If a blower sits on a shared slab with offices, you may need additional isolation and a different mounting pattern to keep vibration within acceptable limits.
Permitting and Operational Constraints
Permits often require documentation of electrical safety, ventilation, spill containment, and waste handling. Prepare a site-specific checklist that ties each requirement to a physical feature.
Example: If the permit requires a defined ventilation rate for an enclosure, ensure the ventilation equipment is sized and tested during commissioning, not just installed.
Mind Map: Site Requirements
Quick Site Checklist for Design Reviews
Confirm these items in order: physical access for maintenance, electrical service capacity for peak loads, water and drain routing for normal and maintenance states, air intake filtration and pressure drop allowance, temperature and humidity boundaries with mitigation, and containment with a defined collection path. If any one item is missing, the rest of the design will eventually compensate in a way that costs time and money.
12.2 Grid Interconnection Studies and Operational Constraints
Grid interconnection studies answer a practical question: can the storage system deliver the requested power and energy without violating grid codes, equipment limits, or operational rules? For iron-air storage, the study must treat the battery, power electronics, and balance of plant as one coupled system, because air handling, electrolyte circulation, and electrical dispatch all influence each other.
Study Inputs and What They Must Cover
Start with the interconnection request: point of common coupling (PCC) voltage, available fault levels, desired operating modes (peak shaving, energy shifting, frequency response), and the expected dispatch duration. Then collect system-level constraints that often get overlooked:
- Electrochemical limits: maximum current density, allowable state-of-charge window, and minimum rest or conditioning time between aggressive cycles.
- Thermal and hydraulic limits: pump power ceilings, allowable electrolyte temperature range, and maximum air flow that avoids condensation in the air path.
- Power electronics limits: inverter current limits, DC bus voltage range, and ride-through capability.
A simple best practice is to create an “operating envelope” table that lists, for each mode, the maximum continuous power, the maximum short-duration power, and the minimum time to recover. Example: if the grid requests 2 hours at 1C-equivalent power but the air electrode can only sustain the required oxygen utilization for 45 minutes without exceeding humidity limits, the study must reflect that the dispatch profile is not feasible as requested.
Power Quality and Protection Coordination
Interconnection studies typically include power quality and protection review. For iron-air systems, the key is mapping battery behavior to grid-side requirements.
Harmonics and flicker: The inverter switching and any control-loop interactions can create harmonic currents. Use manufacturer inverter models plus measured or estimated current limits to simulate steady-state and transient harmonic behavior at the PCC.
Voltage regulation: During charging and discharging, reactive power capability may be limited by inverter settings and thermal headroom. If the system is configured for unity power factor, the study should still verify that voltage changes remain within limits under worst-case dispatch.
Protection coordination: Protection settings must account for fault current contributions from the inverter and any auxiliary power paths. A practical approach is to run fault studies for multiple fault types at the PCC and confirm that:
- the storage trips within the required clearing time,
- the inverter current limit behavior is consistent with relay assumptions,
- and the system does not “hunt” between trip and ride-through during marginal voltage dips.
Operational Constraints That Affect Grid Compliance
Grid codes often specify performance during disturbances, but operational constraints determine whether the system can actually meet them.
State-of-charge and dispatch feasibility: Many grid services assume the asset can respond immediately. Iron-air systems may require conditioning steps to stabilize electrolyte and air-side humidity. The study should include a “time-to-ready” constraint for each service.
Ramp rates: If the control system limits how quickly current can change to protect electrodes and maintain air flow stability, the study must compare requested ramping with the achievable ramp.
Energy availability: Capacity is not just nameplate energy. It depends on the operating point, including temperature and air utilization. Example: if the study assumes full energy delivery at low ambient temperature, but the air handling system requires higher fan power and reduces effective discharge duration, the energy schedule must be corrected.
Simulation Workflow from Grid Model to Dispatch Limits
A systematic workflow prevents surprises during commissioning.
- Build the grid model: include transformer tap settings, line impedances, and load models near the PCC.
- Add the interconnection model: inverter control mode, current limits, and reactive power settings.
- Add the storage operational model: include ramp limits, time-to-ready, and energy derating due to thermal/humidity constraints.
- Run steady-state and dynamic cases: normal operation, voltage deviations, and fault scenarios.
- Translate results into operational constraints: convert simulation outputs into dispatch rules that operators can follow.
A useful deliverable is a constraint matrix that links each grid event type to allowed storage actions. Example: for a short-circuit event with a specified voltage dip depth, the matrix might allow ride-through only if electrolyte temperature is within a safe band and air-side humidity is below a threshold.
Mind Map of Study Scope and Outputs
Mind Map: Grid Interconnection Studies for Iron-Air Storage
Example Constraint Matrix for Dispatch Rules
| Grid Event Type | Voltage Condition | Allowed Storage Action | Required Preconditions |
|---|---|---|---|
| Normal dispatch | Within nominal band | Charge or discharge per schedule | Electrolyte temperature within range; air humidity stable |
| Load step | Moderate voltage change | Limited ramp discharge | Air flow within ceiling; inverter current limit not exceeded |
| PCC fault | Deep voltage dip | Ride-through with current limiting | State-of-charge within window; protection logic enabled |
| Prolonged abnormal operation | Sustained deviation | Reduce power or suspend | Pumps and air handling able to maintain limits |
This kind of matrix turns study results into operational reality. It also makes commissioning less mysterious: tests can verify each precondition and confirm that the system behaves exactly as the grid model assumed.
12.3 System Commissioning Steps from Prechecks to Performance Tests
Commissioning turns a stack of parts into a storage system that behaves predictably under real operating conditions. The goal is simple: verify that every subsystem can start, run, measure correctly, and stop safely—then confirm performance with repeatable tests.
Prechecks That Prevent “Fixes” During Testing
Start with paperwork and physical readiness. Confirm the bill of materials matches what is installed, including cell stack variants, electrolyte grade, air electrode catalyst batch, and membrane/separator type. Then verify utilities: electrical supply ratings, grounding continuity, air handling power, and water/electrolyte supply lines.
A practical precheck example: before energizing, run a dry mechanical cycle of pumps and valves while watching for binding, abnormal noise, and leaks at every seal. If a valve sticks during a dry run, it will stick during a wet run—only faster and with more consequences.
Next, validate instrumentation. Calibrate sensors or at least verify plausibility ranges: temperature probes should read within expected offsets, pressure sensors should respond smoothly, and flow meters should show monotonic change when you vary a valve position.
Controlled Start Up with Guardrails
A safe start-up sequence reduces the chance of damaging the cell stack or confusing the control system. Begin with the stack in a known state: electrolyte level verified, air path sealed, and electrical connections tightened.
Then apply commissioning guardrails:
- Limit initial current to a fraction of the planned operating current.
- Use conservative air flow to ensure oxygen access without flooding or condensation.
- Enable interlocks that stop the system when measured values cross thresholds.
Example: if the system uses a target electrolyte concentration window, start with a concentration that is already within tolerance. If it is slightly off, correct it before running any high-current test; otherwise, you’ll interpret performance results through the wrong lens.
Baseline Measurements That Establish Reference Points
Before performance tests, collect baseline data under low-stress conditions. Run a short idle or low-current soak to stabilize temperatures and flows. Record:
- Cell or module voltage versus time at the chosen current.
- Electrolyte temperature and air-side pressure/flow.
- Pump power and any measured pressure drops.
This baseline becomes your reference for later comparisons. If voltage drift is large during baseline, you likely have a measurement issue, a contact resistance problem, or an air distribution imbalance.
Functional Checks Across the Power Conversion Chain
Verify the electrical chain from battery output to grid interface. Confirm inverter settings, protection coordination, and metering alignment. A simple but effective check is to compare energy accounting: integrate measured power at the battery terminals and compare it to the energy reported at the grid interface over a short controlled run.
Example: if the battery-side integration consistently reads 2–3% higher than the grid-side meter, investigate meter scaling, CT/PT ratios, or sign conventions before you trust efficiency results.
Electrochemical Performance Tests with Increasing Rigor
Move from gentle to demanding tests in a planned order.
-
Capacity verification at a defined current: discharge to the specified voltage limit while logging voltage, current, temperature, and air flow. Repeat at least twice to check repeatability.
-
Round-trip efficiency measurement: perform a matched charge and discharge cycle using the same current limits and similar temperature conditions. Track energy in and energy out using consistent measurement points.
-
Rate capability checks: test a small set of current levels (for example, low, nominal, and high within safe bounds). The point is to see whether voltage behavior scales smoothly or whether air access or mass transport becomes limiting.
-
Degradation indicators during commissioning: watch for unusual voltage hysteresis, sudden slope changes, or persistent drift across cycles. These are not “mysteries”; they usually map to air distribution, electrolyte conditioning, or contact issues.
Air Handling Performance Tests That Confirm Oxygen Access
Air systems often determine whether the cell behaves as designed. Verify that oxygen utilization stays within expected limits and that humidity/condensation behavior is stable.
Example: run a discharge at nominal current and compare air-side pressure drop over time. A rising pressure drop can indicate condensation accumulation or flow restriction, which will later show up as voltage sag.
Safety Verification with Realistic Stop Scenarios
Commissioning must prove that shutdowns work under conditions that resemble operation. Test emergency stop and protective trips in a controlled manner, ensuring:
- The system transitions to a safe state.
- Pumps and valves respond as designed.
- Electrical isolation behaves correctly.
Keep these tests short and bounded, but do not skip them. A system that only “stops” when everything is already calm is not fully commissioned.
Acceptance Criteria and Documentation That Close the Loop
Define acceptance criteria before testing begins. Typical criteria include:
- Repeatable capacity within a specified tolerance.
- Efficiency within a defined band.
- Stable voltage curves without abrupt anomalies.
- Metering consistency between battery-side and grid-side measurements.
Document every run with configuration snapshots: setpoints, sensor calibration status, interlock thresholds, and any deviations. If a test fails, the documentation should make the failure explainable, not just recorded.
Mind Map: Commissioning Workflow from Prechecks to Performance Tests
Example: A Two-Day Commissioning Run Plan
Day 1 focuses on readiness and baselines: prechecks, dry mechanical validation, sensor plausibility, controlled start-up at limited current, and baseline voltage/temperature/flow logging. Day 2 runs capacity and efficiency tests with repeat cycles, then performs air-side verification and safety stop scenarios. The sequence matters: you want reference behavior before you ask the system to work hard.
Example: Interpreting a Failed Capacity Repeat
If two capacity runs disagree beyond tolerance, first check measurement alignment: current sensor scaling, voltage limit threshold logic, and temperature sensor placement. If those are consistent, then check air-side stability during each run by comparing pressure drop and flow trends. Finally, review electrolyte conditioning state at start-up; a concentration mismatch can mimic a “hardware” problem even when the stack is fine.
12.4 Operations and Maintenance Procedures for Routine Service
Routine service is about preventing small, predictable problems from becoming expensive ones. For iron-air battery systems, the main recurring themes are electrolyte stability, air-side performance, electrical cleanliness, and mechanical integrity. The procedures below assume a site already commissioned and operating under a defined dispatch schedule.
Daily Operational Checks That Prevent Surprises
Start each day with a short, repeatable walk-through. Verify that the control system is logging data at the expected rate and that alarms are acknowledged and resolved, not merely muted.
Check electrolyte circulation indicators first: pump status, flow rate trend, and any signs of cavitation such as unstable flow readings. A simple example: if flow drops by 15% for two consecutive intervals while pump power rises, treat it as a suction restriction or filter loading event, not as “normal variation.”
Next, inspect air-side conditions. Confirm that air pressure or blower speed is within the operating band and that humidity control is functioning. If condensation is visible in an air path inspection port, note the location and time; water accumulation changes oxygen access and can shift cell voltage behavior.
Finally, do a quick electrical sanity check. Look for unusual temperature gradients on busbars and cell interconnects. If one module runs consistently hotter than neighbors at the same current, prioritize contact resistance inspection during the next maintenance window.
Weekly Maintenance Tasks That Keep Performance Stable
Weekly tasks should focus on cleaning, verification, and calibration rather than deep disassembly.
On the electrolyte side, verify filter differential pressure and record it. If differential pressure rises faster than the historical baseline, schedule filter replacement before flow becomes marginal. Example: a filter that typically increases by 5 kPa per week but jumps by 20 kPa in one week likely has debris from a recent start-up disturbance.
On the air side, inspect seals and manifold connections for leaks. A practical method is to perform a controlled pressure hold test on a section of the air path and compare the decay rate to last week’s value. Even small leaks can reduce oxygen utilization and increase blower energy.
On the instrumentation side, validate sensor plausibility. Compare measured temperatures against expected gradients across the stack. If a temperature sensor reads 10°C higher than adjacent sensors for more than an hour, flag it for verification; bad sensors cause bad control decisions.
Monthly Inspections That Catch Wear Early
Monthly inspections should include targeted mechanical checks. Confirm that mounts and supports are secure and that vibration-related fasteners have not loosened. Check hose and tubing for abrasion points, especially where movement is possible.
Inspect valves for smooth actuation. A valve that takes longer to reach position than before can indicate sticking or contamination. Example: if a valve travel time increases by 30% compared to the last month, schedule a controlled cleaning and verify that the actuator is healthy.
Review control logs for repeated minor faults. If the same fault code appears weekly but is always cleared automatically, treat it as a maintenance trigger. The goal is to remove the cause, not to train the system to tolerate it.
Quarterly Service That Balances Depth and Downtime
Quarterly service is where you perform deeper checks without turning the system into a science project.
Electrolyte sampling should be done with consistent procedure: same sampling point, same time relative to dispatch, and same handling steps. Compare key indicators to the established operating envelope. If impurity indicators trend upward, trace likely sources such as makeup water quality, filtration bypass events, or contamination during maintenance.
Air electrode performance should be assessed indirectly through operating signatures: voltage response under a known current profile, blower power at a given air demand, and pressure drop across the air path. Example: if pressure drop increases while blower power also increases, suspect fouling or partial blockage rather than “normal aging.”
Electrical inspection should include tightening checks on accessible connections and verification of insulation resistance where applicable. Use torque procedures consistent with manufacturer guidance and record the values.
Fault Response Procedures That Keep Systems Safe
When a fault occurs, respond in a way that preserves safety and diagnostic clarity.
- Confirm the alarm category: electrical protection, air-side limit, electrolyte limit, or sensor plausibility.
- Freeze the diagnostic snapshot: record currents, voltages, temperatures, flow, and pressures at the time of the fault.
- Apply the defined control action: reduce load, pause dispatch, or switch to a safe operating mode.
- After stabilization, inspect the most likely physical cause based on the fault category.
Example: if the system reports “air-side oxygen access limit” and blower speed is at the upper bound, prioritize air path restriction checks before touching electrolyte controls.
Mind Map of Routine Service Workflow
Mind Map: Routine Operations and Maintenance
Example Routine Schedule for a Typical Dispatch Week
A practical schedule keeps tasks predictable. For example, run daily checks every morning before the first dispatch block, perform weekly filter and leak checks on the same weekday, and reserve monthly mechanical and valve inspections for a low-dispatch day. Quarterly service can be planned around a maintenance window where dispatch is already reduced, ensuring the system remains within its defined operating envelope.
The key is consistency: the same checks, at the same cadence, using the same acceptance thresholds. That consistency turns maintenance from “reacting to problems” into “preventing them,” which is the whole point of routine service.
12.5 Case Study Workflows for Designing a Long-Duration Storage Project
A good case study workflow turns “we need long duration” into a set of decisions you can defend with numbers. The workflow below assumes an iron-air system and focuses on what to document, what to test, and how to avoid common design traps.
Step 1: Define the Grid Use Case and Operating Window
Start with the grid requirement, not the battery. Write a one-page operating brief that includes target discharge duration, allowable ramp rate, round-trip efficiency expectation, and the number of cycles per year. A practical example: if the grid needs 6 hours of discharge during evening peaks, you size energy for 6 hours at the required power, then check whether the air and electrolyte management can support that duty without drifting out of safe operating bounds.
Best practice: convert the grid requirement into a daily schedule table (charge window, idle window, discharge window). This helps you spot whether the system must charge quickly or can charge gently, which affects current density and water balance.
Step 2: Translate Requirements into Electrical and Energy Sizing
Compute energy first, then power. Energy sizing sets the required active material throughput and the number of cell stacks needed to deliver the target ampere-hours. Power sizing sets busbar current, inverter rating, and protection settings.
Example workflow: assume the project needs 10 MW for 6 hours, so energy is 60 MWh. If the expected usable efficiency is 70% from AC to AC, you plan for higher electrochemical energy input and include margin for auxiliary loads like pumps and air handling.
Best practice: keep a “margin ledger” that lists where you added headroom—auxiliary consumption, measurement uncertainty, and degradation allowances—so you can explain the final nameplate numbers.
Step 3: Select a System Architecture and Balance of Plant Scope
Choose how stacks, electrolyte circulation, air distribution, and power electronics are packaged. Decide whether you will treat the system as one integrated unit or multiple parallel modules.
Example: if you expect maintenance downtime, modular packaging can let you isolate a module while keeping the rest operational. That choice affects valve placement, leak containment boundaries, and how you measure state across modules.
Best practice: define interface contracts between subsystems. For instance, specify the required electrolyte flow range at the stack inlet and the acceptable air pressure drop across the air electrode.
Step 4: Build a Test Plan That Mirrors Real Operation
Design tests to match the operating schedule from Step 1. A useful structure is three layers: component checks, module verification, and system acceptance.
Example: run a “representative day” test where you charge at the planned rate, idle for the planned duration, then discharge for the full required time. During the test, log electrolyte temperature, air flow, pressure, cell voltage distribution, and current.
Best practice: define acceptance criteria before testing. For example, require that the voltage spread across parallel stacks stays within a specified band and that water balance indicators remain within safe limits.
Step 5: Perform Failure-Mode Checks and Instrumentation Coverage
List credible failure modes that can occur during the operating window: air starvation, electrolyte imbalance, sensor drift, pump cavitation, and electrical contact heating. Then map each failure mode to detection signals and protective actions.
Example: if air flow drops below a threshold, the control system should both reduce current and flag the event for operator review. If temperature rises faster than expected, the system should trigger a controlled shutdown rather than waiting for a hard fault.
Best practice: verify instrumentation coverage. If you cannot measure the variable that indicates the failure mode, you cannot reliably protect against it.
Step 6: Create a Commissioning and Handover Checklist
Commissioning should progress from safe energization to full duty cycles. Use a checklist that includes mechanical leak checks, electrical continuity, sensor calibration, and then staged load tests.
Example: first verify that pumps achieve the required flow without abnormal noise, then confirm that air handling reaches target pressure and humidity behavior, and only then run a partial discharge before the full-duration acceptance test.
Best practice: include a “what good looks like” section for each test. For instance, describe expected trends in cell voltage curves over time rather than only pass/fail numbers.
Step 7: Document the Design Rationale with Traceability
A case study is useful when every major design decision traces back to a requirement. Create a traceability matrix that links: grid requirement → sizing assumption → design choice → test evidence.
Example: if you chose a particular air distribution strategy, the traceability should show the airflow uniformity goal and the test results that demonstrate it.
Mind Map: Case Study Workflow for Long-Duration Iron-Air Design
Example: One-Week Case Study Timeline
Week 1 can be structured as: Day 1 finalize operating brief and sizing assumptions; Day 2 lock architecture and interface requirements; Day 3 complete test plan and acceptance criteria; Day 4 run representative-day simulation and instrumentation review; Day 5 execute staged commissioning checks; Day 6 run partial discharge and validate control behavior; Day 7 run full-duration acceptance test with full logging.
This timeline works because it forces early alignment on requirements, then validates the system under the same schedule it will face in the field.