Practical Biohacking: Evidence-Based Self-Experimentation
1. Introduction to Biohacking and Self-Experimentation
1.1 What is Biohacking? Definitions and Scope
Biohacking is a broad and evolving concept that refers to the practice of using science, technology, and lifestyle modifications to optimize the human body’s performance, health, and longevity. At its core, biohacking is about self-experimentation and taking control of your biology through evidence-based interventions.
Definitions of Biohacking
- Biohacking (General): The art and science of improving your body and mind through deliberate changes in diet, environment, technology, and behavior.
- DIY Biology: A subset of biohacking focused on conducting biology experiments outside traditional labs, often by citizen scientists.
- Nutritional Biohacking: Using diet and supplements to enhance physical and cognitive performance.
- Quantified Self: Tracking biological, physical, and behavioral data to inform health decisions.
Scope of Biohacking
Biohacking covers a wide range of practices, from simple lifestyle tweaks to advanced technological interventions. Below is a mind map illustrating the main domains:
Practical Examples of Biohacking
-
Intermittent Fasting: A nutritional biohack where individuals restrict eating windows to improve metabolic health and cognitive function. For example, a 16:8 fasting schedule (16 hours fasting, 8 hours eating) is widely practiced.
-
Sleep Tracking with Wearables: Using devices like Oura Ring or Fitbit to monitor sleep stages and quality, then adjusting bedtime routines based on data to improve rest.
-
Cold Exposure Therapy: Taking cold showers or ice baths to stimulate brown fat activation, reduce inflammation, and improve mood.
-
Nootropic Supplementation: Using compounds like caffeine, L-theanine, or racetams to enhance focus and mental clarity.
-
Genetic Testing for Personalized Nutrition: Using services like 23andMe or DNAfit to understand genetic predispositions and tailor diet or exercise accordingly.
Mind Map Example: Intermittent Fasting Biohack
Why Biohacking Matters
Biohacking empowers individuals to become active participants in their health journey rather than passive recipients of generic advice. By combining scientific rigor with personal experimentation, biohackers can discover what truly works for their unique biology.
Summary
Biohacking is a multidisciplinary approach to optimizing human health and performance through self-directed, evidence-based experimentation. Its scope ranges from simple lifestyle changes to cutting-edge technologies, all aimed at enhancing quality of life and longevity.
1.2 The Science and Ethics of Self-Experimentation
Self-experimentation is a cornerstone of biohacking, allowing individuals to explore and optimize their biology through personal trials. However, to ensure meaningful and safe outcomes, it is essential to ground these experiments in scientific rigor and ethical responsibility.
The Science of Self-Experimentation
Self-experimentation follows the principles of the scientific method, adapted for individual use. This involves:
- Observation: Noticing a health or performance aspect to improve.
- Hypothesis: Formulating a testable idea (e.g., “Intermittent fasting improves my energy levels”).
- Experimentation: Implementing a controlled change.
- Data Collection: Tracking relevant metrics.
- Analysis: Evaluating results objectively.
- Conclusion: Deciding on next steps based on evidence.
Mind Map: Scientific Method in Self-Experimentation
Example:
Experiment: Testing if 8 hours of sleep improves cognitive focus.
- Observation: Feeling groggy after 6 hours of sleep.
- Hypothesis: Increasing sleep to 8 hours will improve focus.
- Experimentation: Sleep 8 hours for 2 weeks, track focus using a cognitive app.
- Data Collection: Daily focus scores and subjective energy ratings.
- Analysis: Compare average focus scores before and after.
- Conclusion: Determine if increased sleep correlates with improved focus.
The Ethics of Self-Experimentation
While self-experimentation involves personal autonomy, ethical considerations remain critical to protect health and well-being.
Key Ethical Principles:
- Safety First: Avoid interventions with high risk or unknown side effects.
- Informed Consent: Even though you are the subject, fully understand potential risks.
- Transparency: Document methods and results honestly.
- Respect for Limits: Recognize when to stop or seek professional advice.
- Privacy: Protect personal health data.
Mind Map: Ethical Considerations in Self-Experimentation
Example:
Scenario: Considering experimenting with a new nootropic supplement.
- Research the supplement’s safety profile and clinical evidence.
- Start with the lowest effective dose.
- Monitor for adverse effects daily.
- Keep a detailed log of dosage, timing, and effects.
- If negative symptoms arise, discontinue immediately and consult a healthcare provider.
Integrating Science and Ethics
Successful biohacking balances curiosity with caution. Applying scientific rigor ensures valid results, while ethical mindfulness safeguards health.
Mind Map: Balancing Science and Ethics
Example:
Case Study: A biohacker wants to test cold exposure benefits.
- Designs a gradual cold shower protocol (starting with 30 seconds).
- Monitors heart rate and subjective stress levels.
- Keeps detailed records.
- Stops if feeling unwell.
- Shares results with community, including both positive and negative outcomes.
Summary
- Self-experimentation is a powerful tool when grounded in the scientific method.
- Ethical considerations protect the biohacker and add credibility.
- Documenting and reflecting on both process and outcomes fosters continuous improvement.
By embracing both science and ethics, biohackers can safely unlock personalized insights and optimize their health effectively.
1.3 Benefits and Risks: Setting Realistic Expectations
Biohacking, when approached thoughtfully and evidence-based, offers a range of potential benefits but also carries inherent risks. Understanding both sides is crucial for setting realistic expectations and ensuring safe, effective self-experimentation.
Benefits of Biohacking
- Enhanced Physical Health: Improved energy levels, better sleep quality, optimized nutrition, and increased longevity.
- Cognitive Improvements: Enhanced focus, memory, creativity, and mental clarity.
- Personalized Health Insights: Data-driven understanding of one’s body and responses to interventions.
- Empowerment and Autonomy: Taking control of one’s health journey through self-directed experimentation.
- Preventive Health: Early detection of potential issues and proactive lifestyle adjustments.
Example: Sarah, a 35-year-old biohacker, used sleep tracking and blue light reduction techniques. Over 3 months, she reported improved sleep efficiency from 75% to 90%, leading to better daytime focus and mood.
Risks and Challenges of Biohacking
- Data Misinterpretation: Drawing incorrect conclusions from incomplete or noisy data.
- Over-Experimentation: Trying too many hacks simultaneously, making it hard to isolate effects.
- Safety Concerns: Potential adverse effects from supplements, extreme diets, or untested interventions.
- Psychological Impact: Anxiety or obsession over tracking metrics and health data.
- Ethical and Privacy Issues: Handling sensitive personal health data responsibly.
Example: John began taking multiple nootropics simultaneously without tracking effects carefully. After two weeks, he experienced increased anxiety and difficulty sleeping, illustrating the risk of over-experimentation without proper controls.
Setting Realistic Expectations
- Start Small and Simple: Begin with one variable at a time to clearly observe effects.
- Use Reliable Tools: Employ validated devices and apps for data collection.
- Be Patient: Meaningful changes often take weeks or months.
- Document Everything: Keep detailed logs of interventions, context, and outcomes.
- Consult Professionals: When in doubt, seek advice from healthcare providers.
Example: Emma decided to improve her energy by testing intermittent fasting alone. She tracked her energy levels daily for 6 weeks, adjusting only fasting duration. This focused approach helped her identify the optimal fasting window without confusion.
Summary Mind Map
By balancing enthusiasm with caution, biohackers can maximize benefits while minimizing risks, creating a sustainable and rewarding self-experimentation journey.
1.4 Overview of Evidence-Based Approaches in Biohacking
Biohacking, at its core, is about optimizing human performance and health through intentional interventions. However, to ensure safety and effectiveness, it is crucial to ground these interventions in evidence-based approaches. This section explores how to apply scientific rigor to biohacking practices, helping you make informed decisions and maximize benefits.
What Does Evidence-Based Biohacking Mean?
Evidence-based biohacking involves using scientific research, clinical data, and validated methodologies to guide self-experimentation. It prioritizes measurable outcomes, reproducibility, and critical evaluation over anecdotal or purely experimental approaches.
Key Principles of Evidence-Based Biohacking
- Scientific Method: Formulating hypotheses, designing controlled experiments, collecting data, and analyzing results.
- Quantifiable Metrics: Using objective biomarkers and validated tools for tracking progress.
- Reproducibility: Ensuring that results can be replicated either by yourself or others.
- Safety and Ethics: Prioritizing health and avoiding harm through informed choices.
Mind Map: Core Components of Evidence-Based Biohacking
Step-by-Step Approach to Evidence-Based Self-Experimentation
- Identify a Clear Objective: Define what you want to improve or understand (e.g., improve sleep quality).
- Research Existing Evidence: Review scientific literature and credible sources related to your goal.
- Design Your Experiment: Decide on variables, controls, duration, and measurable outcomes.
- Select Tools and Metrics: Choose validated devices or tests (e.g., Oura ring for sleep tracking).
- Conduct the Experiment: Follow your protocol consistently while recording data.
- Analyze Data: Use statistical or visual methods to interpret results.
- Draw Conclusions and Iterate: Adjust your approach based on findings and repeat if necessary.
Example: Evidence-Based Approach to Improving Sleep
- Objective: Increase deep sleep duration by 20%.
- Research: Studies show blue light exposure before bed reduces melatonin and deep sleep.
- Experiment Design: Compare sleep quality over two weeks with and without blue light blocking glasses.
- Metrics: Deep sleep duration measured by a validated sleep tracker.
- Outcome: Data shows a 25% increase in deep sleep when wearing glasses.
Mind Map: Example Sleep Experiment Workflow
Common Evidence-Based Tools and Resources
- Scientific Databases: PubMed, Google Scholar for research articles.
- Wearables: Oura Ring, WHOOP, Fitbit for biometrics.
- Apps: Sleep Cycle, Headspace for tracking and interventions.
- Biomarker Testing: At-home blood tests, saliva hormone panels.
Integrating Community and Peer Feedback
Sharing your protocols and results with biohacking communities can provide valuable insights, alternative interpretations, and validation. Platforms like Reddit’s r/Biohackers or dedicated forums encourage transparency and collective learning.
Summary
Evidence-based biohacking empowers you to hack your biology responsibly and effectively. By grounding your experiments in science, tracking measurable outcomes, and iterating based on data, you transform biohacking from guesswork into a powerful tool for personal health optimization.
1.5 Case Study: A Beginner’s Journey into Biohacking
Biohacking can seem overwhelming at first, but starting with simple, evidence-based self-experimentation can empower anyone to take control of their health. In this case study, we follow Sarah, a health enthusiast new to biohacking, as she embarks on her first self-experiment to improve her sleep quality and daytime energy.
Step 1: Identifying the Goal
Sarah often feels tired during the day despite getting what she thought was enough sleep. Her goal is to improve her sleep quality to boost her daytime energy and focus.
Mind Map: Defining the Goal and Focus Areas
Step 2: Research and Hypothesis
Sarah reads evidence-based articles and learns that blue light exposure before bedtime can disrupt melatonin production and delay sleep onset. She hypothesizes that reducing blue light exposure in the evening will improve her sleep quality.
Mind Map: Research and Hypothesis
Step 3: Designing the Experiment
Sarah decides to test this hypothesis over two weeks:
- Week 1 (Baseline): No changes, track current sleep and energy.
- Week 2 (Intervention): Use blue light blocking glasses 2 hours before bedtime and reduce screen time.
She plans to track:
- Sleep onset time
- Total sleep duration
- Sleep quality (subjective rating)
- Daytime energy levels
Mind Map: Experiment Design
Step 4: Tools and Data Collection
Sarah uses the following tools:
- Sleep tracking app on her smartphone (records sleep duration and onset)
- Daily journal to rate sleep quality and daytime energy
- Blue light blocking glasses purchased online
Example Entry from Sarah’s Journal:
| Date | Sleep Onset (min) | Total Sleep (hours) | Sleep Quality (1-10) | Daytime Energy (1-10) |
|---|---|---|---|---|
| 2024-05-01 | 25 | 7.5 | 6 | 5 |
| 2024-05-08 | 15 | 7.8 | 8 | 7 |
Step 5: Results and Interpretation
After the two-week experiment, Sarah observes:
- Average sleep onset time decreased from 25 to 15 minutes.
- Sleep quality rating improved from 6 to 8.
- Daytime energy increased from 5 to 7.
This suggests that reducing blue light exposure before bed positively impacted her sleep and energy.
Mind Map: Results Summary
Step 6: Next Steps and Best Practices
Sarah plans to continue using blue light blocking glasses and explore additional sleep hygiene practices such as:
- Maintaining consistent bedtime
- Reducing caffeine intake after noon
- Using white noise for better sleep environment
Best Practices Highlighted:
- Start with a clear, measurable goal.
- Use simple, accessible tools for tracking.
- Keep the experiment period short and focused.
- Record subjective and objective data.
- Analyze results before making further changes.
This beginner’s journey demonstrates how practical, evidence-based biohacking can be approachable and effective. By starting small and tracking meaningful data, anyone can begin to optimize their health through self-experimentation.
2. Preparing for Self-Experimentation: Foundations and Frameworks
2.1 Setting Clear, Measurable Goals for Your Biohacks
Setting clear and measurable goals is the cornerstone of successful biohacking. Without well-defined objectives, it becomes difficult to track progress, interpret results, or make informed adjustments. This section will guide you through the process of crafting effective goals, supported by practical examples and mind maps to visualize the approach.
Why Set Clear, Measurable Goals?
- Focus: Goals provide direction and help prioritize which biohacks to pursue.
- Measurement: Clear goals enable you to quantify progress and outcomes.
- Motivation: Concrete targets keep you motivated and accountable.
- Adaptability: Measurable goals allow for data-driven adjustments.
Characteristics of Effective Goals (SMART Framework)
- Specific: Clearly define what you want to achieve.
- Measurable: Identify metrics or indicators to track progress.
- Achievable: Set realistic and attainable targets.
- Relevant: Ensure the goal aligns with your overall health objectives.
- Time-bound: Set a deadline or timeframe for evaluation.
Mind Map: Crafting SMART Biohacking Goals
Step-by-Step Process to Set Your Biohacking Goals
-
Identify the Area of Focus: Choose the domain you want to improve (e.g., sleep, cognition, fitness).
-
Define the Desired Outcome: Be specific about what success looks like.
-
Select Measurable Metrics: Decide how you will track progress (e.g., hours of sleep, reaction time, resting heart rate).
-
Assess Your Baseline: Collect initial data to understand your starting point.
-
Set Realistic Targets: Based on baseline and research, determine achievable goals.
-
Determine Timeframe: Decide how long you will run the experiment before evaluating.
-
Plan Data Collection Methods: Choose tools and frequency for measurement.
Example 1: Sleep Improvement Goal
- Area: Sleep Quality
- Specific Goal: Increase deep sleep duration
- Measurable Metric: Hours of deep sleep tracked via wearable device
- Baseline: 1.2 hours of deep sleep per night (average over 7 days)
- Target: Increase to 1.8 hours per night
- Timeframe: 30 days
- Data Collection: Daily sleep tracking with Oura Ring
Mind Map: Sleep Improvement Goal
Example 2: Cognitive Focus Enhancement
- Area: Cognitive Performance
- Specific Goal: Improve sustained attention
- Measurable Metric: Score on a 10-minute continuous performance test (CPT)
- Baseline: Average score 75/100
- Target: Achieve 85/100
- Timeframe: 4 weeks
- Data Collection: Weekly CPT tests using a mobile app
Mind Map: Cognitive Focus Goal
Example 3: Fitness and Recovery
- Area: Physical Fitness
- Specific Goal: Reduce resting heart rate (RHR) as a marker of cardiovascular fitness
- Measurable Metric: Resting heart rate in beats per minute
- Baseline: 72 bpm
- Target: 65 bpm
- Timeframe: 8 weeks
- Data Collection: Morning RHR measured with chest strap heart rate monitor
Mind Map: Fitness Goal
Tips for Maintaining Goal Clarity
- Write your goals down and review them regularly.
- Use digital tools or journals to track progress.
- Be flexible: adjust goals based on interim results and new insights.
- Share your goals with a community or accountability partner.
Summary
Setting clear, measurable goals is essential for effective biohacking. Applying the SMART framework helps you create actionable objectives that guide your experiments and enable meaningful evaluation. Using mind maps can clarify your thought process and ensure all aspects of goal-setting are covered. Start with small, focused goals and build complexity as you gain experience.
Ready to set your first biohacking goal? Reflect on an area you want to improve, and try drafting a SMART goal using the examples and mind maps above!
2.2 Designing Your Experiment: Variables, Controls, and Timelines
Designing a successful self-experiment is the cornerstone of effective biohacking. This section will guide you through identifying and managing variables, establishing controls, and setting realistic timelines to ensure your experiments yield meaningful, actionable insights.
Understanding Variables
Variables are the elements of your experiment that can change and potentially affect the outcome. They are typically divided into three types:
- Independent Variables: The factors you intentionally change or manipulate.
- Dependent Variables: The outcomes or responses you measure.
- Controlled Variables: Factors you keep constant to avoid confounding effects.
Mind Map: Types of Variables
Establishing Controls
Controls are essential to isolate the effect of the independent variable. In self-experimentation, controls can be:
- Baseline Period: A phase where you track dependent variables without any intervention.
- Placebo or Sham Conditions: When applicable, using a placebo or sham to account for psychological effects.
- Consistent Environment: Keeping factors like diet, sleep schedule, and activity level stable.
Example: Sleep Optimization Experiment
- Independent Variable: Reduction of blue light exposure after 8 PM.
- Dependent Variable: Sleep quality measured by a wearable.
- Control: Baseline week with no change in blue light exposure.
Designing Timelines
A well-structured timeline helps capture sufficient data to observe trends and effects. Consider:
- Baseline Phase: Typically 1-2 weeks to establish normal patterns.
- Intervention Phase: Duration depends on the nature of the experiment (e.g., 2-4 weeks for dietary changes).
- Washout Period: Optional phase to return to baseline before testing another variable.
Mind Map: Timeline Structure
Practical Example: Designing a Self-Experiment to Test the Effect of Caffeine on Focus
| Step | Description |
|---|---|
| Goal | Determine how caffeine affects your focus during work hours. |
| Independent Variable | Amount of caffeine intake (0 mg, 100 mg, 200 mg). |
| Dependent Variable | Focus level measured via a daily productivity app and subjective focus rating (1-10). |
| Controlled Variables | Sleep duration, diet, work environment kept consistent. |
| Timeline | 1 week baseline (no caffeine), 1 week 100 mg caffeine, 1 week 200 mg caffeine, 1 week washout. |
Mind Map: Caffeine Focus Experiment
Tips for Effective Experiment Design
- Start Small: Begin with one independent variable to reduce complexity.
- Be Consistent: Keep controlled variables as stable as possible.
- Document Everything: Record your methods, observations, and any deviations.
- Use Tools: Leverage apps, wearables, and journals for accurate data collection.
- Plan for Analysis: Consider how you will analyze data before starting.
By carefully designing your experiment with clear variables, controls, and timelines, you set the stage for reliable and insightful biohacking results. This structured approach minimizes bias and maximizes your ability to draw meaningful conclusions from your self-experimentation.
2.3 Tools and Technologies for Data Collection and Monitoring
Effective biohacking hinges on accurate, consistent data collection and monitoring. Choosing the right tools and technologies empowers you to track variables, analyze results, and make informed decisions about your self-experimentation. This section explores a variety of accessible and reliable tools, categorized by their primary function, along with practical examples and mind maps to help you visualize their integration.
Key Categories of Tools and Technologies
Wearables: Continuous Biometric Monitoring
Wearables are among the most popular biohacking tools, providing real-time data on heart rate, sleep, activity, and more.
- Smartwatches (e.g., Apple Watch, Garmin, Fitbit): Track heart rate variability (HRV), steps, calories burned, and sleep stages.
- Dedicated Sleep Monitors (e.g., Oura Ring, Whoop Strap): Offer detailed sleep architecture insights and recovery scores.
Example:
A biohacker uses an Oura Ring to monitor sleep quality and HRV over a month while experimenting with a new evening routine. The ring’s app provides daily readiness scores, helping correlate lifestyle changes to recovery.
Mobile Apps: Focused Data Capture and Analysis
Apps can complement wearables or serve as standalone tools for tracking nutrition, mood, cognition, and habits.
- Nutrition Trackers (MyFitnessPal, Cronometer): Log food intake to analyze macro- and micronutrient consumption.
- Mood Journals (Daylio, Moodpath): Record emotional states and triggers.
- Cognitive Testing Apps (Lumosity, BrainHQ): Measure memory, attention, and processing speed.
Example:
A longevity seeker uses Cronometer to track micronutrient intake while supplementing vitamin D and magnesium, comparing symptom changes with logged data.
Home Testing Kits: Objective Biomarker Measurement
Home kits enable biohackers to gather lab-quality data without frequent doctor visits.
- Blood Glucose Monitors (e.g., Contour Next): Track glucose response to meals and fasting.
- Hormone Test Kits (Everlywell, LetsGetChecked): Measure cortisol, thyroid hormones, or sex hormones.
- Microbiome Sampling (uBiome, Viome): Analyze gut flora composition.
Example:
A biohacker performs a 14-day time-restricted eating experiment, using a glucose monitor to observe blood sugar fluctuations and adjust eating windows accordingly.
Environmental Sensors: Contextualizing Your Data
Environmental factors can significantly impact health metrics, so monitoring air quality, light exposure, and noise levels is valuable.
- Air Quality Monitors (Awair, IQAir): Detect pollutants, humidity, and CO2.
- Light Sensors: Measure blue light exposure, especially in the evening.
- Noise Meters: Track ambient noise to improve sleep environments.
Example:
A biohacker installs an Awair sensor in their bedroom to reduce indoor pollutants and improve sleep quality, correlating air quality data with sleep tracker results.
Manual Tracking: The Power of Consistent Self-Observation
Despite technological advances, manual tracking remains essential for qualitative data and nuanced observations.
- Journals: Record subjective experiences, symptoms, and contextual notes.
- Spreadsheets: Organize and analyze quantitative data collected from various sources.
- Voice Notes: Capture quick observations when writing is inconvenient.
Example:
A biohacker maintains a daily journal alongside wearable data to note stressors or dietary deviations that might explain anomalies in biometric readings.
Integrated Example Mind Map: Combining Tools for a Sleep Optimization Experiment
In this example, the biohacker uses wearables to gather objective sleep data, apps to track subjective mood and sleep patterns, environmental sensors to monitor bedroom conditions, and manual journaling to capture qualitative insights. This multi-modal approach enhances data reliability and interpretation.
Best Practices for Tool Selection and Use
- Start Simple: Choose a few reliable tools that align with your goals to avoid data overload.
- Ensure Data Accuracy: Prefer validated devices and apps with scientific backing.
- Consistency is Key: Use tools regularly and under similar conditions for comparable data.
- Integrate Data Sources: Combine objective and subjective data for a holistic view.
- Backup Your Data: Regularly export and save your data to prevent loss.
By thoughtfully selecting and integrating these tools and technologies, you can elevate your biohacking practice with robust, evidence-based data collection and monitoring, paving the way for meaningful self-experimentation and health optimization.
2.4 Maintaining Safety and Ethical Considerations
Biohacking, while empowering and transformative, carries inherent responsibilities. Ensuring safety and adhering to ethical standards are paramount to protect your well-being and maintain integrity in self-experimentation.
Key Principles of Safety in Biohacking
- Start Small and Incremental: Avoid drastic changes; introduce one variable at a time.
- Know Your Baseline: Establish clear health baselines before starting any experiment.
- Monitor Continuously: Use reliable tools to track physiological and psychological responses.
- Have an Exit Plan: Know when and how to stop an experiment if adverse effects occur.
- Consult Professionals: When in doubt, seek advice from healthcare or scientific experts.
Ethical Considerations
- Informed Consent (Self-Consent): Fully understand the risks and benefits before proceeding.
- Privacy and Data Security: Protect your personal health data from unauthorized access.
- Transparency: Document and share findings honestly, including failures.
- Avoid Harm: Prioritize your health over curiosity or performance gains.
- Respect Legal Boundaries: Ensure all interventions comply with local laws and regulations.
Mind Map: Safety Checklist for Biohacking Experiments
Mind Map: Ethical Framework for Self-Experimentation
Practical Examples
Example 1: Safe Introduction of a New Supplement
Scenario: You want to try a new nootropic supplement to enhance focus.
Best Practices:
- Research the supplement’s safety profile and recommended dosage.
- Consult your doctor if you have pre-existing conditions or take medications.
- Start with the lowest effective dose.
- Monitor for side effects daily (e.g., jitteriness, headaches).
- Keep a journal of cognitive performance and mood.
- If adverse effects appear, discontinue immediately and seek advice.
Example 2: Ethical Data Sharing
Scenario: You conduct a month-long intermittent fasting experiment and want to share your results online.
Best Practices:
- Remove any personally identifiable information.
- Present data honestly, including days when fasting was not successful.
- Discuss limitations and avoid making unfounded health claims.
- Encourage readers to consult professionals before trying similar experiments.
Example 3: Monitoring and Stopping an Experiment
Scenario: You attempt cold exposure therapy but notice excessive shivering and prolonged numbness.
Best Practices:
- Use a timer and thermometer to control exposure duration and temperature.
- Recognize warning signs such as intense discomfort or loss of sensation.
- Stop the session immediately if symptoms worsen.
- Warm up gradually and document the experience.
- Adjust future protocols to safer parameters.
Summary
Maintaining safety and ethics in biohacking is not just about avoiding harm but fostering a sustainable, responsible approach to self-improvement. By integrating structured planning, continuous monitoring, and ethical mindfulness, you empower yourself to explore biohacking confidently and conscientiously.
2.5 Example: Planning a Sleep Optimization Experiment
Optimizing sleep is one of the most impactful biohacks you can undertake. In this example, we’ll walk through the process of planning a sleep optimization experiment using evidence-based methods, clear goals, and practical tracking tools.
Step 1: Define Your Objective
Goal: Improve sleep quality and increase total restorative sleep time (deep and REM sleep stages).
Step 2: Identify Variables and Controls
-
Independent Variables (Interventions):
- Reducing blue light exposure 2 hours before bedtime
- Implementing a consistent sleep schedule
- Using a white noise machine
- Adjusting room temperature to 65°F (18°C)
-
Dependent Variables (Outcomes to Measure):
- Total sleep time
- Sleep efficiency (time asleep/time in bed)
- Time spent in deep and REM sleep
- Subjective sleep quality (morning mood, alertness)
-
Control Variables:
- Avoid caffeine after 2 PM
- Maintain usual diet and exercise routines
Step 3: Design the Experiment Timeline
- Baseline Period (1 week): Track sleep without any interventions to establish baseline data.
- Intervention Period (3 weeks): Introduce one or more interventions.
- Washout Period (1 week): Return to baseline conditions to observe reversibility.
Step 4: Select Tools for Data Collection
- Wearables: Oura Ring, Fitbit, or WHOOP for objective sleep stage tracking.
- Apps: Sleep Cycle or Pillow for sleep timing and subjective ratings.
- Journaling: Daily sleep diary to log bedtime, wake time, and subjective sleep quality.
Step 5: Create a Mind Map of the Experiment Plan
Sleep Optimization Experiment Mind Map
Step 6: Example Daily Sleep Diary Entry
| Date | Bedtime | Wake Time | Total Sleep Time | Sleep Quality (1-10) | Notes |
|---|---|---|---|---|---|
| 2024-06-01 | 10:30PM | 6:30AM | 8 hours | 7 | Felt rested, no caffeine after 2PM |
Step 7: Example Data Visualization Plan
- Line Graph: Total sleep time over baseline and intervention weeks.
- Bar Chart: Average deep sleep percentage before and after intervention.
- Scatter Plot: Correlation between bedtime consistency and sleep efficiency.
Step 8: Best Practices Embedded in the Experiment
- Start with Baseline: Understand your natural sleep patterns before making changes.
- One Variable at a Time: If possible, introduce interventions sequentially to isolate effects.
- Use Objective and Subjective Data: Combine wearable data with personal feelings.
- Maintain Consistency: Keep other lifestyle factors stable to reduce confounding variables.
- Document Everything: Journaling helps contextualize data and identify patterns.
Summary
By carefully planning your sleep optimization experiment with clear goals, defined variables, appropriate tools, and structured timelines, you can systematically improve your sleep quality. This evidence-based approach minimizes guesswork and maximizes actionable insights.
Ready to hack your sleep? Start by tracking your baseline tonight!
3. Nutrition and Supplementation Hacks
3.1 Tracking Macronutrients and Micronutrients for Optimal Health
Understanding and tracking your intake of macronutrients and micronutrients is foundational to biohacking your nutrition for optimal health, energy, and longevity. This section will guide you through the basics, practical tools, and examples to make nutrient tracking approachable and effective.
What Are Macronutrients and Micronutrients?
-
Macronutrients: Nutrients required in large amounts that provide energy.
- Carbohydrates
- Proteins
- Fats
-
Micronutrients: Nutrients required in smaller amounts essential for physiological functions.
- Vitamins (e.g., Vitamin D, B12, C)
- Minerals (e.g., Magnesium, Iron, Zinc)
Why Track Nutrients?
- Optimize energy levels and physical performance
- Support cognitive function and mood
- Prevent nutrient deficiencies or excesses
- Personalize diet based on individual needs and goals
Mind Map: Overview of Nutrient Tracking
How to Track Macronutrients
Step 1: Define Your Goals
- Weight loss, muscle gain, cognitive enhancement, etc.
Step 2: Choose a Tracking Method
- Apps: MyFitnessPal, Cronometer, Lose It!
- Manual Logs: Food diary with nutrition labels
Step 3: Measure Portions Accurately
- Use food scales or measuring cups
Step 4: Log Daily Intake
- Record all meals, snacks, and drinks
Example: Tracking Macros for Energy Optimization
- Goal: Maintain steady energy throughout the day
- Approach: Moderate carbs (40%), moderate protein (30%), healthy fats (30%)
- Result: Notice reduced afternoon energy crashes
How to Track Micronutrients
Step 1: Understand Key Micronutrients Relevant to You
- Example: Vitamin D for immune support, Magnesium for muscle relaxation
Step 2: Use Detailed Tracking Apps
- Cronometer provides micronutrient breakdowns
Step 3: Supplement with Lab Testing
- Blood tests to confirm deficiencies or excesses
Step 4: Adjust Diet and Supplementation Accordingly
Example: Self-Experiment with Magnesium Intake
- Baseline: Fatigue and muscle cramps
- Intervention: Track magnesium-rich foods + supplement
- Outcome: Improved sleep quality and reduced cramps
Mind Map: Practical Steps for Nutrient Tracking
Best Practices
- Be consistent with logging for at least 2-4 weeks
- Combine subjective feelings (energy, mood) with objective data
- Reassess goals and adjust macros/micros as needed
- Use lab testing to validate micronutrient status
Real-Life Example: Sarah’s Journey to Balanced Nutrition
Sarah, a 35-year-old biohacker, struggled with afternoon slumps and brain fog. She began tracking her macronutrients using Cronometer and realized her carbohydrate intake was too low, causing energy dips. She adjusted her macros to 45% carbs, 25% protein, and 30% fats. Additionally, a blood test revealed low Vitamin B12, so she added B12-rich foods and a supplement. Over 6 weeks, Sarah reported improved focus, sustained energy, and better mood.
Summary
Tracking macronutrients and micronutrients empowers you to make informed dietary choices tailored to your unique biology and goals. Using accessible tools, clear goals, and evidence-based adjustments, you can optimize your nutrition as a cornerstone of practical biohacking.
Ready to start? Download a tracking app today and begin your first 7-day nutrient log to uncover your personalized nutrition blueprint!
3.2 Intermittent Fasting: Protocols, Benefits, and Self-Monitoring
Intermittent fasting (IF) has gained significant traction as a practical biohacking strategy to improve metabolic health, enhance cognitive function, and potentially extend longevity. This section explores popular IF protocols, the science-backed benefits, and how to effectively self-monitor your fasting experiments.
What is Intermittent Fasting?
Intermittent fasting is an eating pattern that cycles between periods of eating and fasting, focusing more on when you eat rather than what you eat. It is not a diet in the traditional sense but a timing strategy.
Popular Intermittent Fasting Protocols
Evidence-Based Benefits of Intermittent Fasting
- Metabolic Health: Improves insulin sensitivity, reduces blood sugar and insulin levels.
- Weight Management: Promotes fat loss while preserving lean muscle mass.
- Cognitive Function: Enhances brain-derived neurotrophic factor (BDNF), supports neuroplasticity.
- Longevity: Activates cellular repair processes like autophagy.
- Inflammation Reduction: Lowers markers of systemic inflammation.
Best Practices for Self-Experimentation with IF
- Choose a Protocol That Fits Your Lifestyle: Start with a gentle approach like 16/8.
- Track Biometrics: Use apps or journals to log weight, mood, energy, hunger levels.
- Monitor Blood Glucose and Ketones: Devices like continuous glucose monitors (CGMs) or ketone meters provide objective data.
- Record Sleep Quality: Fasting can impact sleep; track with wearables or sleep apps.
- Stay Hydrated: Drink water, herbal teas, and electrolytes during fasting windows.
- Adjust Based on Feedback: If energy dips or mood worsens, modify fasting duration or eating windows.
Example Self-Experiment: 16/8 Intermittent Fasting for 30 Days
Objective: Improve energy levels and reduce mid-afternoon slumps.
Protocol: Fast daily from 8pm to 12pm (16 hours fasting, 8 hours eating window).
Monitoring:
- Daily mood and energy journal entries.
- Weekly weight and waist circumference measurements.
- Blood glucose checks before first meal twice a week.
- Sleep quality tracked via wearable.
Results:
- Increased afternoon energy reported after 10 days.
- Average weight loss of 3 pounds by day 30.
- Improved fasting blood glucose levels.
- Slight initial sleep disruption that normalized by week 2.
Adjustments:
- Added electrolytes during fasting to reduce headaches.
- Shifted eating window earlier on weekends for social flexibility.
Mind Map: Self-Monitoring Components for Intermittent Fasting
Tips for Success
- Start gradually and listen to your body.
- Combine IF with nutrient-dense meals during eating windows.
- Avoid overeating or binging after fasting periods.
- Consult healthcare professionals if you have underlying conditions.
Intermittent fasting is a powerful, evidence-based biohack that can be tailored to individual needs through careful self-experimentation and monitoring. By integrating data-driven insights with mindful practice, you can optimize your fasting strategy for maximal health benefits.
3.3 Nootropics and Cognitive Enhancers: Evidence and Practical Use
Nootropics, often referred to as “smart drugs” or cognitive enhancers, are substances that aim to improve mental functions such as memory, creativity, focus, and motivation in healthy individuals. This section explores the scientific evidence behind popular nootropics, their mechanisms of action, safety considerations, and practical examples of self-experimentation.
What Are Nootropics?
- Natural or synthetic compounds that enhance cognitive performance.
- Categories include:
- Nutritional supplements (e.g., Omega-3 fatty acids, Bacopa monnieri)
- Pharmaceuticals (e.g., Modafinil, Piracetam)
- Herbal extracts (e.g., Ginkgo biloba, Rhodiola rosea)
Mind Map: Categories and Examples of Nootropics
Mechanisms of Action
- Neurotransmitter modulation: Many nootropics influence dopamine, acetylcholine, or glutamate pathways.
- Neuroprotection: Antioxidant properties protect neurons from oxidative stress.
- Neurogenesis: Some promote the growth of new neurons or synaptic connections.
- Cerebral blood flow: Enhanced oxygen and nutrient delivery to the brain.
Mind Map: Mechanisms of Cognitive Enhancement
Evidence-Based Nootropics and Their Effects
| Nootropic | Evidence Summary | Common Use Cases | Safety Profile |
|---|---|---|---|
| Caffeine + L-Theanine | Synergistic effect improves focus and reduces jitters (multiple RCTs) | Increased alertness and calm focus | Generally safe in moderate doses |
| Bacopa monnieri | Improves memory and learning after chronic use (4-12 weeks) | Memory enhancement | Mild GI discomfort possible |
| Rhodiola rosea | Reduces fatigue and improves mental performance under stress | Stress resilience | Well tolerated |
| Modafinil | Enhances wakefulness and executive function in healthy adults (prescription drug) | Shift work, cognitive fatigue | Potential side effects; consult doctor |
| Omega-3 Fatty Acids | Supports brain health and cognitive aging (mixed evidence for acute effects) | Long-term brain health | Safe, watch for bleeding risk |
Practical Use: Combining Caffeine and L-Theanine
- Why: Caffeine boosts alertness but can cause anxiety; L-Theanine promotes relaxation without sedation.
- Typical dose: 100 mg caffeine + 200 mg L-Theanine.
- Self-experiment example: Track focus and jitteriness using a daily journal or apps like Brain.fm or Focus@Will.
Example Mind Map: Caffeine + L-Theanine Self-Experiment
Safety and Best Practices
- Start with low doses to assess tolerance.
- Avoid stacking multiple nootropics without understanding interactions.
- Keep a detailed log of doses, timing, effects, and side effects.
- Consult healthcare professionals before using pharmaceuticals or if you have underlying health conditions.
- Cycle usage to prevent tolerance buildup.
Example: Self-Experiment with Bacopa Monnieri for Memory Enhancement
- Goal: Improve short-term memory recall.
- Protocol: 300 mg Bacopa extract daily for 8 weeks.
- Baseline: Conduct memory tests (e.g., digit span, word recall).
- Monitoring: Weekly cognitive tests and subjective mood/fatigue ratings.
- Outcome: Analyze improvements versus baseline and note any side effects.
Summary
Nootropics offer promising avenues for cognitive enhancement, but their effects vary widely among individuals. Evidence-based self-experimentation, combined with careful monitoring and safety considerations, empowers biohackers to optimize mental performance responsibly.
3.4 Personalized Supplementation: Testing Vitamin D and Magnesium Levels
Personalized supplementation is a cornerstone of practical biohacking, allowing you to tailor nutrient intake based on your unique physiological needs rather than relying on generic recommendations. Two of the most commonly deficient and impactful nutrients are Vitamin D and Magnesium. Testing your levels and adjusting supplementation accordingly can lead to significant improvements in energy, mood, sleep, and overall health.
Why Test Vitamin D and Magnesium?
- Vitamin D: Essential for bone health, immune function, mood regulation, and inflammation control. Deficiency is widespread, especially in regions with limited sunlight.
- Magnesium: Involved in over 300 enzymatic reactions including muscle and nerve function, blood glucose control, and blood pressure regulation. Deficiency can cause fatigue, muscle cramps, and poor sleep.
Step-by-Step Guide to Testing and Supplementing
-
Order Reliable Tests:
- Vitamin D: 25-hydroxyvitamin D blood test.
- Magnesium: Serum magnesium test or RBC magnesium test (more accurate).
-
Collect Baseline Data:
- Record symptoms such as fatigue, muscle cramps, mood changes, or sleep disturbances.
- Note lifestyle factors: sun exposure, diet, stress levels.
-
Analyze Results:
- Vitamin D optimal range: 40-60 ng/mL (some experts suggest 30-50 ng/mL as minimum).
- Magnesium normal serum range: 1.7-2.2 mg/dL; RBC magnesium preferred for intracellular status.
-
Design Supplementation Protocol:
- Vitamin D3 supplementation typically ranges from 1000-5000 IU daily depending on deficiency severity.
- Magnesium forms: Magnesium citrate, glycinate, or malate are well-absorbed; doses vary from 200-400 mg daily.
-
Track Changes and Symptoms:
- Retest after 8-12 weeks.
- Monitor symptom improvements and adjust doses.
Mind Map: Personalized Supplementation Workflow
Practical Example: Sarah’s Vitamin D and Magnesium Biohack
- Background: Sarah, a 35-year-old health enthusiast, experiences low energy and occasional muscle cramps.
- Testing: She orders a 25-hydroxyvitamin D test and RBC magnesium test.
- Results: Vitamin D level is 22 ng/mL (deficient), magnesium is at the low end of normal.
- Plan:
- Vitamin D3 3000 IU daily with a meal.
- Magnesium glycinate 300 mg nightly.
- Tracking: Sarah logs energy levels, muscle cramps, and sleep quality daily.
- Outcome: After 10 weeks, retesting shows Vitamin D at 45 ng/mL and improved magnesium status. Sarah reports better energy and reduced cramps.
Tips for Effective Supplementation
- Take Vitamin D with a fat-containing meal to improve absorption.
- Split magnesium doses if higher amounts cause digestive upset.
- Avoid excessive supplementation; toxicity is rare but possible.
- Consider seasonal variations: increase Vitamin D intake in winter months.
Mind Map: Supplementation Best Practices
By integrating testing, supplementation, and monitoring into your biohacking routine, you can optimize Vitamin D and Magnesium levels safely and effectively, leading to tangible improvements in your health and longevity.
3.5 Example: Self-Experimenting with a Ketogenic Diet for Energy and Focus
Introduction
The ketogenic diet (keto) is a low-carbohydrate, high-fat diet that has gained popularity for its potential to improve energy levels, mental clarity, and focus. This self-experiment aims to explore how adopting a ketogenic diet affects your cognitive performance and energy throughout the day using evidence-based tracking and adjustments.
Step 1: Define Your Goals
- Increase sustained mental focus during work/study hours
- Improve overall energy levels without afternoon crashes
- Understand personal response to macronutrient shifts
Step 2: Plan Your Experiment
- Duration: 4 weeks
- Baseline week: Track current diet, energy, and focus without changes
- Intervention weeks: Follow ketogenic macronutrient ratios (~70% fat, 20% protein, 10% carbs)
- Track daily metrics: energy levels, mental clarity, mood, ketone levels
Step 3: Tools and Tracking
- Use a food tracking app (e.g., Cronometer) to monitor macros
- Use a ketone meter (blood or breath) to measure ketosis
- Use a cognitive performance app (e.g., BrainHQ or Lumosity) for focus tests
- Maintain a daily journal for subjective energy and mood ratings (scale 1-10)
Step 4: Execution and Monitoring
- Gradually reduce carbs over 3 days to minimize keto flu
- Increase healthy fats: avocado, olive oil, nuts, fatty fish
- Avoid processed foods and added sugars
- Hydrate adequately and supplement electrolytes (sodium, potassium, magnesium)
Step 5: Data Collection and Analysis
- Record ketone levels each morning and evening
- Perform cognitive tests twice daily (morning and afternoon)
- Rate energy and focus subjectively three times per day
Mind Map: Planning the Ketogenic Diet Self-Experiment
Example Daily Log Entry
| Time | Metric | Value/Notes |
|---|---|---|
| Morning | Blood ketones | 1.5 mmol/L (nutritional ketosis) |
| Morning | Cognitive test score | 85/100 (improved from baseline) |
| Morning | Energy rating | 7/10 |
| Afternoon | Cognitive test score | 80/100 |
| Afternoon | Energy rating | 6/10 |
| Evening | Blood ketones | 1.2 mmol/L |
| Evening | Mood rating | 8/10 |
Step 6: Interpreting Results
- Look for trends in ketone levels correlating with cognitive test improvements
- Identify times of day when focus or energy dips occur
- Adjust fat intake or meal timing accordingly
Mind Map: Analyzing and Adjusting
Practical Tips
- Be patient: adaptation to keto can take 1-2 weeks
- Stay hydrated and maintain electrolytes to reduce side effects
- Use whole foods and avoid processed keto products
- Combine with regular sleep and exercise for best results
Summary
This self-experiment provides a structured, evidence-based approach to testing the ketogenic diet’s effects on energy and focus. By carefully tracking objective and subjective data, you can personalize the diet to maximize cognitive benefits and overall well-being.
Additional Resources
- The Art and Science of Low Carbohydrate Performance
- Ketogenic Diet Tracker Apps
- Cognitive Testing Platforms
4. Sleep Biohacking: Enhancing Rest for Longevity
4.1 Understanding Sleep Architecture and Its Importance
Sleep architecture refers to the structure and pattern of sleep cycles that occur throughout the night. Understanding sleep architecture is fundamental for biohackers and longevity seekers because it directly impacts cognitive function, physical recovery, hormonal balance, and overall health.
What is Sleep Architecture?
Sleep is not a uniform state but consists of multiple stages that cycle repeatedly. These stages are broadly categorized into:
- Non-Rapid Eye Movement (NREM) Sleep
- Stage 1: Light sleep, transition from wakefulness
- Stage 2: Deeper light sleep, body temperature drops, heart rate slows
- Stage 3: Deep sleep (also called Slow Wave Sleep), critical for physical restoration
- Rapid Eye Movement (REM) Sleep
- Dreaming stage, important for memory consolidation and emotional processing
A typical adult cycles through these stages approximately every 90 minutes, with 4-6 cycles per night.
Mind Map: Sleep Architecture Overview
Why is Sleep Architecture Important?
- Physical Recovery: Deep sleep (Stage 3) promotes tissue repair, muscle growth, and immune function.
- Cognitive Function: REM sleep supports learning, memory consolidation, and emotional health.
- Hormonal Balance: Sleep stages regulate hormones like cortisol, melatonin, and growth hormone.
- Metabolic Health: Poor sleep architecture is linked to insulin resistance and weight gain.
Example: Tracking Sleep Architecture with Wearables
Many modern wearables (e.g., Oura Ring, Fitbit, WHOOP) estimate sleep stages by measuring heart rate variability, movement, and skin temperature.
- Case: Jane, a biohacker, noticed she felt groggy despite 8 hours of sleep.
- Action: She used a wearable to track her sleep stages over two weeks.
- Finding: Her deep sleep was consistently below 10% of total sleep time (normal is about 13-23%).
- Intervention: She improved her sleep environment by reducing noise and temperature, leading to increased deep sleep and better daytime energy.
Mind Map: Factors Influencing Sleep Architecture
Practical Takeaway for Biohackers
- Measure: Use validated wearables or sleep studies to understand your sleep architecture.
- Optimize: Target improvements in deep and REM sleep through lifestyle changes (e.g., consistent sleep schedule, reducing blue light exposure).
- Experiment: Track changes over time to see how interventions affect your sleep stages and overall wellbeing.
By mastering the understanding of sleep architecture, biohackers can design personalized strategies to enhance restorative sleep, ultimately improving longevity, cognitive performance, and physical health.
4.2 Tracking Sleep Quality with Wearables and Apps
Understanding and improving sleep quality is a cornerstone of effective biohacking. Wearables and apps have revolutionized how individuals can monitor their sleep patterns, providing accessible, real-time data that can be used to optimize rest and recovery. This section explores the best practices for tracking sleep quality, the types of data collected, and how to interpret and act on this information.
Why Track Sleep Quality?
- Identify sleep stages and disruptions
- Understand sleep duration and efficiency
- Correlate lifestyle factors with sleep patterns
- Detect potential sleep disorders early
Common Metrics Monitored by Wearables and Apps
- Total Sleep Time (TST): Total duration spent asleep
- Sleep Stages: Light, Deep, REM sleep durations
- Sleep Onset Latency: Time taken to fall asleep
- Wake After Sleep Onset (WASO): Time awake during the night
- Sleep Efficiency: Percentage of time in bed spent asleep
- Heart Rate Variability (HRV): Indicator of autonomic nervous system activity
- Respiratory Rate: Breathing patterns during sleep
Popular Wearables and Apps for Sleep Tracking
| Device/App | Features | Example Use Case |
|---|---|---|
| Fitbit | Sleep stages, HRV, SpO2 monitoring | Tracking impact of exercise on sleep |
| Oura Ring | Detailed sleep staging, readiness | Optimizing bedtime based on readiness |
| WHOOP Strap | Recovery scores, strain tracking | Balancing training load with sleep |
| Apple Watch | Sleep duration, heart rate | Integrating sleep data with health apps |
| Sleep Cycle (App) | Smart alarm, sleep analysis | Waking during light sleep phase |
Best Practices for Using Wearables and Apps
- Consistency: Wear the device every night for accurate trend analysis.
- Calibration: Understand baseline metrics before making changes.
- Contextual Logging: Use app journals to note lifestyle factors (caffeine, stress, exercise).
- Data Privacy: Review privacy policies and secure your data.
- Avoid Over-Reliance: Use data as guidance, not absolute diagnosis.
Example: Tracking Sleep with Oura Ring
- Goal: Improve sleep efficiency and reduce time to fall asleep.
- Method: Wear Oura Ring nightly, log caffeine intake and evening screen time.
- Data Observed: Noticed increased sleep onset latency on days with late caffeine.
- Action: Shifted caffeine consumption to before 2 PM.
- Result: Sleep onset latency decreased by 15 minutes over two weeks.
Mind Map: Sleep Tracking Workflow
Mind Map: Interpreting Sleep Data for Biohacking
Practical Tips for Beginners
- Start with a simple wearable or app to avoid data overwhelm.
- Keep a sleep diary alongside digital tracking for qualitative insights.
- Experiment with one variable at a time (e.g., reduce screen time before bed) and observe changes.
- Use app reminders to maintain consistent sleep and wake times.
Summary
Tracking sleep quality with wearables and apps empowers biohackers to make informed decisions about their rest and recovery. By understanding key metrics, maintaining consistent data collection, and interpreting results within the context of lifestyle factors, individuals can optimize their sleep for enhanced health and longevity.
4.3 Environmental and Behavioral Hacks to Improve Sleep
Improving sleep quality is a cornerstone of effective biohacking, and environmental and behavioral modifications often yield significant benefits. This section explores practical, evidence-based strategies to optimize your sleep environment and habits, supported by clear examples and mind maps to help you visualize and implement these hacks.
Key Environmental Factors Affecting Sleep
- Light Exposure: Light influences melatonin production, the hormone regulating sleep-wake cycles.
- Noise Levels: Ambient noise can disrupt sleep stages.
- Temperature: The ideal bedroom temperature supports natural body cooling.
- Air Quality: Fresh air and low allergens promote restful sleep.
- Comfort: Mattress, pillows, and bedding affect physical comfort.
Behavioral Factors Influencing Sleep
- Consistent Sleep Schedule: Going to bed and waking up at the same time daily.
- Pre-Sleep Routine: Activities that signal the body to wind down.
- Screen Time Management: Limiting blue light exposure before bed.
- Caffeine and Alcohol Intake: Timing and quantity impact sleep onset and quality.
- Physical Activity: Exercise timing can either promote or hinder sleep.
Mind Map: Environmental and Behavioral Sleep Hacks
Practical Examples
Example 1: Blue Light Reduction
Scenario: Sarah struggles with falling asleep and often uses her smartphone before bed.
Hack: She installs a blue light filter app on her devices and sets a reminder to stop screen use 1 hour before bedtime. Additionally, she buys warm, dimmable bedside lamps.
Outcome: After two weeks, Sarah notices she falls asleep faster and experiences fewer nighttime awakenings.
Example 2: Temperature Optimization
Scenario: John wakes up feeling hot and restless.
Hack: He adjusts his thermostat to 65°F (18°C), switches to breathable cotton sheets, and uses a fan for air circulation.
Outcome: John reports deeper, uninterrupted sleep and feels more refreshed in the morning.
Example 3: Noise Management
Scenario: Emma lives near a busy street and finds traffic noise disruptive.
Hack: She purchases a white noise machine and uses earplugs.
Outcome: Emma experiences fewer awakenings and improved sleep duration.
Example 4: Establishing a Pre-Sleep Routine
Scenario: Mike often lies in bed scrolling through social media, delaying sleep onset.
Hack: Mike replaces screen time with 20 minutes of light stretching and reading a physical book.
Outcome: Mike falls asleep quicker and reports feeling less groggy upon waking.
Integrating Hacks into a Personalized Sleep Improvement Plan
- Assess your current environment and behaviors. Use a sleep diary or app to track patterns.
- Select 2-3 environmental or behavioral changes to implement. Avoid overwhelming yourself.
- Monitor changes for at least 2 weeks. Record sleep quality and duration.
- Adjust and iterate based on data and subjective experience.
Summary
Optimizing your sleep environment and behaviors is a powerful, low-risk approach to enhancing sleep quality. By systematically reducing disruptive light and noise, controlling temperature and air quality, and adopting consistent, calming pre-sleep habits, you can biohack your way to restorative sleep and improved overall health.
4.4 Using Light Therapy and Melatonin Supplementation Responsibly
Light therapy and melatonin supplementation are powerful tools in the biohacker’s toolkit for optimizing sleep quality and circadian rhythm alignment. However, their benefits depend heavily on responsible use, timing, and individual factors. This section explores best practices, scientific evidence, and practical examples to help you harness these interventions effectively and safely.
Understanding Light Therapy
Light therapy involves exposure to specific wavelengths and intensities of light to influence the body’s internal clock (circadian rhythm). It is commonly used to treat Seasonal Affective Disorder (SAD), circadian rhythm sleep disorders, and jet lag.
Key Concepts:
- Blue Light (460-480 nm): Most effective at suppressing melatonin and shifting circadian rhythms.
- Intensity: Therapeutic light boxes typically emit 10,000 lux.
- Timing: Morning exposure advances the circadian phase (helps wake earlier), evening exposure delays it.
Mind Map: Light Therapy Basics
Best Practices for Light Therapy
- Use a clinically validated light box emitting 10,000 lux.
- Expose yourself for 20-30 minutes within 1-2 hours of waking.
- Maintain a distance of about 12-24 inches from the light source.
- Avoid direct staring; keep eyes open and let light enter peripherally.
- Avoid bright light exposure in the evening to prevent melatonin suppression.
- Consult a healthcare provider if you have bipolar disorder or eye conditions.
Understanding Melatonin Supplementation
Melatonin is a hormone produced by the pineal gland that signals the body to prepare for sleep. Supplementation can help with sleep onset, jet lag, and circadian rhythm disorders.
Key Points:
- Dosage: Typically 0.3 mg to 5 mg; lower doses often mimic natural physiology better.
- Timing: Take 30-60 minutes before desired bedtime.
- Forms: Immediate-release (for sleep onset) and extended-release (for sleep maintenance).
- Safety: Generally safe for short-term use; long-term effects less studied.
Mind Map: Melatonin Supplementation
Combining Light Therapy and Melatonin Responsibly
To optimize circadian alignment:
- Use morning light therapy to advance wake time.
- Use melatonin in the evening to advance sleep onset.
- Avoid bright light exposure 2-3 hours before bedtime to prevent melatonin suppression.
Practical Examples
Example 1: Overcoming Delayed Sleep Phase Syndrome (DSPS)
Scenario: You naturally fall asleep at 2 AM and wake at 10 AM but want to shift to a 11 PM - 7 AM schedule.
Protocol:
- Morning (7 AM): 30 minutes of 10,000 lux light therapy.
- Evening (9:30 PM): 0.5 mg melatonin supplement.
- Avoid screens and bright lights after 9 PM.
Outcome: Over 2 weeks, sleep onset shifts earlier by 30 minutes per week.
Example 2: Managing Jet Lag After Eastward Travel
Scenario: Flying from New York to London (5-hour time difference).
Protocol:
- Morning light therapy in London local time (7 AM) for 30 minutes.
- Melatonin 1 mg at local bedtime (10 PM) for 3 nights.
- Avoid bright light exposure in the evening.
Outcome: Faster adjustment to local time, reduced daytime fatigue.
Monitoring and Adjusting Your Protocol
- Track sleep onset, duration, and quality using apps or wearables.
- Note subjective alertness and mood.
- Adjust light therapy timing and melatonin dose based on response.
Cautions and Contraindications
- People with bipolar disorder should use melatonin cautiously due to potential mood destabilization.
- Eye conditions like retinal diseases require medical advice before light therapy.
- Avoid melatonin if pregnant or breastfeeding without medical consultation.
Summary
| Intervention | Timing | Typical Dose/Duration | Key Considerations |
|---|---|---|---|
| Light Therapy | Morning (within 1-2h of waking) | 20-30 minutes at 10,000 lux | Avoid evening exposure; use validated device |
| Melatonin | 30-60 minutes before bedtime | 0.3-5 mg (start low) | Use short-term; consider form and timing |
Using light therapy and melatonin supplementation responsibly requires understanding their mechanisms, timing, and individual variability. By following evidence-based protocols and monitoring your responses, you can effectively biohack your sleep and circadian health.
4.5 Example: Self-Experiment on Blue Light Reduction and Sleep Efficiency
Introduction
Blue light, primarily emitted from screens like smartphones, tablets, and computers, can disrupt our natural circadian rhythms by suppressing melatonin production. This suppression often leads to poorer sleep quality and reduced sleep efficiency. This self-experiment aims to test the impact of reducing blue light exposure in the evening on sleep efficiency using evidence-based methods.
Objective
To determine whether reducing blue light exposure after 7 PM improves sleep efficiency, total sleep time, and subjective sleep quality.
Materials & Tools
- Blue light blocking glasses (wavelength cutoff ~450 nm)
- Screen filter apps (e.g., f.lux, Night Shift)
- Sleep tracker (wearable like Oura Ring, Fitbit, or smartphone app)
- Sleep diary/journal
- Light meter app (optional, to measure ambient light intensity)
Experimental Design
| Variable | Description |
|---|---|
| Independent Variable | Blue light exposure after 7 PM (reduced vs. normal) |
| Dependent Variables | Sleep efficiency, total sleep time, subjective sleep quality |
| Control | Normal evening screen use without blue light reduction |
| Duration | 14 days (7 days baseline, 7 days intervention) |
Procedure
- Baseline Week: Maintain usual evening habits without blue light reduction. Track sleep data and record subjective sleep quality daily.
- Intervention Week: From 7 PM onwards, wear blue light blocking glasses and enable screen filter apps on all devices. Continue tracking sleep and subjective quality.
- Data Collection: Use the sleep tracker to record objective sleep metrics. Use a sleep diary to note perceived sleep quality, sleep onset latency, and any disturbances.
Mind Map: Blue Light Reduction Self-Experiment
Data Analysis
- Compare average sleep efficiency (%) between baseline and intervention weeks.
- Analyze total sleep time (hours) changes.
- Review sleep onset latency and number of awakenings.
- Evaluate subjective sleep quality scores (scale 1-10).
- Use simple paired t-tests or non-parametric tests to assess significance.
Example Data Table
| Day | Blue Light Exposure | Sleep Efficiency (%) | Total Sleep Time (hrs) | Sleep Onset Latency (min) | Subjective Quality (1-10) |
|---|---|---|---|---|---|
| 1 | Normal | 78 | 6.5 | 25 | 6 |
| 2 | Normal | 80 | 6.8 | 22 | 7 |
| … | … | … | … | … | … |
| 8 | Reduced | 85 | 7.2 | 15 | 8 |
| 9 | Reduced | 87 | 7.4 | 12 | 9 |
Practical Tips
- Consistency is key: wear glasses and enable filters every evening after 7 PM.
- Avoid caffeine and heavy meals close to bedtime to reduce confounding factors.
- Keep a consistent bedtime and wake time.
- Use a dark, quiet, and cool bedroom environment.
Additional Mind Map: Factors Influencing Sleep Efficiency
Summary
This self-experiment provides a structured, evidence-based approach to evaluate how blue light reduction impacts sleep efficiency. By combining objective data from sleep trackers with subjective sleep diaries, biohackers can make informed decisions about evening screen use and optimize their sleep hygiene for longevity and well-being.
References & Further Reading
- Chang, A.-M., et al. (2015). Evening use of light-emitting eReaders negatively affects sleep, circadian timing, and next-morning alertness. PNAS.
- Harvard Health Publishing. (2020). Blue light has a dark side.
- Walker, M. (2017). Why We Sleep: Unlocking the Power of Sleep and Dreams. Scribner.
This example can be adapted to other light-related biohacks or extended with additional variables such as melatonin supplementation or light therapy for a comprehensive sleep optimization strategy.
5. Physical Activity and Movement Optimization
5.1 Biohacking Exercise: Balancing Intensity, Frequency, and Recovery
Biohacking exercise is about optimizing your physical activity to maximize benefits such as strength, endurance, metabolic health, and longevity, while minimizing risks like injury and burnout. The key to effective exercise biohacking lies in balancing three critical components: intensity, frequency, and recovery.
Understanding the Components
- Intensity: How hard you push your body during exercise. This can be measured by heart rate zones, perceived exertion, or weight lifted.
- Frequency: How often you exercise within a given timeframe (e.g., per week).
- Recovery: The rest and repair period your body needs to adapt and grow stronger.
Mind Map: Balancing Exercise Components
Best Practices for Balancing Intensity, Frequency, and Recovery
-
Start with Clear Goals: Define what you want to achieve — strength, endurance, fat loss, or overall health.
-
Use Periodization: Cycle through phases of varying intensity and volume to prevent plateaus and overtraining.
-
Listen to Your Body: Use subjective measures like fatigue, soreness, and motivation alongside objective data.
-
Track Recovery Metrics: Heart Rate Variability (HRV) is a powerful tool to gauge readiness.
-
Incorporate Active Recovery: Light movement, stretching, or mobility work can accelerate recovery.
-
Prioritize Sleep and Nutrition: Recovery is incomplete without quality sleep and proper nutrient intake.
Example 1: Balancing for Fat Loss with HIIT
- Goal: Fat loss and metabolic health
- Intensity: High (HIIT sessions at 85-95% max heart rate)
- Frequency: 3 times per week
- Recovery: 48 hours between sessions, active recovery days with walking or yoga
- Monitoring: Use HRV and perceived exertion to adjust session intensity
Outcome: This balance allows for maximizing fat burning while preventing overtraining.
Example 2: Strength Training for Longevity
- Goal: Maintain muscle mass and joint health
- Intensity: Moderate to high (70-85% 1RM for compound lifts)
- Frequency: 3-4 times per week
- Recovery: 1-2 rest days per week, focus on sleep quality and protein intake
- Monitoring: Track soreness, performance progression, and HRV
Outcome: Sustainable strength improvements with minimized injury risk.
Mind Map: Recovery Strategies
Practical Tips for Self-Experimentation
- Track your workouts: Record intensity (weights, reps, heart rate), frequency, and subjective recovery.
- Use wearable tech: Devices like WHOOP, Oura Ring, or Garmin can provide HRV and sleep data.
- Adjust based on data: If HRV drops or fatigue increases, reduce intensity or increase recovery.
- Experiment with frequency: Try 3 vs. 5 sessions per week and note performance and recovery differences.
Summary
Balancing intensity, frequency, and recovery is essential for effective exercise biohacking. By combining clear goal-setting, data-driven monitoring, and mindful recovery strategies, you can optimize your workouts to enhance performance, health, and longevity.
5.2 Monitoring Biometrics: Heart Rate Variability and Performance Metrics
Biohacking physical performance and recovery hinges on understanding and monitoring key biometrics. Among these, Heart Rate Variability (HRV) and other performance metrics provide invaluable insights into your autonomic nervous system balance, stress levels, and readiness for training. This section will dive into practical ways to monitor these biometrics, interpret the data, and apply it to optimize your workouts and recovery.
What is Heart Rate Variability (HRV)?
HRV is the variation in time intervals between consecutive heartbeats, measured in milliseconds. Unlike resting heart rate, which is a single average number, HRV reflects the dynamic interplay between the sympathetic (fight or flight) and parasympathetic (rest and digest) nervous systems.
- High HRV: Indicates good autonomic balance, recovery, and resilience.
- Low HRV: Suggests stress, fatigue, or overtraining.
Why Monitor HRV and Performance Metrics?
- Optimize Training Load: Adjust intensity based on recovery status.
- Prevent Overtraining: Early detection of fatigue and stress.
- Enhance Recovery: Tailor rest days and active recovery.
- Track Adaptations: See how your body responds to interventions.
Common Performance Metrics to Track Alongside HRV
- Resting Heart Rate (RHR)
- Sleep Quality and Duration
- Training Volume and Intensity
- Perceived Exertion
- Blood Oxygen Saturation (SpO2)
- Respiratory Rate
Tools and Devices for Monitoring
- Wearables: WHOOP Strap, Oura Ring, Garmin, Polar, Apple Watch
- Apps: Elite HRV, HRV4Training, Kubios
- Chest Straps: Polar H10 (for more accurate HRV data)
Practical Mind Map: Monitoring HRV and Performance Metrics
How to Measure HRV Effectively
- Consistency: Measure at the same time daily, preferably upon waking.
- Position: Measure lying down or seated to reduce variability.
- Duration: Use 1-5 minute recordings for reliable data.
- Environment: Quiet, relaxed setting without distractions.
Example 1: Using HRV to Adjust Training Intensity
Scenario: Jane is a biohacker and endurance athlete who tracks her HRV every morning using the Oura Ring.
- On days when her HRV is above her personal baseline, she performs high-intensity interval training (HIIT).
- When HRV drops below baseline, she opts for low-intensity recovery workouts or rest.
Outcome: Over 3 months, Jane notices fewer injuries, improved performance, and better overall energy.
Example 2: Correlating HRV with Sleep and Stress
Scenario: Mark uses Elite HRV app and a Polar H10 chest strap.
- He logs daily stress levels and sleep quality.
- Over 6 weeks, he observes that nights with poor sleep correlate with lower HRV the following morning.
- On high-stress days, HRV is consistently suppressed.
Application: Mark implements mindfulness meditation and sleep hygiene improvements, resulting in increased HRV and better training outcomes.
Mind Map: Example Workflow for HRV-Based Training Adjustment
Tips for Effective Biometrics Monitoring
- Avoid Overreacting to Single Data Points: Look for trends over days or weeks.
- Combine Subjective and Objective Data: Use how you feel alongside biometrics.
- Keep a Log: Use apps or journals to track and correlate data.
- Be Patient: Adaptations take time; consistent monitoring is key.
Summary
Monitoring HRV and performance metrics empowers biohackers and longevity seekers to make informed decisions about their training and recovery. By integrating wearable technology, consistent measurement protocols, and thoughtful data interpretation, you can optimize your physical performance, reduce injury risk, and enhance overall well-being.
Further Reading and Resources
- “Heart Rate Variability: Standards of Measurement, Physiological Interpretation and Clinical Use” – Task Force of the European Society of Cardiology
- Elite HRV Blog: https://elitehrv.com/blog
- WHOOP Journal: https://www.whoop.com/thelocker/
- “The Science of Recovery” by Dr. Andrew Huberman
5.3 Incorporating Mobility and Flexibility Routines
Maintaining and improving mobility and flexibility is a cornerstone of effective biohacking for physical performance and longevity. Mobility refers to the ability of a joint to move actively through a range of motion, while flexibility is the capacity of muscles and connective tissues to stretch passively. Together, they contribute to injury prevention, better posture, and enhanced physical function.
Why Mobility and Flexibility Matter
- Injury Prevention: Poor mobility can cause compensations that lead to overuse injuries.
- Improved Performance: Greater range of motion allows for more efficient movement patterns.
- Longevity: Maintaining joint health and muscle elasticity supports long-term physical independence.
Best Practices for Incorporating Mobility and Flexibility
- Consistency Over Intensity: Daily short sessions are more effective than sporadic long ones.
- Dynamic Warm-Ups: Use dynamic stretches before workouts to prepare muscles and joints.
- Static Stretching: Best performed post-exercise or during dedicated flexibility sessions.
- Progressive Overload: Gradually increase stretch duration and range to avoid injury.
- Integrate Mind-Body Awareness: Focus on breathing and muscle engagement during stretches.
Mind Map: Components of Mobility and Flexibility Routines
Practical Examples
Example 1: Morning Mobility Routine (10 minutes)
- 2 minutes of arm circles and shoulder rolls
- 2 minutes of hip circles and leg swings
- 3 minutes of thoracic spine rotations and cat-cow stretches
- 3 minutes of ankle mobility drills and calf stretches
Example 2: Post-Workout Flexibility Session (15 minutes)
- 3 minutes hamstring stretch (each leg)
- 3 minutes hip flexor stretch (each leg)
- 3 minutes chest and shoulder stretch
- 3 minutes seated spinal twist
- 3 minutes deep breathing and relaxation
Mind Map: Sample Weekly Mobility & Flexibility Schedule
Self-Experimentation Example: Tracking Mobility Improvements
Goal: Improve hip mobility to reduce lower back discomfort.
Protocol:
- Perform hip circles, pigeon stretch, and hip flexor stretches daily for 10 minutes.
- Use a goniometer or smartphone app to measure hip flexion range weekly.
- Record subjective pain levels and ease of movement.
Outcome: After 4 weeks, increased hip flexion by 15 degrees and reported decreased discomfort during daily activities.
Tips for Success
- Use apps like ROM Coach or Goniometer Pro for tracking joint angles.
- Incorporate mobility breaks during sedentary work hours.
- Pair mobility work with breath control to enhance relaxation and effectiveness.
- Listen to your body; avoid pushing into pain.
Incorporating mobility and flexibility routines into your biohacking practice not only supports physical health but also enhances overall well-being by improving movement quality and reducing injury risk. Start small, stay consistent, and track your progress to optimize your results.
5.4 Cold Exposure and Heat Therapy: Science and Practical Application
Cold exposure and heat therapy are two powerful biohacking modalities that leverage the body’s natural adaptive responses to improve health, enhance recovery, and boost longevity. This section explores the underlying science, practical applications, and easy-to-follow examples to safely incorporate these therapies into your routine.
The Science Behind Cold Exposure
Cold exposure activates several physiological pathways:
- Thermogenesis: The body generates heat by burning calories, particularly through brown adipose tissue (BAT) activation.
- Hormesis: Mild stress from cold triggers adaptive responses that enhance cellular resilience.
- Anti-inflammatory Effects: Cold reduces inflammation and oxidative stress.
- Immune System Modulation: Regular cold exposure may improve immune function.
Mind Map: Cold Exposure Science
The Science Behind Heat Therapy
Heat therapy, including sauna use and hot baths, offers complementary benefits:
- Heat Shock Proteins (HSPs): Heat induces HSPs that help repair damaged proteins and support cellular health.
- Cardiovascular Benefits: Heat causes vasodilation, improving circulation and cardiovascular conditioning.
- Detoxification: Sweating helps eliminate toxins.
- Muscle Relaxation and Recovery: Heat reduces muscle soreness and stiffness.
Mind Map: Heat Therapy Science
Practical Applications and Best Practices
| Therapy | Method Examples | Duration & Frequency | Safety Tips |
|---|---|---|---|
| Cold Exposure | Cold showers, ice baths, cryotherapy | Start with 30 seconds, build to 2-5 minutes; 3-5 times/week | Avoid prolonged exposure; monitor for hypothermia; consult doctor if cardiovascular issues |
| Heat Therapy | Sauna sessions, hot baths, steam rooms | 10-20 minutes per session; 3-4 times/week | Stay hydrated; avoid overheating; consult doctor if pregnant or with heart conditions |
Example 1: Beginner Cold Shower Protocol
- Start with your regular warm shower.
- Switch to cold water for 30 seconds.
- Gradually increase cold exposure by 15 seconds every session.
- Aim for 2-3 minutes of cold exposure within 2 weeks.
- Monitor your body’s response and adjust accordingly.
Example 2: Sauna Routine for Recovery
- Begin with a 10-minute sauna session at 70-80°C (158-176°F).
- Cool down with a cold shower or plunge.
- Repeat cycle 2-3 times.
- Finish with hydration and rest.
Integrating Cold and Heat for Enhanced Benefits
Alternating between cold and heat therapies, known as contrast therapy, can amplify benefits:
- Enhances circulation through vasoconstriction and vasodilation cycles.
- Accelerates muscle recovery.
- Boosts mood and energy levels.
Mind Map: Contrast Therapy
Example 3: Contrast Therapy Session
- 3-5 minutes in a sauna or hot bath.
- 30 seconds to 1 minute cold shower or ice bath.
- Repeat cycle 3 times.
- End with a cool shower and hydration.
Monitoring and Tracking Your Progress
- Use wearable devices to track heart rate variability (HRV) and recovery.
- Keep a journal noting mood, energy, soreness, and sleep quality.
- Adjust duration and frequency based on personal tolerance and goals.
Summary
Cold exposure and heat therapy are accessible, evidence-based biohacks that can improve metabolic health, recovery, and longevity. Starting gradually, respecting safety guidelines, and tracking your responses will help you harness their full potential.
For further reading, consider exploring:
- “What Doesn’t Kill Us” by Scott Carney (cold exposure)
- Research on heat shock proteins and sauna benefits
- Scientific articles on hormesis and thermoregulation
5.5 Example: Self-Experimenting with High-Intensity Interval Training (HIIT)
High-Intensity Interval Training (HIIT) is a popular biohack for improving cardiovascular fitness, metabolic health, and fat loss in a time-efficient manner. This section walks you through a practical, evidence-based self-experiment to optimize your HIIT routine.
Step 1: Define Your Goals
Before starting, clarify what you want to achieve. Common goals include:
- Improving cardiovascular endurance
- Increasing fat oxidation
- Enhancing insulin sensitivity
- Boosting overall energy levels
Step 2: Design Your Experiment
Key variables to consider:
- Interval duration (e.g., 20s, 30s, 60s)
- Rest period length (e.g., equal to work, double work)
- Number of intervals per session
- Frequency per week
- Intensity level (measured by heart rate or perceived exertion)
Example protocol:
| Parameter | Value |
|---|---|
| Work Interval | 30 seconds |
| Rest Interval | 60 seconds |
| Number of Intervals | 8 |
| Frequency | 3 times per week |
| Intensity | 85-95% max HR |
Step 3: Select Metrics to Track
Choose measurable outcomes to evaluate effectiveness:
- Resting heart rate (RHR)
- Heart rate variability (HRV)
- Perceived exertion (RPE scale)
- Blood glucose response (fasting and post-exercise)
- Body composition (fat percentage via scale or calipers)
- Mood and energy levels (daily journal)
Step 4: Establish Baseline Data
Before starting HIIT, collect baseline data for at least 3-5 days:
- Measure resting heart rate each morning
- Record fasting blood glucose
- Assess body composition
- Log mood and energy
This baseline will help you compare progress objectively.
Step 5: Conduct the Experiment
Follow your designed HIIT protocol consistently for 4 weeks. Use a heart rate monitor or fitness tracker to ensure you hit target intensity zones.
Example daily log entry:
| Date | Intervals Completed | Avg HR (bpm) | RPE (1-10) | Mood (1-5) | Notes |
|---|---|---|---|---|---|
| 2024-06-01 | 8 | 170 | 8 | 4 | Felt strong, good recovery |
Step 6: Analyze Results
After 4 weeks, compare your tracked metrics against baseline:
- Has resting heart rate decreased?
- Is HRV improved?
- Any changes in body fat percentage?
- How do mood and energy levels compare?
Visualizing data can help:
Step 7: Adjust and Iterate
Based on findings, tweak your protocol:
- Increase intervals or intensity if progress plateaued
- Adjust rest periods for better recovery
- Incorporate complementary recovery strategies (e.g., cold exposure, stretching)
Practical Tips and Best Practices
- Warm-up and Cool-down: Always include 5-10 minutes of warm-up and cool-down to prevent injury.
- Consistency: Stick to your schedule but listen to your body to avoid overtraining.
- Hydration and Nutrition: Support your training with adequate hydration and nutrient intake.
- Use Technology: Apps like Strava, WHOOP, or Garmin can help track heart rate and intervals precisely.
- Safety First: Consult a healthcare provider if you have pre-existing conditions.
Summary Mind Map
By following this structured, evidence-based approach to self-experimenting with HIIT, you can optimize your training for your unique physiology and goals, minimizing guesswork and maximizing results.
6. Cognitive and Mental Performance Enhancements
6.1 Mindfulness, Meditation, and Neurofeedback Techniques
Biohacking mental performance is not just about supplements or gadgets; cultivating a calm, focused mind through mindfulness, meditation, and neurofeedback can profoundly enhance cognitive function, emotional regulation, and stress resilience. This section explores these techniques with practical examples and mind maps to guide your self-experimentation.
What is Mindfulness?
Mindfulness is the practice of intentionally paying attention to the present moment without judgment. It helps reduce stress, improve focus, and increase emotional awareness.
Example: Start with a simple 5-minute daily mindfulness breathing exercise. Sit quietly, focus on your breath, and gently bring your attention back when your mind wanders.
Meditation Techniques
Meditation is a structured practice to cultivate mindfulness and other mental states. Common forms include:
- Focused Attention Meditation: Concentrate on a single object (breath, mantra).
- Open Monitoring Meditation: Observe thoughts and sensations without attachment.
- Loving-Kindness Meditation: Cultivate compassion towards self and others.
Example: Try a 10-minute focused attention meditation each morning and track mood and concentration changes using a journal or app.
Neurofeedback: Training Your Brain
Neurofeedback uses real-time EEG data to help you learn to regulate brain activity. It can improve attention, reduce anxiety, and enhance cognitive flexibility.
Example: Use a consumer-grade neurofeedback device (e.g., Muse headband) during meditation sessions to receive feedback on your brain’s calmness and focus levels.
Mind Map: Overview of Mindfulness, Meditation, and Neurofeedback
Mind Map: Steps to Start a Mindfulness Meditation Practice
Practical Self-Experiment Example: Combining Meditation and Neurofeedback
Goal: Improve focus and reduce anxiety over 4 weeks.
Protocol:
- Week 1-2: 10 minutes daily focused attention meditation without device.
- Week 3-4: 10 minutes daily meditation with Muse headband neurofeedback.
Measurements:
- Daily subjective focus rating (scale 1-10).
- Weekly anxiety questionnaire (e.g., GAD-7).
- Device feedback metrics (calmness score).
Expected Outcome: Increased focus ratings, reduced anxiety scores, improved neurofeedback calmness.
Tips for Effective Practice
- Consistency is key: daily practice yields best results.
- Start small to build habit and avoid overwhelm.
- Use apps like Headspace, Insight Timer, or neurofeedback devices for guidance.
- Combine mindfulness with physical activity for synergistic effects.
Summary
Mindfulness, meditation, and neurofeedback are powerful, evidence-based tools for biohackers to enhance mental performance. By integrating these practices into your routine and tracking outcomes, you can optimize cognitive function and emotional well-being through self-experimentation.
6.2 Tracking Cognitive Performance: Apps and Tests
Tracking cognitive performance is a cornerstone of biohacking mental acuity and overall brain health. By systematically measuring aspects such as memory, attention, processing speed, and executive function, biohackers can identify what interventions improve or impair their cognitive abilities.
Why Track Cognitive Performance?
- Objective Feedback: Understand the impact of lifestyle changes, supplements, or routines.
- Personalized Optimization: Tailor interventions based on data rather than guesswork.
- Early Detection: Spot cognitive decline or stress-related impairments early.
Key Cognitive Domains to Track
Popular Apps and Platforms for Cognitive Testing
| App Name | Features | Example Use Case |
|---|---|---|
| Lumosity | Brain games targeting memory, attention, speed | Daily 15-min brain training sessions |
| Peak | Personalized workouts, progress tracking | Tracking improvements in problem-solving |
| Cognifit | Clinical-grade tests, detailed reports | Monitoring cognitive recovery post-injury |
| BrainHQ | Scientifically designed exercises | Enhancing processing speed and attention |
| Neurotrack | Memory tests with eye-tracking technology | Early detection of memory decline |
| Cambridge Brain Sciences | Wide range of cognitive tasks | Comprehensive cognitive profiling |
Example: Using Lumosity to Track Attention and Memory
- Baseline Testing: Complete the initial assessment to establish your cognitive baseline.
- Daily Training: Engage in 15 minutes of targeted games focusing on attention and memory.
- Weekly Review: Use app analytics to observe trends and improvements.
- Adjustments: Modify training focus based on data (e.g., increase memory games if attention improves but memory lags).
Cognitive Tests You Can Do at Home
- N-Back Test: Measures working memory and attention.
- Example: Use an app like Brain Workshop or online N-back tests.
- Stroop Test: Assesses cognitive flexibility and inhibitory control.
- Example: Online Stroop tests with timed responses.
- Trail Making Test: Evaluates processing speed and executive function.
- Example: Printable versions or digital apps.
- Digit Span Test: Tests short-term memory capacity.
- Example: Repeat sequences of numbers forward and backward.
Integrating Mood and Stress Tracking
Cognitive performance is closely linked to mood and stress levels. Apps like Moodpath, Daylio, or simple journaling can be integrated with cognitive testing to provide richer context.
Example:
- Track daily stress levels alongside cognitive test scores.
- Notice correlations such as lower memory scores on high-stress days.
Practical Tips for Effective Tracking
- Consistency: Test at the same time daily or weekly to reduce variability.
- Environment: Minimize distractions during testing.
- Duration: Keep sessions short to avoid fatigue effects.
- Record Context: Note sleep quality, diet, and mood to interpret results better.
Example Mind Map: Workflow for Tracking Cognitive Performance
Real-World Example: Self-Experiment with Meditation and Cognitive Testing
Objective: Assess if daily meditation improves attention and working memory.
Method:
- Baseline: Complete N-back and Stroop tests daily for 1 week.
- Intervention: Add 10 minutes of mindfulness meditation daily.
- Continue daily cognitive tests for 4 weeks.
- Track mood and sleep quality using a journaling app.
Outcome:
- Analyze trends in test scores.
- Correlate improvements with meditation adherence.
This approach provides actionable insights into how meditation influences cognitive performance in a personalized, evidence-based manner.
Tracking cognitive performance through apps and tests empowers biohackers to make data-driven decisions, optimize mental function, and enhance overall brain health. Combining objective measures with contextual lifestyle data creates a holistic picture that guides effective self-experimentation.
6.3 Biohacking Stress: Cortisol Monitoring and Adaptogens
Stress is a natural physiological response to challenges, but chronic stress can negatively impact health, cognition, and longevity. Biohacking stress involves understanding your body’s stress response, monitoring key biomarkers like cortisol, and using evidence-based interventions such as adaptogens to modulate this response.
Understanding Cortisol: The Stress Hormone
- Cortisol is produced by the adrenal glands in response to stress and follows a diurnal rhythm, peaking in the morning and declining throughout the day.
- It helps regulate metabolism, immune response, and energy availability.
- Chronic elevated cortisol can lead to fatigue, impaired cognition, weight gain, and immune dysfunction.
Mind Map: Cortisol and Stress Response
Monitoring Cortisol: Practical Approaches
-
Salivary Cortisol Testing
- Non-invasive, can be done at home.
- Collect samples at waking, 30 minutes after waking, afternoon, and evening to assess diurnal rhythm.
- Example: Using a kit like the “ZRT Labs Cortisol Test” to track cortisol awakening response (CAR).
-
Blood Cortisol Testing
- Provides snapshot but less useful for diurnal patterns.
- Often done in clinical settings.
-
Urinary Free Cortisol
- 24-hour urine collection to assess total cortisol output.
-
Wearable Stress Trackers
- Devices like WHOOP or Oura ring estimate stress via heart rate variability (HRV) as a proxy.
- Useful for correlating subjective stress with physiological data.
Mind Map: Cortisol Monitoring Methods
Adaptogens: Natural Allies Against Stress
Adaptogens are plant-derived compounds that help the body adapt to stress and normalize physiological functions. They have been studied for their potential to modulate cortisol levels and improve resilience.
Common adaptogens include:
-
Ashwagandha (Withania somnifera)
- Evidence: Several randomized controlled trials show Ashwagandha reduces serum cortisol and perceived stress.
- Example: Taking 300-600 mg standardized extract daily for 8 weeks.
-
Rhodiola Rosea
- Evidence: Shown to reduce fatigue and improve mental performance under stress.
- Example: 200-400 mg standardized extract before stressful tasks.
-
Holy Basil (Ocimum sanctum)
- Evidence: May lower cortisol and improve mood.
-
Panax Ginseng
- Evidence: Supports energy and cognitive function; mixed results on cortisol.
-
Licorice Root
- Caution: Can increase cortisol by inhibiting its breakdown; use carefully.
Mind Map: Adaptogens and Their Effects
Practical Example: Self-Experiment with Ashwagandha for Stress Reduction
Objective: To evaluate the effect of Ashwagandha supplementation on cortisol levels and perceived stress.
Protocol:
- Baseline: Measure salivary cortisol at 4 time points (awakening, +30 min, afternoon, evening) for 3 days.
- Subjective stress assessment using Perceived Stress Scale (PSS).
- Intervention: Take 600 mg Ashwagandha extract daily for 8 weeks.
- Post-intervention: Repeat cortisol measurements and PSS.
Expected Outcomes:
- Reduction in average cortisol levels, especially in afternoon/evening.
- Improved subjective stress scores.
Notes:
- Control confounding variables like sleep, caffeine, and exercise.
- Track side effects or changes in mood.
Additional Stress Biohacks Complementing Cortisol Modulation
- Mindfulness Meditation: Reduces cortisol and improves HRV.
- Regular Physical Activity: Moderate exercise lowers chronic cortisol.
- Sleep Optimization: Deep, consistent sleep supports HPA axis balance.
- Breathwork: Techniques like box breathing reduce acute stress.
Summary
Biohacking stress through cortisol monitoring and adaptogen use offers a measurable, evidence-based approach to improving resilience and well-being. By combining objective biomarker tracking with natural interventions and lifestyle modifications, you can create a personalized stress management protocol that supports longevity and mental performance.
6.4 Enhancing Creativity and Focus through Environmental Adjustments
Creating an environment that nurtures creativity and sharpens focus is a powerful biohack that can significantly improve mental performance. Environmental factors such as lighting, sound, workspace organization, and even scents can influence brain function, mood, and productivity. This section explores evidence-based strategies to optimize your surroundings for enhanced cognitive output, supported by practical examples and mind maps.
Key Environmental Factors Impacting Creativity and Focus
Lighting: Harnessing the Power of Light
- Natural Light: Exposure to natural daylight regulates circadian rhythms, boosting alertness and creativity. Position your desk near windows to maximize sunlight.
- Blue Light Exposure: Blue light during daytime enhances focus by stimulating the brain. However, excessive blue light in the evening can disrupt sleep.
- Adjustable Brightness: Use adjustable lighting to match task demands; brighter light for focused work, softer light for creative brainstorming.
Example: Sarah, a graphic designer, rearranged her workspace to face a window and installed a smart lamp with adjustable color temperature. She noticed improved mood and longer periods of sustained focus during her design sessions.
Sound: Crafting an Auditory Environment
- White Noise: Masks distracting background sounds, enhancing concentration.
- Nature Sounds: Sounds like rain or forest ambiance can reduce stress and stimulate creativity.
- Noise-Cancelling Headphones: Useful in noisy environments to create a personal quiet zone.
Example: Mark, a software developer, uses a white noise app during coding sprints and switches to gentle rain sounds when brainstorming new features. This auditory switching helps him maintain focus and sparks creative ideas.
Workspace Organization: Declutter and Personalize
- Decluttered Space: Reduces cognitive load and distractions.
- Ergonomic Setup: Supports physical comfort, reducing fatigue.
- Personalization: Adding meaningful objects or art can inspire creativity.
Example: Emily, a writer, keeps her desk minimalistic with only essential tools and a small plant. She also decorates with motivational quotes. This setup helps her enter a creative flow state more easily.
Air Quality and Temperature: Breathing and Comfort
- Ventilation: Fresh air improves cognitive function.
- Plants: Indoor plants can improve air quality and reduce stress.
- Humidity: Maintaining optimal humidity (40-60%) prevents discomfort.
- Temperature: Ideal cognitive performance occurs around 22-24°C (72-75°F).
Example: Jason installed an air purifier and added a few low-maintenance plants to his office. He also uses a fan to maintain a comfortable temperature. He reports feeling more alert and less fatigued during long work sessions.
Scents: Aromatherapy for Cognitive Enhancement
- Essential Oils: Peppermint and rosemary oils have been shown to improve alertness and memory.
- Personal Preferences: Choose scents that you find pleasant and non-overwhelming.
Example: Anna diffuses rosemary essential oil during her study sessions. She finds it helps her stay alert and retain information better.
Practical Integrated Example: Designing a Focus-Boosting Workspace
Scenario: John wants to enhance his home office to improve creativity and focus.
Steps:
- Moves desk near a window to maximize natural light.
- Installs a smart lamp with adjustable brightness and color temperature.
- Uses noise-cancelling headphones and plays nature sounds during brainstorming.
- Declutters desk, keeping only essentials and a small succulent plant.
- Adds an air purifier and maintains room temperature at 23°C.
- Diffuses peppermint essential oil during work hours.
Outcome: John experiences longer periods of deep work, reduced mental fatigue, and enhanced creative output.
Summary
Optimizing your environment is a low-cost, high-impact biohack to boost creativity and focus. By adjusting lighting, sound, workspace organization, air quality, temperature, and scents, you create a personalized sanctuary for cognitive excellence. Experiment with these factors systematically, track your productivity and mood, and iterate to find your ideal setup.
6.5 Example: Self-Experiment with Daily Meditation and Cognitive Testing
Objective
To evaluate the impact of a daily meditation practice on cognitive performance, stress levels, and overall mental clarity using simple, accessible cognitive tests and subjective assessments.
Step 1: Define Your Meditation Protocol
- Duration: 10 minutes per day
- Type: Mindfulness meditation focusing on breath awareness
- Time: Morning, immediately after waking up
Step 2: Select Cognitive Tests
- Working Memory: Digit Span Test (forward and backward)
- Attention: Stroop Color and Word Test
- Processing Speed: Symbol Digit Modalities Test (SDMT)
- Subjective Stress: Perceived Stress Scale (PSS) - short form
Step 3: Baseline Measurements
- Perform all cognitive tests and stress scale before starting the meditation practice.
- Record results carefully.
Step 4: Daily Practice and Data Collection
- Meditate daily for 10 minutes.
- At the end of each week, repeat cognitive tests and stress scale.
- Keep a journal to note subjective feelings of mental clarity, focus, and mood.
Step 5: Analyze Results
- Compare weekly cognitive test scores and stress levels to baseline.
- Look for trends in improvement or decline.
Mind Map: Daily Meditation and Cognitive Testing Self-Experiment
Example Data Table (Sample Results Over 4 Weeks)
| Week | Digit Span Forward | Digit Span Backward | Stroop Test (seconds) | SDMT (correct) | PSS Score | Notes on Mood and Focus |
|---|---|---|---|---|---|---|
| Baseline | 7 | 5 | 45 | 50 | 18 | Feeling distracted, moderate stress |
| 1 | 7 | 5 | 43 | 52 | 16 | Slightly more focused, less anxious |
| 2 | 8 | 6 | 40 | 55 | 14 | Noticeably calmer, improved clarity |
| 3 | 8 | 6 | 38 | 57 | 12 | Better concentration, less reactive |
| 4 | 9 | 7 | 35 | 60 | 10 | Clearer mind, more resilient to stress |
Practical Tips for Success
- Consistency is key: Meditate at the same time and place daily.
- Use apps: Consider apps like Insight Timer or Headspace for guided meditation.
- Keep testing simple: Use free online cognitive tests or printable versions.
- Journal daily: Record subjective experiences to complement quantitative data.
- Be patient: Cognitive changes may take weeks to manifest.
Interpretation and Next Steps
- If cognitive scores improve and stress decreases, consider extending meditation duration or trying different meditation styles.
- If no improvement, reassess meditation quality or test selection.
- Use data-driven insights to personalize your mental performance biohacks.
This example demonstrates how a structured, evidence-based approach to meditation and cognitive testing can empower biohackers to optimize mental performance through self-experimentation.
7. Hormonal and Metabolic Biohacking
7.1 Understanding Hormonal Cycles and Their Impact on Health
Hormones are chemical messengers that regulate numerous physiological processes in the body, including metabolism, mood, growth, reproduction, and energy levels. Understanding hormonal cycles is crucial for biohackers and longevity seekers because hormones fluctuate naturally throughout the day, month, and life stages, influencing overall health and performance.
What Are Hormonal Cycles?
Hormonal cycles refer to the periodic fluctuations in hormone levels that occur in predictable patterns. These cycles can be:
- Circadian (daily) cycles: Hormones like cortisol and melatonin follow a 24-hour rhythm.
- Menstrual cycles: In people with ovaries, estrogen and progesterone fluctuate over approximately 28 days.
- Seasonal cycles: Some hormones vary with seasons, affecting mood and metabolism.
Understanding these cycles helps optimize timing for activities like exercise, nutrition, sleep, and stress management.
Key Hormones and Their Cycles
Hormonal Cycles Mind Map
Impact of Hormonal Cycles on Health
- Energy and Mood: Cortisol peaks in the morning help wake you up, while melatonin rise at night promotes sleep. Disruptions can cause fatigue and mood disorders.
- Metabolism: Hormones regulate appetite, fat storage, and glucose metabolism. For example, insulin sensitivity varies throughout the day.
- Reproductive Health: Menstrual cycle hormones influence fertility, mood, and physical performance.
- Stress Response: Chronic cortisol elevation can impair immune function and increase inflammation.
Practical Biohacking Examples
-
Tracking Cortisol to Optimize Energy:
- Use saliva tests or wearable devices that estimate stress hormone levels.
- Example: Schedule demanding cognitive work in the morning when cortisol is naturally high.
-
Aligning Sleep with Melatonin Cycles:
- Dim lights and reduce blue light exposure 1-2 hours before bedtime to support melatonin production.
- Example: Use blue light blocking glasses after sunset.
-
Menstrual Cycle-Based Training:
- Adjust workout intensity based on cycle phase.
- Example: Focus on strength training during the follicular phase (when estrogen is rising) and prioritize recovery during the luteal phase.
-
Seasonal Light Exposure:
- Increase outdoor time in winter to boost serotonin and vitamin D.
- Example: Use light therapy lamps during darker months.
Example Case Study: Tracking Hormonal Cycles for Mood and Performance
Subject: Jane, a 32-year-old biohacker
Goal: Improve mood stability and workout performance by aligning activities with hormonal cycles.
Method:
- Tracked menstrual cycle phases using a period tracking app.
- Logged mood, energy, and workout intensity daily.
- Monitored sleep quality with a wearable.
Findings:
- Higher energy and motivation during follicular phase.
- Increased fatigue and irritability during luteal phase.
- Best workout performance mid-cycle (around ovulation).
Biohacks Implemented:
- Scheduled high-intensity workouts during follicular phase.
- Prioritized restorative yoga and meditation during luteal phase.
- Adjusted nutrition to include more magnesium and B vitamins pre-menstruation.
Outcome:
- Improved mood stability.
- Enhanced workout consistency.
- Better sleep quality during luteal phase.
Summary
Understanding hormonal cycles empowers biohackers to tailor lifestyle, nutrition, and training for optimal health and longevity. By tracking and aligning with these natural rhythms, you can enhance energy, mood, and physical performance while minimizing stress and fatigue.
7.2 Tracking Blood Glucose and Insulin Sensitivity at Home
Maintaining optimal blood glucose levels and insulin sensitivity is crucial for metabolic health, energy regulation, and longevity. Biohackers and longevity seekers can gain valuable insights by tracking these markers at home, enabling personalized adjustments to diet, exercise, and lifestyle.
Why Track Blood Glucose and Insulin Sensitivity?
- Blood Glucose: The amount of sugar circulating in your bloodstream, a key energy source.
- Insulin Sensitivity: How effectively your cells respond to insulin, influencing glucose uptake.
Poor regulation can lead to insulin resistance, type 2 diabetes, and metabolic syndrome.
Tools for Home Monitoring
- Continuous Glucose Monitors (CGMs): Devices like Abbott’s FreeStyle Libre or Dexcom provide real-time glucose data.
- Glucometers: Finger-prick devices for spot-checking blood glucose.
- Insulin Sensitivity Estimation: Indirectly assessed through glucose response curves, fasting insulin tests (via labs), or calculated indices like HOMA-IR.
Designing Your Self-Experiment
- Define Your Goal: e.g., improve fasting glucose or reduce glucose spikes post-meal.
- Select Monitoring Method: CGM for continuous data or glucometer for periodic checks.
- Choose Variables to Test: Meal composition, timing, exercise, sleep.
- Record Contextual Data: Food logs, activity, stress, sleep quality.
- Duration: Typically 1-2 weeks per intervention.
Practical Example: Tracking Post-Meal Glucose Response
Objective: Identify which meals cause the least glucose spike.
Protocol:
- Use a glucometer to measure blood glucose:
- Fasting (before breakfast)
- 30 minutes post-meal
- 60 minutes post-meal
- 120 minutes post-meal
- Log meal details (macronutrients, portion size).
Outcome: Determine meals with minimal glucose excursions to optimize diet.
Mind Map: Home Blood Glucose Tracking Workflow
Understanding Insulin Sensitivity at Home
Direct insulin measurement requires lab tests, but you can infer insulin sensitivity by observing how quickly your blood glucose returns to baseline after meals or glucose challenges.
Example:
- After a high-carb meal, a rapid return to baseline glucose within 2 hours suggests good insulin sensitivity.
- Prolonged elevated glucose indicates possible insulin resistance.
Mind Map: Inferring Insulin Sensitivity
Example Self-Experiment: Improving Insulin Sensitivity with Exercise
Step 1: Baseline glucose tracking for 3 days with usual activity.
Step 2: Introduce 30 minutes of moderate-intensity exercise after meals.
Step 3: Track glucose response post-meal for 7 days.
Expected Outcome: Reduced post-meal glucose spikes and faster return to baseline.
Data Logging: Use a spreadsheet or app to record glucose values, exercise timing, and meal details.
Tips for Accurate Tracking
- Use the same glucometer and test strips for consistency.
- Wash hands before testing to avoid contamination.
- Avoid testing immediately after exercise or stress without noting context.
- Combine glucose data with subjective feelings (energy, focus, mood).
Summary
Tracking blood glucose and insulin sensitivity at home empowers you to make data-driven lifestyle changes. By integrating simple tools, clear protocols, and mindful data analysis, you can optimize metabolic health and longevity.
Further Reading and Resources
- “The Glucose Revolution” by Jessie Inchauspé
- Abbott FreeStyle Libre official website
- Apps: MySugr, Levels (for CGM users)
Remember: Always consult healthcare professionals before making significant changes, especially if you have pre-existing conditions.
7.3 Biohacking Thyroid and Adrenal Health Through Lifestyle
Maintaining optimal thyroid and adrenal function is crucial for overall health, energy levels, metabolism, and stress resilience. These glands play pivotal roles in hormone regulation, and lifestyle choices can significantly influence their performance. This section explores practical, evidence-based lifestyle biohacks to support thyroid and adrenal health.
Understanding Thyroid and Adrenal Function
- Thyroid gland: Produces hormones (T3, T4) that regulate metabolism, energy production, and body temperature.
- Adrenal glands: Produce cortisol, adrenaline, and aldosterone, which manage stress response, blood pressure, and electrolyte balance.
Disruptions in these glands can lead to symptoms like fatigue, weight changes, mood swings, and impaired cognitive function.
Mind Map: Key Lifestyle Factors Affecting Thyroid and Adrenal Health
Nutrition Hacks
- Iodine: Essential for thyroid hormone synthesis. Include iodized salt, seaweed, and dairy in moderation.
- Selenium: Supports conversion of T4 to active T3 hormone. Sources include Brazil nuts, sunflower seeds, and fish.
- Balanced Macronutrients: Stable blood sugar supports adrenal health. Avoid excessive refined carbs.
- Goitrogens: Foods like raw cruciferous vegetables can interfere with thyroid function if consumed excessively. Cooking reduces this effect.
Example:
Self-Experiment: Track energy levels and mood over 4 weeks while incorporating selenium-rich foods daily and moderating raw cruciferous vegetable intake. Use a simple journal or app to note changes.
Stress Management Techniques
Chronic stress elevates cortisol, straining adrenal glands and disrupting thyroid function.
- Mindfulness Meditation: 10 minutes daily can reduce cortisol levels.
- Breathing Exercises: Techniques like box breathing or diaphragmatic breathing help activate the parasympathetic nervous system.
- Adequate Rest: Short breaks during work and avoiding burnout are essential.
Example:
Self-Experiment: Implement a daily 10-minute mindfulness practice and measure perceived stress levels weekly using validated scales (e.g., Perceived Stress Scale).
Sleep Hygiene
Poor sleep impairs hormone regulation.
- Maintain a consistent sleep schedule.
- Reduce blue light exposure 1-2 hours before bedtime using blue light blocking glasses or apps.
- Create a cool, dark, and quiet sleep environment.
Example:
Self-Experiment: Track sleep quality using wearable devices before and after introducing blue light reduction strategies over 2 weeks.
Physical Activity
- Moderate exercise supports adrenal function and thyroid hormone sensitivity.
- Avoid overtraining, which can elevate cortisol and impair recovery.
Example:
Self-Experiment: Monitor resting heart rate variability (HRV) and fatigue levels while adjusting workout intensity over 3 weeks.
Environmental Toxins
- Exposure to endocrine disruptors (e.g., BPA, phthalates) can impair thyroid and adrenal health.
- Use filtered water and avoid plastic containers for food storage.
Example:
Self-Experiment: Reduce plastic use and switch to glass containers for 1 month, noting any changes in energy or mood.
Supplementation
- Adaptogens: Ashwagandha and rhodiola have been shown to support adrenal resilience and may improve thyroid function.
- Vitamin D: Supports immune regulation and hormone balance.
- Magnesium: Important for stress response and energy metabolism.
Example:
Self-Experiment: Take ashwagandha (300-500 mg daily) for 6 weeks and track stress levels and sleep quality.
Summary Mind Map: Practical Steps for Thyroid & Adrenal Biohacking
By integrating these lifestyle biohacks with careful self-monitoring, you can optimize your thyroid and adrenal health effectively and safely. Remember to consult healthcare professionals when making significant changes or if symptoms persist.
7.4 Practical Use of Peptides and Hormone Modulators: What Science Says
Biohackers and longevity seekers are increasingly interested in peptides and hormone modulators as tools to optimize health, enhance recovery, and potentially extend lifespan. However, understanding their practical use requires a careful look at the current scientific evidence, safety profiles, and ethical considerations.
What Are Peptides and Hormone Modulators?
- Peptides: Short chains of amino acids that can act as signaling molecules in the body, influencing various physiological processes such as growth, metabolism, and immune function.
- Hormone Modulators: Substances that influence the production, release, or activity of hormones, including natural supplements, pharmaceuticals, or peptides.
Mind Map: Overview of Peptides and Hormone Modulators
Scientific Evidence and Practical Applications
Growth Hormone Secretagogues (GHS)
- Examples: GHRP-6, Ipamorelin
- Mechanism: Stimulate the pituitary gland to release growth hormone (GH), which influences muscle growth, fat metabolism, and recovery.
- Evidence: Clinical studies show increased GH levels and improved body composition in some populations, but long-term safety and efficacy data are limited.
- Example Use: A biohacker might self-experiment with Ipamorelin to improve recovery after workouts, tracking muscle soreness, sleep quality, and IGF-1 blood levels.
Metabolic Regulator Peptides
- Examples: MOTS-c, AOD9604
- Mechanism: MOTS-c influences mitochondrial function and metabolism; AOD9604 mimics a fragment of human growth hormone related to fat metabolism.
- Evidence: Early research suggests potential benefits for metabolic health and fat loss, but human trials are preliminary.
- Example Use: Self-experimenting with AOD9604 alongside a calorie-controlled diet to assess fat loss and energy levels, using body composition scans and metabolic rate measurements.
Recovery and Repair Peptides
- Examples: BPC-157, Thymosin Beta-4
- Mechanism: Promote tissue repair, reduce inflammation, and support healing.
- Evidence: Animal studies show promising results; human data is mostly anecdotal or from small case studies.
- Example Use: Using BPC-157 topically or via injection to accelerate recovery from a minor injury, tracking pain levels, mobility, and inflammation markers.
Hormone Modulators
-
Testosterone Modulators: DHEA supplementation may support testosterone levels in aging men; Clomiphene citrate can stimulate endogenous testosterone production.
-
Thyroid Modulators: Adjusting T3/T4 levels under medical supervision can improve metabolism and energy.
-
Cortisol Modulators: Adaptogens like Ashwagandha have evidence supporting cortisol reduction and stress resilience.
-
Example Use: A biohacker might trial Ashwagandha supplementation for 8 weeks, monitoring perceived stress, salivary cortisol, and sleep quality.
Mind Map: Self-Experimentation Framework for Peptides & Hormone Modulators
Best Practices for Safe and Effective Use
- Medical Supervision: Always consult healthcare professionals before starting peptides or hormone modulators.
- Source Verification: Use peptides from reputable suppliers to avoid contamination or incorrect dosing.
- Start Low, Go Slow: Begin with the lowest effective dose and increase cautiously.
- Track Everything: Maintain detailed logs of dosage, timing, subjective effects, and objective data.
- Regular Testing: Monitor hormone levels and biomarkers to avoid adverse effects.
- Ethical Considerations: Avoid substances banned in sports or with unclear legality.
Example: Self-Experiment with Ipamorelin for Recovery Enhancement
- Objective: Improve post-exercise muscle recovery and sleep quality.
- Protocol:
- Dose: 200 mcg Ipamorelin subcutaneously before bedtime.
- Duration: 4 weeks.
- Measurements:
- Sleep tracked via Oura Ring (sleep stages, HRV).
- Muscle soreness rated daily on a 1-10 scale.
- IGF-1 blood test pre- and post-experiment.
- Results:
- Subjective improvement in sleep depth and reduced soreness.
- IGF-1 increased within normal range.
- Adjustments:
- Reduced dose to 150 mcg after week 2 due to mild headaches.
Summary
Peptides and hormone modulators represent promising tools in the biohacker’s toolkit, but their use must be grounded in scientific evidence and safety. Thoughtful self-experimentation, combined with rigorous data collection and medical oversight, can help individuals explore these compounds’ potential benefits while minimizing risks.
7.5 Example: Self-Experiment on Time-Restricted Eating and Metabolic Markers
Time-Restricted Eating (TRE) is a popular biohacking strategy that involves limiting your daily eating window to a specific number of hours, typically between 6 to 12 hours, to improve metabolic health, support weight management, and enhance longevity. This self-experiment example will guide you through designing, implementing, and analyzing a TRE protocol with a focus on metabolic markers.
Step 1: Define Your Objective
- Improve insulin sensitivity
- Reduce fasting blood glucose levels
- Enhance fat metabolism
- Support weight management
Step 2: Design Your Experiment
- Eating Window: 8 hours (e.g., 12 PM to 8 PM)
- Fasting Window: 16 hours (e.g., 8 PM to 12 PM next day)
- Duration: 4 weeks
- Baseline Measurements: Collect fasting glucose, insulin, HbA1c, lipid profile, and body weight before starting
Step 3: Track Key Variables
- Daily: Eating window adherence, hunger levels, energy, mood
- Weekly: Body weight, waist circumference
- Pre- and Post-Experiment: Blood tests for metabolic markers
Step 4: Tools and Methods
- Continuous Glucose Monitor (CGM) or finger-prick glucose meter
- Food diary or app to track meal timing
- Wearable for activity and sleep tracking
- Blood test kits or lab visits for metabolic panels
Step 5: Implementation Tips
- Stay hydrated during fasting (water, black coffee, tea)
- Avoid calorie intake outside the eating window
- Maintain consistent meal quality and quantity
- Monitor subjective feelings of hunger and energy
Mind Map: Planning the TRE Self-Experiment
Step 6: Example Daily Log Entry
| Time | Activity | Notes |
|---|---|---|
| 7:00 AM | Wake up | Water and black coffee |
| 12:00 PM | First meal | Balanced meal with protein, fats, and carbs |
| 3:00 PM | Snack | Handful of nuts |
| 7:30 PM | Last meal | Light dinner, mostly vegetables |
| 8:00 PM | Start fasting | No calories, herbal tea only |
| 10:00 PM | Sleep | 7.5 hours |
Step 7: Analyzing Results
- Compare baseline and post-experiment metabolic markers
- Assess changes in fasting glucose and insulin levels
- Evaluate body weight and waist circumference trends
- Reflect on subjective energy and hunger patterns
Mind Map: Data Analysis and Interpretation
Example Outcome Summary
- Fasting glucose decreased from 95 mg/dL to 88 mg/dL
- Insulin levels improved, indicating better sensitivity
- Weight reduced by 3 pounds
- Subjective reports of increased daytime energy and reduced late-night cravings
Best Practices and Lessons Learned
- Consistency in eating window is key to reliable results
- Hydration and sleep quality significantly impact metabolic outcomes
- Tracking both objective and subjective data provides a holistic view
- Adjust eating window length based on personal tolerance and goals
This example illustrates how a structured, evidence-based self-experiment on time-restricted eating can empower you to optimize metabolic health through actionable data and mindful adjustments.
8. Microbiome and Gut Health Optimization
8.1 The Role of Gut Microbiota in Overall Health
The gut microbiota refers to the trillions of microorganisms, including bacteria, viruses, fungi, and other microbes, that reside primarily in the large intestine. These microbes form a complex ecosystem that plays a crucial role in maintaining overall health. Understanding the gut microbiota’s functions and influence can empower biohackers and longevity seekers to optimize their gut health through evidence-based self-experimentation.
Why Gut Microbiota Matters
- Digestion & Nutrient Absorption: Gut bacteria help break down complex carbohydrates, fibers, and proteins that human enzymes cannot digest alone.
- Immune System Regulation: Approximately 70% of the immune system is located in the gut. Microbes help train and modulate immune responses.
- Metabolic Health: Gut microbes influence metabolism, energy balance, and fat storage.
- Neurotransmitter Production: Some gut bacteria produce neurotransmitters like serotonin and GABA, affecting mood and cognition.
- Barrier Function: The microbiota supports the intestinal lining, preventing harmful pathogens and toxins from entering the bloodstream.
Mind Map: Key Functions of Gut Microbiota
Gut Microbiota Diversity and Health
A diverse gut microbiota is generally associated with better health outcomes. Low diversity has been linked to conditions such as obesity, inflammatory bowel disease, allergies, and even mental health disorders.
Example:
- A study found that individuals with higher microbial diversity had improved insulin sensitivity and lower inflammation markers.
Biohacking Tip:
- Track dietary fiber intake and diversity of plant-based foods to support microbiome diversity.
Dysbiosis: When Gut Microbiota Is Out of Balance
Dysbiosis refers to an imbalance in the gut microbial community, often characterized by a loss of beneficial bacteria and overgrowth of harmful species.
Common causes:
- Poor diet (high sugar, low fiber)
- Antibiotic use
- Chronic stress
- Infections
Health consequences:
- Increased gut permeability (“leaky gut”)
- Systemic inflammation
- Digestive issues (bloating, diarrhea, constipation)
Example:
- Self-experimentation with elimination diets can help identify food sensitivities linked to dysbiosis.
Mind Map: Factors Influencing Gut Microbiota
Practical Example: Tracking Gut Health Through Self-Experimentation
Objective: Improve gut microbiota diversity and reduce digestive discomfort.
Protocol:
- Baseline tracking of digestive symptoms (bloating, stool consistency) using a daily journal or app.
- Incorporate a variety of high-fiber plant foods (e.g., legumes, whole grains, vegetables).
- Add fermented foods such as yogurt, kefir, sauerkraut.
- Avoid processed sugars and artificial sweeteners.
- Monitor changes over 4 weeks.
Expected outcomes:
- Improved stool regularity
- Reduced bloating
- Enhanced energy levels
Data Collection:
- Use a simple symptom tracker app (e.g., Cara Care, MySymptoms).
- Optional: At-home gut microbiome test kits to measure diversity changes.
Summary
The gut microbiota is a foundational element of overall health, influencing digestion, immunity, metabolism, and even mental well-being. Through mindful lifestyle choices and evidence-based self-experimentation, individuals can optimize their gut microbiome to support longevity and vitality.
8.2 Testing and Interpreting Microbiome Data
Understanding and optimizing your gut microbiome is a cornerstone of practical biohacking. This section will guide you through the process of testing your microbiome and interpreting the results with actionable insights.
What is Microbiome Testing?
Microbiome testing involves analyzing the community of microorganisms living in your gut, primarily bacteria, but also viruses, fungi, and other microbes. These microbes influence digestion, immunity, mental health, and overall well-being.
Common Methods of Microbiome Testing
- 16S rRNA Gene Sequencing: Identifies bacterial species by sequencing a specific gene common to bacteria.
- Metagenomic Sequencing: Provides a more comprehensive profile including bacteria, viruses, fungi, and functional genes.
- Metabolomic Analysis: Measures metabolites produced by gut microbes.
How to Collect Samples
- Most tests require a stool sample collected at home using kits provided by companies.
- Follow instructions carefully to avoid contamination.
- Ship samples promptly to ensure data integrity.
Mind Map: Microbiome Testing Overview
Interpreting Microbiome Data
Microbiome reports typically include:
- Alpha Diversity: Measures diversity within your gut; higher diversity is generally linked to better health.
- Beta Diversity: Compares your microbiome to others or to healthy reference groups.
- Relative Abundance: Percentage of different bacterial species or genera.
- Functional Potential: What metabolic pathways your microbiome can perform.
Key Metrics Explained
| Metric | What It Means | Practical Insight |
|---|---|---|
| Alpha Diversity | Variety of species in your gut | Aim to maintain or increase diversity |
| Firmicutes/Bacteroidetes Ratio | Balance of two major phyla | Imbalance may relate to obesity or inflammation |
| Presence of Beneficial Bacteria | e.g., Lactobacillus, Bifidobacterium | Supports digestion and immunity |
| Presence of Pathogenic Bacteria | e.g., Clostridium difficile | May indicate dysbiosis or infection |
Mind Map: Interpreting Microbiome Data
Example: Interpreting a Sample Microbiome Report
Scenario: Jane receives a microbiome report showing:
- Alpha diversity score below average
- Elevated Firmicutes/Bacteroidetes ratio
- Low abundance of Bifidobacterium
Interpretation:
- Low diversity suggests a less resilient gut ecosystem.
- High Firmicutes/Bacteroidetes ratio may be linked to weight gain or inflammation.
- Low Bifidobacterium could mean impaired digestion or immune support.
Actionable Biohacks:
- Increase dietary fiber intake (prebiotics) to promote diversity.
- Incorporate fermented foods (yogurt, kimchi) to boost beneficial bacteria.
- Avoid excessive processed foods and sugar.
Practical Tips for Self-Experimentation
- Baseline Testing: Start with an initial test to understand your microbiome.
- Track Changes: Retest every 3-6 months after dietary or lifestyle changes.
- Log Symptoms: Keep a journal of digestion, mood, and energy levels to correlate with microbiome shifts.
- Use Multiple Data Points: Combine microbiome data with blood markers and subjective well-being.
Mind Map: Self-Experimentation with Microbiome Data
Example: Self-Experiment with Probiotic Supplementation
Objective: Improve gut diversity and reduce bloating.
Protocol:
- Take a multi-strain probiotic daily for 8 weeks.
- Increase intake of prebiotic-rich foods like garlic and asparagus.
- Avoid antibiotics and unnecessary medications.
Data Collection:
- Stool microbiome test before and after intervention.
- Daily symptom tracking (bloating, bowel movements).
Outcome:
- Post-test shows increased alpha diversity.
- Increased abundance of Lactobacillus and Bifidobacterium.
- Subjective reduction in bloating and improved digestion.
Summary
Testing and interpreting microbiome data empowers you to make informed, evidence-based adjustments to your diet and lifestyle. By combining quantitative data with subjective experience, you can optimize your gut health and overall well-being through practical biohacking.
8.3 Dietary and Probiotic Interventions for Gut Balance
Maintaining a balanced gut microbiome is essential for overall health, immunity, digestion, and even mental well-being. Dietary choices and probiotic supplementation are two of the most effective biohacking strategies to optimize gut health. This section explores evidence-based dietary interventions, probiotic use, and practical examples to help you self-experiment with gut balance.
Understanding Gut Balance
The gut microbiome consists of trillions of microorganisms, including bacteria, fungi, and viruses. A balanced microbiome features a diverse and stable community that supports digestion, nutrient absorption, and immune function. Dysbiosis, or microbial imbalance, can lead to digestive issues, inflammation, and chronic diseases.
Dietary Interventions to Promote Gut Health
Diet is the primary modulator of the gut microbiome. Here are key dietary strategies:
- Increase Dietary Fiber: Fibers, especially prebiotic fibers, feed beneficial bacteria.
- Include Fermented Foods: Natural probiotics found in fermented foods help introduce beneficial microbes.
- Limit Processed Foods and Added Sugars: These can promote growth of harmful bacteria.
- Diversify Plant Intake: Different plants provide varied fibers and polyphenols that support microbial diversity.
Mind Map: Dietary Interventions for Gut Balance
Probiotic Interventions
Probiotics are live microorganisms that, when consumed in adequate amounts, confer health benefits. They can help restore microbial balance, especially after antibiotic use or digestive disturbances.
- Common Probiotic Strains: Lactobacillus, Bifidobacterium, Saccharomyces boulardii
- Forms: Capsules, fermented foods, powders
- Considerations: Strain specificity, dose, and individual response
Mind Map: Probiotic Supplementation
Practical Examples and Self-Experimentation
Example 1: Introducing Fermented Foods
- Goal: Increase gut microbial diversity and improve digestion.
- Protocol: Add 1 serving of sauerkraut or kimchi daily for 4 weeks.
- Tracking: Monitor digestive comfort, stool consistency, and energy levels.
- Expected Outcome: Improved digestion, reduced bloating.
Example 2: Prebiotic Fiber Increase
- Goal: Promote growth of beneficial bacteria.
- Protocol: Gradually increase intake of inulin-rich foods (e.g., chicory root, garlic) over 3 weeks.
- Tracking: Use a gut symptom diary and note any gas or discomfort.
- Expected Outcome: Enhanced bowel regularity and microbial diversity.
Example 3: Probiotic Supplement Trial
- Goal: Restore gut balance after antibiotic treatment.
- Protocol: Take a multi-strain probiotic supplement (10 billion CFU) daily for 30 days.
- Tracking: Record digestive symptoms, mood, and energy.
- Expected Outcome: Reduced antibiotic-associated diarrhea, improved gut comfort.
Tips for Successful Dietary and Probiotic Interventions
- Introduce changes gradually to minimize digestive discomfort.
- Keep a detailed log of foods, supplements, and symptoms.
- Combine dietary fiber with probiotics for synergistic effects.
- Consult with healthcare professionals if you have underlying conditions.
By integrating these dietary and probiotic strategies into your biohacking routine, you can systematically optimize your gut microbiome and overall health through evidence-based self-experimentation.
8.4 Tracking Digestive Health and Inflammation Biomarkers
Maintaining optimal digestive health is a cornerstone of effective biohacking, as the gut plays a critical role in nutrient absorption, immune function, and overall well-being. Tracking digestive health and inflammation biomarkers allows you to gain objective insights into your gut status, identify potential issues early, and tailor interventions for improved longevity and vitality.
Why Track Digestive Health and Inflammation?
- Detect imbalances in gut microbiota
- Identify food intolerances or sensitivities
- Monitor inflammation that could lead to chronic diseases
- Optimize nutrient absorption and metabolism
Key Biomarkers to Monitor
| Biomarker | Description | How to Measure | Practical Example |
|---|---|---|---|
| C-Reactive Protein (CRP) | General marker of systemic inflammation | Blood test (lab or home kits) | Elevated CRP may indicate gut inflammation |
| Fecal Calprotectin | Marker of intestinal inflammation | Stool test (lab) | High levels suggest inflammatory bowel disease |
| Zonulin | Marker of intestinal permeability (“leaky gut”) | Stool or blood test | Increased zonulin may indicate gut barrier dysfunction |
| Gut Microbiome Diversity | Variety and balance of gut bacteria | Stool microbiome sequencing | Low diversity linked to poor gut health |
| Short-Chain Fatty Acids | Metabolites produced by gut bacteria | Stool test | Levels reflect gut bacterial activity |
| Lactulose/Mannitol Test | Measures intestinal permeability | Urine test after sugar ingestion | High ratio indicates increased gut permeability |
Mind Map: Digestive Health Biomarkers
Tools and Methods for Tracking
- Home Test Kits: Convenient options like Everlywell, Viome, or Thryve provide stool or blood testing with easy-to-understand reports.
- Lab Testing: More comprehensive and accurate, ordered through healthcare providers or direct-to-consumer labs.
- Symptom Journaling: Track digestive symptoms (bloating, gas, stool consistency) alongside biomarker data for correlation.
- Wearables & Apps: Some apps allow you to log food intake, symptoms, and test results for integrated analysis.
Example: Self-Experiment Tracking Digestive Health
Objective: Identify if fermented foods improve gut inflammation and symptom severity.
Protocol:
- Baseline stool test to measure calprotectin and microbiome diversity.
- Track daily digestive symptoms (bloating, stool consistency) using a symptom journal app.
- Introduce fermented foods (e.g., kimchi, kefir) daily for 4 weeks.
- Repeat stool test at 4 weeks.
- Compare biomarker levels and symptom logs.
Outcome:
- Reduction in fecal calprotectin indicating decreased inflammation.
- Increased microbiome diversity.
- Subjective improvement in bloating and stool regularity.
Mind Map: Digestive Health Self-Experiment Example
Best Practices for Tracking
- Consistency: Collect samples and log symptoms at the same time of day and under similar conditions.
- Control Variables: Avoid introducing multiple changes simultaneously to isolate effects.
- Data Integration: Combine biomarker data with subjective symptom tracking for holistic insights.
- Consult Professionals: Share results with healthcare providers when interpreting complex data or making clinical decisions.
By systematically tracking digestive health and inflammation biomarkers, you can make informed, evidence-based adjustments to your diet, lifestyle, and supplementation strategies—empowering you to optimize gut health and overall longevity.
8.5 Example: Self-Experiment with Fermented Foods and Symptom Tracking
Objective:
To evaluate the effects of incorporating fermented foods into the daily diet on gut health, digestion, and overall well-being by tracking symptoms and relevant biomarkers.
Step 1: Define Your Hypothesis and Goals
- Hypothesis: Adding fermented foods daily will improve digestion, reduce bloating, and enhance mood.
- Goals:
- Track digestive symptoms (bloating, gas, stool consistency)
- Monitor mood and energy levels
- Observe any changes in skin condition or inflammation
Step 2: Select Fermented Foods to Test
- Yogurt (with live cultures)
- Sauerkraut
- Kimchi
- Kefir
- Kombucha
Choose 1-2 fermented foods to introduce initially to isolate effects.
Step 3: Establish Baseline Data
Before starting the experiment, track symptoms for 7 days without fermented foods.
Symptom Tracking Mind Map:
Step 4: Experiment Protocol
- Duration: 21 days
- Daily intake: 1 serving of chosen fermented food
- Record symptoms daily using a journal or app
- Optional: Use a simple spreadsheet or app like ‘Cara’ or ‘MySymptoms’ for symptom logging
Step 5: Symptom Tracking Template (Example)
| Day | Fermented Food | Bloating (0-5) | Gas (0-5) | Stool Consistency (1-7) | Mood (1-5) | Energy (1-5) | Notes |
|---|---|---|---|---|---|---|---|
| 1 | Sauerkraut | 3 | 2 | 4 | 3 | 3 | Slight fullness after meal |
| 2 | Sauerkraut | 2 | 1 | 4 | 4 | 4 | Felt more energetic |
Step 6: Analyze Results
- Compare symptom scores before and after fermented food introduction.
- Look for trends such as reduced bloating or improved mood.
- Use simple visualization tools (graphs or charts) to see symptom changes over time.
Example Mind Map for Data Analysis:
Step 7: Adjust and Iterate
- If symptoms improve, consider maintaining or increasing fermented food intake.
- If adverse symptoms appear (e.g., excessive gas or discomfort), reduce intake or try different fermented foods.
- Optionally, incorporate gut microbiome testing before and after the experiment for deeper insights.
Real-Life Example:
Case: Jane, a 35-year-old biohacker, experienced frequent bloating and irregular bowel movements. She introduced 100g of homemade sauerkraut daily for 3 weeks.
- Week 1: Mild increase in gas but improved stool consistency.
- Week 2: Bloating reduced from 4/5 to 2/5; mood improved.
- Week 3: Sustained improvements; energy levels increased.
Jane tracked symptoms using a Google Sheet and visualized trends with simple line charts.
Tips for Success:
- Start with small servings to allow gut adaptation.
- Be consistent with timing and quantity.
- Use objective symptom scales for better data quality.
- Combine symptom tracking with lifestyle factors (stress, sleep) for holistic understanding.
Summary Mind Map of the Experiment Workflow:
This structured approach ensures your biohacking experiment with fermented foods is evidence-based, measurable, and tailored to your unique physiology.
9. Environmental and Lifestyle Biohacks
9.1 Reducing Toxic Exposure: Air, Water, and Household Chemicals
Toxic exposure from everyday environments can silently undermine your health and longevity goals. In this section, we explore practical, evidence-based strategies to reduce your exposure to harmful substances in air, water, and household products. These approaches are designed for easy self-implementation and include simple monitoring techniques and actionable biohacks.
Understanding Toxic Exposure
Toxicants are substances that can cause adverse health effects. Common sources include:
- Air pollutants: VOCs (volatile organic compounds), particulate matter, mold spores, carbon monoxide
- Water contaminants: Heavy metals (lead, arsenic), chlorine, pesticides, microplastics
- Household chemicals: Cleaning agents, flame retardants, phthalates, parabens
Reducing exposure involves both identifying sources and implementing mitigation strategies.
Mind Map: Sources of Toxic Exposure
Practical Biohacks to Reduce Airborne Toxicants
-
Improve Indoor Air Quality
- Use HEPA air purifiers to reduce particulate matter and allergens.
- Increase ventilation by opening windows or using exhaust fans.
- Choose low-VOC or VOC-free paints and furniture.
- Regularly clean and replace HVAC filters.
-
Control Mold and Moisture
- Use dehumidifiers in damp areas.
- Fix leaks promptly.
- Use mold test kits to detect hidden mold.
-
Monitor Carbon Monoxide
- Install carbon monoxide detectors near sleeping areas.
Example: Sarah noticed frequent headaches and fatigue. She installed a HEPA air purifier and opened windows daily for ventilation. After two weeks, her symptoms improved, correlating with better air quality.
Mind Map: Air Quality Improvement Strategies
Practical Biohacks to Improve Water Quality
-
Test Your Water
- Use home water testing kits to detect heavy metals, chlorine, and other contaminants.
-
Use Appropriate Filtration Systems
- Activated carbon filters reduce chlorine and organic chemicals.
- Reverse osmosis systems remove heavy metals and microplastics.
- UV filters can eliminate microbial contaminants.
-
Avoid Bottled Water Pitfalls
- Choose BPA-free bottles.
- Limit plastic use to reduce microplastic ingestion.
Example: John tested his tap water and found elevated lead levels. He installed a reverse osmosis filter and retested after one month, confirming lead levels dropped below harmful thresholds.
Mind Map: Water Quality Improvement
Practical Biohacks to Minimize Household Chemical Exposure
-
Choose Safer Cleaning Products
- Opt for fragrance-free, non-toxic, and biodegradable cleaners.
- DIY natural cleaners using vinegar, baking soda, and lemon.
-
Personal Care Product Awareness
- Read labels to avoid parabens, phthalates, and synthetic fragrances.
- Use certified organic or natural personal care items.
-
Reduce Flame Retardant Exposure
- Avoid furniture with chemical flame retardants.
- Regularly dust and vacuum with HEPA filters to reduce dust-bound chemicals.
Example: Emma switched to homemade vinegar-based cleaners and organic shampoo. Over several weeks, she noticed fewer skin irritations and improved respiratory comfort.
Mind Map: Household Chemical Reduction
Monitoring and Tracking Your Progress
- Keep a journal logging symptoms, changes in environment, and interventions.
- Use apps or spreadsheets to track air quality indices and water test results.
- Periodically retest water and air quality to measure improvements.
Summary
Reducing toxic exposure is a foundational biohack that supports overall health and longevity. By understanding sources and applying practical strategies—improving air and water quality, choosing safer household products—you empower yourself to create a cleaner, safer living environment.
Remember, start small with manageable changes, track your progress, and adjust based on your findings for sustainable impact.
9.2 Optimizing Circadian Rhythms through Light and Temperature
Circadian rhythms are the natural, internal processes that regulate the sleep-wake cycle and repeat roughly every 24 hours. These rhythms are heavily influenced by environmental cues, primarily light and temperature. Optimizing these factors can significantly improve sleep quality, mood, energy levels, and overall health.
Understanding Circadian Rhythms
- The circadian system is governed by the suprachiasmatic nucleus (SCN) in the brain.
- Light is the most powerful cue (zeitgeber) for synchronizing circadian rhythms.
- Temperature fluctuations also play a role in signaling time of day to the body.
Mind Map: Key Factors Influencing Circadian Rhythms
Light and Circadian Rhythms
Morning Light Exposure
- Exposure to natural sunlight within 30-60 minutes of waking helps reset the circadian clock.
- Example: Spending 15-30 minutes outside or near a bright window boosts alertness and melatonin regulation.
Evening Light Management
- Blue light (wavelengths ~460-480 nm) from screens suppresses melatonin production, delaying sleep onset.
- Best practice: Use blue light blocking glasses or apps that reduce blue light emission after sunset.
Artificial Light Use
- Bright, cool-white lights in the morning and daytime support alertness.
- Dim, warm lights in the evening promote relaxation and prepare the body for sleep.
Mind Map: Light Exposure Strategies
Temperature and Circadian Rhythms
- Core body temperature naturally drops in the evening to facilitate sleep onset.
- Cooler ambient temperatures (~60-67°F or 15-19°C) are optimal for sleep.
- Warm baths or showers 1-2 hours before bedtime can promote this temperature drop by increasing peripheral blood flow.
Mind Map: Temperature Optimization for Sleep
Practical Examples
Example 1: Morning Sunlight Exposure
- Sarah, a biohacker, starts her day by spending 20 minutes on her balcony with her morning coffee, soaking in natural sunlight. She noticed improved mood and faster wakefulness within a week.
Example 2: Blue Light Blocking Glasses
- John uses blue light blocking glasses starting at 7 PM while working on his computer. He also dims the lights in his living room. After two weeks, he reports falling asleep 30 minutes earlier and feeling more rested.
Example 3: Temperature Regulation for Better Sleep
- Emily takes a warm bath 90 minutes before bedtime and lowers her bedroom thermostat to 65°F. She tracks her sleep with a wearable and sees a 15% increase in deep sleep duration.
Best Practices Summary
- Get at least 15-30 minutes of natural light exposure soon after waking.
- Minimize blue light exposure 2-3 hours before bedtime using glasses or screen filters.
- Use bright, cool lighting during the day and dim, warm lighting in the evening.
- Maintain a cool sleeping environment, ideally between 60-67°F (15-19°C).
- Consider warm baths or showers before bed to facilitate core temperature drop.
Optimizing circadian rhythms through light and temperature is a practical, evidence-based biohack that can be easily integrated into daily life to enhance sleep quality and overall well-being.
9.3 Enhancing Recovery with Sleep Environment and Noise Control
Optimizing your sleep environment and managing noise levels are critical components of effective biohacking for recovery. Quality sleep supports physical repair, cognitive function, hormonal balance, and overall longevity. This section explores evidence-based strategies to create an ideal sleep setting and control noise disruptions, with practical examples and mind maps to guide implementation.
Key Factors in Sleep Environment Optimization
- Temperature: Ideal bedroom temperature ranges between 60-67°F (15-19°C) to promote deep sleep.
- Lighting: Minimizing exposure to blue and bright light in the evening helps regulate melatonin production.
- Bedding: Comfortable mattresses and pillows tailored to your sleep style reduce discomfort and awakenings.
- Air Quality: Clean, well-ventilated air improves oxygen intake and reduces allergens.
- Noise: Controlling ambient noise or using masking techniques prevents sleep fragmentation.
Mind Map: Sleep Environment Components
Noise Control Strategies
-
Soundproofing the Bedroom:
- Add heavy curtains or acoustic panels.
- Use rugs and soft furnishings to absorb sound.
-
White Noise and Sound Masking:
- White noise machines create consistent ambient sound.
- Nature sounds (rain, ocean waves) can be soothing.
-
Earplugs:
- Foam or silicone earplugs reduce disruptive noises.
- Choose comfortable, hypoallergenic options for nightly use.
-
Behavioral Adjustments:
- Establish quiet hours in shared living spaces.
- Limit use of noisy appliances before bedtime.
Practical Example: Self-Experiment on Noise Control and Sleep Quality
Objective: Improve sleep efficiency by reducing nighttime noise disruptions.
Protocol:
- Week 1: Baseline sleep tracking without interventions.
- Week 2: Use foam earplugs every night.
- Week 3: Add white noise machine playing nature sounds.
- Week 4: Combine earplugs and white noise.
Measurements:
- Sleep duration and efficiency via wearable tracker.
- Subjective sleep quality via morning journal.
- Number of awakenings recorded.
Results:
- Week 1: Average sleep efficiency 78%, 3 awakenings/night.
- Week 2: Efficiency improved to 83%, awakenings reduced to 2.
- Week 3: Efficiency 85%, awakenings 1.5.
- Week 4: Efficiency peaked at 89%, awakenings 1.
Conclusion: Combining earplugs with white noise significantly enhanced sleep continuity and subjective restfulness.
Mind Map: Noise Control Techniques
Additional Tips for Enhancing Recovery via Sleep Environment
- Consistent Sleep Schedule: Align your environment with regular bed and wake times.
- Limit Electronic Use: Avoid screens 1-2 hours before bed to reduce blue light exposure.
- Aromatherapy: Use calming scents like lavender to promote relaxation.
- Declutter Bedroom: A tidy space reduces stress and mental clutter.
By systematically optimizing your sleep environment and controlling noise, you can biohack your recovery process effectively. Self-experimentation with these variables, combined with objective tracking, empowers you to tailor your sleep setting for maximal restorative benefit.
9.4 Practical Use of Wearable Tech for Environmental Monitoring
Environmental factors such as air quality, temperature, humidity, and noise levels significantly impact our health, cognitive function, and overall well-being. Wearable technology has evolved beyond fitness tracking to include sophisticated environmental sensors that empower biohackers to monitor and optimize their surroundings in real-time.
Why Monitor Your Environment?
- Air Quality: Poor air quality can cause inflammation, allergies, and reduce cognitive performance.
- Temperature & Humidity: Extremes can affect sleep quality, metabolic rate, and immune function.
- Noise Levels: Chronic exposure to noise pollution increases stress and disrupts focus.
Types of Wearable Environmental Sensors
| Sensor Type | What It Measures | Example Devices |
|---|---|---|
| Air Quality | VOCs, PM2.5, CO2, CO | Atmotube Pro, Flow by Plume Labs |
| Temperature | Ambient temperature | Garmin, Fitbit (some models) |
| Humidity | Relative humidity | Some multi-sensor wearables |
| Noise | Decibel levels | Eargo, QuietOn, specialized apps |
Integrating Wearables into Your Biohacking Practice
- Baseline Assessment: Use wearables to record environmental data throughout your day to identify exposure hotspots.
- Correlate with Biometrics: Track how environmental changes affect heart rate variability (HRV), sleep quality, or mood.
- Implement Interventions: Adjust your environment based on data (e.g., use air purifiers, noise-cancelling devices).
- Continuous Monitoring: Use wearables to maintain optimal environmental conditions and detect changes early.
Mind Map: Wearable Tech for Environmental Monitoring
Example 1: Using Atmotube Pro for Air Quality Monitoring
Scenario: Jane, a biohacker, notices frequent headaches and brain fog while working from home.
Approach:
- She wears the Atmotube Pro, which tracks VOCs, PM2.5, and CO2 levels in her workspace.
- Data shows elevated VOCs during afternoons, likely from cleaning products and poor ventilation.
- Jane opens windows and adds a HEPA air purifier.
- Over two weeks, she tracks a decrease in VOC levels and reports improved focus and fewer headaches.
Key Takeaway: Real-time environmental data helped Jane identify and mitigate a hidden health hazard.
Mind Map: Correlating Environmental Data with Health Metrics
Example 2: Noise Monitoring to Enhance Focus
Scenario: Mark experiences difficulty concentrating in his open-plan office.
Approach:
- He uses a noise-monitoring wearable app that tracks decibel levels throughout the day.
- The data reveals frequent noise spikes above 70 dB during peak hours.
- Mark uses noise-cancelling headphones and schedules focused work during quieter periods.
- He notices improved productivity and reduced stress.
Key Takeaway: Monitoring noise exposure can guide practical interventions to improve mental performance.
Best Practices for Using Wearable Environmental Tech
- Choose Devices with Validated Sensors: Accuracy is critical for reliable data.
- Combine Environmental and Physiological Data: Contextualize environmental readings with your body’s responses.
- Set Threshold Alerts: Use apps or devices that notify you when environmental factors exceed healthy limits.
- Document Interventions and Outcomes: Keep a journal or digital log to track cause-effect relationships.
- Regularly Calibrate and Maintain Devices: Ensure sensors remain accurate over time.
Summary
Wearable technology for environmental monitoring offers biohackers a powerful tool to understand and optimize the invisible factors affecting health. By integrating environmental data with physiological metrics, you can make informed decisions to create healthier living and working spaces, ultimately enhancing longevity and well-being.
9.5 Example: Self-Experiment on Blue Light Blocking Glasses and Daytime Alertness
Objective
To evaluate the impact of wearing blue light blocking glasses during daytime screen exposure on subjective alertness, focus, and overall cognitive performance.
Background
Blue light emitted from screens (computers, smartphones, tablets) can disrupt circadian rhythms and potentially cause eye strain and fatigue. While blue light blocking glasses are commonly recommended for evening use to improve sleep, their effects during daytime use on alertness and cognitive function are less explored.
This experiment aims to test whether wearing blue light blocking glasses during daytime screen exposure can improve alertness and reduce mental fatigue.
Hypothesis
Wearing blue light blocking glasses during daytime screen time will increase subjective alertness and improve performance on cognitive tasks compared to no glasses.
Materials & Tools
- Blue light blocking glasses (ensure lenses block 90%+ blue light)
- Cognitive performance app (e.g., BrainHQ, Lumosity, or simple reaction time tests)
- Subjective alertness scale (e.g., Karolinska Sleepiness Scale or a 1-10 self-rating scale)
- Screen time tracking app
- Journal or digital note-taking app
Experimental Design
| Variable | Description |
|---|---|
| Independent Variable | Wearing blue light blocking glasses vs. no glasses |
| Dependent Variables | Subjective alertness, cognitive test scores, self-reported eye strain |
| Duration | 14 days (7 days with glasses, 7 days without) |
| Control | Same work environment, similar screen time, consistent sleep schedule |
Procedure
- Baseline Week (No Glasses): For 7 days, record daily subjective alertness scores 3 times a day (morning, midday, late afternoon), complete a cognitive test once daily, and note any eye strain symptoms.
- Intervention Week (Glasses): For the next 7 days, wear blue light blocking glasses during all screen time in the daytime. Repeat the same measurements.
- Data Logging: Use a spreadsheet or app to log all data points.
Mind Map: Experiment Workflow
Data Collection Example
| Day | Glasses Worn? | Morning Alertness (1-10) | Midday Alertness (1-10) | Afternoon Alertness (1-10) | Cognitive Test Score (%) | Eye Strain (Yes/No) |
|---|---|---|---|---|---|---|
| 1 | No | 6 | 5 | 4 | 78 | Yes |
| 2 | No | 7 | 6 | 5 | 80 | Yes |
| … | … | … | … | … | … | … |
| 8 | Yes | 7 | 7 | 6 | 85 | No |
| 9 | Yes | 8 | 7 | 7 | 88 | No |
Analysis and Interpretation
- Calculate average alertness scores for each time point during baseline and intervention weeks.
- Compare cognitive test scores between weeks.
- Note changes in eye strain frequency.
If alertness and cognitive scores improve and eye strain decreases during the glasses week, this supports the hypothesis.
Practical Tips
- Maintain consistent sleep and caffeine intake throughout the experiment.
- Avoid other changes in screen time habits.
- Use the same device(s) for cognitive tests.
Additional Mind Map: Factors Influencing Results
Summary
This self-experiment provides a practical, evidence-based approach to test the effectiveness of blue light blocking glasses during the day. By integrating subjective and objective measures, biohackers can make informed decisions about incorporating this simple intervention into their routines to optimize alertness and cognitive function.
Further Exploration
- Experiment with different types of blue light filters (software vs. glasses).
- Test effects on evening screen use and subsequent sleep quality.
- Combine with other environmental biohacks like ambient lighting adjustments.
References
- Harvard Health Publishing: Blue light has a dark side
- Journal of Adolescent Health: Effects of blue light on sleep and alertness
- Peer-reviewed studies on blue light blocking glasses and cognitive performance
By following this structured approach, health enthusiasts and biohackers can confidently explore the impact of blue light blocking glasses on their daytime alertness and overall cognitive health.
10. Data Analysis and Interpretation for Self-Experimenters
10.1 Collecting Reliable Data: Best Practices and Common Pitfalls
Reliable data collection is the cornerstone of effective biohacking self-experimentation. Without accurate and consistent data, it becomes impossible to draw meaningful conclusions or optimize your health interventions. This section will guide you through best practices for collecting reliable data and highlight common pitfalls to avoid.
Best Practices for Collecting Reliable Data
Define Clear Metrics and Objectives
- Before collecting data, clearly define what you want to measure and why.
- Choose metrics that directly relate to your biohacking goals.
Example: If your goal is to improve sleep quality, relevant metrics might include total sleep time, sleep efficiency, and number of awakenings.
Use Validated Tools and Devices
- Select measurement tools and devices with proven accuracy and reliability.
- Prefer devices with peer-reviewed validation or clinical-grade standards.
Example: Use a validated wearable like the Oura Ring or WHOOP for sleep tracking instead of unverified smartphone apps.
Standardize Data Collection Conditions
- Collect data under consistent conditions to reduce variability.
- Control for factors like time of day, environment, and pre-measurement activities.
Example: Measure resting heart rate each morning immediately after waking up and before getting out of bed.
Record Contextual Information
- Alongside quantitative data, log qualitative context such as mood, diet, stress levels, or unusual events.
- This helps interpret anomalies and understand confounding variables.
Example: Note if you consumed caffeine late in the day when analyzing sleep disturbances.
Automate Data Collection Where Possible
- Use apps and devices that automatically track and sync data to minimize manual entry errors.
Example: Use continuous glucose monitors (CGMs) that record glucose levels every few minutes without manual input.
Maintain Consistent Frequency and Duration
- Collect data frequently enough to capture meaningful trends but avoid overload.
- Ensure the experiment runs long enough to observe effects beyond natural variability.
Example: Track mood daily for at least 30 days when testing a new supplement.
Common Pitfalls in Data Collection
Inconsistent Measurement Times
- Measuring metrics at different times can introduce noise.
Pitfall Example: Measuring blood pressure once in the morning one day and in the evening the next.
Relying on Subjective Data Alone
- Subjective feelings are important but should be paired with objective data.
Pitfall Example: Reporting “felt more energetic” without tracking activity or sleep data.
Ignoring Calibration and Device Limitations
- Devices may need calibration or have accuracy limits.
Pitfall Example: Using a consumer-grade scale without zeroing it before weighing.
Data Overload and Poor Organization
- Collecting too much data without a plan can lead to confusion and analysis paralysis.
Pitfall Example: Tracking dozens of variables daily without prioritizing or organizing data.
Confirmation Bias and Selective Reporting
- Only recording or focusing on data that supports your hypothesis.
Pitfall Example: Ignoring days when a supplement had no effect or negative effects.
Mind Maps
Mind Map 1: Best Practices for Reliable Data Collection
Mind Map 2: Common Pitfalls in Data Collection

Practical Example: Tracking Resting Heart Rate (RHR)
Goal: Improve cardiovascular health through exercise.
Step 1: Define Metric - Resting Heart Rate (beats per minute).
Step 2: Tool - Use a validated wearable (e.g., Polar H10 chest strap).
Step 3: Standardize - Measure RHR every morning immediately after waking, before getting out of bed.
Step 4: Record Context - Log sleep quality, caffeine intake, and stress levels.
Step 5: Automate - Sync data to app for automatic recording.
Step 6: Frequency - Collect data daily for 60 days.
Pitfall to Avoid: Measuring RHR after morning coffee or exercise, which can skew results.
By following these best practices and being mindful of common pitfalls, you can ensure the data you collect is reliable, meaningful, and actionable, empowering you to make informed decisions in your biohacking journey.
10.2 Basic Statistical Tools for Personal Data Analysis
When engaging in evidence-based self-experimentation, understanding and applying basic statistical tools is crucial to make sense of your personal data. This section will guide you through fundamental concepts and methods that help you analyze your data effectively, identify meaningful patterns, and make informed decisions about your biohacking protocols.
Why Use Statistics in Biohacking?
- Quantify changes and improvements objectively
- Distinguish real effects from random fluctuations
- Optimize interventions based on data-driven insights
Key Statistical Concepts
Mind Map: Key Statistical Concepts
Descriptive Statistics
These summarize your data to give a quick overview.
-
Mean (Average): Sum of all values divided by the number of values.
- Example: Tracking daily sleep hours over 7 days: [7, 6.5, 8, 7.5, 6, 7, 7]
- Mean = (7 + 6.5 + 8 + 7.5 + 6 + 7 + 7) / 7 = 6.93 hours
-
Median: The middle value when data is ordered.
- Useful when data has outliers.
-
Mode: Most frequently occurring value.
-
Range: Difference between max and min values.
-
Standard Deviation (SD): Measures data spread around the mean.
- Lower SD means data points are closer to the mean.
Mind Map: Descriptive Statistics Example (Sleep Hours)
Inferential Statistics
Used to make conclusions about your data beyond simple description.
-
Hypothesis Testing: Test if an observed effect is likely due to your intervention or just chance.
- Example: Does intermittent fasting increase your average energy levels?
-
p-value: Probability that the observed effect happened by chance.
- p < 0.05 is commonly considered statistically significant.
-
Confidence Interval (CI): Range within which the true effect likely lies.
Correlation
Measures the strength and direction of a relationship between two variables.
-
Pearson’s r: Measures linear correlation.
- Values range from -1 (perfect negative) to +1 (perfect positive).
-
Spearman’s rho: Non-parametric measure for ranked data.
-
Example: Correlate daily caffeine intake with hours of focus.
Mind Map: Correlation Example
Visualization Tools
Visual aids help you quickly identify trends and outliers.
- Histograms: Show frequency distribution.
- Scatter Plots: Show relationships between two variables.
- Box Plots: Show data spread and outliers.
Example: Analyzing Sleep and Mood Data
You track your sleep hours and mood rating (1-10) daily for 14 days.
| Day | Sleep Hours | Mood Rating |
|---|---|---|
| 1 | 7 | 6 |
| 2 | 6.5 | 5 |
| 3 | 8 | 7 |
| 4 | 7.5 | 7 |
| 5 | 6 | 4 |
| 6 | 7 | 6 |
| 7 | 7 | 6 |
| 8 | 6.8 | 5 |
| 9 | 7.2 | 7 |
| 10 | 7 | 6 |
| 11 | 6.5 | 5 |
| 12 | 7.8 | 8 |
| 13 | 7 | 6 |
| 14 | 6.9 | 6 |
- Calculate mean sleep: ~7 hours
- Calculate mean mood: ~6
- Calculate Pearson correlation between sleep and mood: ~0.75 (moderate positive correlation)
Mind Map: Sleep vs Mood Analysis
Tips for Applying Statistics in Your Biohacking
- Collect data consistently and accurately
- Use simple tools like spreadsheets or apps for calculations
- Visualize data to spot trends easily
- Avoid over-interpreting small datasets
- Combine statistical results with subjective experience
By mastering these basic statistical tools, you empower yourself to transform raw personal data into actionable insights, making your biohacking journey more effective and scientifically grounded.
10.3 Visualizing Your Results for Better Insights
Visualizing your self-experimentation data is a crucial step in understanding patterns, trends, and correlations that raw numbers alone might not reveal. Effective visualization helps you make informed decisions about your biohacking protocols and identify what works best for your body.
Why Visualize Data?
- Clarifies complex data: Transforms raw data into understandable visuals.
- Identifies trends and outliers: Spot improvements or unexpected results.
- Supports decision-making: Helps adjust protocols based on evidence.
- Motivates continued experimentation: Seeing progress can boost engagement.
Common Visualization Techniques for Biohacking Data
| Visualization Type | Use Case | Example |
|---|---|---|
| Line Graphs | Track changes over time | Sleep duration across 30 days |
| Bar Charts | Compare categories | Cognitive test scores pre- and post-intervention |
| Scatter Plots | Explore correlations | Mood ratings vs. hours of exercise |
| Heatmaps | Identify intensity or frequency | Daily mood intensity throughout a month |
| Pie Charts | Show proportions | Distribution of macronutrients in diet |
Example Mind Map: Visualizing Sleep Data
Example Mind Map: Visualizing Cognitive Performance
Practical Example: Visualizing a 30-Day Sleep Experiment
Scenario: You tracked your sleep duration and subjective sleep quality daily while reducing blue light exposure in the evening.
- Line Graph: Plot sleep duration (hours) on the Y-axis and days (1-30) on the X-axis.
- Add a horizontal line at 7.5 hours to represent your target.
- Bar Chart: Plot subjective sleep quality ratings (scale 1-10) for each day.
- Scatter Plot: Plot caffeine intake (mg) on the X-axis and sleep quality on the Y-axis to see if caffeine affects your rest.
Insights:
- Notice if sleep duration increases after day 10 when blue light reduction started.
- Check if higher caffeine days correspond to lower sleep quality.
Tools for Visualizing Your Data
- Excel or Google Sheets: Easy for line graphs, bar charts, and scatter plots.
- Tableau Public: Powerful for interactive and complex visualizations.
- Notion: Embed simple charts and keep notes together.
- R or Python (Matplotlib, Seaborn): For advanced users wanting custom visuals.
- Biohacking Apps: Some apps provide built-in visualization features.
Tips for Effective Visualization
- Keep it simple and focused on your goals.
- Use consistent scales and labels.
- Combine multiple visualizations to get a holistic view.
- Annotate charts with key events or protocol changes.
- Review visuals regularly to track progress and adjust accordingly.
By integrating these visualization strategies into your biohacking practice, you empower yourself to extract meaningful insights from your data, making your self-experimentation more precise, evidence-based, and ultimately more effective.
10.4 Adjusting Your Protocol Based on Evidence and Feedback
Self-experimentation is an iterative process. After collecting and analyzing your data, the next crucial step is to adjust your biohacking protocol based on the evidence and feedback you have gathered. This ensures your interventions are optimized for your unique physiology and lifestyle.
Why Adjust Your Protocol?
- Individual Variability: What works well for one person may not work for another.
- Dynamic Physiology: Your body and environment change over time, requiring protocol tweaks.
- Data-Driven Improvements: Objective data helps identify what is effective and what isn’t.
Key Steps to Adjust Your Protocol
-
Review Your Data Thoroughly
- Look for trends, patterns, and anomalies.
- Compare baseline data with intervention phases.
-
Evaluate Subjective Feedback
- Consider mood, energy levels, sleep quality, and other self-reported metrics.
-
Identify What Worked and What Didn’t
- Highlight successful interventions.
- Pinpoint areas needing improvement or elimination.
-
Formulate Hypotheses for Adjustments
- Why might a particular hack have failed or succeeded?
-
Implement Incremental Changes
- Avoid multiple simultaneous changes to isolate effects.
-
Set New Measurement Criteria
- Define what success looks like for the next iteration.
Mind Map: Adjusting Your Protocol Workflow
Example: Adjusting a Sleep Optimization Protocol
Initial Protocol:
- Reduce blue light exposure 2 hours before bedtime using blue light blocking glasses.
- Track sleep duration and quality with a wearable.
Data & Feedback:
- Sleep duration improved by 30 minutes.
- Subjective sleep quality unchanged; still waking up tired.
Adjustment Process:
- Data Review: Sleep duration increased but sleep efficiency (time asleep vs. time in bed) remained low.
- Subjective Feedback: Persistent morning fatigue suggests deeper sleep stages may be insufficient.
- Hypothesis: Blue light reduction alone may not address other factors like room temperature or caffeine intake.
- Adjustment: Add a protocol to reduce caffeine intake after 2 PM and optimize bedroom temperature to 65°F.
- Measurement: Continue tracking sleep metrics and add subjective morning alertness rating.
Outcome:
- After 2 weeks, sleep efficiency improved by 15%, and morning alertness ratings increased.
Mind Map: Example Sleep Protocol Adjustment
Tips for Effective Protocol Adjustment
- Change One Variable at a Time: To clearly attribute effects.
- Keep Detailed Logs: Document changes, dates, and subjective experiences.
- Be Patient: Some effects take time to manifest.
- Use Control Periods: Return to baseline conditions occasionally to compare.
- Seek External Feedback: Share data with a community or coach for insights.
Summary
Adjusting your biohacking protocol based on evidence and feedback is essential for personalized optimization. By systematically reviewing data, forming hypotheses, and implementing incremental changes, you can refine your interventions to better suit your unique biology and goals. This iterative approach transforms self-experimentation into a powerful tool for lasting health improvements.
10.5 Example: Analyzing Sleep and Mood Correlations Over 30 Days
Understanding the relationship between sleep quality and mood is a foundational biohack for improving mental well-being and overall health. In this example, we will walk through a practical, evidence-based self-experiment to analyze how variations in sleep affect mood over a 30-day period.
Step 1: Define Your Variables and Metrics
- Sleep Metrics: Total sleep duration, sleep efficiency, number of awakenings, time to fall asleep.
- Mood Metrics: Daily mood rating on a scale of 1-10, qualitative notes on stress, anxiety, or happiness.
Step 2: Data Collection Tools
- Sleep Tracking: Use a wearable device (e.g., Oura Ring, Fitbit) or a smartphone app (e.g., Sleep Cycle) to record sleep data.
- Mood Tracking: Use a simple daily journal or mood tracking app (e.g., Daylio, Moodpath) to log mood scores and notes.
Step 3: Daily Routine for 30 Days
- Record sleep data every morning.
- Log mood rating and notes every evening.
- Maintain consistency in bedtime and wake time as much as possible.
Mind Map: Data Collection Workflow
Step 4: Organizing Your Data
Create a spreadsheet with columns for each metric and date. Example:
| Date | Sleep Duration (hrs) | Sleep Efficiency (%) | Awakenings | Sleep Latency (min) | Mood Score (1-10) | Notes |
|---|---|---|---|---|---|---|
| 2024-05-01 | 7.2 | 90 | 2 | 15 | 7 | Felt a bit stressed |
| 2024-05-02 | 6.5 | 85 | 4 | 25 | 5 | Anxious, restless night |
| … | … | … | … | … | … | … |
Mind Map: Data Organization and Visualization
Step 5: Visualizing the Data
- Line Graph: Plot sleep duration and mood score over time to observe trends.
- Scatter Plot: Plot sleep duration (x-axis) vs. mood score (y-axis) to identify correlation.
Example:
Date: 30 days
X-axis: Sleep Duration (hours)
Y-axis: Mood Score (1-10)
Observation: Positive correlation where higher sleep duration tends to align with higher mood scores.
Step 6: Basic Statistical Analysis
- Calculate the Pearson correlation coefficient between sleep duration and mood score.
- Interpret the coefficient:
- Close to +1: Strong positive correlation
- Close to 0: No correlation
- Close to -1: Strong negative correlation
Example:
- Pearson r = 0.65 indicates a moderate positive correlation between longer sleep and better mood.
Mind Map: Statistical Analysis
Step 7: Interpretation and Actionable Insights
- Identify patterns such as “mood dips on nights with less than 6 hours of sleep.”
- Consider confounding factors noted in qualitative data (e.g., stress, caffeine intake).
- Adjust sleep hygiene practices accordingly (e.g., earlier bedtime, reduce screen time).
Step 8: Example Summary Table
| Metric | Observation | Actionable Biohack |
|---|---|---|
| Sleep Duration < 6 hrs | Mood scores drop below 5 | Aim for minimum 7 hours sleep |
| High Sleep Latency | Correlates with lower mood scores | Practice relaxation techniques before bed |
| Frequent Awakenings | Associated with mood variability | Optimize bedroom environment (dark, quiet) |
Mind Map: Interpretation and Next Steps
Final Thoughts
This 30-day self-experiment empowers you to understand your unique sleep-mood relationship through evidence-based tracking and analysis. By integrating quantitative data with qualitative insights, you can make informed biohacking decisions that enhance your mental health and overall quality of life.
Remember, consistency and honest data logging are key to meaningful results. Use this framework as a foundation for more complex experiments involving other variables such as diet, exercise, or supplementation.
Happy biohacking!
11. Scaling and Sustaining Your Biohacking Practice
11.1 Building a Biohacking Routine That Fits Your Lifestyle
Creating a sustainable biohacking routine is essential for long-term success and meaningful health improvements. The key is to design a personalized approach that integrates seamlessly into your daily life without causing overwhelm or burnout. This section will guide you through practical steps, mindset strategies, and examples to build a biohacking routine tailored to your unique lifestyle.
Understanding Your Lifestyle and Priorities
Before diving into specific biohacks, take stock of your current lifestyle, commitments, and priorities. This helps ensure your routine is realistic and aligned with your goals.
Key questions to ask yourself:
- What are my main health and performance goals?
- How much time can I realistically dedicate daily or weekly?
- What are my current habits and routines?
- Which areas of my health need the most attention?
Mind Map: Designing Your Biohacking Routine
Step 1: Start Small and Prioritize
Begin with 1-3 biohacks that address your most pressing goals. For example, if sleep quality is poor, prioritize sleep hygiene improvements before adding complex supplementation.
Example:
- Goal: Improve energy and focus
- Start with: 7-8 hours consistent sleep + 10 minutes morning meditation
- Track: Sleep quality via wearable + mood/energy journal
Step 2: Integrate Biohacks into Existing Habits
Leverage current habits to make new biohacks easier to adopt. This reduces friction and increases adherence.
Example:
- Habit: Morning coffee ritual
- Biohack integration: Add 5 minutes of deep breathing or light stretching before coffee
Step 3: Schedule and Time Block
Allocate specific times for your biohacking activities. Treat them as non-negotiable appointments.
Example:
- 6:30 AM - Wake up
- 6:35 AM - 10-minute meditation
- 7:00 AM - Healthy breakfast with tracked macros
- 8:00 PM - Blue light reduction (wear blue light blocking glasses)
Mind Map: Sample Daily Biohacking Routine
Step 4: Use Tools to Track and Reflect
Consistent tracking helps you understand what works and what doesn’t. Use apps, wearables, or simple journals.
Example:
- Use a sleep tracker (e.g., Oura Ring) to monitor sleep stages
- Keep a daily journal logging mood, energy, and any side effects
Step 5: Build in Flexibility and Review Regularly
Life changes, so your routine should too. Schedule weekly or monthly reviews to assess progress and make adjustments.
Example:
- Every Sunday evening, review your journal and tracker data
- Adjust meditation time or supplement dosage based on results
Common Pitfalls and How to Avoid Them
-
Overloading: Trying too many hacks at once can cause burnout.
- Solution: Prioritize and phase in new practices gradually.
-
Inconsistency: Skipping days reduces effectiveness.
- Solution: Anchor biohacks to existing habits and schedule them.
-
Ignoring Data: Not tracking progress can lead to wasted effort.
- Solution: Use simple tools and reflect regularly.
Real-Life Example: Sarah’s Biohacking Routine
Sarah is a busy professional aiming to improve her focus and reduce stress.
- Goals: Enhance cognitive clarity, reduce afternoon fatigue
- Routine:
- Morning: 10-minute mindfulness meditation + hydration
- Daytime: Balanced meals with intermittent fasting (12:12)
- Evening: 30 minutes of light stretching + blue light blocking glasses after 8 PM
- Tracking: Uses a mood and energy app daily, plus a sleep tracker
- Review: Weekly reflections to tweak fasting window and meditation length
Sarah found that starting small and integrating biohacks into her existing schedule helped her maintain consistency and see gradual improvements.
Summary
Building a biohacking routine that fits your lifestyle is about personalization, simplicity, and adaptability. Start with clear goals, integrate biohacks into your current habits, track progress, and review regularly to optimize your approach. This sustainable method ensures long-term success and empowers you to take control of your health journey.
11.2 Community and Support Networks for Motivation and Learning
Biohacking is a deeply personal journey, but it doesn’t have to be a solitary one. Engaging with communities and support networks can significantly enhance motivation, accelerate learning, and provide valuable feedback. In this section, we explore how to find, build, and leverage these networks effectively.
Why Community Matters in Biohacking
- Accountability: Sharing goals and progress with others encourages consistency.
- Knowledge Sharing: Access to collective wisdom, experiences, and troubleshooting.
- Emotional Support: Overcoming challenges is easier with encouragement.
- Collaboration: Opportunities for joint experiments and data sharing.
Types of Biohacking Communities
How to Find and Join Communities
- Start with Online Forums: Platforms like Reddit’s r/biohacking or LongeCity offer vast resources and active discussions.
- Social Media Groups: Join Facebook groups or follow Instagram accounts focused on biohacking topics.
- Attend Local Meetups: Use Meetup.com or Eventbrite to find local biohacking or health optimization groups.
- Participate in Workshops and Conferences: Events like the Biohacker Summit provide immersive learning and networking.
Best Practices for Engaging with Communities
- Be Curious and Respectful: Ask questions and contribute thoughtfully.
- Share Your Data and Results: Transparency fosters trust and constructive feedback.
- Offer Help and Insights: Even beginners can provide value by sharing fresh perspectives.
- Stay Critical and Evidence-Based: Encourage discussions grounded in science.
Example: Leveraging a Facebook Group for Motivation
Sarah, a longevity seeker, joined a Facebook group dedicated to intermittent fasting. She posted weekly updates on her fasting windows and energy levels. Group members offered tips on managing hunger and shared relevant studies. This interaction kept her motivated and helped her refine her approach based on community feedback.
Building Your Own Support Network
If you can’t find a community that fits your needs, consider creating one.
Example: Creating a Discord Server for Cognitive Enhancement
John, a biohacker focused on cognitive performance, created a Discord server where members share nootropic experiences, meditation techniques, and cognitive testing results. The server includes channels for daily motivation, research paper discussions, and experiment logs. This structure fosters continuous engagement and collective learning.
Leveraging Peer Feedback for Experiment Improvement
- Share your experimental design and preliminary data.
- Request constructive criticism on methodology.
- Discuss unexpected results to explore alternative hypotheses.
Example: Peer Review in a Quantified Self Forum
Emily posted her sleep optimization experiment data on a Quantified Self forum. Community members pointed out potential confounding factors like caffeine intake timing and suggested additional metrics to track. Incorporating this feedback improved the rigor and outcomes of her experiment.
Summary
Building and engaging with community and support networks is a cornerstone of sustainable and effective biohacking. Whether through online forums, local meetups, or self-created groups, these networks provide motivation, knowledge, and collaboration opportunities that enrich your self-experimentation journey.
Further Resources
- Reddit r/biohacking
- LongeCity Forum
- Quantified Self
- Biohacker Summit
- Meetup.com
11.3 Documenting and Sharing Your Findings Responsibly
Documenting and sharing your biohacking experiments is a crucial step in the self-experimentation process. It not only helps you track progress and refine your methods but also contributes to the broader community by providing valuable insights and fostering collaboration. However, responsible documentation and sharing require attention to accuracy, privacy, and ethical considerations.
Why Document and Share?
- Track Progress: Keeping detailed records allows you to identify patterns, successes, and areas for improvement.
- Enhance Accountability: Documentation encourages consistency and discipline in your biohacking practice.
- Contribute to Community Knowledge: Sharing findings can help others avoid pitfalls and replicate successful hacks.
- Receive Feedback: Engaging with others can provide new perspectives and suggestions.
Best Practices for Documenting Your Findings
- Be Detailed and Consistent: Record dates, times, protocols, dosages, and subjective experiences.
- Use Structured Formats: Tables, logs, and journals help organize data clearly.
- Include Both Quantitative and Qualitative Data: Combine biometrics (e.g., heart rate, sleep duration) with personal observations (e.g., mood, focus).
- Note Confounding Variables: Document lifestyle changes, stressors, or illnesses that might affect results.
- Regularly Review and Summarize: Weekly or monthly summaries help identify trends.
Responsible Sharing: Ethical and Privacy Considerations
- Protect Personal Identifiable Information (PII): Anonymize data if sharing publicly.
- Be Transparent About Limitations: Clarify that findings are personal and not medical advice.
- Respect Others’ Privacy: If involving others, obtain consent before sharing.
- Avoid Overgeneralization: Emphasize that biohacks may not work universally.
Tools and Platforms for Documentation and Sharing
- Personal Journals and Spreadsheets: Google Sheets, Excel, Notion.
- Biohacking Communities: Reddit (r/biohacking), LongeCity, Quantified Self forums.
- Blogs and Social Media: Medium, personal websites, Twitter.
- Scientific Platforms: Open Science Framework (OSF) for more formal sharing.
Example Mind Maps in Format
Mind Map 1: Documentation Workflow
Mind Map 2: Ethical Sharing Considerations

Mind Map 3: Platforms for Sharing
Practical Example: Documenting and Sharing a Sleep Optimization Experiment
Step 1: Documentation
- Use a spreadsheet to log bedtime, wake time, total sleep, sleep quality (subjective rating), and use of blue light blocking glasses.
- Record daily notes on mood and alertness.
Step 2: Weekly Summary
- Calculate average sleep duration and quality.
- Note correlations between blue light blocking and sleep improvements.
Step 3: Sharing
- Prepare an anonymized summary report.
- Share on a biohacking forum with clear disclaimers about personal nature and limitations.
- Invite feedback and questions.
Step 4: Reflect and Adjust
- Incorporate community feedback.
- Plan next phase of experimentation.
Summary
Documenting and sharing your biohacking findings responsibly enhances your self-experimentation journey and benefits the wider community. By following best practices in detailed recording, ethical sharing, and engaging with supportive platforms, you create a positive feedback loop of learning and improvement.
11.4 Avoiding Burnout and Over-Experimentation
Biohacking is an exciting journey of self-discovery and optimization, but it can also lead to burnout and diminishing returns if not managed carefully. Avoiding burnout and over-experimentation is crucial to maintaining long-term motivation, mental well-being, and sustainable progress.
Understanding Burnout in Biohacking
Burnout occurs when the mental, emotional, or physical demands of continuous self-experimentation exceed your capacity to cope. Symptoms include fatigue, loss of motivation, irritability, and even physical health setbacks.
Common causes of burnout in biohacking:
- Excessive tracking and data obsession
- Trying too many interventions simultaneously
- Unrealistic expectations of rapid results
- Neglecting rest and recovery
Mind Map: Causes and Signs of Burnout

Strategies to Avoid Burnout and Over-Experimentation
-
Prioritize and Limit Experiments
- Focus on 1-2 variables at a time.
- Use a hypothesis-driven approach to test interventions.
-
Schedule Rest and Recovery Periods
- Incorporate breaks between experiments.
- Practice mindfulness and relaxation techniques.
-
Set Realistic Goals and Timelines
- Understand that meaningful changes often take weeks or months.
- Avoid rushing to conclusions.
-
Track Qualitative as well as Quantitative Data
- Include mood, energy levels, and subjective well-being.
- Helps identify early signs of burnout.
-
Maintain a Balanced Lifestyle
- Ensure social connections, physical activity, and hobbies outside biohacking.
-
Reflect and Adjust Regularly
- Use journaling or monthly reviews to assess progress and mental state.
Mind Map: Strategies to Avoid Burnout
Example 1: Limiting Variables for Sustainable Progress
Scenario: Sarah wants to improve her sleep quality and cognitive focus. Instead of trying multiple supplements, diet changes, and sleep gadgets all at once, she chooses to first test the effect of reducing blue light exposure in the evening.
Approach:
- She wears blue light blocking glasses for 3 weeks.
- Tracks sleep duration and subjective sleep quality.
- Records mood and focus daily.
Outcome:
- Sarah notices improved sleep onset and feels more refreshed.
- She avoids adding other interventions simultaneously, preventing overwhelm.
Example 2: Scheduling Recovery to Prevent Burnout
Scenario: Mike is experimenting with intermittent fasting and high-intensity interval training (HIIT) to boost metabolism.
Approach:
- He plans 4 weeks of experimentation followed by 1 week of rest with no new interventions.
- During rest weeks, he focuses on light activities, socializing, and hobbies.
Outcome:
- Mike feels mentally refreshed and physically recovered.
- He avoids fatigue and maintains motivation for the next cycle.
Example 3: Using Qualitative Data to Detect Burnout Early
Scenario: Emma tracks her biometrics intensively but starts feeling unusually tired and irritable.
Approach:
- She adds daily mood and energy level ratings to her tracking.
- Upon noticing a downward trend, she pauses new experiments and prioritizes sleep and relaxation.
Outcome:
- Emma recovers quickly and learns to listen to subjective signals alongside data.
Practical Tips Summary
- Start small and build gradually.
- Avoid multitasking multiple experiments.
- Listen to your body and mind.
- Keep a balanced approach to life beyond biohacking.
- Use reflection tools like journaling to maintain awareness.
By integrating these best practices, you can enjoy the benefits of biohacking without sacrificing your well-being or enthusiasm. Sustainable self-experimentation is a marathon, not a sprint.
11.5 Example: Creating a Monthly Review System for Continuous Improvement
Continuous improvement is a cornerstone of effective biohacking. Establishing a structured monthly review system allows you to reflect on your experiments, analyze data, and make informed adjustments to optimize your health journey. Below, we outline a practical, step-by-step approach to creating this system, enriched with examples and mind maps to visualize the process.
Step 1: Collect and Organize Your Data
Start by gathering all relevant data from your biohacking experiments conducted over the month. This may include:
- Sleep metrics (duration, quality, interruptions)
- Nutrition logs (macronutrients, supplements taken)
- Physical activity data (workouts, heart rate variability)
- Cognitive performance scores (memory tests, focus apps)
- Mood and stress journals
Example: If you tracked sleep with a wearable, export the weekly reports and compile them into a single spreadsheet.
Step 2: Reflect on Your Goals and Hypotheses
Revisit the goals you set at the beginning of the month. Were they SMART (Specific, Measurable, Achievable, Relevant, Time-bound)?
- What hypotheses did you test?
- Did you follow your planned protocols consistently?
Example: Your goal was to improve sleep efficiency by reducing blue light exposure after 8 PM. Reflect on adherence and any challenges.
Step 3: Analyze Trends and Patterns
Look for correlations or trends in your data. Use simple statistical tools or visualization to identify what worked and what didn’t.
- Did sleep quality improve on days with blue light blocking glasses?
- Was there a relationship between workout intensity and next-day mood?
Example: Plot sleep efficiency over the month and highlight days when you used blue light blockers.
Step 4: Summarize Key Insights
Create a concise summary of findings.
- What interventions showed positive effects?
- Were there unexpected outcomes?
- What variables need further testing?
Example: “Blue light blocking glasses improved sleep efficiency by 8% on average, but inconsistent use limited overall gains.”
Step 5: Plan Adjustments for Next Month
Based on insights, adjust your goals and protocols.
- Increase adherence strategies
- Introduce new variables or remove ineffective ones
Example: Plan to combine blue light blocking with a fixed bedtime routine.
Mind Map: Monthly Review System Overview
Mind Map: Example - Sleep Optimization Monthly Review
Practical Tips for Maintaining Your Monthly Review System
- Use Templates: Create or download monthly review templates to streamline data entry and reflection.
- Set a Fixed Date: Dedicate a consistent day each month for your review session.
- Leverage Technology: Use apps like Notion, Evernote, or Excel for organizing notes and data.
- Visualize Data: Incorporate charts and graphs to make trends easier to spot.
- Be Honest and Objective: Acknowledge failures as learning opportunities.
Final Example: Sample Monthly Review Entry (Excerpt)
Month: March 2024
Goal: Improve cognitive focus using daily meditation and nootropic supplementation.
Data Summary:
- Meditation practiced 25/30 days
- Nootropic (L-Theanine + Caffeine) taken 20/30 days
- Cognitive test scores improved by 12% on average
- Mood logs indicated reduced stress on meditation days
Insights:
- Consistent meditation correlates with better mood and focus.
- Nootropic effects less consistent, possibly due to irregular intake.
Adjustments:
- Aim for 30/30 meditation days.
- Set reminders for nootropic intake.
- Add journaling to track subjective effects daily.
By integrating a monthly review system like this, biohackers can create a feedback loop that drives continuous, evidence-based improvements, turning self-experimentation into a sustainable and rewarding practice.
12. Advanced Biohacking Techniques and Future Directions
12.1 Genetic Testing and Personalized Medicine in Biohacking
Genetic testing has revolutionized the way biohackers approach health optimization by providing personalized insights into an individual’s unique genetic makeup. This section explores how genetic testing integrates with personalized medicine to empower evidence-based biohacking.
What is Genetic Testing?
Genetic testing analyzes your DNA to identify variations that may influence traits such as metabolism, nutrient absorption, exercise response, and disease risk. These insights enable tailored interventions rather than generic recommendations.
Personalized Medicine in Biohacking
Personalized medicine uses genetic information alongside lifestyle and environmental factors to customize health strategies. For biohackers, this means designing nutrition plans, supplement regimens, and lifestyle modifications that align with their genetic predispositions.
Mind Map: Genetic Testing in Biohacking
Example 1: Using Genetic Testing to Optimize Caffeine Intake
Background: A biohacker discovers through genetic testing that they carry the CYP1A2 slow-metabolizer variant. This gene affects how quickly caffeine is processed.
Action: Based on this, they reduce daily caffeine intake to avoid jitteriness and sleep disturbances.
Outcome: Improved sleep quality and reduced anxiety, demonstrating how genetic insights can guide personalized lifestyle adjustments.
Mind Map: Personalized Medicine Workflow in Biohacking
Example 2: Nutrigenomics for Folate Supplementation
Background: A biohacker’s genetic report shows a mutation in the MTHFR gene, which impairs folate metabolism.
Action: They switch from standard folic acid supplements to methylated folate (5-MTHF) to improve absorption.
Outcome: Enhanced energy levels and reduced homocysteine markers, illustrating the power of gene-informed supplementation.
Best Practices for Genetic Testing in Biohacking
- Choose reputable testing providers with transparent data policies.
- Interpret results with professional guidance to avoid misapplication.
- Combine genetic data with phenotypic tracking (sleep, diet, mood).
- Stay updated as research evolves; genetic insights are continually refined.
- Protect your genetic privacy by understanding data sharing agreements.
Summary
Genetic testing and personalized medicine offer powerful tools for biohackers seeking to optimize health with precision. By understanding genetic predispositions, biohackers can design targeted interventions that maximize benefits and minimize risks. However, integrating these insights responsibly and ethically is crucial for sustainable and effective biohacking.
Further Reading & Resources
- The Personalized Diet by Eran Segal & Eran Elinav
- Promethease (https://promethease.com) – Genetic report interpretation
- Genetic Literacy Project (https://geneticliteracyproject.org)
- Precision Medicine Initiative (https://allofus.nih.gov)
This section equips you with foundational knowledge and practical examples to begin incorporating genetic testing into your biohacking toolkit.
12.2 Emerging Technologies: Neurostimulation and Wearable Biosensors
Biohacking is rapidly evolving with the advent of cutting-edge technologies that allow individuals to monitor and modulate their physiology in real time. Two of the most promising areas are neurostimulation and wearable biosensors. This section explores these technologies, their mechanisms, practical applications, and examples of how biohackers can integrate them into their routines.
Neurostimulation Technologies
Neurostimulation involves applying targeted electrical or magnetic stimuli to the nervous system to influence brain function, mood, cognition, and overall neurological health.
Types of Neurostimulation
- Transcranial Direct Current Stimulation (tDCS): Applies low electrical current to the scalp to modulate neuronal excitability.
- Transcranial Magnetic Stimulation (TMS): Uses magnetic fields to stimulate nerve cells in the brain.
- Vagus Nerve Stimulation (VNS): Stimulates the vagus nerve to affect mood and inflammation.
- Cranial Electrotherapy Stimulation (CES): Delivers small electrical pulses to the head to reduce anxiety and improve sleep.
Mind Map: Neurostimulation Overview
Practical Example: Using tDCS for Cognitive Enhancement
A biohacker interested in improving focus and working memory might use a tDCS device targeting the dorsolateral prefrontal cortex (DLPFC). Sessions typically last 20 minutes with a current of 1-2 mA. Users should track cognitive performance via apps like Lumosity or dual n-back tests before and after sessions to evaluate effectiveness.
Wearable Biosensors
Wearable biosensors are devices worn on the body that continuously collect physiological data, enabling real-time monitoring and feedback.
Common Types of Wearable Biosensors
- Heart Rate Monitors: Measure beats per minute and heart rate variability (HRV).
- Continuous Glucose Monitors (CGM): Track blood glucose levels throughout the day.
- Electroencephalography (EEG) Headbands: Monitor brainwave activity.
- Sleep Trackers: Analyze sleep stages and quality.
- Pulse Oximeters: Measure blood oxygen saturation.
- Skin Temperature Sensors: Detect changes in peripheral temperature.
Mind Map: Wearable Biosensors
Practical Example: Continuous Glucose Monitoring (CGM) for Dietary Biohacking
A longevity seeker might wear a CGM device to observe how different foods impact their blood sugar levels. By logging meals and glucose responses, they can identify foods that cause spikes and adjust their diet accordingly to improve metabolic health.
Integrating Neurostimulation and Wearable Biosensors
Combining neurostimulation with wearable biosensors can create powerful feedback loops for personalized biohacking.
Mind Map: Integration of Technologies
Example: EEG-Guided tDCS for Focus Enhancement
A biohacker uses an EEG headband to monitor brainwave patterns during work sessions. When focus wanes (detected by increased theta waves), a tDCS device delivers a mild current to the prefrontal cortex to boost alertness. This closed-loop system allows dynamic adjustment based on real-time brain activity.
Best Practices and Safety Considerations
- Always start with conservative settings and short sessions.
- Consult healthcare professionals before beginning neurostimulation, especially if you have neurological or cardiac conditions.
- Use devices from reputable manufacturers with clear instructions.
- Maintain detailed logs of sessions, sensations, and outcomes.
- Combine data from wearables with subjective reports for holistic understanding.
Summary
Emerging technologies like neurostimulation and wearable biosensors offer exciting opportunities for evidence-based self-experimentation. By understanding their mechanisms, applications, and safety, biohackers can harness these tools to optimize cognition, mood, and overall health with personalized, data-driven approaches.
12.3 Ethical Considerations of Advanced Self-Experimentation
Advanced self-experimentation in biohacking pushes the boundaries of personal health optimization but also raises important ethical questions. As biohackers explore novel interventions—ranging from genetic editing to neurostimulation—it’s crucial to balance innovation with responsibility, safety, and respect for broader societal norms.
Key Ethical Principles in Advanced Self-Experimentation
Safety: The Foremost Priority
Advanced biohacking techniques often involve interventions with uncertain outcomes. For example, experimenting with CRISPR gene editing or unapproved peptides can carry risks of unintended side effects or long-term health impacts.
Example: A biohacker attempting self-administered gene editing to reduce cholesterol levels must consider potential off-target effects that could cause immune reactions or disrupt other genes.
Best Practice: Always conduct thorough literature reviews, consult with medical professionals when possible, and start with minimal effective doses or low-risk protocols.
Informed Consent: Self-Awareness and Voluntariness
Even though self-experimentation involves only oneself, it is vital to be fully informed about the potential risks and benefits.
Example: Before trying a novel neurostimulation device to enhance cognitive function, a biohacker should understand the device’s mechanism, possible side effects like headaches or mood changes, and have a clear plan for monitoring.
Best Practice: Document your understanding of the experiment, including potential risks, and establish criteria for stopping the experiment if adverse effects occur.
Privacy: Protecting Sensitive Data
Advanced biohacking often involves collecting and storing sensitive personal data such as genomic sequences, hormone levels, or brain activity patterns.
Example: Sharing raw genetic data publicly without anonymization could expose a biohacker to discrimination by insurers or employers.
Best Practice: Use encrypted storage solutions, anonymize data before sharing, and be mindful of who has access to your information.
Legal Compliance: Navigating Regulatory Landscapes
Many advanced biohacking interventions fall into gray areas legally. Some substances or devices may be unapproved for human use or restricted by law.
Example: Using peptides or hormones without prescriptions may violate local regulations.
Best Practice: Research local laws and regulations thoroughly. When in doubt, seek legal advice or avoid high-risk interventions.
Social Responsibility: Considering Broader Impact
Self-experimentation can influence others, especially when shared publicly. Promoting unsafe or unverified practices can lead to harm.
Example: A biohacker publishing a blog post endorsing an untested DIY gene therapy could inadvertently encourage dangerous replication attempts.
Best Practice: Share results transparently, including failures and risks. Encourage critical thinking and caution among your audience.
Scientific Integrity: Commitment to Truth and Transparency
Maintaining honesty in reporting results, even when experiments fail or produce negative outcomes, is essential for the collective progress of biohacking.
Example: Publishing only positive outcomes of a cognitive enhancement trial while ignoring adverse effects skews the evidence base.
Best Practice: Keep detailed logs, report all findings objectively, and be open to peer feedback.
Summary Mind Map: Ethical Considerations Overview
Final Example: Ethical Self-Experimentation with Neurostimulation
Scenario: Jane, a biohacker, wants to try transcranial direct current stimulation (tDCS) to improve focus.
- Safety: She researches device safety, starts with low current, and monitors for side effects.
- Informed Consent: Jane documents her understanding of potential risks.
- Privacy: She stores her cognitive test data encrypted and anonymizes it before sharing in forums.
- Legal: She verifies that tDCS devices are legal for personal use in her country.
- Social Responsibility: Jane shares her full experience, including lack of improvement and mild headaches, to provide balanced information.
- Scientific Integrity: She publishes detailed logs and invites peer discussion.
By integrating these ethical considerations, Jane exemplifies responsible advanced self-experimentation.
Conclusion
Ethical considerations are the foundation of responsible advanced biohacking. By prioritizing safety, informed consent, privacy, legal compliance, social responsibility, and scientific integrity, biohackers can innovate safely and contribute valuable knowledge to the community.
12.4 Integrating AI and Machine Learning for Personalized Insights
Artificial Intelligence (AI) and Machine Learning (ML) are revolutionizing the way biohackers approach self-experimentation. By leveraging large datasets, pattern recognition, and predictive analytics, AI/ML can provide personalized insights that help optimize health, performance, and longevity.
What is AI and Machine Learning in Biohacking?
- Artificial Intelligence (AI): Computer systems designed to perform tasks that typically require human intelligence.
- Machine Learning (ML): A subset of AI that enables systems to learn from data and improve over time without explicit programming.
Why Use AI/ML for Personalized Biohacking?
- Handles complex, multidimensional data (e.g., sleep, nutrition, genetics).
- Identifies subtle patterns and correlations beyond human capability.
- Provides tailored recommendations based on individual data.
- Enables dynamic adjustments to biohacking protocols.
Mind Map: AI and ML Applications in Biohacking
Practical Examples of AI/ML in Biohacking
Example 1: Personalized Sleep Optimization
- Data: Sleep stages, heart rate variability (HRV), ambient light, noise levels.
- ML Model: Uses historical sleep data to predict optimal bedtime and wake time.
- Outcome: Personalized sleep schedule recommendations that improve sleep efficiency.
Example 2: Nutritional Response Prediction
- Data: Continuous glucose monitoring (CGM), food intake logs, activity levels.
- ML Model: Predicts blood sugar response to different foods.
- Outcome: Customized diet plans minimizing glucose spikes.
Example 3: Stress and Recovery Monitoring
- Data: HRV, cortisol levels, subjective mood logs.
- ML Model: Detects early signs of stress overload.
- Outcome: Suggests recovery interventions like meditation or rest days.
How to Integrate AI/ML Into Your Biohacking Practice
- Collect High-Quality Data: Use reliable wearables and apps to gather consistent data streams.
- Use Accessible AI Tools: Platforms like TensorFlow, Apple HealthKit, or specialized biohacking apps with AI features.
- Start Simple: Begin with basic pattern recognition or trend analysis before moving to complex models.
- Iterate and Validate: Continuously test AI-generated recommendations against your subjective experience and objective metrics.
- Maintain Privacy and Security: Ensure your data is stored securely and consider ethical implications.
Mind Map: Steps to Implement AI/ML in Personal Biohacking
Example: Using AI to Tailor Nutritional Interventions
Scenario: A biohacker wants to minimize post-meal blood sugar spikes.
Process:
- Collect CGM data alongside detailed food logs.
- Use an ML algorithm (e.g., Random Forest) to analyze which foods cause spikes.
- AI suggests personalized meal plans emphasizing low-impact foods.
- Biohacker tracks results and refines diet accordingly.
Result: Improved glycemic control, increased energy stability, and reduced inflammation.
Final Thoughts
Integrating AI and ML into biohacking empowers individuals to make data-driven, personalized decisions. While the technology can be complex, starting with simple tools and progressively incorporating more sophisticated models can yield meaningful health improvements. Always combine AI insights with self-awareness and consult healthcare professionals when necessary.
12.5 Example: Using Genetic Data to Tailor Nutritional Interventions
Personalized nutrition based on genetic data is a cutting-edge approach in biohacking that allows individuals to optimize their diet according to their unique genetic makeup. This section explores how to leverage genetic information to design effective nutritional interventions, supported by practical examples and mind maps.
Understanding Nutrigenomics
Nutrigenomics studies how genes affect the body’s response to nutrients and how diet can influence gene expression. By analyzing specific genetic variants, biohackers can identify nutritional needs, sensitivities, and metabolic tendencies.
Step 1: Obtaining and Interpreting Genetic Data
- Use reputable genetic testing services (e.g., 23andMe, AncestryDNA) that provide raw genetic data.
- Upload raw data to specialized nutrigenomics platforms (e.g., Nutrigenomix, DNAfit) for detailed reports.
- Focus on genes related to metabolism, vitamin absorption, and food sensitivities.
Step 2: Key Genetic Variants and Their Nutritional Implications
Mind Map: Key Genetic Variants for Nutritional Biohacking
Step 3: Designing Nutritional Interventions Based on Genetic Insights
-
Example 1: MTHFR Variant (C677T)
- Issue: Reduced ability to convert folic acid to active folate.
- Intervention: Increase consumption of folate-rich foods (spinach, broccoli), avoid synthetic folic acid supplements, consider methylfolate supplements.
- Monitoring: Track homocysteine levels and energy levels.
-
Example 2: CYP1A2 Slow Metabolizer
- Issue: Slow caffeine metabolism leading to increased risk of hypertension.
- Intervention: Limit caffeine intake to morning hours or reduce overall consumption.
- Monitoring: Track blood pressure and sleep quality.
-
Example 3: LCT Non-Persistent (Lactose Intolerance)
- Issue: Reduced lactase enzyme activity causing lactose intolerance.
- Intervention: Avoid or limit dairy products; use lactose-free alternatives.
- Monitoring: Track digestive symptoms and gut comfort.
Step 4: Practical Self-Experimentation Protocol
- Baseline Assessment: Document current diet, symptoms, and biomarkers (e.g., blood tests).
- Implement Nutritional Changes: Based on genetic recommendations.
- Track Outcomes: Use food diaries, symptom logs, and wearable devices.
- Analyze Data: Compare before and after intervention data.
- Adjust Protocol: Refine diet based on results and ongoing feedback.
Mind Map: Self-Experimentation Workflow Using Genetic Data
Real-Life Example: Sarah’s Genetic-Based Nutritional Biohack
- Background: Sarah, a 35-year-old health enthusiast, discovered she has the MTHFR C677T variant.
- Intervention: She increased intake of folate-rich foods and switched to methylfolate supplements.
- Tracking: Sarah monitored her energy levels, mood, and homocysteine blood levels over 8 weeks.
- Outcome: Reported improved energy and reduced fatigue; homocysteine levels normalized.
Tips for Success
- Always consult healthcare professionals before making significant dietary changes.
- Use multiple data points (symptoms, biomarkers, performance) for comprehensive evaluation.
- Be patient; genetic-based nutritional changes may take weeks to show effects.
- Combine genetic insights with other biohacking practices for holistic optimization.
Summary
Using genetic data to tailor nutritional interventions empowers biohackers to make informed, personalized dietary choices. By understanding key gene variants and designing targeted self-experiments, individuals can optimize health outcomes with precision and evidence-based strategies.
13. Conclusion: Empowering Your Health Journey Through Evidence-Based Biohacking
13.1 Recap of Best Practices and Key Takeaways
Biohacking is a dynamic journey that combines curiosity, science, and personal empowerment. As we conclude this comprehensive guide, let’s revisit the essential best practices and key takeaways that will help you continue your evidence-based self-experimentation safely and effectively.
Best Practices Summary
Key Takeaways with Examples
Set Clear, Measurable Goals
- Example: Instead of “improve sleep,” specify “increase deep sleep duration by 20% in 4 weeks.”
Design Controlled Experiments
- Example: When testing intermittent fasting, keep calorie intake constant to isolate timing effects.
Prioritize Safety and Ethics
- Example: Before trying cold exposure, consult with a healthcare provider if you have cardiovascular issues.
Use Reliable Data Collection Tools
- Example: Use validated wearables like Oura Ring or WHOOP for sleep and HRV tracking rather than generic apps.
Start Simple and Change One Variable at a Time
- Example: Test blue light blocking glasses for 2 weeks before adding melatonin supplementation.
Track Consistently and Record Contextual Factors
- Example: Log mood, diet, exercise, and stress levels alongside sleep data to understand correlations.
Analyze Data with Basic Statistics and Visualization
- Example: Plot sleep efficiency over time and calculate average improvements to assess impact.
Adapt Protocols Based on Evidence
- Example: If intermittent fasting causes low energy, adjust fasting window or meal composition.
Avoid Over-Experimentation and Burnout
- Example: Limit experiments to one major change every 4-6 weeks to allow meaningful adaptation.
Engage with Community and Share Responsibly
- Example: Join biohacking forums or local groups to exchange insights and receive feedback.
Mind Map: Example of a Simple Sleep Optimization Experiment
Final Thought
Evidence-based biohacking is about becoming your own scientist—curious, methodical, and cautious. By following these best practices and learning from each experiment, you empower yourself to optimize health, longevity, and performance in a sustainable way.
Keep iterating, stay curious, and prioritize your well-being above all.
13.2 Encouragement for Lifelong Learning and Adaptation
Biohacking is not a one-time project but a continuous journey of self-discovery, improvement, and adaptation. The human body and mind are dynamic systems that respond to internal and external changes, so your approach to biohacking should evolve accordingly. Embracing lifelong learning and flexibility is key to sustained success and well-being.
Why Lifelong Learning Matters in Biohacking
- Dynamic Physiology: Your body changes with age, environment, stress levels, and lifestyle.
- Emerging Science: New research and technologies continuously reshape best practices.
- Personal Growth: Self-awareness deepens over time, refining your goals and methods.
- Resilience: Adaptation helps you overcome plateaus, setbacks, or unexpected challenges.
Mind Map: Lifelong Learning & Adaptation in Biohacking
Practical Strategies for Lifelong Learning and Adaptation
Continuous Education
Stay updated with the latest research, books, podcasts, and courses related to health, longevity, and biohacking.
Example: Subscribe to newsletters like “Examine.com” or “Bulletproof Radio,” and dedicate 30 minutes weekly to reading or listening.
Regular Self-Assessment
Schedule monthly or quarterly reviews of your biohacking experiments, health metrics, and subjective well-being.
Example: Use a journal or app to track sleep quality, mood, energy, and cognitive performance, then analyze trends.
Experimentation & Iteration
Treat each biohack as a hypothesis to test, and be ready to modify or abandon protocols based on your data.
Example: If intermittent fasting improves focus but reduces workout performance, adjust fasting windows or nutrition accordingly.
Community Engagement
Join forums, local groups, or social media communities to share experiences, gain insights, and stay motivated.
Example: Participate in Reddit’s r/Biohackers or join a Longevity-focused Discord server.
Mind Map: Practical Steps to Adapt Your Biohacking Practice
Real-Life Example: Adapting Sleep Biohacks Over Time
Scenario: Jane started using blue light blocking glasses and a strict bedtime routine to improve sleep quality. Initially, she saw great improvements in sleep latency and morning energy.
Adaptation: After 6 months, her sleep quality plateaued. By reviewing her data and journaling, she noticed increased caffeine intake in the afternoons and inconsistent weekend sleep times.
Action: Jane reduced caffeine after noon and implemented weekend sleep consistency. She also experimented with adding a 20-minute mindfulness meditation before bed.
Outcome: Sleep quality improved again, demonstrating the importance of ongoing assessment and adaptation.
Cultivating the Right Mindset
- Curiosity: Approach your body as a fascinating system to explore.
- Flexibility: Be willing to pivot when data or experience suggest.
- Patience: Understand that meaningful changes often take time.
- Open-mindedness: Consider new ideas, even if they challenge your current beliefs.
Summary
Lifelong learning and adaptation are the cornerstones of effective biohacking. By continuously educating yourself, assessing your progress, engaging with communities, and maintaining a flexible mindset, you empower your health journey to evolve with you. Remember, biohacking is less about quick fixes and more about sustainable, evidence-based self-optimization.
13.3 Resources for Continued Education and Experimentation
Biohacking is a continuously evolving field, and staying updated with the latest research, tools, and community insights is essential for effective and safe self-experimentation. Below is a curated list of resources organized into categories to help you deepen your knowledge and enhance your biohacking journey.
Books and Literature
- “Boundless” by Ben Greenfield – A comprehensive guide covering fitness, nutrition, sleep, and longevity hacks.
- “Biohack Your Brain” by Kristen Willeumier – Focuses on cognitive enhancement and brain health.
- “Lifespan” by Dr. David Sinclair – Explores the science of aging and longevity.
- PubMed and Google Scholar – For accessing peer-reviewed scientific articles.
Online Courses and Platforms
- Coursera & edX – Courses on nutrition, neuroscience, and human physiology.
- The Quantified Self Institute – Workshops and webinars on self-tracking and data analysis.
- Biohacking Conferences (e.g., Biohacker Summit) – Recorded talks and live events.
Communities and Forums
- Reddit r/Biohackers and r/QuantifiedSelf – Active discussions, experiment sharing, and Q&A.
- Ben Greenfield Fitness Forum – Practical advice and community support.
- Facebook Groups: Biohacking & Longevity Seekers – Peer support and resource sharing.
Tools and Apps
- Oura Ring & WHOOP Strap – Advanced sleep and recovery tracking.
- Cronometer & MyFitnessPal – Nutrition tracking with micronutrient focus.
- Muse Headband – Meditation and neurofeedback.
- Exist.io – Integrates multiple data streams for holistic analysis.
Scientific Journals and Newsletters
- Nature Aging & Cell Metabolism – Cutting-edge longevity research.
- Bulletproof Newsletter – Practical biohacking tips and product reviews.
- Ben Greenfield Fitness Newsletter – Weekly insights and experiment results.
Mind Maps for Organizing Biohacking Resources
Mind Map 1: Biohacking Learning Resources
Mind Map 2: Tools for Data Collection & Analysis
Mind Map 3: Community Engagement and Support
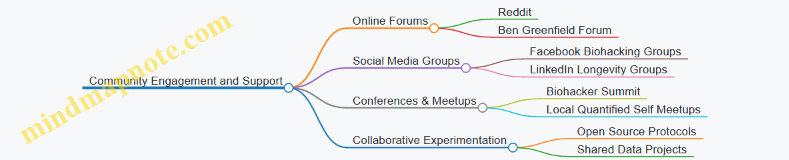
Examples of Using Resources for Self-Experimentation
Example 1: Designing a Sleep Improvement Protocol
- Use the book “Boundless” to understand sleep fundamentals.
- Enroll in a Coursera course on sleep science.
- Join the r/Biohackers subreddit to ask about blue light blocking glasses.
- Track sleep with Oura Ring and analyze data via Exist.io.
- Adjust environment based on insights and share results in community forums.
Example 2: Cognitive Enhancement Experiment
- Read “Biohack Your Brain” for nootropic guidance.
- Use Muse Headband daily to practice meditation and gather neurofeedback.
- Track cognitive performance using Lumosity app.
- Participate in Facebook groups to discuss supplement experiences.
- Document and analyze data, then iterate protocols accordingly.
Example 3: Nutrition and Metabolic Health Optimization
- Study “Lifespan” for longevity-related dietary strategies.
- Track micronutrients with Cronometer.
- Join Quantified Self Institute webinars on metabolic markers.
- Use Reddit forums to exchange tips on intermittent fasting.
- Monitor blood glucose with a continuous glucose monitor (CGM) and share findings.
Final Tips
- Always cross-reference information from multiple sources.
- Prioritize peer-reviewed science over anecdotal claims.
- Engage actively with communities to stay motivated and informed.
- Document your experiments meticulously to contribute back to the biohacking ecosystem.
By leveraging these resources and mind maps, you can build a strong foundation for ongoing, evidence-based self-experimentation that evolves with your personal health journey.
13.4 Final Case Study: A Year of Evidence-Based Biohacking Success
In this final case study, we explore the journey of Alex, a health enthusiast and biohacker who committed to a year-long evidence-based self-experimentation program. Alex’s goal was to optimize energy levels, cognitive performance, and overall longevity through practical biohacking techniques grounded in scientific evidence.
Initial Assessment and Goal Setting
Alex began by establishing baseline metrics:
- Sleep quality (tracked via Oura Ring)
- Daily mood and cognitive sharpness (using Lumosity and mood journals)
- Blood biomarkers (vitamin D, fasting glucose, lipid panel)
- Physical fitness (VO2 max and resting heart rate)
Goal: Improve sleep efficiency by 15%, increase sustained focus periods by 30%, and reduce fasting glucose variability.
Mind Map: Year-Long Biohacking Plan
Monthly Breakdown with Examples
Month 1-3: Sleep and Nutrition Focus
- Implemented blue light blocking glasses after 7 pm.
- Established a strict 10 pm bedtime and 6 am wake time.
- Started 16:8 intermittent fasting.
- Supplemented with vitamin D after blood test revealed deficiency.
Example: After 4 weeks, sleep efficiency improved from 72% to 81%, and morning alertness ratings increased by 20%.
Month 4-6: Physical Activity and Cognitive Training
- Added HIIT workouts thrice weekly.
- Incorporated daily 10-minute guided meditation.
- Trialed a low-dose racetam nootropic, monitoring cognitive tests.
Example: VO2 max increased by 8%, and working memory scores improved by 15% on Lumosity.
Month 7-9: Advanced Supplementation and Environmental Hacks
- Introduced cold showers post-workout.
- Experimented with magnesium supplementation for muscle recovery.
- Optimized bedroom environment with blackout curtains and white noise machine.
Example: Muscle soreness decreased by 30%, and sleep disturbances reduced significantly.
Month 10-12: Data Integration and Refinement
- Used AI-driven app to correlate sleep, nutrition, and mood data.
- Adjusted fasting window to 18:6 based on energy patterns.
- Engaged with biohacking community for feedback and shared results.
Example: Fasting glucose variability reduced by 25%, and sustained focus periods increased by 35%.
Mind Map: Data-Driven Adjustments
Key Takeaways from Alex’s Year of Biohacking
- Consistency is critical: Regular tracking and adherence to protocols yielded measurable improvements.
- Data informs decisions: Objective metrics helped identify what worked and what needed adjustment.
- Small iterative changes: Gradual protocol tweaks prevented burnout and allowed sustainable progress.
- Community support: Sharing experiences and learning from others accelerated growth.
Final Thoughts
Alex’s year-long evidence-based biohacking journey demonstrates how structured self-experimentation, combined with scientific rigor and practical tools, can lead to meaningful health and performance gains. By integrating best practices and continuously refining protocols based on data, biohackers can empower themselves to achieve lasting wellness and longevity.
Inspired to start your own journey? Remember to set clear goals, track consistently, and prioritize safety throughout your biohacking experiments.