Synthetic Timber Technologies
1. Scope and Terminology for Synthetic Timber
1.1 Definitions of Engineered Wood Alternatives and Synthetic Timber
Engineered wood alternatives are wood-based or wood-derived products whose performance comes from controlled manufacturing rather than relying on the natural variability of solid timber. Synthetic timber is a broader, practical term for engineered products that behave like timber in structural use, even when the material system includes non-wood components such as polymer binders, thermoplastic matrices, or mineral fillers.
A useful way to keep the terms straight is to separate what the product is made from from how it is expected to perform. For example, a panel made from wood strands bonded with resin is still an engineered wood product, while a composite beam that uses a polymer matrix with wood fibers may be described as synthetic timber because it is specified and detailed like a timber member.
Core Definitions That Drive Design Decisions
Engineered wood alternatives typically include:
- Panels such as OSB, particleboard, and fiberboard, where layers or particles are bonded into a sheet.
- Laminated members such as glulam-like systems, where strength is built by arranging layers and controlling adhesive bonding.
- Hybrid composites where wood elements are combined with other matrices or reinforcements to meet stiffness, durability, or fire requirements.
Synthetic timber is best treated as a performance category rather than a single material recipe. In practice, it means a product is:
- Specified with mechanical properties suitable for structural design.
- Produced with repeatable manufacturing controls.
- Detailed with connections, moisture management, and fire behavior assumptions similar to timber.
Material Families and What They Mean in Plain Terms
- Wood-derived composites use wood particles, strands, or fibers plus a binder. The binder’s job is to transfer stress between wood elements and stabilize the product against moisture-driven movement.
- Polymer-modified wood changes the wood phase using polymer impregnation or coating. The goal is often improved dimensional stability or moisture resistance.
- Fiber-reinforced composites use wood fibers as reinforcement inside a polymer or hybrid matrix. The matrix carries load and protects fibers from swelling and degradation.
- Mineral-filled composites mix wood with mineral phases to tune stiffness, thermal behavior, and sometimes fire performance.
Mind Map: How Definitions Connect to Product Behavior
Examples That Clarify the Boundary
Example: A strand-bonded panel
A panel made from oriented wood strands bonded with resin is an engineered wood alternative. It is not “synthetic timber” in the strictest sense because it is primarily a panel product, but it can still be used as a structural component (for example, as a diaphragm) where timber-like behavior is assumed.
Example: A composite beam with a polymer matrix
A beam that uses wood fibers embedded in a polymer matrix may be called synthetic timber because it is treated as a timber member: it is designed for bending, deflection limits, and connection detailing, and it is supplied with mechanical property data.
Example: A hybrid wall panel
A wall system that combines a wood-based structural layer with a protective polymer layer is an engineered wood alternative. The protective layer changes moisture and durability behavior, so the product is defined by the whole assembly, not just the wood portion.
System Thinking for Definitions
Definitions matter because they determine what you can assume during design and installation. If a product is treated as engineered wood, you expect properties that depend on panel thickness, layup, and adhesive cure quality. If it is treated as synthetic timber, you also expect that the non-wood components influence moisture transport, thermal response, and how joints transfer load.
A practical rule of thumb is to read the product description as a chain: material system → manufacturing control → tested properties → detailing requirements. When that chain is explicit, definitions stop being academic and start being usable on drawings and in specifications.
1.2 Material Families Including Fiber Based Composites and Polymer Modified Wood
Synthetic timber technologies start with a simple question: what structure do we want, and what chemistry helps us keep it stable? Material families answer that question by pairing a “reinforcement” phase with a “holding” phase. Reinforcement carries loads; the holding phase transfers stress, seals pores, and locks the reinforcement in place.
Foundational Families and Their Roles
Fiber based composites typically use fibers (glass, carbon, aramid, or natural fibers) embedded in a matrix (thermoset resins, thermoplastics, or hybrid binders). The fibers provide stiffness and strength along their orientation, while the matrix controls how forces move between fibers and how the composite resists moisture and wear.
Polymer modified wood uses wood as the reinforcement skeleton, then modifies or fills it with polymers. The polymer phase reduces water uptake, improves dimensional stability, and can raise resistance to decay when properly formulated and cured. Think of it as giving wood a more controlled “skin” and internal support without replacing the wood entirely.
Mind Map: Material Families and Key Mechanisms
Fiber Based Composites in More Detail
Fiber based composites are often described by fiber orientation because orientation determines stiffness direction. A unidirectional layup behaves like a “single direction beam,” while cross-ply or woven architectures spread strength across two directions. In structural panels, this matters because shear and bending performance depend on how well the matrix transfers stress between layers.
Matrix choice affects both processing and service behavior. Thermoset matrices cure into a rigid network, which tends to provide good dimensional stability and predictable stiffness. Thermoplastic matrices soften during processing and solidify on cooling, which can improve recyclability in some systems but requires careful control of temperature exposure during service.
Moisture behavior is not just about “water resistance.” Fibers and matrices interact differently with water. Natural fibers can swell and lose strength if the matrix does not adequately seal them, while glass fibers are less sensitive but still rely on the matrix to prevent debonding. A practical best practice is to specify performance after moisture conditioning, not only dry-state properties.
Polymer Modified Wood in More Detail
Polymer modified wood starts with wood’s internal pathways: capillaries in the lumens and microvoids in the cell wall. If polymer penetrates these pathways, it can reduce capillary transport and slow swelling. If polymer mainly forms a surface layer, it may still help, but the internal moisture gradients can remain.
Polymer chemistry also influences how the wood behaves under repeated wetting and drying. A well-chosen polymer can reduce hysteresis, meaning the wood returns closer to its original dimensions after cycles. A useful example is a polymer impregnation process where the treated wood is conditioned to a target moisture content before bonding into panels; this reduces early joint movement and helps adhesives cure without unexpected moisture release.
Integrated Example: Choosing a Family for a Panel
Suppose you need a structural panel for a humid interior with frequent cleaning. A fiber based composite panel can be designed with a matrix that seals fibers and provides stable shear transfer across layers. The easy-to-check step is to verify interlaminar shear strength after moisture conditioning, because that property often drops when the matrix-fiber interface weakens.
Alternatively, a polymer modified wood panel can reduce swelling in the wood phase itself. The easy-to-check step is to measure thickness swelling after controlled wetting and drying, then confirm that fasteners and edges do not show excessive splitting or pull-out due to residual moisture gradients.
Practical Comparison Summary
Fiber based composites emphasize engineered orientation and matrix control, making them strong candidates when you need predictable stiffness and robust layer-to-layer behavior. Polymer modified wood emphasizes stabilizing the wood microstructure, making it a good fit when you want wood-like geometry with improved moisture performance.
Both families share the same discipline: control moisture before bonding, control cure or consolidation, and validate properties in the condition that matches the intended service environment.
1.3 Performance Targets for Structural and Nonstructural Applications
Performance targets translate “it’s strong enough” into measurable requirements that designers, manufacturers, and inspectors can all check. For synthetic timber technologies, the targets differ by application because loads, moisture exposure, and acceptable failure modes are not the same for a floor beam versus a wall panel.
Foundational Concepts for Setting Targets
Start with three inputs: (1) intended function, (2) governing limit states, and (3) environmental exposure. A simple way to keep teams aligned is to write targets as a matrix of properties and acceptance criteria.
Limit states typically include:
- Strength: the element must resist peak loads without unacceptable failure.
- Serviceability: deflection, vibration, and surface behavior must remain within comfort and usability limits.
- Durability: properties must not degrade beyond acceptable bounds under moisture, biological risk, and temperature swings.
Environmental exposure should be stated in plain terms, such as “interior dry,” “interior humid,” or “exterior sheltered,” because moisture drives many property changes.
Structural Applications Performance Targets
Structural targets focus on load transfer and long-term behavior.
Strength and Stiffness Targets
For beams, joists, and columns, specify:
- Bending strength and modulus of elasticity for deflection checks.
- Shear strength for web and interlayer regions.
- Compression strength for bearing zones and end blocks.
Easy example: If a floor joist is designed for a span where serviceability governs, you can have adequate strength but still fail the deflection requirement. In that case, stiffness targets (not just strength) decide the product choice.
Long-Term Effects Targets
Synthetic timber systems often show time-dependent behavior, so include:
- Creep limits under sustained loads.
- Fatigue or cyclic degradation checks where applicable.
- Residual strength after conditioning when moisture or temperature cycles are expected.
Easy example: A roof member that sees daily temperature swings may not fail immediately, but repeated cycling can change stiffness and connection demand. Targets should therefore include conditioning states used for design values.
Connection and Load Transfer Targets
Connections are where many real failures happen, so set targets for:
- Shear transfer capacity at joints and interfaces.
- Bearing resistance under fasteners or plates.
- Slip behavior if the design relies on composite action.
Easy example: Two products with similar bending strength can behave differently at the fastener line. A product with lower bearing capacity may require different edge distances or fastener spacing to meet the same design load.
Nonstructural Applications Performance Targets
Nonstructural targets emphasize appearance, dimensional stability, and safety under everyday use.
Dimensional Stability and Surface Behavior
For wall panels, soffits, and cladding:
- Thickness swelling and dimensional change under humidity.
- Warping and bowing limits to prevent gaps and misalignment.
- Surface integrity such as delamination resistance at edges.
Easy example: A panel can meet strength requirements but still cause visible waviness if its moisture-driven swelling is not controlled. That’s a serviceability failure, just not a structural one.
Fire and Smoke Performance Targets
Even when an element is “nonstructural,” it can still be part of a rated assembly. Targets should therefore specify:
- Fire classification for the material system.
- Heat release and smoke behavior as required by the assembly design.
Easy example: A decorative interior panel may be thin and not load-bearing, but it still must meet the assembly’s fire criteria because occupants experience smoke and heat, not just structural collapse.
Acoustic and Thermal Targets
For partitions, ceilings, and floor toppings:
- Sound transmission loss and impact sound performance where relevant.
- Thermal conductivity or assembly-level thermal behavior when insulation interfaces matter.
Easy example: A lightweight panel may be easy to install, but if it is too flexible, it can reduce sound isolation. Acoustic targets prevent “it looks fine” outcomes.
Mind Map: Performance Targets by Application
Turning Targets into Usable Requirements
To avoid ambiguity, each target should include: the property, the test method basis, the conditioning state, and the acceptance criterion. For example, “moisture-conditioned bending strength” is not the same as “as-manufactured bending strength,” and inspectors need to know which one applies.
Practical example: If a product is used in a humid interior, specify the conditioning state used to derive design values and require that production lots meet the same conditioning-based property range. That keeps design assumptions and quality control from drifting apart.
Quick Checklist for Selecting the Right Targets
- Identify whether the element is governed by strength or serviceability.
- Match targets to exposure class and define conditioning states.
- Include connection targets when joints control performance.
- For nonstructural elements, prioritize dimensional stability, fire/assembly behavior, and comfort-related properties.
- Write acceptance criteria so they can be verified without interpretation gymnastics.
1.4 Standards Landscape for Materials Testing and Product Classification
Standards for synthetic timber and engineered wood alternatives exist to answer three practical questions: What is the material, how does it behave, and how can a buyer verify it without guessing. The landscape is layered, so the best way to navigate it is from test methods to product rules, then to how those results become usable documentation.
Foundational Building Blocks
Test methods describe how to measure properties. They specify specimen preparation, conditioning, loading rates, temperature and humidity, and acceptance calculations. For example, a bending test is not just “bend a beam”; it defines span length, moisture conditioning, and how failure is recorded.
Product standards translate test results into categories or requirements. They answer “What must a manufacturer demonstrate to claim this grade?” For instance, a panel might be classified for structural use only if it meets minimum stiffness and strength thresholds under defined conditioning.
System or assembly standards go one level higher. They define performance of a wall, floor, or roof assembly, including how materials interact with fasteners, adhesives, membranes, and air/water layers. This matters because a synthetic timber product can test well as a standalone panel but still fail an assembly requirement if installation details are wrong.
Mind Map: Standards Flow from Measurement to Classification
How Testing Becomes Classification
A common workflow looks like this: a manufacturer runs standardized tests on representative specimens, then uses the results to assign declared values and grades. The key is that the declared values are tied to the same conditioning and test setup used in the standard.
Easy example: Suppose a structural panel is tested for bending stiffness. If the standard requires conditioning at a specific relative humidity, but the product is later installed in a much wetter environment without moisture management, the real stiffness can drop. Standards prevent this mismatch by forcing consistency between test conditions and intended use conditions.
Conditioning and Moisture: The Quiet Gatekeeper
Moisture conditioning is often where projects go sideways. Standards typically define equilibrium moisture content targets or conditioning regimes before testing. For synthetic timber technologies, this is especially important because binders and polymer-modified components can respond differently than plain wood.
Easy example: Two labs test the same panel type. One conditions specimens to equilibrium at moderate humidity; the other uses a shorter conditioning time. Even if the test machines are identical, the measured stiffness and strength can differ because the material’s internal stresses and binder behavior are not the same.
Sampling, Variability, and Lot Acceptance
Standards rarely assume every piece is identical. They define sampling plans and how many specimens represent a production lot. They also specify how variability is handled when converting raw test results into characteristic values.
Easy example: If a standard requires a minimum number of specimens per lot, a manufacturer cannot “cherry-pick” the best boards. The classification is based on the distribution, not the headline result.
Documentation and Traceability
Product classification becomes useful only when it is traceable. Standards typically require test reports, declared performance values, and identification of production batches. On a jobsite, this supports verification that the installed product matches the specified grade.
Easy example: A project specification calls for a panel grade with a defined bending stiffness. During inspection, the contractor checks batch documentation and markings to confirm the delivered product corresponds to that grade.
Third-Party Verification and Project Submittals
Many standards frameworks include third-party assessment or certification to reduce the risk of inconsistent manufacturing. Even when third-party schemes are not mandatory, project submittals usually require evidence: test reports, certificates, and quality control statements.
Easy example: A structural engineer reviews a submittal package and looks for declared values tied to the correct test method and conditioning regime. If the documentation references a different conditioning standard, the engineer can request clarification or additional evidence.
Practical Checklist for Navigating the Standards
- Identify the intended application level: material, product, or assembly.
- Confirm the test method family matches the declared property type.
- Verify conditioning requirements are consistent with the product’s declared use environment.
- Check sampling and lot acceptance rules to understand how results represent production.
- Ensure documentation and traceability link declared values to delivered batches.
This approach keeps the standards landscape from becoming a maze: you move from measurement rules to classification rules, then to the installation and documentation steps that make the numbers real.
1.5 Terminology for Moisture Behavior Fire Resistance and Durability
When people compare synthetic timber technologies, they often mix up terms that sound similar but describe different physics. This section standardizes the vocabulary so you can read test reports, design details, and failure descriptions without playing telephone.
Moisture Behavior Terms You Will See Everywhere
Moisture content (MC) is the amount of water in a material, usually expressed as a percentage of dry mass. A simple example: if a specimen weighs 110 g at test time and 100 g when oven-dried, its MC is 10%.
Equilibrium moisture content (EMC) is the MC a material reaches after it has been exposed long enough to a given temperature and relative humidity. EMC matters because many properties change with MC, but they stabilize once the material equilibrates.
Hygroscopic moisture is water taken up by polar sites in the material matrix. In wood-based systems, this is the main driver of EMC. In polymer-modified or resin-rich composites, hygroscopic uptake may be smaller, but it is not always zero.
Liquid water absorption is water entering through cracks, edges, or capillary pathways. A practical example: a panel edge exposed to splash water can gain moisture faster than the same panel face because edges often have more direct pathways.
Capillary transport describes how liquid water moves through small pores and interfaces. If you have ever seen a paper towel wick water upward, you have the right mental model—just applied to engineered microstructures.
Moisture sorption isotherms are curves showing EMC versus relative humidity at a fixed temperature. They let you estimate EMC without waiting months for equilibrium.
Hygrothermal cycling means repeated wetting and drying (often with temperature changes). It is used to test durability because real buildings rarely sit at one humidity forever.
Fire Resistance Terms That Separate “Burning” from “Performing”
Fire resistance is the ability of an element to maintain required performance during a fire exposure, typically including load-bearing capacity, integrity, and insulation. It is not the same as “flammability.”
Integrity refers to whether the assembly prevents flames and hot gases from passing through. A door that stays closed during a test is an integrity-focused outcome.
Insulation is the ability to limit temperature rise on the unexposed side. Even if nothing passes through, a wall can fail insulation if the unexposed surface heats too much.
Load-bearing capacity is the structural performance under fire conditions. For timber-like materials, this often depends on charring behavior and residual strength.
Charring rate is how quickly the material surface converts to char under heat. A lower charring rate can improve fire performance, but it must be paired with structural verification.
Char layer is the protective surface residue that slows further heat penetration. In engineered systems, char formation can be influenced by resin chemistry, fiber architecture, and additives.
Heat release rate measures how quickly a material contributes to fire growth. Two materials can both “survive” a time period but differ greatly in how they feed the fire.
Smoke production is often reported as smoke density or smoke toxicity indicators depending on the test method. For buildings, smoke behavior is frequently the limiting factor for egress.
Durability Terms That Explain Why Failures Are Often Quiet
Durability is the ability to resist degradation over time under expected service conditions. It is not a single number; it is a bundle of mechanisms.
Biological resistance covers resistance to mold, decay, and insect-related damage. In moisture-managed designs, the goal is usually to prevent sustained wetness long enough for organisms to establish.
Freeze-thaw resistance is relevant where water can enter and then expand during freezing. Even if the material does not “rot,” repeated cycling can damage interfaces.
Delamination is separation between layers or phases, often driven by moisture gradients, adhesive behavior, or thermal stresses. A common example: if one side of a laminated element stays wetter, swelling can stress the bond line.
Creep is time-dependent deformation under sustained load. Moisture can accelerate creep in some composites by changing matrix stiffness and interfacial friction.
Fatigue is damage accumulation under repeated loading. In structural design, fatigue terminology helps distinguish “it bent once” from “it bent thousands of times.”
Accelerated conditioning is a test approach that uses controlled exposure conditions to speed up degradation mechanisms. The key is that the test must represent the same failure modes, not just produce damage quickly.
Mind Map: Moisture, Fire, and Durability Vocabulary
Integrated Examples That Tie the Terms Together
Example 1: Edge wetting and delamination risk. A wall panel installed with a poorly sealed edge can experience liquid water absorption and capillary transport into the laminate. As MC rises, swelling stresses the adhesive layer, increasing the chance of delamination. A durability test that uses hygrothermal cycling can reproduce this mechanism.
Example 2: Fire test interpretation without confusion. A product may show good integrity but weak insulation. If you only read the “pass/fail” for integrity, you might miss that the unexposed surface temperature exceeds limits. That is why fire resistance terminology separates integrity, insulation, and load-bearing capacity.
Example 3: Moisture conditioning before structural evaluation. If a specimen is tested for bending after being conditioned to a target EMC, the measured strength reflects service-relevant moisture. Without that conditioning step, the same material could appear stronger than it will be in the field.
Quick Terminology Checklist for Reading Reports
- Does the report state MC or EMC, and under what temperature and humidity?
- Are moisture exposures described as hygrothermal cycling or single-point conditioning?
- For fire, does it report integrity, insulation, and load-bearing capacity separately?
- For durability, does it identify the failure mechanism, such as delamination or biological degradation?
Using consistent terms turns test results into design inputs instead of confusing stories about what happened to a sample.
2. Raw Materials and Feedstock Preparation
2.1 Wood Residues and Cellulosic Feedstock Sources and Sorting
Engineered wood alternatives start with what you can reliably collect and consistently process. “Wood residue” is a practical umbrella term: it includes byproducts from sawmills, panel plants, demolition, and agricultural processing. The goal of this section is to turn that messy reality into a feedstock stream with predictable composition, moisture, and contamination levels.
Feedstock Categories and What They Imply
Sawmill residues typically include slabs, edgings, trimmings, and sawdust. These are often relatively clean and uniform in chemistry, but they can vary in particle size and moisture depending on storage. Panel-plant residues may include offcuts and trim from plywood, OSB, or MDF lines. These can be useful, but they may contain adhesive residues and different fiber furnish characteristics. Agricultural cellulosic feedstocks include straw, husks, stalks, and bagasse-like materials. They often have higher ash and silica content, which affects grinding energy and can influence binder performance.
Demolition-derived wood can be abundant, but it introduces the widest contamination range: coatings, preservatives, metals, and fasteners. If you use it, sorting becomes less of a “nice to have” and more of a safety and quality gate.
Sorting Objectives and Quality Gates
Sorting is not only about removing “bad” material. It also standardizes the “good” material so your manufacturing process behaves the same day after day.
A practical sorting plan targets five variables:
- Moisture level: Wet feedstock increases energy demand and can cause uneven drying before pressing or casting.
- Particle size distribution: Too many fines can raise dust handling issues and change resin demand.
- Contaminants: Metals, stones, plastics, and treated wood fragments can damage equipment or compromise performance.
- Chemical variability: Adhesive carryover, coatings, and extractives change how binders wet and cure.
- Density and bulk behavior: Inconsistent bulk density affects dosing accuracy and mat formation.
A simple example: if you are making a composite panel with a binder that needs good wetting, a feedstock stream with high extractives may require more binder to achieve the same bond quality. Sorting reduces that “binder tax.”
Source-to-Stream Mapping
Treat each source as a starting point, then define a “stream” that matches your process needs. For instance, sawmill residues can be split into a coarse stream (slabs and edgings) and a fine stream (sawdust). Coarse material may be better for certain strand or particle geometries, while fine material can be blended to tune density.
Agricultural residues are often handled as separate streams by crop type and pretreatment level. Straw and husks behave differently under grinding and can produce different dust characteristics.
Physical Sorting Methods and Their Roles
Most facilities use a layered approach:
- Screening separates by size and reduces fines or oversized pieces.
- Magnetic separation removes ferrous metals.
- Air classification can separate lighter contaminants and dust fractions.
- Optical or manual inspection catches coatings, plastics, and obvious treated wood pieces.
- Washing or wet screening is sometimes used for agricultural feedstocks to reduce ash and soil, but it adds water handling complexity.
A concrete example: a sawdust stream that contains occasional metal fragments can be protected by magnetic separation and then verified by periodic metal detection. This prevents “mystery failures” where a single contaminant ruins a batch.
Chemical and Adhesive Carryover Considerations
If residues come from panel plants, adhesive carryover can be beneficial or harmful depending on your binder system. Some adhesives may partially cure during your process, altering bond formation. Others can interfere with wetting or create brittle interphases.
A practical best practice is to characterize residue streams by simple batch tests: measure extractives or perform small-scale bonding trials to see whether the residue reduces or increases binder demand. Even a basic comparison—same binder dosage, different residue stream—often reveals whether adhesive carryover is helping or getting in the way.
Moisture Handling Before Sorting
Moisture affects sorting efficiency. Very wet material can blind screens and reduce separation performance. Very dry material increases dust and can lead to inconsistent dosing.
A straightforward approach is to standardize moisture as early as possible, then sort. For example, if you store residues outdoors, you can precondition them to a target moisture range before screening and classification. That reduces day-to-day variation in particle behavior.
Mind Map: Wood Residues and Sorting Logic
Example: Building a Two-Stream Sawmill Plan
Suppose you receive sawmill residues with variable moisture and particle size. You can create two streams:
- Stream A: coarse trimmings and edgings, screened to remove fines.
- Stream B: sawdust, air-classified to remove light contaminants.
Then you set moisture preconditioning to a consistent target before dosing. In production, you blend Streams A and B to hit a target density and mat formation behavior. If a metal contaminant appears, magnetic separation plus periodic metal detection prevents it from reaching the press.
This approach keeps the feedstock predictable, which makes downstream binder use, pressing parameters, and final panel quality easier to control.
2.2 Synthetic Binders Including Thermosets, Thermoplastics, and Hybrid Systems
Binders are the “glue logic” of synthetic timber technologies: they connect fibers, particles, strands, or lamellae into a load-bearing composite and also control water uptake, creep, and failure mode. A binder choice is never just about strength; it also sets how the material behaves when heated, wetted, or repeatedly loaded.
Foundations of Binder Function
A binder must wet the reinforcement so intimate contact forms during pressing or casting. It must then cure or solidify into a stable network that transfers stress across the interface. In practice, binder performance is judged by three linked outcomes: (1) bond strength at the microscopic interface, (2) dimensional stability under moisture cycles, and (3) long-term deformation under sustained load.
A helpful way to picture this is to separate “interface chemistry” from “bulk mechanics.” Interface chemistry governs whether fibers stay attached after water and temperature exposure. Bulk mechanics governs whether the composite resists bending without excessive creep.
Thermoset Binders
Thermosets cure into an infusible, crosslinked structure. Once cured, they do not soften again under typical service temperatures, which is why they are common in structural panels and boards.
How Thermosets Cure
Thermoset curing is usually driven by heat and time, sometimes with catalysts or hardeners. During pressing, viscosity drops enough for penetration and wetting, then crosslinking locks the structure in place. A practical best practice is to match press temperature and dwell time to the binder’s cure kinetics so the core reaches cure, not just the surface.
Failure Modes and What They Teach
Thermoset-bonded composites often fail by fiber pull-out or cohesive failure within the binder-rich region, depending on formulation and surface preparation. If you see brittle, sudden delamination after moisture exposure, it often indicates insufficient interfacial wetting or cure depth.
Example: Phenolic-Style Resin in a Wet-Exposure Panel
Imagine a particle board intended for a damp utility room. A phenolic-type thermoset binder can be formulated to resist water-driven bond weakening. In a simple quality check, you compare dry and conditioned shear strength of bonded specimens. If conditioned strength drops sharply, the binder system likely lacks adequate water resistance or the pressing schedule did not achieve full cure.
Thermoplastic Binders
Thermoplastics soften when heated and solidify when cooled. Their bonding relies on melt flow and interdiffusion at contact surfaces rather than permanent crosslinking.
Processing Implications
Because thermoplastics re-melt, processing must be controlled to avoid under-bonding (insufficient melt contact) or over-processing (excessive squeeze-out and starved interfaces). Cooling rate matters too: slow cooling can allow relaxation that reduces stiffness, while very fast cooling can trap stresses.
Failure Modes and What They Teach
Thermoplastic-bonded systems can show ductile failure with more energy absorption, but they may be more sensitive to creep under sustained load. If a beam deflects progressively under constant load, the binder’s glass transition behavior and molecular mobility are often involved.
Example: Polyolefin-Style Binder in a Dry-Use Composite
Consider a strand board for an interior ceiling where temperatures stay moderate. A thermoplastic binder can provide stable bonding during installation and service. A practical test is to compare short-term flexural stiffness with longer-term creep deflection. If creep is high, the binder may be too soft for the intended load duration.
Hybrid Systems
Hybrid binders combine thermoset and thermoplastic components to balance properties. The thermoset phase can provide dimensional stability and heat resistance, while the thermoplastic phase can improve toughness and reduce brittle cracking.
Why Hybrids Work in Real Composites
In a hybrid, the thermoplastic can act as a stress-relief phase, limiting crack propagation through the binder-rich regions. Meanwhile, the thermoset network maintains structural integrity after cure. The key is compatibility: phases must disperse well enough that the composite does not become a “two-material sandwich” with weak boundaries.
Example: Toughened Thermoset Binder for Edge-Sensitive Elements
Suppose you are making a board where edges chip during handling and installation. A hybrid binder can be tuned so the binder-rich regions resist microcracking. A simple check is to perform repeated edge impact or abrasion tests and compare crack initiation patterns between a pure thermoset and the hybrid formulation.
Mind Map: Binder Selection Logic
Practical Selection Checklist
Start with service conditions: moisture exposure, temperature range, and load duration. Then map those conditions to binder behavior: thermosets for stable heat resistance and reduced softening, thermoplastics for processable bonding with potential ductility, and hybrids when you need toughness without giving up dimensional stability.
Finally, verify with tests that mirror the failure you care about. If the concern is delamination, use conditioned bond strength checks. If the concern is long-term deformation, include creep or sustained-load deflection measurements. If the concern is handling damage, use edge impact or abrasion-style evaluations. The binder that looks best on dry strength alone is often not the binder that survives the job site’s reality.
2.3 Additives for Adhesion Water Resistance and Dimensional Stability
Additives are the small chemistry decisions that decide whether a panel behaves like a stable building material or like a science fair experiment. In engineered wood alternatives, they typically serve three jobs: improve bonding at the interface, slow water uptake, and reduce dimensional swings when humidity changes.
Adhesion Foundations for Composite Interfaces
Adhesion starts with surface contact and chemical compatibility. If the binder can wet the wood particles or fibers, it can form a continuous film that transfers stress. Additives that support adhesion usually fall into three practical categories: coupling agents, wetting promoters, and resin modifiers.
Coupling agents act like translators between dissimilar surfaces. For example, a silane-type coupling agent can improve bonding between inorganic fillers and organic binders by creating a more compatible interphase. In practice, this means fewer weak zones at the particle surface, which shows up as higher dry and wet shear strength.
Wetting promoters reduce the binder’s tendency to bead on the substrate. A simple way to see why this matters: if binder spreads poorly, it leaves dry spots that later become crack starters under load.
Resin modifiers tune the binder’s flexibility and crosslink density. A slightly more flexible network can reduce stress concentration at the interface when the panel expands and contracts. The goal is not “softness everywhere,” but enough interfacial compliance to avoid debonding.
Water Resistance Mechanisms That Actually Matter
Water resistance is not one mechanism; it is a set of barriers and rate controls. Additives help by reducing capillary transport, lowering binder permeability, and improving the stability of the bond line.
Hydrophobic agents can reduce water penetration by lowering surface energy. When applied appropriately, they encourage water to form droplets rather than wicking along pores. This is especially helpful for particle-based systems where voids and pathways are abundant.
Water-resistant binders and co-binders reduce swelling by limiting how much water can enter the polymer network. If the binder swells less, the interface experiences less stress during wetting cycles.
Mineral fillers and reactive additives can also contribute by densifying the matrix. A denser matrix shortens diffusion paths, so water takes longer to reach the bond line.
A practical example: consider two panels made with the same resin and pressing schedule. If one includes a hydrophobic additive and the other does not, the hydrophobic panel typically shows lower thickness swelling after a standardized soak test because less water reaches the binder-rich regions.
Dimensional Stability Through Swelling Control
Dimensional stability is the outcome of swelling control plus stress management. Additives influence both.
Swelling control comes from reducing the amount of water that can be absorbed and from limiting how strongly the binder and wood components respond to that water. Crosslinking modifiers, hydrophobic components, and filler systems all contribute.
Stress management addresses what happens after swelling begins. Even if water uptake is reduced, some swelling is inevitable. Additives that improve interfacial toughness help the bond line resist crack growth. Think of it as allowing controlled deformation rather than forcing brittle separation.
Another practical example: in a layered element, the outer layers often face more moisture exposure. Using additives that are effective at the surface region can reduce edge swelling, which helps prevent curling. This is why formulation and placement matter, not just total dosage.
Mind Map: Additives and Their Roles
Example Formulation Logic for a Practical Panel
Start with the failure mode you want to prevent. If wet shear strength is low, prioritize adhesion support: coupling agents and wetting promoters. If thickness swelling is high, prioritize water resistance: hydrophobic additives and binder permeability control. If panels curl after moisture exposure, prioritize dimensional stability: surface-focused additive strategy and interfacial toughness.
A simple workflow for choosing additives is to run small-scale comparisons with the same pressing conditions. Measure dry strength, then repeat after a standardized water exposure. If strength drops mainly after wetting, the adhesion system needs attention. If strength stays but thickness swelling grows, the water barrier system needs attention. If both change, adjust both adhesion and swelling control together, because fixing only one side often shifts the problem rather than removing it.
2.4 Particle Fiber Strand and Lamella Preparation Methods
Particle fiber strand and lamella preparation is where “raw feedstock” turns into a predictable building block. The goal is simple: control geometry, cleanliness, and moisture so the later pressing, bonding, and forming steps behave consistently. If you’ve ever seen a panel with streaks or weak spots, the cause is often hiding here.
Foundational Inputs and What They Must Control
Start with three measurable inputs: particle or strand size distribution, surface cleanliness, and moisture content. Geometry affects packing density and resin coverage; cleanliness affects wetting and bond strength; moisture affects steam generation during pressing and can create internal delamination.
A practical way to think about preparation is to separate it into three stages: size reduction, surface conditioning, and classification. Size reduction creates the target form; surface conditioning prepares surfaces for bonding; classification ensures the final batch stays within a tight window.
Size Reduction Methods for Particles Strands and Lamellae
Particle Preparation
Particle production typically uses hammer mills or knife mills. Hammer mills are good for producing a broad distribution quickly, while knife mills can be tuned for narrower distributions. The best practice is to control screen size and rotor speed so you don’t over-crush. Over-crushing increases fines, which can raise resin demand and reduce permeability for steam escape.
Example: If a mill produces too many fines, you may see higher thickness swelling later because excess fines trap moisture and reduce effective drainage paths.
Strand Preparation
Strands are longer and more slender than particles, so they require controlled cutting. Common approaches include rotary cutting or flaking followed by strand shaping. Strand length and thickness should be consistent because they influence orientation during mat forming and the resulting bending stiffness.
Example: In a floor panel, strands that are too short behave more like particles, lowering stiffness and changing failure modes from fiber-dominated to matrix-dominated.
Lamella Preparation
Lamellae are thin layers, often produced by sawing, slicing, or controlled splitting. The key is maintaining thickness uniformity and minimizing edge tearing. Lamellae with rough, frayed edges can increase resin penetration but may also create weak boundary layers if bonding is inconsistent.
Example: If lamella thickness varies by more than the target tolerance, press pressure distribution becomes uneven, leading to localized under-bonding.
Surface Conditioning for Bonding Consistency
Surface conditioning aims to improve resin wetting and reduce contaminants. Contaminants include dust, waxy extractives, and residual bark. Conditioning can be mechanical (screening and air classification) and sometimes thermal or chemical, depending on the binder system.
A simple best practice is to remove fines and bark early. Even when the binder can “handle” some contamination, the bondline becomes less predictable. Consistency beats heroics.
Example: If bark content is high, you may observe reduced internal bond strength because bark surfaces resist wetting and can create resin-starved zones.
Moisture Conditioning and Equilibrium Management
Moisture content should be set to a target that matches the pressing schedule. Too wet: steam pressure can separate layers and create blisters. Too dry: resin may not cure properly through the intended heat transfer path, and dust generation can increase.
Moisture conditioning is often done using controlled drying followed by conditioning in a tempering environment. The “temper” step helps the interior moisture catch up with the surface.
Example: A strand batch dried aggressively may look dry on the outside but still contain moisture pockets, which later show up as localized delamination after pressing.
Classification and Batch Control
Classification is the quality gate that prevents a good process from being ruined by one bad batch. Use sieves, air classifiers, or density-based separation to control fines and oversized pieces.
For strands and lamellae, classification also supports mat uniformity. If one fraction dominates, orientation and packing density shift, changing both stiffness and dimensional stability.
Best practice: sample from multiple points in the feed stream, not just the outlet. Mills can produce gradients as wear changes.
Orientation and Mat-Forming Readiness
Preparation is not only about the material; it’s also about how it will behave in the mat. Strand and lamella geometry influences how layers lay down, how evenly resin spreads, and how air escapes during pressing.
A useful checklist before mat forming:
- Geometry within target ranges for length, thickness, and aspect ratio
- Moisture within the specified band
- Contaminant levels controlled through screening and bark removal
- No visible clumping or excessive dust
Example: If strands clump due to residual moisture or static, they can create voids that later become weak planes.
Mind Map: Particle Fiber Strand and Lamella Preparation
Worked Example: Diagnosing a Weak Bondline
Assume a composite panel shows low internal bond strength. The preparation log indicates the strand batch had higher fines than usual and slightly elevated moisture. Fines increase resin demand and reduce permeability, so steam escape becomes harder. Elevated moisture increases the chance of bondline separation during pressing.
Corrective actions follow the logic of the failure:
- Tighten classification to reduce fines.
- Adjust drying and tempering to bring moisture into the target band.
- Re-check contaminant removal so resin wetting returns to normal.
The point is not to “fix everything,” but to align the correction with the specific mechanism implied by the symptoms.
2.5 Quality Control for Contaminants Density and Moisture Content
Quality control here is about catching three things early: unwanted material (contaminants), incorrect mass distribution (density), and incorrect water content (moisture). Those three interact—water can change how contaminants behave, and density affects how moisture moves—so the checks are designed as a linked system rather than separate chores.
Foundational Concepts for What You Are Measuring
Start by defining the acceptance logic before testing. For contaminants, you need a rule for what counts as “foreign” and how much is tolerable. For density, you need a target range and a method that produces repeatable results. For moisture, you need a measurement method that matches the product’s intended service conditions.
A practical way to set this up is to map each property to a physical mechanism:
- Contaminants affect bonding, surface finish, and local strength.
- Density affects stiffness, dimensional stability, and void sensitivity.
- Moisture affects swelling, shrinkage, and adhesive performance.
Contaminants Control from Incoming Feedstock to Finished Panels
Contaminants control begins with incoming material screening. Create a simple classification: metal, plastics, stones, oversized wood pieces, and “unknowns.” Then define how you will detect each class.
A common best practice is layered screening:
- Visual and manual sorting at receiving.
- Mechanical separation such as magnets for metal and sieving for oversize.
- Process monitoring during production to catch drift, like increasing speck count on surfaces.
Example: If you see recurring black specks on a panel face, treat it as a process signal. Stop and inspect the feedstock stream for charred particles or plastic fragments, then verify whether the adhesive spread is being disrupted at those locations.
For finished products, contaminants are checked using sampling plans. Use a consistent sampling area and lighting conditions for surface inspection. For internal contaminants, rely on indirect indicators such as density anomalies or localized strength reductions from targeted tests.
Density Verification and Why It Must Be Measured the Same Way Every Time
Density is not just “heavier equals better.” It is a proxy for void content, compaction level, and binder distribution. If density is measured inconsistently, you will chase phantom problems.
Best practice is to measure density using a defined workflow:
- Condition the sample to a specified environment.
- Measure dimensions with a calibrated method.
- Weigh with a calibrated scale.
- Compute density from mass and volume.
Example: Two labs may both report density, but one measures thickness after trimming and the other before. That difference can shift density enough to trigger false nonconformance. Standardize the measurement stage.
Density control also benefits from process-linked checks. If density drops while press temperature stays constant, suspect compaction or mat formation issues. If density rises with stable moisture, suspect overfeeding or mat thickness drift.
Moisture Content Measurement and Conditioning Discipline
Moisture content is typically measured by oven-drying, but the key is discipline: sample representativeness and consistent drying parameters. Moisture varies across a mat, so a single grab sample can lie.
Best practice sampling:
- Take samples from multiple locations within a production batch.
- Combine or analyze separately depending on your control plan.
- Record the time between sampling and weighing so you can account for moisture change during handling.
Example: If samples are taken from the center and edges but only one location is dried, you may miss a moisture gradient. That gradient can later show up as warping or uneven bonding.
Integrated Acceptance Logic for Contaminants, Density, and Moisture
Treat the three checks as a decision tree. A simple approach is:
- If contaminants exceed limits, reject or rework regardless of density and moisture.
- If moisture is out of range, recondition or adjust process parameters before judging density.
- If density is out of range, investigate compaction and mat formation, then re-check moisture to rule out confounding.
This order prevents wasted effort. For instance, low density caused by high moisture should not be “fixed” by changing feed rate without first addressing moisture.
Mind Map: Quality Control Workflow for Contaminants Density and Moisture
Example: A Complete Batch Check with Clear Actions
Suppose a batch fails on density and moisture. Start by checking whether contaminants are within limits using the surface sampling results. If contaminants are acceptable, verify moisture measurement records: confirm sample locations and drying parameters. If moisture is high, recondition or adjust upstream drying and press timing, then re-run density checks after moisture is corrected. If moisture is within range but density remains low, focus on compaction and mat formation, including mat thickness and press pressure consistency.
Practical Recordkeeping That Prevents Repeating Mistakes
Keep records that connect cause to measurement. For each batch, log calibration status for scales and thickness measurement tools, the sampling locations used for moisture, and the inspection area used for contaminants. When a nonconformance occurs, the goal is not to assign blame; it is to identify which step changed and which measurement method could have drifted.
3. Manufacturing Processes for Engineered Wood Alternatives
3.1 Panel Manufacturing Routes Including Pressing and Casting
Panel manufacturing is where engineered wood alternatives stop being a material idea and start behaving like a building product. Two dominant routes—pressing and casting—share the same goal: convert prepared feedstock into a stable, dimensionally consistent panel with predictable properties. The difference is how the material is compacted, shaped, and cured.
Foundational Concepts for Panel Formation
A panel route must manage four things in a controlled order: (1) feedstock preparation, (2) forming into a mat or mold fill, (3) consolidation under pressure or controlled flow, and (4) curing or solidification. In pressing routes, consolidation is driven mainly by mechanical pressure applied through platens. In casting routes, consolidation is driven mainly by flow into a mold and solidification of a binder system, with pressure used more selectively.
A practical way to think about it is to track three “states”: loose (particles or fibers), packed (mat density established), and locked (binder cured or polymer solidified). If you can describe how your process moves material from loose to locked, you can troubleshoot it.
Pressing Routes Including Hot Press and Cold Press
Pressing routes typically start with a mat formed from particles, fibers, strands, or lamellae. The mat is laid to target thickness and then fed into a press where heat and pressure act together.
Hot Pressing for Thermoset Binder Systems
Hot pressing is common when the binder is thermosetting and needs heat to cure. The sequence is straightforward: mat formation, preheating if needed, pressing to reach target density, and holding long enough for binder cure. A key best practice is to control mat moisture before pressing because moisture affects viscosity, steam generation, and final density.
Example: A plant targets a nominal 18 mm panel. If the mat moisture is too high, steam can create internal voids and thickness variation. If moisture is too low, binder may not spread and cure uniformly, leading to weak bonding near the surfaces.
Cold Pressing for Thermoplastic or Pre-Cured Systems
Cold pressing relies less on heat-driven cure and more on mechanical consolidation. When thermoplastic binders are used, heat may be applied in a separate step after pressing. Cold pressing is often chosen when heat exposure must be limited during consolidation.
Example: For a composite panel with a moisture-sensitive additive, operators may cold-press to set density, then apply controlled heating to soften and fuse the binder without overheating the entire mat.
Pressing Parameters That Actually Matter
Three parameters dominate outcomes: pressure profile, temperature profile, and dwell time. Pressure profile matters because mats compress nonlinearly; early pressure may rearrange particles, while later pressure densifies. Temperature profile matters because binder cure and viscosity change with heat. Dwell time matters because under-cure can look fine on day one and fail under long-term loading.
A simple quality check is to compare density and thickness uniformity across the panel. If density is high but bonding is weak, the binder cure path is likely incomplete. If bonding is fine but density varies, the mat formation or pressure distribution is the likely culprit.
Casting Routes Including Mold Filling and Controlled Solidification
Casting routes begin with a formulation that can flow and wet the reinforcement. The “mat” is replaced by a mixture that fills a mold or forms a layer on a moving surface.
Casting with Fiber-Reinforced Slurries
In fiber-reinforced casting, fibers are dispersed in a binder system so they can orient and distribute. The process must prevent fiber clumping and ensure consistent wetting. After filling, solidification locks the structure.
Example: If fibers clump, you get local zones with higher fiber content and lower binder coverage. Those zones may show higher stiffness but lower impact resistance because the binder-rich regions that normally absorb energy are missing.
Casting with Particle-Filled Formulations
Particle-filled casting can produce smooth surfaces and tight thickness control. The challenge is maintaining particle dispersion so the mixture does not segregate during filling.
Example: During mold filling, if the mixture is too thin, heavier particles can settle before solidification, creating a dense bottom layer and a weaker top layer.
Solidification Control
Solidification can be driven by curing chemistry, cooling, or both. The best practice is to control the thermal or chemical environment uniformly across the mold. Uneven solidification creates internal stresses and warping.
A practical verification is to measure warpage and internal density gradients. If warpage increases with faster solidification, the process likely introduces thermal gradients or uneven cure rates.
Integrated Mind Map for Pressing and Casting
Mind Map: Panel Manufacturing Routes
Example Workflow for Choosing a Route
A useful decision logic is to match the route to the binder behavior and the desired panel surface. If the binder needs heat to cure and the product tolerates mat-based forming, pressing is a natural fit. If the formulation can flow and you need tight thickness control with smooth surfaces, casting can be advantageous.
Example: A manufacturer producing a structural panel with consistent density across the face may prefer hot pressing for its controlled consolidation. A manufacturer producing a decorative or coating-ready panel surface may prefer casting to reduce surface roughness, while still verifying bonding and warpage through routine measurements.
Both routes succeed when the process is treated as a sequence of controlled state changes rather than a single “press or pour” step. When you can point to where loose material becomes packed and where it becomes locked, troubleshooting becomes specific instead of guessy.
3.2 Lamination and Assembly Methods for Composite Timber Elements
Composite timber elements rely on controlled layering: the right materials, placed in the right order, with the right interface behavior. Lamination is where performance is either earned or lost, because most failure modes start at interfaces—where loads transfer, moisture moves, and heat or fire effects concentrate.
Foundational Concepts of Layering
Start with the purpose of each layer. In practice, a composite timber element often combines a structural core with surface layers that carry bending compression or tension, resist abrasion, and stabilize moisture movement. When you plan the layup, treat it like a load path problem rather than a stacking problem.
A simple rule for beginners: if the element will bend, the outer layers matter most; if it will shear, the interface and core thickness matter most. For example, in a beam made from thin lamellae, the bending stresses peak at the top and bottom surfaces, while shear stresses peak near the neutral axis. That means you should prioritize consistent adhesive coverage and lamella alignment where shear transfer is critical.
Layup Design and Orientation
Layup design begins with orientation. Lamella grain direction, fiber alignment, and any strand or particle orientation affect stiffness and splitting resistance. Even when the product is engineered to be quasi-isotropic, the manufacturing process can introduce directional differences.
A practical best practice is to define a layup “stack map” before production. The stack map lists layer type, thickness, orientation, and adhesive system. For instance, a common approach for a composite panel is alternating lamella orientation in adjacent layers to reduce warping and improve dimensional stability. If you do this, keep the adhesive strategy consistent across interfaces so you do not create weak seams.
Interface Engineering and Adhesive Application
Adhesive selection and application are inseparable from lamination quality. Adhesives must wet the surfaces, provide adequate bondline thickness, and cure reliably under the press schedule.
Interface engineering includes:
- Surface preparation: remove dust and contaminants; ensure the surface profile supports wetting.
- Bondline thickness control: too thin can starve the joint; too thick can reduce strength and increase creep.
- Coverage uniformity: gaps become stress concentrators.
Example: Suppose you are laminating thin veneers for a curved element. If the adhesive is applied too sparsely, the first contact points carry load early, and the remaining area bonds later under uneven pressure. The result is a stiffness drop and a higher risk of delamination under cyclic loading.
Pressing Methods and Pressure-Time Logic
Pressing is not just “apply pressure and wait.” It is a pressure-time logic that matches adhesive chemistry and wood deformation.
Common pressing approaches include:
- Hot pressing: accelerates cure and can improve early bond strength.
- Cold pressing: relies on ambient or controlled conditions; often used when heat is undesirable.
- Vacuum-assisted pressing: helps draw layers into contact, useful for uneven substrates.
A systematic way to set the press schedule is to define three phases: initial wetting and contact, curing under controlled temperature or time, and a stabilization phase to reduce spring-back. For example, if you skip stabilization, the element may meet strength targets in the press but show higher warping after release.
Alignment, Clamping, and Gap Prevention
Lamination quality depends on keeping layers aligned during press closure. Misalignment can create local thickness variations and uneven adhesive distribution.
Best practices:
- Use alignment jigs or stops that control lateral position.
- Apply clamping pressure gradually to avoid “skating” layers.
- Monitor for edge squeeze-out patterns; consistent squeeze-out suggests uniform bondline.
Example: In a beam with multiple lamella layers, a small step at one edge can propagate into a bondline thickness mismatch across the length. That mismatch can shift the neutral axis slightly and increase local shear stress, which is exactly where you do not want surprises.
Curing, Conditioning, and Release
After pressing, curing continues until the adhesive reaches sufficient conversion and strength. Release too early can reduce bond strength and increase creep susceptibility.
Conditioning matters because moisture gradients drive dimensional change. A controlled conditioning step brings the element closer to service moisture conditions before machining or installation.
Example: If you laminate a panel and immediately machine it while it still has a moisture gradient, you may create internal stresses that later show up as edge checking or warping. Waiting for moisture equalization reduces that risk.
Advanced Assembly Strategies for Composite Elements
Some composite timber elements require more than a single lamination step.
- Multi-stage lamination: build sub-assemblies first, then bond them together. This can improve control when long elements are hard to press as a single unit.
- Hybrid interfaces: combine adhesive bonding with mechanical features such as dowels or splines to manage shear transfer and reduce reliance on bondline alone.
- Curved or cambered elements: use controlled forming molds and staged pressure to maintain curvature without crushing fibers.
Example: For a curved roof member, staged pressure prevents fiber buckling in the compression side. If you clamp all at once, the outer layers may reach their forming limit early, leaving the inner layers under-formed.
Mind Map: Lamination and Assembly Methods
Practical Example Workflow
A reliable workflow ties the steps together: define the stack map, prepare surfaces, apply adhesive with controlled bondline thickness, assemble with alignment jigs, press using a schedule matched to the adhesive, stabilize after release, condition to reduce moisture gradients, and only then machine or install.
If you want one concrete check that catches many problems early, use bondline consistency indicators. For instance, consistent squeeze-out at edges and uniform thickness measurements across the panel are strong signals that the interface is behaving as intended. When those signals are inconsistent, it is usually faster to correct the process before curing than to repair the element after it has already “learned” the wrong shape.
3.3 Extrusion and Profile Forming for Board and Beam Components
Extrusion and profile forming turn a prepared mix—wood particles or fibers plus binders and additives—into a continuous shape with predictable geometry. The core idea is simple: force the material through a die so it exits with the cross-section you designed, then control cooling, curing, and post-processing so the part keeps its shape.
Foundational Concepts That Make the Process Work
Material State for Extrusion
Extrusion needs a feed that can flow under pressure without separating. In practice, that means controlling moisture, particle size distribution, and binder viscosity. A helpful rule of thumb is to treat the mix like dough: too dry and it won’t consolidate; too wet and it won’t hold together when pressure drops.
Example: If a board mix shows streaks after extrusion, it often means binder distribution is uneven. A practical fix is to adjust mixing time and binder spray pattern so every particle sees binder, not just the ones near the surface.
Die Geometry and Flow Paths
The die defines the cross-section and strongly influences internal density. Sharp corners can trap material and create density gradients. Smooth transitions help the flow “settle” into the final shape.
Example: For a beam with a T-shaped profile, a die with abrupt web-to-flange transitions can create a low-density zone at the junction. Adding a gradual radius in the die reduces that risk and improves uniformity.
Consolidation and Density Control
Extrusion compacts the mix as it passes through the die. Your target density is not just a number; it drives stiffness, screw withdrawal, and dimensional stability. Density also affects how heat and moisture move through the part.
Example: If the extruded board feels rigid but later warps, the density may be high near the surface and low in the core. That pattern can come from uneven compaction or inconsistent feed rate.
Process Flow from Feed to Finished Profile
Feed Preparation and Metering
Start with consistent feedstock. Use screening to remove oversized particles and blending to stabilize the particle size distribution. Metering controls the pressure and residence time.
Best practice: Calibrate the feed system so the extruder sees steady mass flow. Even small fluctuations can cause thickness variation along the length.
Compounding and Binder Activation
Binders may require heat, moisture, or both to reach the right viscosity and cure behavior. Additives such as lubricants can reduce die wear, while coupling agents can improve adhesion between wood and binder.
Example: If the profile shows surface cracking, binder activation may be incomplete. Increasing binder temperature or adjusting cure conditions can improve surface integrity.
Extrusion Through the Die
The die is where geometry becomes reality. Maintain stable extrusion pressure and temperature so the material exits at a consistent state. Monitor die wear because worn dies can subtly change dimensions.
Best practice: Track die pressure and product dimensions together. If pressure rises while dimensions drift, the die may be clogging or wearing.
Cooling and Shaping
Cooling locks in the profile. For thermoset systems, curing may continue after extrusion, so cooling must be coordinated with cure kinetics. For thermoplastic systems, cooling rate affects internal stress.
Example: A beam profile that twists after cutting often experienced uneven cooling. Using controlled air or water cooling across the cross-section can reduce twist.
Cutting, Conditioning, and Post-Processing
Extruded parts are typically cut to length after they reach handling strength. Conditioning equalizes moisture and temperature so the part doesn’t “move” after installation.
Best practice: Perform a short conditioning period before final inspection. It catches dimensional issues early, when corrections are still practical.
Advanced Details That Prevent Common Failures
Density Gradients and How to Fix Them
Density gradients come from flow nonuniformity, die design, or inconsistent feed. They show up as uneven stiffness and unpredictable screw performance.
Example: If screws strip near the surface but hold in the core, the surface may be under-compacted. Adjusting die land length or feed moisture can improve surface consolidation.
Surface Quality and Die Maintenance
Surface defects include roughness, streaks, and edge tearing. These often trace back to die cleanliness, lubrication balance, or binder distribution.
Best practice: Establish a die cleaning schedule based on observed defect onset rather than calendar time.
Dimensional Tolerances and Springback
Profiles can change after extrusion due to residual stresses and curing shrinkage. Tuning die dimensions to account for springback is common, but it must be validated with measurements.
Example: If the flange width consistently measures 1–2 mm under target after conditioning, adjust die dimensions or curing conditions and verify with a controlled run.
Mind Map: Extrusion and Profile Forming for Board and Beam Components
Example: Designing a Simple Extruded Beam Profile
A practical beam profile might include a web for bending resistance and flanges for lateral stability. Start by choosing a cross-section that supports the expected load path, then design the die with smooth transitions at the web-to-flange junction. During production, keep extrusion pressure steady and use uniform cooling so the web and flanges reach handling strength at similar times. After cutting, condition the parts before final dimensional checks; if flange width drifts, correct die dimensions or cure settings and re-validate with a short production run.
3.4 Adhesive Application and Curing Protocols
Adhesives turn separate wood-based parts into a single load path, but only if the bond line is consistent. The goal of this section is simple: control surface condition, adhesive placement, bond-line thickness, and curing conditions so the final element meets the design strength and durability assumptions.
Adhesive Selection Inputs for Application
Start with the adhesive system’s intended bond line and curing method. Thermoset resins typically require heat or time at temperature, while some thermoplastics rely on controlled cooling. Before any application, confirm the adhesive viscosity range for the chosen spread method; a “works in the lab” viscosity that is too thick on the shop floor often creates starved joints.
A practical check is to define an application window: acceptable viscosity, open time, and target spread rate. For example, if the open time is 6 minutes at 20°C, then your layup and pressing sequence must reliably bring parts into contact within that window.
Surface Preparation That Actually Matters
Adhesive performance is dominated by the bond line, not the adhesive label. Surface preparation should aim for clean, properly wetted surfaces.
- Dust and fines: Remove loose particles; they act like tiny bond-line spacers.
- Moisture control: Too much moisture can interfere with cure and reduce wetting. Too little can increase adhesive penetration unpredictably.
- Temperature conditioning: Cold substrates can shorten effective open time by accelerating viscosity changes.
Example: In a particle-based panel line, a quick visual target is uniform wetting without dry patches. If you see “skips” where adhesive beads and fails to spread, adjust roller pressure, feed rate, or substrate temperature.
Adhesive Application Methods and Their Failure Modes
Common application methods include roller coating, curtain coating, spray, and bead dispensing.
- Roller coating: Good for consistent spread rates; failure often comes from roller wear or uneven substrate thickness.
- Curtain coating: Useful for vertical or controlled flow; failure often comes from air entrainment and uneven coverage.
- Spray: Flexible but sensitive to operator settings; failure often comes from overspray and dry overshoot.
- Bead dispensing: Works for targeted joints; failure often comes from bead collapse that creates variable bond-line thickness.
A systematic approach is to measure spread rate during start-up and after any equipment adjustment. Record the mass applied per unit area and compare it to the target spread rate used in design assumptions.
Bond-Line Thickness Control
Bond-line thickness is a strength lever. Too thin can starve the interface; too thick can reduce effective stiffness and increase creep.
Control thickness using:
- calibrated applicator gap or roller settings
- controlled press pressure and platen parallelism
- spacer or layup jigs where geometry is tricky
Example: If a beam lamination shows higher variability in shear strength, check whether bond-line thickness is drifting with lamella thickness variation. Even a small thickness shift can change the cure profile and final adhesive distribution.
Layup Timing and Open Time Management
Open time is the interval from adhesive application to part contact. Manage it by sequencing:
- apply adhesive to the first set
- stage the mating parts within a defined travel path
- close the press promptly
If you must pause, treat it as a process change. Rework rules should be defined: for instance, whether to scrape and reapply or discard parts when open time is exceeded.
Curing Protocols for Consistent Strength
Curing is not just “wait until it hardens.” It is a controlled transformation that depends on temperature, time, and pressure.
Key controls:
- Press temperature: verify platen temperature stability, not just setpoint.
- Cure time: confirm it matches the adhesive’s required dwell time at the actual bond-line temperature.
- Pressure maintenance: ensure pressure is applied during the cure phase needed for wetting and squeeze-out control.
- Ventilation and exhaust: manage fumes and prevent condensation on bond surfaces.
A simple shop-floor method is to use a curing log that records platen temperature, line speed, and dwell time for each batch. If you see strength drift, the log often points to the exact deviation.
Squeeze-Out, Starved Joints, and Visual Acceptance
Squeeze-out is a useful indicator when interpreted correctly.
- Healthy squeeze-out: uniform, limited excess that confirms wetting and pressure.
- Starved joints: dry-looking edges, minimal squeeze-out, or visible gaps.
- Over-squeeze: excessive squeeze-out can indicate too much pressure or too low viscosity, potentially thinning the bond line.
Example: During start-up, run a short trial and cut a sample after cure. Inspect bond-line continuity and measure thickness at several locations. Use the results to set press pressure and applicator settings.
Mind Map: Adhesive Application and Curing Protocols
Example: Start-Up Protocol for a Lamination Line
- Confirm adhesive viscosity in the application tank.
- Calibrate spread rate by weighing a known area or using a controlled test strip.
- Condition substrates to the target temperature and moisture range.
- Apply adhesive, stage mating parts, and close the press within open time.
- Set press temperature and dwell time from the curing requirement.
- After cure, cut test coupons and inspect bond-line continuity and thickness.
- Lock settings only after results match the acceptance criteria.
This sequence prevents the most common “it looked fine but it failed” outcomes: starved joints from late layup, inconsistent thickness from mis-set applicators, and cure variability from unverified platen temperature.
3.5 Process Control for Thickness Uniformity Surface Finish and Yield
Thickness uniformity, surface finish, and yield are linked by the same physics: how material flows, how heat and pressure distribute, and how much variation you allow before it becomes a structural or aesthetic problem. Good control starts with measurable targets, then uses feedback loops that catch drift early—before the press, extruder, or casting line turns “slightly off” into “consistently off.”
Foundational Targets and What They Mean in Practice
Set three categories of targets: dimensional, surface, and production efficiency.
- Dimensional targets: thickness tolerance across the panel or board, plus local variation limits near edges and corners. For example, if a floor panel must fit a tongue-and-groove system, edge thickness variation matters more than the center.
- Surface targets: roughness range, waviness, and defect limits such as telegraphing from mat lines or imprinting from press plates.
- Yield targets: usable output per batch or per shift, accounting for trimming loss, rework, and scrap.
A practical rule: choose tolerances that match the downstream process. If machining removes 1 mm, thickness variation smaller than that may not matter; if it removes 0.2 mm, it matters a lot.
Thickness Uniformity Control from Material to Press
Thickness variation usually comes from one of four sources: feed mass variation, mat or charge distribution, compression behavior, and thermal gradients.
-
Feed mass and distribution
- Weighing systems should be calibrated against the actual material flow rate, not just nominal settings.
- Example: If a strand-based mat is fed by a screw, a worn screw flight can reduce flow at the end of a run. The result is a thinner strip that repeats every time the screw reaches the same wear state.
-
Preform geometry
- Control mat thickness before pressing using scanning or mechanical gauges at multiple points.
- Example: If the preform is thicker at the center, the press may “overwork” the center, increasing local density and causing springback that later shows up as waviness.
-
Compression and springback
- Track press closing force and platen temperature together. A cooler platen can make the surface set faster while the core still relaxes, increasing thickness scatter.
- Example: During a morning start-up, platen temperature may lag. The first panels can be thicker at the edges because the core compresses more while the surface skins early.
-
Thermal gradients
- Use thermocouples or infrared mapping to confirm uniform heating across the platen face.
- Example: A hot spot near one corner can reduce viscosity locally, letting material flow more and creating a slight “dish” after release.
Surface Finish Control Without Guesswork
Surface finish is controlled by how the surface layer forms and how it releases from the platen or mold.
- Surface layer formation: ensure binder distribution and moisture or carrier content are consistent at the forming stage.
- Example: If the top layer has less binder, it may not wet the fibers or particles fully, producing a dry, rough surface even when thickness is correct.
- Platen or mold condition: monitor surface cleanliness, wear, and release agent application.
- Example: Excess release agent can cause localized sheen differences and streaks that look like “ghost lines” after machining.
- Pressure profile: avoid sudden pressure ramps that can trap air and create pinholes.
- Example: A fast ramp can compress the surface quickly, trapping voids that later expand into small craters.
Measure surface finish using a consistent method and location pattern. If you only test the center, you may miss edge defects caused by uneven release or airflow.
Yield Control Through Loss Accounting and Process Stability
Yield is not just “how many panels you make.” It’s how much you keep after trimming, rework, and scrap.
- Define yield loss categories: thickness out-of-tolerance, surface defects, delamination risk indicators, and machining scrap.
- Link losses to process variables: thickness failures often correlate with feed distribution or platen temperature; surface failures often correlate with binder distribution or platen condition.
- Use run charts: track defect rates by shift and by time since maintenance.
- Example: If surface roughness spikes after a platen cleaning cycle, the cause may be residue or altered release agent coverage.
A stable process reduces variation, which reduces the need for conservative trimming. That’s where yield improves without changing the product.
Mind Map: Process Control Logic for Thickness, Surface, and Yield
Example: One-Day Control Plan for a Pressed Panel Line
Start with a baseline run at steady feed rate and verified platen temperature. During the first 30 minutes, sample thickness at center and corners and record surface roughness at the same grid points. If thickness at corners drifts high while center stays stable, check preform distribution and edge airflow or mat thickness. If surface roughness worsens while thickness remains within tolerance, focus on binder distribution and platen cleanliness rather than press force. At the end of the shift, summarize yield losses by category and compare them to the logged variables; the goal is not to “fix everything,” but to connect each loss type to the most likely control lever.
Advanced Details That Prevent Recurring Variation
- Maintenance timing as a control variable: track how long since platen resurfacing or release system calibration; treat it like a process parameter.
- Calibration cadence: verify scales, thickness gauges, and temperature sensors on a schedule tied to usage, not just calendar time.
- Sampling strategy: use a spatial pattern that matches where defects appear. If edge defects are common, include edge points in every sampling plan.
When thickness, surface, and yield are managed together, the line stops trading one problem for another. You get parts that fit, look consistent, and waste less material—without relying on heroic operator judgment.
4. Structural Design Properties and Testing Methods
4.1 Mechanical Property Determination for Bending, Tension, and Compression
Mechanical properties for synthetic timber and engineered wood alternatives are usually established through controlled lab tests that convert measured loads and deformations into material parameters. The key is consistency: specimen geometry, conditioning, loading rate, instrumentation, and data reduction must match the intended design use. A good rule of thumb is to treat every test as a mini production line for numbers—if the process is stable, the results become comparable.
Foundations for Interpreting Test Results
Start with what the machine actually measures. A load cell gives force, while displacement transducers or strain gauges provide deformation. From these, you compute stress and strain using the specimen’s cross-sectional area and gauge length. For bending, you also need the span and moment arm. For tension and compression, you need grip alignment and a way to avoid eccentric loading.
Before any mechanical testing, specimens should be conditioned to a defined moisture state because engineered wood alternatives can change stiffness and strength with moisture. If your product is intended for interior service, conditioning to a representative equilibrium moisture content reduces scatter. If you skip conditioning, you may still get results, but they won’t map cleanly to design assumptions.
Specimen Geometry and Preparation
Use standardized specimen dimensions whenever possible. For bending, common geometries include beams with a defined width, thickness, and span-to-depth ratio. For tension, dog-bone or tabbed specimens help distribute load and reduce premature failure at grips. For compression, short blocks or cylinders may be used, but alignment is critical to prevent buckling from dominating the response.
Preparation details matter more than they sound. Surface roughness affects strain gauge bonding and local stress concentrations. Edge damage can trigger early cracking in brittle or partially brittle systems. A practical approach is to inspect each specimen visually and reject those with obvious defects that exceed your manufacturing quality thresholds.
Bending Testing for Flexural Properties
Bending tests typically target flexural strength and modulus of elasticity. In a three-point bending setup, the load is applied at midspan, producing a clear bending moment region. In a four-point setup, a constant moment region reduces the influence of shear deformation and improves the quality of modulus calculations.
Data reduction follows a consistent chain:
- Measure load versus midspan deflection (or curvature).
- Convert deflection to bending strain using beam theory.
- Compute flexural stress at the extreme fiber.
- Determine modulus from the linear portion of the stress–strain curve.
A concrete example: if a beam fails at a midspan load of 12 kN, with width 50 mm, thickness 20 mm, and span 1.2 m in a three-point configuration, you compute the maximum bending moment from the applied load and then convert moment to extreme-fiber stress. The exact formula depends on the test configuration, but the workflow stays the same.
Tension Testing for Tensile Strength and Modulus
Tension tests are sensitive to grip slippage and misalignment. Tabs or end blocks can help transfer load more uniformly into the specimen. Strain measurement should be taken over a gauge length away from the grips so the computed modulus reflects the material, not the grip region.
A practical best practice is to verify that failure occurs in the gauge section rather than at the ends. If many specimens fail near the grips, your tensile strength is contaminated by test setup rather than material behavior. When that happens, improve surface preparation, use better gripping hardware, and re-check alignment.
Example: suppose a specimen with cross-sectional area 300 mm² reaches a peak load of 9 kN before rupture. Tensile strength is peak load divided by area. For modulus, use the slope of the initial linear stress–strain segment derived from measured gauge strain.
Compression Testing for Compressive Strength and Stability
Compression tests can be dominated by buckling or end effects if the specimen is not aligned or if the loading platens are not parallel. Use end preparation that ensures full contact, and consider lubrication or compliant layers only if they are part of the validated method.
For compressive modulus, strain gauges or extensometers should be placed so they measure axial strain without being affected by local crushing near the ends. If the material shows nonlinearity early, define the modulus using a specified strain range rather than assuming a single straight line.
Example: if a 40 mm by 40 mm specimen reaches 18 kN peak load in compression, compressive strength is peak load divided by 1600 mm². If the stress–strain curve shows a clear initial linear region, modulus can be taken from that region; if not, use a defined secant modulus approach consistent across specimens.
Mind Map: Mechanical Property Determination Workflow
Quality Control That Keeps Numbers Comparable
After each test, check whether the failure mode matches expectations. In bending, brittle systems may show sudden drops after peak load; ductile systems may show more gradual post-peak behavior. In tension, grip-related failures are a red flag. In compression, premature buckling indicates alignment or slenderness issues.
Finally, report results with enough detail to reproduce the calculations: specimen dimensions, conditioning method, test configuration, loading rate, instrumentation type, and the exact definition of modulus and strength. When those details are consistent, bending, tension, and compression properties become a coherent set rather than three unrelated stories.
4.2 Shear and Interlaminar Strength Testing for Layered Systems
Layered engineered timber alternatives often fail along interfaces before the bulk material gives up. That is why shear and interlaminar strength testing is not a “nice to have” add-on; it is the reality check for how layers share load. In practice, you want to measure the strength and the failure mode under controlled conditions, then use that information to choose connection details, layups, and quality checks.
Foundational Concepts for Interface Loading
Interlaminar strength refers to the ability of a layered system to resist separation between layers. Shear strength in this context is the resistance to sliding and shearing stresses that concentrate at interfaces due to bending, torsion, or eccentric loading.
A simple way to picture it: if you bend a layered beam, the top and bottom layers want to move in different directions. The interface must transfer shear to keep the layers acting together. If the interface is weak, you see delamination, splitting, or a sudden loss of stiffness.
Test Selection Based on Expected Failure Modes
Choose a test method that matches the stress path your product experiences.
- If your design is dominated by bending, prioritize tests that create shear transfer across interfaces.
- If your design includes significant through-thickness stresses, include a method that directly loads the interface in tension or shear.
- If your product uses adhesives or polymer-modified layers, ensure the test captures adhesive layer behavior, not just wood or fiber behavior.
A practical rule: if the interface is the likely weak link, the test should force the interface to do the work early, not after the bulk material has already failed.
Specimen Preparation and Conditioning
Specimen geometry should be consistent with the intended stress distribution. Too small, and edge effects dominate; too large, and you risk nonuniform loading.
Surface preparation matters because interlaminar strength is sensitive to bond quality. Use the same process controls as production: cleaning, adhesive spread, layup pressure, and curing time. If you test multiple batches, label them so you can trace results back to process parameters.
Condition specimens to a defined moisture state before testing. Moisture changes both the matrix and the interface. A straightforward approach is to condition to equilibrium in a controlled environment, then test promptly to reduce drift.
Loading Setup and Instrumentation
A typical goal is to create a known shear stress distribution at the interface while measuring load and displacement accurately.
Common instrumentation choices:
- Load cell for force measurement.
- Displacement transducers for relative slip or overall deflection.
- Strain gauges only when needed, since they can complicate interpretation.
If you want to understand how failure initiates, add a way to observe the interface: visual inspection during loading, or post-test sectioning to identify where separation started.
Shear Testing Approaches for Layered Systems
Two widely used approaches are:
- Short-Beam Shear: A reduced span bending setup that increases shear stress relative to bending. It is efficient for comparing interface performance across layups.
- Interlaminar Shear or Push-Off Style Tests: Configurations that concentrate shear at the interface more directly, often with a clear separation plane.
For both, record the load at first visible cracking or delamination, then the peak load, and finally the residual capacity if the specimen continues to carry load after cracking.
Interlaminar Strength Evaluation and Failure Mode Classification
Compute strength from the measured peak load using the method’s defined stress calculation. More important than the single number is the failure mode.
Classify failures such as:
- Adhesive failure at the bond line.
- Cohesive failure within the adhesive or matrix.
- Substrate failure within a layer.
- Mixed failure where multiple mechanisms contribute.
A useful interpretation: adhesive failure usually signals surface preparation or curing issues; cohesive failure suggests the interface is bonded well but the adhesive or matrix is not strong enough; substrate failure indicates the interface is stronger than the adjacent layer.
Mind Map: Shear and Interlaminar Testing Workflow
Example: Comparing Two Layups with the Same Interface
Assume you test two layered beams with identical interface materials but different fiber orientation in the outer layers. If both show adhesive failure at the bond line at similar loads, the interface is the controlling factor, and the layup change mainly affects stiffness after cracking. If Layup A shows cohesive failure within the matrix at higher loads while Layup B shows adhesive failure earlier, then the interface quality differs, even though the interface material is nominally the same.
To make this comparison meaningful, keep conditioning and curing identical, and use the same specimen dimensions and loading rate. Otherwise, you might “discover” differences that are really just differences in moisture or bond formation.
Example: Using Load-Displacement Shape to Spot Interface Issues
Two specimens can have the same peak load but different behavior. A specimen that reaches peak load quickly and then drops sharply often indicates brittle interface separation. A specimen that shows a gradual decline with sustained load suggests progressive delamination or stable crack growth. Recording the full curve helps you connect interface mechanics to how the product will behave under service-like loading, where stiffness loss can matter as much as ultimate strength.
4.3 Creep Fatigue and Long Term Load Effects Testing Protocols
Long term load effects matter because engineered timber alternatives rarely fail instantly under service loads. Instead, they gradually change stiffness and strength through time-dependent deformation (creep), repeated loading damage (fatigue), and combined effects. A good protocol keeps three things under control: the load history, the environment, and the measurement plan.
Foundational Concepts for Time Dependent Behavior
Creep is the increase in strain under sustained stress. Fatigue is progressive damage under cyclic stress. Long term load effects are the practical umbrella that includes creep, fatigue, and their interaction, plus any relaxation or redistribution in multi-layer elements.
A useful starting point is to separate two questions. First: “What happens to deformation over time at a fixed stress level?” Second: “What happens to capacity when the stress keeps cycling?” If you can answer both separately, you can then test combined scenarios with fewer surprises.
Test Objectives and Acceptance Metrics
Define objectives in measurable terms before choosing equipment. Typical objectives include:
- Creep compliance tracking: measure strain growth rate and total strain at defined time points.
- Residual strength or stiffness: after cycling, quantify remaining flexural or shear capacity.
- Serviceability limits: verify that deflection and strain stay within target bounds under realistic load combinations.
Acceptance metrics should be tied to the design use case. For example, a floor system may prioritize long term deflection limits, while a shear wall may prioritize stiffness retention and connection performance.
Specimen Selection and Conditioning
Choose specimens that represent the governing failure mode. For layered products, include the same layer orientation and interface conditions used in the final element.
Condition specimens to a defined moisture and temperature state. A practical approach is to equilibrate specimens until mass change becomes negligible over a short interval, then start loading immediately to avoid drift. Record initial moisture content and temperature at the start of every test run.
Loading Protocols for Creep and Fatigue
For creep, apply a constant stress or constant load with a controlled ramp. Avoid instant jumps that create artificial transient strain. Hold the load for durations that cover both early and late behavior, such as hours for primary creep and longer periods for secondary creep.
For fatigue, define cycle parameters: stress level, load ratio, frequency, and waveform. Keep the stress range consistent with the intended service action category. If the product is sensitive to mean stress, include tests at multiple load ratios rather than assuming symmetry.
For combined effects, use a sequence that reflects reality. A common integrated method is to pre-load in creep conditions, then apply cyclic loading at the resulting stress state. This captures the fact that stiffness changes during the sustained phase alter the effective stress during cycling.
Measurement Plan and Data Quality
Use instrumentation that can survive long durations without drift. Strain gauges or extensometers should be checked for zero stability before starting. Plan measurement intervals so you capture curvature in strain-time behavior rather than only endpoints.
Track at least:
- time, temperature, and moisture state
- applied load and any control system adjustments
- strain or deflection at scheduled intervals
- failure mode and location
If you see sudden jumps in strain, treat them as potential damage events, not measurement noise. Log the event time so you can correlate it with any control changes.
Mind Map: Creep Fatigue Testing Workflow
Example: Integrated Creep Then Fatigue on a Beam Element
Suppose you test a composite beam element intended for long term floor loading. Start by equilibrating specimens at a target moisture state, then apply a sustained load that corresponds to a service stress level. Measure deflection at short intervals early on, then switch to longer intervals once the strain-time curve flattens.
After the creep hold, keep the environment constant and apply cyclic loading with a defined stress range and load ratio. Use the measured post-creep stiffness to set the cyclic load so the stress level matches the intended service action. After cycling, unload and perform a short monotonic test to quantify residual stiffness and identify whether failure initiated in the same region as the creep deformation concentrated.
Example: Data Handling for Stiffness Retention
A simple stiffness retention check compares the slope of the load–deflection response before and after cycling.
1) Record initial stiffness K0 from a small monotonic re-load.
2) After fatigue, re-load monotonically to the same load level.
3) Compute Kf from the slope at that level.
4) Report retention R = Kf / K0.
5) Pair R with the observed failure mode location.
This approach avoids mixing different load levels and makes it easier to interpret whether stiffness loss is uniform or localized.
Practical Control Points That Prevent Bad Tests
- Use consistent ramp rates for every specimen to reduce transient variability.
- Keep environmental conditions stable during both sustained and cyclic phases.
- Confirm that the control system maintains the intended load or stress, not just the setpoint.
- Log any instrumentation changes, because a “small” gauge swap can invalidate comparisons.
A protocol that is this explicit tends to produce results you can actually use, which is the whole point of testing—less guessing, more evidence.
4.4 Dimensional Stability Testing Including Swelling and Warping
Dimensional stability testing answers one practical question: when the material sees moisture and temperature changes, how much does it change shape, and how repeatable is that behavior? For synthetic timber technologies, the “shape change” is not only swelling in thickness; it also includes warping, cupping, and edge curl that can break fit-up tolerances and load paths.
Foundational Concepts for Swelling and Warping
Swelling is the increase in dimensions driven by moisture uptake. In engineered wood alternatives, moisture can move through pores, along fiber or particle interfaces, and through the binder-rich phases. Warping is the result of non-uniform moisture distribution and stiffness differences across the thickness or along the length. A board that swells evenly stays flat; a board that swells more on one face than the other bends.
A useful mental model is “moisture gradient plus stiffness gradient.” If both faces absorb similarly, the gradient is small. If one face is more permeable due to surface treatments, resin content, or pressing conditions, the gradient grows. If the stiffness differs across layers, the same gradient produces more curvature.
Test Objectives and Acceptance Thinking
A good test plan separates three outcomes:
- Magnitude: how much thickness or width changes.
- Geometry: how much curvature or bow develops.
- Reversibility: whether dimensions return after drying.
Acceptance criteria should be tied to the intended installation. For example, a floor panel tolerates small thickness change but must keep flatness for flooring underlayment. A wall panel may prioritize warping limits to maintain cladding alignment.
Specimen Preparation and Conditioning
Start with consistent specimens. Cut from representative production lots, avoid edge damage, and label orientation so “face A” and “face B” are not mixed up. Measure initial dimensions and mass at a controlled baseline condition, then condition specimens in a controlled humidity or water exposure regime.
A common workflow is:
- Baseline: equilibrate at a standard indoor condition, record thickness at multiple points.
- Moisture exposure: move to a higher humidity chamber or controlled water immersion, depending on the product’s service.
- Post-exposure: measure immediately after reaching the target condition.
- Dry-back: return to baseline and measure again to assess recovery.
To avoid accidental bias, keep airflow uniform around specimens and ensure they are not touching each other or the chamber walls.
Measurement Methods for Swelling
Swelling is quantified using thickness and linear change.
- Thickness swelling: measure at a grid (for instance, center and near corners) and report the average and the maximum deviation.
- Linear swelling: measure width and length changes, especially if the product is used as a panel with edge joints.
Mass change is not just bookkeeping. It helps interpret whether swelling is driven by moisture uptake or by measurement artifacts such as surface wetting without penetration.
Measurement Methods for Warping
Warping needs geometry, not just a single “bow” number. Use a straightedge and feeler gauge for quick screening, but for systematic results use a dial gauge or laser-based profile measurement.
Key metrics include:
- Cupping: opposite faces curve in the same direction.
- Bow: curvature along the length.
- Edge curl: corners lift relative to the center.
Measure curvature after exposure and after dry-back. If the panel returns flat, the warping is likely moisture-driven and reversible. If it stays curved, residual set may indicate binder-related dimensional locking or irreversible microstructural changes.
Mind Map: Dimensional Stability Testing Logic
Example: Interpreting Thickness Swelling and Residual Curvature
Consider a composite timber panel tested with humidity exposure followed by dry-back. After exposure, thickness increases by 3.0% on average, with a maximum of 3.6% near one edge. At the same time, the panel shows a bow of 6 mm.
After dry-back, thickness returns to 0.4% above baseline, but bow remains at 4 mm. This pattern suggests that moisture uptake is largely reversible, but the curvature is not fully recovered. The likely cause is a persistent stiffness or moisture-history imbalance across faces, which can come from uneven permeability, uneven pressing density, or surface treatment differences.
A practical best practice is to repeat the test with face-swapped specimens. If the curvature direction flips when faces are swapped, the driver is face-specific moisture behavior. If the curvature direction stays the same relative to the original cut orientation, the driver may be internal density gradients from manufacturing.
Example: Setting Measurement Density for Reliable Warping Results
If you measure warping only at the center, you can miss edge curl that matters for joint lines. A simple improvement is to measure at three or five points along the length and at both edges. For a 1.2 m panel, sampling at 0.3 m intervals captures bow and edge effects without turning the test into a full-time job.
Practical Reporting Checklist
Report:
- Conditioning conditions and exposure duration.
- Baseline and post-exposure dimensions with measurement locations.
- Thickness swelling and linear swelling values.
- Warping metrics with direction and measurement method.
- Dry-back results to show recovery or residual set.
When these elements are consistent, the test results become comparable across lots and manufacturing adjustments, and they translate cleanly into installation tolerances.
4.5 Sampling Plans and Statistical Treatment for Test Results
A good sampling plan answers two questions before anyone touches a press or test frame: what population are we representing, and how much uncertainty can we tolerate. For synthetic timber technologies, the “population” is rarely a single homogeneous slab. It is a batch of panels or beams made from specific feedstock, binder lots, pressing schedules, and curing conditions. If you sample as if everything is identical, your statistics will politely lie.
Foundational Concepts for Sampling
Start by defining the unit of inference. Common choices are:
- Lot-level unit: a production lot of panels produced under one set of process parameters.
- Element-level unit: individual panels or beams cut from a lot.
- Specimen-level unit: test coupons cut from an element.
Next, decide what variability you expect. In engineered wood alternatives, variability often comes from:
- Material heterogeneity (fiber distribution, resin-rich zones, voids)
- Manufacturing gradients (thickness or density variation across a panel)
- Conditioning differences (moisture content after conditioning)
A practical rule: if you can’t point to a plausible source of variation, you can’t justify a sampling strategy.
Designing the Sampling Plan
A sampling plan typically includes selection, replication, and stratification.
Selection means how you choose elements from a lot. Random selection reduces bias, but you still need operational realism. For example, if panels are stacked, random selection should avoid always taking from the top of the stack.
Replication means how many specimens you test per element. Replication is not the same as more specimens from the same location. If you cut ten coupons from one panel corner, you have ten measurements of one local region, not ten independent realizations.
Stratification means dividing the population into meaningful subgroups and sampling each. For panels, a simple stratification is by location: center, edge, and corner. For beams, it can be by height or by distance from the ends.
Example: Suppose you test bending strength for a composite panel. You might select 5 panels from a lot, then cut 3 specimens from each panel at the center region. That gives 5 independent panels (element-level replication) and 15 measurements (specimen-level replication). If you instead select 1 panel and cut 15 specimens, your uncertainty estimate will be unrealistically tight.
Statistical Treatment of Test Results
Once data are collected, treat them consistently with the structure of your sampling plan.
Step 1: Check data integrity. Record failure modes, specimen dimensions, conditioning times, and any deviations. If a specimen is clearly invalid due to a handling error, document it and exclude it using a predefined rule.
Step 2: Summarize with the right level of aggregation. If your sampling unit is the panel, compute statistics at the panel level first (e.g., average strength per panel), then analyze across panels. If you compute everything across coupons, you risk underestimating variability.
Step 3: Use descriptive statistics that match the distribution. For many strength measures, distributions can be skewed. Report median and spread (such as interquartile range) alongside mean and standard deviation when appropriate. For design-oriented reporting, you often need a conservative lower bound rather than a central tendency.
Step 4: Estimate uncertainty. A simple and transparent approach is to compute confidence intervals for the mean at the panel level. For acceptance decisions, you may also need tolerance intervals that reflect both variability and confidence.
Step 5: Handle outliers carefully. Outliers can be real material behavior or measurement artifacts. Use failure mode notes and dimensional checks to decide whether an outlier is informative or invalid. Avoid “outlier hunting” after seeing the results.
Mind Map: Sampling and Statistics
Worked Example for a Panel Lot
Assume a lot contains 100 panels. You select 5 panels at random. From each selected panel, you cut 3 specimens from the center region and test them after identical conditioning. You compute the mean strength of the 3 specimens for each panel, producing 5 panel means. You then compute the mean and standard deviation of these 5 panel means to represent lot-level behavior. This approach respects the sampling structure: the uncertainty reflects variation between panels, not just variation within a single panel.
Finally, you compare the resulting lot-level statistic to the acceptance criterion using the same aggregation level used to derive that criterion. If the criterion was defined using panel-level data, you must not switch to coupon-level statistics at the last minute. That mismatch is a common reason test programs “fail” even when the material is behaving consistently.
5. Moisture Management and Durability in Service
5.1 Water Absorption Mechanisms and Capillary Transport
Water reaches synthetic timber and engineered wood alternatives through several paths, and each path leaves a different “signature” in the material. Understanding those signatures helps you choose the right moisture control strategy rather than treating all wetting as the same problem.
Foundational Concepts of Water Entry
Water absorption starts with wetting at the surface. If the surface energy is low and the outer layer is well sealed, water beads and runoff dominates. If the surface is more wettable or has micro-voids, water spreads and penetrates. From there, transport is governed by two coupled processes: capillary flow through pores and diffusion of water molecules through the polymer or binder matrix.
Capillary transport is strongest when there is a connected pore network with small characteristic pore sizes. In simple terms, narrow pores act like tiny straws. The driving force is a pressure difference created by surface tension and the contact angle between water and the pore wall. Diffusion becomes more important when pores are larger, less connected, or when the binder phase itself is permeable.
Mind Map: Water Transport Pathways
Capillary Transport Mechanics in Practical Terms
Capillary rise in a pore can be approximated by the idea that smaller pores pull water in more strongly. The key variables are pore radius, water–solid contact angle, and surface tension. In engineered wood alternatives, pore structure is not uniform: you may have larger voids from incomplete compaction, smaller pores within the binder-rich phase, and microcracks near interfaces.
A useful way to reason is to separate “fast paths” from “slow paths.” Fast paths are connected pores and cracks that allow liquid water to move quickly. Slow paths are diffusion-dominated regions where water must migrate molecule-by-molecule through less permeable phases. When you see a steep moisture gradient near the exposed face, fast paths are likely dominating. When moisture increases more uniformly with time, diffusion through the matrix is likely contributing more.
How Formulation and Manufacturing Influence Capillarity
Capillary transport depends on both chemistry and structure. Chemistry affects contact angle: hydrophilic binders or poorly cured resin systems tend to lower the contact angle and increase wetting. Structure affects pore connectivity: higher compaction pressure, better resin penetration, and controlled curing reduce voids and interrupt pore networks.
Manufacturing choices also change the location of pores. For example, if resin is applied unevenly, you can create resin-starved zones with higher permeability. Those zones behave like highways for water, even if the overall panel looks dense.
Example: Interpreting a Simple Wetting Test
Consider a flat specimen exposed to liquid water on one face. After a fixed time, you measure moisture content at the surface and at several depths.
- If the surface moisture is high and the moisture front moves inward quickly, capillary flow through connected pores is likely dominant.
- If the surface moisture rises but depth changes slowly, diffusion through the binder and less connected pores is likely dominant.
- If you observe localized wet streaks, the likely cause is a defect pathway such as a microcrack, an adhesive line discontinuity, or a region with higher void content.
This interpretation matters because mitigation differs. Capillary-dominant behavior responds well to improved sealing layers, reduced surface defects, and tighter control of compaction and curing. Diffusion-dominant behavior responds more to binder chemistry and matrix permeability control.
Example: Why Edge Details Often Matter More Than Faces
In many building components, edges and cut surfaces are the first places to show moisture uptake. Even when the main faces are well sealed, edges expose end-grain-like pathways, machining-induced micro-roughness, and any internal pore connectivity that was previously blocked by the outer layer.
A practical best practice is to treat edges as “high-risk surfaces” during installation. For instance, sealing a cut edge with a compatible moisture barrier can reduce the capillary driving force at the boundary, limiting how far water can travel inward.
Summary of Mechanisms and What to Watch
Water absorption in synthetic timber alternatives is best understood as a combination of surface wetting, capillary transport through connected pores and cracks, and diffusion through the binder or polymer phases. The most informative observations are moisture gradients over depth, the presence of localized wetting patterns, and the difference between face exposure and edge exposure. These observations let you connect material behavior to the specific transport mechanism that is actually doing the work.
5.2 Hygrothermal Behavior and Equilibrium Moisture Content Testing
Hygrothermal behavior is how a material responds when temperature and moisture conditions change at the same time. For synthetic timber and engineered wood alternatives, the key practical question is simple: when the environment stops changing, what moisture level does the product settle at, and how quickly does it get there? That settled moisture level is the equilibrium moisture content (EMC).
Core Concepts That Control EMC
Moisture in wood-based composites typically moves through diffusion and capillary transport, and the rate depends on binder type, fiber orientation, density, and surface treatments. Temperature affects EMC because the relationship between relative humidity (RH) and water activity shifts with temperature. In practice, you can treat EMC as a function of RH and temperature, then verify it experimentally for the specific product.
A useful mental model is to separate two ideas:
- Where moisture wants to be: EMC determined by RH and temperature.
- How fast moisture gets there: moisture diffusivity and sorption kinetics, influenced by thickness, permeability, and internal structure.
Test Objective and What “Equilibrium” Means
EMC testing aims to measure the moisture content at equilibrium under controlled RH and temperature. “Equilibrium” is not a vibe; it is a measurable condition. A common approach is to track mass change over time and stop when the change rate falls below a set threshold (for example, a small percentage per day). The threshold should be tight enough that the remaining drift does not meaningfully affect EMC.
Experimental Setup and Conditioning Logic
Start with specimens that represent the product’s real geometry. If you test a thin coupon but the field element is thick, you may get a different time-to-equilibrium and sometimes a different apparent EMC due to gradients during conditioning. For engineered products, include at least two thicknesses when feasible.
Conditioning chambers maintain a target RH using saturated salt solutions or controlled humidification systems. Temperature should be stable because RH control alone is not enough; a small temperature drift changes the effective moisture driving force.
A practical workflow:
- Dry baseline: Dry specimens to a consistent reference moisture state.
- Condition: Place specimens in chambers at defined RH and temperature.
- Weigh: Measure mass at intervals that get shorter as equilibrium approaches.
- Compute EMC: Convert mass to moisture content using the dry mass reference.
- Confirm equilibrium: Apply the mass-change criterion.
Mind Map: Hygrothermal Behavior and EMC Testing
Example: Building an EMC Curve for Specification Use
Suppose you need EMC values for a composite panel used in a ventilated wall cavity. Choose two temperatures that bracket expected service conditions, such as 10°C and 25°C, and test several RH levels that cover typical indoor ranges. For each RH-temperature pair, condition specimens until equilibrium.
You might end up with a table like this (illustrative numbers):
- At 25°C and 60% RH, EMC could be around the mid-teens by mass.
- At 25°C and 90% RH, EMC increases noticeably.
- At 10°C, the EMC at the same RH may differ due to temperature effects.
The best practice is to report EMC with the conditioning conditions and the equilibrium criterion, not just the final values. That makes the data usable when someone later checks dimensional stability or moisture-driven stress.
Example: Avoiding a Common EMC Testing Pitfall
A frequent issue is assuming that reaching a stable chamber RH automatically means the specimen is at equilibrium. If the specimen is thick or has low permeability, the surface may stabilize while the core still lags. You can detect this by using multiple specimens and ensuring the mass-change criterion is met consistently across them. If results scatter, it often points to insufficient conditioning time or specimen variability rather than a mysterious material property.
Advanced Details That Improve Confidence
Surface condition matters. If the product has a coating or factory-applied treatment, test specimens with that same surface finish. A bare edge can behave differently from a coated face, and EMC testing should reflect the real moisture exposure path.
Replicate specimens reduce ambiguity. Use at least three specimens per condition. When EMC values cluster tightly, you can trust the equilibrium criterion. When they don’t, you learn something important about heterogeneity.
Mass measurement discipline. Weigh specimens quickly after removal from the chamber to limit transient moisture uptake or loss. Use consistent handling and record the dry mass reference carefully.
When these elements are in place, EMC testing becomes a reliable foundation for predicting hygrothermal performance, rather than a one-off measurement that only makes sense in the lab where it was performed.
5.3 Biological Resistance Strategies Including Mold and Decay Control
Biological growth in synthetic timber systems is mostly a moisture problem with a materials twist. Mold needs water activity and time; decay fungi need sustained moisture plus oxygen and suitable temperatures. The practical goal is to keep moisture low enough that growth cannot get started, and to ensure that any brief wetting events do not turn into long wet periods.
Foundations of Mold and Decay Control
Start with the moisture pathways. In engineered wood alternatives, water can enter through bulk liquid leaks, capillary transport along edges and joints, or vapor diffusion through assemblies. A useful rule of thumb is that controlling the “first wetting” is cheaper than trying to clean up after the material has stayed damp.
Next, connect moisture to biology. Mold can appear on many surfaces once they remain damp long enough, even if the material is not “food.” Decay is more selective and typically requires longer wetting and favorable conditions. That difference matters for design: you can often prevent decay by preventing sustained wetness, while preventing mold requires both moisture control and surface conditions that do not support persistent dampness.
Finally, treat biology as a system. A panel may be resistant, but a poorly detailed joint can create a local moisture trap. The best strategy combines material choices, assembly detailing, and maintenance-friendly design.
Mind Map: Biological Resistance Strategy
Moisture Management That Actually Works
Preventing mold and decay begins with keeping the material dry during construction and in service. During installation, store panels off the ground, cover them so rain cannot pool on edges, and keep cut faces protected until sealing is complete. A common failure mode is “temporary” exposure: a few days of rain during a schedule crunch can be enough to start surface staining and odor, even if the structure later dries.
In service, focus on the wettest locations. Roof edges, window heads, and penetrations are where water finds a way in. Use continuous air and water barriers, and ensure flashing directs water outward rather than letting it run behind layers. For joints, design for drainage and avoid creating a pocket where water can sit. For example, if a panel edge meets a metal flashing, include a small gap and a drip path so water cannot wick into the interface.
Capillary transport is the sneaky one. Even when bulk water is controlled, water can move along edges and through porous pathways. Use water-shedding detailing at horizontal surfaces and ensure that sealants and membranes do not bridge into a capillary channel. A practical example: when installing a floor deck over a supporting frame, keep the underside dry by sealing penetrations and providing ventilation where the assembly allows it.
Material and Surface Choices for Biological Resistance
Biological resistance is improved when the material matrix reduces water uptake and slows moisture redistribution. In engineered wood alternatives, the binder system and the composite structure influence how quickly water can penetrate and how long it stays. Dimensional stability helps because swelling can open micro-gaps that then become moisture pathways.
Surface treatments can help, but they must be compatible with the assembly. A coating that reduces water retention is useful on exposed faces, yet it should not be relied on for edges that will be cut and left unsealed. Treat field cuts as part of the system: if the factory product is protected, the jobsite must replicate that protection on every cut face and drilled hole.
Interfaces deserve special attention. If two materials have different moisture expansion behavior, the joint can loosen and create a route for water. Choose connector and sealant systems that maintain continuity under expected movement, and verify that the joint does not trap water against a porous surface.
Durability Verification and Acceptance Logic
Testing should reflect the moisture conditions that drive growth. Accelerated conditioning typically uses damp cycles rather than constant wetting, because real buildings experience wetting and drying. The key is to match exposure time and temperature ranges to the intended service environment.
Acceptance criteria should be specific and measurable. For mold and decay resistance, look for evidence of growth on relevant surfaces and confirm that any biological exposure does not cause unacceptable loss of mechanical properties. A good practice is to test representative assemblies, not just flat coupons, because joints and edges often control outcomes.
Installation Practices and Quality Checks
Field quality is where good designs succeed or fail. Use a simple checklist approach:
- Keep panels covered and dry before installation.
- Seal all cut edges, not just the visible faces.
- Verify flashing continuity and sealant bead integrity.
- Inspect joints for gaps that could become moisture traps.
Example: For a wall assembly with composite panels, seal the panel-to-frame interface and ensure the WRB laps are directed so water drains outward. During inspection, check that sealant is continuous at corners and that no unsealed cut faces remain behind trim.
Worked Example: Preventing Mold at a Window Head
Consider a window head detail where water can run along the top of the opening. If the flashing is discontinuous, water can enter and remain behind the panel for days. The fix is threefold: direct water outward with a properly lapped flashing, prevent capillary wicking by maintaining a drainage gap at the interface, and seal any cut panel edges so the moisture cannot penetrate the composite matrix. After installation, verify that the joint is dry and that the air and water barrier continuity is not interrupted at the corners.
Biological resistance is not a single product feature. It is the combined effect of moisture control, compatible detailing, and verification that the assembly stays dry long enough to keep mold and decay from getting a foothold.
5.4 Corrosion and Metal Interface Considerations for Connectors
Engineered wood alternatives often rely on metal connectors—screws, bolts, hangers, plates, and brackets—to transfer shear, tension, and compression. Corrosion at the metal interface is not just a “rust problem”; it changes fastener diameter, increases slip, and can create staining paths that signal moisture movement. The goal is to control three variables: moisture at the interface, oxygen access, and the chemistry that sits between metal and the synthetic timber.
Foundational Mechanisms That Drive Corrosion
Corrosion needs an electrolyte, typically water with dissolved ions. In service, the electrolyte forms when moisture reaches the connector zone and remains there long enough for ions to move. Oxygen availability matters too: many corrosion forms accelerate where oxygen can diffuse in, such as at edges of plates or around partially embedded fasteners.
In engineered timber alternatives, the interface chemistry can contribute. Some binders and additives may release ions or create a slightly conductive film when wet. Even if the connector is stainless, crevice conditions—tight gaps where water can sit—can still promote localized attack.
Interface Moisture Control That Prevents the Electrolyte
Start with moisture management before choosing a connector grade. Good practice is to ensure the connector zone is not the lowest point in a wetting cycle. For example, when installing a beam-to-wall bracket, keep the bracket’s top surface sloped or detailed so water drains away rather than pooling at the metal/wood contact.
Use a simple check during detailing: if water can reach the interface, it must also be able to leave. That means avoiding sealed pockets where water can be trapped by tight cover plates. When a design requires a pocket, include a drainage path or a controlled gap so moisture can escape after wetting.
Connector Material Selection and Coatings
Connector corrosion resistance is a system choice, not a single product label. Consider:
- Corrosion class and environment: exterior exposure, condensation-prone interiors, and splash zones demand higher protection.
- Galvanic pairing: dissimilar metals in the presence of an electrolyte can accelerate corrosion of the less noble metal.
- Coating integrity: coatings must survive installation damage. A screw that scratches through a coating at the first thread is still a screw with a head start on corrosion.
A practical example: if you use galvanized steel connectors in a region with persistent moisture, specify connectors with a coating thickness and fastener design that tolerate abrasion during driving. Pairing them with compatible metals in contact reduces galvanic effects.
Surface Chemistry and Contact Films
At the interface, thin films can form from moisture plus dissolved species. These films can be more aggressive than bulk water because they concentrate ions at the metal surface. To reduce this risk:
- Keep surfaces clean and dry before assembly.
- Avoid trapping dust or sanding residue between metal and the synthetic timber.
- Use compatible sealants or interface barriers where detailing requires it.
Example: when installing a steel plate over a composite panel, do not rely on “whatever sealant is on hand.” Use a sealant that remains stable with the panel’s binder chemistry and does not create a conductive residue when wet.
Crevice Corrosion and Tight Gaps
Crevice corrosion is common where water is trapped in narrow spaces. Typical trouble spots include:
- Under washers and plates with poor contact pressure
- Around partially embedded fasteners where micro-gaps persist
- Behind tight-fitting covers that block drying
A best practice is to ensure adequate bearing and contact pressure. For plates, confirm that the fastener pattern and tightening method achieve uniform contact rather than point loading. For washers, choose sizes that distribute load without creating a sealed pocket.
Galvanic Corrosion at Mixed-Metal Assemblies
Galvanic corrosion occurs when two metals are electrically connected and both are exposed to an electrolyte. The more active metal corrodes faster. In practice, this can happen when stainless connectors contact carbon steel plates, or when aluminum elements sit near steel in a wet interface.
Mitigation steps:
- Use the same metal family for connectors and plates when feasible.
- Add an insulating barrier between dissimilar metals where design allows.
- Prevent water from bridging the metals by detailing drainage and avoiding sealed wet pockets.
Example: if a stainless bracket must connect to a carbon steel base plate, include an insulating layer between them and ensure the assembly can dry after any wetting event.
Testing and Verification for Connector Zones
Verification should focus on the interface, not just bulk material. Consider acceptance checks such as:
- Visual inspection for early staining after controlled wetting cycles
- Measurement of fastener condition after exposure, including head and thread areas
- Pull-through or slip checks where corrosion could reduce effective diameter
A systematic approach is to test representative assemblies: the same connector type, coating, interface barrier, and tightening method used in production.
Mind Map: Corrosion and Metal Interface Considerations
Example: Beam Bracket with Controlled Drying
A common detail is a steel bracket bolted to a composite beam. If the bracket traps water against the top face, the connector zone stays wet and corrosion accelerates. Instead, specify a bracket geometry that allows drainage, use a compatible interface barrier under the plate, and ensure the bolt pattern provides full bearing contact. After installation, confirm that no sealant creates a sealed wet pocket under the plate edges.
Example: Washer Selection to Reduce Crevice Formation
If a washer is too small, it can create a tight perimeter gap where water sits. Choose a washer size that distributes load and maintains contact pressure across the interface. During assembly, tighten to achieve uniform bearing rather than leaving uneven contact that forms crevices.
Practical Checklist for Connector Interfaces
- Detail for drainage and drying at the connector zone.
- Select connector materials and coatings compatible with the environment.
- Avoid dissimilar metal contact without an insulating barrier.
- Ensure full bearing contact to reduce crevice corrosion.
- Use interface barriers and sealants that do not create conductive residues.
- Verify with assembly-level testing that matches real installation methods.
5.5 Durability Verification Through Accelerated Conditioning Tests
Durability is the ability of a synthetic timber product to keep its performance when it meets real service conditions: repeated wetting and drying, temperature swings, biological exposure, and mechanical loading. Accelerated conditioning tests aim to reproduce the same damage mechanisms faster, using controlled cycles and measurable endpoints. The key is not speed for its own sake; it is matching the “what breaks” and “how it breaks” to the product’s intended use.
Foundational Concepts for Designing Accelerated Tests
Start by mapping expected service stressors to likely failure modes. For example, a fiber-composite panel used in a ventilated façade may face moisture cycling and swelling stresses, while a polymer-modified beam inside a conditioned building may face mostly thermal cycling and creep under sustained load.
Next, define acceptance endpoints before running tests. Common endpoints include:
- Strength retention after conditioning, measured in bending or tension.
- Stiffness retention, often tracked through load–deflection curves.
- Dimensional stability, such as thickness swelling and warping.
- Interface integrity, such as delamination indicators or shear strength loss.
- Surface degradation indicators, such as gloss loss or coating failure (when coatings are part of the system).
Finally, choose a conditioning regime that is physically credible. If the test uses extreme temperatures, it must still represent the chemistry and transport processes that occur in service. A good rule of thumb is to keep the test within the range where the dominant degradation mechanism remains the same.
Test Planning Workflow with Practical Checks
- Define the product and system boundary. Include adhesives, coatings, and any protective layers that affect moisture behavior.
- Select conditioning cycles. Use wetting and drying cycles for moisture-driven durability, and combine thermal cycling when temperature affects transport.
- Set exposure duration using a cycle count. Use cycles rather than hours to reflect repeated transport and drying.
- Include controls and replicates. Keep unconditioned specimens as baseline controls, and use enough replicates to separate real trends from noise.
- Precondition specimens consistently. For instance, equilibrate to a defined humidity state before starting cycles so the first cycle is comparable across batches.
- Measure at defined checkpoints. Test some specimens after early cycles and others after the full regime to see whether damage progresses gradually or suddenly.
A simple example: if a composite board is specified for intermittent rain exposure, you might use a cycle of water immersion followed by drying at controlled humidity, then measure thickness swelling and bending strength after 10, 20, and 30 cycles.
Moisture Cycling Regimes and What They Reveal
Moisture cycling tests should capture both absorption and drying. During wetting, water penetrates through edges, pores, and any microcracks. During drying, trapped moisture can drive internal stresses and weaken adhesive bonds.
A practical approach is to track two measurements during the program:
- Thickness swelling after each cycle or at selected checkpoints.
- Strength retention after the full conditioning period.
If swelling increases sharply after a certain number of cycles, it often signals that pathways for water ingress are opening or that the adhesive interface is losing integrity.
Thermal and Hygrothermal Conditioning for Transport-Driven Damage
When temperature affects moisture transport, hygrothermal cycles are more informative than moisture-only cycles. A common structure is alternating warm humid exposure and cooler drying exposure. This helps reveal whether the product’s dimensional stability depends on temperature-driven diffusion.
Example: a laminated element with a moisture-sensitive adhesive may show modest swelling under room-temperature wetting, but larger swelling when warm humid conditions accelerate diffusion and slow drying.
Biological Resistance Conditioning for Service-Relevant Exposure
For products intended to resist mold or decay, biological conditioning should be paired with clear evaluation criteria. Use controlled exposure conditions and assess both mass change and performance loss. Also document whether degradation is localized to surfaces, edges, or interfaces.
A useful practice is to compare conditioned specimens with and without protective layers, if the product system includes them. This prevents attributing durability to the wrong component.
Mechanical Loading During Conditioning When Needed
Some durability problems involve stress-assisted degradation. If the service includes sustained loads while exposed to moisture, consider conditioning under load. This can be done by applying a defined fraction of the service load during cycles, then testing residual strength after conditioning.
Example: a beam that is always slightly loaded may show less stiffness loss than an unloaded specimen if the adhesive interface is stable, but it may show greater creep-related deformation if moisture reduces the effective bond stiffness.
Mind Map: Accelerated Conditioning Test Design
Example: Turning Results into Clear Acceptance Decisions
Suppose a composite panel is tested with 30 moisture cycles. After conditioning, you measure thickness swelling and bending strength. If swelling exceeds the limit early and strength drops sharply after the same checkpoint, you likely have an ingress or interface integrity issue. If swelling stays within limits but strength declines slowly, the degradation may be affecting the matrix or fiber–binder stress transfer rather than water uptake.
Acceptance should be based on the pre-defined endpoints, not on the most convenient metric. A product can pass a swelling limit yet fail strength retention, and that mismatch is exactly the kind of information accelerated conditioning is meant to surface.
Mind Map: Common Pitfalls and How to Avoid Them

Example: A Simple Moisture Cycle with Measurable Outputs
Use a cycle that alternates water exposure and controlled drying, then measure thickness swelling after each cycle and bending strength after the full set. Record specimen mass before and after drying to confirm that the drying step actually removes moisture rather than pausing at an intermediate state. This single check prevents a surprising number of “passes” that are really incomplete conditioning.
6. Fire Performance and Thermal Behavior
6.1 Fire Classification Testing Methods and Acceptance Criteria
Fire classification testing answers one practical question: “How does this material behave under a defined fire exposure, and what limits must it meet to be used in a specific building context?” The key is that the test method, specimen preparation, and acceptance criteria are tightly coupled—change one, and the classification may no longer apply.
Foundations of Fire Classification Testing
Start with the test boundary. A classification test specifies the heat source, specimen orientation, mounting method, and measurement approach. For engineered wood alternatives, the specimen often includes the relevant surface layer and thickness, because coatings, resin content, and surface treatments can dominate early fire behavior.
Next, define what is being measured. Common outputs include flame spread, heat release, smoke production, ignition propensity, and structural integrity after exposure. A material can pass one metric and fail another, so acceptance criteria must be treated as a set, not a single score.
Specimen Preparation and Conditioning
Specimens should be representative of production. That means using the same manufacturing route, adhesive system, and surface finishing process as the final product. If the product is sold as a panel with a protective film, the test should specify whether the film is included or removed.
Conditioning matters because moisture changes thermal decomposition and smoke behavior. A typical best practice is to condition specimens to a defined equilibrium state before testing, then record the actual mass and thickness. A simple example: if two batches differ in moisture content by several percentage points, their ignition timing can shift even when density is similar.
Test Methods by Performance Focus
Different classification schemes emphasize different hazards.
Flame Spread and Surface Burning
Surface burning tests evaluate how quickly flames propagate along a specimen. Acceptance criteria usually include limits on flame spread rate and/or extent, plus requirements for sustained flaming. A practical example: a board may show low initial ignition but still fail if flames travel far along the surface.
Heat Release and Ignition
Heat release measurements quantify energy output during burning. Acceptance criteria often include maximum heat release rate and total heat released over the test duration. A material with a high peak but short duration can still fail if the criterion is based on peak intensity.
Smoke Production and Toxicity Proxies
Smoke tests focus on optical density or specific extinction area. Some schemes also include measurements that act as proxies for toxic effects. For engineered wood alternatives, smoke can be strongly influenced by binder chemistry and any flame retardant system.
Structural Integrity After Exposure
When classification includes post-fire performance, the test may require that the specimen maintains load-bearing capacity or retains a minimum residual strength. In practice, this is where connection design and assembly details can matter: a “material-only” specimen may not capture how a real wall assembly behaves.
Acceptance Criteria as a Checklist
Acceptance criteria are not just numbers; they define what counts as failure. For example, “sustained flaming” may be defined as flaming that continues beyond a time threshold without interruption. Similarly, “flame spread” may be measured against a marked distance on the specimen.
A useful best practice is to build an internal checklist aligned to the standard: specimen dimensions, mounting, ignition source placement, measurement channels, and pass/fail thresholds for each metric. If any item is missing, the classification claim should be treated as incomplete.
Mind Map: Fire Classification Testing Workflow
Example: Interpreting a Mixed Result
Imagine a composite timber panel that meets flame spread limits but exceeds a smoke criterion. The correct response is not to “average” the outcomes. Instead, the classification is limited to the metrics it satisfies, and the product must be used only where the required smoke performance is not stricter than what the test demonstrated.
Example: Acceptance Criteria Applied to a Practical Decision
Suppose a project requires a classification that includes both heat release and smoke limits for a corridor application. During procurement, the acceptance workflow should confirm that the test report includes the exact specimen configuration used for classification, including thickness and any surface layers. If the supplier provides a test for a thinner variant, the acceptance decision should be based on whether the standard permits thickness extrapolation; otherwise, treat it as a mismatch.
Documentation and Traceability
A classification is only as reliable as its traceability. The test report should identify the product, batch or production range, specimen dimensions, conditioning state, and any deviations from the standard procedure. If the report lacks specimen traceability, it becomes difficult to justify that the tested material matches what is installed.
In short, fire classification testing is a structured chain: define the scope, prepare representative specimens, run the correct method for the hazard of interest, then apply acceptance criteria exactly as written. That discipline is what turns “it seems fire resistant” into a defensible classification.
6.2 Charring Mechanisms and Heat Release Measurement Approaches
Charring as a Material Transformation
Charring is the controlled conversion of the outer region of a material into a carbon-rich layer when exposed to heat. For synthetic timber technologies, that layer is not just “burned wood”; it is a heat- and mass-transfer barrier that slows further decomposition. The barrier effect comes from three linked processes: (1) thermal insulation from the porous char, (2) reduced release of flammable volatiles, and (3) altered surface chemistry that changes how easily the surface ignites.
A useful way to picture it is a moving boundary. Heat penetrates inward, the surface decomposes first, and the char front advances as the underlying material continues to pyrolyze. If the char is cohesive, it stays in place and maintains the barrier. If it is brittle or easily eroded, the barrier fails and fresh material is exposed, which typically increases heat release.
What Drives Char Formation in Engineered Wood Alternatives
Char formation depends on the balance between polymer content, binder chemistry, and the availability of carbon-forming components. Cellulose-rich constituents tend to form a char that can be relatively structured, while many polymer binders can either promote char (when they generate carbonaceous residues) or reduce it (when they favor complete volatilization).
Moisture and additives also matter. Moisture absorbs heat during evaporation, delaying decomposition and often lowering early heat release. Intumescent or char-forming additives can expand the surface and create a thicker, more insulating char. Meanwhile, mineral fillers can dilute combustible content and improve char stability by promoting a more rigid residue.
Heat Release: Why It Is Measured Instead of Only Watching Flames
Flames are dramatic, but they are not the measurement. Heat release rate (HRR) is a direct indicator of how much energy the material is generating in the fire environment. In standard tests, HRR is derived from oxygen consumption: the more oxygen a specimen consumes, the more heat it releases. This approach works even when flames are partially hidden, because the chemistry of combustion still consumes oxygen.
In practice, HRR is reported as a curve over time. Two features are especially important for engineered timber products: the peak HRR and the time to reach it. Peak HRR reflects how quickly the material transitions from ignition to vigorous decomposition. Time to peak reflects how long the protective processes—drying, surface heating, and char formation—can keep the specimen from producing large quantities of volatiles.
Measurement Approaches and What They Reveal
Most building-material fire characterization uses controlled bench-scale methods that relate to full-scale behavior through standardized assumptions.
- Cone Calorimetry: A radiant heat flux is applied to the specimen surface. HRR is measured via oxygen consumption, producing HRR curves that show ignition delay, peak HRR, and post-peak decay. This is particularly useful for comparing formulations because the heat input is controlled.
- Single- or Multi-Specimen Furnace Methods: These focus on larger-scale assemblies or different exposure conditions. They can capture effects of thickness, orientation, and edge exposure that cone tests may underrepresent.
- Smoke and Gas Metrics Coupled to HRR: While this section focuses on HRR, many test setups also record smoke production and mass loss, which help interpret why HRR changes. For example, a lower HRR paired with high mass loss can indicate that volatiles are not efficiently burning, not that the material is “safe.”
Mind Map: From Char Formation to Heat Release Curves
Example: Interpreting Two HRR Curves
Consider two engineered timber panel formulations tested under the same radiant heat flux.
- Panel A shows a longer ignition delay and a lower peak HRR. After exposure, it retains a thicker, intact char layer. The interpretation is straightforward: the char forms early enough and stays cohesive, limiting volatile release.
- Panel B ignites sooner and reaches a higher peak HRR. Its surface char appears fragmented and recedes during heating. The interpretation is that the barrier effect is short-lived, so fresh material keeps decomposing and feeding the fire.
In both cases, the HRR curve is doing more than ranking materials. It is mapping the time-dependent effectiveness of the char barrier against heat and mass transfer.
Practical Best Practices for Interpreting Char and HRR Together
When analyzing results, pair HRR with mass loss and post-test residue observations. A lower peak HRR with minimal residue loss suggests stable char formation. A lower HRR with rapid residue loss suggests reduced burning efficiency rather than robust barrier performance. Finally, always compare specimens with consistent thickness and edge conditions, because char formation is a surface phenomenon and edges can accelerate exposure by bypassing the intended barrier.
6.3 Smoke Toxicity and Ventilation Considerations for Materials
Smoke is not just “visible.” It carries heat, irritant gases, and particulates that can impair breathing and reduce visibility for occupants and responders. For engineered wood alternatives, the key is to treat smoke behavior as a system outcome: material chemistry plus heat exposure plus how the building moves air.
Foundations of Smoke Toxicity
Smoke toxicity comes from what the material releases when heated. Two practical categories matter for building decisions: (1) gases that irritate or interfere with oxygen use, and (2) fine particles that deposit in airways and worsen breathing. In many products, the binder and any polymeric components dominate the release profile more than the wood fiber itself.
A useful way to think about toxicity is “dose at breathing height.” The same material can produce different hazard levels depending on how quickly it heats, how much oxygen is available, and how effectively smoke is diluted by ventilation. That’s why toxicity discussions must connect to ventilation, not live in a separate box.
Smoke Production Pathways
When a material is heated, it can undergo drying, decomposition, and combustion or smoldering. Each step changes what leaves the surface. Early heating often produces water vapor and low-molecular compounds; later stages can generate more complex gases and soot. For layered composites, smoke can also be influenced by internal delamination, which exposes fresh surfaces and changes the burning rate.
A practical best practice is to consider worst-case exposure geometry. For example, a board edge exposed in a cavity can generate a different smoke plume than the same board face exposed to direct flame, because the edge can promote faster heating and more surface area participation.
Ventilation as a Control Lever
Ventilation affects both concentration and movement. Higher air exchange can dilute toxic gases and reduce smoke density, but it can also spread smoke to adjacent spaces if pressure relationships are not controlled. The goal is not “more air,” but predictable smoke pathways.
In design and installation, ventilation considerations should be tied to compartmentation and pressure control. If a corridor is intended to remain tenable, the building needs a pressure strategy that prevents smoke from being pushed into that corridor during a fire scenario.
Measurement Concepts That Drive Decisions
Fire tests often report smoke-related metrics such as smoke density and specific extinction behavior. These metrics help compare materials under controlled heating, but they do not automatically translate to occupant exposure without considering ventilation and room geometry.
A systematic approach is to map test outputs to building use. For instance, a product used in a ceiling assembly may be evaluated differently than the same product used in a wall cavity because smoke stratification and ceiling jet behavior change how smoke reaches occupants.
Mind Map: Smoke Toxicity and Ventilation Logic
Integrated Best Practices with Examples
1) Specify assemblies, not just materials. A binder-rich composite might show one smoke profile as a standalone sheet, but the assembly’s surface finish, thickness, and jointing can change heating and decomposition. Example: when specifying a ceiling panel, require performance evidence for the full ceiling build-up, including any backing board and joint treatment.
2) Control oxygen access through detailing. Small gaps can change burning behavior by supplying oxygen to cavities. Example: if a wall lining system has unsealed perimeter joints, smoke can migrate through the cavity and produce a denser plume than expected from the lining surface alone.
3) Coordinate ventilation strategy with compartment design. Example: in a multi-room layout, ensure that smoke management assumptions match the intended pressure zones. If a mechanical smoke control plan assumes corridor pressurization, do not introduce leakage paths through poorly sealed service penetrations.
4) Treat “ventilation” as both mechanical and passive. Door undercuts, duct leakage, and stack effects can all alter smoke movement. Example: a stairwell that is intended to stay clear can become a smoke conduit if door gaps allow smoke to bypass compartment boundaries.
5) Verify installation continuity. Many smoke outcomes depend on whether layers remain intact during heating. Example: if a composite panel is installed with inconsistent adhesive coverage, early delamination can expose more surface area, increasing smoke generation.
Practical Checklist for Material-to-Building Integration
- Confirm the product’s smoke-related test basis matches the intended assembly type.
- Identify binder and polymer content as primary smoke drivers for the specification narrative.
- Review jointing and perimeter sealing details that affect oxygen access and smoke migration.
- Align ventilation and pressure control assumptions with the building’s compartment boundaries.
- Require installation quality checks that preserve layer continuity and prevent unintended cavity pathways.
Smoke toxicity and ventilation are inseparable in practice: ventilation changes exposure, and material behavior changes what ventilation must manage. When you connect the two through assembly-level thinking and disciplined detailing, the design becomes easier to reason about and harder to surprise.
6.4 Thermal Expansion and Post Fire Residual Strength Testing
Thermal expansion matters in fire because it changes geometry before it changes strength. Even when a synthetic timber product survives the exposure, the element may have shifted, bowed, or cracked internally. Post fire residual strength testing is the way to quantify what remains after those changes, using controlled specimens and consistent conditioning.
Foundational Concepts for Expansion During Fire
Most engineered wood alternatives expand when heated, but the details depend on how heat moves through the product and how the binder and fibers respond. A simple mental model is to treat the element as layers with different stiffness and different thermal strain. If the layers expand differently, shear stresses develop at interfaces, and those stresses can create delamination or microcracking.
In practice, expansion is not uniform. The fire side heats faster, so the temperature gradient drives differential expansion. That gradient also affects moisture movement: if the material contains moisture or bound water, internal vapor pressure can add to cracking risk. For testing and design, the key is to separate three effects: thermal strain from temperature rise, mechanical strain from restraint by adjacent members, and damage strain from cracking or interface failure.
Thermal Expansion Measurement and Interpretation
Thermal expansion testing typically uses a controlled heating rate while measuring length change. For building-relevant interpretation, the heating profile should resemble fire exposure conditions rather than slow lab warming. A practical approach is to report expansion as a function of temperature and time, then compare it to expected gradients in assemblies.
A useful example: imagine a composite beam with a synthetic binder-rich core and fiber-rich faces. If the core heats more slowly, the faces may expand first, putting the core in shear. In a test, you might see modest overall length change but significant internal damage. That’s why expansion alone cannot be treated as a proxy for residual strength.
Post Fire Residual Strength Testing Goals
Residual strength testing answers a narrower question than “did it pass fire classification.” It measures how much load-bearing capacity remains after a defined fire exposure and cooling/conditioning sequence. The testing program should preserve the damage state created by heat, not erase it through overly aggressive conditioning.
A systematic goal list helps keep the program coherent:
- Quantify residual bending and compression capacity.
- Identify whether failure mode changes after heating.
- Determine whether stiffness reduction is proportional to strength reduction.
- Verify whether cracking or delamination correlates with strength loss.
Specimen Selection and Conditioning Sequence
Specimens should be representative of the product and manufacturing batch. If the product is used in assemblies, consider whether the test should include realistic boundary conditions or whether standalone coupons are sufficient. After fire exposure, cooling method matters. Rapid cooling can introduce thermal shock, while slow cooling may allow stress relaxation. The conditioning sequence should be consistent across all specimens so comparisons remain meaningful.
A practical example sequence for a beam coupon is:
- Fire exposure to a specified temperature-time curve.
- Controlled cooling to a target handling temperature.
- Conditioning to a defined moisture state before mechanical testing.
- Mechanical testing under the same loading setup used for unexposed reference specimens.
Residual Strength Test Methods and Reporting
Mechanical tests should mirror the pre-fire test methods as closely as possible. If the reference bending test uses a three-point setup with a specific span-to-depth ratio, the residual test should use the same geometry and span. Report both strength and stiffness, because stiffness often drops earlier than peak load.
Failure mode documentation is not optional. If unexposed specimens fail by bending with fiber fracture, but post fire specimens fail by interface separation, the strength reduction may be driven by different mechanisms. That distinction helps interpret why expansion and damage occurred.
Mind Map: Expansion and Residual Strength Workflow
Example: Interpreting a Residual Bending Drop
Suppose unexposed coupons show an average bending strength of 40 MPa. After fire exposure, the average residual strength is 22 MPa, and the failure mode shifts from fiber-dominated fracture to interface separation near the midspan. If thermal expansion measurements show only moderate overall length change, the most likely explanation is that internal differential expansion created interface shear damage rather than causing large macroscopic warping.
In reporting, you would present the residual strength ratio (22/40) alongside stiffness ratio and a clear failure mode summary. That combination prevents the common mistake of attributing strength loss solely to “it expanded a lot,” when the real driver was where the damage formed.
Practical Quality Checks for Test Consistency
To keep results trustworthy, control these variables tightly:
- Heating profile repeatability across specimens.
- Cooling and handling temperature windows.
- Moisture conditioning targets before mechanical testing.
- Alignment and span setup during bending tests.
If any of these drift, residual strength comparisons become noisy. The goal is not just to get numbers, but to ensure the numbers reflect thermal expansion effects and post-fire damage, not test setup quirks.
6.5 Fire Rated Assembly Design for Walls Floors and Roofs
Fire rating is an assembly property, not a material trophy. A wall, floor, or roof system earns its rating through a chain of behaviors: the surface must resist ignition, the structure must retain load capacity, and the interfaces must prevent hidden pathways for flames and hot gases. In synthetic timber technologies, the details that matter most are often the ones that look boring on drawings: joint gaps, fastener patterns, penetrations, and how layers are supported.
Foundations of Assembly Fire Performance
Start with the three outcomes used in most fire tests: integrity, insulation, and load-bearing capacity. Integrity means flames and hot gases cannot pass through the assembly. Insulation means the unexposed side does not exceed temperature limits. Load-bearing capacity applies when the assembly supports structural loads during the test.
A practical way to think about design is to map each layer to a job. For example, a gypsum board layer often provides the primary barrier through endothermic dehydration and char formation. A structural core made from engineered wood alternatives must then maintain geometry and strength long enough for the barrier to do its work. If the core shrinks, cracks, or delaminates early, the barrier can lose contact and integrity.
Layering Strategy for Walls
Walls usually combine a fire-resistant lining with a structural substrate and a controlled cavity. Keep the lining continuous across studs or framing members, and avoid relying on sealant alone at edges. Use a consistent board thickness and fastening schedule, because board failure modes are sensitive to screw spacing and edge distances.
A common best practice is to design the wall as a system of three lines of defense: (1) the fire-rated lining, (2) the cavity barrier at the perimeter, and (3) the penetration seals. For a simple example, consider a stud wall with a synthetic timber composite panel as the backing. If the perimeter gap is left unsealed, hot gases can bypass the lining at the top plate and reach the cavity. The fix is straightforward: specify a perimeter seal detail that maintains contact under thermal movement, typically using a tested sealant or packing method rather than an ad hoc bead.
Floors and Ceilings for Integrity and Load
Floors add a complication: the assembly must resist both fire exposure and structural demand. The underside lining controls integrity, while the top side and any deck or diaphragm layers influence heat transfer and mechanical stability.
When engineered wood alternatives form part of the deck or joist system, pay attention to how the assembly is supported. If the deck is simply laid without a fire-tested bearing condition, thermal expansion and softening can create gaps that allow flame passage. A good practice is to specify bearing length and restraint details that match the test configuration. For example, if a composite deck is tested with a minimum bearing of 25 mm and a specific screw pattern, do not reduce bearing to “make it fit” on site.
Roof Assemblies and Heat Flow Control
Roofs often fail first at edges, penetrations, and junctions where layers change direction. Heat flow is also less forgiving because the fire exposure can involve both underside and, depending on scenario, wind-driven flame impingement.
Design roof assemblies with edge continuity in mind. If a fire-rated ceiling lining terminates at a parapet, the termination detail must prevent a bypass path. A practical example is a roof with a synthetic timber board ceiling and a separate parapet wall. The interface should be treated as a joint, not a coincidence: specify how the ceiling lining is anchored to the parapet and how the cavity is sealed.
Interfaces, Penetrations, and Service Openings
Most real-world failures come from interfaces. Treat every joint line, corner, and service opening as a fire detail with its own acceptance criteria.
For penetrations, the key variables are annular space, material compatibility, and movement. If you seal around a cable bundle with a material that is not rated for the required fire scenario, the seal can crack or shrink away from the opening. Use a tested penetration system and match the installation method, including packing density and thickness.
For joints between panels or boards, specify the joint type and how it is fastened or supported. A butt joint that is left unsupported can open under thermal stress. A simple best practice is to ensure that joint edges are backed by framing or blocking so the lining remains mechanically supported as it heats.
Mind Map: Fire Rated Assembly Design Logic
Example: Wall Assembly Detail That Avoids Bypass Paths
Imagine a wall where a synthetic timber composite panel forms the backing behind a fire-rated gypsum lining. The drawings show a 10 mm gap at the top perimeter for construction tolerance. If that gap is left open, hot gases can enter the cavity and reach the lining’s backside, reducing the effective barrier area.
A robust approach is to specify a perimeter seal detail that closes the gap while allowing for movement. In practice, that means using a tested packing or seal system installed at the perimeter before lining closure. Then, specify the lining fastening schedule so the board stays tight to the framing as it heats.
Example: Floor Deck Bearing Condition That Matches the Test
Consider a composite deck made with engineered wood alternatives. The test configuration assumes a minimum bearing length and a specific fastening pattern at supports. If the field installation reduces bearing to save time, the deck can lose contact as it heats, creating a pathway for flames.
The fix is not complicated: lock the bearing length into the installation method and verify it during inspection. Pair that with a fastening schedule that matches the tested pattern, including edge distances, so the lining and deck behave as a single assembly rather than separate parts pretending they are connected.
Design Checklist for Construction Reality
Use a short, enforceable checklist tied to the rated configuration: confirm layer thicknesses, fastening schedules, bearing lengths, perimeter seals, and penetration systems. Then verify that every joint and opening is installed using the same method as the tested assembly. If the design depends on “close enough,” the fire test will disagree.
7. Acoustic and Vibration Performance for Building Use
7.1 Sound Transmission Loss Measurement for Panel Systems
Sound transmission loss (STL) tells you how well a panel system blocks sound energy moving from one side to the other. In building practice, you usually care about two things: how much sound gets through at each frequency, and whether the result is stable enough to compare products and assemblies. STL is measured in a controlled setup so that differences in results come from the specimen, not from the room.
Core Concepts and What STL Actually Measures
STL is reported as a function of frequency, typically in 1/3-octave bands. Higher STL means better isolation. The measurement is based on the relationship between sound power incident on the specimen and sound power transmitted through it. In a lab, you create a known sound field on the source side, measure the transmitted field on the receiving side, and compute STL using standardized procedures.
A useful mental model is to treat the panel as a barrier with multiple paths for sound: direct transmission through the material, transmission through flanking paths via the mounting frame, and transmission through leaks at joints. A “good” STL result requires controlling all three.
Measurement Setup Foundations
Test Rooms and Mounting
Most STL measurements use two rooms separated by the specimen. The specimen is mounted in a rigid test opening so that the frame does not become a sound radiator. If the frame is loose or poorly sealed, you may measure the frame’s behavior instead of the panel’s.
A practical best practice is to seal every interface between specimen and frame with an appropriate gasket or sealant system specified for the test method. For example, if you test a composite panel with a perimeter gasket, you should compress the gasket consistently around the full perimeter rather than “spot sealing.”
Source and Receiver Instrumentation
On the source side, a loudspeaker generates sound, and microphones capture the sound field. On the receiving side, microphones measure the transmitted sound field. You also need a way to characterize the receiving room’s absorption or reverberation time so that the calculation can separate transmitted energy from room acoustics.
A common workflow is to run multiple microphone positions in the receiving room and average results. This reduces sensitivity to standing waves and local anomalies.
Step-by-Step Measurement Procedure
Prepare the Specimen and Verify Geometry
Record specimen dimensions, thickness, and construction details. If the panel includes layers, note the orientation so you can repeat the test consistently. Inspect the surface for damage that could create unintended leakage or local stiffness changes.
Example: If you test a panel with a thin facing layer, a small delamination near the edge can create a micro-gap. That gap can dominate low-frequency results because air leakage often behaves differently than structural transmission.
Seal and Mount Without Introducing New Paths
Mount the specimen using the test frame designed for the method. Ensure uniform gasket compression and avoid over-tightening that could warp the panel. Measure and document the mounting torque or clamp pressure if the method allows it.
Example: For a panel with a tongue-and-groove edge, do not leave the groove unsealed just because it looks “tight.” The groove can act as a leak path under pressure differences.
Calibrate and Establish Steady Conditions
Calibrate microphones and verify that the source produces stable output across the frequency range. Use a frequency sweep or band-limited signals as required by the method.
A practical check is to confirm that the source level does not drift during the run. If it does, your STL curve will show artificial dips or peaks.
Measure Reverberation and Background
Measure background noise levels and the receiving room’s acoustic characteristics. If background noise is high relative to transmitted sound at some frequencies, STL values become unreliable.
Example: In the mid-to-high frequencies, background noise may be low enough to trust results. In low frequencies, HVAC rumble or traffic noise can raise the noise floor and flatten the STL curve.
Compute STL and Apply Corrections
Compute STL from measured levels and room parameters using the standardized equation for the chosen test method. Apply any required corrections for background noise, flanking, and reference conditions.
A key nuance is that flanking transmission can reduce STL, especially for lightweight panels. If the method includes a flanking correction or separate flanking test, follow it rather than trying to “eyeball” the effect.
Interpreting Results Like a Builder
Frequency Bands and Typical Failure Modes
STL curves often show dips at frequencies where the panel or mounting system resonates. If you see a sharp dip, check whether it aligns with the panel’s expected bending modes or with frame resonances.
Example: A composite panel may show improved STL at high frequencies but a noticeable dip around a frequency where the panel behaves like a plate. If the mounting is too flexible, the dip can deepen.
Comparing Assemblies Fairly
To compare two panel systems, keep test conditions consistent: same frame, same sealing approach, same specimen size, and same measurement method. Even small differences in gasket material or compression can shift results.
Mind Map: Sound Transmission Loss Measurement Workflow
Example: A Practical Panel Test Outcome
Suppose a 20 mm engineered panel is tested in a rigid frame with a perimeter gasket. After sealing and mounting, the STL curve shows strong isolation in mid-to-high frequencies, but a dip at a lower band where the curve drops noticeably. The first check is whether the dip is repeatable across runs; if it is, the second check is mounting and sealing integrity. If the gasket compression was uneven during one run, you might see a larger low-frequency drop due to leakage. If compression was consistent, the dip likely reflects structural resonance, and the next step is to verify mounting stiffness and frame behavior.
7.2 Impact Sound and Floor Assembly Performance Testing
Impact sound is what you hear when something hits the floor: footsteps, dropped tools, or the classic “why is the dog running at 7 a.m.” moment. Testing impact sound is about measuring how efficiently a floor assembly transmits vibration into the room below, then translating that into a rating that designers and builders can compare.
Foundational Concepts for Impact Sound
Impact sound testing uses a standardized tapping machine that applies repeatable impacts to the test floor. Microphones in the receiving room capture the resulting sound pressure over frequency bands. The key output is the normalized impact sound level, which accounts for the room’s acoustics so results are comparable across test setups.
A practical way to think about it: the tapping machine supplies the same “input hammer,” while the receiving room is treated as a “listening box.” Normalization corrects for how reflective or absorptive that listening box is, so the floor assembly’s behavior is the main variable.
Test Setup and Control Variables
Start by controlling what can accidentally change results.
- Receiving room conditions: Similar volume and reverberation characteristics are required, and the room must be prepared consistently (furniture removed, doors closed, HVAC stable).
- Test specimen mounting: The floor assembly must be installed as it would be in the building, including perimeter details. A test that ignores edge conditions can overestimate performance because vibration can escape through flanking paths.
- Tapping machine placement: Use a defined grid or pattern so the machine covers representative areas. If the floor has joists, beams, or panel seams, include positions that stress those features.
- Substrate and finish: The impact sound you care about is the assembly as occupied, so include the underlayment, topping, and any resilient layers that affect vibration transmission.
Measurement Procedure from Input to Rating
- Calibrate the tapping machine so the impact energy is consistent.
- Place microphones in the receiving room at specified locations and heights.
- Run impacts for the required duration per position.
- Record frequency band data and compute the normalized impact sound level.
- Repeat for consistency if the standard requires multiple runs.
The rating is typically expressed as a single-number impact sound level or a spectrum-based rating, depending on the applicable standard. Either way, the spectrum matters because resilient layers often improve low-frequency transmission differently than high-frequency transmission.
Mind Map: Impact Sound Testing Workflow
Example: Diagnosing a “Good on Paper” Assembly
Imagine a floor system with a floating floor over a resilient underlayment. In the lab, the normalized impact sound level looks acceptable. On site, the performance is worse. A common reason is that the floating layer is unintentionally bridged.
Easy-to-understand check: after installation, press along the perimeter and around penetrations. If the floating layer contacts the rigid structure at multiple points, it creates a direct vibration path. In testing, those bridges would show up as higher impact levels, especially in bands where the resilient layer normally decouples the slab.
To prevent this, ensure:
- Perimeter isolation is continuous and not compressed by trim or blocking.
- Penetration detailing includes resilient sleeves or isolation collars.
- Underlayment continuity is maintained across seams.
Advanced Details That Affect Results
Flanking transmission is the biggest “gotcha.” Even if the test floor is well isolated, vibration can travel through walls, columns, or the slab edges into the receiving room. Standards address this by requiring specific construction and sometimes by limiting how the specimen is supported.
Resilient layer behavior also depends on load. A resilient underlayment can perform differently under the weight of a screed or furniture. That’s why the test specimen should include the same mass and layer stack used in the final design.
Seams and joints matter because they can act like short circuits for vibration. If the assembly uses panelized components, include seam regions in the tapping grid.
Example: Choosing Tapping Positions for a Joist System
For a joist-and-deck floor, place impacts:
- Over joists to test direct transmission through the primary framing.
- Between joists to test how the deck spans and couples.
- Near edges to test perimeter coupling.
If the spectrum shows a strong increase at certain bands for impacts over joists, it suggests the resilient layer or decoupling strategy is not sufficiently interrupting the joist-to-deck vibration path.
Reporting Results Clearly
A useful report includes:
- The floor build-up and thicknesses of each layer.
- The installation method and support conditions.
- The tapping machine type and placement pattern.
- Receiving room conditions and normalization approach.
- The measured impact sound levels by frequency band and the resulting rating.
When these details are consistent, impact sound testing becomes less of a mystery and more of a controlled experiment—minus the lab coat, plus the practical value.
7.3 Damping and Vibration Response for Beams and Joists
Damping is the part of vibration that turns motion into heat, friction, and tiny irreversible changes. In beam and joist systems, damping affects how quickly oscillations die out after a footstep, a dropped object, or a rhythmic load. Two structures can have the same stiffness and natural frequency, yet feel different because their damping levels differ.
Foundational Concepts for Damping
Start with the basic model: a vibrating member behaves like a mass on a spring. The natural frequency depends mainly on stiffness and mass, while damping controls the decay rate. Engineers often describe damping using a single ratio (commonly called damping ratio) that summarizes multiple physical mechanisms.
In real buildings, damping is not one thing. It comes from material internal friction, friction at joints and fasteners, micro-slip in connections, and energy loss through surrounding assemblies such as subflooring and ceiling systems. A practical takeaway: if you change only the beam material but keep the same connection details, the damping may not change as much as you expect.
Where Damping Comes from in Beam Joists
- Material damping: Polymer-modified wood, fiber composites, and engineered timber alternatives can show different internal friction compared with conventional timber. The effect is usually modest compared with connection losses, but it matters for higher-frequency vibration.
- Friction damping at interfaces: Joists connected to beams, ledgers, hangers, and blocking can dissipate energy through micro-slip. Tight, well-fitted connections tend to reduce slip and can lower damping at some frequencies, while allowing controlled slip can increase damping.
- Panel and flooring participation: Subfloor panels, sheathing, and ceiling boards add constrained-layer behavior. Even when they do not significantly change the natural frequency, they can increase effective damping by adding additional deformation modes.
- Boundary conditions: A joist that is simply supported behaves differently from one with continuous restraint. Restraint can shift mode shapes and change how much energy is dissipated at supports.
System Response and Human Perception
Human sensitivity is not uniform across frequency. Floors often feel “bouncy” when the system has low damping near the excitation frequency range created by walking. The same floor can sound acceptable but feel annoying if damping is low and the decay after each step is slow.
A useful engineering habit is to separate two questions:
- How strong is the vibration? This depends on stiffness, mass, and excitation.
- How fast does it fade? This depends on damping and coupling to adjacent elements.
Modeling Damping in Practice
For design and verification, damping is commonly treated as an equivalent value in dynamic models. The equivalent damping represents the combined effect of material and connection losses. Because damping is frequency-dependent in reality, the “single number” approach works best when you calibrate it to the relevant vibration range.
A practical workflow:
- Identify the dominant vibration mode for the floor system (often the first bending mode for joists).
- Estimate or assume an equivalent damping ratio based on similar assemblies and connection tightness.
- Check sensitivity by varying damping within a reasonable band to see whether comfort-critical outcomes change materially.
Mind Map: Damping Pathways and Design Levers
Example: Connection Choice Changes Decay Rate
Consider a joist span with a subfloor screwed down. If the screws are spaced widely, the subfloor can move slightly relative to the joists, creating slip at the interface. That slip can increase damping, making vibrations decay faster after a step. If the screws are tightened densely, slip reduces, and the system can become more “springy” even if stiffness increases.
The key is not to chase maximum damping blindly. Instead, aim for a connection strategy that balances stiffness, mode shape, and controlled energy dissipation. In practice, you can test the sensitivity by comparing two fastening patterns that meet strength requirements but differ in interface slip potential.
Example: Blocking and Flooring Participation
Two floors with identical joist properties can differ in vibration response because one includes blocking and the other does not. Blocking limits relative motion between joists, which can reduce certain deformation modes. Meanwhile, the subfloor becomes more engaged in the bending response, which can increase effective damping through additional deformation and friction at fasteners.
A simple check during detailing: if the subfloor can “hinge” between joists due to missing blocking, expect different damping behavior than in a fully supported layout.
Advanced Details Without the Mystery
When you refine the design, focus on how energy travels:
- If energy is trapped in the joist bending mode with minimal interface motion, damping will be lower.
- If energy repeatedly transfers into interfaces and panels, damping increases.
This is why small detailing changes—fastener pattern, edge support, bearing length, and restraint at supports—can noticeably change how quickly vibrations fade. The goal is a system where the dominant mode is controlled and the decay rate is consistent with the intended floor use.
7.4 Detailing for Flanking Paths and Air Leakage Control
Air leakage and flanking sound transmission often share the same root cause: discontinuities. If a floor assembly has a small gap, air will find it, and sound will follow through the same route. The goal of this section is to treat the assembly like a system—seals, interfaces, and penetrations—so both air and sound have fewer escape routes.
Foundational Concepts for Flanking and Leakage
Flanking paths are secondary routes where vibration or pressure waves travel outside the intended load path. In practice, they show up as sound arriving through side walls, rim zones, service cavities, or the underside of a floor. Air leakage is the movement of air through cracks, joints, and imperfect interfaces, driven by pressure differences from wind, stack effect, and HVAC operation.
A useful rule: if you can feel or see airflow at a joint, you can expect sound to use that joint too. That doesn’t mean every leak equals poor acoustics, but it means the detailing work is doing double duty.
Pressure Control First, Then Mechanical Isolation
Start with air control because it reduces pressure-driven movement. Then address mechanical isolation by preventing rigid connections that bypass the resilient or absorptive layers.
Example: In a wall-to-floor junction, if the air barrier is continuous but the wall studs are rigidly tied through the resilient layer, you may still get flanking. Conversely, if the studs are isolated but the air barrier is broken at the base, you may get both drafts and audible “hiss” that correlates with sound transmission.
Detailing Principles That Prevent Flanking
- Keep the acoustic and air control layers aligned. When the air barrier stops at a different plane than the acoustic layer, you create a cavity that can act like a sound conduit.
- Avoid hard bridges across resilient layers. Use isolation gaskets and maintain separation at hangers, brackets, and edge trims.
- Seal interfaces, not just surfaces. A sealant bead on a face is less effective than sealing the joint line where materials meet.
- Treat corners and junctions as primary risk zones. Most failures cluster at transitions: floor edges, wall corners, and around penetrations.
Detailing Principles That Prevent Air Leakage
Air leakage control relies on continuity and correct material selection.
- Continuity: The air barrier must be unbroken across the assembly. If you use tape, ensure it bridges the same joint geometry every time.
- Compatibility: Sealants and tapes must bond to the actual substrates present, including primers where required.
- Durability: Joints should tolerate construction tolerances without cracking. If the joint opens during installation, the seal will not survive.
Example: A rim joist area often has irregular surfaces. If you rely on a single sealant line without addressing gaps behind it, the seal can look intact while air passes through the hidden void.
Mind Map: Flanking Paths and Air Leakage Control
Penetrations and Service Routes
Penetrations are where both air and sound routes multiply. The detailing approach should be consistent: seal the annulus, decouple the penetration from the surrounding structure, and avoid creating a rigid sleeve that bypasses the intended isolation.
Example: For a pipe passing through a floor assembly, use a sleeve or collar system that allows sealing while preventing direct metal-to-structure contact across the resilient layer. Seal the annulus with an appropriate fire-rated and acoustically compatible sealant, and ensure the seal is continuous around the full perimeter.
Rim Zones and Wall-to-Floor Junctions
Rim zones are notorious because they combine geometry changes with multiple materials. A practical approach is to treat the junction as three layers: structural support, air barrier continuity, and acoustic isolation.
- Structural support: Provide stable bearing without forcing rigid contact through resilient layers.
- Air barrier continuity: Seal the joint line and ensure the air barrier wraps or interfaces correctly at the edge.
- Acoustic isolation: Use gaskets or isolation strips where brackets or trims cross the resilient boundary.
Example: If a base trim is fastened directly to the underside of a resilient layer, it can become a flanking bridge. Instead, fasten to the intended substrate and keep the resilient boundary uninterrupted.
Verification and Quality Checks
Field verification should be simple and targeted.
- Joint-by-joint inspection: Confirm sealant coverage at every junction type used in the project.
- Airflow checks: Use smoke or controlled airflow at representative joints to confirm continuity.
- Consistency checks: If one crew uses a different tape or sealant at the same joint detail, treat it as a potential failure point.
Example: During walkthroughs, compare the same junction at two locations. If one has a visible gap at the air barrier interface and the other doesn’t, prioritize sealing correction there before moving on.
Integrated Example: A Wall-to-Floor Junction with Penetrations
Consider a floor assembly with a resilient layer and an air barrier that must continue into the wall. The correct sequence is: install the resilient boundary, form the air barrier continuity at the junction line, isolate any brackets that cross the resilient zone, and seal penetrations with a system that prevents rigid contact while maintaining a continuous seal.
If any one of these steps is skipped, the assembly can still “work” structurally, but you’ll likely see either drafts, audible leakage, or unexpected flanking sound arriving through the same bypass route.
7.5 Example Assembly Configurations for Practical Installations
This section shows how to translate acoustic and vibration goals into real installation layouts for engineered wood alternatives. The key idea is simple: sound and vibration travel through the structure, so your assembly must control both the direct path and the side paths.
Foundational Setup for a Repeatable Layout
Start with a target performance statement, even if it is informal. For example, in a typical multiuse room you may want:
- Reduced impact noise between floors
- Stable panel behavior under humidity swings
- Connections that do not create a “hard bridge” from room to room
A practical way to design is to separate the assembly into three layers of responsibility:
- Primary load path (beams, joists, panels)
- Acoustic isolation layer (resilient materials, decoupling gaps)
- Surface and enclosure layer (drywall, sheathing, finishes)
Mind Map: Assembly Decisions
Example A: Floor System Layout for Impact Noise Control
Imagine a floor built with engineered wood alternative panels over a joist system. The goal is to reduce impact noise from footsteps.
Configuration:
- Joists support a structural panel layer.
- A resilient underlayment sits between the structural layer and the finish layer.
- The finish layer is installed with controlled fastener engagement so it does not clamp the resilient layer into a rigid connection.
Best-practice moves with concrete examples:
- Resilient layer continuity: If the underlayment is cut around a pipe, keep the cut edges tight and tape or seal the seam so the resilient layer does not become a leak path for vibration.
- Avoiding hard bridges: At perimeter edges, do not let fasteners bypass the resilient layer and contact the joists directly. For instance, if you use a perimeter trim, attach it to the wall framing rather than to the floating floor surface.
- Compression control: If the resilient strip is designed to be slightly compressed, stop tightening when the strip reaches its intended thickness. Over-compression turns it into a stiff spacer.
Reasoning: Impact noise is dominated by the coupling between the walking surface and the structural frame. Resilient layers reduce that coupling, but only if they remain continuous and not short-circuited by rigid connections.
Example B: Ceiling or Soffit Assembly for Airborne Sound
Now consider the same building but focus on airborne sound, like voices. A ceiling assembly can be designed to avoid direct transmission.
Configuration:
- A primary ceiling support system is attached to the structure.
- A decoupled lining layer is suspended or resiliently mounted.
- All perimeter and penetration gaps are sealed.
Best-practice moves with concrete examples:
- Perimeter sealing: Where the ceiling meets a wall, apply a continuous sealant line or gasket so air cannot move behind the lining. A small unsealed gap can dominate performance because air movement carries sound.
- Penetration discipline: Around light fixtures or vents, maintain the decoupling strategy. If you install a rigid sleeve through the decoupled layer, the sleeve becomes a sound conduit; instead, use a flexible interface that preserves isolation.
- Consistent spacing: Keep the lining spacing uniform. Uneven contact points create local rigid spots that reduce the benefit of the decoupling layer.
Reasoning: Airborne sound is transmitted through both mass and leakage. Even a heavy lining underperforms if air can bypass it through gaps.
Example C: Wall Assembly for Flanking Control
Walls are where side paths show up. A wall can meet its target in the center but fail at corners if the assembly is not continuous.
Configuration:
- Structural studs or framing support a wall lining system.
- A resilient layer separates the lining from the framing where appropriate.
- Corner junctions include sealing and controlled connection strategy.
Best-practice moves with concrete examples:
- Corner continuity: At corners, avoid “pinning” the two sides together with long fasteners that bridge the resilient layer. Use connection details that transfer structural loads while keeping acoustic isolation intact.
- Service penetrations: When running cables or small ducts, fill voids around penetrations with appropriate sealant or backing material so the cavity does not become a resonant path.
- Edge treatment: If the wall uses panelized sheathing, ensure edges are supported and sealed consistently. Unsupported edges can flex and create localized vibration.
Reasoning: Flanking occurs when sound energy finds an alternate route through adjacent elements. Good wall detailing reduces those alternate routes by controlling both mechanical coupling and air leakage.
Installation Checklist for the Three Examples
Use the same verification logic on every job:
- Isolation layer integrity: No missing resilient strips, no shortcuts around penetrations.
- Seal continuity: Perimeters and interfaces are sealed without pinholes.
- Connection discipline: Fasteners do not bypass isolation layers or create unintended rigid bridges.
- Uniform assembly geometry: Spacing and alignment match the design intent.
These examples show that “acoustic performance” is not only a material property. It is an installation behavior: what touches what, where the air can move, and how consistently the assembly is built.
8. Connection Systems and Structural Detailing
8.1 Fastener Types Including Screws Nails and Bolts
Fasteners are the “last-mile” of structural performance. In synthetic timber and engineered wood alternatives, the goal is simple: transfer forces reliably without crushing, splitting, or loosening the composite layers. The right fastener type depends on the load path (tension, shear, bearing), the joint geometry (edge distances and thickness), and the material’s behavior under moisture and cyclic loading.
Foundational Concepts for Choosing Fasteners
Start with three questions.
- What force direction dominates? Shear loads usually govern connection design for floors and shear walls; tension loads govern uplift and hold-downs.
- Where does the load enter the material? Bearing stresses concentrate near the fastener shank and head. Engineered composites can be strong in-plane but sensitive to localized crushing.
- How will the joint behave over time? Moisture changes can alter clearances and friction. Cyclic loads can gradually reduce clamping force in some joint types.
A practical rule: if the joint relies on friction alone, you need a fastener system that maintains clamping under service conditions. If the joint relies on mechanical interlock, you need enough embedment and edge distance to prevent splitting or delamination.
Fastener Families and Their Typical Roles
Screws
Screws provide controlled withdrawal resistance and good shear transfer when properly embedded. They are especially useful when you need repeatable installation torque or when you want to connect through multiple layers.
Best practice: use a screw diameter and thread geometry that matches the composite’s density and layer structure. For example, in a multi-layer panel, a coarse thread can increase withdrawal resistance but may raise the risk of local crushing if the panel is thin.
Example: Attaching a synthetic timber wall top plate to a shear wall panel. Use screws with sufficient embedment into the structural layer, not just the surface skin. Keep edge distances large enough that the screw threads do not “walk” into a weaker edge zone.
Nails
Nails are fast to install and can work well for light framing and sheathing, but they are less forgiving when withdrawal resistance is critical. In layered composites, nail bending and withdrawal can trigger delamination if the nail penetrates near interfaces.
Best practice: treat nails as shear and bearing contributors, not as the primary mechanism for resisting uplift unless the system is specifically designed for it.
Example: Fixing a roof deck to beams. Nails can be effective for shear transfer if the deck thickness and nail length ensure full engagement with the intended load-bearing layer. If the nail only bites into a thin outer layer, the joint may fail by pull-through.
Bolts
Bolts excel where you need high tensile capacity, robust clamping, and inspectable installation. They are also useful when you must connect through thicker assemblies or when you want to distribute load using washers.
Best practice: use washers to spread bearing stresses and prevent crushing of the composite around the bolt hole. Hole tolerances matter: a sloppy fit reduces clamping effectiveness; an overly tight fit can damage the material during installation.
Example: Connecting a hold-down bracket to a composite shear wall. A bolt with a properly sized washer set can resist uplift while maintaining clamping on the bracket. If you omit washers, the bracket can “sink” into the composite under load cycles.
Mind Map: Fastener Selection Logic
Advanced Details That Prevent Common Failures
- Embedment depth and effective length. For composite materials, “length” is not just total penetration; it is the portion that engages the structural layer. If the fastener crosses a weak interface, the effective engagement drops.
- Edge distance and end distance. Too close to an edge increases splitting risk and reduces stiffness. In layered systems, the edge zone can behave differently because of manufacturing gradients.
- Bearing area management. Screws and bolts both create localized bearing. Washers and head geometry help distribute load. For nails, bearing is concentrated at the head and shank, so nail size and spacing matter.
- Installation quality. Overdriving screws can crush the composite and reduce capacity. Underdriving can leave gaps that increase slip. Bolts should be tightened to the specified condition so clamping is consistent.
Worked Example: Choosing Between Screws and Bolts
Suppose you need to connect a bracket that resists uplift to a synthetic timber shear wall panel.
- If the bracket must resist high tension and you need reliable clamping, bolts with washers are the safer choice.
- If the bracket load is moderate and the connection is primarily shear, screws can be sufficient, provided embedment reaches the structural layer and edge distances are respected.
In both cases, the decision is not about which fastener is “stronger,” but about which one matches the dominant load path and the composite’s local failure modes.
8.2 Adhesive Bonded Joints and Surface Preparation Requirements
Adhesive bonded joints in synthetic timber systems rely on a simple chain: the adhesive must wet the surface, form a strong interphase, and transfer load without premature failure. In practice, the “surface prep” step is where most bonding problems are born—often invisibly—so the goal is to make the surface predictable before you ever mix adhesive.
Core Principles of Adhesive Bonding
Start with surface energy and cleanliness. If dust, release agents, or oxidation films remain, the adhesive may bead instead of spreading, reducing real contact area. Next comes mechanical interlocking. Roughness helps when it is controlled: too smooth gives weak anchoring, while too rough can trap air and create thin, inconsistent adhesive layers.
Finally, match the adhesive to the substrate. Many adhesives tolerate only a narrow moisture range and require a specific surface chemistry. A practical rule: treat surface prep as part of the adhesive system, not a generic “clean and go” step.
Surface Preparation Workflow
Use a repeatable sequence so every joint sees the same conditions.
-
Inspect and classify the substrate
- Identify whether the surface is resin-rich, fiber-exposed, or coated.
- Look for delamination, cracks, or glossy areas that suggest contamination or incomplete curing.
-
Remove contaminants
- Dry wipe first to remove loose dust.
- Follow with a solvent wipe only if the adhesive manufacturer allows it; otherwise use mechanical cleaning.
- Let the surface fully dry before adhesive application.
-
Create controlled roughness
- Light sanding or scuffing is usually safer than aggressive grinding.
- Remove sanding residue completely; trapped particles act like a weak layer.
-
Manage moisture and temperature
- Bonding performance depends on adhesive viscosity and curing kinetics.
- If the substrate is cold, the adhesive may thicken before it wets the surface.
-
Apply adhesive within the open time
- “Open time” is the window where the adhesive remains workable.
- If you exceed it, re-wetting may not restore bond strength.
-
Clamp and cure correctly
- Clamping pressure should ensure intimate contact without starving the joint of adhesive.
- Cure conditions must be consistent; uneven curing creates weak zones.
Mind Map: Surface Preparation and Bond Quality
Practical Examples for Common Substrates
Example: Bonding a resin-rich composite panel
A resin-rich surface can be glossy and low-energy. Begin with scuff sanding to break the film, then wipe away residue. Apply adhesive promptly and clamp to maintain contact. If you see adhesive beading during a trial, treat it as a surface energy issue, not a “stronger clamp” issue.
Example: Bonding to a dusty saw-cut edge
Saw-cut edges often carry fine dust that looks clean to the eye. Use a dry wipe followed by a controlled mechanical clean. Then apply adhesive within open time. If bond lines show voids or peeling at the edge, dust removal was incomplete.
Example: Bonding after storage in humid conditions
Moisture absorbed by the substrate can interfere with curing and reduce interfacial strength. Check that the substrate moisture is within the adhesive’s allowable range, then allow it to equilibrate if needed. During bonding, keep the joint covered to prevent re-wetting.
Advanced Details That Prevent Subtle Failures
Adhesive layer thickness control
Too thick can reduce stiffness and increase creep; too thin can starve the joint. Use spacers or controlled tooling where appropriate, and verify that clamping produces consistent bond line thickness.
Edge sealing and adhesive squeeze-out
For many joints, slight squeeze-out indicates full contact. Wipe excess only after it reaches the correct handling stage so you do not disturb the interphase.
Joint geometry and load path
Adhesive joints perform best when shear transfer is uniform. Avoid abrupt changes in geometry that concentrate stress at the ends. If the joint must carry peel components, increase overlap length and ensure the clamping setup resists separation.
Quick Checklist for Field-Ready Bonding
- Surface is visibly clean and not glossy from contamination
- Roughness is consistent and residue is removed
- Substrate moisture and temperature are within adhesive limits
- Adhesive is applied within open time
- Clamping pressure achieves full contact and consistent bond line thickness
- Cure conditions are maintained until the joint reaches handling strength
Mind Map: Failure Signals and Likely Causes

Example: Diagnosing a Failed Joint Without Guessing
If a bonded specimen fails by peeling along the interface, treat it as a surface prep problem first. Confirm whether the surface was scuffed appropriately, whether residue remained, and whether the substrate was within moisture limits. If the interface looks clean but failure still occurs, reassess adhesive open time and clamping coverage, because a “good-looking” surface can still be poorly wetted due to timing or temperature.
8.3 Mechanical Joint Design for Shear Transfer and Bearing
Mechanical joints are where engineered timber alternatives prove they can behave like engineered products rather than just “big boards.” For shear transfer and bearing, the goal is simple: control how forces flow from one member into the next, then prevent local crushing, slip, and splitting from turning a good global design into a bad local one.
Foundational Force Paths and Failure Modes
Start by identifying the dominant load path. In a shear wall, forces travel from sheathing into framing through fasteners, then into the wall boundary elements through bearing at the ends. In a beam-to-column or beam-to-header connection, shear may be carried by fasteners in a row, while bearing controls how the member compresses under the joint.
Design should explicitly check these common failure modes:
- Fastener slip: the joint deforms before the structure reaches its intended stiffness.
- Fastener pull-through or withdrawal: especially when fasteners are near edges or end grain.
- Member bearing crushing: local compression reduces capacity and stiffness.
- Splitting and edge breakout: fasteners create tensile stresses perpendicular to grain.
- Interlayer shear or delamination-like behavior: relevant for layered or composite timber alternatives.
A practical best practice is to sketch the force path and mark where compression zones and shear planes form. If you cannot point to the bearing area and the shear plane on your sketch, the joint details are not yet “design-ready.”
Bearing Design Principles
Bearing capacity depends on contact area and the material’s ability to resist local compression. For mechanical joints, bearing is often governed by the member’s perpendicular-to-load behavior (for example, compression across the thickness or across layers).
Key practices:
- Use adequate contact area: If the load is transferred through a small plate or direct fastener head bearing, local crushing can govern. Increase bearing area with a plate, washer, or spreader strip.
- Avoid edge and end grain concentration: Bearing near edges increases the chance of splitting. Keep bearing zones away from edges or add reinforcement.
- Control thickness and surface condition: Uneven surfaces create partial bearing contact, which raises local stresses. Ensure flatness and consistent installation pressure.
Example: A shear wall boundary element receives vertical load through a narrow timber alternative end. If the design uses direct bearing from the member end without a plate, the local compression check may fail even when global shear checks pass. Adding a steel plate that spreads the load over a larger area can shift the governing limit from crushing to fastener shear or connector capacity.
Shear Transfer Design Principles
Shear transfer is typically carried by fasteners arranged to resist relative displacement between members. The joint stiffness and ultimate capacity depend on fastener spacing, embedment, edge distances, and the shear plane geometry.
Key practices:
- Arrange fasteners to match the shear plane: If the shear plane is diagonal due to load eccentricity, a single straight line of fasteners may not be enough. Use multiple rows or staggered patterns to keep the shear path continuous.
- Use spacing to control slip: Wider spacing reduces fastener count and can increase joint slip. Tighten spacing where serviceability stiffness matters.
- Respect edge distance rules: Edge distance controls splitting risk. When fasteners are too close to edges, the joint may fail by edge breakout before fastener shear capacity is reached.
- Check group action: Fasteners in a group do not act independently. Overlapping stress zones can reduce effective capacity.
Example: Two members overlap with a single row of screws. Under lateral shear, the overlap region experiences bending and fasteners near the ends see higher demand. Adding a second row and using a staggered pattern can reduce end concentration and improve both stiffness and strength.
Detailing for Robust Load Transfer
Good joint detailing reduces the chance that installation realities undermine the design.
- Prevention of splitting: Use proper pilot holes where required, avoid overdriving, and keep fasteners away from edges and corners.
- Consistent embedment: For screws and nails, embedment depth affects shear and withdrawal. If the member thickness varies, specify allowable tolerances and installation checks.
- Load direction clarity: Specify whether the joint is designed for shear parallel to grain, across thickness, or combined shear and tension. Mixed loading changes governing failure modes.
- Compression control: If the joint relies on tight contact, specify how gaps are handled. A small gap can shift load from bearing to fastener shear.
Mind Map: Mechanical Joint Design for Shear Transfer and Bearing
Worked Example: Two-Member Overlap with Bearing and Shear
Assume a lateral shear connection where member A overlaps member B. The design intent is that fasteners carry shear across the overlap while member B provides bearing under the compressive component.
- Define bearing area: If the overlap relies on direct bearing at member B’s thickness, compute local compression capacity for that contact area. If it is marginal, add a plate or washer to spread load.
- Define fastener layout: Choose a fastener spacing that limits slip under service loads and provides enough fasteners to meet ultimate shear demand.
- Check edge distances: Ensure the first fastener row is far enough from the edge to prevent splitting. If space is limited, use a reinforcement plate or adjust the pattern.
- Check group effects: If fasteners are close enough that stress zones overlap, apply a group reduction approach rather than summing single-fastener capacities.
If the bearing check fails, the joint will crush locally even if fastener shear capacity is adequate. If the shear transfer check fails, the joint may remain uncrushed but will deform excessively due to slip. A good joint design makes both checks pass together, so the connection fails in a controlled, predictable way rather than by whichever mechanism happens to be weakest.
8.4 Edge Distance Spacing and Failure Mode Verification
Edge distance is the quiet rule that decides whether a joint behaves predictably or turns into a collection of local failures. In synthetic timber technologies, where members may be composite panels, laminated boards, or polymer-modified elements, the failure modes around fasteners can shift compared with solid wood. The goal of this section is to help you choose spacing that supports the intended load path, then verify that the governing failure mode matches the design assumption.
Foundational Concepts for Edge Distance
Edge distance is measured from the centerline of a fastener to the nearest loaded edge. Spacing is measured between fastener centers. Both influence stress concentrations in the member and the likelihood of splitting, crushing, or delamination.
A practical way to think about it: the fastener creates a localized “stress cone.” If the cone reaches the edge, the material has less confinement and the failure mode often changes from bearing or withdrawal to splitting or edge breakout. If cones overlap due to tight spacing, the member can fail by a combined mechanism such as row shear or group bearing.
Governing Failure Modes Around Fasteners
For engineered wood alternatives, the most common local mechanisms to check are:
- Splitting or edge splitting: cracks propagate along weak planes or through the thickness, often triggered by insufficient edge distance.
- Bearing failure: the fastener compresses the surrounding material until the local strength is exceeded.
- Withdrawal: the fastener pulls out due to reduced embedment or poor surface bonding.
- Shear-out or edge breakout: the fastener group causes a block of material to separate near the edge.
- Interlayer or interface failure: in layered systems, the load can separate plies or layers if the interface strength is limiting.
Which one governs depends on fastener type, embedment depth, member thickness, loading direction, and whether the material is layered or homogeneous.
Verification Workflow That Stays Systematic
Use a step-by-step process so the verification doesn’t become a guessing game.
-
Confirm the joint geometry and load direction
- Identify whether the fastener is loaded in shear, tension, or combined action.
- Note whether the edge is a cut face, a factory edge, or a laminated interface.
-
Select candidate edge distance and spacing
- Start from the design intent: if you assume bearing governs, you must provide enough edge distance to prevent splitting from becoming cheaper.
- If you assume interface shear governs in a layered member, ensure spacing doesn’t cause group effects that bypass the interface.
-
Compute local capacity for each plausible mechanism
- Evaluate bearing, splitting, withdrawal, and interface-related mechanisms using the appropriate material model for the product.
- Treat the smallest capacity as the likely governing mode.
-
Check spacing interaction effects
- Tight spacing can reduce effective strength due to overlapping stress cones.
- Verify whether the design method includes group reduction factors or requires separate group failure checks.
-
Validate with failure mode consistency
- The verification is not only “capacity is enough.” It is also “the assumed failure mode is the one that would occur first.”
- If your calculations show splitting capacity is higher than bearing capacity, but the geometry is close to the edge, you should re-check because real stress concentrations can shift the governing mode.
Mind Map: Edge Distance and Failure Mode Verification
Example: Two Fasteners Near an Edge
Assume a shear connection using two screws into a laminated composite timber panel. The design method for the product assumes bearing governs when edge distance is adequate.
-
Case A: Edge distance is generous, and spacing between screws is moderate. Local bearing capacity is the smallest computed mechanism. Splitting capacity is higher, and interface shear capacity is higher than bearing.
- Verification outcome: The assumed governing mode (bearing) is consistent with the geometry, so the joint should fail by local bearing rather than edge splitting.
-
Case B: Edge distance is reduced while keeping screw spacing the same. Bearing capacity remains similar, but splitting capacity drops because the stress cone reaches the edge sooner. If the computed splitting capacity becomes smaller than bearing, the governing mode changes.
- Verification outcome: The joint should be redesigned because the failure mode assumption no longer matches the geometry.
A quick sanity check helps: if you can draw a rough stress cone from each screw and see it touching the edge, you should expect splitting or edge breakout to become competitive.
Practical Detailing Checks That Prevent Surprises
- Use consistent edge condition: cut edges can be weaker than factory edges, especially in layered products.
- Avoid fastener placement too close to interfaces: if the edge is a lamination line, interface failure can govern even when bearing seems adequate.
- Confirm embedment depth: insufficient embedment can turn a shear design into a withdrawal or combined failure.
- Document the verification: record the edge distance, spacing, assumed failure mode, and the mechanism that controlled the calculation.
Edge distance and spacing are not just “minimums.” They are the geometry controls that keep the joint’s failure mode aligned with the design model. When the verification is systematic, the joint behaves like the calculation, not like a surprise guest at the meeting.
8.5 Worked Detailing Examples for Beams Headers and Shear Walls
Good detailing is mostly about deciding where forces go, then making sure the materials and fasteners agree with that plan. The examples below use a consistent workflow: identify load paths, choose a joint type, set spacing and edge distances, manage moisture at interfaces, and verify failure modes with simple checks.
Mind Map: Beam Header and Shear Wall Detailing Flow
Worked Example: Beam to Header Transfer at an Opening
Scenario. A floor beam frames into a synthetic timber header above a window opening. The beam delivers vertical load and also creates local bearing pressure at the header.
Step 1: Choose the transfer mechanism. If the beam sits on a bearing surface, the primary action is compression perpendicular to grain (or equivalent plane). If the beam also needs lateral restraint, add a shear connector or a side fastener line.
Step 2: Detail bearing to avoid crushing. Use a full bearing length with a uniform contact area. Place a thin, durable bearing pad only if required to level the assembly; avoid soft pads that creep under sustained load.
Step 3: Add shear transfer with a simple connector layout. Use two rows of screws or bolts near the beam ends, aligned to resist slip. Keep the first row far enough from the header edge to prevent splitting, and keep the second row far enough to avoid creating a weak “hinge” line.
Step 4: Manage moisture at the header top. The header is exposed at the opening. Provide a continuous weather-resistive barrier behind the cladding and a drip edge at the sill line. Seal penetrations so water doesn’t track along fastener shanks.
Step 5: Verify failure modes. Check (a) bearing capacity at the contact zone, (b) fastener shear capacity, and (c) splitting risk near edges. If splitting governs, increase edge distance, reduce fastener spacing, or switch to a connector pattern that distributes load over a wider zone.
Concrete detailing notes. Pre-drill for screws when the header is dense or brittle. If you must shim, shim under the beam bearing area, not under the connector line, so the connectors don’t carry unintended bending.
Worked Example: Header to Side Stud Transfer
Scenario. The header transfers load into side elements that act like short columns. The joint must resist compression and prevent lateral slip.
Step 1: Provide direct load paths. Ensure the header end bears on a solid surface rather than on a thin web edge. If the synthetic timber element has a different thickness than the side member, use a leveling plate that spreads bearing.
Step 2: Use a connector pattern that resists both slip and rotation. A common approach is a staggered screw pattern on the joint faces plus a top and bottom fastener near the bearing corners. This reduces the chance of the joint rotating under load.
Step 3: Control gaps. Leave no large construction gaps at the bearing interface. Small gaps can be filled with rigid shims; avoid compressible fillers that reduce stiffness.
Concrete detailing notes. Keep fasteners away from any adhesive seams or laminated interfaces unless the design explicitly accounts for them. If the header is made from layered components, align connector lines so they don’t concentrate forces at a single weak plane.
Worked Example: Shear Wall Boundary and Coupling at Intersections
Scenario. A shear wall made from engineered wood alternatives resists lateral loads. Boundary elements at corners and intersections must transfer shear into the wall panels and into adjacent framing.
Step 1: Define the lateral load path. Lateral load flows from the diaphragm into the shear wall, then through panel shear to boundary members, then into the foundation or floor system.
Step 2: Detail panel-to-boundary connections for shear transfer. Use a perimeter fastener pattern with consistent spacing. At corners, add extra fasteners to prevent panel edge separation.
Step 3: Prevent edge splitting with correct edge distances. Edge distance is not a “nice-to-have.” It controls whether fasteners pull out, split the panel, or crush the material. If the panel is thin, use shorter fasteners or a different connector type rather than forcing the same pattern.
Step 4: Couple intersecting walls without creating a weak hinge. Where two shear walls meet, provide a continuous boundary element or a connector zone that transfers shear across the intersection. Avoid relying on a single row of fasteners to carry the entire transfer.
Step 5: Manage moisture and air movement at the wall base. Use a sill plate detail that includes a moisture barrier and a sealant strategy at penetrations. Keep the panel bottom edge protected so water doesn’t wick into the connection line.
Concrete detailing notes. If the wall is installed over a slab, use a capillary break under the sill plate. At the panel edges, ensure the WRB and air barrier layers don’t trap water against the panel face.
Mind Map: Connection Checks Before You Build

Quick Synthesis for Consistent Detailing
Across beams, headers, and shear walls, the same logic holds: choose the primary force mechanism, detail the joint so the mechanism can actually occur, and then remove the common failure triggers—splitting at edges, crushing at bearings, and water tracking at interfaces. When those three are controlled, the rest of the design tends to behave like the calculations.
9. Building Envelope Integration and Installation Practices
9.1 Wall and Roof Assembly Integration Including Sheathing and Panels
Wall and roof assemblies work only as a system: the sheathing and panels must carry loads, manage moisture, and provide a stable substrate for air and water control layers. The goal is simple—make sure every layer knows what job it is doing, and that the next layer doesn’t undo the previous one.
Foundational Integration Principles
Start with three requirements that guide every detail.
- Load path clarity: Panels and sheathing must transfer wind, gravity, and diaphragm forces to studs, rafters, and the structural frame. If you can’t trace the forces with your fingers on a drawing, the assembly will be harder to build correctly.
- Moisture direction control: Water should be guided outward, while vapor movement should not trap moisture where it can accumulate. Think of the wall as a one-way street for bulk water.
- Air control continuity: Air leakage often travels through gaps at edges, penetrations, and layer transitions. The air barrier must be continuous across panel seams and around openings.
A practical habit: before specifying materials, sketch a “layer stack” from exterior to interior and label each layer’s job in plain language. This prevents the common mistake of assigning two layers the same job while leaving a third job unattended.
Layer Stack from Exterior to Interior
A typical integrated wall stack with engineered wood alternatives can be organized like this:
- Exterior weather layer: A water-shedding layer such as a weather-resistant barrier (WRB) or integrated panel surface treatment.
- Sheathing and panel layer: Panels provide stiffness and a substrate for WRB attachment. Their edges and fastener patterns matter as much as their field performance.
- Air control layer: Often the WRB or a dedicated membrane, but it must be continuous at seams, corners, and transitions.
- Thermal layer: Insulation placed to avoid compressing the air control layer.
- Interior finish: Drying potential and protection from interior moisture sources.
For roofs, the same logic applies, but gravity and wind-driven rain make the sequencing at eaves, ridges, and valleys especially important.
Sheathing and Panel Interface Details
Panel Edges and Seams
Panel seams are where stiffness, air tightness, and water management meet. Best practice is to specify:
- A seam design that includes the required support under panel edges.
- A fastening schedule that matches the panel thickness and expected loads.
- A seam treatment that aligns with the air and water control strategy.
Example: If you use a panel system with tongue-and-groove edges, still plan for how the WRB will bridge the seam. A WRB that stops at the seam without a continuity method can create a hidden leakage path.
Fasteners and Attachment Zones
Fasteners must be placed where the panel can transfer load without crushing or splitting. Use a consistent rule: attachment patterns should be derived from the panel’s structural design, not improvised on site.
Example: When installing panels over framing that is slightly out of plane, shimming only where allowed by the panel system prevents uneven gaps that later become air leaks.
Transitions at Corners and Openings
Corners and openings concentrate stress and movement. Detail these transitions so the air control layer is not forced to stretch beyond its design.
Example: At a window rough opening, plan the WRB and air control layer to be continuous around the opening with compatible tapes or flashing methods. If the WRB is interrupted at the sill and “patched” later, the patch becomes the first place water finds a path.
Roof Integration with Sheathing and Panels
Roofs add two integration challenges: drainage plane continuity and ventilation strategy alignment.
- Drainage plane: Ensure the WRB or roof membrane laps in the correct direction and that panel edges do not create reverse-slope pockets.
- Ventilation: If the design uses ventilation channels, the sheathing and panel layout must not block airflow unintentionally.
Example: In a roof deck using engineered panels, verify that the panel joints are supported and that underlayment laps are not trapped under flashing. A trapped lap can hold water against the deck longer than expected.
Mind Map: Wall and Roof Assembly Integration
Worked Example: One Detail Set That Works for Both Wall and Roof
Consider a project where the same engineered panel family is used for walls and roof decks.
- Define the air control layer as the WRB system that will be continuous across panel seams.
- Specify panel seam support so both wall and roof edges land on framing members.
- Use the same fastening logic across assemblies, but adjust for roof wind uplift requirements.
- Detail openings consistently: flashing at windows and roof penetrations should follow the same continuity rules—water sheds outward, air barrier remains unbroken.
This approach reduces installation variation. Builders don’t need to memorize two different “rules of the road” for the same panel system.
Installation Checks That Prevent Common Failures
Before closing walls or roofs, verify:
- Panel edges are supported and fastened per schedule.
- WRB laps and flashing are continuous at seams, corners, and openings.
- Air control continuity is maintained at transitions between panels and framing.
- Penetrations are flashed so water cannot travel behind the drainage plane.
A quick field method: walk the assembly with a flashlight and look for unsealed gaps at panel seams and around penetrations. If you can see a gap, air can usually find it too.
9.2 Substrate Preparation and Handling to Prevent Damage
A synthetic timber system is only as good as what it sits on. Substrate preparation is the step where you remove the “unknowns” that later show up as squeaks, gaps, uneven loads, or hidden moisture paths. The goal is simple: create a stable, clean, correctly profiled surface that matches the product’s installation requirements.
Foundations of Substrate Readiness
Start with three checks before you touch tools: geometry, cleanliness, and moisture.
- Geometry: Verify flatness and level where panels or boards will bear. If the substrate is wavy, the engineered element may bridge high spots and concentrate stress at edges.
- Cleanliness: Remove dust, paint overspray, curing compounds, and loose debris. Adhesives and sealants behave like picky eaters; they need direct contact with the right surface.
- Moisture: Confirm the substrate is dry enough for the intended adhesive, coating, or fastener corrosion protection. If you can see darkening, feel dampness, or smell mustiness, stop and correct the moisture source.
A practical example: if you’re installing a composite panel floor system over a slab, use a straightedge to map high and low areas. Then plan shimming or leveling so the panel doesn’t end up carrying load through a few contact points.
Surface Preparation Methods That Match the Material
Different substrates require different cleaning and profiling.
- Concrete: Remove laitance and weak surface layers by grinding or scarifying. Vacuum thoroughly. If you use primers or bonding agents, apply them exactly within their specified window.
- Masonry: Brush out mortar droppings and repair spalled areas. Patch materials must cure fully and be compatible with any coatings or sealants.
- Steel: Degrease and remove rust scale. If the system relies on adhesives, ensure the surface profile and cleanliness meet the adhesive manufacturer’s requirements.
- Existing wood: Scrape off loose coatings, replace damaged sections, and ensure the surface is not glossy or contaminated with oils.
A good rule: if you can rub a gloved finger across the surface and see residue, the substrate is not ready.
Handling Practices That Prevent Edge and Face Damage
Engineered wood alternatives often fail in the small ways first: chipped edges, crushed corners, or surface contamination that later blocks bonding.
- Lift and support correctly: Use spreaders or multiple points of support so panels don’t sag during movement. A slight bend can create permanent stress lines.
- Protect edges and corners: Store with edge guards and keep off rough ground. Edges are where moisture and impact damage start.
- Control site contamination: Cover materials when rain is possible. If a panel gets wet, separate it from other panels and allow it to dry under controlled conditions before installation.
- Avoid dragging: Dragging creates micro-gouges that can become crack starters or weak points for sealant continuity.
Example: during a roof deck installation, workers sometimes drag boards across insulation. Instead, stage boards near the work area and carry them with two-person handling to keep edges intact.
Temporary Storage and Staging Logic
Storage is not just “where it sits,” it’s “how it behaves.”
- Elevate from ground: Use spacers so air can circulate and moisture doesn’t wick into the bottom layer.
- Keep it flat: Warping from uneven stacking can transfer into the installed system.
- Sequence deliveries: Install in a way that reduces time exposed to wind-driven rain or repeated temperature swings.
A systematic approach is to stage by installation zone. For each zone, prepare the substrate, then install the corresponding panels the same day or within the specified exposure limits.
Verification Before Installation
Before committing fasteners, adhesives, or sealants, do a quick verification pass.
- Visual inspection: Look for cracks, delamination, or residue.
- Dimensional check: Reconfirm flatness where bearing occurs.
- Moisture check: Use the appropriate method for the substrate and system requirements.
- Compatibility check: Ensure primers, tapes, and sealants are compatible with the substrate and the engineered timber product.
If any check fails, correct it now. Fixing a substrate after installation is like trying to patch a roof after the rain has already found the seams.
Mind Map: Substrate Preparation and Handling
Example: Wall Panel Installation Substrate Workflow
- Inspect the wall framing or sheathing for flatness and repair any protrusions.
- Clean the surface so sealant lines will bond continuously.
- Confirm moisture is controlled, especially around penetrations and window openings.
- Store panels off the ground with spacers and keep edges protected.
- Stage panels by wall bay, then install immediately after substrate verification.
This workflow reduces rework because it prevents the most common early problems: poor sealant continuity, uneven bearing, and moisture trapped behind the assembly.
9.3 Weatherproofing Layers Including Air Barriers and WRB Interfaces
A weatherproofing system is a stack of jobs: keep bulk water out, manage water that gets in, stop uncontrolled air movement, and provide a reliable interface between layers. In practice, the air barrier and the water-resistive barrier (WRB) are often combined or closely coordinated, because air movement is a fast track for moisture.
Foundational Layer Roles
Water-Resistive Barrier Function
The WRB is the layer that sheds or redirects liquid water before it reaches assemblies that can’t tolerate it. It is not the same as a vapor barrier; it is designed to handle wetting and drying cycles.
Example: In a wall with cladding, rain that hits the face can run behind the cladding. The WRB should be continuous so that water flows down and out, rather than finding gaps around fasteners.
Air Barrier Function
The air barrier controls pressure-driven airflow through the building envelope. Even if the WRB is perfect, air leakage can carry moisture into cavities where it condenses.
Example: A small gap around a window rough opening can move enough air to wet insulation. You may not see leaks during a calm day, but you can see staining after a windy rain.
Interface Logic Between WRB and Air Barrier
When the WRB and air barrier are separate materials, the interface must be treated as a system: seams, transitions, and penetrations are where continuity is won or lost.
Example: If the WRB is a sheet membrane and the air barrier is a different product, the overlap and sealing method must be specified so that the air barrier does not “float” away from the WRB at corners.
Layer Sequencing and Continuity
A typical wall sequence (from outside to inside) might include cladding, drainage plane, WRB, air barrier, insulation, and interior finish. The key is that the WRB and air barrier continuity lines should align with the drainage plane strategy.
Best practice: Treat the envelope like a set of continuous planes. If the WRB is continuous but the air barrier is interrupted at a floor line, you have two different systems fighting each other.
WRB Interfaces at Key Details
Sheathing to WRB Transitions
Sheathing edges, joints, and fastener lines need a plan. Sheet WRBs require attention to laps and seam sealing.
Example: If board edges are uneven, the WRB can bridge over a gap and create a channel. Prepping the substrate—flattening ridges and filling voids—reduces seam stress.
WRB to Window and Door Rough Openings
Rough openings are where water and air both concentrate. The WRB should be integrated with flashing so that water sheds outward and air sealing is continuous.
Best practice: Use a flashing sequence that directs water to the exterior at every step, and seal the air barrier around the opening with compatible materials.
Example: A window pan flashing should sit so that water can drain even if the WRB is wet. Then the WRB transitions up the sides and over the head in a way that prevents water from being trapped.
Penetrations and Service Openings
Penetrations include pipes, vents, electrical boxes, and brackets. Each penetration is a potential leak path.
Best practice: Use pre-formed boots or properly detailed flashing sleeves where possible, and seal around penetrations with products rated for the membrane and substrate.
Example: A vent pipe through the WRB should not rely on caulk alone. The flashing should create a shingled path so water runs away from the opening.
Corners, Sills, and Horizontal Surfaces
Corners are stress points where membranes wrinkle or pull away. Horizontal surfaces can hold water.
Best practice: Reinforce corners with properly sized materials and avoid relying on stretched membrane sections.
Example: At a balcony ledger, water can pool at the interface. A drainage strategy plus a correctly flashed WRB transition prevents prolonged wetting.
Air Barrier Continuity Strategy
Air barrier continuity is verified by how you handle joints and transitions. The goal is a continuous “air-tight line” through the envelope.
Example: If you use taped seams on a sheet air barrier, you must ensure the tape bonds to the substrate. Dusty sheathing or wet surfaces can cause poor adhesion, leading to invisible air leakage.
Mind Map: Weatherproofing Layers and Interfaces
Practical Example: Wall Section Integration
Imagine a wall where the WRB is a sheet membrane and the air barrier is a taped system on the same plane. The workflow is: prep the sheathing surface, install the WRB with correct laps, seal seams, then integrate window flashing so the WRB transitions are shingled. Finally, seal penetrations with compatible boots and verify that the air barrier line does not break at the window perimeter or at floor-to-wall transitions.
Result: Rainwater has a drainage path, air movement has a controlled boundary, and the interface details don’t create hidden channels for moisture to travel.
9.4 Sealing and Flashing Details at Openings and Penetrations
Openings and penetrations are where water stops being “mostly managed” and starts being “actively challenged.” The goal of this section is simple: keep bulk water out, let incidental moisture drain, and prevent air leakage paths from turning into water paths.
Foundational Principles for Water and Air Control
- Separate water control from air control. A WRB or equivalent water-resistive layer manages liquid water; an air barrier manages airflow. If you try to do both with one thin layer, you’ll end up with gaps you can’t see.
- Use a drainage-first mindset. Flashing should direct water to the outside and away from the sheathing. Think “shed and drain,” not “seal and hope.”
- Create shingle-lap continuity. Each upper layer overlaps the layer below so water flows outward. When layers reverse order, water finds the first seam and then keeps going.
- Treat penetrations as mini-openings. Pipes, vents, and cable runs need the same logic as windows and doors: water-shedding surfaces, sealed transitions, and a drainage path.
Mind Map: Opening and Penetration Sealing Logic
Window and Door Openings: Sequence That Works
Sill and Base Flashing
Start at the sill because water arrives there first. Install a sill pan or sill flashing that extends beyond the opening edges. Extend it to the exterior face so water can drain out instead of pooling at the bottom of the frame. A practical check: after installation, you should be able to trace a continuous path from any point on the sill to the outside.
Jamb Flashing and Side Transitions
Side flashing should overlap the sill flashing. If you’re using preformed flashing, ensure it wraps the corners without creating wrinkles that can trap water. For flat membranes, cut clean corners and maintain overlap rather than stretching the material to “make it fit.”
Head Flashing and Upper Overlaps
Head flashing goes last and must overlap the jamb flashing. Keep the top edge protected so water doesn’t run behind the WRB. A useful mental model: water should always hit a surface that directs it outward, not inward.
Air Sealing at the Frame Interface
Use an air seal strategy that matches the frame material and WRB. For example, if the WRB is a membrane, the air seal should connect to the air barrier layer, not just the water layer. Seal at corners and at the frame-to-sheathing interface where air leakage commonly forms a “hidden zipper.”
Penetrations: Pipes, Vents, and Service Entries
Penetration Through the WRB
Treat the penetration as a localized opening. Install a flashing collar or boot that provides a water-shedding surface. The flashing should overlap the WRB in the correct direction so water flows over it and out.
Sealing the Interface Without Creating Traps
Avoid sealing in a way that traps water against the WRB. For example, if you use sealant around a pipe, ensure the flashing still provides a drainage path and that the sealant doesn’t bridge over a gap that would otherwise drain.
Multiple Penetrations and Crowded Areas
When several items pass through near each other, flashing becomes a choreography problem. Use a single integrated flashing plane where possible so water doesn’t find a seam between overlapping small pieces. If you must use multiple pieces, maintain shingle-lap order and ensure each piece sheds water over the previous one.
Material Compatibility and Detailing Discipline
Flashing membranes, tapes, sealants, and WRB layers must be compatible. Incompatible materials can lose adhesion or become brittle, which turns a “sealed” detail into a slow leak. A simple practice: before committing, confirm that the tape and sealant are intended for the WRB type and the expected temperature range.
Also, keep the surface preparation consistent. Dust, moisture, and uneven surfaces reduce bond strength. If the WRB is wrinkled or dirty at the tape location, fix the substrate first rather than trying to compensate with more tape.
Example: Window Opening with Integrated Flashing Plan
- Install sill pan flashing with side extensions beyond the opening.
- Apply jamb flashing so it overlaps the sill pan.
- Install head flashing so it overlaps both jambs.
- Connect the air barrier continuity at the frame interface using a compatible sealant or tape system.
- Verify overlap direction by tracing water flow from head to sill.
A quick on-site check: spray water at the head area and observe whether water reaches the sill and drains outward without wetting the interior sheathing plane.
Example: Pipe Penetration Through a WRB
- Fit a flashing boot or collar that sheds water outward.
- Overlap the boot flange over the WRB in the correct direction.
- Seal the boot-to-penetration interface using the manufacturer’s intended method.
- Ensure the WRB around the penetration is clean and dry before sealing.
- Confirm that water would run over the flashing rather than behind it.
Verification Checklist for Installers
- Overlaps follow shingle-lap direction at every seam.
- Sill conditions include a drainage path beyond the opening edges.
- Air seal continuity exists at corners and frame interfaces.
- Penetrations use flashing that overlaps the WRB correctly.
- No wrinkles, fish-mouths, or gaps are left at critical transitions.
When these steps are followed, openings and penetrations stop being the weak points of the envelope and become predictable, testable details—like a well-labeled circuit diagram, except with fewer sparks.
9.5 Installation Checklists for Quality Assurance on Site
A good installation checklist does two things: it prevents avoidable rework and it proves, with evidence, that the installed synthetic timber system matches the design intent. Use it as a sequence, not a pile of forms. Start with site readiness, move through handling and layout, then verify connections, weather protection, and final condition.
Site Readiness and Pre-Install Checks
Confirm the basics before materials arrive on the work face.
- Access and staging: Ensure forklifts and lifts can reach the installation zone without dragging panels across rough ground. Example: set temporary cribbing so boards never sit directly on mud.
- Storage conditions: Keep materials flat, supported, and covered to prevent edge swelling. Example: store off the slab on spacers so air can circulate and water can’t pool.
- Environmental conditions: Verify temperature and humidity are within the product’s installation limits. Example: if the site is very cold, plan for longer conditioning time before fastening.
- Tools and consumables: Check that the correct fasteners, adhesives, tapes, and sealants are on hand and match the approved specification.
- Documentation readiness: Have the latest drawings, approved submittals, and connection details at the work area.
Handling, Layout, and Fit-Up
Most installation defects start as small fit-up issues.
- Inspection on receipt: Look for cracks, delamination, damaged edges, and incorrect product IDs. Example: mark any suspect panel with a tag and isolate it.
- Orientation and labeling: Install with the correct face and layer orientation as specified. Example: if a panel has a wear surface, keep it on the exterior side.
- Dimensional verification: Measure critical spans and compare to design dimensions. Example: if a beam pocket is off by 10 mm, adjust the layout before cutting.
- Cutting and edge treatment: Use approved cutting methods and protect cut edges per the system instructions. Example: seal exposed edges where the design requires moisture barriers.
- Clearances: Maintain required gaps for expansion and for connector tolerances. Example: don’t “force” a tight fit; instead, re-check spacing and re-align.
Connection Verification and Load Path Integrity
Connections are where quality becomes structural.
- Fastener selection: Confirm diameter, length, coating type, and spacing match the detail. Example: if the detail calls for corrosion-resistant screws, do not substitute standard screws.
- Pre-drilling rules: Follow rules for pilot holes to avoid splitting or loss of holding power. Example: for dense boards, pre-drill to the specified diameter.
- Torque or drive depth: Verify consistent embedment depth and avoid overdriving. Example: use a depth stop on the driver and check the first few fasteners with a ruler.
- Adhesive use where required: Apply bead size and coverage exactly as specified, and respect open/curing times. Example: if adhesive skins over, remove and reapply rather than “hoping it cures.”
- Shear transfer surfaces: Ensure mating surfaces are clean, dry, and in full contact. Example: remove dust from joint lines before bonding.
Weather Protection and Moisture Control During Installation
Treat moisture control as a construction phase requirement, not a final inspection item.
- Temporary cover: Keep installed work protected from rain and standing water until the permanent envelope is in place. Example: cover stacks with breathable wrap and secure edges.
- Flashing and penetrations: Verify that openings and penetrations receive sealing and flashing immediately after installation. Example: seal around sleeves before the next trade closes the cavity.
- Drainage paths: Confirm that water can exit where the design intends. Example: do not block weep routes with sealant.
- Drying time: Do not trap wet materials behind membranes. Example: if a panel got wet, document drying conditions and confirm readiness before enclosure.
Quality Evidence and Final Condition Checks
A checklist is only useful if it produces traceable evidence.
- In-process photos: Capture key steps such as joint preparation, fastener patterns, and flashing before cover-up.
- Measurement logs: Record spacing, embedment depth checks, and any deviations with corrective actions.
- Surface condition: Confirm no protruding fasteners, damaged edges, or unsealed cuts.
- Flatness and alignment: Verify that the installed surface meets tolerance requirements. Example: use a straightedge across seams and note any out-of-plane areas.
- Clean-up and handoff: Remove debris that could interfere with membranes or finishes.
Mind Map: Installation Quality Assurance Flow
Example: First-Article Checklist for a Panel Line
Use a short first-article run to prevent repeating mistakes.
- Confirm panel ID, orientation, and edge treatment method.
- Install one representative joint and verify fastener spacing and embedment depth.
- Check joint contact and, if adhesive is used, verify bead coverage and cure timing.
- Photograph the joint before the next panel row is installed.
- Record any deviations and the corrective action before continuing.
Example: Corrective Action Triggers
Define what stops the work.
- Fasteners installed with incorrect length or coating.
- Evidence of splitting, delamination, or damaged edges.
- Joint surfaces contaminated with dust, moisture, or debris.
- Flashing or sealing missed at penetrations before enclosure.
When a trigger occurs, pause the sequence, correct the installed area as required, and document the fix so the next inspection has a clear story.
10. Life Cycle Assessment and Environmental Accounting Methods
10.1 Defining System Boundaries and Functional Units
A life cycle assessment (LCA) only becomes useful when you define what the study is actually measuring. “System boundary” answers what is included and what is excluded. “Functional unit” answers what the included system is supposed to deliver. If these two are fuzzy, the results will be precise in the wrong direction—like weighing a sandwich while leaving the plate out.
System Boundaries: What You Include and Exclude
Start by listing the life cycle stages you might include, then justify the boundary choice based on the decision you’re supporting. For synthetic timber technologies, the boundary often matters most for three reasons: (1) manufacturing energy and binder chemistry, (2) transport and installation practices, and (3) end-of-life pathways that differ from conventional timber.
A practical boundary for building materials typically covers:
- Raw material supply for wood residues, fibers, binders, additives, and any reinforcement.
- Manufacturing of panels, boards, beams, or composite elements.
- Transport to the project site.
- Construction stage impacts that are material-related (waste, packaging, on-site handling losses).
- Use stage impacts that are relevant to the material’s performance (for example, maintenance cycles driven by moisture or durability).
- End of life including disassembly assumptions, recycling routes, and disposal.
Then decide what to exclude. Common exclusions are office overhead, capital equipment used by factories, and general infrastructure impacts, unless they are unusually significant for the product route. Document exclusions so someone else can reproduce your logic.
Functional Units: Turning “A Material” into “A Job”
A functional unit must be measurable and comparable across alternatives. For building products, it’s usually expressed per area, per length, or per installed element over a defined service period.
A good functional unit includes:
- Service delivered (e.g., load-bearing floor support, roof deck covering, wall sheathing performance).
- Quantity basis (e.g., 1 m² of floor system, 1 m of beam, 1 m² of wall assembly).
- Service duration (e.g., the same design life used for all compared options).
- Performance assumptions (e.g., no additional maintenance beyond what the durability design requires).
Example: If you compare a composite panel floor system to a conventional timber joist system, define the functional unit as “supporting 1 m² of floor area for the same service duration while meeting the same deflection and vibration criteria.” That forces the comparison to reflect what the building needs, not just what the material is.
Mind Map: Boundary and Functional Unit Workflow
Example: Boundary Choices for a Composite Panel Wall
Suppose you’re comparing two wall sheathing materials: one is an engineered wood alternative with a polymer-modified binder, the other is a conventional wood-based panel.
- Functional unit: “1 m² of wall sheathing providing the required moisture resistance and structural contribution for 50 years, installed as part of the same wall assembly.”
- System boundary:
- Include raw materials and binder production.
- Include manufacturing energy and panel yield losses.
- Include transport to the site using the same distance and packaging assumptions.
- Include construction-stage waste based on realistic cutting losses.
- Include use-stage maintenance only if the durability design requires it.
- Include end-of-life outcomes using the same disassembly assumptions for both options.
- Exclusions: exclude generic building infrastructure and site office energy, because they don’t vary meaningfully between the two sheathing options.
Example: Avoiding a Common Boundary Trap
A frequent mistake is defining the functional unit as “1 m² of installed panel” while the two options have different thicknesses and different contributions to the wall’s performance. If one system needs an extra layer to meet the same requirement, the functional unit should reflect the full wall performance, not just the panel quantity. Otherwise, you end up comparing a thinner product that quietly shifts work to another component.
Practical Checklist for Writing the Boundary Section
- State the functional unit with service duration and performance basis.
- List included life cycle stages and the reason for each inclusion.
- List excluded items and confirm they are not driving differences.
- Specify how you treat waste, yield, and replacement triggers.
- Confirm that all compared alternatives share the same functional unit and service duration.
A well-defined boundary and functional unit make the rest of the LCA behave: data mapping becomes straightforward, comparisons become fair, and results become interpretable without guesswork.
10.2 Inventory Data Collection for Materials and Manufacturing Energy
Inventory data collection turns a building product into numbers you can use in an LCA. The goal is not to guess; it is to measure what you can, document what you cannot, and keep the accounting consistent across materials and plants. A good workflow starts with boundaries and ends with a dataset that another team could reproduce.
Define the Inventory Scope and Functional Unit
Start by restating the functional unit for the system you are modeling, such as “1 m² of floor assembly at a specified service life” or “1 m³ of structural element meeting strength class X.” Then define what the inventory includes: raw material extraction, binder production, panel manufacturing, transport to the factory gate, and any on-site processes under your control. Keep the scope aligned with the rest of the chapter so you do not later discover that you counted energy twice or missed a key input.
A practical check: list every process step you would see on a production line map, then mark each step as included or excluded. If you exclude something, record the reason and the boundary rule.
Build a Data Hierarchy That Matches Data Quality
Use a hierarchy so you can balance effort and accuracy.
- Primary plant measurements: metered electricity, steam, natural gas, compressed air, and process water.
- Supplier-specific data: resin/binder energy from manufacturer statements or verified EPD-style datasets.
- Industry-average datasets: used only when primary data is unavailable.
For each input, record the data source type and the time period. If you need a reference date, use a date like 2026-03-15 for dataset versioning in your internal documentation.
Collect Manufacturing Energy Using Metered and Normalized Inputs
Manufacturing energy is usually split into utilities and process loads. Utilities include heating, drying, and steam generation; process loads include pressing, mixing, conveying, and material handling.
Measure where possible:
- Electricity: kWh from plant meters, ideally separated by production area.
- Thermal energy: fuel consumption converted to MJ using standard lower heating value.
- Steam and hot water: meter readings or boiler logs.
Normalize energy to the product output. Use a mass or volume basis that matches your LCA unit. For example, if a line produces 12,000 kg of panels per day and consumes 18,000 kWh, the electricity intensity is 1.5 kWh/kg for that production period.
Then account for yield and scrap. If 8% of material becomes offcuts or rejects that are not reprocessed into the same product, the inventory should reflect the extra upstream material required to produce 1 kg of saleable product.
Capture Material Inputs and Their Embedded Energy
For each bill of materials item, collect:
- Mass fraction in the final product.
- Moisture content at the time of manufacturing.
- Binder type and dosage.
- Additives such as coupling agents, waxes, or fire-retardant components.
Embedded energy comes from upstream processes tied to each input. The key is consistency: if you use a dataset for “phenolic resin,” use the same dataset family for all products in the study rather than mixing unrelated sources.
A concrete example: if two panel grades use the same wood furnish but different resin dosages, you can keep the wood furnish inventory constant and update only the resin and any associated curing energy differences.
Manage Allocation Rules for Co-Products and By-Products
Allocation prevents double counting when a process produces more than one output. Common cases include:
- By-products from wood processing used as fuel or sold as material.
- Energy recovery from waste streams.
Choose an allocation method and apply it consistently. For instance, if a plant produces both boards and offcuts that are reused internally, you may allocate energy based on mass of saleable outputs, while treating internal reuse as a closed-loop input rather than a new upstream purchase.
Document Data Quality and Uncertainty Drivers
Data quality is not a vibe; it is a checklist.
- Temporal representativeness: how close the data is to the production period.
- Geographic representativeness: country or grid mix for electricity.
- Technological representativeness: similar equipment and operating conditions.
- Completeness: whether any major utility streams are missing.
Identify the biggest uncertainty drivers. Often these are binder energy, thermal efficiency, and yield assumptions.
Mind Map: Inventory Data Collection Workflow
Example: Converting Plant Logs into an Inventory Entry
Suppose a panel line uses 9,600 kWh electricity and 240 GJ of thermal energy to produce 6,000 kg of finished panels in a month. Electricity intensity is 1.6 kWh/kg, and thermal intensity is 40 MJ/kg. If the resin dosage is 12% by dry mass and the panel yield is 92%, then producing 1 kg of finished panels requires 1/0.92 = 1.087 kg of dry furnish and resin inputs. The inventory entry for “1 kg finished panels” then combines:
- Upstream inventories for wood furnish, resin, and additives scaled by 1.087.
- Electricity and thermal energy scaled by the normalized intensities.
- Any scrap treatment or internal reuse flows handled under the chosen allocation rule.
This approach keeps the dataset coherent: energy and material inputs are tied to the same production period, the same yield logic, and the same functional output.
10.3 Modeling Transport Packaging and Construction Stage Impacts
Life cycle assessment (LCA) models construction impacts by turning real project logistics into measurable flows: how much material moves, how it’s protected, and what energy and equipment are used to install it. The key is consistency—use the same functional unit and the same system boundary choices you used for earlier stages, then add transport, packaging, and construction activities as separate, traceable modules.
Define the Modeling Scope for Logistics
Start by listing every movement that affects the product’s footprint. For synthetic timber alternatives, that usually includes raw material delivery to the plant, finished product shipment to the site, and any on-site handling steps that consume energy. Packaging is modeled as its own flow because it can be reused, recycled, or landfilled differently than the timber product.
A practical way to avoid gaps is to separate three questions:
- What is transported? (product mass, packaging mass, pallets, fasteners if they are supplied with the product)
- How far is it transported? (distance by mode)
- What happens during installation? (equipment hours, electricity, fuel, waste handling)
Build a Transport Inventory That Matches the Project
Transport modeling begins with quantities and distances. Use the bill of quantities to compute mass per installed unit, then multiply by the number of units. If the project uses multiple delivery rounds, model each round separately because the average distance can hide large swings.
Example: A floor system uses 12 m³ of engineered panels. If panels are delivered in 3 truckloads, each load carries 4 m³. Model each truckload with its own distance and load factor. Load factor matters because emissions per ton-kilometer change with how full the truck is.
For transport modes, keep it simple but honest: if you know it’s a mix of regional trucking and final delivery, represent it as two legs. If you only know “truck,” use trucking for the entire leg rather than guessing rail or ship.
Model Packaging as Material Flows with End-of-Life Paths
Packaging modeling requires two numbers: packaging mass per unit and the fate of that packaging after use. Even when packaging is lightweight, it can dominate impacts if the product itself is low mass or if packaging is not recovered.
A common packaging set for engineered wood alternatives includes stretch wrap, corner protectors, edge guards, and pallets. If pallets are reused, model the pallet as a service with multiple trips; if pallets are discarded, model them as waste.
Example: If each pallet supports 1.5 m³ of panels and is reused 10 times, allocate pallet impacts across those 10 trips. If the project site returns pallets to the supplier, the end-of-life allocation differs from a scenario where pallets are landfilled.
Construction Stage Modeling as Equipment and Waste Accounting
Construction stage impacts cover energy use and emissions from installation activities. Model them using activity data where possible: crane operation hours, forklift time, cutting and drilling energy, and site electricity for tools. When activity data is missing, use a proxy based on installation time per unit area or per element, but document the basis so the model remains auditable.
Waste is part of construction stage impacts. Include offcuts, damaged material, and packaging waste. The important nuance is treatment: recycling, incineration, or landfill have different emission profiles. If synthetic timber products are not accepted by local recycling streams, treat them accordingly rather than assuming generic recycling.
Example: During installation of a wall panel system, 6% of panel area becomes offcuts. If offcuts are collected and processed as a similar material stream, model that route; if they are landfilled, model landfill disposal. The difference can be larger than the difference between two transport distances.
Allocation Rules for Mixed Deliveries and Shared Equipment
Construction sites often share equipment across trades. Allocation prevents double-counting by distributing equipment impacts across the activities that use them. Use a clear rule such as time-based allocation (equipment hours per trade) or area-based allocation (installed area per trade).
Example: A forklift is used for multiple material deliveries. If the forklift runs 12 hours total and engineered timber installation accounts for 3 hours, allocate one quarter of forklift fuel and electricity to the timber product.
Mind Map: Modeling Transport, Packaging, and Construction Stage Impacts
Worked Example with Integrated Accounting
Assume 12 m³ of panels are installed. Panels are delivered by truck in three rounds of 4 m³ each over 180 km, 120 km, and 160 km. Each m³ requires 2.5 kg of stretch wrap and 1 pallet that supports 1.5 m³. On site, installation uses a forklift for 3 hours and cutting tools for 6 kWh total. Offcuts are 6% by area and are landfilled.
Modeling steps:
- Compute product mass from density and multiply by each delivery leg’s ton-kilometers.
- Compute packaging mass from per-m³ values and allocate pallet impacts across reuse trips.
- Add construction energy from forklift and tools, using the site energy source assumptions.
- Add waste impacts from offcuts and packaging, using the disposal route for each waste stream.
The result is a transport-and-construction subtotal that can be compared to earlier stages without mixing categories. That separation is what keeps the model from “averaging away” the real drivers—distance, packaging recovery, and waste handling are often the ones that move the needle.
10.4 End-of-Life Pathways Including Reuse Recycling and Disposal
End-of-life planning starts with a simple question: what happens to each material stream when the building is dismantled? For synthetic timber technologies, the answer depends on three things—how the product is bonded, what it contains (fibers, binders, additives), and how it is attached (fasteners, adhesives, hybrid assemblies). A practical approach is to map the pathways by material stream rather than by building component.
Foundational Concepts for Pathway Planning
Begin by separating the end-of-life inventory into four streams.
- Reusable components: elements designed for disassembly, such as panels on mechanical fasteners.
- Recyclable fractions: materials that can be processed into feedstock, such as fiber-rich composites.
- Recoverable energy: non-recyclable residues suitable for controlled thermal treatment.
- Disposal: materials that cannot be safely processed in the available system.
A key best practice is to record the “bonding story” for each product. If the binder is thermoset and tightly crosslinked, mechanical recycling may still be possible (size reduction and fiber recovery), but chemical recycling may require specialized facilities. If the binder is thermoplastic or hybrid, reprocessing options can be broader. This is why end-of-life pathways should be specified alongside installation details.
Mind Map: End-of-Life Pathways
Reuse Pathway with Concrete Examples
Reuse works best when the product is treated like a kit of parts. For instance, a wall panel system installed with accessible screws and standardized bearing details can be removed without tearing the panel face. A practical workflow is to define acceptance criteria before demolition: maximum delamination length, allowable edge damage, and whether coatings remain intact. If the panel has been exposed to persistent wetting, reuse may still be possible, but only after moisture history is verified and the material meets dimensional stability thresholds.
A simple example: a community retrofit replaces interior partitions. If the partitions were mounted with removable tracks and mechanical connectors, the panels can be reinstalled in a non-structural role elsewhere. The reuse claim is stronger when the documentation includes product identity and installation method, because it reduces uncertainty about binder condition and contamination.
Recycling Pathway with Concrete Examples
Recycling starts with sorting. Fiber-rich composites are often recyclable only if they are not heavily contaminated with incompatible coatings, insulation foams, or mixed metals. A best practice is to plan for “clean separation zones” during design—clear labeling of panel types, standardized connector types, and predictable disassembly order.
Mechanical recycling example: a damaged floor deck panel is shredded to reduce particle size, then separated into fiber-rich fractions and binder-rich fines. The fiber-rich fraction can be used for non-structural boards, while binder-rich fines may be directed to energy recovery. The important nuance is performance matching: the recycled output must meet the target properties for its new role, not the original structural grade.
Chemical recycling example: if the binder chemistry supports depolymerization, the process may require controlled feedstock purity and specific temperature and solvent conditions. In practice, this means the product specification should state binder family and any additives that could interfere with processing.
Recovery and Disposal with Concrete Examples
When recycling is not feasible, energy recovery can still be a controlled pathway. The decision hinges on residue characterization: binder content, presence of halogenated additives, and contamination from finishes. A practical example is demolition of mixed assemblies where only the core composite is suitable for recovery; metal fasteners and insulation are removed first to avoid processing complications.
Disposal is the last resort. If landfill is used, the goal is to minimize environmental risk through proper containment and stabilization where required. For planning, treat disposal as a defined pathway with known constraints rather than a vague “it goes away” outcome.
Integrated Decision Logic for LCA Accounting
To keep life cycle accounting consistent, apply the same logic across reuse, recycling, and disposal: quantify the mass of each stream, apply pathway-specific allocation rules, and document assumptions about yields and contamination losses. A systematic method is to create a pathway matrix for each component type, listing feasible routes and the conditions needed for each route to be valid.
Example matrix for a composite panel:
- Reuse: feasible if mechanically fastened and moisture exposure is within limits.
- Mechanical recycling: feasible if coatings are removable and contamination is low.
- Energy recovery: feasible if binder residues are within acceptable emissions criteria.
- Disposal: used only for fractions that fail the above constraints.
This approach prevents the common accounting mistake of treating end-of-life as a single number. Instead, it reflects how real dismantling and sorting decisions control what actually happens to the material.
10.5 Interpreting Results for Procurement and Specification Decisions
Procurement decisions become easier when test results are translated into clear acceptance criteria, risk boundaries, and installation requirements. The goal is not to compare numbers for their own sake, but to confirm that the product will behave as intended in the specific building context.
Start with the Decision You Are Actually Making
Begin by writing the procurement decision in one sentence: what component is being bought, for what exposure, and under what performance requirement. For example, “Buy a composite panel for a roof deck assembly in a humid coastal climate, requiring stable stiffness after wetting and drying.” This sentence determines which test results matter and which ones are merely interesting.
Map Test Outputs to Performance Claims
Most product documentation mixes different test types: material properties, assembly behavior, and durability indicators. Treat them as separate layers.
- Material properties answer “What can the product do in a controlled test?”
- Assembly behavior answers “How does it perform when installed with real connectors and layers?”
- Durability indicators answer “How does it change after repeated moisture, heat, or load history?”
A practical habit is to create a two-column checklist: “Requirement” and “Evidence.” If a requirement has no evidence, the specification should either be revised or the procurement should request additional data.
Use Acceptance Logic Instead of Single-Number Comparisons
A single reported value rarely tells the whole story. Interpret results using acceptance logic that includes variability and failure modes.
- Check the test basis: sample size, conditioning state, and loading duration.
- Confirm the failure mode: brittle fracture, delamination, connector slip, or surface cracking lead to different installation implications.
- Verify the margin: compare characteristic or design values to the required design demand, not to the mean test value.
Example: If bending strength is reported as an average, but the failure mode is frequent delamination at the adhesive line, the procurement should require assembly-level shear testing evidence or a tighter adhesive/pressing process statement.
Mind Map: Evidence to Specification Translation
Translate Durability Results into Installation Constraints
Durability tests often show “what happens after exposure,” but procurement needs “what must be controlled on site.” Convert durability findings into constraints.
- If moisture cycling reduces stiffness, specify allowable moisture conditions at installation and require drying/conditioning steps.
- If biological resistance depends on surface treatment, specify coating coverage and inspection method.
- If corrosion risk exists at metal interfaces, specify compatible fasteners and protective measures.
Example: A product that passes moisture cycling in lab coupons may still fail in the field if the installer leaves cut edges unsealed. Procurement should require edge sealing details and include them as part of the deliverable scope.
Use “Condition Matching” to Avoid False Confidence
Many test results are produced under a specific conditioning regime. Procurement should ensure the conditioning regime matches the building exposure.
- Roof decks: consider wetting-drying cycles and temperature swings.
- Interior partitions: consider humidity cycling and long-term creep under service loads.
- Shear walls: consider connector behavior and interlayer slip under sustained loads.
If the product documentation uses a conditioning state that does not match the intended exposure, the specification should require either additional test evidence or a conservative design approach that reflects the mismatch.
Build a Procurement Evidence Package That Can Be Audited
A good procurement package is not just a datasheet; it is a set of auditable documents.
- Test reports that state conditioning, dimensions, and acceptance criteria.
- Quality documentation describing how the manufacturing process controls the properties that the tests depend on.
- Installation requirements that connect the tested assembly to the installed assembly.
Example: If the test report assumes a specific adhesive spread rate and curing time, the procurement should require those parameters in the installation method statement and require verification steps.
Example: Interpreting Results for a Roof Deck Purchase
Assume the requirement is “maintain stiffness after repeated wetting and drying.” The documentation includes moisture cycling stiffness retention, but the failure mode is delamination at the bond line when specimens are exposed with unsealed edges. A systematic interpretation leads to three procurement actions:
- Require the moisture cycling report to include edge conditions representative of the installed product.
- Specify edge sealing as a mandatory installation step with inspection criteria.
- Confirm that the design values used in the structural calculation correspond to the characteristic basis implied by the report.
When these steps are followed, procurement stops treating test results as a scoreboard and starts treating them as a chain of evidence that can survive real construction conditions.
11. Specification Documentation and Compliance Workflows
11.1 Writing Product Specifications for Engineered Wood Alternatives
A good product specification does three jobs at once: it tells the supplier what you need, it tells the installer what to do, and it tells the inspector what to verify. For engineered wood alternatives, the tricky part is that performance depends on the whole system—material, manufacturing, moisture exposure, connections, and assembly details—so the specification must be explicit without becoming a novel.
Start with Scope and Intended Use
Define the product category and where it will live. State whether the item is structural or nonstructural, the assembly context (floor, wall, roof, partition), and the expected moisture conditions (dry interior, intermittently wet, exterior sheltered). A simple example: “Composite panel for interior floor underlayment, dry service, no direct plumbing exposure.” This single sentence prevents mismatches like “great for exterior” products being installed where they are unnecessary.
Define Performance Requirements with Measurable Criteria
List the required properties in the same order you expect to verify them. Use test methods or acceptance criteria when possible.
- Mechanical performance: bending strength and stiffness, shear capacity, compressive strength where relevant.
- Dimensional stability: thickness swelling limits and warping tolerances after conditioning.
- Moisture behavior: allowable equilibrium moisture range or conditioning protocol.
- Fire performance: required classification for the product and any required assembly behavior.
- Durability: resistance to biological growth for the intended exposure class.
- Acoustic and vibration: only if the assembly needs it; otherwise avoid over-specifying.
Example requirement phrasing: “Provide panels with documented bending stiffness meeting the design value for the specified span, using the referenced standard test method, with batch-to-batch variability included in the submittal.” That last clause matters because “average test results” are not the same as “design values.”
Require Documented Evidence Through Submittals
Specifications should state what the supplier must submit and how the project will use it.
Minimum submittal set
1. Product data sheet with dimensions, tolerances, and intended use.
2. Test reports for the required properties, tied to the exact product formulation and manufacturing process.
3. Quality control description including sampling frequency and acceptance criteria.
4. Installation instructions including storage, handling, fastening, and jointing.
5. Safety data sheets for adhesives, coatings, or additives used in the product.
A practical best practice: require that test reports reference the same thickness, density range, and surface treatment as the proposed product. If the supplier offers “similar thickness,” you should require a justification that demonstrates equivalency.
Specify Materials and Manufacturing Identity
Engineered wood alternatives can vary widely even within the same category. Identify the product by manufacturing identity, not just by name.
- Panel type: particle-based, fiber-based, strand-based, or hybrid.
- Binder system: thermoset, thermoplastic, or hybrid, including whether it is factory-cured.
- Surface layers: wear layer, facing, coating, or encapsulation.
- Core composition: wood fraction, fiber orientation approach, and any reinforcement.
Example: “Factory-manufactured composite panel with specified binder system and factory-cured surface layer; do not substitute field-applied coatings for the factory facing.” This prevents a common failure mode where the installed product differs from the tested one.
Lock Down Handling, Storage, and Installation Requirements
Performance claims only hold if the product is treated correctly between delivery and completion.
Include requirements for:
- Storage: keep flat, off the ground, protected from rain and standing water.
- Moisture exposure: maximum allowable time on site before installation.
- Cutting and edges: whether edges must be sealed and what sealant is acceptable.
- Fastening and spacing: fastener type, spacing, edge distances, and predrilling rules.
- Jointing: gap requirements, tongue-and-groove behavior, and adhesive use.
Example installation clause: “Store panels flat on level supports; protect from precipitation. Seal cut edges when the assembly is exposed to intermittent moisture, using the specified compatible edge sealer.”
Define Inspection and Acceptance Criteria
Tell the inspector what to check and what constitutes a reject.
- Verify delivered product matches submittals: thickness, grade, batch/lot identification.
- Check storage conditions and visible damage limits.
- Confirm installation details: fastening pattern, joint treatment, edge sealing.
- Require documentation of any deviations and corrective actions.
A helpful approach is to include a short acceptance checklist in the specification so the field team and the reviewer are aligned.
Mind Map: Product Specification Workflow
Example: Specification Snippet for a Composite Panel
Provide factory-manufactured composite panels for interior floor underlayment in dry service. Panels shall meet specified bending stiffness and shear capacity for the design span, using the referenced standard test method. Thickness swelling after conditioning shall not exceed the stated limit. Submit product data, test reports for the exact panel thickness and surface treatment, and installation instructions. Store panels flat on level supports, protected from precipitation. Seal cut edges only where the assembly is exposed to intermittent moisture. Install with specified fastener type and spacing, and verify joint treatment per manufacturer instructions.
Example: Specification Snippet for a Moisture-Sensitive Assembly
Provide engineered wood alternative panels for sheltered exterior wall sheathing with documented dimensional stability under the project’s conditioning protocol. Require test reports demonstrating performance for the specified binder system and factory surface layer. Installation shall include protection from standing water during construction and sealing of all cut edges and penetrations using compatible sealants. Reject panels with delamination, swelling beyond tolerance, or damage that compromises fastening or joint integrity.
A specification that reads like a checklist is easier to follow, easier to inspect, and harder to misunderstand—especially when the product’s performance depends on details that are easy to skip.
11.2 Submittals Including Test Reports Certificates and Quality Plans
A submittal package is the paper trail that connects a product’s lab results to the way it will be installed on a specific project. Think of it as three linked stories: what the material is, how it was proven, and how it will be controlled from delivery to installation.
Foundational Submittal Package Logic
Start with product identity, then proof, then process control. If the identity is unclear, test results can’t be trusted. If proof is missing, quality plans can’t be verified. If process control is weak, even correct test results won’t match what arrives on site.
A complete package typically includes:
- Product description and intended use (structural, nonstructural, interior, exterior)
- Manufacturer and plant identification
- Performance claims supported by test reports
- Certificates of compliance where applicable
- A quality plan describing how the manufacturer ensures consistent output
- Installation-relevant documentation such as handling, storage, and jointing requirements
Product Identity and Intended Use
Include enough detail for the reviewer to confirm you’re not substituting a different formulation. Provide the product name, grade or designation, dimensions, thickness range, and any surface treatments. For engineered wood alternatives, also state the binder system type and whether the product is designed for dry, humid, or wet service conditions.
Example: If a composite panel is specified for a floor deck, the submittal should state the deck’s expected load path role and whether it is rated for the required span direction. A reviewer should be able to match the panel to the structural design assumptions without guessing.
Test Reports That Actually Match the Specification
Test reports should be traceable to the exact product configuration. Confirm that the report includes:
- Test standard and edition
- Specimen description including layup, thickness, density, and any surface layers
- Conditioning method and moisture state at test
- Loading setup and acceptance criteria
- Date of testing and laboratory identification
- Results with units and failure modes where relevant
Best practice: include a short “report-to-spec mapping” table in the submittal cover sheet. Each performance requirement in the project specification should point to the exact report and test method.
Example: If the specification requires fire performance classification, the submittal should show the classification outcome and the assembly context used in the test. A panel-only report is not automatically equivalent to a wall assembly result.
Certificates and Compliance Statements
Certificates are not performance data, but they confirm that the product meets defined administrative or regulatory requirements. Include:
- Certificates of conformity or compliance where required
- Traceability statements linking certificates to manufacturing plants and production batches
- Any third-party certification scope and limitations
Best practice: ensure the certificate scope covers the same product designation and intended use as the test reports. A certificate for one product grade does not cover a different grade with a different binder content.
Quality Plans for Consistent Production
A quality plan explains how the manufacturer prevents drift in material properties. It should cover incoming raw materials, in-process controls, finished product checks, and corrective actions.
Include at minimum:
- Incoming control for feedstock moisture, contamination checks, and binder lot verification
- Process controls for pressing temperature/pressure profiles, curing conditions, and adhesive application rates
- Dimensional and mass checks for thickness, density, and surface quality
- Mechanical sampling frequency and acceptance criteria
- Nonconformance handling and traceability to affected batches
- Calibration and maintenance schedule for critical equipment
Example: If thickness uniformity is critical for connection performance, the quality plan should state how thickness is measured, the tolerance limits, and what happens when results fall outside limits.
Mind Map: Submittal Package Components
Example: Submittal Cover Sheet Outline
Use a cover sheet that reviewers can scan in minutes. Include a checklist that ties each project requirement to a document.
- Requirement: Structural bending performance
- Document: Test Report TR-####
- Notes: Specimen thickness and conditioning state
- Requirement: Moisture-related dimensional stability
- Document: Test Report TR-####
- Notes: Conditioning cycle and equilibrium criteria
- Requirement: Fire classification
- Document: Test Report TR-####
- Notes: Assembly context and classification outcome
- Requirement: Quality control frequency
- Document: Quality Plan QP-####
- Notes: Sampling rate and acceptance tolerances
Quality Plan Evidence and Traceability
To make the quality plan verifiable, include evidence artifacts such as sample inspection forms, batch traceability templates, and calibration records summaries. If a project requires a specific retention period for records, state it clearly.
Example: A batch traceability sheet should show how a delivered pallet or bundle maps to production date, plant line, and the inspection results that apply to that batch.
Final Assembly and Submission Readiness
Before submission, run a consistency check: product designation matches across identity, test reports, certificates, and quality plan. Confirm that the test specimen configuration matches the installed configuration, including thickness and any surface layers. If any document is limited in scope, state the limitation in the mapping table so the reviewer doesn’t have to guess.
A well-structured submittal reduces back-and-forth because it answers the reviewer’s three questions immediately: “What is it?”, “How was it proven?”, and “How will it be controlled?”
11.3 Coordination With Structural Fire and Envelope Requirements
Coordinating fire and envelope requirements is easiest when you treat them as one system: the material, the assembly, the detailing, and the inspection evidence all have to agree. Engineered wood alternatives often perform well in isolation, but real projects fail when the fire-rated assembly is specified without matching the air-water control strategy, or when the envelope layers are installed in a way that changes the fire behavior.
Start with a single “assembly intent” statement that ties together structure, fire, and envelope. For example: “A floor build-up that achieves the required fire resistance while maintaining an air barrier continuity line and a water-shedding plane at the perimeter.” This statement becomes the reference for every submittal and every site check.
Foundational Inputs You Must Lock Early
- Fire requirement basis: the required fire resistance rating for the element, plus any additional constraints such as smoke control or integrity-only versus integrity-and-insulation performance. If the rating is integrity-and-insulation, the envelope layers cannot be treated as “non-participating.”
- Envelope performance basis: air leakage target, water penetration resistance approach, and thermal continuity strategy. If the design uses a continuous insulation layer, you need to confirm how it interfaces with fire-rated cavities and firestopping.
- Assembly boundary definition: where the fire-rated element starts and ends, and where the air and water control layers start and end. A common mistake is letting the air barrier line cross a firestopping interface without specifying the transition.
Coordination Workflow That Prevents Mismatches
Use a three-pass workflow: specification alignment, detail alignment, and inspection alignment.
Pass 1: Specification alignment
- Confirm that the fire-rated product or system is specified as an assembly, not just as a material. The fire rating often depends on joint design, thickness, and surface treatments.
- Confirm that the envelope layers are compatible with the fire assembly. For instance, if the envelope calls for a specific membrane type at a cavity, verify that the membrane does not interfere with required firestopping materials or the intended charring/heat exposure behavior.
- Require submittals that include both fire test evidence and envelope-relevant installation instructions, such as required sealant types and curing conditions.
Pass 2: Detail alignment
- Create a single set of “interface details” for transitions: perimeter edges, penetrations, service cavities, and expansion joints. These are where fire and envelope requirements collide.
- For each interface, specify three things: the firestopping method, the air barrier continuity method, and the water management method. If any one of the three is left to contractor interpretation, you will get inconsistent results.
Pass 3: Inspection alignment
- Translate the interface details into inspection checklists. Each checklist item should map to a visible condition on site, such as “firestop installed to specified depth” and “air barrier seal continuous across the same plane.”
- Require mockups for complex interfaces, especially where the fire-rated element includes concealed cavities that also serve as envelope drainage paths.
Practical Example Perimeter Transition
Imagine a wall-to-floor junction where the floor assembly is required to meet a fire resistance rating, and the wall perimeter must maintain air and water control.
- Fire integrity: specify the firestopping at the floor edge and at any gaps created by panel tolerances.
- Air control: specify a continuous air barrier line that bridges the junction without relying on materials that are not part of the fire-rated assembly.
- Water control: specify drainage and flashing so water that reaches the cavity has a defined path, while firestopping remains intact and not “short-circuited” by missing sealant.
The key coordination move is to ensure the same gap is not “solved” twice with conflicting materials. If the firestopping requires a particular backing or depth, the air sealant must be compatible with that geometry.
Mind Map: Coordination Points Across Fire and Envelope
Example Checklist Items That Actually Get Verified
- Firestopping installed to the specified depth and configuration at the wall-to-floor edge.
- Air barrier continuity maintained across the same junction plane using the specified sealant and tape or membrane system.
- Water-shedding layers and flashing do not block drainage paths intended for the envelope design.
- Penetrations include both the fire-rated sleeve or seal system and the air-water sealing system at the same location.
A good coordination package makes it hard to “do the wrong thing” because the drawings, product instructions, and inspection checks all point to the same interface geometry. When those three agree, the project stops arguing with itself.
11.4 Inspection and Acceptance Criteria During Construction
Construction inspection for engineered wood alternatives is mostly about making sure the product you specified is the product you installed, and that it stayed in the condition it was supposed to be in. The trick is to inspect early enough that fixes are still cheap, and to inspect in a way that doesn’t turn every day into a paperwork marathon.
Foundational Acceptance Logic
Start with three acceptance questions that guide every inspection:
- Is it the right material and configuration? Verify product identity, grade, thickness, and intended system (panel, beam, deck, or assembly).
- Is it installed correctly? Check layout, orientation, connections, spacing, and required accessories.
- Is it protected from damage and moisture? Confirm storage, handling, and weather protection before and during enclosure.
A practical best practice is to align inspection points with the work sequence. For example, verify connector type and edge distances before panels are fully fastened, because once the last screw goes in, the evidence becomes harder to retrieve.
Inspection Plan and Hold Points
Use a simple inspection plan with defined hold points:
- Pre-Installation Verification: Confirm submittals match delivered materials, including batch or lot traceability where applicable.
- In-Process Checks: Inspect after major steps that affect later performance, such as surface preparation for bonded joints and alignment of framing.
- Post-Installation Verification: Confirm final fastener patterns, joint sealing, and any required protective coatings or fire-rated coverings.
- Before Enclosure: Ensure moisture management measures are complete so the system doesn’t trap water behind finishes.
A good rule of thumb: if a defect can be corrected without demolition, inspect it before the next trade covers it.
Mind Map: Construction Inspection Flow
Concrete Acceptance Criteria That Actually Get Used
Define criteria in observable terms. “Looks good” is not a criterion; “no delamination visible at edges within 1 m of inspection point” is.
1. Identity and Configuration Match
- Delivered product labels must correspond to the approved specification.
- Thickness, panel type, and intended system must match the drawings.
- Example: If the plan calls for a moisture-resistant panel for a roof deck, acceptance includes verifying the delivered panel is the same rated product, not a visually similar substitute.
2. Damage and Dimensional Condition
- Acceptable limits should address cracks, edge chipping, and surface damage that could affect connections or durability.
- Example: If a panel edge is chipped beyond the specified limit, the acceptance action is replacement or edge repair only if the method is documented and approved.
3. Connection Installation Quality
- Fastener type, diameter, length, spacing, and pattern must match the detail.
- For bonded joints, surface cleanliness and correct adhesive application must be verified before curing is complete.
- Example: If screws are overdriven and countersinks crush the surface, acceptance should require correction before proceeding, because crushed bearing can reduce shear transfer.
4. Alignment, Tolerances, and Support Conditions
- Panels and beams must sit on intended supports without gaps that create stress concentrations.
- Example: If a deck panel spans over a framing member that is out of plane, acceptance includes checking that the panel is fully supported and that the installation tolerances are met.
5. Moisture Management and Weather Protection
- Acceptance includes verifying that storage is elevated and covered, and that installation is sequenced to avoid prolonged exposure.
- Example: If rain interrupts installation, acceptance criteria should require that wet materials are assessed and dried per the approved handling procedure before enclosure.
Evidence, Documentation, and Nonconformance Handling
Inspection evidence should be consistent and traceable:
- Photos should include context (grid location, elevation view, or framing bay).
- Measurements should record the value and the reference point.
- Checklists should link to the specific detail being verified.
When something fails acceptance criteria, document it as a nonconformance with:
- What failed (criterion and location)
- Likely cause (for example, incorrect fastener length or insufficient weather protection)
- Corrective action (repair, replacement, or rework)
- Verification step (how you confirm the fix worked)
A useful practice is to close the loop: the same inspector or team that verifies the corrective action should confirm the resolution, because “repaired” without verification is just a story.
Example: Quick Acceptance Walkthrough for a Panel Installation
During installation of a wall panel system, the inspector checks:
- Pre-installation: panel labels match the approved product, edges are not excessively damaged, and storage was elevated.
- In-process: panel orientation matches the drawings, fasteners match the specified pattern, and edge distances are maintained.
- Post-installation: joints are treated as required, and any required fire or acoustic coverings are installed without blocking critical gaps.
- Pre-enclosure: the air and water management layers are continuous and the assembly is not enclosed while visibly wet.
If any step fails, the work is paused at the hold point, corrective action is documented, and acceptance is re-verified before the next trade proceeds.
11.5 Example Specification Packages for Common Building Components
A specification package is a set of documents that lets a product supplier, a fabricator, and a site team build the same thing without guessing. For synthetic timber technologies, the package should connect material behavior to installation reality: what the product is, how it must be tested, how it must be installed, and what evidence proves compliance.
Package Scope and Roles
Start by stating the component boundaries and responsibilities. For example, a “floor deck system” might include the engineered wood alternative panel, fasteners, adhesives if used, and required underlayment or membranes. If the package is silent on scope, submittals often arrive as “just the panel,” and the rest becomes a site interpretation.
A practical way to structure roles is to assign each requirement to one party:
- Manufacturer provides product identity, test reports, and quality plan.
- Installer provides installation method statements, sequencing, and on-site checks.
- Engineer provides design assumptions, load paths, and acceptance criteria.
Mind Map: Specification Package Content
Specification Package Mind Map
Product Identity Section
Use a short, unambiguous product description that matches how the product will be ordered. Include:
- Designation: the engineered wood alternative type and grade.
- Geometry: thickness, panel size, and edge profile.
- Tolerances: flatness and thickness variation limits.
- Traceability: batch or lot marking method.
Example wording for a panel product line item:
- “Engineered wood alternative floor deck panel, nominal thickness 18 mm, with factory-milled edges for butt joint alignment, lot-marked for traceability.”
Performance Requirements Section
Group requirements by building function so the supplier can respond with the right tests.
Structural: specify bending and shear properties as design values or characteristic values, and state the test method basis. If the design uses a particular span condition, require the supplier’s test to reflect similar support conditions.
Serviceability: include limits for deflection and vibration where applicable. A simple example is a floor deck where the design expects a certain composite action; the specification should require the connector type and spacing that achieve that action.
Durability: state moisture-related performance expectations and the required conditioning regime for test evidence. For instance, if the product is intended for wet construction phases, require documentation showing performance after controlled moisture exposure.
Fire and Thermal: require fire classification testing for the product as installed in the intended assembly, not only as a standalone sheet. If the assembly includes a membrane or board, the package should name it.
Acoustic: specify sound transmission or impact performance targets at the assembly level, and require the supplier to provide assembly test evidence or a justified calculation basis.
Test and Evidence Section
This is where many packages fail because they list standards without stating acceptance criteria. A workable approach is to require:
- Test reports with specimen description, conditioning history, and failure modes.
- Sampling plan describing how many specimens were tested per lot.
- Acceptance criteria that match the performance requirements.
Example evidence mapping:
- “Provide test reports demonstrating declared bending strength and stiffness after the specified conditioning regime, including mean and characteristic values and test specimen dimensions.”
Installation Requirements Section
Installation rules should be written as “must” statements tied to failure modes.
Include:
- Handling: “Store flat on level supports; protect edges from impact; do not expose to standing water.”
- Substrate prep: “Substrate must be dry, level within specified tolerance, and free of debris.”
- Fasteners and spacing: “Use the specified fastener type and spacing pattern; maintain minimum edge distances.”
- Adhesives: “Apply adhesive only to prepared surfaces; follow open time and cure time requirements; do not clamp beyond stated limits.”
- Weather and curing: “Do not install when surfaces are wet; maintain minimum temperature and humidity for curing where adhesives are used.”
A small but important example: if the product has a moisture-sensitive adhesive interface, the package should require that the installer verify surface dryness before bonding, not just after bonding.
Quality Assurance and Inspection Section
Define hold points and what documentation must be available before work proceeds.
Example hold points:
- “Before deck placement, submit fastener schedule and joint detailing drawings for approval.”
- “At first installation of each crew, perform a verification of fastener spacing and edge distance on a sample area.”
Compliance Matrix Example
Use a matrix so reviewers can trace requirements to evidence quickly.
| Requirement | Evidence Required | Verifier |
|---|---|---|
| Declared bending properties | Test report with conditioning and acceptance criteria | Engineer of record |
| Fire classification | Assembly test report for named build-up | Code compliance reviewer |
| Moisture durability | Conditioning and post-test performance documentation | Engineer |
| Installation method | Method statement and on-site checklists | Site QA |
| Fastener spacing | Approved shop drawings and sample verification | Inspector |
Example Package Assembly List
For a common component set, list items in the order they will be installed:
- Engineered wood alternative panel deck or wall panel.
- Connectors and fasteners with specified grades.
- Adhesives if used, with open time and cure conditions.
- Membranes or boards required by the fire and moisture strategy.
- Sealants and tapes for air and water control at joints.
A complete package ends with a checklist that matches the compliance matrix, so the final review is a verification exercise rather than a scavenger hunt.
12. Practical Case Studies for Engineered Timber Alternatives
12.1 Case Study for a Low Rise Floor System Using Composite Panels
Project Setup and Design Intent
A three-story, low-rise apartment building uses composite timber-like floor panels to reduce dead load while keeping installation straightforward. The design intent is simple: achieve code-compliant stiffness and strength for typical residential spans, limit deflection to serviceability targets, and manage moisture exposure during construction. The floor system is treated as a layered assembly: composite panels provide bending resistance, while a topping and fastener layout control load transfer and long-term performance.
System Description and Load Path
The floor build-up is:
- Composite structural panels spanning between primary beams
- A thin cementitious topping for surface durability and diaphragm action
- Mechanical fasteners and bearing details that prevent slip at panel edges
The load path runs from occupants’ live loads into the topping, then into the composite panels, and finally into beams and supports. To keep the reasoning concrete, the design checks three failure modes: bending of the panel, shear transfer at interfaces, and serviceability deflection under sustained loads.
Mind Map: Floor System Logic
Foundational Assumptions and Material Data Use
Start with verified panel properties from product testing: bending strength, modulus of elasticity, shear strength, and thickness swelling behavior. For long-term deflection, use creep or time-dependent factors provided with the panel system data. A practical best practice is to match the test conditions to the intended environment: if the building will see temporary wetting during installation, the design should use durability-relevant property sets rather than “dry-only” values.
Example: If the panel system data includes two stiffness sets—conditioned and dry—select the conditioned set for serviceability checks when the topping curing schedule and construction sequencing allow moisture exposure before full drying.
Design Loads and Serviceability Targets
Residential floors typically govern by deflection rather than ultimate strength. The design therefore treats serviceability as a first-class check:
- Short-term deflection under live loads
- Long-term deflection under sustained loads including self-weight and topping
- Local deflection near supports and openings
A systematic approach is to compute bending response using the panel’s effective stiffness, then apply time-dependent factors for sustained loading. If the calculated deflection is close to the limit, adjust one variable at a time: reduce span via beam spacing, increase panel thickness, or improve composite action through topping and edge restraint.
Fastener Layout and Shear Transfer
Composite panels rely on edge and interface behavior. The fastener system must prevent slip that would otherwise reduce effective stiffness and increase deflection. Best practice is to design for the governing interface mode: bearing failure, pull-through, or shear-out depending on fastener type and panel thickness.
Example: For a typical edge connection, use a consistent fastener spacing pattern with verified edge distance. During installation, mark reference lines on beams so crews drive fasteners at the correct locations. This reduces the common “almost right” problem where small spacing errors accumulate into measurable slip.
Moisture Management During Construction
Even when the final assembly is protected, construction moisture can temporarily change panel behavior. The integrated practice is to control three things: panel storage, exposure time, and topping curing.
- Store panels flat with spacers and cover them to prevent standing water
- Install panels quickly and brace them to avoid sagging while wet
- Keep topping curing uniform and avoid premature loading
Example: If panels are delivered on a rainy week, stage unloading so only the panels for the next day’s work are exposed. This keeps the moisture condition closer to the design assumption used for stiffness and swelling checks.
Mind Map: Verification and Quality Assurance
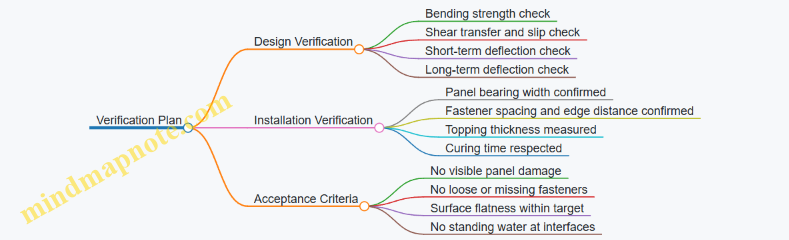
Worked Example: Span Adjustment Decision
Assume the initial design uses a panel spanning between beams at a spacing that yields deflection near the serviceability limit. If the long-term deflection exceeds the target by a small margin, the most controlled fix is to reduce span by adjusting beam spacing rather than changing multiple details at once.
Example decision sequence:
- Reduce beam spacing by a small increment to lower bending span length.
- Re-check bending stiffness and long-term deflection.
- Confirm fastener demand at edges remains within the interface capacity.
- Verify bearing and installation tolerances still fit the construction method.
This keeps the solution traceable: the change addresses the governing mechanism without introducing new failure modes.
Summary of Integrated Best Practices
This case study shows that a low-rise floor system succeeds when design checks and installation practices agree. Use panel property data that matches the moisture condition, design fastener layouts to control slip, manage construction exposure to prevent temporary stiffness loss, and verify serviceability with time-dependent effects. The result is a floor system that performs predictably, not just on paper, but on the jobsite where details matter.
12.2 Case Study For a Shear Wall Assembly With Mechanical Connections
This case study describes a shear wall assembly built with engineered wood alternative panels and mechanical connections. The goal is simple: transfer lateral loads reliably while keeping installation practical and durability requirements explicit.
Foundational Requirements and Load Path
A shear wall must provide a continuous load path from roof or floor diaphragm into the wall base. Start by defining three roles: (1) diaphragm-to-wall transfer at the top, (2) in-plane shear resistance through the wall panel and its fasteners, and (3) base anchorage that turns horizontal forces into foundation reactions.
Best practice example: If the top connection is a ledger with intermittent fasteners, treat it as a shear transfer boundary, not just a support. In the field, crews often focus on wall studs and forget the top line; the result is a “stiff-looking” wall that still slips at the diaphragm interface.
System Layout and Materials
Use a panelized shear element with mechanical fastening to a framing line. A typical layout includes:
- Vertical framing members at panel edges and intermediate spacing
- Shear panel spanning between top and bottom plates
- Edge blocking or stiffeners where required by panel stiffness and fastener spacing
- Top and bottom plates that distribute loads to the foundation
Best practice example: Mark panel orientation before installation. Many engineered panels have direction-dependent stiffness or fastening performance; installing them rotated can reduce effective shear capacity even if the panel “fits.”
Connection Strategy for Mechanical Shear Transfer
Mechanical connections govern performance because they control slip, load distribution, and failure modes. The design process should specify:
- Fastener type and diameter
- Fastener spacing along edges and intermediate lines
- Edge distance and end distance
- Screw embedment or nail penetration depth
- Whether connections are single-shear or double-shear
Best practice example: Create a fastening map on the shop drawings that matches the physical panel layout. On site, workers benefit from a simple rule like “fasten every marked line at 150 mm spacing, then add extra fasteners within 300 mm of openings.”
Installation Sequence That Preserves Performance
A shear wall is only as good as its installation tolerances. Use a sequence that prevents misalignment and avoids damaging the panel surface.
- Set and plumb the framing line.
- Install bottom plate anchors and verify spacing.
- Place panels with consistent gaps or bearing conditions.
- Fasten edges first, then field fasteners.
- Re-check fastener pattern after the panel is fully seated.
Best practice example: Edge-first fastening reduces panel “creep” during tightening. If you fasten the middle first, the panel can bow, forcing later fasteners to fight the geometry.
Durability and Serviceability Checks
Mechanical shear walls must also handle moisture exposure and long-term movement. Include checks for:
- Panel surface protection at cuts and edges
- Compatibility between fasteners and panel chemistry
- Allowance for shrink-swell without losing contact at bearing lines
Best practice example: When panels are trimmed on site, treat the cut edges consistently. If one crew seals edges and another leaves them bare, you create uneven stiffness and uneven slip behavior.
Testing and Verification Approach
Verification should confirm both strength and the practical behavior that designers care about: slip and load distribution.
- Fastener pull-through or withdrawal checks for the panel material
- In-plane shear testing or validated design equations
- Cyclic loading to observe stiffness degradation and failure mode
- Inspection criteria for fastener installation quality
Best practice example: During mock-up testing, record slip at a defined load level. A wall that reaches peak strength but slips excessively can still fail serviceability targets like diaphragm alignment and finish cracking.
Worked Example for Connection Layout
Assume a panel fastened to framing with a consistent pattern:
- Edge fasteners at 150 mm spacing
- Field fasteners at 300 mm spacing
- Minimum edge distance maintained per product guidance
- Extra fasteners within 300 mm of an opening jamb
Best practice example: If an opening interrupts the panel, do not simply “skip” the pattern. Instead, terminate the shear panel with a defined boundary element and continue the fastener layout into the jamb region so the load path remains continuous.
Summary of Integrated Best Practices
This case study shows that mechanical shear walls succeed when connection design, installation sequence, and durability controls are treated as one system. The panel provides the surface and stiffness, but the fasteners and their placement provide the actual lateral resistance. When the fastening map matches the field workflow, the wall behaves predictably instead of merely looking correct.
12.3 Case Study for a Roof Deck Assembly with Moisture Managed Detailing
Project Setup and Performance Targets
This case study describes a roof deck assembly using an engineered wood alternative deck panel. The goal is simple: keep the deck dry enough that its structural capacity and stiffness stay predictable, even when rain hits before the roof is fully closed in.
Performance targets are set in three layers:
- Moisture control: limit liquid water entry, manage vapor diffusion, and provide a drainage path for incidental wetting.
- Structural reliability: maintain panel flatness and fastener performance under wet-dry cycles.
- Buildability: details must be installable without requiring perfect weather or perfect trades coordination.
Foundational Moisture Pathways
Moisture moves through roof assemblies in three main ways:
- Bulk water: driven by wind-driven rain, capillary leakage at seams, or poor flashing.
- Vapor diffusion: water vapor migrating through materials due to temperature and humidity gradients.
- Air leakage: moist air bypassing layers through gaps, penetrations, or poorly sealed edges.
A moisture-managed roof deck treats these as separate problems. For example, a well-sealed air barrier does not automatically stop bulk water from reaching the deck, and a drainage plane does not stop vapor diffusion.
Assembly Overview and Layer Roles
A practical roof deck assembly can be organized as follows:
- Roof deck panel: provides structural support and a substrate for subsequent layers.
- Underlayment or waterproofing layer: sheds bulk water and controls capillary rise.
- Air and vapor control layer: reduces air leakage and moderates vapor movement.
- Ventilation or drainage strategy: allows any incidental moisture to dry.
- Flashing and edge details: prevent water from finding the easiest path.
The key best practice is to ensure every layer has a clear job. If two layers both try to “solve everything,” the assembly becomes sensitive to installation mistakes.
Mind Map: Moisture Managed Roof Deck Detailing
Detail 1: Panel Layout, Seams, and Fasteners
Start with the deck panel because it sets the boundary conditions for everything above it.
Best practices:
- Panel orientation and support: keep panel edges fully supported so seams do not open under load and moisture cycling.
- Staggered joints: avoid a continuous seam line that can become a preferential leakage path.
- Fastener pattern discipline: follow spacing and edge distance requirements so wetting does not cause localized crushing or pull-through.
Example: If the deck is installed on rafters at a fixed spacing, align panel joints so each joint lands over a rafter. If a joint must land between supports, the assembly becomes dependent on sealant performance, which is not a moisture control strategy.
Detail 2: Underlayment Laps and Capillary Breaks
Underlayment is the first line against bulk water. The most common failure is incorrect lap direction or incomplete sealing at transitions.
Best practices:
- Shingle-style laps: each upper course overlaps the one below so water sheds rather than wicks.
- Tape and sealant compatibility: use products intended for the underlayment system so adhesion survives moisture exposure.
- No “pinch points”: avoid compressing underlayment at corners where it can tear or separate.
Example: At a valley or roof-to-wall intersection, treat the underlayment as a continuous drainage surface. If you stop the underlayment early and rely on later flashing alone, water can reach the deck through capillary action.
Detail 3: Air Barrier Continuity at the Deck Interface
Even when waterproofing is correct, air leakage can move moisture into the assembly.
Best practices:
- Seal deck-to-wall and deck-to-penetration interfaces: use appropriate tapes or gaskets designed for the materials.
- Avoid relying on fasteners as seals: fasteners secure structure; sealing is a separate task.
Example: Around a roof vent pipe, a common mistake is sealing only the top flange. Moist air can still enter at the sides if the air barrier layer is not continuous and properly sealed to the deck.
Detail 4: Eaves, Rakes, and Flashing Transitions
Edge details are where water accelerates and finds gaps.
Best practices:
- Provide a clear drainage path: ensure water can exit without being forced back into the assembly.
- Use overlapping flashing sequences: each piece should shed water to the next lower piece.
- Maintain a robust interface at the deck edge: prevent underlayment from bridging into a pocket where water can pool.
Example: At the eave, the underlayment should extend and terminate in a way that directs water outward. If it ends abruptly, the deck edge can become a sponge.
Verification During Installation
Moisture management is not only design; it is also inspection.
Best practices:
- Confirm panel moisture content before closing: install when panels are within the specified range.
- Check underlayment laps and seals: verify overlap direction and continuity before covering.
- Perform targeted water testing: if feasible, test at transitions and penetrations where failures are most likely.
Summary of Integrated Best Practices
This roof deck case study shows that moisture control works when each layer is assigned a role: underlayment stops bulk water, air barrier continuity limits moisture-laden air movement, and edge flashing plus drainage/drying prevents incidental wetting from becoming trapped moisture. The result is a roof deck assembly that stays structurally predictable and installable under real-world conditions.
12.4 Case Study for an Interior Partition With Acoustic Performance Targets
Project Setup and Acoustic Goals
A mid-rise office retrofit needs an interior partition that reduces speech transmission between an open-plan area and a small meeting room. The target is practical: keep conversations from sounding clear through the wall, while still allowing normal ventilation and electrical penetrations.
The acoustic target is expressed as a required Sound Transmission Class (STC) for the partition assembly. Instead of treating STC as a magic number, the design team breaks it into contributors: panel stiffness, cavity absorption, airtightness, and flanking paths.
Baseline target: STC 50 for the partition board-to-board assembly.
Key constraints:
- Partition height: 2.7 m with typical stud spacing.
- Limited floor-to-ceiling tolerance, so the top seal must be forgiving.
- Electrical boxes and conduit sleeves are required.
Foundational Concepts Applied to This Wall
Acoustic performance in partitions is mostly about controlling how sound energy moves from one side to the other.
- Mass and stiffness: Heavier, well-supported layers resist panel vibration. In practice, this means selecting a partition board thickness and ensuring studs are not too widely spaced.
- Decoupling: Two layers separated by an air cavity reduce direct vibration transfer. A cavity with mineral wool improves absorption.
- Damping and airtightness: Small gaps can dominate performance. A wall that is “mostly sealed” is often “mostly leaky.”
- Flanking control: Sound can bypass the partition through edges, ceiling connections, and service penetrations.
Assembly Selection and Layering Strategy
The chosen system uses a double-stud or resiliently mounted approach to reduce direct coupling. For this case, a practical solution is a single stud line with resilient channels on one face and a second board layer on the other face.
Proposed build-up (one side to the other):
- Interior board layer: 12.5 mm gypsum board (or equivalent engineered board)
- Resilient channel layer on one face with mineral wool in the cavity
- Cavity insulation: 50 mm mineral wool with consistent density
- Second face board layer: 12.5 mm gypsum board
- Perimeter seals: acoustic sealant at joints and compressible gaskets at tracks
Easy-to-understand example: If you press your ear near a small crack at the perimeter, you can often hear speech more clearly than you expect. That observation is the reason perimeter sealing is treated as a primary design element, not a finishing step.
Mind Map: Acoustic Design Decisions
Detailing for Airtightness and Penetrations
Most real-world failures come from penetrations and imperfect sealing.
Electrical boxes: Use boxes designed for partition systems and ensure the box-to-board gap is sealed. If a box is installed and left with a visible gap around the flange, the wall becomes a short path for sound.
Conduits and sleeves: Any sleeve that passes through the cavity should be sealed at both ends. A common mistake is sealing only one side because it is easier to access.
Perimeter joints: Tracks at floor and ceiling should include compressible gaskets. Where the partition meets uneven surfaces, acoustic sealant fills the irregularities so the seal is continuous.
Easy-to-understand example: Think of the wall as a series of doors. A single unsealed “door” at the perimeter can let sound in even if every other door is closed.
Installation Workflow with Quality Checks
A systematic build reduces rework.
- Framing inspection: Confirm stud spacing and alignment before boards go on.
- Insulation placement: Install mineral wool without compressing it excessively; gaps reduce absorption.
- First face board: Apply boards with consistent screw spacing and avoid skipping fasteners near edges.
- Penetration sealing: Seal around boxes and sleeves before closing the second face.
- Second face board: Maintain airtight joints and avoid leaving voids at board edges.
- Perimeter seal verification: Check continuity at floor, ceiling, and side jambs.
Practical check: After the first face is installed, temporarily cover a suspected gap with tape and compare sound leakage at that location. If the leakage drops noticeably, you have found a priority sealing point.
Example Targeting STC 50 Without Overbuilding
If the initial design only reaches STC 47 in a preliminary assessment, the most efficient fixes are usually:
- Add a second board layer on the lower-performing face.
- Improve decoupling by correcting resilient channel installation and ensuring no rigid bridges.
- Seal penetrations more thoroughly, especially around electrical boxes.
Reasoning: Increasing mass helps, but airtightness and decoupling often provide a larger improvement per unit of added material.
Summary of the Case Study Outcome
The partition meets the acoustic goal by treating sound control as a system: layered mass, controlled cavity absorption, and continuous sealing at every interface. The final result is not just a higher STC number; it is a wall that behaves consistently when real penetrations and on-site tolerances are included.
12.5 Case Study for a Building Envelope Retrofit With WRB Integration
A mid-1990s apartment block shows recurring moisture staining near window heads and along balcony soffits. The original wall assembly used a weather-resistant barrier (WRB) that was either incomplete at penetrations or degraded behind cladding. The retrofit goal is straightforward: restore a continuous water-shedding path, keep the WRB properly lapped and sealed, and avoid trapping moisture between layers.
Project Baseline and Constraints
The retrofit scope targets the exterior wall system while leaving interior finishes in place. The team documents existing conditions: cladding type, fastener pattern, sheathing material, and the presence of any existing WRB. A practical best practice is to perform a “dry inspection” first—remove a small test area to confirm whether a WRB exists, where it terminates, and how it was detailed at windows and corners. In this case, the WRB was present in some bays but discontinuous at openings, with inconsistent tape use and missing flashing at penetrations.
Mind Map: Retrofit Logic from Water Path to Details
Step 1: Define the Water Path and Lap Direction
WRB performance depends on how water is directed once it reaches the surface. The team establishes a shingle-lap scheme: upper layers overlap lower layers so water flows outward and downward rather than inward. For example, at a window head, the WRB above the opening must lap over the head flashing, and the side flashing must lap over the WRB at the jambs. This ordering prevents water from being “handed off” to a seam that is oriented the wrong way.
Step 2: Prepare Substrate and Control Surface Chemistry
Many WRB failures are not about the membrane itself; they are about adhesion and surface readiness. Before any tape or sealant is used, the substrate is cleaned and dried, and any loose sheathing edges are repaired. Where primers are required, the team uses them consistently and verifies coverage. A simple example: if a tape manufacturer specifies primer for dusty OSB, skipping primer may look fine during installation but can fail under wind-driven rain because the bond line never fully develops.
Step 3: Install a Continuous WRB Plane with Sealed Seams
The retrofit uses a membrane system designed for exterior applications, with taped seams and sealed overlaps. The team treats corners as transitions rather than afterthoughts: WRB at corners is folded or layered to maintain overlap without creating thick, uneven ridges that can lift under cladding pressure.
A practical approach is to work from the most complex areas outward. Windows and penetrations are detailed first because they dictate how the WRB plane must be interrupted and reconnected. After those are complete, the wall field membrane is installed to lap over the flashing components.
Step 4: Flashing Windows and Managing the Sill
Window flashing is where the retrofit earns its keep. The sill flashing is installed so water that reaches the opening has a direct path to the drainage plane. In this case, the sill flashing includes end dams to prevent water from bypassing the intended route.
Example detailing logic:
- Side jamb flashing is installed first, then the head flashing laps over it.
- The WRB field laps over the head flashing.
- The sill flashing interfaces with the WRB field using a lap that keeps water moving outward.
Step 5: Integrate Penetrations and Maintain Drainage
Penetrations include balcony brackets, conduit penetrations, and hose bib locations. Each penetration receives a boot or flashing collar rather than relying on sealant alone. Sealant can crack or peel; a boot provides a mechanical water-shedding geometry.
At the base of the wall, the team ensures the drainage plane can discharge water. Weep paths are kept clear, and the WRB is not sealed in a way that blocks outward drainage.
Step 6: Quality Assurance Through Mock-Up and Water Testing
Before full production, a mock-up panel is built at a representative window bay and corner. The mock-up includes the exact sequence of membrane installation, tape/primer use, flashing overlaps, and cladding attachment. After installation, a controlled water test is performed to verify that water tracks outward and does not migrate behind the WRB at seams.
The final deliverable is an as-built record showing where seams, tapes, and flashing transitions are located. This matters because future maintenance depends on knowing what is actually installed, not what the drawings assume.
Outcome in This Case Study
After retrofit completion, the exterior staining pattern stops progressing, and the most common moisture entry points—window heads, jamb corners, and balcony soffit interfaces—are corrected by restoring WRB continuity and flashing order. The wall assembly also retains drying potential because the retrofit does not create a sealed moisture trap; it re-establishes a drainage path and a properly lapped WRB plane.