Ammonia Fuel Infrastructure and Marine Propulsion Engineering
1. Scope and Engineering Requirements for Ammonia Marine Fuel Systems
1.1 Defining System Boundaries for Fuel Supply and Propulsion Integration
System boundaries answer a deceptively simple question: what exactly is “in scope” for the fuel system and what is “out of scope” for the propulsion system? Getting this right prevents design reviews from turning into argument marathons about who owns which valve, alarm, and failure mode.
Start with the Mission Profile and Interfaces
Begin by writing the vessel’s operational mission in engineering terms: typical service speed, expected load range, maneuvering requirements, and the time spent at each mode. Then list the interfaces that cross the fuel-to-propulsion line. For ammonia, those interfaces usually include:
- Fuel supply to the engine skid or fuel gas unit
- Electrical power distribution to pumps, compressors, heaters, and controls
- Control and safety signals that coordinate start/stop and emergency shutdown
- Venting and blowdown paths that connect fuel containment to atmosphere or treatment
Example: If a vessel runs mostly at 70–85% load, you can size control authority and fuel conditioning capacity around that band rather than around rare full-load spikes.
Define the System Boundary Line in Physical Terms
Draw a boundary line on the P&ID and on the general arrangement. The boundary should pass through equipment that changes responsibility or design assumptions. Common boundary choices include:
- Between terminal transfer and ship receiving manifold
- Between ship receiving manifold and ship fuel conditioning
- Between conditioning outlet and engine fuel inlet
- Between engine fuel inlet and combustion control unit
A practical rule: if a component’s failure changes the required safety action, it belongs on the same side of the boundary as the safety logic that responds.
Example: If a water-in-fuel event triggers a specific engine derate and a specific alarm, the filtration and water management strategy should be treated as part of the same integrated system boundary as the engine protection logic.
Define the Boundary in Energy and Mass Flow Terms
Next, specify what flows are tracked across the boundary. At minimum, define:
- Mass flow of ammonia to the engine
- Vapor flow and pressure relief discharge routes
- Any purge or inerting flows
- Condensate or drain streams from separators and filters
Then state the measurement points used for reconciliation. This matters for both commissioning and operations.
Example: If you measure tank level and engine consumption but ignore separator drains, your mass balance will “fail” during trials even when the plant is operating correctly.
Define the Boundary in Control and Safety Terms
A fuel system boundary is incomplete without control and safety boundaries. Identify:
- Normal control loops (pressure regulation, temperature conditioning, flow control)
- Interlocks (permissives for start, run, and transfer)
- Emergency shutdown actions and their triggers
- Safe state definitions for each boundary-crossing event
To avoid gaps, map each safety function to the equipment it depends on and the signals it consumes.
Example: If emergency shutdown requires stopping a transfer pump and isolating a valve, the boundary must include the valve actuation power path and the signal path that commands it.
Build a Requirements Trace from Boundary to Design
Once boundaries are set, convert them into requirements categories:
- Functional requirements: deliver specified fuel quality and pressure at engine inlet
- Performance requirements: response time for load changes and transient stability
- Safety requirements: maximum allowable release rates, detection coverage, and shutdown timing
- Verification requirements: what tests prove each requirement
Example: A “deliver specified pressure” requirement should specify acceptable tolerance at the engine inlet, not just at a tank outlet.
Use a Mind Map to Keep the Boundary Honest
Mind Map: Fuel Supply and Propulsion Integration Boundaries
Example Boundary Set for a Typical Ammonia-Fuelled Vessel
A coherent boundary set might be:
- In scope: ship receiving manifold through conditioning to engine fuel inlet, including associated instrumentation, interlocks, and vent/blowdown routing up to the defined connection points.
- Out of scope: engine internal combustion control algorithms beyond the fuel inlet interface, and terminal-side transfer equipment beyond the ship manifold connection.
This lets the design team verify integration with clear acceptance criteria: the engine receives fuel at the required conditions, and the safety system responds to boundary-relevant triggers with defined timing.
Quick Boundary Checklist for Design Reviews
- Boundary line is marked on P&ID and arrangement drawings
- Every boundary-crossing signal has an owner and a failure response
- Every boundary-crossing flow has a measurement or reconciliation method
- Vent/blowdown paths are included up to the stated connection points
- Safety functions are mapped to required equipment and power dependencies
When these items are satisfied, the rest of the engineering work becomes less about interpretation and more about calculation, testing, and verification.
1.2 Regulatory and Classification Scope for Ammonia Fuelled Vessels
Regulatory and classification scope is where “ammonia as a fuel” becomes a set of enforceable engineering constraints. The goal is not to memorize rules, but to translate them into design inputs: what must be prevented, what must be demonstrated, and what must be documented.
Foundational Concepts That Drive the Scope
Start with three basics. First, ammonia is toxic and flammable under certain conditions, so the rules focus heavily on containment, detection, ventilation, and emergency response. Second, ammonia’s physical behavior affects system design: pressure, temperature, and phase management influence how you size relief devices and how you plan transfer operations. Third, the fuel system is part of the ship’s safety philosophy, so requirements are often expressed as performance goals rather than single “component” prescriptions.
A practical way to keep scope manageable is to treat the ammonia system as a set of interfaces: fuel storage, fuel transfer, fuel supply to engines, and the surrounding hazardous zones. Each interface triggers different rule clauses and different classification expectations.
Core Regulatory Layers and How They Interact
Most ammonia-fuelled vessel requirements come from overlapping layers:
- International conventions define baseline safety objectives for ships and ship operations.
- Flag-state regulations translate those objectives into enforceable national rules and approval processes.
- Classification society rules provide technical interpretation and verification methods, often including additional requirements beyond the minimum convention text.
In practice, you should assume that the classification society will be the “how” for verification, while the flag-state will be the “permission” for operation. That means your design package must be consistent across both.
Classification Scope for Fuel Systems
Classification scope typically covers the fuel system as a functional safety system, not just as piping and tanks. Expect scrutiny of:
- Design basis and assumptions used for hazard identification and risk assessment.
- Materials and workmanship for ammonia service, including joint design and corrosion allowances.
- Pressure protection including relief philosophy, routing, and blowdown handling.
- Fuel supply reliability so that loss of fuel supply does not create unsafe engine states.
- Electrical and instrumentation suitability in hazardous areas.
- Testing and inspection plans that prove the system can be safely operated and maintained.
A useful engineering habit is to map each major component to the verification method you will use. For example, a transfer line is not “approved” by a drawing alone; it needs hydrostatic or pressure testing evidence, plus documentation of supports, valves, and leak detection strategy.
Hazard Zoning and Operational Modes
Regulations and classification rules usually require hazardous area zoning and operational mode definitions. Your scope should explicitly list modes such as normal operation, bunkering/transfer, start-up, shutdown, maintenance, and emergency conditions.
Example: During bunkering, the risk is not only the stored ammonia but also the release potential from hoses, connections, and venting. That means your scope should include procedures for connection sequencing, pre-transfer checks, and how the system prevents ignition sources in the relevant zones.
Documentation and Approval Deliverables
A coherent scope includes the documents that demonstrate compliance. Typical deliverables include:
- Safety case inputs such as hazard identification results and design basis assumptions.
- General arrangement and system schematics showing containment boundaries and ventilation paths.
- Calculations for pressure relief sizing, vent routing, and mass balance for transfer.
- Operating manuals and emergency procedures aligned with the safety philosophy.
- Inspection and maintenance plans that specify what is checked, how often, and by whom.
To keep reviews efficient, ensure the same assumptions appear consistently across documents. If your risk assessment assumes a certain detection response time, your alarm logic and testing plan should reflect that assumption.
Mind Map: Regulatory and Classification Scope
Example: Turning Scope into Engineering Questions
When you define scope, convert each regulatory theme into a concrete question for the design team.
- Containment: Where is the boundary, and what is the leak path if a joint fails?
- Detection: What sensors cover each release scenario, and what actions do they trigger?
- Ventilation: How do you ensure ventilation remains effective during the defined operational modes?
- Pressure protection: Where does relief discharge go, and how is it prevented from creating secondary hazards?
- Operations: What exact steps reduce release likelihood during bunkering?
If these questions are answered consistently, the regulatory and classification scope stops being a checklist and becomes a structured engineering workflow.
Diagram: Scope Flow from Requirements to Verification
    flowchart TD
  A[Regulatory Objectives] --> B[Flag-State Requirements]
  B --> C[Classification Technical Interpretation]
  C --> D[Design Basis and Hazard Assumptions]
  D --> E[Engineering Design of Fuel System]
  E --> F[Verification Plan]
  F --> G[Testing, Inspection, and Commissioning Evidence]
  G --> H[Operating and Emergency Procedures]
A final note on dates: if your approval process references a specific rule edition, record the edition date in your design basis index. For example, you might cite a rule edition dated 2024-03-15 in the internal document control record so reviewers can trace the exact text used.
1.3 Engineering Performance Targets for Fuel Quality and Energy Conversion
Engineering performance targets translate “fuel quality” from a vague phrase into measurable limits that protect combustion stability, heat rate, and system safety. For ammonia-fuelled marine propulsion, targets must cover both the fuel itself and the way the fuel turns into useful shaft power.
Foundational Targets for Fuel Quality
Start with targets that prevent immediate operational problems. The first set focuses on composition and physical condition.
- Water content target: Water can form corrosive mixtures with contaminants and can upset vaporization and injection behavior. A practical target is a low, measurable maximum water fraction, paired with an acceptance test that can be run before bunkering.
- Total impurities target: Impurities such as sulfur compounds, oxygenated species, and heavy residues can affect ignition behavior and aftertreatment performance. Targets should be expressed as maximum allowable concentrations with a defined sampling plan.
- Particulate and insolubles target: Even small solids can clog strainers and degrade injection performance. Targets should specify a maximum particle loading and a filtration strategy that matches the engine’s smallest flow passages.
- Volatility and phase behavior target: Ammonia’s storage and transfer conditions determine whether the fuel reaches the engine as intended. Targets should include acceptable ranges for temperature, pressure, and vapor-liquid ratio at key transfer points.
A simple example: if the fuel arrives with higher-than-allowed water, the transfer system may still move it, but the engine may show unstable combustion during load changes. The target is therefore not just “low water,” but “low water verified by a test that matches the bunkering workflow.”
Energy Conversion Targets for Propulsion Performance
Fuel quality matters because it affects conversion efficiency and controllability. Define targets that connect fuel input to propulsion output.
- Brake thermal efficiency or heat rate target: Choose a metric that your propulsion team already uses. For example, set a maximum heat rate at steady load and a separate transient heat-rate penalty limit.
- Combustion stability target: Use measurable indicators such as acceptable ranges for misfire rate, cycle-to-cycle variation, or control-loop activity during start, acceleration, and steady operation.
- NOx and unburned ammonia slip targets: These are not only emissions limits; they also reflect how well combustion and aftertreatment are operating together. Targets should be paired with operating windows (load and ambient conditions) so the engine is judged fairly.
- Engine derate and operability target: Define how far the vessel can operate outside nominal fuel conditions before derating is required. This prevents “technically running” from being mistaken for “acceptable operation.”
A simple example: if the fuel has slightly higher impurities, the engine might still meet power, but the aftertreatment may require more frequent regeneration or show higher slip. The energy conversion target should capture that operational cost, not just the immediate power output.
Coupling Targets to System Boundaries
Targets must be consistent across the fuel chain: production, conditioning, storage, transfer, and combustion. A target that is met at the terminal but not at the engine inlet is still a failure.
- Define measurement points: Specify where each test result is taken, such as terminal custody transfer, ship manifold inlet, and engine supply line.
- Set allowable drift: Include limits for how much a property can change between points due to temperature, pressure, and mixing.
- Link to control limits: Ensure that control system alarms and interlocks are aligned with the quality targets, so the vessel responds predictably.
Verification Logic and Acceptance Criteria
Targets become useful when verification is systematic.
- Sampling plan target: Define sample frequency and composite vs grab sampling rules based on transfer duration and expected variability.
- Test method target: Require methods with known detection limits and repeatability so “pass/fail” is meaningful.
- Mass balance target: Use reconciliation to confirm that the measured fuel quality aligns with the quantity delivered and consumed.
A practical example: if sampling is taken only at the start of bunkering, a later portion with different composition could still reach the engine. The acceptance criteria must therefore include a sampling plan that matches the transfer profile.
Mind Map of Performance Targets
Mind Map: Fuel Quality and Energy Conversion Targets
Worked Example Target Set for a Design Basis
Assume a design basis where the engine must deliver stable power during load changes while keeping aftertreatment within its operating envelope. A coherent target set could be structured as follows:
- Fuel quality: water below a defined maximum; impurities below a defined maximum; particulates below a defined maximum; and an engine inlet phase window defined by temperature and pressure.
- Energy conversion: heat rate not exceeding a maximum at steady load; a transient heat-rate penalty limit during acceleration; combustion stability limits during start and load steps.
- Emissions and operability: NOx and slip targets defined over a load range; derate triggered only when quality or stability targets are violated.
The key is that every target is measurable, placed at a specific point in the system, and tied to an engineering consequence. If a test fails, the design should say what happens next: reject the fuel, adjust conditioning, or limit operating mode. That is what makes performance targets more than numbers on a page.
1.4 Safety Case Inputs for Design Basis and Operational Modes
A safety case is only as good as its inputs. For ammonia fuel systems, the design basis must translate real operating conditions into clear hazards, credible scenarios, and measurable acceptance criteria. The goal is not to list everything that could go wrong; it is to define what must be prevented, controlled, or mitigated for each operational mode.
Establishing the Design Basis from Operational Modes
Start by defining operational modes in engineering terms, not just in words. Typical modes include normal propulsion, maneuvering, start-up, shutdown, bunkering, maintenance with isolation, and emergency response. For each mode, specify:
- Fuel state at the interface (liquid, vapor, mixed, or isolated)
- System pressure and temperature envelope
- Expected flow directions and duty cycles
- Personnel presence and access restrictions
Example: During bunkering, the fuel transfer system is active, hoses or loading arms are connected, and sampling occurs. During normal propulsion, the transfer system is typically idle, and the focus shifts to steady-state storage, supply, and combustion control.
Hazard Identification Inputs That Actually Drive Design
Safety case inputs should include a hazard register that links hazards to system elements and operational modes. For ammonia, the most design-relevant hazard categories are:
- Toxic exposure from release and dispersion
- Flammable or reactive behavior where ignition sources and concentrations overlap
- Overpressure from blocked flow, regulator failure, or thermal expansion
- Corrosion and material degradation affecting integrity over time
- Human factors such as incorrect valve line-up or bypassing interlocks
Example: If the hazard register flags “hose connection leak during transfer,” then the design basis must require specific controls such as connection verification steps, leak detection coverage, and emergency shutoff logic timing.
Defining Credible Release Scenarios and Boundaries
A safety case needs release scenarios that are credible given the system design. Inputs should define:
- Release size categories (small leak, medium leak, large rupture)
- Release location categories (tank, transfer line, manifold, engine supply)
- Duration assumptions (instantaneous, intermittent, or sustained)
- Environmental conditions for dispersion modeling (wind, ventilation state, weather)
Example: A “small leak at a flange” scenario might assume a short-duration seep that triggers detection and isolation, while a “large rupture in a transfer line” scenario assumes isolation may take longer due to access and valve actuation.
Safety Functions and Performance Targets
Safety case inputs must specify safety functions and their performance targets. Common safety functions include:
- Detection and alarm initiation
- Automatic isolation of fuel supply and transfer lines
- Depressurization or blowdown to a safe system
- Ignition source control in hazardous areas
- Emergency shutdown of propulsion fuel delivery
For each function, define measurable targets such as response time, detection threshold, and isolation coverage. If the design basis only says “detect quickly,” it will not survive engineering scrutiny.
Example: For transfer operations, the design basis can require that gas detection triggers an automatic stop of transfer within a defined time window, and that the system transitions to a safe state with minimal residual release.
Human and Procedural Inputs for Operational Modes
Operational modes must include procedural assumptions: who does what, when, and with which constraints. Inputs should cover:
- Permit to work and isolation verification steps
- Valve line-up rules and tagging practices
- Sampling and maintenance procedures with isolation and purging requirements
- Training and competency requirements for critical tasks
Example: If maintenance requires opening a line, the safety case inputs should require a defined isolation boundary, verification method (e.g., pressure decay or gas-free confirmation), and a controlled purge method before opening.
Verification Inputs for the Safety Case
The safety case must state how claims will be verified. Inputs should include a verification matrix mapping hazards and safety functions to evidence types:
- Analysis evidence (mass balance, dispersion, overpressure calculations)
- Test evidence (functional tests of shutdown valves and detection systems)
- Inspection evidence (integrity management and corrosion monitoring)
- Operational evidence (drills and procedure compliance checks)
Example: If the safety case claims “automatic isolation prevents hazardous accumulation,” then the verification matrix should include functional test results demonstrating valve closure timing and detection-to-shutdown logic.
Mind Map of Safety Case Inputs
Mind Map: Safety Case Inputs for Design Basis and Operational Modes
Integrated Example of Inputs to Claims
Consider the claim: “During bunkering, a small leak will not lead to hazardous exposure.” The safety case inputs should include:
- Mode definition: transfer active, ventilation state known, personnel access controlled
- Scenario: small leak at a connection with assumed duration until isolation
- Safety functions: gas detection coverage and automatic stop of transfer
- Performance targets: detection threshold and shutdown timing
- Verification: functional test evidence for shutdown logic and valve closure time
When these inputs are explicit, the safety case becomes an engineering argument with checkable links, not a document that merely sounds confident.
1.5 Documentation Deliverables for Design Review and Commissioning
A good ammonia fuel system design review is mostly about proving that the design is consistent, testable, and safe in the real world. Documentation is the bridge between “we designed it” and “we can verify it without guesswork.” The deliverables below are organized from foundational design basis to commissioning-ready evidence.
Design Basis and Assumptions Pack
Start with a short, controlled set of documents that states what the system is supposed to do and under which conditions.
- Design basis statement: vessel operating profile, bunkering concept, fuel quality assumptions, and key performance targets (e.g., pressure ranges, transfer rates, allowable downtime).
- Assumptions and constraints log: what is fixed (tank pressure rating, engine interface limits) versus what is adjustable (operating setpoints, control tuning approach).
- Hazard and safety input summary: a traceable list of the safety requirements that drive design choices (gas detection coverage, ventilation capacity basis, emergency shutdown philosophy).
Example: If the design assumes a specific ammonia purity and water content, the documentation should state the acceptance criteria that later appear in commissioning tests and operating procedures.
System Architecture and Interface Set
Design review needs clarity on how subsystems connect, not just how they work individually.
- System description: narrative of fuel path from terminal to tank to engine, including vapor handling and return flows.
- Piping and instrumentation diagrams: P&ID with tag lists, valve functions, relief paths, and sampling points.
- Electrical and control interface matrix: signal list for sensors, actuators, interlocks, alarms, and shutdown outputs.
- Mechanical interface drawings: tank connections, transfer line routing constraints, and supports.
Example: A commissioning engineer should be able to pick a specific interlock (e.g., “high pressure in transfer line”) and find the exact sensor tag, logic input, alarm text, and the expected shutdown action.
Safety Case Documentation for Verification
Safety documentation should be written so it can be checked, not just read.
- Safety requirements specification: measurable requirements derived from hazard analysis.
- Cause and consequence mapping: which alarms and shutdowns respond to which initiating events.
- Emergency response procedures summary: the design basis for safe state, including ventilation and isolation logic.
Example: If the safety requirement states “gas detection triggers ventilation at X concentration,” the document should include the sensor type, placement basis, and the setpoint used in control logic.
Verification and Test Traceability Package
This is where design review becomes commissioning-ready.
- Verification plan: what will be tested, by whom, and at which stage (factory acceptance, onboard pre-commissioning, commissioning, sea trials).
- Traceability matrix: requirement → design feature → test method → acceptance criteria.
- Test procedures: step-by-step scripts for functional tests, leak tests, calibration checks, and interlock verification.
Example: For a fuel transfer system, the traceability matrix should link “no uncontrolled release during hose disconnection” to the specific isolation valves, check valves, and the test that demonstrates correct behavior.
Commissioning Readiness and Evidence Pack
Commissioning documentation should support repeatable execution and clear acceptance.
- Commissioning checklist: prerequisites (equipment status, permits, sensor calibration certificates, ventilation readiness).
- As-built documentation set: updated P&IDs, wiring diagrams, and control logic snapshots after changes.
- Calibration and instrument verification records: as-found/as-left values for pressure, temperature, level, flow, and gas detection.
- Functional test records: pass/fail with recorded data, alarm logs, and interlock response timing.
- Nonconformance and closeout log: each deviation with corrective action and re-test evidence.
Example: If a gas detector channel fails a calibration check, the evidence pack should show the corrective action, the re-test results, and the impact on allowed operating modes.
Mind Map: Documentation Flow and Traceability
Integrated Example: One Interlock from Requirement to Evidence
- Requirement: “High ammonia vapor concentration triggers ventilation and prevents transfer start.”
- Design feature: gas detector placement and setpoint in control logic; transfer start permissive tied to alarm state.
- Test method: inject test gas to the detector channel; verify ventilation start and transfer permissive lockout.
- Acceptance criteria: ventilation starts within a defined time window; transfer start command is blocked and logged.
- Evidence: functional test record with timestamps, alarm log, and as-left calibration values.
This structure keeps the review grounded: every safety requirement has a design hook and a test proof, and every commissioning result has a document trail that can be audited without detective work.
2. Ammonia Fuel Properties and Implications for Marine Engineering
2.1 Thermophysical Properties Relevant to Storage and Transfer
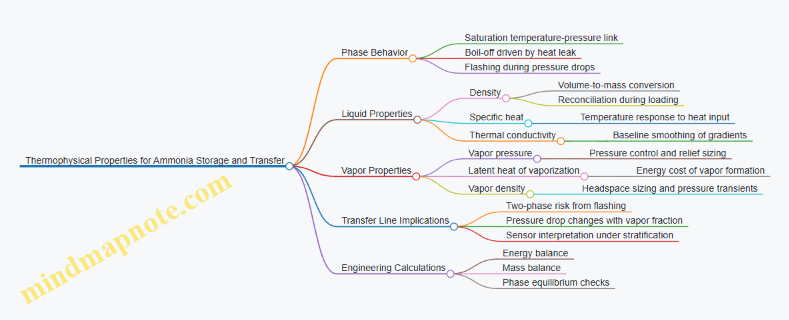
Ammonia behaves differently from common marine fuels because its phase behavior, heat transfer characteristics, and vapor properties directly shape tank design, transfer line sizing, and operating procedures. The goal of this section is practical: connect key thermophysical properties to what engineers must calculate and what operators must control.
Core Concepts for Storage and Transfer
Phase State and Saturation Behavior
Ammonia can be stored as a liquid under pressure or as a refrigerated liquid, depending on the system design. In both cases, the liquid and vapor are linked by saturation conditions: at a given pressure, there is a corresponding saturation temperature. This matters because any heat leak into the tank raises the saturation temperature, increases vapor pressure, and can drive boil-off.
Example: If a tank is designed to operate at a target pressure, a warm day increases heat input. Even if the liquid volume stays the same, the tank pressure rises because the liquid-vapor equilibrium shifts.
Density and Mass Balance
Liquid density affects how you convert between volume and mass during loading, settling, and ullage management. Vapor density affects how much gas occupies the headspace and how quickly pressure changes during transfer.
Example: Two tanks with the same liquid volume can contain different masses if their operating temperatures differ. That difference shows up in transfer reconciliation and in how much fuel is actually available for propulsion.
Specific Heat and Heat Leak Sensitivity
Specific heat capacity governs how much temperature change results from a given heat input. Higher specific heat means the same heat leak produces a smaller temperature rise, which can reduce pressure excursions.
Example: During a slow bunkering operation, heat from the transfer pump and ambient environment warms the receiving tank. If the liquid specific heat is high, the temperature rise is modest, and the vapor pressure increase is easier to manage.
Thermal Conductivity and Mixing Effects
Thermal conductivity influences how quickly temperature gradients smooth out within the liquid. In real tanks, stratification can still occur due to inlet jets, sloshing, and imperfect mixing, but conductivity sets the baseline for how fast equilibrium is approached.
Example: A transfer line discharges near the top of the tank. Even if the bulk liquid is near saturation, the incoming stream can locally warm or cool, creating short-lived gradients that affect sensor readings and control actions.
Vapor Properties That Drive Transfer Design
Vapor Pressure and Volatility
Vapor pressure is the single most important property for pressure control because it determines the equilibrium pressure at the liquid temperature. Engineers use it to estimate boil-off rates, size relief systems, and set operating limits.
Example: If the receiving tank is colder than the incoming ammonia, the initial vapor pressure can be lower than expected. As the liquid warms toward equilibrium, pressure rises, so the control strategy must tolerate the transient.
Latent Heat of Vaporization
Latent heat quantifies the energy required to convert liquid to vapor without temperature change. It strongly affects boil-off and flashing during pressure drops.
Example: If a throttling valve causes a pressure drop in a line, some liquid may flash into vapor. The fraction depends on the enthalpy change, and latent heat determines how much energy is “spent” on phase change rather than temperature change.
Gas Density and Flow Regimes
Vapor density affects two-phase flow behavior, pressure drop, and the likelihood of slugging in transfer lines. Even when the line is intended to carry liquid, small vapor fractions can form due to flashing, heat pickup, or pressure transients.
Example: A line that is sized for single-phase liquid may experience higher pressure losses if vapor forms, leading to reduced flow rate and longer transfer times.
Practical Property Use in Calculations
Engineers typically combine thermophysical properties into three calculation themes.
- Energy balance: heat leak into tanks, pump heat, and line heat pickup determine temperature and phase state.
- Mass balance: density converts between measured volumes and transferred mass; vapor space volume determines ullage behavior.
- Phase equilibrium: vapor pressure and latent heat determine whether the system stays in the intended liquid regime or produces vapor during transfer.
Example: During a bunkering operation, operators monitor tank pressure and temperature. If pressure rises faster than expected, the likely causes are increased heat input, vapor generation from flashing, or insufficient vapor handling capacity.
Mind Map: Thermophysical Property Links
Worked Micro-Example for Intuition
Assume a receiving tank starts at a lower temperature than the incoming ammonia. Early in transfer, the receiving liquid warms, and the vapor pressure rises toward the saturation value corresponding to the new temperature. If the control system maintains a constant transfer rate, the line may experience a changing pressure drop as the receiving conditions evolve. The key engineering takeaway is that thermophysical properties convert “temperature and pressure readings” into “phase state and energy flow,” which is exactly what you need to keep transfer stable.
2.2 Chemical Reactivity and Combustion Pathways for Engine Design
Ammonia (NH3) does not behave like a typical hydrocarbon fuel in the cylinder. Its nitrogen content changes the chemistry, and its ignition characteristics force engine designers to think in pathways rather than a single “burning” process. The goal of this section is to connect chemical reactivity to practical engine design choices: ignition support, mixture preparation, combustion control, and emissions-relevant operating limits.
Foundational Chemistry for Engine Thinking
Ammonia combustion starts with decomposition. In the hot environment of the cylinder, NH3 breaks into smaller species such as NH2, NH, and ultimately nitrogen-containing radicals. These radicals then interact with oxygen to form nitrogen oxides (NOx) and with hydrogen-containing radicals to form water and other intermediates.
A useful mental model is to separate the process into three coupled stages:
- Fuel activation: NH3 must decompose enough to create reactive radicals.
- Oxidation and nitrogen chemistry: radicals react with oxygen, producing NOx pathways.
- Heat release completion: remaining intermediates oxidize, determining stability and efficiency.
If stage 1 is weak, you get delayed ignition, misfires, and high unburned ammonia slip. If stage 2 is too aggressive, you can raise NOx even when the engine is otherwise stable.
Main Combustion Pathways and What They Mean
Engine design typically targets one of two practical pathway regimes, depending on how ignition and mixing are managed.
Pathway A: Decomposition-led combustion
- NH3 decomposes and forms nitrogen radicals before significant heat release.
- Heat release is often more sensitive to local temperature and residence time.
- Design implication: ignition support and in-cylinder temperature control matter as much as fuel quantity.
Pathway B: Mixing-led combustion
- Reactive species and oxygen availability govern how quickly the system reaches conditions for sustained burning.
- Design implication: injection strategy and spray/jet behavior affect both stability and emissions.
In both regimes, the nitrogen chemistry is central. NOx formation is influenced by peak temperature, oxygen availability, and the time radicals spend in reactive conditions.
Ignition Support and Its Engineering Consequences
Ammonia’s ignition delay is typically longer than for many conventional fuels. That means the engine must create a reliable ignition kernel.
Common engineering approaches include:
- Pilot ignition with an auxiliary fuel: a small pilot establishes a hot zone that accelerates NH3 decomposition.
- High-energy ignition: stronger spark energy can reduce variability, especially during transients.
- Thermal management: cylinder and exhaust temperatures influence how quickly decomposition begins.
Example: If an engine is tuned for stable operation at steady load but shows occasional misfire during rapid acceleration, the issue is often that the ignition kernel forms too late. Adjusting pilot timing earlier (or increasing pilot energy) can reduce ignition delay without changing the overall fuel mass balance.
Mixture Preparation and Combustion Stability
Ammonia can be used with different mixture strategies, but the design principle is consistent: avoid large regions that are too lean to ignite and too rich to oxidize cleanly.
Key design levers:
- Injection timing: earlier injection increases time for mixing and decomposition but can raise NOx if peak temperatures rise.
- Injection rate shaping: smoother fuel delivery reduces local extremes that cause either misfire or excessive NOx.
- Dilution and charge conditions: using excess air or exhaust gas dilution changes oxygen availability and effective temperature.
Example: For a given engine, increasing exhaust gas dilution may reduce NOx by lowering effective combustion temperature. However, if dilution pushes the charge below the decomposition threshold, you may see more ammonia slip. The “best” setting is the one that keeps decomposition active while limiting peak reactive conditions.
NOx and Slip: Linking Chemistry to Measurable Outcomes
NOx and ammonia slip are not independent. A design that improves ignition stability by making combustion hotter or faster can increase NOx. A design that suppresses NOx by cooling the process can leave NH3 unreacted.
A practical way to connect chemistry to measurements is to track three signals:
- Ignition timing and variability: indicates whether decomposition-led activation is reliable.
- Combustion phasing: indicates how quickly heat release completes.
- Exhaust NH3 concentration: indicates whether oxidation of nitrogen/hydrogen intermediates is finishing.
Example: If combustion phasing advances (earlier heat release) and NOx rises while NH3 slip falls, the engine is likely moving toward more complete oxidation. If both NOx and NH3 slip rise, the engine may be producing hot pockets that generate NOx while still leaving locally rich regions where NH3 oxidation is incomplete.
Mind Map: Reactivity to Engine Design Decisions
Worked Example: Choosing a Pathway Strategy
Suppose an engine is operating with a pilot-assisted strategy. During part-load operation, NOx is acceptable but ammonia slip is high. That points to incomplete oxidation completion rather than purely ignition failure.
A systematic adjustment sequence is:
- Confirm ignition stability using ignition delay variability. If variability is low, the decomposition-led activation is already adequate.
- Adjust injection timing slightly later to reduce over-mixing that can create locally rich pockets persisting into late combustion.
- Check combustion phasing. If phasing retards and slip decreases, the engine is likely spending less time in conditions that favor incomplete oxidation.
- Re-check NOx. If NOx rises, the change may have increased peak reactive conditions; then reduce charge temperature or dilution slightly to rebalance.
This approach keeps the reasoning anchored to chemistry stages: activation, nitrogen chemistry, and completion. When the engine is tuned this way, “fixes” stop being guesswork and start being controlled shifts between pathway behaviors.
2.3 Contaminants and Fuel Quality Control for Stable Operation
Stable ammonia-fuel operation starts with a simple idea: the engine and fuel system are designed around a known fuel composition and condition. Contaminants break that assumption by changing combustion behavior, clogging or corroding components, and upsetting control loops. Quality control is therefore not just “testing before bunkering”; it is a chain that begins at production and ends at the engine inlet.
Contaminants That Matter Most
Ammonia contaminants fall into a few practical buckets.
Water and moisture. Water can form during handling, especially when temperature and pressure conditions allow condensation. In fuel supply lines, water increases the risk of freezing in cold sections, promotes corrosion, and can destabilize injection behavior. A straightforward example: if a transfer line cools after shutdown, moisture can condense inside the line; the next start may ingest a slug of water before the system reaches steady conditions.
Inert gases and light impurities. Dissolved or entrained gases can alter density and vapor-liquid balance, affecting metering and pressure control. Even when they do not directly participate in combustion, they can shift how the fuel behaves during throttling and injection.
Reactive impurities and fuel “carryover.” Some impurities can react under engine conditions or interact with catalysts and aftertreatment components. The engineering consequence is often indirect: deposits, altered exhaust chemistry, or changes in NOx formation.
Particulates and corrosion products. Solids can originate from storage tank residues, transfer-line wear, or incomplete cleaning. They can block strainers and filters, and they can accelerate wear by acting like abrasive paste.
Salts and non-volatile residues. These are especially relevant when water is present. When water evaporates, salts can remain and concentrate at hot spots or in low-flow regions.
Quality Control Objectives
A useful way to set targets is to map each contaminant to an operational failure mode.
- Combustion stability: avoid composition shifts that change ignition support needs and combustion phasing.
- Fuel system reliability: prevent filter plugging, valve sticking, and corrosion-driven leaks.
- Aftertreatment performance: limit impurities that affect catalyst activity or exhaust chemistry.
- Measurement integrity: ensure sampling and metering represent the true bulk fuel.
Sampling and Testing That Actually Represent the Fuel
Sampling is where many quality programs stumble, because the sample can be “correct” yet not representative. The fix is procedural and mechanical.
- Define sampling points by flow regime. Take samples where the fuel is well mixed, not where it stratifies. For example, sampling from a dead-leg can over-represent water or heavier residues.
- Control sample temperature and pressure. Ammonia can change phase behavior quickly. If the sample conditions differ from the bulk, you can bias results for moisture and dissolved gases.
- Use consistent container handling. Containers should be compatible and preconditioned to avoid adsorption or contamination.
- Apply acceptance criteria tied to system design. If the engine fuel supply includes a specific strainer rating, the particulate limit should be set to keep expected plugging intervals within maintenance windows.
A practical example: if your filtration design assumes a maximum allowable solids loading to prevent strainer differential pressure from exceeding a threshold, then the acceptance test must measure solids in a way that correlates to that threshold, not just a generic “clean/dirty” indicator.
Control Strategy Across the Chain
Quality control works best as layered defenses.
- Upstream conditioning: remove water and manage impurities before the fuel reaches the marine terminal.
- Terminal controls: verify incoming batches, keep storage conditions stable, and prevent cross-contamination between tanks.
- Bunkering controls: ensure transfer lines are drained and purged as required, and confirm that sampling during transfer reflects the batch being loaded.
- Shipboard controls: maintain filtration, monitor differential pressure across strainers, and manage water removal where installed.
- Engine inlet verification: confirm that the fuel delivered to the engine meets the same criteria used for design basis assumptions.
Mind Map: Contaminants to Controls
Example: From Test Result to Operational Action
Suppose a batch test shows elevated moisture compared with the acceptance limit, but still within a “tolerable” range for storage. The stable-operation response is to treat moisture as a system-level variable, not a checkbox.
- Before bunkering: verify whether the terminal can blend with a drier batch to bring the delivered composition within the engine inlet target.
- During bunkering: increase sampling frequency to confirm that the delivered stream matches the blended plan.
- On board: watch strainer differential pressure and any water-management indicators during the first operating hours, because moisture-related solids can appear after evaporation.
This approach keeps the engine within its expected operating envelope while using the data you already collected, rather than relying on “it should be fine” logic.
Example: Preventing Misleading Samples
A common failure mode is sampling from a location that is not representative during transfer. If a sample is taken from a line section that experiences stratification, the measured moisture may be higher than the bulk fuel, leading to unnecessary rejection. The corrective action is to align sampling points with mixing conditions and to standardize sampling temperature and pressure so the measurement reflects the same phase behavior the engine will see.
2.4 Material Compatibility and Corrosion Mechanisms in Ammonia Service
Ammonia service is less about one “magic corrosion” and more about a set of interacting conditions: phase (liquid vs vapor), temperature, water content, oxygen exposure, and the material’s surface chemistry. The engineering goal is to keep those interactions from turning into corrosion, stress cracking, or loss of sealing performance.
Foundational Compatibility Rules
Start with the simplest compatibility check: what is the ammonia phase contacting the material, and what impurities are present? In many systems, the most aggressive spots are not the bulk tank walls but the interfaces—wetting films, low points in piping, valve seats, and areas where condensation forms.
A practical rule set:
- Keep water out of “dry” ammonia lines. Even small water levels can enable corrosion pathways.
- Control oxygen ingress. Oxygen plus ammonia can change surface films and accelerate attack.
- Avoid galvanic couples in wet zones. Dissimilar metals connected electrically can drive localized corrosion.
- Design for drainage and purge. Residual liquid and stagnant pockets are corrosion hotspots.
Example: If a transfer line has a low point where liquid ammonia can collect, that location often becomes the first place where pitting or film breakdown is observed, even when the rest of the line looks fine.
Corrosion Mechanisms You Must Plan For
General Corrosion and Film Breakdown
Ammonia can form protective films on some alloys, but those films are sensitive to water and oxygen. When the film is stable, corrosion rates may be low; when it is disrupted, the surface can revert to active corrosion.
Engineering implication: corrosion allowance alone is not enough. You need material selection plus operational controls that prevent film-destabilizing conditions.
Localized Corrosion and Pitting
Localized corrosion is driven by small-scale differences in chemistry at the metal surface. In ammonia systems, localized wetting, crevices under gaskets, and deposits from impurities can create differential aeration and concentration gradients.
Example: A flange gasket that traps a thin wet film can create a crevice environment where corrosion concentrates, even if the bulk fluid is relatively clean.
Stress Corrosion Cracking and Stress Corrosion Susceptibility
Stress corrosion cracking (SCC) requires a susceptible material, tensile stress, and a reactive environment. In ammonia service, the environment can be influenced by water and oxygen, and tensile stress can come from residual stresses, tightening practices, or thermal cycling.
Engineering implication: compatibility is not only “which alloy,” but also “how it is made and installed.” Heat treatment, weld procedures, and bolt preload control matter.
Corrosion Fatigue in Cyclic Duty
Where vibration, pressure cycling, or flow-induced pulsation exists, corrosion can reduce fatigue life. Even moderate corrosion can create surface roughness and pits that act as crack initiators.
Example: A flexible section near a pump discharge can see both cyclic stress and intermittent wetting; that combination is a recipe for early cracking if materials and surface finish are not controlled.
Material Families and Where They Fit
Rather than listing alloys as “good” or “bad,” map them to the conditions they can tolerate.
- Carbon and low-alloy steels: often used where conditions are controlled, but they can be vulnerable when water and oxygen are present, especially in crevices.
- Stainless steels: generally offer better resistance due to passive films, but localized corrosion and SCC risk still depend on alloy grade, weld quality, and impurity control.
- Nickel-based alloys: can be more resistant in harsher impurity conditions, but they still require correct installation practices to avoid crevice and galvanic issues.
- Elastomers and polymers: compatibility depends on swelling, permeation, and mechanical integrity under temperature and chemical exposure.
Example: A valve seat material might be compatible in bulk flow, yet the seal area can experience trapped moisture and oxygen, shifting the local chemistry enough to cause degradation.
Galvanic and Crevice Corrosion Engineering
Galvanic corrosion occurs when two dissimilar metals are electrically connected in an electrolyte. In ammonia systems, the electrolyte is often a thin water film rather than bulk liquid.
Crevice corrosion occurs in narrow gaps where mass transfer is limited. Typical crevice locations include:
- under gaskets and flange faces
- around fasteners
- at weld undercuts
- inside sleeve-to-pipe interfaces
Engineering practices:
- Use compatible material pairs and avoid unnecessary dissimilar connections.
- Ensure surface finish and gasket selection minimize crevice trapping.
- Apply proper torque and gasket compression to prevent micro-gaps.
Practical Verification and Acceptance Checks
Compatibility is verified through a combination of material documentation and system-level checks:
- Material traceability: confirm heat numbers, weld procedures, and coating specifications.
- Weld inspection: focus on undercutting, lack of fusion, and surface defects that can seed crevices.
- Hydrotest and purge strategy: ensure post-test residues are removed so water and salts do not remain.
- Operational discipline: keep ammonia dry where required and prevent oxygen ingress during commissioning and maintenance.
Example: After a pressure test, if residues remain in low points, the first “real” ammonia transfer can dissolve and redistribute contaminants, creating corrosion conditions exactly where you least want them.
Mind Map: Material Compatibility and Corrosion Mechanisms
Example: Flange and Valve Seat Compatibility Walkthrough
Consider a stainless steel flange connected to a different metal component. If a gasket traps a thin water film during shutdown, oxygen can dissolve into that film and promote localized corrosion at the crevice. The fix is not only “change the gasket,” but also ensure correct gasket compression, minimize micro-gaps, and avoid dissimilar metal coupling where the electrolyte can form. This is why compatibility checks must include installation details, not just material datasheets.
2.5 Handling and Venting Behavior for Risk Assessment and Design
Ammonia handling and venting design starts with one practical question: where can ammonia go, and how fast can it reach a concentration that matters? Risk assessment turns that question into a set of scenarios, each tied to measurable inputs such as release rate, ventilation effectiveness, and time to ignition or exposure limits.
Foundational Concepts for Release and Dispersion
A release can be liquid, vapor, or a two-phase mixture. In ammonia service, the most important behavior is that a vapor cloud forms quickly, while liquid can continue to flash and feed the vapor cloud. Venting design must therefore treat “ventilation” as a time-dependent process, not a single airflow number.
Key terms used in design reviews:
- Release phase: vapor only, liquid only, or flashing two-phase.
- Source strength: mass flow rate into the space or outdoors.
- Confinement: whether the release is in a compartment, duct, or open deck area.
- Ventilation path: where air enters, where it exits, and whether short-circuiting occurs.
A simple example: a small leak at a fuel valve seat in an enclosed machinery space. Even if the leak rate is modest, the vapor can accumulate near the release point before mixing catches up. If the exhaust outlet is poorly placed, the cloud can linger where people work.
Modeling Release Scenarios for Risk Assessment
Risk assessment typically builds a scenario set that covers normal, abnormal, and emergency conditions. For venting behavior, scenarios should include:
- Minor leak with continuous source: e.g., packing leakage.
- Line rupture or hose failure: short-duration high release.
- Tank venting during transfer or pressure control: controlled but potentially large mass flow.
- Blocked vent or failed fan: ventilation loss with ongoing release.
For each scenario, define the release location, duration, and the ventilation mode. A blocked exhaust fan is not just “no ventilation”; it changes the mixing pattern and can shift the highest concentration to a different zone.
Venting Design Principles That Affect Concentrations
Venting systems aim to keep ammonia concentrations below relevant limits in occupied and equipment-protected areas. The design logic is:
- Remove ammonia at the source when feasible.
- Prevent accumulation in low or stagnant zones.
- Ensure exhaust discharge is located to avoid re-entrainment.
- Maintain predictable airflow direction during releases.
Because ammonia is lighter than air, it tends to rise, but buoyancy is not the whole story. Jet momentum, wind, and mechanical ventilation can dominate. In a ducted exhaust, the flow pattern matters more than the gas density alone.
Concrete example: two ventilation layouts for the same compartment. In layout A, exhaust is near the ceiling and air supply is near the floor, creating a sweep. In layout B, exhaust is near a wall corner. Layout B often produces a pocket where the cloud lingers, even with the same fan capacity, because the airflow short-circuits around the release zone.
Vent Stack and Discharge Behavior
Outdoor discharge design focuses on plume rise, dilution, and avoidance of recirculation. The discharge point should be positioned so that exhaust does not enter intakes, open windows, or adjacent work areas. Wind direction and ship motion can change the effective dilution.
A practical check used in engineering reviews: assume the worst plausible wind direction for the site layout and verify that the plume does not intersect typical access routes. If the exhaust outlet is near a superstructure wake, the plume can be trapped and diluted less than expected.
Two-Phase Effects and Flashing Considerations
If liquid ammonia can reach a vent path, flashing can increase vapor generation. This matters for:
- Vent lines connected to relief devices where liquid carryover may occur.
- Drains and purge systems that route condensate or trapped liquid.
- Transfer hose end failures where liquid can be entrained.
Design mitigation includes ensuring vent lines are arranged to minimize liquid carryover, using appropriate separators where required, and selecting materials and supports that tolerate thermal cycling.
Example: a vent line that slopes uphill toward a stack can trap liquid in low points if not drained correctly. During a relief event, trapped liquid can later flash, creating a delayed vapor pulse that complicates alarm and evacuation timing.
Instrumentation and Alarm Setpoints for Venting Events
Detection and control should align with the venting strategy. If the design relies on exhaust fans to maintain safe conditions, then alarms should be tied to both concentration trends and ventilation status.
A systematic approach:
- Place sensors to represent the likely high-concentration zones based on airflow patterns.
- Include interlocks that start or boost exhaust upon detection.
- Add alarms for fan failure and duct blockage, not only for gas concentration.
Example: if a fan trips, concentration can rise quickly. A concentration-only alarm may arrive too late for safe shutdown actions, while a ventilation-status alarm triggers earlier and supports a controlled response.
Mind Map: Handling and Venting Behavior for Risk Assessment and Design
Engineering Example Workflow for a Compartment Release
- Define the scenario: a small leak at a valve in a machinery space, continuing for 10 minutes.
- Select the ventilation mode: normal operation with one exhaust fan running.
- Identify likely accumulation zones: based on supply and exhaust placement, not just gas properties.
- Check two cases: fan running versus fan failed.
- Set instrumentation logic: alarms for concentration and fan status, with interlocks that boost exhaust when detection occurs.
This workflow ensures the venting design is testable and reviewable, because each decision ties to a specific scenario and a measurable response.
3. Ammonia Production, Conditioning, and Fuel Quality Assurance
3.1 Production Routes and Their Engineering Impacts on Fuel Composition
Ammonia used as a marine fuel is not just “ammonia.” Its production route determines what else is present, how much, and how those impurities behave during storage, transfer, and combustion. Engineering decisions start with composition because composition drives: (1) safety-relevant properties like water content and pressure behavior, (2) engine-relevant behavior like ignition support needs and combustion stability, and (3) infrastructure-relevant behavior like corrosion and filter loading.
Foundational Idea: Composition Is a Chain Reaction
Production routes set the upstream chemistry, which sets the separation strategy, which sets the final impurity profile. For example, if a route introduces nitrogen-containing byproducts, the downstream purification must remove them; if purification is less effective for a specific impurity, that impurity can later show up as deposits or sensor drift. The engineering task is to translate “route” into “composition bands” that can be tested and controlled.
Major Production Routes and What They Tend to Leave Behind
Most industrial ammonia is produced by either steam reforming of natural gas or by electrochemical routes using hydrogen from water splitting. Each route has a different “impurity signature,” even when the final product meets a general ammonia specification.
- Steam reforming with synthesis gas conditioning
- Typical composition drivers: trace hydrocarbons, oxygenated species, and sulfur-related contaminants can appear depending on feedstock purity and gas cleanup performance.
- Engineering impacts: sulfur and oxygenates can affect catalyst performance in exhaust systems and can contribute to fouling tendencies. Even at low levels, they can change how deposits form on heat-exchanger surfaces.
- Practical example: if a terminal receives ammonia with slightly elevated sulfur compounds, commissioning filters may load faster during early bunkering campaigns, and differential pressure across strainers rises sooner than expected.
- Coal gasification with extensive cleanup
- Typical composition drivers: a broader range of trace contaminants can be present in raw syngas, requiring more aggressive cleanup.
- Engineering impacts: higher likelihood of trace metals or particulate carryover if cleanup and polishing are not tightly controlled.
- Practical example: a ship’s fuel transfer system may show more frequent strainer blowdowns because fine solids increase the rate of particle accumulation, especially during the first transfers after tank commissioning.
- Electrolytic hydrogen with nitrogen fixation
- Typical composition drivers: the impurity profile is dominated by water quality, electrolyte contamination, and nitrogen feed purity rather than hydrocarbon-related byproducts.
- Engineering impacts: water content and dissolved impurities can be more variable if conditioning is not consistent, which matters for corrosion risk and for stable fuel delivery.
- Practical example: if water content is higher in one batch, the ship may need tighter control of pre-use draining and filtration steps to prevent water-driven operational issues.
Purification and Conditioning Steps That Reshape Composition
Even with the same production route, purification determines the final “fuel chemistry.” Key steps include:
- Primary separation: removes bulk gases and reduces major contaminants.
- Polishing: targets trace impurities that are hard to remove early.
- Drying and water control: reduces water content that otherwise affects corrosion and system stability.
- Condensate management: prevents carryover of dissolved species into storage.
A useful engineering mindset is to treat purification as a set of “impurity gates.” Each gate has a measurable efficiency, and the overall impurity level is the product of gate performances. That’s why two suppliers using the same route can still deliver different impurity profiles.
How Composition Impacts Engineering Choices
- Storage and transfer: water content influences corrosion mechanisms and can change how quickly systems foul. Trace solids influence strainer loading and pump wear.
- Combustion and aftertreatment: impurities can alter combustion chemistry and deposit formation, which affects heat transfer and emissions control stability.
- Instrumentation: some impurities can bias sensor readings or affect calibration stability through deposits on measurement points.
Mind Map: Production Route to Fuel Composition to Engineering Effects
Example: Translating a Batch Test into Operational Actions
Suppose a terminal receives two ammonia batches with the same nominal ammonia purity but different measured water content and trace solids.
- Batch A: lower water, minimal solids. The ship can follow standard pre-transfer draining and filtration intervals.
- Batch B: higher water and elevated solids. The ship increases attention to pre-use draining, schedules additional strainer checks during early transfers, and verifies that fuel delivery pressure remains stable.
The key point is not that one batch is “bad,” but that engineering actions should match the measured composition, not the label.
Engineering Takeaway
Production routes set the starting chemistry; purification and conditioning set the final impurity profile. The engineering best practice is to connect route-informed expectations to batch-specific testing, then convert those results into concrete storage, transfer, and combustion controls that reduce surprises during real operations.
3.2 Conditioning Processes for Water Removal and Impurity Management
Ammonia used as marine fuel needs conditioning because water and impurities change how the fuel behaves in storage, transfer, and combustion. Water can freeze in cold lines, form corrosive mixtures, and upset injection and aftertreatment performance. Impurities such as sulfur compounds, oxygenated species, and heavy hydrocarbons can increase deposits, catalyst poisoning, and unstable combustion. Conditioning is therefore not a single step; it is a controlled sequence that starts with measuring what you have and ends with verifying that the fuel meets acceptance criteria.
Foundational Concepts for Conditioning
Conditioning begins with a simple mass-and-interfaces view. Water exists as dissolved, suspended, or condensed phases depending on temperature and pressure. Impurities may be dissolved in the ammonia liquid, carried in vapor, or trapped as particulates. Each conditioning method targets one physical form: phase separation for free water, adsorption for trace polar contaminants, filtration for solids, and polishing for residuals.
A practical engineering rule is to treat conditioning as a loop: measure → condition → re-measure. If you only measure at the end, you will not know whether the process failed or the measurement was wrong. If you only measure at the start, you will not know whether the process worked.
Water Removal Methods and How They Work
1) Phase Separation and Drainage Start with settling and controlled drainage to remove free water. In a typical setup, ammonia is cooled or held at conditions that encourage water to separate into a distinct phase. The separated water is drained to a dedicated collection system. A good practice is to include a sight glass or level indication on the drain pot so operators can confirm separation without guessing.
Example: During commissioning, an operator notices repeated high water readings after bunkering. A review shows the drain pot was not fully purged after maintenance. The next batch shows improved water content once the drain pot is returned to its normal operating state.
2) Refrigeration-Assisted Condensation Control Water can reappear if humid air or wet equipment is introduced during transfer. Conditioning therefore includes controlling moisture ingress: dry nitrogen purges for hoses and manifolds, tight seals, and controlled warm-up/cool-down sequences. Refrigeration-assisted control is used to manage condensation behavior so that water forms where it can be removed, not where it can cause blockages.
3) Adsorption Polishing After bulk water removal, trace moisture is reduced using adsorption media. The media selection depends on compatibility with ammonia and expected contaminant chemistry. Engineering practice is to size the adsorption bed based on breakthrough testing and to monitor differential pressure to detect channeling or fouling.
Example: A terminal uses adsorption polishing but ignores differential pressure trends. Later, the bed channels and moisture slips through. The fix is not just replacing the media; it is implementing a pressure-based maintenance trigger.
Impurity Management Across the Conditioning Train
Impurities are handled by matching the removal mechanism to the contaminant form.
1) Filtration for Particulates Solids can originate from upstream equipment, corrosion products, or degraded seals. Filtration removes suspended particles before they reach injectors and valves. A practical approach is staged filtration: a coarse stage to protect downstream elements and a finer stage to meet cleanliness targets.
2) Chemical Scavenging for Reactive Species Some impurities react with ammonia or with catalyst surfaces. Scavenging steps are used where chemistry demands it, such as removing sulfur-bearing species that can contribute to catalyst deactivation. The engineering detail is to verify scavenger capacity and to ensure spent media handling is safe for ammonia service.
3) Vapor-Phase Control for Carryover Even if liquid is clean, vapor carryover can transport trace contaminants. Conditioning systems therefore include vapor management: demisters, controlled reflux, and appropriate vent treatment. The goal is to prevent “clean liquid with dirty vapor” from undermining the final fuel quality.
Measurement, Acceptance, and Batch Control
Conditioning is only as good as the measurement plan. Water content is typically assessed with methods sensitive to trace levels, and impurity profiles are verified against acceptance criteria defined for the propulsion and aftertreatment system.
A robust batch control practice includes:
- Sampling points that represent the final delivered state, not intermediate tanks.
- Defined sampling frequency during steady operation and increased frequency during transitions.
- Clear hold-and-release rules when results are near limits.
Example: A batch passes initial water checks but fails after transfer. Investigation shows sampling was taken from a tank before final polishing. The corrected procedure samples from the final outlet line after polishing.
Integrated Mind Map
Mind Map: Conditioning Processes for Water Removal and Impurity Management
Engineering Example Workflow
A terminal receives ammonia with variable moisture readings. It first performs phase separation and drains the water pot, then runs staged filtration to remove particulates, followed by adsorption polishing to reduce trace moisture. During transfer, it maintains dry purges and monitors differential pressure across the polishing bed. Finally, it samples from the final outlet line and compares results to acceptance criteria before releasing the batch for bunkering. This sequence keeps the “what changed” question answerable at each step, which is the difference between troubleshooting and guessing.
3.3 Fuel Sampling, Testing, and Acceptance Criteria for Marine Use
Fuel sampling and testing are where “paper fuel” becomes “usable fuel.” For ammonia, the goal is not just to measure properties, but to prove that the delivered batch will behave predictably in storage, transfer, and combustion systems.
Foundational Principles for Sampling
Start with the sampling plan before touching a valve. Define the sampling point (tank bottom, vapor space, or manifold), the sampling frequency (per delivery, per shift, or per batch), and the sampling method (grab sample, composite sample, or continuous sampling). A common best practice is to align the sampling location with the system that will actually consume the fuel. If the engine supply draws from a settling tank, sampling only the receiving tank can misrepresent what the engine sees.
Next, control contamination. Use dedicated, ammonia-compatible sampling equipment and keep caps closed between steps. Even small water ingress matters because ammonia systems are sensitive to water and certain impurities that can affect combustion stability and downstream components.
Finally, preserve representativeness. For pressurized deliveries, pressure changes during sampling can cause phase behavior shifts. Use procedures that minimize flashing and ensure the sample container is prepared for the expected pressure and temperature conditions.
Testing Strategy That Matches Engineering Needs
Testing should map directly to acceptance criteria categories:
- Identity and composition: Confirm ammonia concentration and detect major deviations that could affect stoichiometry and combustion control.
- Water content and impurities: Measure water and relevant contaminants that influence corrosion risk, catalyst behavior, and combustion stability.
- Physical suitability: Verify properties that affect transfer and metering, such as density-related parameters and any indicators of abnormal phase behavior.
- Safety-relevant checks: Ensure results support safe operation of detection, ventilation, and relief systems by confirming that the fuel does not contain unexpected constituents.
A practical approach is to use a two-tier workflow. Tier 1 uses fast screening tests to catch obvious nonconformities quickly. Tier 2 uses confirmatory laboratory tests for parameters that drive acceptance decisions and engine performance.
Acceptance Criteria and Decision Logic
Acceptance criteria should be written as measurable limits with clear pass/fail rules and defined actions for borderline results. For example, if water content exceeds the limit, the batch should be rejected for direct engine use, but it may still be usable for non-critical systems if the vessel design allows it. If results are close to the limit, specify whether retesting is permitted and under what conditions.
Use a decision tree that includes sampling integrity. If the sample shows signs of contamination (for example, inconsistent duplicate results beyond the allowed tolerance), the correct action is not “accept anyway,” but “resample and retest.” This keeps the acceptance process defensible during audits and incident investigations.
Example Workflow for a Typical Bunkering Delivery
- Pre-transfer verification: Confirm sampling ports are accessible, equipment is clean, and containers are labeled with batch identifiers.
- Composite sampling: Collect multiple increments over the delivery window to reduce the effect of stratification.
- Tier 1 screening: Run quick checks for ammonia concentration and key impurity indicators.
- Tier 2 confirmation: Send retained samples to laboratory testing for water and impurity quantification.
- Acceptance decision: Apply limits; if pass, release the batch for engine supply. If fail, segregate and document.
- Retention and traceability: Store retained samples for the defined record period so that disputes can be resolved without guessing.
A small but important best practice: record the sampling start and end times and the delivery rate. If later results correlate with a specific portion of the delivery, the logs help explain why.
Mind Map: Sampling, Testing, and Acceptance
Example Acceptance Criteria Set for Engineering Use
Acceptance criteria should be expressed as limits tied to system needs. For instance:
- Water content: Must be below the maximum value that prevents unacceptable corrosion risk and combustion instability.
- Impurity thresholds: Must be below values that could foul aftertreatment components or disrupt combustion control.
- Ammonia concentration: Must fall within a defined range so that fuel dosing remains accurate.
When a parameter is borderline, the criteria should specify whether the batch can be used under restricted operating conditions (such as reduced load) or must be rejected for engine supply. The key is that the acceptance document should tell operators what to do next, not just what failed.
Case Study: Duplicate Results That Don’t Match
Suppose Tier 1 screening yields two duplicate samples with impurity results that differ beyond the allowed tolerance. The correct response is to treat this as a sampling integrity issue. Resample using the same method but with verified equipment cleanliness and container handling, then repeat Tier 1. If the duplicates now agree and Tier 2 confirms compliance, accept the batch. If not, reject and document the sampling deviation so the supplier can address the root cause.
This kind of disciplined logic prevents “acceptance by hope” and keeps the fuel system predictable from tank to engine.
3.4 Traceability and Batch Control for Engine and Tank Operations
Traceability answers a simple question: “Which exact fuel ended up in which engine at which time, under which operating conditions?” Batch control answers the second question: “How do we prevent mixing, mislabeling, and silent quality drift?” Together they reduce troubleshooting time and make safety and performance decisions defensible.
Foundational Concepts for Traceability
Start with three identifiers that never change for a given fuel lot:
- Batch ID assigned at production or conditioning.
- Bunkering/Transfer Record ID created at each transfer event.
- Onboard Tank ID that maps to physical containment.
A practical rule: every measurement (sampling result, density/pressure reading, water content test) must reference at least one of these identifiers. If a lab report cannot be tied to a batch ID, it cannot be used for acceptance decisions.
Example: A terminal issues Batch ID A-1042. The ship’s bunker plan lists Tank 3 as the receiving tank. The sampling report must state “Batch A-1042 into Tank 3,” and the transfer record must show the start and end times for that same event.
Batch Control Logic from Receiving to Use
Batch control is easiest when you treat each tank as a “container of containers.” You track which batch(es) are present and in what proportions.
- Receiving and segregation: keep incoming fuel in a defined receiving path. If the system allows only one batch per tank, enforce it operationally.
- Mixing rules: if mixing is unavoidable (for example, topping up), define a mixing policy that records the mixing ratio basis and the resulting composite batch designation.
- Hold and release criteria: do not release fuel to the engine until required tests are complete and within limits.
- Consumption accounting: when fuel is drawn, update the tank’s remaining quantity and maintain a link to the batch composition.
Example: Tank 2 receives Batch B-2201, then later receives a smaller top-up of Batch B-2210. The onboard system creates a composite designation “Tank2-Composite-2026-03-14-1” tied to both batch IDs and the measured volumes.
Sampling, Testing, and Decision Traceability
Traceability becomes useful when it drives decisions. For each tank, define a sampling plan that matches operational reality:
- Pre-transfer sample from the receiving line or tank ullage space if relevant.
- Post-transfer sample after stabilization.
- In-service samples at defined drawdown thresholds or after maintenance events.
Each test result should be stored with: test method, instrument ID, calibration status, operator, timestamp, and the batch/tank mapping.
Example: If water content is measured after transfer, the record must show whether the sample came from the tank bottom drain, a vapor space sample, or a recirculation loop. Those locations behave differently, so mixing them up creates false confidence.
Tank-to-Engine Traceability in Operations
To connect tank fuel to engine operation, you need a mapping between:
- Fuel supply manifold state (which tank feeds which service line)
- Engine operating mode (start, steady load, transient)
- Time windows (when the manifold configuration was active)
A simple approach is to log “fuel source state” whenever valves or transfer pumps change. Then each engine run record references the active fuel source state.
Example: During a load increase, the system switches from Tank 1 to Tank 2 to maintain pressure. The engine log should show the switch time, and the fuel quality record for Tank 2 should be the one used for that run’s acceptance basis.
Mind Map: Traceability and Batch Control
Practical Example Workflow for One Transfer
- Before transfer: confirm Tank 3 is empty or assigned to a defined batch policy. Verify the planned receiving line path and sampling points.
- During transfer: record start/end times, flow totals, and the Transfer Record ID. If the system supports it, record pressure and temperature trends for the transfer line.
- After transfer: take post-transfer samples and run acceptance tests. Mark Tank 3 as “released” only after results are within limits.
- Engine use: log fuel source state changes. When Tank 3 feeds the engine, engine run records reference Tank 3’s released batch composition.
- Reconciliation: compare metered delivered quantity with tank level change estimates. If there is a mismatch beyond tolerance, flag the tank as “under review” and restrict engine draw until resolved.
Common Failure Modes and How Traceability Prevents Them
- Mislabeling: solved by requiring batch ID presence in every record, not just on paper.
- Untracked mixing: solved by composite designation rules and explicit mixing ratios.
- Sampling location confusion: solved by recording sampling point and method.
- Valve change without logging: solved by fuel source state event logging tied to engine run windows.
Traceability is not paperwork for its own sake; it is the chain of evidence that lets engineers answer “what happened” quickly and “what is safe to do next” with confidence.
3.5 Quality Assurance Procedures for Bunkering Readiness
Bunkering readiness is the moment when “paper design” becomes “safe, measurable transfer.” Quality assurance (QA) here means you can demonstrate—using defined checks—that the receiving system, the fuel, and the operational plan are aligned. The goal is simple: prevent wrong fuel, wrong condition, or wrong configuration from reaching the ship’s tanks.
Foundational Inputs That QA Must Verify
Start with three inputs that drive every later check:
- Fuel identity and condition: correct ammonia grade/quality, acceptable water content, and no unexpected contaminants.
- Receiving system configuration: correct tank selection, valves in the intended positions, and correct line routing.
- Operational readiness: calibrated instruments, valid procedures, and trained personnel.
A practical way to keep this systematic is to use a readiness checklist that mirrors the transfer sequence. If a check cannot be tied to a step, it probably belongs elsewhere.
Pre-Transfer Document and Equipment Checks
QA begins before any hose is connected.
- Procedure validity: confirm the latest approved bunkering procedure is in use, including the defined hold points for sampling and reconciliation.
- Calibration status: verify that key measurement devices (flow meters, temperature/pressure sensors used for reconciliation, and sampling equipment) have current calibration certificates and are within tolerance.
- System integrity: confirm leak test status for relevant lines and fittings, and verify that strainers/filters are installed and clean.
- Instrument functionality: perform quick functional tests for alarms and interlocks that will govern transfer stop conditions.
Example: If the flow meter is out of tolerance, reconciliation becomes unreliable. QA should stop the transfer until the meter is corrected or an approved alternative measurement method is used.
Fuel Quality Verification with Sampling Logic
Fuel QA must be defensible, not just “we tested it.” Use a sampling plan that matches the transfer reality.
- Sampling points: take samples from the transfer stream at a defined location that represents what the ship will receive.
- Timing: sample after initial stabilization of the transfer line, not immediately at start-up.
- Acceptance criteria: compare results to the agreed limits for water content, contaminants, and any other contract parameters.
- Chain of custody: label samples uniquely, record who handled them, and preserve them under conditions that prevent composition change.
Example: If water content is above limit, the receiving system may experience operational issues such as freezing risk in certain components or increased corrosion potential. QA should require corrective action before continuing.
Configuration Control for Receiving Systems
Configuration mistakes are common because they are easy to make and hard to notice.
- Tank selection: verify the intended tank(s) and confirm they are in the correct pressure/temperature state for transfer.
- Valve lineup: use a valve position verification method (visual check plus system status confirmation) and record it.
- Line routing: confirm transfer lines are connected to the correct manifold and that any bypasses are locked out.
- Vapor management readiness: ensure venting/relief paths are unobstructed and aligned with the procedure.
Example: If the wrong tank is selected, the ship may exceed operational limits for that tank’s pressure range. QA should treat this as a hard stop.
Operational Readiness and Hold Points
QA should define hold points where the transfer pauses for verification.
- Before start: confirm readiness of detection systems, ventilation status, and emergency shutdown triggers.
- During transfer: pause at defined intervals to confirm flow stability and that measured parameters remain within expected bands.
- After transfer: perform reconciliation checks and confirm the final tank condition matches the expected mass balance.
Example: If flow rate drifts while pressure remains stable, it may indicate partial blockage or sampling mismatch. QA should investigate before proceeding further.
Mind Map: Bunkering Readiness QA
Go/No-Go Decision and Nonconformance Handling
QA must produce a clear decision record: Go only when all required checks pass, and No-Go when any hard-stop criterion fails.
- Hard stops: wrong fuel identity, out-of-tolerance critical instruments, invalid valve lineup, or fuel quality outside acceptance limits.
- Soft issues: minor deviations that can be corrected without compromising safety, provided the procedure allows it and QA re-verifies.
Example: If fuel quality is borderline but still within acceptance, QA records the result, confirms the sampling method, and ensures the transfer continues under the same acceptance logic for the remainder of the batch.
Integrated Example Walkthrough
On 2026-03-11, a terminal plans a ship transfer.
- QA confirms the approved procedure version and verifies flow meter calibration is current.
- Sampling is scheduled after line stabilization; samples are labeled and logged.
- The ship’s QA verifies tank selection, valve positions, and vapor management alignment.
- At the first hold point, fuel test results meet acceptance criteria and transfer begins.
- During transfer, QA monitors flow stability and checks that measured parameters stay within expected bands.
- After transfer, QA reconciles delivered mass with tank level/pressure changes and records the outcome.
If any step fails, QA documents the nonconformance, applies corrective action, and re-checks the specific failing item before resuming.
4. Ammonia Storage and Bunkering Infrastructure for Ports and Terminals
4.1 Storage System Architectures for Marine Fuel Terminals
Marine fuel terminals need storage architectures that match three realities: ammonia’s phase behavior, the operational rhythm of bunkering, and the safety case’s tolerance for releases. The architecture is not just “tanks plus pipes”; it is a set of choices that determine how reliably fuel can be conditioned, transferred, and accounted for under normal and upset conditions.
Foundational Concepts for Architecture Selection
Start with the storage state. Ammonia is typically handled as a pressurized liquid at ambient temperatures in marine terminal contexts, which drives the need for pressure-rated containment, vapor management, and reliable boil-off handling. Next, define the terminal’s bunkering pattern: continuous small transfers favor fast, stable transfer trains; batch bunkering favors larger inventory buffers and more time for conditioning and reconciliation.
Finally, map the safety philosophy to physical layout. A good architecture makes the “safe state” easy to reach: isolation valves close quickly, pressure relief routes are sized and routed to safe locations, and detection/ventilation are placed where releases are most likely to accumulate.
Core Architecture Types
Most terminal designs fall into a few repeatable patterns. Each pattern can be implemented with different tank sizes and transfer capacities.
Single Inventory, Shared Transfer Trains
This is the simplest: one storage inventory feeds one or more transfer trains. It reduces complexity in metering and reconciliation, but it concentrates risk and can create operational coupling. A practical best practice is to keep transfer trains modular so maintenance on one train does not force the whole terminal offline.
Example: A terminal with two loading arms can share one tank manifold, but each arm has its own isolation valves and sampling points so a line issue does not contaminate the entire transfer system.
Segregated Inventories for Quality Control
Here, tanks are grouped by fuel quality or conditioning status. The goal is to prevent “good fuel” from being diluted by off-spec batches and to simplify acceptance testing. This architecture adds valves, sampling, and reconciliation logic, but it reduces the chance of engine-impacting variability.
Example: One tank is dedicated to conditioned fuel meeting water and impurity limits; another holds newly received fuel awaiting test results. Transfer to ships is only permitted from the conditioned tank after sampling verification.
Multi-Pressure or Temperature Conditioning Loops
Some terminals include conditioning loops that adjust pressure and manage vapor-liquid equilibrium before bunkering. This can stabilize transfer rates and reduce throttling losses. The tradeoff is added instrumentation and control complexity.
Example: If bunkering pressure must be kept within a narrow band for a specific ship manifold, the terminal can use a controlled vapor return and pressure control valve set to maintain tank pressure while limiting unnecessary venting.
System Components That Make Architectures Work
Regardless of the type, the architecture must specify how these elements interact.
Containment and Pressure Relief Strategy
Tank selection and relief routing must align with the maximum credible pressure rise and the expected vent/blowdown behavior. A practical approach is to design relief to discharge to a controlled system (for example, a scrubber/neutralization arrangement) rather than relying on open release.
Example: Relief from a tank is routed to a dedicated blowdown header that leads to a treatment unit. The header includes isolation valves and drains so maintenance does not require draining the entire terminal.
Vapor Management and Boil-Off Handling
Vapor management prevents pressure excursions and reduces uncontrolled venting. Common methods include vapor return to tanks, controlled venting to treatment, and pressure balancing across manifolds.
Example: During loading, vapor displaced from the ship side is routed back to the terminal vapor system so the tank pressure does not climb faster than the control system can respond.
Transfer Train Layout and Isolation Philosophy
Transfer trains should be arranged so that any single failure can be isolated without losing the whole transfer capability. Isolation points typically include tank outlet valves, manifold valves, loading arm isolation, and emergency shutdown valves.
Example: Place sampling points upstream of the final isolation valve so operators can verify fuel quality without opening the entire line to the ship.
Metering, Sampling, and Reconciliation
Architectures must support accountability. Metering should be paired with sampling locations that represent the metered stream. Reconciliation logic should account for vapor handling and any losses to treatment systems.
Example: If vapor is returned, the reconciliation calculation includes both liquid metered volume and vapor return mass (or an equivalent measured parameter) so the ship’s received quantity matches the terminal’s accounting.
Mind Map: Storage System Architectures
Integrated Example Walkthrough
Assume a terminal that must bunkering multiple ships per day with consistent fuel quality. The architecture uses segregated inventories: a conditioned tank and a receiving tank. The conditioned tank feeds a shared manifold, but each loading arm has its own isolation valves and sampling points. Vapor displaced during loading is routed to a controlled vapor header that returns to the conditioned tank within operating limits. Relief from tanks and headers is routed to a treatment system, with isolation valves and drains so maintenance does not compromise safety functions. Metering is performed on the liquid line, while sampling is taken from the same line segment upstream of the final arm isolation valve. Reconciliation includes the measured liquid volume and the operationally tracked vapor return behavior so the terminal and ship quantities align.
This architecture is systematic: it reduces mixing risk, keeps transfer operations maintainable, and ties safety actions to physical isolation points rather than relying on operator heroics.
4.2 Tank Design Considerations for Pressure Relief and Containment
Ammonia fuel tanks must handle two realities at once: pressure can rise quickly, and releases must be controlled so the ship stays operable and people stay safe. Pressure relief and containment are therefore designed as a paired system—relief prevents structural overpressure, while containment limits the consequences of any venting or leakage.
Foundational Design Basis for Relief and Containment
Start with the design basis events that drive sizing. Typical triggers include blocked outlet scenarios, fire exposure heating the tank, rapid boil-off during transfer interruptions, and regulator or control failures that upset pressure. For each event, define the maximum credible pressure rise, the allowable tank pressure envelope, and the required safe state. A practical way to keep this systematic is to create a single “event-to-response” table during early design: event, initiating failure, expected pressure trajectory, relief action, and containment performance.
Containment begins with the question: what is the acceptable release path? For ammonia, the answer is usually “none to the atmosphere except through engineered venting,” and even then only to locations designed for safe dispersion and isolation.
Pressure Relief System Architecture
A relief system typically includes pressure relief valves (PRVs), rupture disks or burst devices where appropriate, vent piping, and a discharge arrangement. The key engineering goal is to keep the tank pressure below the design pressure with margin, even during worst-case heating or vapor generation.
Relief sizing depends on vapor generation rate and the thermodynamic behavior of ammonia in the tank. Engineers often use a mass balance approach: estimate the rate of ammonia vapor production under the event, then size relief capacity so that the net mass leaving via relief prevents pressure from exceeding the setpoint plus accumulation allowance.
Set pressure and accumulation are not arbitrary. Set pressure is chosen to avoid nuisance lifting during normal transients, while accumulation is limited so the tank never approaches its structural limits. A good sanity check is to compare the relief valve’s expected lift behavior with the tank’s pressure rise time constant; if the tank can reach near-design pressure before the valve can flow effectively, the design basis is not met.
Vent Discharge and Blowdown Engineering
Relief discharge piping must avoid backpressure that could reduce effective flow. Backpressure can come from vent headers, wind effects, or liquid carryover. To manage this, vent lines are routed to minimize elevation drops that encourage condensation and to include provisions that prevent liquid ammonia from reaching the PRV outlet.
Blowdown strategy matters because it controls how quickly the system returns to normal after lifting. If blowdown is too tight, valves may chatter, increasing wear and creating unstable discharge. If it is too wide, pressure may remain elevated longer than necessary. The engineering approach is to align valve characteristics with the tank’s expected cooling and vapor generation decline after the initiating event.
Containment Layers and Leak Control
Containment is usually implemented as multiple barriers: the primary tank boundary, secondary containment where required, and controlled venting to a safe location. For ammonia, secondary containment is not just about “catching leaks”; it also supports safe drainage, prevents accumulation in enclosed spaces, and enables detection.
Design the containment so that any leaked ammonia is directed to a controlled system rather than spreading. That means slope and drainage planning, venting of secondary spaces, and segregation from ignition sources. Even when the tank is “sealed,” the relief system can still create ammonia release, so the discharge location and dispersion design must be treated as part of containment.
Materials, Thermal Effects, and Corrosion Management
Pressure relief and vent components see different conditions than the tank wall. Relief valves and vent piping experience cycling, temperature gradients, and potential wet flow. Materials selection must consider ammonia compatibility and the effect of moisture and impurities. Corrosion control is not limited to the tank; it includes valve internals, gaskets, and any downstream piping exposed to condensate.
Thermal effects also influence containment performance. During fire exposure, heat flux can raise tank pressure and also heat relief discharge lines, increasing the risk of condensation and blockage. Insulation and routing choices should therefore be coordinated with relief sizing and discharge geometry.
Integrated Mind Map for Relief and Containment
Mind Map: Pressure Relief and Containment for Ammonia Tanks
Example: Sizing Logic for a Fire Exposure Event
Assume a tank experiences fire exposure that increases vapor generation. The engineering workflow is: (1) estimate heat input to the tank and convert it to vapor generation rate using ammonia thermodynamic properties; (2) compute the required mass flow through relief so that tank pressure stays below the allowable limit; (3) select PRV capacity accounting for valve efficiency and expected accumulation; (4) verify vent piping backpressure is low enough that the PRV can actually pass the required flow; and (5) confirm the discharge location can handle the resulting release without creating hazardous concentrations near occupied areas or equipment.
A common failure mode is stopping at step (3). If the vent header is undersized or routed in a way that collects condensate, the PRV may lift but the system still cannot relieve effectively, pushing pressure higher than predicted. That’s why the containment and relief piping design must be checked together, not sequentially.
Verification Checks That Keep the Design Honest
Functional verification should include relief valve setpoint confirmation, blowdown behavior checks, and vent piping flow path validation under representative conditions. Containment verification should include leak path assumptions, drainage effectiveness, and the ability of secondary spaces to avoid ammonia accumulation. When these checks are done as a single integrated package, the design basis events map cleanly to the engineered response, and the tank remains within safe pressure and controlled release boundaries.
4.3 Transfer Line Design for Loading Arms and Hoses
A transfer line is the “plumbing brain” between the terminal and the vessel. For ammonia service, the design goal is simple to state and hard to execute: deliver the required flow rate and pressure to the ship with predictable quality, while keeping leaks, overpressure, and incompatible materials firmly under control.
Foundational Requirements and Design Basis
Start with a clear design basis before choosing hardware. Define the maximum and minimum transfer rates, expected ambient conditions, allowable pressure drop, and the required delivery pressure at the ship manifold. Also specify the operational envelope: typical transfer duration, number of transfers per day, and whether the line must support vapor return or only liquid transfer.
A practical example: if the ship manifold requires 6 bar(g) for stable feed to the ship’s transfer pumps, and the terminal pump can supply 10 bar(g), you still must budget pressure losses across loading arms, hoses, strainers, filters, and control valves. If you ignore this, the line may “work” at the start and then starve the ship as the transfer progresses.
Line Routing and Layout Principles
Routing affects both hydraulics and safety. Keep the transfer line as short as practicable, minimize sharp bends, and avoid low points where condensate or water could collect. For hoses, ensure they are not twisted beyond manufacturer limits and that their movement range matches the expected berth motions.
A good rule of thumb is to design for the worst-case relative motion between ship and terminal. If the hose length is chosen only for static alignment, the hose may become over-stressed during tide or ship trim changes.
Loading Arm and Hose Selection
Loading arms and hoses must match ammonia phase, pressure, temperature, and motion requirements.
For loading arms, confirm compatibility of seals, bearings, and actuators with ammonia exposure and the required pressure rating. For hoses, verify burst pressure, working pressure, bend radius, and end fitting standards. Use strain relief and proper clamping so that loads do not transfer into the hose end connections.
Example: a hose rated for the correct pressure but with an end fitting that does not match the terminal coupling standard can force field modifications. Those modifications are where leak paths and misalignment risks tend to appear.
Hydraulic Design and Pressure Drop Budgeting
Compute pressure drop for the full operating range, including friction losses and local losses from valves, elbows, strainers, and meters. Include the effect of viscosity and density at the expected ammonia temperature and composition.
Pressure drop budgeting should be explicit. A simple worksheet approach works well:
- Required delivery pressure at ship manifold
- Terminal pump discharge pressure
- Subtract static head and elevation differences
- Subtract friction and local losses
- Subtract control valve losses at expected valve positions
If the remaining margin is small, increase line diameter, reduce restrictions, or adjust control valve sizing. Do not rely on “it will probably be fine” margins; ammonia systems punish optimism.
Materials Compatibility and Surface Finish
Ammonia service requires careful material selection. Choose materials compatible with ammonia and any expected impurities such as water, oxygen, or sulfur compounds. Pay attention to elastomers, gaskets, and coatings; compatibility is not universal across all polymers.
Surface finish matters for sealing. Rough surfaces can prevent reliable sealing under repeated make-and-break operations. For example, a gasket that seals well on a clean flange may leak after a few cycles if the flange face is not maintained.
Valves, Meters, and Control Elements
A transfer line typically includes:
- Isolation valves at terminal and ship connection points
- Emergency shutdown valves and remote actuators
- Check valves to prevent backflow
- Strainers or filters upstream of meters and sensitive components
- Flow meters and temperature/pressure instruments
- Pressure control or regulating valves where needed
Design the control philosophy so that the line responds predictably to operator commands and interlocks. For instance, if the system uses a pressure-regulating valve, ensure the valve authority is sufficient across the expected flow range; otherwise, the line may oscillate between “too much” and “not enough” pressure.
Connection Design and Leak Prevention
Connections must support repeated coupling cycles and withstand mechanical loads from hose movement. Use standardized couplings, correct gasket seating procedures, and alignment aids where appropriate.
A useful operational practice is to define coupling checks in the procedure: verify gasket condition, confirm flange face cleanliness, and confirm that the coupling is fully engaged before opening valves. This turns a vague “make sure it’s connected” into a repeatable checklist.
Instrumentation Placement and Functional Testing
Place instruments where they reflect the actual conditions that matter for control and safety: pressure near the ship manifold, temperature near the transfer line, and flow measurement where it is not affected by upstream turbulence.
Functional testing should include:
- Valve stroke and response time checks
- Interlock logic verification
- Meter calibration verification
- Leak detection system checks
Example: if pressure transmitters are installed too far upstream, the control system may think pressure is adequate while the ship manifold is actually under-supplied due to downstream restrictions.
Mind Map: Transfer Line Design for Loading Arms and Hoses
Integrated Example Workflow
- Set delivery pressure at the ship manifold and compute allowable pressure drop.
- Select hose or arm ratings and end fittings that match the coupling standards.
- Route the line to minimize bends and avoid low points.
- Size the line and restrictions using a pressure drop budget across the full flow range.
- Choose compatible materials for seals, gaskets, and wetted parts.
- Place instruments to measure the conditions used by control and interlocks.
- Commission with valve response tests, meter checks, and coupling leak-prevention procedures.
This sequence prevents the common failure mode: designing hydraulics first, then discovering that the chosen seals, fittings, or instrumentation placement cannot support the required operating behavior.
4.4 Bunkering Operations Planning Including Pre Transfer Checks
Bunkering an ammonia-fuelled vessel is mostly planning plus discipline. The goal of pre-transfer checks is simple: confirm that the right fuel is being transferred, the right equipment is connected, and the safety barriers are in place before any significant flow starts.
Define the Transfer Envelope and Roles
Start by writing down the “transfer envelope” in plain terms: which tanks will be filled, which manifold/lines will be used, the target transfer rate, and the maximum allowable pressure/temperature ranges for the specific transfer method. Assign roles so no one person is both “deciding” and “doing.” For example, one person verifies permits and checklists, while another controls valves and monitors readings.
A practical habit: conduct a short pre-job briefing using the same sequence as the checklist. If the briefing order differs from the checklist order, errors tend to show up during execution.
Confirm Fuel Quality and Compatibility Before Connection
Before connecting hoses or arms, verify that the delivered ammonia meets the acceptance criteria for the vessel’s engine and storage system. Check batch identity, sampling method, and test results for key impurities such as water content and any contaminants that can affect corrosion or combustion stability.
Easy example: if the vessel’s fuel system has a water-management requirement, treat “water content within limit” as a hard gate. If results are pending, plan for a controlled hold point rather than “starting and hoping.”
Verify Terminal and Vessel Readiness
Pre-transfer checks should cover both sides of the interface.
Terminal readiness typically includes:
- Transfer equipment inspection (loading arm/hoses, couplings, gaskets, strainers)
- Metering system calibration status
- Pressure relief devices inspection status
- Emergency shutdown system functional test status
Vessel readiness typically includes:
- Tank pressure/temperature within allowable operating window
- Venting system availability and correct routing
- Fuel supply line configuration matching the intended tank
- Filters/strainers installed and in correct condition
A useful cross-check: confirm that the vessel’s intended receiving tank and the terminal’s intended sending line match the same line diagram. If the diagrams differ, stop and reconcile.
Perform Interface Checks and Establish Safe Flow Conditions
Before opening any valves for transfer, verify the physical and control interface:
- Correct connection type and orientation
- Correct electrical bonding/earthing where required
- Correct communication channel between terminal and vessel control rooms
- Correct setpoints for alarms and interlocks
Then establish safe flow conditions by confirming that:
- The receiving tank is prepared for the expected vapor handling
- Any required pre-cooling or pre-pressurization steps are completed (as applicable to the system design)
- The transfer line is in the correct state for ammonia service
Easy example: if the plan calls for a staged ramp-up in flow rate, ensure the control system is configured for that ramp. Starting at full rate can overwhelm vapor handling capacity even when the final steady-state would be acceptable.
Check Safety Barriers and Emergency Preparedness
Pre-transfer checks must confirm that safety barriers are active and testable.
Core items include:
- Gas detection system availability and correct alarm thresholds
- Ventilation status where required
- Exclusion zones established and access controlled
- Emergency shutdown logic verified for the specific transfer mode
- Spill/containment readiness, including drainage routing and recovery equipment
A practical approach: run a “what if” walk-through limited to the actual transfer scenario. For instance, if a leak is detected at the connection, confirm who initiates shutdown, what valves close, and how the system reaches a safe state.
Execute the Pre-Transfer Checklist in a Logical Sequence
Use a checklist order that mirrors the physical sequence of events.
Recommended sequence:
- Permits and roles confirmed
- Fuel batch identity and test results verified
- Equipment inspection completed
- Interface connections verified
- Instrumentation and interlocks confirmed
- Communication and control mode confirmed
- Safety systems verified
- Final readiness sign-off
- Start transfer with controlled ramp-up
Mind Map of Pre-Transfer Planning
Mind Map: Pre-Transfer Checks for Ammonia Bunkering
Mini Case Example: Preventing a Wrong-Tank Transfer
Assume the terminal operator intends to fill Tank A, while the vessel plan indicates Tank B. The pre-transfer checklist catches it at the “line diagram match” step: the receiving manifold tagging and the control system tank selection do not correspond to the same tank. The team pauses, reconciles the line diagram, and only then proceeds.
The lesson is operational, not theoretical: most serious transfer errors are not caused by missing safety equipment, but by mismatched assumptions about which tank and which line are actually connected.
Completion Criteria Before Starting Transfer
Starting transfer should be allowed only when all completion criteria are met: verified fuel batch, verified equipment condition, verified interface and control settings, verified safety barrier readiness, and a final sign-off that explicitly confirms readiness for the selected transfer mode.
4.5 Metering, Sampling, and Reconciliation for Bunkering Accountability
Bunkering accountability is the engineering practice of proving how much ammonia entered the ship, in what condition, and under which measurement assumptions. The goal is not just to satisfy paperwork; it is to prevent disputes caused by measurement gaps, inconsistent sampling, or untracked losses in hoses, lines, and manifolds.
Foundations of Measurement Logic
Start with a simple mass balance: Delivered mass = Metered mass − Measured line and hose residuals − Corrected losses +/− Quality adjustments. Each term must be either measured or justified by a controlled procedure.
A practical example: during a 1,000 kg delivery, the meter reports 1,012 kg. The operator then drains and measures hose residuals of 9 kg and confirms 3 kg of unavoidable vent/blowdown losses were captured by the terminal’s recovery system. The reconciliation becomes 1,012 − 9 − 3 = 1,000 kg. The numbers are boring; the discipline is what matters.
Metering Systems and Calibration Practices
Metering typically uses a flow meter with a totalizer, plus temperature and pressure inputs to support density correction. For ammonia, the key engineering detail is that mass depends on density, and density depends on temperature and pressure at the meter.
Best practices that keep the math honest:
- Calibration traceability: ensure the meter’s calibration certificate matches the meter serial number and the operating range. If the bunkering pressure is near the top of the calibrated range, treat it as a special case and document the uncertainty.
- Metering mode consistency: do not switch between volumetric and mass modes mid-transfer without a documented reason and a reconciliation method that matches the mode.
- Zeroing and start/stop discipline: define when the totalizer starts (after stabilization) and stops (after flow settles). A common failure mode is “start when the hose is connected” instead of “start when flow is stable.”
Sampling Plans That Match the Measurement Purpose
Sampling is not a generic “take a bottle” activity. It must match the purpose: acceptance testing, custody transfer, or operational conditioning.
A systematic sampling plan includes:
- Sampling points: choose locations that represent the delivered stream, typically downstream of conditioning and upstream of the ship connection.
- Sampling frequency: increase frequency during transients such as grade changes, pressure settling, or when the terminal reports composition variability.
- Composite vs grab samples: use composite sampling for steady deliveries; use grab samples for short events or when the terminal reports step changes.
- Chain of custody: label samples with unique IDs, record time stamps, and seal them so that later lab results can be traced to the exact transfer.
Easy example: if the terminal blends two batches, a single grab sample at the beginning can miss a later shift in water content. A composite sample over the full transfer window prevents that mismatch.
Reconciliation Methods and Uncertainty Handling
Reconciliation combines metered quantity, measured residuals, and quality-based corrections. Quality corrections are often driven by density changes due to impurities and water content.
A clean approach is to compute two reconciliations:
- Quantity reconciliation: based on meter totals and physical residual measurements.
- Quality reconciliation: based on lab results that affect density or acceptance criteria.
Then compare them. If the quantity reconciliation is tight but quality reconciliation is wide, the issue is likely sampling representativeness or lab variability. If both are wide, the issue is likely metering stability or unaccounted losses.
Uncertainty handling should be explicit. For instance, if hose residual measurement has a ±1 kg uncertainty and the meter has a ±0.5% uncertainty, the reconciliation tolerance should reflect both, not just the meter.
Mind Map: Metering, Sampling, and Reconciliation
Example Workflow for a Single Transfer
- Pre-transfer: confirm meter calibration status, verify temperature/pressure sensors are within tolerance, and agree on sampling method and composite window.
- During transfer: record meter totals continuously, log any flow interruptions, and collect samples according to the plan.
- Post-transfer: drain and measure hose/line residuals using the agreed procedure, document any vent/blowdown losses captured by recovery.
- Reconciliation: compute delivered mass from meter totals and residuals, then apply quality-based corrections using lab results tied to the sample IDs.
- Sign-off: produce a transfer report that includes the evidence pack: meter logs, sampling IDs, residual measurements, and the reconciliation calculation.
A good test of the system is whether a third party can reproduce the delivered mass from the records without guessing missing steps. If they can, the accountability is real, not just declared.
5. Ammonia Shipboard Fuel Storage and Transfer Systems
5.1 Tank Arrangements and Integration With Vessel Structure
Tank arrangement is where “fuel system engineering” becomes “ship structure engineering.” The goal is simple: keep ammonia where it belongs, move it safely to the transfer system, and ensure the vessel structure can handle loads, thermal effects, and maintenance access without turning routine work into a scavenger hunt.
Foundational Principles for Layout
Start with three constraints that drive nearly every decision.
-
Containment and segregation: Place tanks so that any credible release is contained by the design boundaries and does not directly threaten machinery spaces, accommodation, or escape routes. A practical approach is to treat the tank space like a controlled zone with clear separation distances and dedicated ventilation.
-
Fuel transfer efficiency: Arrange the tank outlet and vapor return lines to minimize long runs through hazardous boundaries. Short, direct piping reduces pressure losses and makes commissioning checks easier.
-
Structural load paths: Tanks impose bending, shear, and local stresses. The structure must provide a predictable load path from tank supports to the hull girder and frames, with reinforcement where needed.
A useful mental model is to sketch the vessel cross-section and draw three “lanes”: tank containment boundaries, piping routes, and access/maintenance corridors. If these lanes overlap, expect rework.
Common Tank Arrangement Patterns
Most ammonia fuel installations use one of these patterns, often combined.
-
Single tank in a dedicated compartment: Simplifies piping and isolation. Maintenance access is straightforward, but the compartment must be engineered for full containment and ventilation.
-
Multiple tanks distributed along the length: Improves trim and reduces single-point structural demands. It complicates manifold design and requires careful reconciliation of tank-to-tank transfer and sampling.
-
Integrated tank and cofferdam concepts: Adds a buffer space around the tank. This can improve segregation from adjacent spaces, but it increases volume to ventilate and inspect.
Example: If a vessel has limited deck space, two smaller tanks on either side of a central service corridor can keep piping runs short while maintaining separation from machinery spaces.
Structural Integration Details That Matter
Tank integration is not just “where the tank sits.” It includes how the tank is supported, how loads are transferred, and how the hull behaves during operations.
-
Support design and settlement control: Tank supports must accommodate thermal expansion and prevent stress concentrations. Engineers typically define allowable settlement and ensure the support geometry does not create unintended bending moments.
-
Thermal effects and insulation interfaces: Even when ammonia is not cryogenic, temperature changes during transfer and operational cycles can still affect clearances and gasket performance. Specify insulation thickness tolerances and define inspection points for insulation integrity.
-
Corrosion allowance and material pairing: Ammonia service can be tough on materials depending on water content and impurities. Structural steel in contact with adjacent spaces may need coatings, while tank and piping materials must be selected for ammonia compatibility.
-
Local reinforcement and fatigue considerations: Tank supports and penetrations can create fatigue hotspots. Reinforcement plates, bracket design, and weld details should be consistent with the vessel’s fatigue assessment approach.
Piping Penetrations and Boundary Integrity
Penetrations through tank boundaries are where leaks become real problems. Treat them as engineered assemblies, not “holes with flanges.”
-
Penetration location: Keep penetrations away from high-stress structural zones when possible. If unavoidable, increase reinforcement and define inspection access.
-
Double barrier where required: For critical lines, consider a secondary containment concept such as a drip tray or monitored annulus, depending on the overall safety philosophy.
-
Isolation strategy: Provide valves and quick isolation points near the tank boundary so that a leak in downstream piping does not force the entire tank to be treated as “at risk.”
Example: A tank outlet line can include a boundary isolation valve plus a downstream block valve. During maintenance, you can isolate the tank without relying on long downstream sections to remain leak-tight.
Ventilation, Gas Containment, and Access
Tank arrangement must support ventilation and safe access for inspection.
-
Ventilation zoning: Define ventilation supply and exhaust locations so that any released gas is directed away from ignition sources and toward monitored exhaust points.
-
Drainage and spill management: Even with good containment, design for condensate and minor releases. Provide drainage paths that do not spread liquid to escape routes.
-
Maintenance access: Ensure you can reach strainers, sampling points, and instrumentation without removing major structural elements. If a component requires “special tools and a contortionist,” it will eventually be skipped.
Mind Map: Tank Arrangement Integration
Worked Example: Choosing Between Two Layouts
Consider a vessel with limited deck space and a requirement to keep ammonia away from machinery spaces.
-
Layout A places one large tank near the centerline with a dedicated compartment. Piping to the engine room is direct, but the compartment must handle full inventory isolation and requires robust ventilation capacity.
-
Layout B uses two smaller tanks port and starboard with a central service corridor. Transfer piping can be kept short to a common manifold, and maintenance access is improved because components can be reached from the corridor. Structural reinforcement is spread across more frames, reducing local load concentration.
If the vessel’s structural design already has strong central reinforcement, Layout A can be simpler. If access and inspection are constrained by other systems, Layout B often reduces operational friction.
The “best” arrangement is the one that keeps containment boundaries, load paths, and maintenance access aligned. When those three agree, the rest of the design tends to behave.
5.2 Vapor Management and Pressure Control Strategies
Ammonia fuel systems live and die by how they handle vapor. Even when the tank is “full,” the system must manage boil-off, pressure rise, and vapor quality so the engine receives fuel at stable conditions. The goal is simple: keep pressure within design limits, prevent liquid carryover into vapor lines, and ensure transfer lines deliver the right phase at the right time.
Foundational Concepts for Vapor and Pressure
Ammonia in a tank exists as a liquid with a vapor space above it. As temperature increases, more liquid flashes into vapor, raising tank pressure. As temperature decreases, vapor condenses back to liquid, lowering pressure. This means pressure control is fundamentally a temperature and phase-control problem, not just a valve problem.
A practical engineering way to think about it is to separate three tasks:
- Maintain tank pressure within allowable bounds using controlled venting, reliquefaction, or pressure regulation.
- Manage vapor composition and entrainment so vapor leaving the tank is not contaminated with liquid droplets.
- Protect transfer and engine supply from unstable phase behavior during transients like start-up, load changes, and bunkering.
Tank Vapor Space Design and Entrainment Control
Vapor lines are vulnerable to liquid carryover because vapor velocity can drag droplets from the liquid surface. Engineers reduce this with internal separation devices and by controlling operating conditions.
Common strategies include:
- Demister or vane separators in the vapor outlet to capture droplets.
- Sufficient vapor space volume to reduce the fraction of flashing during short disturbances.
- Outlet elevation and geometry so the vapor takeoff is not directly above the most turbulent region.
Easy example: if a tank is filled quickly during bunkering, the liquid surface can surge. Without a demister, the first vapor leaving the tank may contain droplets, which can later flash in downstream piping and cause pressure oscillations. With a demister, the vapor path stays “dry,” and the pressure control loop behaves predictably.
Pressure Control Methods and When They Fit
Pressure control options depend on whether the system can tolerate venting and whether it can return condensed vapor to the tank.
- Pressure relief and controlled venting: Used when the design basis allows venting to a safe system. The vent path must be sized for credible worst-case scenarios and routed to a location where dispersion is safe.
- Pressure regulation with back-pressure control: Used to keep downstream equipment within limits. This is often paired with a stable vapor supply strategy.
- Reliquefaction or condensation: Used when venting is undesirable. Condensed vapor returns to the liquid phase, reducing net losses.
Easy example: during a hot day, tank temperature rises. If the system relies only on relief valves, pressure may repeatedly approach setpoints, leading to frequent vent events. If reliquefaction is available, the same temperature rise can be absorbed by condensation, keeping pressure steady and reducing operational interruptions.
Vapor Line Conditioning and Phase Assurance
Even with good tank separation, vapor lines can experience phase changes due to pressure drops and heat transfer. Phase assurance is achieved by controlling pressure, insulation, and line routing.
Key practices:
- Minimize unnecessary pressure drops in vapor lines so flashing is less likely.
- Insulate vapor lines to reduce heat gain that would increase vapor generation.
- Use phase separators or knock-out pots where design permits, to remove any entrained liquid before vapor reaches sensitive equipment.
- Maintain stable line temperatures during transitions by using controlled operating sequences.
Easy example: a vapor line that runs through a warm compartment can pick up heat, increasing vapor generation and raising flow rate into the engine supply system. Insulation reduces this coupling, so the pressure control loop responds to tank conditions rather than ambient swings.
Control Loop Strategy for Stable Operation
Pressure control is typically implemented with interlocks and a supervisory loop that coordinates valves and pumps. A robust strategy avoids “fighting” between loops.
A systematic approach:
- Primary objective: keep tank pressure within limits using a dedicated pressure controller.
- Secondary objective: keep vapor quality acceptable by monitoring differential pressure and using demister performance assumptions.
- Transient handling: during start-up or bunkering, switch to a sequence that prioritizes phase stability over tight pressure regulation.
Example: during engine start, the fuel demand may change quickly. If the pressure controller tries to hold tank pressure perfectly while the system is simultaneously drawing vapor and liquid, it can create oscillations. A staged sequence can first stabilize phase delivery, then tighten pressure control once flow conditions settle.
Mind Map: Vapor Management and Pressure Control
Worked Example for a Typical Operating Scenario
Consider a vessel with a pressurized ammonia tank feeding an engine via a vapor-to-liquid supply arrangement. During bunkering, the tank temperature rises slightly and the vapor space experiences increased turbulence. The demister reduces droplet carryover, so the vapor outlet remains mostly dry. The pressure controller monitors tank pressure and opens a regulated vent valve only when approaching the upper limit, rather than waiting for a relief setpoint. After bunkering stops, the system transitions to a steady operating sequence that reduces vapor draw rate, allowing pressure to settle without repeated venting. The result is stable engine supply conditions and fewer pressure excursions, with safety functions still available if the unexpected happens.
Practical Checklist for Engineering Review
- Vapor outlet includes droplet separation and appropriate geometry.
- Vapor line insulation and routing reduce unwanted heat transfer.
- Pressure control strategy defines normal regulation versus emergency relief.
- Transient operating sequences prevent phase oscillations during start-up and bunkering.
- Interlocks coordinate with the pressure loop to avoid conflicting actions.
5.3 Transfer Pumps, Valves, and Actuation for Cryogenic and Pressurized Service
Transfer hardware for ammonia must do three jobs at once: move fluid reliably, keep leakage within limits, and behave predictably when conditions drift. The engineering approach starts with the service type—pressurized liquid, pressurized vapor, or two-phase transfer—then selects pump and valve technologies that match the phase, temperature, and allowable pressure drop.
Foundational Concepts for Selecting Transfer Hardware
Phase and Service Mode
For pressurized liquid transfer, the pump must tolerate flashing at suction if the line warms or the pressure drops. For vapor transfer, the main concerns shift to compressor-like behavior, noise, and stable control of flow without hunting. For two-phase transfer, the design must prevent vapor locking and avoid cavitation-like damage mechanisms that occur when vapor fraction spikes.
Temperature and Material Behavior
Cold service changes clearances, elastomer hardness, and metal toughness. A practical rule is to treat every seal and actuator as a temperature-rated component, not as a generic “fits ammonia” part. Engineers typically verify that materials selected for wetted parts maintain strength and corrosion resistance at the lowest expected metal temperature.
Pressure Drop Budget
Transfer systems often fail quietly because the pump is sized for ideal conditions but the real system has extra losses: strainers, filters, elbows, instrumentation impulse lines, and valve throttling. A good design builds a pressure-drop budget early so the pump can maintain required net positive suction conditions across operating points.
Pump Selection and Integration
Pump Types and Where They Fit
- Centrifugal pumps are common for pressurized liquid transfer when suction conditions are stable. They dislike low NPSH margins and can suffer performance loss if flashing occurs.
- Positive displacement pumps can handle variable flow demands more directly, but they require careful relief protection and can stress piping if the discharge is blocked.
- Submerged or close-coupled arrangements reduce suction line length and help NPSH, but they complicate maintenance access.
NPSH and Flashing Control
To keep suction stable, designers manage suction pressure using tank pressure control, minimize suction line heat gain, and avoid unnecessary restrictions. A simple example: if a transfer line includes a strainer with a high initial pressure drop, the pump may start fine but later trip on low suction pressure as the strainer loads.
Pump Protection and Trip Logic
Protection is not just “trip on fault.” It includes:
- Low suction pressure trip to prevent flashing damage.
- High discharge pressure relief to protect against blocked discharge.
- Dry-run or low-flow detection where applicable.
- Vibration and bearing temperature monitoring for early warning.
Valve Selection and Actuation for Cryogenic and Pressurized Service
Valve Functions in a Transfer System
A transfer skid typically needs:
- Isolation valves at tank and manifold boundaries.
- Control valves for flow regulation.
- Check valves to prevent backflow during shutdown.
- Relief and vent valves to manage pressure excursions.
Common Valve Types and Practical Tradeoffs
- Ball valves provide tight shutoff and fast actuation, but seat materials must be compatible with temperature and any contaminants.
- Globe or plug valves can offer good throttling characteristics for control, but they may be more sensitive to cavitation and flashing in the throttling region.
- Butterfly valves are compact, yet their sealing performance depends strongly on seat design and operating temperature.
- Diaphragm or bellows-sealed valves reduce leakage risk where packing would be unacceptable.
Seat Leakage and Contamination Tolerance
Ammonia systems can carry trace water or particulates from upstream equipment. A control valve that works during commissioning may stick later if the trim is too fine. Engineers often specify filtration upstream of control valves and choose trim materials that resist corrosion and maintain geometry at low temperature.
Actuation Strategy and Fail-Safe Behavior
Actuator Energy and Control
Actuation can be pneumatic, hydraulic, or electric. The key is to match actuator response time to the safety function. For example, isolation valves used in emergency shutdown typically require a defined stroke time and a known fail position.
Fail-Safe Design
A robust design defines what “safe” means for each valve:
- Emergency isolation valves usually fail closed or to a predetermined safe position.
- Control valves may fail to a conservative flow limit rather than fully closed if that avoids pressure surges.
Position Feedback and Interlocks
Position switches or transmitters confirm valve state, and interlocks prevent unsafe sequences. A typical interlock prevents pump start unless upstream isolation valves are confirmed open and the downstream path is established.
Mind Map: Transfer Pumps, Valves, and Actuation
Example: Designing a Transfer Line Start Sequence
A common commissioning issue is a pump that starts but cannot maintain flow. One practical sequence is:
- Confirm tank pressure is within the transfer window.
- Verify upstream isolation valves are open and downstream path is established.
- Start pump with a controlled ramp to avoid sudden suction pressure drop.
- Use the control valve to hold target flow while monitoring suction pressure and discharge pressure.
- If suction pressure falls below the minimum margin, the system trips and closes isolation valves to prevent flashing damage.
This sequence ties hardware behavior to measurable signals, so the system fails in a controlled way rather than “mysteriously.”
Diagram: Component Interaction During Transfer
    flowchart TD
  A[Start Command] --> B[Check Interlocks]
  B --> C{Isolation Valves Confirmed Open?}
  C -- No --> Z[Do Not Start Pump]
  C -- Yes --> D[Start Pump]
  D --> E[Control Valve Modulates Flow]
  E --> F[Monitor Suction Pressure]
  F --> G{Below NPSH Margin?}
  G -- Yes --> H[Trip Pump]
  H --> I[Close Emergency Isolation]
  G -- No --> J[Maintain Transfer Steady State]
Engineering Checks That Prevent Field Surprises
Before commissioning, engineers typically verify valve stroke timing at temperature, confirm actuator fail positions under loss of control energy, and test leak tightness for isolation valves. They also validate that the pump curve and system pressure-drop curve intersect within the required operating range, not just at one convenient point.
5.4 Filtration, Strainers, and Water Management in Fuel Supply Lines
Ammonia fuel systems are unforgiving about water. Not because water is evil, but because it changes phase behavior, promotes corrosion, and can carry dissolved contaminants into parts of the system that hate surprises. Filtration and straining are therefore not “nice-to-have cleanliness steps”; they are part of the fuel delivery safety function.
Foundational Concepts for Clean Fuel Delivery
Start with what you are trying to prevent. In ammonia service, the main practical issues are:
- Particulate solids from production, conditioning, tank residues, and line scale.
- Liquid water that can accumulate in low points, settle in quiet zones, or enter during transfer.
- Emulsions or wetting films that behave like “invisible solids” by plugging small passages.
A useful engineering mindset is to treat the fuel line as a chain of protection layers. Each layer has a target particle size, a location where it is most effective, and a maintenance plan so it does not become the next blockage.
Filtration and Straining Strategy by System Location
Use a layered approach, typically in this order of increasing “fineness”:
- Strainers at the tank outlet or suction to protect pumps and downstream valves.
- Filters before sensitive components such as regulators, injectors, or metering devices.
- Water management steps that prevent liquid water from reaching those sensitive components.
A simple example: if a transfer line has a low point where water can collect, placing only a fine filter downstream may lead to repeated filter plugging. Better practice is to combine a strainer upstream with a water removal method at the low point or at a dedicated drain/knockout location.
Strainer Design and Sizing Practices
Strainers are coarse by design and should be sized for both flow and maintainability.
- Mesh or perforation selection: Choose a nominal opening that blocks expected solids without creating excessive pressure drop.
- Pressure drop budgeting: Plan for the clean and partially loaded states. If the system cannot tolerate a higher differential pressure, you will end up with nuisance trips.
- Bypass or isolation: Ensure you can isolate and inspect a strainer without draining the entire line.
Example: A fuel supply line feeding a pump at steady load might be designed for a 0.2 bar clean differential pressure across a strainer. If commissioning shows it reaches 0.6 bar quickly, the issue is usually upstream contamination or water-driven wetting, not “mysterious filter aging.”
Filter Selection for Ammonia Service
Filters provide finer particle control than strainers, but they are more sensitive to water and to differential pressure.
- Media compatibility: Select materials that tolerate ammonia exposure and cleaning methods.
- Collapse and wetting behavior: If the filter media can trap water and then release it intermittently, you may see unstable pressure drop.
- Differential pressure monitoring: Install sensors across filters so operators can act before a restriction becomes a fuel starvation event.
Example: If a filter differential pressure rises during bunkering, it often indicates that the filter is catching “batch-specific” solids. The operational response should be to stop, verify water control, and inspect the upstream strainer rather than simply swapping the filter and continuing.
Water Management Methods in Supply Lines
Water management is about controlling where liquid water can exist and how it is removed.
Key practices:
- Low-point drainage: Provide drain points at predictable low locations so water can be removed without dismantling equipment.
- Knockout and separation: Use a dedicated separation stage where liquid water can disengage from the vapor or flow stream.
- Avoiding dead legs: Dead legs trap condensate and become long-term contamination reservoirs.
- Insulation and heat tracing where required: Keep temperature conditions consistent enough to reduce condensation in unintended places.
Example: During a line fill, a short section of piping that is slightly cooler than the rest can condense water. If that section has no drain, the water will travel until it hits a low point or a filter, where it causes plugging.
Integrated Protection Logic for Operations
Filtration and water management should be reflected in operating procedures and alarms.
- Start-up checks: Confirm drains are closed, differential pressure sensors are functional, and any separation vessels are in the correct state.
- Bunkering discipline: Use pre-transfer checks and post-transfer reconciliation so you can correlate filter loading with specific transfer events.
- Maintenance triggers: Define actions based on differential pressure trends and inspection findings, not only on absolute values.
A practical rule: if differential pressure increases faster than expected, treat it as a system condition change, not a routine filter replacement.
Mind Map: Filtration and Water Management in Fuel Supply Lines
Example Walkthrough from Commissioning to Steady Operation
- Commissioning baseline: Measure clean differential pressure across the strainer and filter at the design flow.
- Introduce a controlled contamination check: Verify that the upstream strainer catches solids without pushing excessive pressure drop downstream.
- Validate water removal: Run a procedure that includes draining low points and confirming separation performance.
- Steady-state monitoring: Track differential pressure trends during normal operation and compare them to the baseline.
If the filter differential pressure rises while the strainer differential pressure stays stable, the likely cause is water wetting or localized condensation downstream of the strainer. If both rise together, the likely cause is solids loading from the incoming batch or incomplete upstream conditioning.
Practical Acceptance Criteria for Design and Handover
A complete handover package should include:
- Strainer and filter locations with sizing rationale.
- Differential pressure sensor setpoints and alarm actions.
- Drain and separation equipment identification with operating steps.
- Inspection and cleaning procedures that match the actual maintenance access.
When these are clear, the system behaves like a well-organized workshop: each component knows its job, and operators know what to check when the numbers start moving.
5.5 Instrumentation and Control Loops for Safe Fuel Delivery
Safe fuel delivery for ammonia depends on two things working together: measurements that actually reflect the process, and control logic that reacts predictably when something is off. This section builds from the basics of sensing and loop behavior to the practical details of interlocks, tuning, and commissioning.
Foundations of Instrumentation for Ammonia Service
Start with what you measure and why. For ammonia transfer and supply, the core variables are pressure, temperature, level, flow, and composition indicators where available.
- Pressure confirms containment integrity and prevents overpressure in tanks, headers, and transfer lines.
- Temperature supports phase awareness and helps avoid conditions that increase vapor fraction or cause unstable delivery.
- Level prevents pump cavitation and avoids drawing from vapor space.
- Flow enables mass balance and detects stuck valves or failed pumps.
- Water and impurity indicators matter because water can destabilize downstream operation and impurities can foul filters or affect combustion system behavior.
A practical example: during bunkering, a rising tank pressure with steady valve position often indicates a transfer line restriction or vapor management mismatch. Without pressure trending, the operator sees only “delivery rate is low,” which is less actionable.
Control Loop Architecture for Delivery Stability
Most safe fuel delivery systems use layered control:
- Continuous control loops keep delivery stable under normal operation.
- Supervisory logic coordinates setpoints across pumps, valves, and vapor handling.
- Safety instrumented functions force a safe state when defined hazards occur.
A typical continuous loop setpoint chain is: desired mass flow → valve position or pump speed command → feedback from flow transmitter → correction based on measured pressure drop and temperature.
When tuning, remember that ammonia systems often have compressible behavior and phase changes. That means you should expect slower dynamics and avoid aggressive controller gains that can cause oscillation between vapor and liquid fractions.
Interlocks and Safety Instrumented Functions
Interlocks are not “extra buttons”; they are deterministic rules tied to specific hazards. Define them using clear cause-and-effect pairs.
Common safety instrumented functions for safe delivery include:
- High-high pressure trip for tank and transfer header.
- Low-low level trip to protect pumps and prevent vapor ingestion.
- Flow mismatch trip when commanded flow does not match measured flow beyond a tolerance window.
- Loss of essential utilities trip, such as loss of power to critical valves or loss of instrument air.
- Gas detection trip in ammonia handling areas that triggers shutdown and ventilation actions.
Example: if the system commands pump start but flow does not rise within a defined time, a flow mismatch trip can stop the pump and close the upstream isolation valve. This prevents dead-heading and reduces the chance of line overpressure.
Signal Quality and Fail-Safe Design
Instrumentation must fail safely. That means:
- Use diagnostic-capable transmitters where possible, so the control system can distinguish “real zero” from “sensor failed.”
- Apply plausibility checks such as pressure-temperature consistency and rate-of-change limits.
- Choose fail positions for valves that align with safety objectives, typically closing to isolate fuel and opening only where that supports safe blowdown or venting.
A concrete practice: if a flow transmitter signal becomes invalid, the controller should not keep integrating error. Instead, it should transition to a controlled stop sequence using the last known safe state and alarms that prompt operator review.
Mind Map: Instrumentation and Control Loops
Example Control Sequence for Bunkering
Consider a bunkering operation with a target mass flow. The sequence can be:
- Pre-transfer checks: confirm gas detection system healthy, verify ventilation status, and check that tank level is within the liquid draw range.
- Establish flow: open transfer valves to a ramped position while the flow controller drives toward the setpoint.
- Stabilize delivery: maintain mass flow while supervising tank pressure and line temperature to keep phase behavior stable.
- Monitor reconciliation: compare delivered mass against expected transfer based on flow and time; trigger an alarm if deviation exceeds tolerance.
- Stop sequence: close valves in a controlled manner, then perform a defined safe depressurization or purge step consistent with the system design.
If any safety instrumented function triggers—say, low-low level—the logic should immediately isolate fuel and move to a safe state, while logging the exact measured values that led to the trip.
Commissioning and Verification of Loops
Commissioning should verify both control performance and safety behavior.
- Loop checks: confirm correct direction of action (increasing valve command increases flow), stable tracking, and acceptable overshoot.
- Alarm checks: verify thresholds and ensure alarms are actionable, not just noisy.
- Trip tests: validate that each safety instrumented function actuates the correct outputs and that reset behavior matches the intended procedure.
A useful verification practice: record a short “normal ramp” test and a “forced trip” test. Comparing them shows whether the system transitions from continuous control to safe shutdown without leaving valves in ambiguous positions.
6. Ammonia Combustion Engine Systems and Fuel Injection Engineering
6.1 Engine Cycle Selection and System Layout for Ammonia Operation
Choosing an engine cycle for ammonia is mostly about matching three things: how ammonia is delivered to the cylinder, how ignition is achieved reliably, and how the exhaust system can handle the chemistry that follows. A good layout starts with the cycle decision, then flows into fuel system architecture, control strategy, and finally the practical interfaces that make commissioning work.
Foundational Constraints That Drive Cycle Choice
Ammonia has a high autoignition resistance compared with many conventional fuels, so ignition support is not optional—it is part of the design. That immediately affects the cycle choice because some cycles tolerate ignition delay and mixing differences better than others.
Second, ammonia’s fuel delivery method matters. If you use a pressurized fuel system with liquid-to-vapor control, your cycle must accommodate stable vaporization and consistent injection timing. If you use a gaseous path, your cycle must handle mixture formation without creating large cylinder-to-cylinder variability.
Third, emissions control is coupled to the cycle. Ammonia combustion tends to produce nitrogen oxides and can leave unburned ammonia if mixing and combustion completeness are not managed. Your cycle and layout must therefore support repeatable combustion phasing and predictable exhaust conditions.
Cycle Options and What They Imply for Layout
Spark-ignited ammonia with ignition support is often the simplest to reason about: you form a mixture and ignite it. The layout typically includes an ignition assist fuel or system, plus careful control of mixture strength to avoid misfires. The fuel system must deliver consistent ammonia mass flow, because spark timing alone cannot compensate for large fuel variability.
Compression-ignited ammonia with pilot assistance treats ammonia as the main fuel but uses a pilot to start combustion. This pushes the layout toward precise pilot injection timing, robust cylinder pressure monitoring, and a fuel system that can deliver ammonia at the required injection conditions without water carryover.
Dual-fuel arrangements split the roles: one fuel supports ignition and stability, while ammonia provides the bulk energy. The layout becomes more complex because you now have two fuel systems and two sets of safety boundaries, but it can reduce ignition risk during load transitions.
A practical rule: if your operating profile includes frequent load changes, prioritize cycles and layouts that keep ignition support stable across the full range. If your profile is steady, you can trade some flexibility for simpler control.
System Layout from Cylinder to Fuel Supply
A complete ammonia engine layout is easiest to understand as five linked subsystems.
-
Cylinder and combustion control: injection timing, ignition support strategy, and combustion monitoring. You need sensors that can detect misfire or abnormal combustion early enough for the control system to react.
-
Fuel injection and metering: valves, pumps or regulators, filters, and injection control. Metering accuracy is not just for efficiency; it prevents unstable combustion and protects aftertreatment.
-
Fuel conditioning and transfer: vaporization or pressurization, water management, and line purging. Water is a recurring practical issue because it can cause injection instability and corrosion.
-
Safety and containment boundaries: leak detection, ventilation zoning, emergency shutdown logic, and blowdown routing. These are not “extra”; they shape where components can be placed.
-
Exhaust and emissions interface: temperature management, backpressure limits, and how exhaust conditions influence catalyst performance and ammonia slip.
Integrated Mind Map
Mind Map: Engine Cycle Selection and System Layout for Ammonia Operation
Example: Selecting a Cycle for a Load-Changing Route
Assume a vessel spends part of the day at low load and then ramps up for several hours. If you choose a compression-ignited ammonia approach with pilot assistance, your layout should emphasize:
- Pilot injection control that maintains consistent pilot energy across the ramp. A simple way to implement this is to tie pilot timing and quantity to measured cylinder conditions rather than only to commanded load.
- Fuel metering stability using upstream pressure regulation and filtration sized to prevent transient flow disturbances.
- Combustion monitoring that detects abnormal pressure rise rate and triggers a controlled fallback mode, such as reducing ammonia fraction while maintaining pilot support.
If instead you choose a spark-ignited approach, the layout must prioritize:
- Mixture strength control so that spark energy and ignition timing remain effective as ammonia mass flow changes.
- Ignition assist reliability so misfires do not cascade into aftertreatment ammonia slip.
In both cases, the “best” cycle is the one whose ignition support and fuel metering remain predictable during transients.
Example: System Layout Checklist for Commissioning Readiness
Before any sea trials, verify these layout-linked items:
- Fuel conditioning performance: confirm stable vaporization or pressurization under the expected ambient range.
- Water management: demonstrate that drains and separators remove water without introducing air or blocking.
- Injection repeatability: check that commanded injection quantities match measured mass flow across the operating envelope.
- Safety interlocks: test that gas detection and emergency shutdown actions move the system to a safe state without creating new hazards.
- Exhaust protection: ensure exhaust temperatures and backpressure stay within limits that protect aftertreatment.
A cycle decision is only as good as the layout that makes it behave. When the fuel system, ignition support, and exhaust interface are designed as one system, the engine stops being a collection of parts and starts behaving like a controlled process.
6.2 Fuel Injection System Design for Spray Formation and Mixing
Foundational Goals for Ammonia Injection
Ammonia injection design starts with two practical goals: deliver the right mass of fuel to the right place in the cylinder at the right time, and keep the mixture conditions stable enough for combustion control. Because ammonia has different physical behavior than typical liquid fuels, the injection system must manage phase state, vapor formation, and mixing quality rather than only “atomization.” A useful way to set targets is to define three measurable outcomes: (1) injected mass per cycle, (2) spray penetration and distribution at a reference crank angle, and (3) mixture uniformity near the ignition region.
A simple example: if the engine control requests a 30% load step, the injection system must change injected mass while also maintaining comparable mixing conditions. If the spray becomes too short, the ignition zone may be fuel-rich; too long, and the local mixture can become lean or overly stratified.
Phase State and Injection Mode Selection
Ammonia can be supplied as pressurized liquid or vapor depending on system architecture and operating conditions. Injection mode selection determines whether the injector primarily performs “spray breakup” (liquid jet disintegration) or “vapor jet shaping” (controlling how quickly the fuel flashes and spreads). For liquid injection, the key variables are injection pressure, nozzle geometry, and ambient cylinder conditions that drive flashing. For vapor injection, the emphasis shifts to flow regulation and jet momentum.
Engineering best practice is to map expected cylinder pressure and temperature versus crank angle, then overlay the ammonia saturation behavior to identify where flashing is likely. This prevents designing a nozzle that looks good on a bench but produces a different spray pattern once the cylinder environment takes over.
Nozzle Geometry and Spray Formation Mechanisms
Nozzle design shapes the initial jet and the subsequent breakup. Common geometry choices include multi-hole nozzles for distribution and single-hole nozzles for penetration control. Hole diameter and length-to-diameter ratio influence discharge coefficient and jet coherence. In ammonia service, material and surface finish also matter because deposits or corrosion products can alter effective flow area.
A concrete example: two injectors with the same nominal flow rate can behave differently if one has a slightly larger effective area due to wear or manufacturing tolerance. In a direct-injection system, that difference can shift the timing window where the ignition-support fuel can successfully light the mixture.
Injection Timing and Rate Shaping
Timing is not just “start of injection.” Rate shaping controls how quickly the fuel mass enters the cylinder, which affects local equivalence ratio around the ignition region. Many systems use a controlled ramp rather than a step, because a step can create strong stratification: a rich pocket near the jet core and a lean shell around it.
A practical method is to define a target mass-flow profile and then verify it against injector dynamics. Injector delay, needle motion, and pressure wave effects in the fuel rail can cause the real delivered profile to lag the command. The best practice is to measure or estimate these dynamics and compensate in the engine control calibration.
Mixing Quality and Ignition Region Strategy
Mixing quality depends on both physical dispersion and chemical readiness. For ammonia, the mixture can be sensitive to local equivalence ratio and to how well the fuel vapor is distributed before ignition. The injection system must therefore coordinate with combustion chamber geometry and ignition placement.
A useful engineering approach is to treat the ignition region as a “mixing target volume.” You can then reason about whether the spray penetration reaches that volume at the intended crank angle and whether the jet-to-wall interactions create unwanted quenching. If the spray impinges on a cold surface, the fuel can condense or form a film, reducing effective vapor availability and making combustion less repeatable.
Control of Spray–Chamber Interactions
Spray–chamber interactions include wall impingement, re-entrainment, and vapor cloud formation. These interactions are often the difference between a stable engine and one that needs constant tuning. Design choices that help include selecting injection direction relative to the swirl or tumble flow, and choosing nozzle orientation to avoid persistent wall wetting.
Example: if the chamber has strong swirl, injecting against the swirl can increase residence time near the ignition region but may also increase wall impingement risk. The correct choice is validated by comparing predicted and measured distribution metrics, not by intuition alone.
Validation Through Measurement and Model Correlation
Injection design should be validated with a combination of bench characterization and in-cylinder evidence. Bench tests can verify flow rate versus rail pressure, needle lift timing, and discharge coefficient. In-cylinder tests can confirm spray penetration and mixture behavior using optical access where available, or indirect indicators such as combustion phasing stability and cycle-to-cycle variation.
A systematic workflow is to calibrate a spray/mixing model using bench data first, then adjust mixing-related parameters using in-cylinder observations. This prevents “fitting” the model to combustion results without understanding whether the injection system is actually delivering the intended spray.
Mind Map: Spray Formation and Mixing Design
Example: Designing for a Load Step Without Losing Mixture Quality
Suppose the engine transitions from 50% to 70% load. The controller increases commanded injected mass and may advance timing slightly to maintain combustion phasing. The injection system design requirement is that the spray penetration at the ignition crank angle remains within a narrow band, so the ignition region sees a similar mixture strength. Practically, this means verifying that the injector’s flow response is linear enough over the operating pressure range, and that rate shaping prevents a sudden rich pocket.
If tests show that penetration increases too much with rail pressure, the fix is not necessarily “change timing.” It can be a nozzle or control adjustment that alters discharge coefficient behavior or modifies the commanded mass-flow ramp so the mixture distribution stays consistent.
Design Checklist for Spray Formation and Mixing
- Confirm injection mode matches expected cylinder phase conditions.
- Choose nozzle geometry to control penetration and distribution, not just flow rate.
- Implement rate shaping to reduce stratification during transients.
- Coordinate nozzle orientation with chamber flow to manage wall interactions.
- Validate with bench flow dynamics and in-cylinder mixture indicators.
- Calibrate control compensation for injector delay and rail pressure effects.
6.3 Ignition Support Systems Including Pilot and Auxiliary Fuels
Ammonia combustion is not naturally eager to ignite. Ignition support systems exist to provide a reliable ignition source, control combustion stability across load changes, and protect the engine from misfires that can lead to poor efficiency or unwanted exhaust conditions. In practice, the ignition system is a coordinated set of hardware and logic: it must deliver the right energy at the right time, under the right mixture conditions, and it must do so while respecting safety constraints for ammonia handling.
Foundational Concepts for Ignition Support
Start with three constraints that drive the design.
-
Ignition energy and flame kernel formation: Ammonia has a higher ignition resistance than many conventional fuels. The system therefore needs either a stronger ignition event or a localized region with more favorable chemistry.
-
Mixture preparation and timing: Even with a good ignition source, ignition can fail if the fuel-air mixture is too lean, too rich, or poorly mixed at the moment of ignition. Ignition support must align with injection timing, scavenging, and cylinder conditions.
-
Operational envelope and transients: Engines rarely operate at a single steady point. Ignition support must remain effective during start-up, load ramps, and low-load operation where mixture conditions often drift toward harder-to-ignite regimes.
Pilot Fuel Strategy and Control Logic
A pilot fuel strategy creates a small, ignitable combustion zone that helps establish a flame kernel. The pilot can be ammonia itself under carefully controlled conditions, or it can use an auxiliary fuel to make ignition easier. The key engineering idea is that the pilot is not meant to carry the entire energy release; it is meant to start the fire reliably.
A typical pilot approach includes:
- Pilot injection timing: Pilot injection is scheduled relative to crank angle so that the pilot mixture is present and ignitable at the ignition event.
- Pilot quantity control: Pilot mass is adjusted to maintain ignition reliability without wasting fuel or causing excessive unburned slip.
- Ignition event coordination: If an ignition device is used (for example, spark or glow), its energy delivery is synchronized with the pilot availability.
Easy example: Imagine a cylinder at low load where the main ammonia injection is reduced. Without pilot support, the mixture may become too lean to ignite. With pilot support, a small pilot dose is injected earlier or in a different pattern so that a richer pocket forms near the ignition source, allowing the flame to grow and then propagate into the main charge.
Auxiliary Fuel Options and Their Engineering Implications
Auxiliary fuels can improve ignition reliability by providing more reactive chemistry. The engineering implications are not limited to combustion; they also affect fuel storage, transfer, safety systems, and emissions.
Common auxiliary-fuel engineering considerations include:
- Fuel system separation: Auxiliary fuel lines, valves, and pumps must be segregated from ammonia systems to prevent cross-contamination and to simplify hazard analysis.
- Ignition device compatibility: The ignition hardware must be sized and controlled for the auxiliary fuel’s combustion characteristics.
- Emissions accounting: Auxiliary fuel use changes exhaust composition. Even if auxiliary fuel is used only for ignition, the engine control system must account for its contribution to NOx formation and unburned hydrocarbons (if applicable).
Easy example: If auxiliary fuel is used only during start-up and low-load operation, the control system can run a “pilot mode” schedule that limits auxiliary consumption. The engine still needs to meet emissions and stability targets, so the schedule is tied to measured cylinder conditions and engine load rather than a fixed time window.
Ignition Hardware and Energy Delivery
Ignition support hardware typically includes one or more of the following:
- Ignition device: Spark, plasma, or glow-type devices provide the initial energy.
- Pilot injector: A dedicated injector or injection strategy that meters pilot fuel with repeatable atomization.
- Fuel conditioning components: Filters, strainers, and pressure regulation to keep injection quality stable.
The design goal is repeatability. If pilot injection spray quality varies due to clogging or pressure drift, ignition reliability will vary too. That’s why the ignition system design is inseparable from fuel supply quality.
System Integration with Engine Control
Ignition support is usually implemented as a control mode layered on top of the main fuel and air management.
- Mode selection: Start-up mode, low-load mode, and normal operation mode determine whether pilot and/or auxiliary fuel is active.
- Closed-loop adjustments: Sensors such as cylinder pressure-derived indicators, exhaust oxygen, or combustion phasing metrics can be used to adjust pilot quantity and timing.
- Interlocks and safe states: If auxiliary fuel pressure is low, if ammonia supply is unstable, or if a misfire is detected, the system must transition to a safe operating state.
Easy example: During a load ramp, the controller may reduce main ammonia injection while increasing pilot quantity briefly. If combustion phasing indicates delayed burn, the controller can advance pilot timing by a small calibrated amount to restore stable flame growth.
Mind Map: Ignition Support Systems
Validation and Commissioning Practices
Ignition support systems should be validated with a focus on repeatability and transient behavior, not just a single “it lights” test.
- Repeat ignition tests: Run multiple start cycles and low-load points to confirm consistent ignition without excessive auxiliary fuel.
- Misfire detection calibration: Establish thresholds that distinguish true misfire from normal combustion variability.
- Pilot injector health checks: Verify spray and pressure stability over time, since degraded injection quality often shows up as intermittent ignition failures.
Easy example: If ignition success is high but varies during a specific load range, the commissioning plan should include fine-grained sweeps of pilot timing and quantity at that load. The goal is to map the boundary where flame kernel formation becomes unreliable, then set control margins inside the reliable region.
Practical Design Takeaways
A good ignition support system is not a single component; it’s a coordinated chain. Pilot injection timing and quantity must align with ignition energy delivery, auxiliary fuel use must be constrained and accounted for, and control logic must handle both normal transients and fault conditions. When these pieces work together, the engine can start cleanly and transition smoothly without relying on luck.
6.4 Combustion Monitoring and Control for Stable Operation
Stable ammonia combustion is mostly about keeping the engine’s “fuel–air–ignition” story consistent from one cycle to the next. Monitoring tells you what the story actually is; control makes small corrections before the story turns into a plot twist.
Foundational Signals and What They Mean
Start with the signals that reflect combustion reality rather than just inputs.
- Cylinder pressure trace: The fastest truth-teller. Key features include peak pressure timing (often expressed as crank angle), pressure rise rate, and cycle-to-cycle variation.
- Exhaust temperature: Useful for aftertreatment protection and for detecting misfire patterns, but slower than cylinder pressure.
- NOx and NH3 slip indicators: Either direct analyzers or inferred estimates. They are not “instant feedback,” but they help tune operating targets.
- Fuel system states: Injection pressure, commanded vs. actual injection quantity, valve response, and purge/vent status. If the fuel system drifts, combustion will follow.
- Air path states: Scavenge/charge pressure, intake temperature, and turbo or blower control positions.
A practical rule: if you can’t explain why a combustion metric changed using measured inputs, you don’t yet have a control problem—you have a measurement problem.
Control Objectives and Stability Metrics
Control aims to keep three things inside bounds:
- Combustion phasing: Peak pressure should occur near the design crank angle for efficiency and mechanical limits.
- Combustion smoothness: Low cycle-to-cycle variation reduces vibration and prevents thermal stress.
- Emissions balance: NOx and slip must remain within operational limits, not just at one load point.
Engine engineers often track mean and variance of cylinder pressure features. Mean tells you where combustion happens; variance tells you how repeatable it is.
Monitoring Architecture from Fast to Slow Loops
Use a layered approach so the controller reacts at the right timescale.
- Fast loop (cycle-level or near-cycle): Adjusts parameters that influence ignition and early heat release. Typical actuators include pilot fuel quantity, injection timing, and sometimes intake air temperature targets.
- Medium loop (seconds): Corrects for drift in fuel quality, actuator wear, and air path changes. It uses aggregated cylinder metrics and exhaust temperature trends.
- Slow loop (minutes): Handles calibration offsets, sensor health checks, and steady-state target updates for emissions balance.
This separation prevents the classic mistake of letting a slow emissions objective fight a fast phasing objective.
Feature Extraction for Cylinder Pressure
Cylinder pressure data is rich but noisy. Extract features that correlate with combustion outcomes.
- Peak pressure location: crank angle of maximum pressure.
- Pressure rise rate: indicates how quickly energy is released, which relates to ignition quality and mixing.
- Heat release proxy: if full heat release calculation is too heavy, use simplified proxies based on pressure derivatives.
- Misfire indicators: sudden drops in pressure rise rate or reduced peak pressure at the same load.
Example: if load increases and peak pressure shifts later while pressure rise rate drops, the controller should suspect reduced ignition effectiveness or delayed mixing, not simply “not enough fuel.”
Control Strategies That Work in Practice
Phasing Control Using Timing and Pilot Support
For ammonia combustion, ignition support is often the difference between “stable” and “occasionally interesting.” A common strategy is:
- Maintain a target peak pressure crank angle.
- Use pilot fuel quantity and injection timing to pull phasing back when it drifts.
Example: during a cold start, exhaust temperature lags. The controller can still stabilize phasing using cylinder pressure features while gradually transitioning toward normal operating targets.
Smoothness Control Using Variation Metrics
Cycle-to-cycle variation is a stability alarm. When variance rises:
- Check fuel injection quantity consistency.
- Verify fuel temperature and line pressure stability.
- Inspect air path control for oscillations.
Example: if variance increases only at a certain load range, it may coincide with a turbo control mode change. The monitoring layer should confirm whether the air path is oscillating before blaming combustion chemistry.
Emissions Balance Using Indirect Feedback
Direct NOx and slip measurements can be delayed. Use them to set operating targets, while fast loops handle phasing and smoothness.
Example: if NOx trends upward over several minutes while phasing is stable, the medium loop can reduce combustion temperature drivers by adjusting air–fuel mixing targets or pilot strategy, rather than chasing instantaneous cylinder pressure.
Sensor Health and Plausibility Checks
Good monitoring includes knowing when sensors are lying.
- Range and rate checks: pressure sensors should not jump beyond physical limits.
- Cross-checks: if cylinder pressure indicates misfire but exhaust temperature does not, confirm signal integrity.
- Consistency with fuel states: injection quantity commands should correlate with combustion features.
Example: a drifting pressure sensor can create a false “phasing error,” causing the controller to chase its own tail. Plausibility checks prevent that.
Mind Map: Combustion Monitoring and Control
Integrated Example: From Anomaly Detection to Correction
Assume load increases by a step. Monitoring shows peak pressure shifts later and pressure rise rate drops, while injection quantity commands remain unchanged.
- Fast loop: adjust pilot quantity upward and advance injection timing slightly to restore phasing.
- Medium loop: verify fuel line pressure and injection valve response; if actual injection quantity is lower than commanded, correct the fuel system calibration.
- Emissions manager: once phasing returns, watch NOx and slip trends to ensure the correction doesn’t trade one problem for another.
The key is sequencing: correct the immediate combustion behavior first, then confirm the root cause using fuel and air measurements.
Practical Commissioning Checklist for Monitoring and Control
- Confirm cylinder pressure feature extraction against known operating points.
- Tune fast-loop gains to correct phasing without amplifying noise.
- Validate medium-loop drift correction using controlled fuel quality changes.
- Implement sensor plausibility checks and define safe fallback actions.
- Verify that emissions objectives do not override phasing and smoothness loops.
When these pieces align, the engine doesn’t just run—it stays boring in the best possible way.
6.5 Engine Tuning Inputs Including Load Transitions and Transient Response
Tuning an ammonia-fuel engine is mostly about controlling how quickly the system can move from one operating point to another without creating unstable combustion, unsafe temperatures, or fuel system upset. In practice, you tune three layers together: fuel delivery, combustion control, and protection limits. If you tune only one layer, the others will still “do their own thing” during transients.
Foundational Tuning Inputs
Start with the inputs that define the operating point and the transient path.
- Requested load and ramp rate: The control system needs not only the target load but also how fast the load changes. A slow ramp allows combustion and exhaust temperatures to track smoothly; a fast ramp forces the controller to make larger step changes.
- Fuel quality and composition: Water content and trace contaminants affect vaporization, mixing, and combustion stability. Even when the engine runs “normally,” a different batch can shift the best injection timing and allowable load ramp.
- Ambient and intake conditions: Intake pressure and temperature influence charge density and ignition behavior. If the controller assumes a fixed intake condition, it will misjudge the required fuel and timing during transitions.
- Exhaust backpressure and aftertreatment state: Backpressure affects cylinder scavenging and effective load. Aftertreatment temperature and catalyst conditions can constrain how much you can change fueling without exceeding limits.
A simple example: during a maneuver, the bridge requests a load increase from 60% to 75% over 30 seconds. If the controller treats this as an instantaneous step, it may overfuel briefly, increasing ammonia slip and raising exhaust temperatures faster than the aftertreatment can tolerate.
Load Transition Strategy
A robust load transition uses a staged approach rather than a single “jump” command.
- Setpoint shaping: Convert the operator request into a ramped fuel/torque demand with a defined slope. This reduces excitation of oscillations in the fuel system and combustion.
- Feedforward plus feedback: Use feedforward to anticipate the needed fuel and timing change, then feedback to correct based on measured combustion indicators.
- Mode-dependent limits: Apply different ramp limits for start-up, steady running, and low-load operation. Low-load operation often has narrower stability margins.
A practical example: when increasing load, you can ramp the fuel command first while holding ignition support stable for a short window. Once combustion stability metrics confirm stable operation, you reduce ignition support and allow timing to follow the steady-state map.
Transient Response Control Variables
During transients, tune the following variables so they respond quickly but not aggressively.
- Fuel mass flow control dynamics: Adjust controller gains for the fuel valve/pump loop so it reaches the demanded flow without overshoot. Overshoot can cause rich pockets and higher slip.
- Injection timing and pilot strategy: For ammonia combustion, timing changes strongly affect ignition delay and burn fraction. Pilot fuel or auxiliary ignition support (where used) should be managed with clear thresholds.
- Air handling and charge control: If the engine uses variable intake or turbocharger control, tune how quickly charge pressure and temperature respond to the load ramp.
- Exhaust temperature and NOx constraints: Use protection limits to cap fueling and timing changes when exhaust temperature rises too quickly.
Stability and Protection Logic
Transient tuning must include “guardrails” that prevent the controller from chasing the setpoint at the expense of safety.
- Combustion stability metrics: Use signals such as cylinder pressure trends, misfire indicators, or fast exhaust temperature rise rates to detect instability early.
- Ammonia slip and aftertreatment temperature: If slip rises, reduce fueling rate or adjust timing/pilot strategy. If aftertreatment temperature climbs too fast, limit ramp rate.
- Fuel system pressure and temperature: Ensure transfer and vapor management remain within bounds, especially when load changes alter consumption rate.
A concrete example: if exhaust temperature rise rate exceeds a threshold during a rapid load increase, the controller can temporarily reduce the fuel ramp slope while maintaining the overall target load. The ship still reaches the requested load, just with a safer path.
Mind Map: Engine Tuning Inputs and Transient Response
Example: Tuning a 20% Load Step with a Controlled Ramp
Assume the engine operates at 50% load and you need to reach 70%.
- Step request: 50% → 70%.
- Tuning choice: Convert to a 40-second ramp for the fuel command.
- Feedforward: Apply a timing advance schedule that matches the expected ignition delay change with load.
- Feedback correction: Monitor a combustion stability indicator and adjust fuel trim if the indicator worsens.
- Protection: If exhaust temperature rise rate exceeds the limit, reduce the ramp slope by a fixed factor until the rise rate returns to normal.
The result you’re aiming for is not “perfect tracking at every instant,” but stable combustion with acceptable emissions and no fuel system excursions. When the ramp is shaped and the controller has clear limits, the engine behaves like a system rather than a collection of independent loops.
7. Exhaust Aftertreatment and Emissions Control for Ammonia Fueled Propulsion
7.1 Emissions Formation Mechanisms Relevant to Ammonia Combustion
Ammonia combustion is different from conventional marine fuels because nitrogen is already inside the fuel. That single fact reshapes where nitrogen oxides come from, how unburned species form, and why small changes in mixing and temperature can noticeably shift emissions.
Core Chemistry and Where Nitrogen Oxides Come From
Ammonia (NH3) contains nitrogen, so nitrogen oxide formation is dominated by two pathways:
- Fuel-NOx formation: nitrogen in NH3 is oxidized during combustion. This tends to be sensitive to how completely ammonia is burned and how long reactive mixtures stay in the right temperature range.
- Thermal-NOx formation: nitrogen from air forms NO when high temperatures enable N2 and O2 to react. This pathway grows strongly with peak flame temperature and residence time.
A practical way to reason about this is to track three things during an engine cycle: how fast ammonia mixes with oxidizer, how quickly radicals build up, and how long the gas remains hot enough for NO chemistry. If mixing is slow, ammonia can slip through the reaction zone and later oxidize incompletely, which often increases both NOx and unburned nitrogen species depending on conditions.
Temperature, Oxygen Availability, and Residence Time
NOx formation is not just “more heat equals more NOx.” It’s more like “more heat plus the right chemical environment equals more NOx.”
- Temperature: higher peak temperatures generally increase thermal-NOx. However, ammonia combustion often operates with strategies that limit peak temperature, which can reduce thermal-NOx but may increase incomplete combustion if the system is pushed too far.
- Oxygen availability: if oxygen is insufficient locally, ammonia can form intermediate species such as NH2 and HNO, which can later convert to NO under different conditions. This is why local equivalence ratio matters more than the average air-fuel ratio.
- Residence time: longer time at elevated temperature allows NO chemistry to proceed. Short residence time can reduce thermal-NOx but may leave more unburned ammonia or other nitrogen-containing slip.
Incomplete Combustion and Nitrogen Slip
Incomplete combustion produces emissions that are not always counted as “NOx,” but they still matter operationally and environmentally. Key contributors include:
- Unburned ammonia (NH3 slip): occurs when ammonia does not fully react before gases leave the effective reaction zone. Slip is strongly affected by injection timing, atomization quality, and how well the engine creates a combustible mixture.
- Other nitrogen-containing species: depending on conditions, intermediates can appear and later convert in the exhaust system. Some of these species can contribute to measured NOx after oxidation, while others remain as reduced nitrogen compounds.
A simple example: if injection creates a locally rich pocket, that pocket may not ignite fully. The surrounding lean zones may burn, but the rich pocket can exit the cylinder with ammonia still present. The exhaust then sees a mixture that is harder to fully oxidize without additional control.
Role of Ignition Support and Combustion Stability
Ammonia has a high ignition resistance compared with many conventional fuels, so ignition support systems influence emissions indirectly:
- Pilot strategy: a pilot that reliably initiates combustion can reduce cycle-to-cycle variability. Lower variability typically reduces the spread of NOx and slip values.
- Transient operation: during load changes, mixing and temperature distributions shift. Even if steady-state emissions look acceptable, transients can increase NH3 slip and alter NOx formation because the combustion process spends more time in partially reacted states.
Exhaust Aftertreatment Interaction with Formation Mechanisms
Even though this section focuses on formation, it’s useful to connect formation to what the exhaust system measures. If cylinder conditions produce high NH3 slip, aftertreatment must handle it. If formation produces NO predominantly, aftertreatment can focus on controlling NOx rather than oxidizing reduced nitrogen species.
In other words, the engine decides the “starting composition,” and the exhaust system decides the “final measured emissions.” The split between those responsibilities depends on combustion quality.
Mind Map: Emissions Formation Drivers for Ammonia Combustion
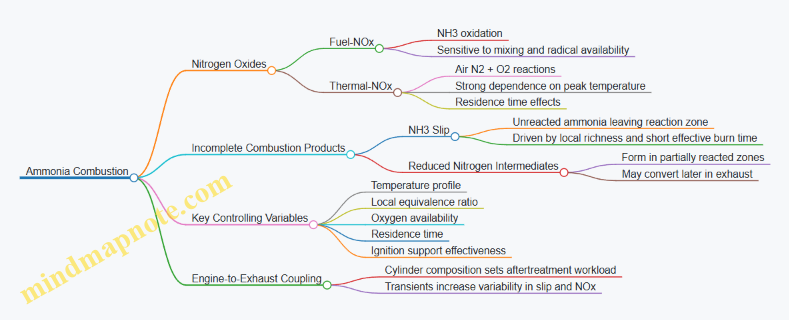
Example: Linking One Design Change to Multiple Emissions
Consider a change that improves injection atomization, producing a finer spray and better mixing. The immediate effect is more uniform equivalence ratio, which reduces locally rich pockets. That typically:
- decreases NH3 slip because ammonia has more opportunity to react before leaving the cylinder,
- shifts NOx balance toward more complete fuel-NOx chemistry rather than late oxidation of partially reacted pockets,
- reduces cycle-to-cycle variability, which often tightens the distribution of both NOx and slip.
The key reasoning step is that improved mixing changes the path through the reaction zone, not just the final amount of nitrogen converted.
Example: Interpreting “High NOx” Without Assuming It’s Only Thermal
If measured NOx rises after an operating adjustment, it might be tempting to blame higher peak temperature. But if the adjustment also increases local richness or reduces ignition reliability, fuel-NOx can rise even when peak temperature is not dramatically higher. The diagnostic logic is to compare trends in NH3 slip and combustion stability: rising NOx with rising slip often points to incomplete combustion and fuel-NOx contributions, while rising NOx with low slip and stable combustion points more toward thermal-NOx dominance.
7.2 Aftertreatment System Architectures for NOx and Slip Control
Ammonia combustion can produce NOx while also leaving unburned ammonia (often called slip). Aftertreatment architectures aim to reduce both, but they do it with different mechanisms, different sensitivities, and different control requirements. A good design treats NOx and slip as coupled problems: the same operating conditions that help NOx reduction can worsen slip, and vice versa.
Core Architecture Building Blocks
Most practical systems combine three layers: exhaust conditioning, NOx conversion, and slip management.
- Exhaust conditioning prepares the gas stream for catalysts by controlling temperature, mixing, and water content. Ammonia systems are sensitive to temperature windows because catalyst activity and reaction rates change quickly with temperature.
- NOx conversion typically uses selective catalytic reduction concepts adapted to ammonia chemistry. The goal is to convert NOx into nitrogen using ammonia as the reductant.
- Slip management ensures that any remaining ammonia is captured or converted downstream, usually by a catalyst designed to oxidize ammonia or by a second-stage reduction/oxidation balance.
A simple mental model helps: conditioning sets the “rules of the game,” the first catalyst sets the “main score,” and the second stage prevents “leftovers” from escaping.
NOx Control Pathways
NOx reduction in ammonia-fueled exhaust depends on how NOx is formed upstream and how much ammonia is available in the exhaust. Two common architectural patterns are:
- Single-stage reduction-focused design: A catalyst bed is placed where the exhaust temperature and ammonia concentration support NOx conversion. This works best when slip is already low enough that ammonia does not pass through unchanged.
- Two-stage reduction with staged dosing: A first catalyst reduces a portion of NOx, and a second catalyst handles remaining NOx under different temperature or ammonia availability. This is useful when the engine’s operating profile causes large swings in exhaust conditions.
In both patterns, the control system must coordinate catalyst inlet temperature and ammonia availability. If the exhaust is too cold, NOx conversion efficiency drops; if it is too hot, ammonia can slip through or decompose in ways that reduce overall conversion.
Slip Control Pathways
Slip control is usually handled by a dedicated catalyst stage that promotes ammonia oxidation or further conversion to nitrogen. The key is that slip catalysts need enough residence time and appropriate temperature to react ammonia without creating excessive byproducts.
A common integrated approach is:
- Primary NOx catalyst tuned for NOx conversion.
- Secondary slip catalyst tuned for ammonia oxidation or completion reactions.
This separation lets the NOx catalyst operate in a window that favors NOx reduction, while the slip catalyst handles the “tail” of ammonia that remains after the first bed.
Integrated System Layout
A typical layout includes:
- Diesel-like hardware, ammonia-like control: mufflers and flow straighteners are still needed, but the control logic must treat ammonia as a reactive species.
- Temperature management: exhaust bypass or electric/thermal heaters can be used to keep the catalyst within its effective range.
- Mixing and distribution: poor mixing can create local ammonia-rich zones that increase slip downstream and local ammonia-lean zones that reduce NOx conversion.
Mind Map: Aftertreatment Architecture for NOx and Slip Control
Example: Two-Stage Catalyst with Coordinated Control
Consider a vessel engine that runs at varying loads. At low load, exhaust temperature drops and NOx formation may be lower but slip risk rises because reactions slow down. At high load, exhaust temperature increases and NOx formation can rise.
A two-stage architecture can be controlled like this:
- At low load: keep the NOx catalyst within its effective temperature range using exhaust heating or bypass. Use the NOx stage to reduce what NOx exists, but rely on the slip stage to prevent ammonia from exiting.
- At high load: allow the NOx catalyst to operate efficiently for NOx reduction. The slip stage remains active to handle increased ammonia carryover.
Concrete control signals include catalyst inlet temperature targets and measured NH3 slip at the outlet. If outlet NH3 rises, the controller can increase catalyst temperature (within limits) or adjust ammonia availability upstream so the first stage does more of the work.
Example: Why Mixing Matters
Suppose ammonia is not evenly distributed across the catalyst face. Even if the average ammonia concentration looks acceptable, local ammonia-rich regions can pass through after incomplete conversion, increasing slip. Local ammonia-lean regions can reduce NOx conversion efficiency. A flow straightener and careful placement of any injection points reduce this mismatch, and the control system can then rely on sensor readings rather than “guessing” the internal distribution.
Practical Design Checks
Before finalizing the architecture, engineers typically verify:
- Temperature window coverage across the engine’s operating map.
- Residence time adequacy for slip conversion at the lowest expected effective temperatures.
- Sensor placement so NOx and NH3 readings reflect the same gas that the catalysts see.
- Failure modes such as sensor drift or heater loss, ensuring the system defaults to conditions that minimize both NOx and slip rather than optimizing only one.
A well-integrated architecture ends up being less about a single magic catalyst and more about matching exhaust conditions, catalyst staging, and control actions so NOx reduction and slip control reinforce each other.
7.3 Catalyst and Thermal Management for Exhaust Conditioning
Ammonia-fueled engines can produce nitrogen oxides (NOx) and unreacted ammonia slip. Exhaust conditioning systems aim to convert NOx and reduce slip while keeping catalysts inside their safe temperature windows. Thermal management is not just about “getting hot enough”; it is about controlling temperature gradients, avoiding condensation and plugging, and matching catalyst activity to real exhaust transients.
Catalyst Roles and Operating Constraints
A typical exhaust conditioning chain includes an oxidation or decomposition step (to address ammonia slip and convert reactive nitrogen species) and a downstream selective catalytic reduction stage (to reduce NOx). The exact arrangement depends on engine type and operating mode, but the engineering constraints are consistent:
- Temperature window control: Catalysts have an effective activity range. Below it, conversion drops; above it, sintering and deactivation accelerate.
- Gas composition sensitivity: Water vapor, oxygen level, and residual ammonia affect reaction pathways. A system that works at steady load may underperform during start-up or rapid load changes.
- Mass transfer limits: Even if the chemistry is favorable, poor mixing or channel blockage reduces contact between gas and catalyst surface.
A practical way to think about it: the catalyst is a “reaction surface,” while thermal management is the “traffic controller” that keeps the surface in the right conditions at the right time.
Thermal Management Architecture
Thermal management usually combines passive insulation, controlled heat input, and careful placement of sensors and mixing devices.
-
Heat retention and insulation
- Insulate ducts and housings to reduce heat loss that would otherwise keep the catalyst below its effective range.
- Example: If the exhaust gas cools quickly in a long uptake, the catalyst may never reach light-off during low-load operation. Adding insulation near the catalyst inlet can shift the entire temperature profile upward.
-
Inlet temperature conditioning
- Use design features that promote uniform temperature distribution across the catalyst face.
- Example: A poorly designed inlet can create hot streaks that locally overheat the catalyst while other regions remain too cool. A flow straightener or mixing section can reduce face-to-face temperature spread.
-
Active heating where needed
- Some systems use electrical heaters or burner-assisted warm-up to reach catalyst operating temperature during start-up.
- Example: During frequent short voyages, relying on exhaust heat alone can lead to repeated cold starts. A compact heater can bring the catalyst to a usable temperature before the engine enters a higher-load regime.
-
Water and condensation control
- Water vapor can condense on cooler surfaces, carrying salts or forming deposits that block pores.
- Example: If the catalyst inlet is cooled by ambient air during maneuvering, condensation can occur. Insulation plus a controlled warm-up sequence helps keep surfaces above dew-point conditions.
Catalyst Selection and Integration Details
Catalyst choice is constrained by the exhaust environment and the desired reactions.
- Geometry and pressure drop: Honeycomb monoliths offer low pressure drop and good surface area. However, they can be sensitive to plugging from deposits.
- Thermal durability: Materials must withstand repeated thermal cycling from start-up and load transitions.
- Compatibility with ammonia slip control: Catalysts intended for NOx reduction must not inadvertently increase ammonia slip or create unwanted byproducts.
Integration means the catalyst is not installed in isolation. Engineers must coordinate:
- Upstream mixing so ammonia and NOx species meet the catalyst surface at the right ratios.
- Downstream handling so any remaining slip does not create compliance issues.
- Bypass and flow control to protect the catalyst during abnormal conditions.
Control Strategy for Transients
A robust control approach uses temperature and composition signals to manage warm-up, steady operation, and shutdown.
- Light-off management: Start-up logic should prevent dosing or operation modes that would produce high slip while the catalyst is cold.
- Thermal ramp limits: Control should limit how quickly temperature rises to reduce thermal stress.
- Graceful shutdown: After engine stop, residual heat can still drive reactions or deposition. A controlled cool-down sequence can reduce deposit formation.
Mind Map: Catalyst and Thermal Management
Example: Preventing Cold-Start Slip with Temperature-Gated Operation
Consider a vessel that frequently operates at low load. Without thermal gating, the catalyst may be below its effective temperature during the first minutes, allowing ammonia slip to pass through.
A systematic fix is to:
- Measure catalyst inlet temperature with a sensor placed to represent the catalyst face.
- Define a minimum temperature threshold for enabling the relevant catalytic stage.
- During start-up, run the engine and exhaust routing so the catalyst warms uniformly, using insulation and a short warm-up period.
- Only after the threshold is reached, allow the operating mode that relies on catalytic conversion.
The result is not magic chemistry; it is simple timing. The catalyst is given a chance to do its job before the system asks it to.
Example: Reducing Hot Spots with Inlet Mixing
If face temperature measurements show a large spread across the catalyst inlet, conversion may be uneven and local overheating can accelerate deactivation. Engineers can address this by adding a mixing section upstream and ensuring the exhaust duct geometry does not create recirculation zones.
A good engineering check is to compare:
- Temperature uniformity across the catalyst face
- Pressure drop before and after the catalyst
- Deposit indicators during maintenance inspections
When these improve together, the thermal management change is doing more than “raising temperature”; it is improving how exhaust contacts the catalyst.
7.4 Monitoring Instrumentation Including Sensors and Calibration Practices
Monitoring ammonia fuel systems is mostly about answering three questions reliably: What state is the fuel in right now, where is it going, and is the system drifting toward an unsafe condition? Instrumentation supports those answers through a layered approach: sensing elements measure physical variables, transmitters convert them into signals, controllers apply logic and alarms, and calibration keeps the whole chain honest.
Foundational Measurement Targets
Start by mapping each monitoring point to a variable and an engineering purpose.
- Pressure: tank pressure, transfer line pressure drop, and relief system setpoint verification. Example: if tank pressure rises while temperature stays flat, you likely have a vapor-space issue rather than a heat leak.
- Temperature: fuel and vapor temperatures for density estimation and vapor management. Example: a slow temperature increase with stable pressure can indicate heat tracing effectiveness improving.
- Level: liquid level for inventory control and transfer readiness. Example: if level readings disagree between two sensors, treat the transfer plan as “not ready” until reconciled.
- Flow: transfer flow rate and return/vent flows for mass balance. Example: a transfer that “finishes early” often shows up as flow tapering sooner than expected.
- Gas detection: ammonia concentration in ventilation zones and near potential leak points. Example: a detector that alarms during maintenance but not during normal operation points to local airflow changes.
Sensor Types and What They’re Good At
Choose sensors based on the measurement physics and the ammonia environment.
- Pressure transmitters: typically strain-gauge based. Use impulse lines and consider vibration and temperature effects on zero.
- Temperature sensors: RTDs are common for stability. Place sensors where they represent the bulk fluid, not just the wall.
- Level measurement: radar or differential pressure approaches are used depending on tank design. Example: radar can be more tolerant of foam and stratification than some alternatives.
- Flow meters: Coriolis meters provide mass flow directly, which helps mass-balance checks. Example: if mass flow integrates to a different delivered mass than the metering reconciliation, investigate calibration drift or line packing.
- Gas detectors: electrochemical or catalytic types for fixed points, with appropriate calibration gas and bump testing. Example: bump testing confirms response, while calibration confirms accuracy.
Signal Integrity and Alarm Logic
A sensor that measures correctly can still cause trouble if the signal path is wrong.
- Wiring and shielding: route signal cables away from high-power runs and use proper grounding to reduce noise-induced false alarms.
- Fail-safe behavior: define how the system reacts to “bad data.” Example: if a pressure transmitter goes out of range, the interlock should default to a conservative state rather than continuing transfer.
- Alarm setpoints with engineering context: alarms should reflect operational boundaries, not just raw sensor limits. Example: a high-pressure alarm can be paired with a “rate of rise” condition to distinguish normal boil-off from abnormal heating.
Calibration Practices That Hold Up in Real Operations
Calibration is not a single event; it’s a cycle of verification, adjustment, and documentation.
Calibration Planning and Traceability
Define the calibration interval based on risk and drift behavior.
- Risk-based intervals: gas detectors often require more frequent checks than temperature sensors.
- Traceability: calibration standards should be traceable to recognized references, and records should include uncertainty.
- Environmental conditions: document temperature and pressure during calibration because ammonia properties and sensor behavior can be condition-dependent.
Two-Step Verification for Gas Detection
Use a practical two-step approach.
- Bump test: apply a known concentration to confirm the detector responds.
- Full calibration: adjust scaling if needed and verify linearity across the relevant range. Example: if bump tests pass but full calibration shows reduced sensitivity, the detector may be contaminated or aging.
Zero and Span Checks for Process Transmitters
For pressure and temperature transmitters, perform checks that isolate common error sources.
- Zero check: verify the baseline at a known reference condition.
- Span check: verify scaling at a second point.
- Linearity verification: for critical measurements, confirm intermediate points. Example: a transmitter with correct zero but wrong span can still cause incorrect mass-balance reconciliation even if alarms seem “mostly fine.”
Calibration with System Integration in Mind
Calibrating a sensor alone is not enough if the installation distorts the measurement.
- Impulse line effects: trapped gas or liquid in impulse lines can bias pressure readings.
- Thermal lag: temperature sensors can lag during fast transients; account for this in control tuning.
- Flow conditioning: ensure straight-run requirements and correct installation orientation. Example: a flow meter calibrated on a bench might read consistently wrong on a vessel if upstream piping differs from the calibration setup.
Mind Map: Monitoring Instrumentation and Calibration
Practical Example Workflow
A commissioning team starts with a measurement map, then verifies each sensor in the order that reduces rework.
- Functional checks: confirm signal scaling, alarms, and interlocks respond to simulated inputs.
- Reference calibration: calibrate gas detectors first because they govern safety actions.
- Process transmitter calibration: calibrate pressure, temperature, and flow with documented reference conditions.
- Integrated verification: run a controlled transfer and confirm mass-balance closure using metered flow and tank inventory changes.
- Record and lock: store calibration certificates, adjustment factors, and acceptance criteria in the system configuration so the next maintenance cycle has a baseline.
When done systematically, calibration becomes a way to keep the engineering story consistent: what the sensors report matches what the system is actually doing, and the alarms mean something actionable rather than merely loud.
7.5 Operational Procedures for Start Up, Shutdown, and Maintenance
Operational procedures for ammonia fuel systems should be written as sequences of cause and effect. Every step must state what changes in the system, what must be verified, and what to do if a check fails. The goal is simple: keep ammonia where it belongs, keep ignition sources controlled, and keep pressure and ventilation within design limits.
Start Up Procedures for Ammonia Fuel Delivery
Start up is best treated as three phases: establish safe ventilation, establish fuel readiness, then transition the engine to stable combustion.
Phase 1: Pre-Start Safety Checks
- Confirm gas detection channels are healthy and alarm setpoints match the safety case.
- Verify ventilation fans are running in the intended mode for the area classification.
- Check that emergency shutdown logic is armed and that bypasses are not active.
- Ensure all manual valves required for the intended operating mode are in the correct positions and tagged.
Example: If a detector shows a fault, do not proceed to fuel transfer. Treat it as “unknown gas concentration,” which means you cannot rely on automatic mitigation.
Phase 2: Fuel System Conditioning
- Purge or precondition transfer lines according to the system design to avoid mixing with residual air or water.
- Bring the fuel supply pressure to the required operating window using the designed control strategy.
- Verify filtration and water management status, including differential pressure across strainers.
Example: A rising differential pressure across a strainer during warm-up often indicates water or particulate loading. Pause transfer and investigate rather than forcing flow.
Phase 3: Engine Transition to Stable Operation
- Start the engine using the approved ignition support strategy.
- Introduce ammonia fuel in the prescribed ramp schedule, monitoring combustion stability indicators.
- Confirm aftertreatment conditions are within operating limits before sustained high-load operation.
Example: During load increase, if combustion stability degrades, hold the load and reduce the fuel ramp rate. The procedure should specify the exact action, not “adjust as needed.”
Shutdown Procedures for Safe Fuel Isolation
Shutdown should reduce ammonia availability to the engine while maintaining safe pressure control until the system is in a stable, low-risk state.
Step 1: Controlled Engine Fuel Reduction
- Reduce engine load and command a controlled fuel cutback consistent with the engine control philosophy.
- Maintain ventilation and detection until the system is confirmed free of hazardous conditions.
Step 2: Fuel Isolation and Line Management
- Close the fuel supply valves to the engine in the order specified by the design to prevent trapped high-pressure sections.
- Manage residual pressure using the approved blowdown or return strategy.
Example: If the procedure closes a valve without addressing downstream trapped pressure, the system may exceed allowable limits during thermal contraction. The written sequence prevents that.
Step 3: Post-Run Verification
- Confirm that fuel pumps are stopped, alarms are acknowledged appropriately, and ventilation remains active until gas concentration trends are stable.
- Record final operating parameters for traceability.
Maintenance Procedures for Reliability and Safety
Maintenance procedures should separate “routine checks” from “work that changes system integrity.” The second category requires stricter controls and verification.
Routine Maintenance
- Inspect and clean strainers and check differential pressure trends.
- Verify sensor calibration status and perform functional checks for alarms.
- Inspect insulation and supports for signs of moisture ingress or corrosion.
Work That Changes Integrity
- Any opening of pressure-containing parts requires isolation, depressurization, and verification of gas-free conditions.
- Use lockout/tagout for valves and electrical isolation for actuators.
- After reassembly, perform leak testing and functional checks before returning to service.
Example: After replacing a transfer valve actuator, confirm that the valve position feedback matches commanded state. A mismatch can cause the system to think it is isolated when it is not.
Mind Map: Operational Procedures
Integrated Example Workflow for a Typical Day
A practical workflow ties the phases together. Before start, the crew confirms ventilation and detection health, then verifies valve line-up. During fuel conditioning, they monitor strainer differential pressure and confirm the supply pressure is within the engine’s operating window. When the engine transitions, they follow the fuel ramp and watch stability indicators; if stability degrades, they hold load and adjust the ramp rate per procedure. At the end of the shift, they reduce load, execute the fuel cutback, isolate the supply, manage residual pressure, and keep ventilation active until gas trends are stable. For maintenance, they schedule routine checks during planned downtime and reserve integrity-changing work for controlled isolation windows with leak testing and functional verification before return to service.
8. Hybrid Propulsion Integration with Ammonia Fueled Prime Movers
8.1 Hybrid System Topologies Including Diesel Electric and Direct Drive
Hybrid propulsion is easiest to reason about when you separate three functions: producing power, converting it to shaft work, and controlling energy flow during transients. In ammonia-fuelled vessels, the hybrid layer also helps keep the ammonia prime mover operating in a steadier region, which makes fuel handling and combustion control less fussy.
Foundational Building Blocks
A hybrid propulsion system typically includes a prime mover (ammonia engine or engine set), a power conversion stage, an energy buffer, and a propulsion output (shaft and propeller). The energy buffer can be batteries, supercapacitors, or a flywheel; in practice, batteries dominate because they are simple to integrate with existing electrical systems.
Key engineering decisions are:
- Where torque is applied: directly at the shaft (direct drive) or through an electrical machine (diesel electric).
- How power is shared: by electrical power management (hybrid electric) or by mechanical coupling (direct drive).
- What happens during load steps: whether the buffer supplies the difference instantly.
Diesel Electric Topology
In a diesel electric arrangement, each prime mover drives a generator. The generators feed a switchboard and power electronics, and electric motors apply torque to the shaft. The “hybrid” part comes from adding an energy storage system that can source or absorb power quickly.
Why it works well for transients: when the vessel demands more thrust, the motors can draw extra current immediately. The batteries cover the shortfall while the generators ramp to a new operating point.
Simple example:
- Cruise at 60% load: generators supply most power, batteries sit near a mid state of charge.
- A maneuver requires a 20% thrust increase for 2 minutes.
- Motors request the higher torque; batteries discharge for those 2 minutes.
- After the maneuver, generators increase load and batteries recharge gradually.
Engineering details that matter:
- Generator loading limits: keep generator voltage and frequency within motor and control tolerances.
- Harmonics and filtering: inverter-fed motors can introduce current ripple; filters and control tuning reduce stress on cables and motors.
- Thermal margins: motors and inverters must handle peak current during maneuvering.
Direct Drive Topology
In direct drive, the prime mover connects mechanically to the propulsion shaft through a gearbox and possibly a clutch. Hybrid assistance is usually provided by an electrical machine integrated with the shaft line, such as a motor-generator coupled through a clutch or a power take-off arrangement.
Why it can be efficient: mechanical coupling avoids some electrical conversion losses during steady operation.
Simple example:
- The ammonia engine runs near a stable speed.
- During a short acceleration, the integrated motor-generator adds torque through the shaft line.
- When acceleration ends, the engine torque returns to its baseline and the motor-generator absorbs power to recharge the buffer.
Engineering details that matter:
- Clutch and synchronization: torque transfer must avoid shock loads; synchronization checks ensure speed alignment.
- Torsional vibration: shaft dynamics can amplify during engagement; torsional analysis guides damper selection.
- Gearbox loading: peak torque during hybrid assist must stay within gear tooth and bearing limits.
Comparing the Two Topologies
Diesel electric systems excel at flexible power sharing because electrical machines decouple the prime mover from instantaneous shaft torque. Direct drive systems excel at straightforward mechanical power transfer but require careful control of torque during coupling events.
A practical rule of thumb for design reviews:
- If the vessel experiences frequent thrust steps and you want smooth torque delivery, diesel electric is usually easier to manage.
- If you want fewer conversion stages and can tolerate more mechanical control complexity, direct drive can be attractive.
Mind Map: Hybrid Topologies and Engineering Decisions
Example: Selecting Control Strategy for Load Steps
Consider a 10,000 kW propulsion system where the prime mover can ramp at a limited rate. In diesel electric, the motor controller can request immediate torque, while the generator control follows a ramp. In direct drive, the clutch engagement and motor-generator torque command must be coordinated so that shaft torque does not exceed allowable limits.
A concrete control approach for both:
- Define a torque demand profile for the maneuver.
- Apply rate limits to prime mover torque changes.
- Use the energy buffer to cover the difference between demanded torque and prime mover capability.
- Enforce state of charge constraints so the buffer does not saturate during repeated maneuvers.
Summary of System Logic
Diesel electric hybridization routes torque through electrical conversion, making transient power sharing straightforward. Direct drive hybridization routes torque through mechanical coupling, which can be efficient but demands careful synchronization and torsional design. Either way, the engineering goal is the same: keep the ammonia prime mover in a controllable operating region while delivering the shaft torque the vessel actually needs.
8.2 Power Management Strategies for Load Sharing and Efficiency
Power management in a hybrid ammonia propulsion system is mostly about two things: keeping the prime movers in their preferred operating zones and preventing energy storage from being treated like a magic sponge. The goal is to coordinate power flow so that propulsion demand, generator loading, and battery buffering stay stable during steady running and transients.
Foundations of Load Sharing
Load sharing starts with defining what “load” means in each part of the system. For generators, load is electrical kW and frequency support. For the battery, load is net kW absorbed or delivered within state-of-charge (SoC) limits. For the shaft or thruster, load is mechanical power demand and speed/torque commands.
A practical way to structure control is to separate:
- Setpoint generation: convert propulsion demand (speed, thrust, or shaft torque) into required electrical power.
- Power allocation: decide how much of that power comes from generators versus battery.
- Actuation and protection: enforce limits on current, voltage, frequency, temperatures, and safety interlocks.
Efficiency Starts with Operating Points
Most engines and generators have regions where efficiency is best and emissions are easiest to manage. In ammonia-fueled systems, stable combustion and aftertreatment conditions matter, so the control system should avoid rapid generator cycling and keep each running unit near its target load band.
Easy example: If the vessel cruises at a steady 60% electrical demand, the controller can keep two generators running around 50–70% each and use the battery only for short bursts (like propeller load changes). When demand rises to 80%, it brings a third generator online rather than forcing the two existing units to chase every fluctuation.
Dispatch Logic for Coordinated Power Allocation
A common dispatch approach is priority-based allocation with SoC-aware buffering.
- Determine required electrical power from propulsion commands and auxiliary loads.
- Apply generator capacity constraints: each generator has minimum stable load, maximum output, and ramp limits.
- Use battery as a buffer when demand changes faster than generators can respond.
- Maintain SoC within a band so the battery can both absorb and deliver power.
SoC Band Control with Hysteresis
SoC limits should not be enforced as a single threshold, because that creates oscillation. Instead, use a band with hysteresis.
Easy example: Set SoC operating band to 40–70%. If SoC drops below 45%, the controller reduces battery discharge and increases generator loading. If SoC rises above 65%, it reduces generator loading slightly and allows battery absorption during regenerative or low-demand periods.
Load Sharing Between Multiple Generators
When more than one generator is running, load sharing can be done by droop control, master-slave strategies, or centralized power management.
Droop Control for Frequency-Based Sharing
Droop control adjusts generator output based on measured frequency deviation. It works well when the system is grid-like and frequency is a shared reference.
Easy example: If one generator is slightly overloaded, its governor response reduces its share by reacting to a frequency drop, while other generators pick up the difference.
Centralized Allocation for Tight Efficiency Targets
Centralized power management can compute each generator’s target kW based on efficiency maps and constraints, then command governors accordingly.
Easy example: During a maneuver, the system may temporarily accept a slightly lower efficiency to keep ammonia combustion stable, then return generators to their preferred load band once the maneuver ends.
Battery Buffering and Transient Handling
The battery should handle power transients that would otherwise cause generator hunting or frequent load changes.
Key practices:
- Limit battery power rate to protect converters and cells.
- Use SoC-dependent limits so the battery doesn’t hit its ceiling or floor during a long transient.
- Coordinate with shaft control so torque commands don’t create unnecessary electrical swings.
Easy example: If the thruster torque demand steps up by 20%, the battery supplies most of the extra electrical power for a few seconds while generators ramp. After generator output catches up, the battery returns toward its target SoC.
Mind Map: Power Allocation and Efficiency Levers
Integrated Control Example: From Cruise to Maneuver
Assume three generators are available and the vessel is cruising. The controller keeps two generators at moderate load and uses the battery for small fluctuations.
- Cruise: propulsion demand is steady; battery SoC is held near a mid-band target.
- Maneuver: torque demand steps up; battery immediately supplies the deficit within its power-rate limit.
- Generator ramp: governors increase output according to ramp limits while centralized dispatch ensures each generator stays within its stable load range.
- Load redistribution: once the new demand level is sustained, the controller adjusts generator loading so the battery returns to buffering duty.
- Return to cruise: when demand drops, battery absorbs the excess only until SoC approaches the upper band, then generator loading is reduced.
The efficiency win comes from avoiding unnecessary generator cycling and preventing the battery from doing long-duration work that should be handled by generators at efficient points. The stability win comes from matching response times: battery for fast changes, generators for sustained power.
8.3 Energy Storage Integration Including Battery and Buffer Requirements
Energy storage in a hybrid ammonia propulsion system is not just “extra capacity.” It is a set of engineered buffers that smooth power swings, protect prime movers, and keep fuel system transients inside safe operating windows. In practice, you design storage around three questions: what power must be delivered for how long, what constraints the engines and fuel system impose during transients, and what safety and control behavior you require when something goes wrong.
Foundational Requirements for Buffering
Start with the load profile the vessel actually sees: maneuvering, speed changes, thruster start/stop, and hotel loads. Convert that into a power demand curve at the propulsion bus (or DC link, depending on topology). Then identify the prime mover constraints that storage must respect. For ammonia-fueled engines, common constraints include limits on fuel valve slew rates, allowable manifold pressure excursions, and aftertreatment temperature management during rapid load changes.
A practical rule: size storage so the engine can follow demand within its ramp limits while storage covers the difference. For example, if the propulsion bus needs a 5 MW step increase over 20 seconds but the engine can only ramp 2 MW in that time, the storage must supply the remaining 3 MW for 20 seconds, plus losses.
Battery Versus Buffer Roles
Batteries are typically used for fast power delivery and absorption, because they can respond in milliseconds to seconds. They are well-suited to:
- Cover short transients during engine start, load steps, and propeller load changes.
- Absorb regenerative power during deceleration or thrust reduction.
- Provide ride-through during brief generator or converter disturbances.
However, batteries are not ideal for long-duration energy shifting unless the system is designed for it. For longer smoothing (minutes to hours), you rely more on generator inertia, flywheels (if present), or operational strategies that avoid large sustained mismatches.
Sizing Method That Avoids Guesswork
Use an energy balance that separates power and energy:
- Power rating: determine the maximum net power the storage must deliver or absorb during worst-case transients.
- Energy capacity: integrate the net power over the transient duration, then add margins for converter efficiency and allowable state-of-charge (SoC) swing.
- SoC window: define minimum and maximum SoC based on battery protection limits and control strategy.
Example: Suppose the bus requires +3 MW for 20 seconds and -1 MW for 10 seconds during a maneuver. Net delivered energy is 3 MW × 20 s = 60 MJ. Convert to kWh: 60 MJ ÷ 3.6 = 16.7 kWh. If converter efficiency is 96% and you allow a 20% usable SoC swing, the required nominal capacity is 16.7 ÷ (0.96 × 0.20) ≈ 87 kWh.
Buffering the DC Link and Converter Dynamics
In many hybrid architectures, a DC link sits between generators/inverters and the propulsion motor drives. The DC link needs buffering to handle current ripple and to keep voltage within control limits. Even if batteries exist, the DC link capacitor bank and any supercapacitor module (if used) handle high-frequency dynamics.
A concrete approach:
- DC link capacitors: manage switching ripple and short current spikes.
- Battery: manages slower power mismatches and provides control authority.
- Control loop coordination: ensure the DC link voltage controller does not fight the battery power controller.
If the DC link controller demands a fast current change, the battery current limit must be respected to avoid saturating the battery converter.
Control and Protection Requirements
Storage integration must define who “owns” each control objective. Typical hierarchy:
- Safety interlocks: hard limits on voltage, current, temperature, and contactor states.
- DC link regulation: keep bus voltage stable.
- Power smoothing: limit ramp rates seen by engines and fuel valves.
- SoC management: keep SoC within the usable window and avoid drifting into a corner.
Protection examples that matter in operation:
- If battery temperature rises, reduce allowable charge/discharge current so the propulsion bus remains stable without forcing the engine into an aggressive transient.
- If a converter fault occurs, the DC link must ride through long enough for the propulsion system to transition to a safe operating mode.
Mind Map: Battery and Buffer Requirements
Integrated Example Walkthrough
Consider a hybrid ammonia system where the engine-generator set can ramp 2 MW in 30 seconds, but the thruster demand changes by 6 MW in 15 seconds during a maneuver. The storage must supply the difference: 4 MW for 15 seconds, minus any immediate generator contribution and accounting for losses. After that, the engine catches up and the storage SoC returns toward its mid-range using controlled absorption if the maneuver includes deceleration.
To keep the fuel system stable, the control system limits the engine load change rate to its ramp capability, while the storage controller enforces a bounded battery current. The DC link controller maintains voltage during the transient, using the battery as the slower actuator and the capacitor bank for the fast switching ripple.
The result is a system where the engine operates within its comfortable envelope, the propulsion bus stays within voltage and current limits, and the storage behaves like a disciplined buffer rather than an uncontrolled second engine.
8.4 Propeller and Shaft System Matching for Hybrid Operating Points
Hybrid propulsion changes the “load story” seen by the propeller and shaft. Matching means choosing propeller, shafting, and control logic so that torque, thrust, and rotational speed stay within safe and efficient regions across the hybrid operating envelope—without forcing the engine or motor into unhappy corners.
Foundational Concepts for Matching
Start with three coupled relationships:
- Propeller load vs. speed: For a given water condition, propeller torque typically rises roughly with the square of shaft speed, while thrust rises roughly with the square to cube of speed depending on regime. That means small speed changes can noticeably alter required torque.
- Shaft torque vs. prime mover output: The engine or motor produces torque based on its control limits. In hybrid mode, the motor may cover transients, but the shaft still sees the combined torque.
- Hydrodynamic and mechanical constraints: Cavitation margin, shaft torsional vibration limits, bearing loads, and allowable thrust all restrict where you can operate.
A practical way to think about matching is to define a set of operating points: each point specifies shaft speed, delivered torque, and resulting thrust. Then you check whether each point is achievable by the hybrid powertrain and acceptable for the propeller and shaft.
Building the Operating Point Map
Create an operating point grid using:
- Speed bands (e.g., low, mid, high shaft RPM)
- Power split cases (engine-only, motor-only, and blended)
- Sea state or water condition cases (at least calm water and a representative resistance increase)
For each point, compute:
- Required propeller torque and thrust
- Engine/motor torque availability at that RPM
- Shaft speed stability under control actions
Example: Suppose the propeller is selected for efficient operation around 85% of maximum continuous RPM. In a hybrid low-speed maneuver, the motor may run at a lower RPM. If the propeller is too “fast” for that RPM, torque demand may be high relative to motor capability, pushing the motor toward its current limit. Matching then means either adjusting the propeller pitch/diameter (if controllable), selecting a different operating band for motor use, or changing the control strategy so the engine supports torque earlier.
Propeller Selection and Hybrid Implications
Propeller choice affects matching more than many expect:
- Fixed-pitch propellers: Hybrid matching relies heavily on controlling shaft speed and power split. The propeller’s torque-speed curve can force the motor to operate at less favorable efficiency.
- Controllable-pitch propellers: Pitch changes can keep the propeller near an efficient thrust coefficient, reducing torque spikes during transitions. This often improves hybrid controllability, but it introduces pitch actuator dynamics and additional constraints.
- Diameter and blade area: Larger blade area can reduce cavitation risk at a given thrust, but it can increase torque requirements at low speed.
A simple check: pick a low-speed maneuver thrust target, then compare the propeller’s expected torque at the motor’s typical RPM range. If torque demand sits near the motor’s peak torque for long periods, you will likely see thermal and efficiency penalties.
Shafting and Torsional Considerations
Hybrid systems can create torque oscillations because power sources may ramp differently. Matching therefore includes:
- Torsional vibration analysis: Ensure that combined torque excitation does not drive resonance at operating RPMs.
- Coupling and clutch behavior: If the hybrid uses clutches or gear stages, engagement timing must avoid torque discontinuities.
- Bearing and thrust loads: Thrust changes with propeller loading; verify allowable thrust margins across the operating point map.
Example: During a transition from engine-only to blended propulsion, the motor torque may ramp up while engine torque ramps down. If the ramp rates are mismatched, the shaft can experience a temporary torque dip or spike, which can excite torsional modes. Matching is achieved by coordinating ramp profiles and confirming torsional safety margins at the transition RPMs.
Control Strategy as Part of Matching
Matching is not only hardware. Control determines whether the system can actually reach the operating points you designed.
Key control elements:
- Torque sharing logic: Decide how the motor and engine split torque for a demanded thrust or shaft speed.
- Speed regulation vs. thrust regulation: Speed control is simpler, but thrust regulation can reduce propeller cavitation risk if implemented correctly.
- Rate limits and deadbands: These prevent chattering between power sources.
Mind Map: Propeller and Shaft Matching for Hybrid Operating Points
Worked Example of Matching Logic
Assume a vessel needs a thrust level equivalent to 60% of maximum continuous power at low speed. You target a shaft RPM that keeps the engine in a stable operating region while allowing the motor to assist.
- From resistance and propeller curves, estimate required torque at the target RPM.
- Check motor torque capability at that RPM. If it is insufficient, you have two options: increase shaft RPM (raising propeller torque demand but also improving motor operating point) or shift more torque to the engine.
- If you use controllable pitch, adjust pitch to meet thrust with lower torque demand, then re-check cavitation margin.
- Finally, validate the transition: confirm that during the torque handover, the shaft torque stays within torsional limits and that the control ramp rates prevent oscillatory behavior.
Validation Checklist for Engineers
For each operating point and each transition between points, verify:
- Propeller thrust and torque are consistent with the selected pitch or fixed geometry
- Motor and engine torque requests remain within limits with margin
- Shaft speed regulation does not force repeated control hunting
- Torsional vibration checks pass at steady and transient conditions
- Bearing and thrust loads remain within allowable envelopes
When these checks are satisfied together, the propeller and shaft system are truly matched to the hybrid operating points—not just “compatible on paper,” but stable and efficient in the way the ship actually runs.
8.5 Control System Interfaces for Coordinated Propulsion and Safety Functions
Coordinated propulsion and safety control is about making the “normal” control loops and the “protective” control loops share the same facts, timing, and priorities. If they disagree, the safety side must win, but it should win for the right reason and with predictable behavior.
Foundational Interface Principles
Start with a shared signal model. Define a small set of canonical variables used by both propulsion control and safety systems: fuel pressure at engine inlet, tank pressure, fuel flow rate, vapor concentration where required, ventilation status, and emergency shutdown command state. Each variable needs a unit, range, update rate, and validity rule.
Next, define priority and authority. A practical rule is: safety interlocks can force actuators to safe positions, while propulsion controllers can request changes but cannot override safety outputs. This is implemented with a clear ownership map: propulsion owns setpoints; safety owns permissives and final actuator commands.
Finally, define timing. Use deterministic scan timing where possible, and ensure that safety decisions are based on consistent sensor snapshots. A common failure mode is “sensor A says safe, sensor B says unsafe” during transient sampling; the interface should include a validity window and a defined logic for disagreement.
Interface Architecture and Data Flow
A typical architecture has four layers:
- Sensing and validation: sensors feed a signal conditioning layer that performs plausibility checks and marks signals as valid/invalid.
- Safety logic: interlocks evaluate validated signals and generate trip or inhibit commands.
- Propulsion control: engine or hybrid power management computes requested fuel delivery and power output.
- Actuator command arbitration: a final layer merges propulsion requests with safety overrides.
The arbitration layer is where coordination becomes real. For example, propulsion may request a higher fuel flow to meet load, but safety may inhibit fuel injection if ventilation is not confirmed or if a gas detection threshold is exceeded.
Mind Map: Coordinated Propulsion and Safety Interfaces
Safety Interlocks as Interface Contracts
Treat each interlock as a contract with explicit inputs and outputs. Inputs should be validated signals; outputs should be named commands such as Fuel Injection Inhibit, Ventilation Demand, or Emergency Shutdown.
Example: Fuel Injection Inhibit might require all of the following to be true:
- Fuel inlet pressure within an acceptable band
- Vapor concentration below a threshold
- Ventilation fan running and airflow proven
- No active emergency shutdown condition
If one input becomes invalid, choose a deterministic behavior. A common engineering choice is “invalid equals inhibit” for injection-related actions, because it prevents unintended fuel delivery when the system cannot prove safety.
Propulsion Control Requests and Safety Overrides
Propulsion control should generate requests, not direct actuator commands. For instance, the propulsion layer can output a Fuel Flow Request and an Injection Timing Request. The arbitration layer then applies safety overrides:
- If injection is inhibited, force fuel flow request to zero and hold injection timing at a safe value.
- If a shutdown is commanded, ramp down according to a defined shutdown curve rather than abruptly cutting everything.
This avoids two problems: nuisance trips from transient conditions, and uncontrolled transients when safety engages.
Example: Load Increase with Ventilation Degraded
Scenario: the vessel is increasing load. Propulsion requests higher fuel flow.
- Ventilation status transitions from “proven airflow” to “fan running but airflow not proven.”
- Safety logic detects loss of proven airflow and asserts Fuel Injection Inhibit.
- Arbitration forces fuel flow request to zero and commands a controlled ramp-down.
- Propulsion control remains active but constrained by the inhibit signal, so it does not keep integrating toward an unreachable setpoint.
The result is coordinated behavior: the engine does not chase a setpoint that safety has blocked, and the safety action is traceable in logs.
Example: Sensor Disagreement and Validity Windows
Scenario: tank pressure sensor A reads normal; sensor B reads high. The interface should not immediately trip on a single outlier if both sensors are within their diagnostic health.
A robust approach is to use a validity window and a voting rule:
- If both sensors are healthy, apply a defined selection method (for example, median or weighted average) within a tolerance.
- If disagreement exceeds tolerance for longer than a specified time, treat the condition as unsafe or degraded depending on the interlock’s purpose.
This keeps the system from “thrashing” between states while still protecting against real abnormal conditions.
Commissioning and Proof Testing of Interfaces
Commissioning should verify the interface contracts, not just the individual controllers. Use scenario-based tests that exercise the arbitration layer:
- Confirm that propulsion requests are blocked when interlocks are active.
- Confirm that safety outputs cannot be overridden by propulsion.
- Confirm that invalid sensor signals lead to the intended inhibit or degraded mode.
Log every interface decision with the triggering inputs and the resulting command. That makes troubleshooting practical, especially when the system behaves correctly but a sensor is miscalibrated.
Summary of Interface Deliverables
A coordinated design typically includes:
- A canonical signal list with validity rules
- An ownership and priority matrix for commands and overrides
- A timing and sampling consistency definition
- Named safety commands and propulsion request signals
- A test matrix covering arbitration behavior under normal, degraded, and invalid-signal conditions
9. Safety Engineering for Ammonia Fuel Systems on Ships and Terminals
9.1 Hazard Identification and Risk Assessment Methods for Ammonia
Ammonia hazard identification starts with a simple question: what can go wrong during fuel production, transfer, storage, and engine operation? The answer becomes useful only when it is tied to specific activities, locations, and operating states (normal, start-up, shut-down, maintenance, and abnormal conditions like loss of power). A systematic approach prevents the common failure mode of listing hazards without linking them to credible scenarios.
Foundations for Hazard Identification
Begin by mapping the system into “nodes” and “activities.” Nodes are physical areas such as tank rooms, transfer manifolds, engine rooms, and ventilation exhaust routes. Activities are actions like bunkering, draining, purging, sampling, and valve line-up. For each node-activity pair, identify credible release mechanisms:
- Leak paths: flanges, seals, gaskets, valves, hose couplings, instrument impulse lines.
- Overpressure and relief events: blocked discharge, regulator failure, thermal expansion.
- Incorrect operation: wrong valve position, bypassing interlocks, incomplete purges.
- Maintenance errors: opening a line without isolating and verifying gas-free status.
- Environmental effects: corrosion thinning, vibration loosening, insulation damage.
A practical check is to ask whether the hazard could exist even when everything is “working as designed.” For example, a relief valve lifting during a normal thermal expansion event is still a release scenario that must be assessed.
Risk Assessment Structure That Stays Traceable
Use a consistent risk model so decisions can be defended. A typical structure is:
- Define consequences for people, assets, and operations.
- Estimate likelihood using barriers and historical failure rates where available.
- Evaluate risk against acceptance criteria.
- Identify risk reduction measures and verify their effectiveness.
For ammonia, consequences often include acute toxicity from inhalation, irritation and burns from contact, and secondary effects like fire involvement of surrounding materials. Even when ammonia is not flammable under many conditions, the toxic release pathway dominates many scenarios.
Barrier-Based Thinking for Likelihood
Likelihood should reflect how many independent barriers prevent a release from becoming harmful. Barriers can be:
- Physical containment: tank integrity, double-walled piping, bunding.
- Control measures: pressure regulation, temperature control, correct valve sequencing.
- Detection and response: gas detection, alarms, automatic shutdown, ventilation control.
- Operational discipline: permits, checklists, training, supervision.
Example: During bunkering, a small gasket leak might be detected quickly and isolated by an emergency shutoff valve. The scenario remains credible, but the likelihood of a large release causing exposure drops because multiple barriers act together.
Scenario Development That Covers Real Life
Create scenarios that are specific enough to drive engineering decisions. Good scenarios include the initiating event, the release type, the duration, and the affected area.
Example scenario set for transfer:
- Initiating event: loading arm connection not fully seated.
- Release type: continuous small leak at coupling.
- Duration: until detection and manual stop within a defined time window.
- Affected area: transfer platform and adjacent enclosed spaces via ventilation pathways.
Then repeat for abnormal states:
- Loss of power during transfer leading to ventilation failure.
- Incorrect purge leaving residual ammonia in a line that is later opened.
- Relief valve lift due to blocked vent downstream.
Quantitative and Semi-Quantitative Methods
Many projects use a mix of methods:
- Qualitative matrices for early screening when data is limited.
- Semi-quantitative scoring that accounts for barrier strength and exposure potential.
- Quantitative dispersion and consequence modeling for scenarios that drive design limits, such as worst-case credible releases.
A useful rule: if the outcome changes the layout, ventilation sizing, or shutdown logic, the assessment should be detailed enough to justify those changes.
Mind Map: Hazard Identification and Risk Assessment
Example: From Hazard List to Engineering Decision
Suppose the hazard identification finds “ammonia release from a sampling point.” A scenario approach clarifies the initiating event: a technician opens the sample valve before confirming isolation and gas-free status. The consequence assessment focuses on the immediate breathing zone in the sampling area. Risk reduction then becomes concrete:
- Add interlocked valve sequencing so sampling cannot proceed without confirmed isolation.
- Improve local ventilation and ensure it is tied to the detection logic.
- Require a standard verification step (instrument reading and procedure sign-off) before opening.
The key is that each measure targets a specific barrier gap, not a generic “be safer” instruction.
Documentation and Review Discipline
Record hazards, scenarios, barriers, and decisions in a way that supports review. A good record makes it easy to answer: which scenarios were considered, what barriers were credited, and what evidence supports barrier performance. When the assessment is reviewed, the goal is not to argue opinions; it is to confirm that the scenario set is complete for the defined system boundaries and that the risk reduction measures are traceably linked to the scenarios they mitigate.
9.2 Detection, Ventilation, and Gas Dispersion Design Principles
Ammonia systems fail safely when three things work together: detection that is fast and reliable, ventilation that keeps concentrations below action levels, and dispersion design that prevents pockets from forming. Treat these as one system, not three separate checklists.
Foundational Concepts for Detection and Ventilation
Detection starts with defining where gas can accumulate. Ammonia is lighter than air, but it can still pool near obstacles, in enclosed spaces, and in low-velocity zones where buoyancy-driven flow is disrupted. Use ventilation and dispersion to manage both “where gas goes” and “how fast it gets there.”
Ventilation design is about maintaining a controlled airflow path. Local exhaust removes gas at the source, while general ventilation dilutes and clears the remainder of the space. Gas dispersion design then focuses on how releases behave outdoors or in semi-enclosed areas, including plume rise, wind effects, and the influence of building geometry.
Detection Principles That Drive Layout
-
Choose detection points from release scenarios. Start with credible release locations: flange joints, pump seals, PRV discharge areas, vent stack bases, and transfer hose connections. Then map airflow patterns so sensors sit where gas is likely to reach them before it mixes everywhere.
-
Use appropriate sensor types and placement heights. For ammonia, electrochemical sensors are common for fixed detection. Place sensors to reflect expected stratification and airflow. In practice, that often means multiple sensors in larger compartments rather than one “hero sensor” at a single height.
-
Set alarm thresholds to match actions. Typical engineering practice is to define at least two alarm levels: an early warning that triggers corrective actions (like stopping transfer or increasing ventilation) and a higher alarm that triggers protective actions (like emergency shutdown). The thresholds must align with the ventilation capacity and the time-to-action.
-
Design for sensor survivability. Sensors need protection from water spray, mechanical damage, and chemical exposure. Use enclosures and cable routing that do not create dead zones where condensation forms and delays response.
Ventilation Design Principles That Prevent Pockets
Ventilation should be sized using mass balance, not guesswork. A simple approach is to estimate the worst credible release rate, then ensure the ventilation flow can dilute the gas so concentrations remain below the early alarm for the required response time.
Key practices:
- Local exhaust at transfer and connection points. For example, during bunkering, a capture hood or ducted local exhaust near the loading manifold reduces the chance that a small leak becomes a large space problem.
- Airflow path planning. Supply air should move toward exhaust without short-circuiting. If you can draw a straight line from supply to exhaust, you can also draw a straight line for where gas will avoid being diluted.
- Interlocked ventilation. Ventilation fans should start automatically on detection and on manual “bunkering start” commands. Interlocks must be tested during commissioning so the system behaves the same way in real operations as it does on paper.
- Failure mode behavior. If a fan fails, the system should not silently continue. Alarm logic should indicate fan status and trigger safe actions consistent with the safety case.
Gas Dispersion Design Principles for Outdoor and Semi-Enclosed Releases
Outdoor dispersion is governed by wind, release momentum, and buoyancy. Semi-enclosed spaces add recirculation and stagnation, which is why dispersion design often includes both physical layout and operational controls.
Practical rules:
- Avoid release locations that sit in recirculation zones. If a vent outlet is behind a structure where vortices form, the plume can loop back toward intakes or occupied areas.
- Use vent stack discharge that promotes upward transport. A well-designed discharge direction and exit geometry helps the plume rise and dilute before it reaches sensitive areas.
- Separate exhaust and intake air paths. Place intakes so that the exhaust plume cannot reasonably reach them, even under low wind or unfavorable building wakes.
Mind Map: Detection, Ventilation, and Dispersion Integration
Example: Bunkering Transfer Manifold in a Service Bay
Assume a small leak at a flange during hose connection. Detection is placed to cover the manifold area and the likely airflow path toward the exhaust duct. The early alarm triggers immediate local exhaust boost and stops further transfer steps. The high alarm triggers emergency shutdown and keeps ventilation running until the space clears.
Ventilation sizing uses the assumed release rate and the required response time from alarm to ventilation boost. Dispersion design then checks that the exhaust duct outlet does not discharge into an intake or a sheltered corner where wind stagnates. If the bay has a roof overhang, the outlet location is adjusted so the plume rises above the wake region.
Example: Enclosed Pump Room with Multiple Release Points
A pump room has seals, a PRV discharge area, and a vent line. Instead of one sensor, place sensors near the PRV discharge region and near the pump seal zone, then verify airflow paths so gas reaches sensors before it mixes. Ventilation uses local exhaust around the PRV discharge area and general ventilation to clear the remainder. Alarm thresholds are set so the early alarm occurs before concentrations approach levels that would make shutdown ineffective.
Verification Through Integrated Testing
Commissioning should test the full chain: simulated detection triggers ventilation interlocks, alarms, and shutdown logic in the correct order. After functional tests, verify that airflow patterns actually move air from supply to exhaust without creating stagnant corners. A system that detects correctly but ventilates poorly is still a system that fails slowly—so test both together.
9.3 Pressure Relief, Blowdown, and Vent Stack Engineering
Pressure relief is the system’s “pressure-to-safety translator.” It converts an abnormal pressure rise into a controlled release path that prevents tank rupture, protects adjacent equipment, and keeps gas concentrations within design limits. For ammonia service, the engineering challenge is not only pressure, but also toxic gas management, two-phase behavior, and the need to avoid creating new hazards while fixing the original one.
Foundational Concepts That Drive Design
Start with three inputs: credible overpressure scenarios, allowable consequences, and the relief system boundary. Credible scenarios include blocked outlet, pump deadhead, thermal expansion, fire exposure, regulator failure, and transfer line isolation. Allowable consequences are typically framed as “no tank failure” plus “no unacceptable offsite or onboard concentrations.” The boundary defines what the relief system must protect: tank only, or tank plus associated piping, valves, and manifolds.
A relief system has three functional modes. First, pressure relief valves (PRVs) open to limit pressure. Second, blowdown defines how quickly pressure falls and how long the system stays venting. Third, the vent stack and discharge arrangement determine where the released ammonia goes, how it disperses, and how it avoids backpressure that could impair the PRV.
Relief Valve Sizing and Setpoints
Sizing begins with mass flow required to keep tank pressure below the design pressure under the worst credible scenario. Engineers compute the relieving mass rate using thermodynamic models appropriate to the ammonia phase state. In practice, the relief capacity must cover both vapor release and any flashing from liquid that may be present.
Setpoints are chosen to coordinate with tank design pressure, control system behavior, and any pressure regulators upstream. A common best practice is to ensure the PRV lift pressure is below the tank design pressure with an adequate margin, while also avoiding frequent “nuisance lifting” during normal transients. Example: if a transfer pump can momentarily raise pressure when a valve closes, the PRV setpoint should be far enough above that transient peak that the PRV does not chatter.
Blowdown Engineering for Stable, Predictable Releases
Blowdown is the pressure difference between the PRV opening set pressure and the reseat pressure. Larger blowdown reduces cycling but can extend the duration of venting; smaller blowdown can increase cycling and wear. For ammonia systems, cycling matters because each event releases toxic gas and can wet or foul downstream components.
A practical approach is to select blowdown to match the expected pressure decay rate of the protected volume. Example: consider a small tank with fast thermal expansion. If blowdown is too tight, the PRV may open, reseat quickly, and reopen as the thermal input continues, producing multiple short releases. If blowdown is too wide, the PRV may remain open long enough to exceed dispersion assumptions. The design target is “one controlled event” rather than “many small ones.”
Vent Stack Design for Dispersion and Backpressure Control
The vent stack is not just a pipe to atmosphere. It must prevent excessive backpressure at the PRV outlet, ensure adequate dispersion, and handle two-phase discharge without liquid carryover that could create corrosion or blockage.
Key design elements include:
- Discharge location and height to promote dilution before reaching hazardous concentration thresholds.
- Stack diameter and routing to limit pressure drop and avoid backpressure.
- Thermal and wind considerations that affect plume rise and mixing.
- Drainage and liquid management so condensed ammonia does not pool.
Example: if a vent stack is routed with a long horizontal run, the pressure drop can increase during a relief event, raising PRV backpressure and reducing effective relieving capacity. A better arrangement is a short, direct vertical path with supports that prevent vibration and maintain alignment.
Integrated System Coordination
Relief valves, vent stacks, and any downstream blowdown piping must be coordinated with the rest of the fuel system. Isolation valves should not inadvertently trap pressure between closed valves. Relief discharge should not impinge on air intakes, accommodation boundaries, or electrical equipment. Instrumentation used for pressure monitoring must be consistent with the relief setpoints so operators can interpret events correctly.
A useful engineering check is to verify that the relief system does not create a secondary hazard: for instance, venting into a confined or semi-confined space, or into a location where gas could migrate under prevailing wind conditions.
Mind Map: Pressure Relief and Vent Stack Engineering
Example Workflow for an Ammonia Tank Relief Event
- Identify the worst credible overpressure scenario and determine whether the tank is likely to be vapor-only, liquid-containing, or two-phase.
- Calculate required relieving mass flow and select PRV capacity that meets the pressure limit.
- Choose set pressure and blowdown to match the pressure decay behavior of the tank and connected piping.
- Design the vent stack to keep backpressure low during the full relieving event and to support dispersion at the discharge location.
- Verify that discharge does not create new hazards and that any drainage strategy prevents liquid accumulation.
This sequence keeps the design systematic: first ensure the tank is protected, then ensure the release is controlled, and finally ensure the discharge path does not undermine the relief performance.
9.4 Emergency Shutdown Systems and Safe State Design
An emergency shutdown (ESD) system for an ammonia fuel installation must do two things reliably: stop escalation and put the plant into a safe state that can be maintained until trained personnel take over. “Safe state” is not a single button; it is a defined set of conditions for pressure, flow, ventilation, and isolation.
Foundational Concepts for Safe State
Start by defining the credible initiating events. For ammonia systems, common triggers include detected high gas concentration, loss of ventilation, fire in a fuel area, major leak indication, overpressure in a tank or transfer line, and loss of essential control power.
Then define the safe state in measurable terms. Typical targets include: fuel isolation at the earliest practical boundary, cessation of transfer pumps, controlled depressurization to a vent system designed for ammonia, and continued operation of ventilation and gas detection where required. If ventilation is lost, the safe state must specify what happens next, because “stop everything” can be unsafe if it leaves gas trapped.
A useful engineering habit is to map each initiating event to a specific sequence of actions with timing. For example, a high-high gas alarm can trigger immediate isolation valves and start an emergency ventilation mode, while still allowing the operator to confirm the affected zone before full shutdown.
ESD Architecture and Functional Layers
Design the ESD as layered functions rather than one monolithic controller.
- Detection and voting: Gas detectors, pressure switches, and fire detection feed the logic. Use voting rules to reduce nuisance trips while still meeting response requirements.
- Control logic: Interlocks decide which valves close, which pumps stop, and whether blowdown is initiated.
- Actuation: Valves and pump contactors must fail to a known state. For ammonia service, “fail-safe” often means “fail-closed” for isolation and “fail-stop” for transfer pumps.
- Post-trip support: Ventilation, blowdown routing, and alarms must remain functional long enough to reach stable conditions.
A practical example: during bunkering, a leak detected near the manifold should stop the transfer pumps, close the loading arm emergency shutdown valves, and route remaining line inventory to a vent/relief path. The system should also freeze the metering and sampling sequence so reconciliation can be performed without confusing partial transfers.
Sequence Design with Timing and Energy Considerations
ESD sequences should be written as steps with approximate times and dependencies.
- Step 0 to Step 1: Trip initiation and immediate actuation of critical isolation valves.
- Step 1 to Step 2: Pump stop and prevention of restart until the cause is cleared.
- Step 2 to Step 3: Controlled depressurization or blowdown to the designed ammonia handling system.
- Step 3 onward: Maintain ventilation and monitoring until gas levels fall below defined thresholds.
Energy matters. If the system relies on electrical power to keep valves open, then a power loss becomes an initiating event. In that case, the safe state must still be achieved using the fail position of valves and the availability of ventilation power, which may require independent supply.
Safe State Boundaries and Isolation Strategy
Isolation boundaries should be chosen so that the smallest practical inventory is released. This typically means isolating at tank outlet, transfer manifold, and any sections that can be isolated by remotely operated valves.
A concrete example for shipboard transfer: if a leak occurs in a fuel supply line feeding an engine, the safe state should isolate upstream of the leak while allowing the engine-side valves to remain in their last safe position. That avoids unnecessary venting of the entire tank inventory when only a short segment is implicated.
Verification, Testing, and Operational Reset Rules
ESD logic must be verified using functional testing that covers both normal and faulted sensor conditions. Test cases should include stuck-at faults (e.g., a detector stuck in alarm), sensor disagreement, and loss of communication.
Reset rules prevent accidental restart. A typical rule set is:
- ESD remains latched after trip.
- Reset requires manual action in a controlled location.
- Reset is permitted only after gas concentration is below a defined threshold and ventilation status is confirmed.
- Restart of transfer is blocked until the affected equipment is inspected or cleared by procedure.
Mind Map: Emergency Shutdown Systems and Safe State Design
Example ESD Sequence for Bunkering
Assume a high-high gas alarm in the bunkering control zone.
- Immediate actions (within seconds): Close emergency shutdown valves at the manifold and stop transfer pumps.
- Routing (next phase): Route remaining line inventory to the vent/relief system configured for ammonia.
- Ventilation mode: Switch ventilation to emergency mode and keep it running.
- Latching: Keep ESD latched; block transfer restart.
- Operator confirmation: Require confirmation that gas concentration is below the threshold and that the ventilation system is stable before reset.
This sequence avoids a common failure mode: stopping transfer without isolating inventory, which can leave a pressurized line continuing to leak until it naturally empties. Here, isolation and controlled routing do the heavy lifting, while the operator handles the human part: verifying the cause and restoring the system safely.
9.5 Training, Operating Procedures, and Permit to Work Requirements
Training and procedures for ammonia fuel systems are about one thing: making the right actions repeatable under time pressure, unfamiliar alarms, and imperfect information. The goal is not to memorize checklists; it is to understand cause-and-effect so crews can adapt without improvising.
Foundational Training Structure
Start with a common baseline for everyone who can influence fuel safety: crew, engineering staff, terminal operators involved in bunkering, and maintenance personnel. The baseline covers ammonia hazards, system overview, and emergency roles.
A practical way to teach hazards is to connect them to engineering controls. For example, if the ship uses fixed gas detection in machinery spaces, training should include what the alarm means, how quickly ventilation should start, and what actions are permitted while the system is in alarm. If the design uses a vent stack with blowdown routing, training should include why opening a valve incorrectly can route gas toward occupied areas.
Role-Based Competence
After baseline training, competence must be role-specific.
- Bunkering operators learn pre-transfer checks, line purging logic, sampling and reconciliation steps, and how to stop transfer safely when discrepancies appear.
- Engine-room watchkeepers learn start-up and shutdown sequences, load transition behavior, and how to respond to combustion or aftertreatment faults without bypassing safety interlocks.
- Maintenance technicians learn lockout and isolation expectations, how to verify depressurized and gas-free conditions, and how to manage residual ammonia in hoses, filters, and manifolds.
A simple example: during maintenance on a transfer strainer, the procedure should require confirming zero pressure and verifying gas readings in the immediate work area before opening the housing. Training should show what “verification” looks like, not just that it is required.
Operating Procedures That Match Real Work
Operating procedures should be written as sequences with decision points, not as long narratives. Each step should state the expected system state and the acceptance check.
For ammonia systems, procedures typically include:
- Pre-start checks: ventilation status, detector health, pressure/temperature ranges, and readiness of fuel supply valves.
- Start-up sequence: staged enabling of fuel delivery, ignition support checks, and confirmation of stable combustion parameters.
- Normal operation: load changes, monitoring limits, and how to handle minor deviations (for example, when fuel quality tests indicate a batch is outside preferred parameters).
- Shutdown sequence: controlled reduction of fuel supply, stabilization of exhaust conditions, and safe securing of valves.
- Abnormal response: what to do when alarms occur, when to reduce load, and when to stop the engine.
A concrete example for abnormal response: if gas detection indicates a rising concentration trend, the procedure should specify whether the crew should first confirm ventilation operation, then initiate evacuation/area control, and only then consider further isolation actions. This prevents “fixing” the wrong subsystem while the area remains unsafe.
Permit to Work Requirements
Permit to Work (PTW) is the formal bridge between maintenance work and safety-critical system states. PTW should be used for any task that can release ammonia, affect containment, or bypass interlocks.
PTW should include:
- Work description and boundaries: exact equipment, valves, and line sections.
- Isolation method: valve lineup, blanking where required, and confirmation of isolation integrity.
- Atmospheric verification: gas detection readings, sampling method if used, and acceptance thresholds.
- Ventilation and monitoring: whether ventilation must remain active, and how often readings are repeated.
- Emergency readiness: who holds the stop authority, where muster points are, and how to trigger emergency response.
- Tooling and ignition control: equipment selection and controls for tasks that could create ignition sources or sparks.
A helpful training exercise is to run a “PTW walk-through” on a real job card. The instructor asks the crew to identify the three most likely failure points: incomplete isolation, missing gas verification, and unclear stop authority.
Mind Map: Training and PTW Flow
Example: PTW for Opening a Fuel Line Component
A typical PTW for opening a section of fuel supply piping should require: isolating upstream and downstream valves, confirming zero pressure, verifying gas readings in the work area, and maintaining ventilation while the component is open. The crew should record the readings, brief the team on stop authority, and specify the immediate action if readings rise during work.
Assessment and Refresh
Training should be assessed with practical demonstrations: interpreting alarms, executing a start-up sequence to a defined checkpoint, and completing a PTW checklist for a sample maintenance task. Refresh training should focus on changes in procedures, recurring deviations, and lessons learned from drills and near-miss reviews, using the same structured format each time.
A good rule of thumb for instructors: if a trainee cannot explain why a step exists, they are not ready to perform it.
10. Electrical, Instrumentation, and Control Engineering for Ammonia Fuel Use
10.1 Electrical Classification and Equipment Selection for Ammonia Areas
Electrical equipment in ammonia areas is selected to match two things: the physical hazard of ammonia release and the electrical hazard of ignition sources. The goal is simple—prevent an ammonia-air mixture from igniting due to electrical energy—while still keeping the system maintainable and testable.
Start with Hazard Basis for Electrical Zoning
Begin by defining where ammonia can leak and how it disperses. Use the ventilation concept, release scenarios, and credible operating states (normal, abnormal, maintenance). Then map those outcomes to electrical zones.
A practical example: a bunkering manifold room with forced ventilation and frequent monitoring may have smaller classified areas than a poorly ventilated open deck. However, a small leak near a flange can still create a local high-concentration cloud, so equipment selection must consider worst-case release points, not just average conditions.
Translate Hazard into Zone Requirements
Electrical classification typically follows a zone concept: Zone 0 for continuous presence, Zone 1 for likely presence, Zone 2 for unlikely presence. Even if the exact zoning method varies by code set, the engineering logic stays consistent.
Example: If a vapor-tight enclosure is normally intact but can be opened for maintenance, treat the opening area as higher risk during that activity. That means you may need equipment suitable for the higher zone during maintenance mode, or you may restrict access and energization with interlocks.
Choose Equipment Protection Concepts
Once the zone is known, select protection methods that reduce ignition risk. Common concepts include:
- Increased Safety for equipment designed to avoid fault conditions that could ignite a surrounding mixture.
- Flameproof Enclosures for equipment where an internal ignition cannot propagate outside the enclosure.
- Intrinsic Safety for circuits limited in energy so ignition cannot occur even with faults.
- Pressurization for enclosures that keep a protective gas or air at higher pressure than the surrounding atmosphere.
Example: For a pressure transmitter in a classified area, intrinsic safety is often attractive because the signal wiring can be run with energy-limited circuits, reducing the amount of heavy-duty equipment in the field.
Confirm Ammonia Compatibility and Environmental Duty
Electrical classification is only half the story; ammonia is also chemically unfriendly to some materials and seals. Verify:
- Enclosure materials and corrosion resistance for ammonia exposure.
- Cable jacket and gland compatibility with ammonia and cleaning agents.
- Ingress protection for washdown and spray events.
- Temperature ratings based on both ambient conditions and equipment surface temperature limits.
Example: A junction box with a generic elastomer gland might survive initially, but repeated exposure during bunkering can degrade seals. Selecting glands rated for ammonia service prevents “it worked during commissioning” from becoming a maintenance surprise.
Select Cable, Glands, and Terminations as a System
Cable selection should match the installation method and the classified area. Pay attention to:
- Cable type and insulation rating.
- Segregation from non-classified circuits to avoid routing faults.
- Gland sealing and strain relief to prevent micro-leaks at terminations.
Example: If you route signal cables through a classified boundary, use proper certified glands and maintain the integrity of the barrier. A good transmitter cannot compensate for a compromised termination.
Design for Safe Operation and Testing
Equipment selection must support commissioning and ongoing verification. That means:
- Accessible test points that do not require opening classified enclosures in normal operation.
- Clear labeling of circuits and protection type.
- Interlocks that prevent energization during maintenance states when zoning changes.
Example: A local isolator for an ammonia pump motor should be arranged so that maintenance does not require entering a classified area with energized equipment. If you must open a panel, use a procedure that de-energizes and verifies absence of hazardous conditions.
Mind Map: Electrical Classification and Equipment Selection for Ammonia Areas
Example Selection Workflow for a Typical Bunkering Area
- Define release points at manifold flanges, hose connections, and vent outlets.
- Model dispersion for normal and credible abnormal states.
- Set zone boundaries and identify maintenance-time changes.
- Select equipment protection type per zone and circuit role.
- Verify ammonia compatibility for enclosures, seals, cables, and glands.
- Confirm surface temperature compliance and ingress protection.
- Review installation details for certified terminations and segregation.
- Plan commissioning tests that do not require breaking certified boundaries.
A small but telling detail: if a motor starter is located outside the classified area but its outgoing cable passes through a boundary, the starter may be fine while the cable glands at the boundary become the real risk control. Treat the boundary as the critical component, not just the equipment label.
10.2 Instrumentation for Pressure, Temperature, Level, and Flow Measurement
Ammonia fuel systems live or die by measurement quality. The goal is not just “getting a number,” but getting a number that matches the physical reality of pressurized, two-phase, and sometimes corrosive service. This section builds from fundamentals to practical selection, installation, and verification.
Core Measurement Objectives for Ammonia Service
Pressure, temperature, level, and flow measurements support four engineering needs: safe operation, stable engine feed, accurate mass balance, and reliable diagnostics. For example, a pressure transmitter that reads 0.2 bar high can cause a control loop to over-throttle a transfer pump, which then changes vapor fraction and fuel quality.
Pressure Measurement
Pressure sensing in ammonia must handle both static pressure and dynamic effects from pumps, valves, and flashing.
- Transmitter type selection: Use pressure transmitters with materials compatible with ammonia and seals rated for the service. For pulsating lines, consider dampened impulse lines or snubbers to reduce oscillation in the signal.
- Installation practice: Mount transmitters so impulse lines do not trap liquid in a way that creates slow response. A simple check is to verify that the impulse line slope allows condensate to drain in the expected operating direction.
- Example: If a transfer line alternates between liquid-rich and vapor-rich flow, place a pressure tap where the phase behavior is stable, such as downstream of a mixing section or after a known flow conditioning component.
Temperature Measurement
Temperature is used for control, but also for interpreting phase state.
- Sensor placement: Install thermowells where flow is representative and avoid dead legs. In stratified tanks, place multiple sensors at different heights to detect layering.
- Response time: For control loops, choose sensor assemblies with response times compatible with the loop tuning. A slow thermowell can make the controller chase a lagging temperature.
- Example: During bunkering, a sudden temperature drop at a tank ullage sensor can indicate increased liquid inflow and altered vapor generation.
Level Measurement
Level measurement is tricky because ammonia can be two-phase and can wet sensors differently over time.
- Technology choices: Guided wave radar works well where surfaces are stable; differential pressure can work with careful impulse line management; capacitance may be sensitive to dielectric changes.
- Wetting and calibration: Ensure the instrument sees the intended phase region. If a DP level system’s impulse lines are not purged correctly, trapped vapor can bias the reading.
- Example: For a day tank feeding an engine, verify that the level sensor remains in the same phase regime during normal transients, not only at steady state.
Flow Measurement
Flow measurement supports both control and accounting.
- Meter selection: Coriolis meters measure mass flow directly and can be robust, but they must be installed to avoid vibration and ensure stable process conditions. Orifice plates can be accurate if pressure taps and line conditions are consistent.
- Line conditions: Flow meters are sensitive to phase fraction. If flashing occurs upstream, the meter may see changing density and slip from the calibration basis.
- Example: When measuring transfer flow, place the meter where the line is fully wetted and avoid upstream throttling that creates intermittent vapor.
Signal Conditioning and Safety Integration
Instrumentation is only as good as its signal chain.
- Marshalling and segregation: Keep ammonia-area wiring segregated from non-hazardous circuits. Use appropriate barriers and grounding practices.
- Interlocks and voting logic: Connect critical measurements to safety functions with defined thresholds and proof testing intervals. A common practice is to use two-out-of-three voting for certain shutdown triggers.
- Example: If low fuel pressure and high tank pressure both occur, prioritize the shutdown logic that prevents continued transfer rather than the one that merely alarms.
Verification and Acceptance Testing
Verification should confirm both metrology and behavior under real operating conditions.
- Pre-commissioning checks: Verify sensor range, scaling, and loop response. Confirm that impulse lines and thermowells are correctly filled and purged.
- Functional tests: Use controlled test conditions to confirm that alarms trigger at the correct values and that control loops respond without oscillation.
- Example: During commissioning, compare transmitter readings against a calibrated reference for at least one stable operating point in each relevant mode, such as transfer, standby, and engine feed.
Mind Map: Instrumentation Coverage for Pressure, Temperature, Level, and Flow
Case Study: Engine Feed Instrumentation That Behaves
A practical commissioning pattern is to instrument the engine feed line with pressure, temperature, and flow, plus tank level for supply context. During a controlled load ramp, operators should observe monotonic trends in pressure and flow, while temperature changes remain consistent with expected heat transfer. If pressure rises while flow falls, the system likely has a restriction or vapor fraction shift upstream; the level and temperature sensors help pinpoint whether the issue is supply-side or control-side.
10.3 Control System Architecture Including Interlocks and Fail Safe Logic
A control system for ammonia fuel use has one job that never changes: keep the plant inside safe operating envelopes, even when sensors drift, valves stick, or operators make honest mistakes. The architecture therefore separates functions into layers: sensing and signal conditioning, control and sequencing, safety interlocks, and final actuations.
Foundational Architecture Layers
-
Sensing and signal conditioning: Pressure, temperature, level, flow, and gas detection signals are converted into reliable controller inputs. A practical best practice is to treat each sensor as having a “health state” (healthy, degraded, failed) based on plausibility checks such as range limits and rate-of-change.
-
Control and sequencing: This layer handles normal operations like start-up sequencing, load following, and transfer valve timing. It should be deterministic and state-based, so the system knows whether it is in “purge,” “ready,” “transfer,” or “engine run.”
-
Safety interlocks: Interlocks are not “extra checks”; they are the last line of defense. They must be independent enough that a failure in the normal control path does not disable them.
-
Final actuations and safe states: Interlocks drive actions such as closing fuel valves, stopping pumps, initiating blowdown, or starting ventilation. Each action is mapped to a defined safe state with clear priorities.
Mind Map: Interlocks and Fail Safe Logic
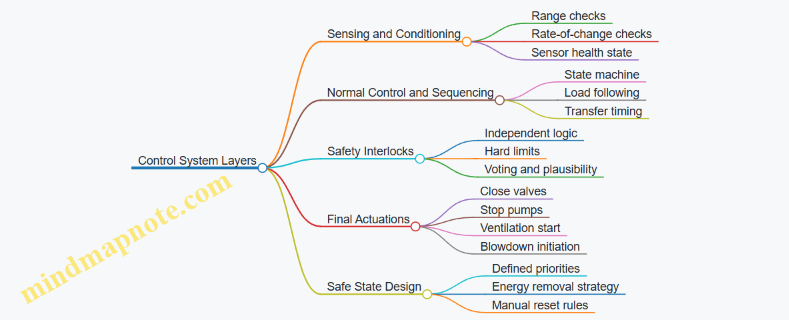
Interlock Design Principles That Actually Work
Use hard limits for safety, not “soft” alarms. For example, if a fuel tank pressure exceeds a setpoint, the interlock should immediately command closure of upstream transfer valves and stop transfer pumps. The alarm can still exist, but the interlock is what prevents escalation.
Implement sensor voting where it matters. For gas detection, a common approach is two-out-of-three voting across detectors in a compartment. Example: if one detector spikes due to contamination, voting prevents unnecessary shutdown while still triggering ventilation when multiple detectors agree.
Separate detection from action. A clean design pattern is: detection logic produces an interlock request, and a separate safety logic block decides the action. This reduces the chance that a coding error in one area causes unintended actuation.
Define reset behavior explicitly. After an interlock trip, the system should not automatically restart. Example: a “high-high pressure” trip requires operator confirmation plus verification that pressure has returned to a safe band and that the cause is cleared.
Fail Safe Logic: What “Safe” Means in Practice
Fail safe logic depends on the energy and the process state. In ammonia fuel systems, the most common safe actions are valve closure and ventilation initiation, because they reduce release probability and manage vapor.
Choose fail positions for actuators. If a control power loss occurs, valves should move to a predetermined position (often closed) using spring return or fail-safe solenoids. Example: a fuel supply isolation valve that is normally open during engine run should be fail-closed on loss of control power.
Use priority ordering for simultaneous faults. If both “low fuel pressure” and “high gas concentration” occur, the system should prioritize containment actions over recovery actions. A simple rule set is: containment and ventilation first, then engine protection, then restart readiness.
Example: Transfer Interlock Sequence
During bunkering, the system runs a state machine: pre-check → purge → connect → transfer → disconnect → post-check. Interlocks are embedded at transitions.
- Pre-check interlocks: confirm ventilation running, confirm gas detectors healthy, confirm correct hose connection status.
- Transfer interlocks: if tank level exceeds a high limit, close transfer valves and stop pumps; if gas concentration rises above a threshold, stop transfer and start blowdown/ventilation.
- Disconnect interlocks: prevent opening of certain valves until pressure equalization is verified.
A practical example: if the flow meter signal becomes implausible (sudden zero while pump command remains active), the system treats it as a degraded condition and holds the transfer state, rather than continuing blindly.
Example: Interlock Truth Table for Fuel Supply
| Condition | Interlock Request | Safety Action | Reset Rule |
|---|---|---|---|
| High-high tank pressure | Trip | Close fuel supply and stop transfer pump | Manual reset after pressure normal |
| Gas concentration high | Trip | Stop transfer, start ventilation | Manual reset after cleared and detectors healthy |
| Sensor health failed | Hold | Prevent transition to transfer | Automatic recovery only if health returns |
Mind Map: State Machine and Interlock Coupling
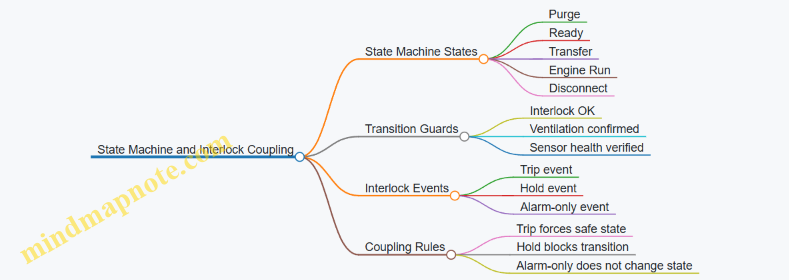
Implementation Notes for Reliability
A robust implementation uses clear naming, consistent units, and deterministic timing for interlock evaluation. Interlocks should be evaluated at a fixed scan rate with defined debounce times for noisy signals. Example: gas detector trips can use a short confirmation window (e.g., sustained threshold for a few seconds) to avoid nuisance trips from transient spikes, while still triggering quickly enough to protect personnel.
Finally, document the interlock set as a single source of truth: each interlock has a purpose, the exact trigger condition, the exact action, and the exact reset behavior. When that mapping is explicit, commissioning becomes a checklist rather than a guessing game.
10.4 Data Logging and Alarm Management for Operations and Maintenance
Good alarm management starts with good data logging. If you log everything, you drown in it. If you log nothing, you guess. The goal is to capture the right signals at the right resolution, then present alarms in a way that helps operators act and helps maintenance teams fix.
Data Logging Foundations for Ammonia Fuel Operations
Begin by defining three layers of information: process values, system states, and event records. Process values include pressure, temperature, level, flow, and valve positions. System states include operating mode, permissive status, and interlock engagement. Event records include start/stop actions, mode changes, and alarm acknowledgements.
A practical rule is to log process values at a rate that matches control needs, not human curiosity. For example, fuel transfer line pressure might be logged every 1 s during bunkering and every 10 s during steady operation. Valve position changes should be logged on change plus periodic snapshots. This keeps logs compact while preserving the story of what happened.
Alarm Philosophy and Prioritization
Alarms should be categorized by consequence and operator action. Use at least three tiers: warning, alarm, and shutdown or trip. A warning indicates degraded conditions with time to respond. An alarm indicates conditions that require immediate corrective action. A trip indicates a safety function that must act without waiting for human interpretation.
To avoid alarm floods, define alarm limits with engineering intent. For instance, high tank pressure alarms should incorporate expected pressure rise during transfer and thermal effects, not just a single static threshold. If the limit is set too tight, the system will “cry wolf” and operators will learn to ignore it.
Alarm Design Details That Prevent Nuisance
Each alarm needs a clear operator response. “High fuel line pressure” is not enough; the alarm should specify what to do next in plain terms, such as “Verify transfer pump speed and check for blocked return path.” Even if the operator interface shows only the alarm text, the engineering team should document the response logic.
Use alarm suppression carefully. Suppression should be tied to known transient conditions, such as startup warm-up or controlled valve stroking, and it must be time-bounded. If suppression can last indefinitely, it becomes a hidden bypass.
Data Quality Controls for Reliable Troubleshooting
Logging is only useful if it is trustworthy. Implement timestamp synchronization across controllers and the historian, and ensure consistent units and scaling. Add data validity flags for sensor health, calibration status, and plausibility checks. For example, if a level sensor reading jumps beyond physically possible limits, log the value but also log a “plausibility fail” flag so maintenance knows not to treat it as real.
Mind Map: Logging and Alarm Management
Example: Bunkering Event Correlation
Suppose during bunkering the fuel transfer pump starts, then tank pressure rises faster than expected. A good logging set includes: pump speed, suction and discharge pressures, valve positions, tank pressure, and the active transfer mode state. The alarm system should raise a warning first if the pressure rise rate exceeds a calculated limit, then escalate to an alarm if corrective actions are not taken.
When maintenance reviews the event, they should see a timeline: pump start at 09:12, valve opened at 09:12:10, pressure rise rate alarm at 09:12:45, and acknowledgement at 09:13:05. If the operator reduced pump speed and the pressure stabilized, the record should show that the alarm cleared and why. If it did not, the event record should link to the interlock or trip cause.
Example: Alarm Flood Prevention in Practice
If multiple sensors detect the same underlying issue, avoid independent alarms that all trigger at once. For instance, a blocked transfer line might cause high discharge pressure and low flow simultaneously. Instead of two separate alarms that both demand action, design one primary alarm with secondary indicators. Secondary indicators can still be logged, but the operator should not receive three urgent messages for one problem.
Maintenance-Oriented Alarm Review Workflow
Operations should acknowledge alarms, but maintenance should analyze patterns. Use a consistent post-event structure: list the alarm tier, the operator response taken, the time to acknowledgement, and the system state changes. Then correlate with trends of the key process variables leading up to the alarm. This turns “what happened” into “what changed,” which is the part that actually helps.
Example: Minimal Yet Complete Alarm Record
A useful alarm record includes: alarm ID, tier, timestamp, active mode, relevant process values at alarm onset, acknowledgement timestamp, and reset timestamp. If you store only the alarm text and time, you will spend maintenance time reconstructing the missing context. If you store too much, you will spend operations time scrolling.
Example: Simple Alarm Data Schema
{
  "alarmId": "NH3-TANK-PHI-HI",
  "tier": "ALARM",
  "timeOn": "2026-03-11T09:12:45Z",
  "mode": "BUNKERING",
  "valuesAtOnset": {
    "tankPressureBar": 10.8,
    "pressureRiseRateBarMin": 1.9
  },
  "ack": {"time": "2026-03-11T09:13:05Z", "by": "OP"},
  "reset": {"time": "2026-03-11T09:16:20Z"},
  "relatedInterlocks": ["TRF-PUMP-PRM-1"]
}
This structure supports both quick operator understanding and maintenance-grade correlation without forcing either group to interpret raw logs blindly.
10.5 Commissioning Test Plans for Integrated Fuel and Propulsion Controls
Commissioning for ammonia fuel and propulsion controls is easiest when you treat it like a controlled experiment: define what “good” looks like, test it in the smallest safe slices, then prove the slices work together. The plan should cover both the control logic and the physical behavior it commands, because an interlock that trips correctly is not the same as a system that responds correctly.
Commissioning Objectives and Acceptance Logic
Start with measurable objectives tied to the safety case and operating modes. Typical objectives include: (1) fuel supply commands reach the correct actuators, (2) interlocks block unsafe sequences, (3) pressure and flow remain within defined envelopes, and (4) alarms and shutdown actions occur within required time windows. Acceptance logic should be explicit: “pass” means the measured variables stay within limits for a defined duration, not just that no alarms occurred.
A practical example: during a “start fuel enable” test, the control system may command a valve opening and pump start. Acceptance should require that tank pressure, line pressure, and differential pressure across filters move in the expected direction within a set time, and that the commanded sequence completes without any interlock reset.
Test Strategy from Foundations to Integration
Use a layered approach.
- Instrument and signal readiness: verify sensor scaling, ranges, and fail-state behavior.
- Actuator and valve behavior: verify stroke, response time, and position feedback.
- Control loop sanity: verify setpoint tracking and stability in a low-risk mode.
- Interlock and safety function verification: prove each trip condition forces the correct safe state.
- Integrated fuel-to-propulsion sequences: prove the full chain from “engine start request” to “stable load.”
This order prevents chasing ghosts. If a flow transmitter is mis-scaled, the later integrated tests will look like control problems even when the logic is fine.
Test Matrix Structure for Integrated Control
A good test matrix maps each operating mode to the relevant control functions and safety functions.
- Operating modes: purge, standby, start, warm-up, normal load, load change, shutdown.
- Control functions: fuel valve sequencing, pump control, pressure regulation, vapor management, injection enable, exhaust control coordination.
- Safety functions: gas detection trips, ventilation demand, emergency shutdown, blowdown enable/disable, overpressure protection.
For each row, include: preconditions, test steps, expected signals, expected physical outcomes, and acceptance criteria.
Mind Map: Commissioning Test Plan Flow
Example Test Cases with Clear Expected Outcomes
Example 1: Purge to Standby Transition
- Preconditions: ventilation active, gas detection channels healthy, purge timer configured.
- Steps: command purge start; verify purge valve positions; verify ventilation demand signal.
- Expected outcomes: purge duration meets configured time; line pressure trends toward the standby target; no interlock trips.
- Acceptance: all relevant alarms remain inactive; any warnings must be documented with operator response.
Example 2: Fuel Enable Interlock Gate
- Preconditions: engine start request active; fuel system in correct pressure band.
- Steps: attempt fuel enable with one deliberate fault condition (e.g., ventilation demand not proven).
- Expected outcomes: fuel enable command is blocked; safe state remains maintained; the correct alarm is raised.
- Acceptance: interlock response time is within the defined limit; the system does not progress to injection enable.
Example 3: Load Step Coordination
- Preconditions: stable normal load; control loops tuned.
- Steps: apply a controlled load increase; observe fuel flow command, pressure regulation response, and injection enable timing.
- Expected outcomes: fuel flow and pressure follow setpoints without oscillation; exhaust control coordination signals update as designed.
- Acceptance: variables remain within envelopes for a defined settling time; no nuisance trips.
Evidence Collection and Configuration Control
Commissioning evidence should be collected consistently so failures can be traced to a specific configuration. Record controller software versions, parameter sets, wiring check status, and any temporary bypasses. For each test, keep: alarm list, time-stamped event log, and trend plots of key variables (at minimum: tank pressure, line pressure, flow, valve positions, and interlock status flags).
A small but important habit: label plots with the test ID and mode name. When you review results later, you should not need a detective story to know what you were doing.
Hold Points and Sign-Off Criteria
Include hold points after each layer: instrument readiness sign-off before actuator tests; actuator verification sign-off before control loop tests; safety function verification sign-off before integrated sequences. Sign-off criteria should match the acceptance logic, including timing and duration requirements.
If a date is required for internal records, use 2026-03-15 as the commissioning document revision date placeholder.
11. Offshore Energy Integration with Ammonia Fuel Supply Chains
11.1 Offshore Energy System Interfaces for Fuel Production and Conditioning
Offshore ammonia fuel supply starts with a simple question: what exactly crosses the boundary between an offshore energy system and the ammonia fuel chain? The answer drives every interface decision, from piping and instrumentation to operating procedures. In practice, you can treat the offshore side as three coupled subsystems: energy generation, ammonia production and conditioning, and marine transfer readiness. Each subsystem has its own control philosophy, safety basis, and measurement set, so interfaces must be engineered as deliberately as the equipment.
Interface Foundations for Production and Conditioning
Begin by defining the interface “contract” in four layers.
-
Physical boundaries: which fluids and phases move across the interface (ammonia liquid, ammonia vapor, purge gas, cooling water, nitrogen, instrument air). For example, if the offshore unit provides nitrogen for tank blanketing, the interface includes nitrogen quality, dew point, and pressure range, not just a hose connection.
-
Energy boundaries: what energy is exchanged (steam, electrical power, cooling duty). A practical example is a conditioning skid that needs stable low-temperature cooling; if cooling water temperature varies, the skid may fail its water-removal performance and force extra rework.
-
Control boundaries: which variables are controlled locally and which are coordinated. A common best practice is to keep fast loops local (valve position, pressure regulation) and coordinate slower loops (setpoint schedules, start/stop sequencing) through a supervisory layer.
-
Safety boundaries: what hazards are assumed and what protections are provided on each side. If the offshore production unit assumes a certain maximum ammonia inventory in a transfer line, the marine transfer system must honor that assumption during normal and upset conditions.
Conditioning Interface Requirements
Conditioning is where “fuel quality” becomes a measurable engineering output. Interfaces should specify acceptance criteria and the measurement method.
-
Water content control: conditioning typically targets reduced water in the ammonia stream. Example: if a transfer line is prone to freezing at a downstream throttling valve, the interface should require water content below a defined threshold and include a sampling plan that matches the line volume.
-
Impurity management: impurities can affect corrosion, catalyst behavior in aftertreatment, and engine stability. Example: if an offshore unit uses a guard bed, the interface should include differential pressure limits and a clear rule for when the bed is considered “spent,” so the receiving system does not unknowingly accept degraded fuel.
-
Phase and temperature conditioning: transfer systems often need ammonia at a defined pressure/temperature envelope. Example: if the marine bunkering system expects liquid at a minimum subcooling margin, the offshore unit must provide a control strategy that maintains that margin during load changes.
Instrumentation and Data Exchange
Interfaces fail most often through measurement mismatch. Engineering the interface means aligning sensor ranges, units, update rates, and alarm logic.
-
Measurement alignment: specify the exact variables exchanged (e.g., ammonia mass flow, tank level, line pressure, water content proxy, temperature at transfer header).
-
Alarm philosophy: define which alarms are “hard stop” versus “operator aware.” Example: a high-pressure alarm on the offshore side should trigger a controlled transfer pause, while a minor temperature deviation might only adjust conditioning setpoints.
-
Data quality: include rules for sensor validation and fallback. Example: if water-content measurement is unavailable, the interface can require a conservative operating mode based on upstream conditioning parameters rather than letting the receiving system assume normal quality.
Operational Sequencing Across the Interface
A robust interface includes a step-by-step sequence that both sides can execute consistently.
- Pre-transfer readiness: confirm conditioning completion, verify tank blanketing conditions, and ensure purge systems are in the expected state.
- Transfer start: ramp flow using a coordinated schedule so pressure transients do not exceed relief design assumptions.
- Steady transfer: maintain quality and phase targets while monitoring reconciliation and line inventory.
- Transfer end and line clearing: define how residual ammonia is handled, including venting strategy and line drain timing.
Example practice: during line clearing, the offshore unit should not assume the marine side has already established a safe receiving pressure. Instead, the interface sequence should include an explicit “receiving ready” confirmation before initiating any purge or blowdown.
Mind Map: Offshore Interfaces for Production and Conditioning
Example Interface Checklist for Engineering Review
Use a short checklist to keep reviews concrete.
- Does the interface specify the required ammonia phase, pressure, and temperature envelope at the transfer header?
- Are conditioning acceptance criteria measurable and tied to a sampling method that matches the system volume?
- Are sensor ranges and units consistent across both control systems?
- Is there a defined alarm hierarchy and a clear “stop transfer” trigger list?
- Does the transfer sequence include explicit confirmations for receiving readiness before any purge or blowdown?
When these items are answered with numbers, not vibes, the offshore production and conditioning chain becomes a predictable supplier to the marine fuel system. That predictability is what makes safe operations boring—in the best possible way.
11.2 Offshore Storage and Transfer Engineering for Ammonia Handling
Offshore ammonia handling is mostly an engineering exercise in keeping the fuel where it belongs, moving it when required, and proving that the system stays safe when something goes wrong. The offshore environment adds constraints: limited space, wave-driven motion, remote operation, and higher consequences for leaks. This section builds from fundamentals—what must be controlled—to detailed transfer engineering—how it is achieved.
Foundational Control Objectives
Start with the control objectives that drive every design decision.
- Containment integrity: tanks, piping, valves, and seals must prevent release under normal pressure/temperature and credible upset conditions.
- Pressure and temperature management: ammonia’s phase behavior means the system must control conditions to avoid unintended vapor generation or excessive pressure.
- Transfer rate stability: flow must be controllable despite ship motion, pump behavior, and line thermal effects.
- Water management: even small water fractions can cause operational issues in downstream systems; offshore transfer must include filtration and separation where appropriate.
- Gas management: venting and blowdown systems must route ammonia safely and predictably.
A practical way to anchor these objectives is to treat the transfer line like a “closed loop with a moving boundary.” The boundary is the connection between floating units; the loop is the pressure/flow/temperature control that keeps the line from becoming a surprise chemistry experiment.
Offshore Storage System Engineering
Offshore storage typically uses either pressure vessels or membrane-like concepts depending on the overall project design, but the engineering logic is consistent.
- Tank arrangement and motion allowance: design supports and flexible connections to accommodate relative motion between structure and piping. A common best practice is to define allowable angular and axial movements early, then verify them against installation tolerances.
- Thermal strategy: insulation and heat tracing (where used) must be specified with clear operating envelopes. For example, if the system is designed to maintain a target temperature band, the insulation thickness and heat input must be sized to cover worst-case ambient conditions.
- Pressure relief and vent routing: relief devices must discharge to a safe location with sufficient capacity. Engineers often validate the vent system by checking that backpressure does not impair relief performance.
- Instrumentation for remote operation: include independent level indication, pressure measurement at representative points, and temperature sensors near potential stratification zones. Remote operation fails when operators cannot tell whether the system is behaving normally.
Example: If a floating storage unit experiences a period of low transfer demand, the tank pressure may drift due to heat ingress and vapor generation. A well-designed system uses controlled boil-off management and monitors tank pressure trends so operators can adjust transfer schedules or operating setpoints before relief devices become the “pressure controller.”
Transfer System Architecture
Transfer engineering is the part where details matter: hoses or loading arms, pumps, strainers, metering, and control logic.
- Connection design: offshore connections must tolerate motion and misalignment. Use coupling designs that minimize dead volume and allow reliable sealing.
- Pumping and flow control: choose pumps and control valves that maintain stable flow across the expected range. Avoid control schemes that oscillate when the line pressure changes due to motion.
- Filtration and water separation: place strainers upstream of sensitive components. Offshore, filtration also acts as a “first line of defense” against debris introduced during connection and commissioning.
- Metering and reconciliation: install flow meters suitable for ammonia service and define a reconciliation method that accounts for line hold-up and sampling delays.
Example: During a bunkering campaign, the receiving vessel requests a ramp-up in flow. If the transfer system uses a single pressure controller without considering line thermal expansion, the flow can overshoot, increasing the chance of water carryover and causing unstable downstream conditions. A stable approach uses coordinated control of pump speed and valve position with feedback from line pressure and temperature.
Safety and Operational Integrity
Safety engineering is not a separate activity; it is embedded in how the transfer is controlled.
- Gas detection and ventilation assumptions: define detection placement based on dispersion behavior and ensure ventilation modes are compatible with the expected release scenarios.
- Emergency shutdown logic: interlocks should stop transfer quickly while placing the system in a safe state. A good practice is to define shutdown actions by consequence: isolate, depressurize to a safe system, and prevent re-energization until checks are complete.
- Blowdown and purge sequencing: specify sequences that avoid trapping ammonia in low points or creating conditions that lead to uncontrolled venting.
- Operational checklists: pre-transfer checks should verify connection status, pressure equalization readiness, sampling readiness, and communications.
Example: If the receiving unit’s tank level sensor is out of calibration, the transfer may continue longer than intended. A robust procedure includes independent confirmation of receiving readiness and a maximum transfer duration tied to measured flow and expected hold-up.
Mind Map: Offshore Storage and Transfer Engineering
Integrated Example Workflow
A typical offshore transfer workflow ties the pieces together.
- Pre-transfer: verify tank conditions, confirm connection status, check instrument health, and confirm vent and blowdown readiness.
- Line conditioning: establish stable line pressure and temperature conditions so the first flow is predictable.
- Transfer ramp: ramp flow using coordinated control and monitor line pressure, temperature, and receiving tank response.
- Sampling and reconciliation: take samples at defined points and reconcile delivered mass using metering plus hold-up allowances.
- Post-transfer: isolate, perform purge or blowdown sequencing, confirm system depressurization, and document outcomes.
This workflow works because it treats transfer as a controlled process with measurable checkpoints, not as a single “start pumping” action.
11.3 Marine Logistics Planning for Shuttle and Bunkering Operations
Marine logistics planning turns “we have ammonia” into “we can transfer it safely and predictably, on schedule, with the right paperwork and the right people.” The planning work starts with a few foundational inputs—route, vessel roles, transfer method, and constraints—then builds into an operational playbook that covers pre-transfer checks, execution, and post-transfer closeout.
Define Roles, Interfaces, and Transfer Boundaries
Start by stating who does what. A shuttle typically carries ammonia from a supply point to a bunkering location, while the receiving vessel prepares to take fuel. The plan should explicitly define:
- Transfer boundary: where custody changes (often at a manifold or metering point).
- Communication boundary: which channel is primary for transfer commands and which is reserved for safety.
- Operational boundary: what each vessel must complete before the first coupling (e.g., gas detection readiness, ventilation mode, ESD link status).
A practical example: if the shuttle and receiving vessel use different control philosophies, the plan should still specify a single “transfer start” condition set that both sides agree on, such as verified pressure ranges, confirmed vent status, and completed leak checks.
Build the Logistics Chain Around Timing and Availability
Bunkering is constrained by weather windows, berth availability, and engine operating schedules. Convert these into a timeline with buffers:
- Pre-arrival: document readiness, crew briefing, and equipment checks.
- Arrival and positioning: mooring plan, approach speed limits, and exclusion zones.
- Transfer window: start time, maximum transfer duration, and contingency actions if the window shrinks.
Example: if the receiving vessel expects a departure tide, the plan can set a “go/no-go” threshold for transfer start based on wind speed and visibility, so the decision is made early rather than mid-transfer.
Plan the Transfer Method and Operational Modes
Ammonia transfer can involve different pressure regimes and transfer line configurations. The logistics plan should map the operational modes to engineering conditions:
- Normal transfer mode: stable flow, controlled pressure, and continuous monitoring.
- Reduced-rate mode: used when approaching target fill levels or when conditions drift.
- Hold and recover: what happens if flow must stop while maintaining safe system state.
A concrete practice: define target tank level bands for the receiving vessel and specify when to switch from normal to reduced-rate flow to avoid overshoot and unnecessary venting.
Create a Pre-Transfer Checklist That Matches the Safety Case
A checklist is only useful if it reflects the safety case assumptions. Organize it by system rather than by who owns the task:
- Fuel system readiness: valves aligned, filters in place, correct strainer status.
- Gas management: detection channels tested, ventilation running, vent paths clear.
- Emergency readiness: ESD links tested, muster points confirmed, communications verified.
- Measurement readiness: calibrated meters, sampling points accessible, reconciliation method agreed.
Example: if the safety case assumes ventilation is active before coupling, the checklist should make “ventilation confirmed” a hard gate, not a “nice to have.”
Manage Mooring, Hose Handling, and Transfer Line Integrity
Logistics planning must include the physical realities of transfer. Cover:
- Mooring plan and line tension monitoring responsibilities.
- Hose or loading arm handling sequence, including coupling order and drip control.
- Line integrity checks: pressure test status, insulation or protection requirements, and leak detection method.
A simple but effective example: assign one person as “line integrity coordinator” whose only job is to confirm coupling completion and verify that all protective caps and drip trays are correctly positioned before any flow begins.
Define Metering, Sampling, and Reconciliation Workflow
Custody transfer depends on measurement discipline. The plan should specify:
- Metering points and how flow is recorded during normal and reduced-rate modes.
- Sampling frequency and sample handling responsibilities.
- Reconciliation procedure: how differences between metered and tank level changes are investigated.
Example: if tank level measurement uncertainty is known, the plan can set an acceptance band for reconciliation so discrepancies trigger investigation rather than immediate operational blame.
Coordinate Crew Roles, Communications, and Decision Authority
Operational success depends on clear decision authority. Define:
- Transfer master and safety officer roles.
- Who can call a hold or stop, and under what alarm conditions.
- Communication cadence: briefings at defined milestones (pre-coupling, start, rate change, completion).
A practical practice: use a short “milestone script” so both vessels confirm the same items at the same times, reducing the chance of one side assuming the other has already completed a check.
Execute, Monitor, and Close Out Without Leaving Loose Ends
Execution should follow the plan, but monitoring should be continuous. Include:
- Alarm response actions mapped to operational modes.
- Stop sequence: how to stop flow, manage residual pressure, and secure valves.
- Post-transfer closeout: line disconnection steps, venting completion criteria, and documentation finalization.
Example: after transfer stop, the plan should specify a “no-disconnect” condition until pressure and vent status meet the agreed safe criteria, preventing premature disconnection.
Mind Map: Marine Logistics Planning for Shuttle and Bunkering Operations
Example Operational Flow for a Single Bunkering Campaign
- Pre-arrival: verify documents, confirm ventilation and detection readiness, and confirm meter calibration status.
- Positioning: complete mooring checks and establish exclusion zones.
- Pre-coupling: perform line integrity checks, confirm ESD link status, and complete agreed coupling sequence.
- Start: confirm transfer start conditions, begin normal mode, and record flow continuously.
- Rate change: switch to reduced-rate mode at the planned tank level band.
- Completion: stop flow using the agreed sequence, manage residual pressure, and confirm safe vent completion.
- Closeout: disconnect lines, secure systems, reconcile measurements, and finalize transfer documentation.
This flow is intentionally procedural: each step produces a measurable state change that the next step depends on, so the operation stays coherent even when conditions are less than perfect.
11.4 Interface Engineering Between Offshore Facilities and Vessels
Interface engineering is the practical work of making two independently designed systems agree on what they will do, when they will do it, and how they will prove it. For ammonia fuel supply, the interface spans physical connections, control signals, safety boundaries, and operational data exchange. The goal is simple: the vessel receives fuel at the required quality and rate without creating unsafe conditions for either party.
Define the Interface Scope and Responsibilities
Start by writing an interface boundary statement that lists what each side owns. Offshore facilities typically own production conditioning, storage, transfer equipment, and terminal control. Vessels own onboard storage, fuel gas handling, and propulsion fuel system interfaces. A clear boundary prevents “shared responsibility” failure modes, where both sides assume the other will handle a valve lineup or a sampling step.
Example: If the facility provides a metered transfer line up to a manifold, the vessel must specify the manifold interface pressure rating, required flow range, and the exact location where sampling is taken. The facility then designs metering and sampling to match those requirements.
Standardize Physical Connections and Operating Envelopes
Physical interfaces include hoses or loading arms, manifolds, quick-connects, valves, strainers, and any adapters. Engineering should capture pressure/temperature limits, allowable leak rates, and the maximum transfer rate under normal and upset conditions.
A useful practice is to express the interface as an operating envelope table: minimum and maximum line pressure, maximum differential pressure across filters, and maximum allowable ammonia mass flow. This turns “we can transfer ammonia” into measurable constraints.
Example: If the vessel’s onboard filter can tolerate only a certain pressure drop, the facility’s pump curve and control strategy must keep the line within that limit at the highest planned transfer rate.
Align Control, Interlocks, and Communication
Control interfaces should be treated like safety equipment, not just convenience wiring. Define which signals are hardwired interlocks (for example, emergency stop, gas detection trip, and valve position permissives) and which are supervisory commands (for example, start transfer, adjust flow setpoint).
A practical approach is to create a signal matrix with four columns: signal name, direction, required state, and consequence if missing or inconsistent. Then implement fail-safe behavior so that loss of communication leads to a safe stop rather than a “keep going and hope” outcome.
Example: If the facility requests “transfer start” but the vessel reports “vent system not ready,” the facility should inhibit pump start and log the reason for the hold.
Harmonize Safety Boundaries and Transfer Procedures
Safety boundaries include exclusion zones, ventilation assumptions, relief system behavior, and emergency response actions. Both sides must agree on what constitutes a safe condition to begin transfer and what triggers a controlled stop.
Use a joint procedure structure with consistent steps: pre-transfer checks, connection verification, line purge plan, start transfer, steady transfer, sampling and reconciliation, controlled stop, and post-transfer isolation. Each step should list the responsible party and the acceptance criteria.
Example: During line purge, the facility and vessel must agree on purge medium, target oxygen or inerting criteria if applicable, and how purge venting is handled to avoid unintended release into enclosed spaces.
Integrate Fuel Quality Assurance and Sampling Points
Quality interfaces are often where projects stumble because sampling is not just a lab activity; it is a system design decision. Define sampling locations, sample frequency, hold times, and acceptance criteria for water content, contaminants, and composition indicators relevant to engine operation.
A good practice is to align sampling with the transfer mass balance. If the facility reconciles by metered mass and the vessel reconciles by onboard tank level change, both must use the same reference conditions and temperature/pressure basis.
Example: If the facility’s metering is temperature-compensated and the vessel’s tank level method is not, reconciliation can show a mismatch even when the transfer is correct. The interface document should specify the reconciliation method used for acceptance.
Verify Interface Readiness Through Joint Testing
Verification should include both functional and safety tests. Functional tests confirm that valves move to commanded positions, flow setpoints track, and sampling systems actuate correctly. Safety tests confirm that interlocks trip as intended and that emergency shutdown leads to a safe state.
A systematic checklist helps: “can we connect,” “can we start,” “can we maintain,” “can we stop,” and “can we recover.” Each item should have a measurable result.
Example: A joint test can simulate a gas detection alarm during steady transfer and confirm that the facility closes upstream valves, the vessel enters a safe shutdown mode, and the system logs the event with timestamps.
Mind Map: Interface Engineering Between Offshore Facilities and Vessels
Example: Interface Checklist for a Transfer Day
- Confirm manifold compatibility and rated pressures for both sides.
- Verify interlock permissives: gas detection status, ventilation readiness, and valve position feedback.
- Confirm sampling plan: location, frequency, and acceptance criteria.
- Run a controlled pre-transfer purge per the agreed procedure.
- Start transfer with flow ramp limits that respect vessel filter pressure drop.
- During transfer, reconcile metered mass with onboard accounting using the agreed reference basis.
- On stop, verify isolation positions and confirm no residual pressure remains in the agreed segments.
- Record evidence: valve positions, alarms, sampling results, and reconciliation outputs.
11.5 Operational Readiness Checks Including Documentation and Testing
Operational readiness for ammonia fuel supply and propulsion is less about “passing a checklist” and more about proving that the whole chain behaves safely under the conditions you actually plan to run. This section organizes readiness from documents to hardware to controlled trials, so nothing important gets skipped.
Readiness Documentation Set
Start with a single traceability spine: every test and procedure must point back to a requirement and a design basis. A practical set includes:
- System description and interfaces: fuel supply boundaries, transfer points, control system interfaces, and emergency shutdown links.
- Safety case summary: hazard assumptions, detection/ventilation basis, and safe states for each credible scenario.
- Operating envelopes: allowable pressure/temperature ranges, minimum/maximum flow rates, and start/stop constraints for engines and transfer systems.
- Procedures: normal operations, abnormal handling, and emergency response steps written for the actual crew roles.
- Maintenance and inspection plans: what gets checked before first operation, what gets checked after, and what gets checked periodically.
- As-built records: final P&IDs, loop diagrams, valve lists, instrument calibration certificates, and material certificates.
Easy example: if the transfer procedure says “verify line pressure before coupling,” the as-built loop diagram must show the exact pressure transmitter and the alarm logic that triggers the stop.
Verification of Documentation Quality
Before any physical testing, verify that documents are consistent and usable:
- Revision control: confirm the version number on procedures matches the version used in the test plan.
- Terminology alignment: ensure the same tag names appear in procedures, drawings, and control system displays.
- Role clarity: each step should indicate who performs it and what evidence is recorded.
- Evidence format: define what “pass” looks like (e.g., recorded values, timestamps, signatures, and acceptance limits).
A common failure mode is “correct content, wrong evidence.” For instance, a procedure may require a leak test result, but the log sheet only provides a checkbox.
Testing Strategy and Sequencing
Testing should progress from low-risk verification to integrated trials. Use a staged approach:
- Component and subsystem checks: instruments, valves, actuators, interlocks, and alarms.
- Static system tests: pressure integrity checks, functional checks without fuel where possible, and control loop verification.
- Dry-run operational rehearsals: simulate start/stop sequences, including emergency shutdown triggers.
- Controlled ammonia trials: limited scope transfers and engine operation within defined envelopes.
- Integrated operational trial: a full sequence that mirrors a real bunkering or offshore transfer day.
Acceptance Criteria That Engineers Can Actually Use
Define acceptance criteria in measurable terms. Typical categories include:
- Pressure and flow behavior: stable pressure within tolerance during transfer and during engine feed.
- Interlock response: confirm shutdown actions occur within the specified time window when triggers occur.
- Alarm correctness: verify alarm setpoints, priorities, and that the correct operator action is prompted.
- Leak testing method: specify the test medium, duration, allowable rate/threshold, and how results are recorded.
- Data logging completeness: confirm that every required variable is logged with correct units and timestamps.
Example: if a “high pressure” alarm is intended to stop transfer and isolate valves, the test should confirm both the alarm annunciation and the valve positions after the event.
Operational Rehearsals and Crew Readiness
Testing is not only hardware. Run rehearsals that include communication and decision points:
- Pre-transfer briefing: confirm roles, stop signals, and the sequence of permits.
- Emergency drill integration: practice the exact steps for detection, ventilation response, and safe shutdown.
- Evidence capture: ensure logs capture the required values at the required times.
A useful trick: conduct a “paper-to-plant” walkdown where the team follows the procedure while physically pointing to the instrument, valve, and control screen referenced in each step.
Readiness Sign-Off and Punch List Closure
Sign-off should be structured so that no one can claim readiness while known gaps remain:
- Responsible parties: operations, engineering, safety, and commissioning authority.
- Punch list rules: define which items can be closed after start, and which block operation.
- Final briefing: confirm that the crew understands the current operating envelopes and any temporary limitations.
Example: a minor instrumentation calibration discrepancy might be acceptable if it does not affect interlock thresholds; the acceptance criteria must explicitly state that.
Documentation Package for Handover
At the end, compile a handover package that supports safe operation without hunting through folders:
- final test reports with acceptance results
- updated as-built drawings and loop lists
- calibration certificates and instrument status
- marked-up procedures showing any controlled deviations
- completed checklists for readiness and permits
This package should allow an operator to answer, in minutes, what was tested, what passed, and what the system is allowed to do.
12. Practical Engineering Workflows for Design, Verification, and Commissioning
12.1 System Level Design Workflow From Requirements to Architecture
System-level design for ammonia fuel and propulsion is easiest when you treat it like a chain of responsibilities: requirements become functions, functions become interfaces, and interfaces become architecture. The workflow below is systematic, so you can trace every design choice back to a stated need.
Step 1: Translate Requirements into Measurable Functions
Start with a requirements list that includes safety, performance, operability, and maintainability. Convert each requirement into a function with a measurable outcome.
Example: If the requirement says “maintain safe fuel supply during normal operation,” define functions such as “control tank pressure within limits,” “deliver fuel to engine at required pressure and temperature,” and “prevent water carryover into engine supply.” Each function should have acceptance criteria (e.g., pressure band, allowable water content, minimum flow stability during load changes).
Step 2: Define Operational Modes and Boundaries
Architecture fails when modes are fuzzy. Identify operational modes such as pre-bunkering, bunkering, start-up, steady cruising, maneuvering, shutdown, and emergency blowdown. For each mode, specify:
- Fuel state assumptions (liquid/vapor fraction, expected temperature range)
- Permitted equipment status (which pumps may run, which valves must be closed)
- Environmental conditions that affect performance (ambient temperature, ventilation availability)
Example: During start-up, you may accept slower ramp rates and higher transient emissions, but you still must keep detection and ventilation active and ensure the fuel supply path is purged to the defined standard.
Step 3: Build a Functional Block Diagram
Create a functional block diagram that shows what the system must do, not how it will do it. Typical blocks for an ammonia fuel system include:
- Fuel storage and vapor management
- Transfer and conditioning
- Supply distribution to engines
- Engine interface and control
- Venting, blowdown, and emergency isolation
- Detection, ventilation control, and alarm handling
Example: “Fuel conditioning” is not just a filter. It may include water management, strainers, and any required steps to meet fuel quality acceptance criteria before injection.
Step 4: Derive Interfaces and Data Contracts
Interfaces include physical connections and control/measurement signals. Define them early so later design choices don’t become expensive surprises.
For each interface, specify:
- Physical parameters (pressure, temperature, flow range, allowable leakage class)
- Signal types (analog/digital, discrete interlocks)
- Timing expectations (startup sequencing delays, alarm response times)
- Failure behavior (what happens if a sensor disagrees with reality)
Example: If the engine control system requests a fuel pressure setpoint, the fuel supply controller must define how it handles actuator saturation and how it reports “cannot meet demand” without masking safety interlocks.
Step 5: Allocate Functions to Subsystems
Now map functional blocks to candidate subsystems. Allocation should respect constraints like space, maintainability, and segregation of hazardous areas.
Example: You might allocate “emergency isolation” to a dedicated valve set with independent actuation logic, rather than relying on the same control path used for normal throttling. That reduces the chance that a single control failure disables both normal and emergency behavior.
Step 6: Establish Safety and Reliability Constraints
Safety engineering inputs must constrain architecture, not decorate it. Use hazard identification outputs to set constraints such as:
- Required detection coverage and placement logic
- Maximum allowable release scenarios and mitigation steps
- Blowdown routing requirements and vent stack capacity assumptions
- Independence and redundancy rules for critical functions
Example: If a credible scenario is “loss of supply pressure during maneuvering,” the architecture should define whether the system transitions to a safe operating mode, how quickly it must do so, and what propulsion fallback is permitted.
Step 7: Perform System-Level Trade Studies with Clear Metrics
Trade studies should compare options using the same metrics. Common metrics include:
- Energy efficiency impact (especially for hybrid integration)
- Transient performance (load changes, start/stop cycles)
- Complexity and maintainability (number of valves, sensors, and test points)
- Safety impact (segregation, independence, and failure containment)
Example: Compare two transfer architectures by counting how many components must be proven during commissioning to meet the same fuel quality and pressure stability targets.
Step 8: Produce the Architecture Baseline and Traceability
The architecture baseline should include:
- System diagrams (functional and physical)
- Mode logic summary (what runs when)
- Interface control documents at a high level
- Traceability from requirements to functions to subsystems
Traceability is the sanity check. If a requirement cannot be traced to at least one function and one subsystem allocation, it’s either missing or misunderstood.
Mind Map: Requirements to Architecture Workflow
Example: A Compact Traceable Path for Fuel Supply
Requirement: “Deliver ammonia to engine with stable pressure during load transitions.”
- Function: “Regulate supply pressure within defined band.”
- Interface: “Fuel supply controller receives engine demand and returns status alarms.”
- Subsystems: “Transfer pumps, pressure control valves, filtration/strainers, and pressure sensors.”
- Constraints: “Emergency isolation valves must remain independently operable.”
- Acceptance: “Pressure deviation stays within limit for specified ramp rates; alarms trigger within defined response time.”
When you write it this way, the architecture stops being a diagram and becomes a set of commitments you can verify.
12.2 Engineering Calculations for Mass Balance and Energy Conversion
Mass balance answers “where the stuff goes.” Energy conversion answers “what it costs.” For ammonia fuel systems, doing both consistently prevents the classic failure mode: a design that looks fine on paper but cannot meet tank pressure, engine load, or heat duty simultaneously.
Foundational Inputs and Modeling Choices
Start by defining the control volumes: (1) production/conditioning to fuel tank, (2) shipboard storage and transfer, (3) engine fuel supply and combustion, (4) exhaust and aftertreatment heat flows, and (5) any hybrid power path. Choose a steady-state model first, then add transient terms only where they matter (startup, load steps, or blowdown).
For mass balance, list species explicitly: NH3, H2O, inert gases (e.g., N2), and any contaminants tracked by your quality spec. For energy conversion, decide whether you will use lower heating value (LHV) or higher heating value (HHV). For ammonia, LHV is typically more practical because it aligns with condensation-free exhaust assumptions; if your aftertreatment or heat recovery condenses water, you must account for the extra latent heat.
Mass Balance Core Equations
A practical mass balance for a fuel system uses component conservation:
-
Fuel mass flow into the control volume equals fuel mass flow out plus accumulation (zero for steady state).
-
For combustion, track ammonia consumption and products. A simplified stoichiometric reference reaction is:
NH3 + 3/4 O2 → 1/2 N2 + 3/2 H2O
Real engines deviate due to excess air, incomplete combustion, and slip. So you treat the stoichiometry as a baseline and correct with measured or modeled efficiencies.
Example: Tank-to-Engine Fuel Accounting
Assume a day service where the engine consumes 1200 kg of ammonia. If bunkering records show 1215 kg transferred to the ship, the remaining 15 kg must be explained by (a) tank heel retained, (b) line purge or drain losses, and (c) sampling losses.
A clean engineering workflow is to compute each term:
- Consumed: 1200 kg
- Purges and drains: 8 kg
- Sampling: 2 kg
- Heel retained: 5 kg
Total outflows = 1200 + 8 + 2 + 5 = 1215 kg, matching the transfer reconciliation.
Energy Conversion Core Equations
Energy conversion links fuel input to useful output and losses. Use a consistent basis:
- Chemical energy input: \(\dot{m}_{NH3} \times LHV\)
- Useful mechanical power: \(\dot{W}_{out}\)
- Losses: exhaust enthalpy, cooling losses, electrical conversion losses (hybrid), and unburned fuel or slip.
A compact steady-state form is:
\(\dot{m}*{NH3} \times LHV = \dot{W}*{out} + \dot{Q}*{cool} + \dot{H}*{exhaust} + \dot{W}*{aux} + \dot{E}*{unburned}\)
Where \(\dot{H}_{exhaust}\) is computed from exhaust mass flow and species enthalpies at the exhaust reference temperature.
Example: Heat Duty Check for Cooling Water
Suppose the engine consumes 0.50 kg/s of ammonia. With LHV = 18.6 MJ/kg, chemical power is:
0.50 × 18.6 = 9.3 MW
If measured brake power is 4.2 MW and auxiliary loads are 0.2 MW, the remaining 4.9 MW must appear as exhaust enthalpy plus cooling heat plus unburned/slip losses. If your cooling system is sized for only 2.0 MW, the mass balance may still close, but the energy balance will not. That mismatch is exactly what this calculation catches early.
Coupling Mass and Energy Through Thermodynamics
Mass and energy become tightly coupled when phase change and vapor handling are involved. For pressurized ammonia, tank pressure depends on vapor-liquid equilibrium, which depends on temperature and composition. When you compute transfer rates, include:
- Vapor generation during loading/unloading
- Heat transfer to/from the tank walls
- Blowdown mass and its enthalpy leaving the system
A good engineering habit is to compute tank boil-off mass from an energy balance first, then use that mass to update pressure/level. Doing it in the opposite order often produces “pressure that doesn’t match the heat.”
Mind Map: Mass Balance and Energy Conversion Workflow
Advanced Checks That Prevent Design Surprises
- Unit discipline: keep mass in kg/s, energy in MJ/kg or MW, and temperatures in a consistent reference for enthalpy calculations.
- Fuel quality sensitivity: if water content changes, combustion products and exhaust enthalpy shift, affecting both NOx control strategy and cooling duty.
- Slip accounting: unburned NH3 affects both mass closure (fuel consumption) and energy closure (chemical energy not converted to heat/work).
- Hybrid coupling: when using batteries or generators, ensure the energy balance is written at the correct boundary—fuel energy into the prime mover, then electrical conversion losses, then propulsion output.
Example: Closure Table for a Single Operating Point
Use a closure table to force consistency:
- Fuel in: \(\dot{m}_{NH3}\)
- Fuel out: unburned NH3 slip \(\dot{m}_{slip}\) plus any purge/drain
- Mechanical output: \(\dot{W}_{out}\)
- Cooling heat: \(\dot{Q}_{cool}\)
- Exhaust enthalpy: \(\dot{H}_{exhaust}\)
- Residual: should be near zero within measurement/model uncertainty
If the residual is not near zero, the calculation is telling you which assumption is wrong: LHV basis, slip fraction, exhaust reference temperature, or missing auxiliary loads.
12.3 Verification and Validation Methods for Fuel and Propulsion Systems
Verification answers “Did we build it right?” while validation answers “Did we build it for the job?” For ammonia fuel and propulsion, the two are tightly coupled because small mismatches—like fuel quality, control logic timing, or sensor calibration—can turn a safe design into an unreliable one.
Start with Requirements That Can Be Tested
A verification plan begins by translating each requirement into a measurable statement. For example, instead of “safe transfer,” use “transfer line pressure must remain within X–Y bar during defined flow rates, with alarms and shutdown occurring within Z seconds of deviation.” This translation forces clarity on test boundaries: steady state versus transient, normal versus faulted conditions, and which system owns the response.
A practical method is to build a requirement-to-test matrix. Each row links a requirement to: (1) analysis, (2) inspection, (3) test, or (4) demonstration. If a requirement cannot be tested or analyzed, it is usually underspecified.
Verification Methods That Cover the Whole System
Use layered verification so you don’t rely on a single technique.
- Model and calculation checks
- Mass balance: confirm ammonia consumption, boil-off, and purge flows reconcile with tank level trends.
- Energy balance: verify that vapor handling and heating assumptions match real operating points.
- Design reviews and inspections
- Check line sizing, valve fail positions, and relief device discharge routing.
- Confirm that instrumentation ranges match expected ammonia pressures, temperatures, and flow rates.
- Interface verification
- Validate signal mapping between fuel system controllers, engine control units, and safety PLCs.
- Example: during a simulated high-level alarm, confirm the fuel supply command is inhibited before any engine fuel demand is acted upon.
- Hardware-in-the-loop and software-in-the-loop tests
- Run control logic with realistic sensor dynamics and actuator limits.
- Example: test the interlock that prevents injection when fuel quality filters report water above threshold.
- Onboard system tests
- Perform functional tests at increasing fidelity: dry runs, inert gas purge checks, then controlled ammonia operation.
- Use a commissioning checklist that includes alarm setpoint verification and proof of safe state transitions.
Validation Through Demonstration of Intended Use
Validation proves the system behaves correctly under representative operating scenarios.
A good validation set includes:
- Normal operation: start, load increase, steady cruising, and shutdown.
- Operational transients: rapid load changes, fuel switching modes, and temperature stabilization after bunkering.
- Fault conditions: sensor failures, blocked filters, unexpected pressure rise, and loss of ventilation.
Example validation scenario: “From cold start to 70% load.” The test demonstrates not only that the engine runs, but that the fuel system achieves required supply conditions before injection is enabled, and that emissions control remains within defined operating constraints.
Quantitative Acceptance Criteria That Prevent Argument Loops
Define acceptance criteria early and keep them consistent across verification and validation.
- Time criteria: alarm-to-action delays, shutdown response times, and interlock reaction windows.
- Performance criteria: pressure stability bands, flow accuracy, and tank level control behavior.
- Quality criteria: water content limits, particulate limits, and sampling representativeness.
A subtle but important practice is to specify measurement uncertainty. If a flow meter has ±2% uncertainty, don’t set acceptance at ±1% without justification.
Mind Map of Verification and Validation Flow
Mind Map: Verification and Validation for Ammonia Fuel and Propulsion
Example Evidence Package for a Commissioning Run
A commissioning evidence package should be traceable and compact.
- Test procedure: step-by-step actions with defined setpoints and hold times.
- Instrumentation list: sensor IDs, calibration status, and uncertainty.
- Recorded data: pressure, temperature, flow, tank level, alarm states, and controller outputs.
- Results summary: pass/fail against each acceptance criterion.
- Deviations log: what changed, why it changed, and whether safety functions still met timing.
Example: during a filter blockage simulation, the evidence should show that fuel supply is inhibited, engine demand is handled according to the defined strategy, and the system enters the specified safe state within the required time window.
Common Failure Modes and How Verification Catches Them
- Interlock race conditions: two controllers act at nearly the same time; HIL tests expose ordering issues.
- Sensor range mismatch: a sensor saturates before an alarm triggers; inspection and calibration checks prevent it.
- Unrepresentative sampling: a test sample misses stratification; validation uses procedures that match operational sampling points.
- Overly optimistic models: calculations assume perfect mixing; system tests confirm real dynamics.
When verification and validation are planned together, the result is not just “it passed,” but “we know why it passed,” which is exactly what you want when ammonia is involved.
12.4 Commissioning Procedures Including Leak Testing and Functional Checks
Commissioning for ammonia fuel systems is easiest to manage when you treat it as three linked loops: readiness, controlled energization, and evidence capture. Leak testing and functional checks should not be separate “events”; they should share the same system configuration, instrumentation, and acceptance criteria so the results remain interpretable.
Commissioning Readiness and Configuration Control
Start by freezing the configuration that will be tested. Create a commissioning checklist that records tank status, valve line-up, purge mode, ventilation status, and which interlocks are active or bypassed. A simple example: if a fuel transfer line is tested with the vent stack isolated, you must record that isolation because it changes where any released ammonia would go.
Verify that test instruments are calibrated and that their measurement ranges match expected conditions. For leak testing, ensure detectors are positioned where gas would realistically accumulate: near low points for heavier-than-air behavior, and near likely release points such as flanges, pump seals, and valve stems.
Leak Testing Strategy and Acceptance Evidence
Use a staged approach so you can localize issues without contaminating the whole system.
-
Pre-closure checks: before insulation or cladding is installed, inspect welds and accessible joints. A practical habit: mark each joint with an ID and photograph it before closure so later findings can be traced.
-
Pressure integrity tests: apply test pressure according to system design basis. Record pressure decay over time and compare against allowable limits. If you see a decay that is too fast, stop and inspect the highest-risk joints first—typically threaded connections and gasketed flanges.
-
Leak detection tests: use ammonia-compatible detection methods. For example, during a controlled pressurization step, monitor detector readings at each planned sampling location and log time-stamped values.
-
Operational leak checks: after functional energization, repeat targeted checks around seals and moving components. A good example is checking pump seal behavior during short-duration run-ups at commissioning flow rates.
Acceptance criteria should be explicit and measurable. Instead of “no leaks,” define what counts as a leak: maximum allowable detector response, maximum pressure decay, and required stabilization time before declaring pass.
Functional Checks for Fuel Transfer and Engine Interface
Functional checks confirm that the system does what the safety case expects, not just that it holds pressure.
Begin with “dry” logic checks: verify control signals, permissives, and interlocks without introducing ammonia. Then proceed to “wet” checks in a controlled sequence.
A systematic sequence for a shipboard transfer subsystem:
- Valve and line-up verification: command each valve through its full travel and confirm position feedback.
- Pump start and stop: run at low speed or reduced duty, confirm pressure/flow response, and verify that alarms trigger at the correct thresholds.
- Filtration and water management: confirm differential pressure across strainers and verify that water removal arrangements operate as designed.
- Metering and reconciliation: validate that flow metering signals are consistent with transfer volumes measured by tank level changes.
- Engine interface: confirm that the engine fuel demand signal drives the correct supply valve positions and that the system transitions smoothly between operating modes.
For each functional check, capture evidence: trend logs, alarm event records, valve position snapshots, and a short narrative describing the observed behavior versus expected behavior.
Mind Map: Commissioning Flow for Leak Testing and Functional Checks
Example: A Controlled Leak Test and Re-Test Loop
Suppose a pressure integrity test shows a borderline pressure decay. The re-test rule should be predefined: isolate the suspect section, repeat the test at the same conditions, and inspect joints with the highest probability first. If the second test passes, document the resolution as “localized issue resolved” only after confirming that the joint inspection found a plausible cause (for example, a gasket seating issue) and that the system configuration matches the original test record.
Example: Functional Check That Catches a Safety Logic Gap
During engine interface checks, you might find that a permissive is satisfied in the control logic but the physical valve position feedback lags. The fix is not to “ignore the lag”; it is to adjust timing logic or improve actuator feedback handling so the interlock behavior matches the safety case. Record the exact sequence of signals and the measured valve response time so the correction is verifiable.
Closeout and Punch List Discipline
Closeout should link each test to its acceptance criteria and evidence. Any punch item must specify: what failed, where it failed, what corrective action was taken, and what re-test will prove the fix. This prevents the classic commissioning trap of “it seems better now,” which is not evidence—just a feeling with a clipboard.
12.5 Maintenance Planning Including Spares, Inspection Intervals, and Procedures
Maintenance planning for ammonia fuel systems works best when it is treated like a control system: define what “good” looks like, measure it, act when it drifts, and document everything so the next person can repeat the logic. The goal is not just to prevent failures, but to prevent failures in the right place at the right time—especially around transfer, vapor management, and combustion-support components.
Foundational Maintenance Strategy for Ammonia Service
Start with a system map of what can degrade and what can fail safely. For each subsystem, define:
- Failure modes: leaks, loss of pressure control, blocked filters, degraded sensors, stuck valves, catalyst performance loss.
- Maintenance objective: restore function, detect early drift, or confirm safe operation.
- Evidence: what measurement or inspection result proves the objective is met.
A practical example: for a fuel transfer line, “good” evidence might be stable differential pressure across a filter during a transfer, plus no abnormal valve travel signatures during actuation tests.
Spares Planning That Matches Real Wear
Spares should be sized to the maintenance tasks you actually perform, not a generic list. Use a three-bucket approach:
- Critical spares: items that stop bunkering or propulsion if they fail (e.g., pressure transmitters used in safety interlocks, rupture disks, key solenoid valves).
- Consumable spares: items replaced on a schedule (e.g., filter elements, gaskets, strainers).
- Support spares: items needed to complete diagnostics and repairs (e.g., spare sensors for calibration swaps, spare sample valves).
Example: if your procedure includes periodic water checks and filter differential pressure monitoring, then filter elements and sampling components become “consumable spares,” while spare sampling valves become “support spares.”
Inspection Intervals Based on Degradation Mechanisms
Intervals should be driven by mechanisms, not calendar habit. Typical ammonia system mechanisms include corrosion risk in wet conditions, seal wear from cycling, sensor drift from exposure, and contamination effects from water or particulates.
Use a baseline interval, then adjust using results:
- Frequent checks: items tied to immediate safety functions (leak detection channels, emergency shutdown logic proof tests).
- Medium intervals: components affected by cycling and flow (valves, strainers, transfer pumps).
- Longer intervals: items where condition is verified by inspection or performance tests (tank internal inspections where accessible, aftertreatment catalyst condition checks).
Example: if differential pressure across a strainer rises faster than expected over two consecutive transfers, shorten the next inspection interval for that strainer rather than waiting for the next planned window.
Procedures That Are Repeatable and Evidence-Driven
A procedure should specify inputs, steps, acceptance criteria, and what to do when results are outside limits. Keep it concrete:
- Preconditions: isolation method, pressure state, ventilation status, gas test requirements.
- Step sequence: order matters for safety and for preventing false readings.
- Acceptance criteria: numeric thresholds for travel time, differential pressure, sensor plausibility, and leak test outcomes.
- Postconditions: restoration checks, alarm reset logic verification, and documentation.
Example procedure logic for a filter change:
- Verify transfer line pressure state and isolate.
- Confirm strainer differential pressure trend matches the reason for replacement.
- Replace element, inspect seating surfaces, and verify no bypass path.
- Perform a short functional check during a controlled transfer to confirm stable differential pressure.
Mind Map of Maintenance Planning Logic
Maintenance Planning Mind Map
Example Maintenance Package for a Typical Month
A month plan should include both scheduled tasks and “triggered” tasks.
- Week 1: Proof test of emergency shutdown logic for ammonia fuel supply (document pass/fail and timing).
- Week 2: Inspect and trend differential pressure across transfer strainers; if trend exceeds limit, schedule immediate element replacement.
- Week 3: Calibrate or validate key pressure/temperature sensors used for control and safety functions; record calibration offsets.
- Week 4: Perform leak detection system channel functional checks and verify ventilation fan start logic.
Each task ends with evidence stored in a consistent format: what was measured, what threshold was used, who performed it, and what actions were taken.
Documentation and Traceability That Prevents Confusion
Maintenance records should connect three things: the component identity, the condition evidence, and the action taken. For ammonia systems, this is especially important for components that appear similar but behave differently under wet exposure or cycling.
Example: if a valve is replaced due to abnormal travel time, record the old valve’s measured travel signature and the new valve’s baseline signature. That way, the next abnormal reading can be interpreted as a system issue rather than a one-off replacement artifact.