Home Battery Backup Systems Mastery
1. Residential Backup Goals and System Boundaries
1.1 Defining Backup Objectives for Outages and Grid Instability
Backup objectives are the “why” behind every design choice: what you want to keep running, for how long, and under what kind of grid problems. If these goals are vague, the system ends up either oversized (expensive) or underperforming (annoying). If they’re precise, sizing, load prioritization, and controls become straightforward.
Start with the Outage Reality You’re Planning For
Grid instability is not one single event. It usually shows up as one or more of these conditions:
- Complete loss of utility power: the grid goes dark and your home must switch to battery-backed power.
- Brownout or undervoltage: lights dim, some electronics may reboot, and motors may draw differently.
- Frequency or voltage instability: sensitive equipment can misbehave even if power never fully disappears.
- Short interruptions: brief dropouts can reset clocks, Wi‑Fi, and some appliances.
Your objective should state which of these you care about. For example, “keep refrigeration running through a full outage” is different from “keep a home office stable through brief dropouts.”
Define the Service Level for Each Objective
A good objective has four parts: scope, duration, criticality, and acceptable behavior.
- Scope: whole home, critical loads only, or a specific set of circuits.
- Duration: how long you want support, such as 2 hours for short events or 24 hours for extended outages.
- Criticality: what must keep running versus what can shut off.
- Acceptable behavior: whether loads can cycle, whether some loads may restart later, and whether comfort can degrade.
Example objective statements:
- Refrigeration and freezer: “Maintain food-safe temperatures for 8 hours during a full outage; cycling is acceptable.”
- Home office: “Keep the router, laptop charging, and one monitor running for 4 hours; brief reboot is acceptable.”
- Lighting and outlets: “Provide basic lighting and phone charging for 6 hours; HVAC may be shed.”
Translate Objectives into Measurable Targets
Once you have objective statements, convert them into targets you can design around.
- Energy target: expected watt-hours required during the outage window.
- Power target: the highest continuous load you must support without tripping the inverter.
- Surge tolerance: whether you must handle motor starting loads like refrigerators or well pumps.
- Transfer behavior: how quickly power must switch and whether a short interruption is acceptable.
A simple way to think about it: energy is “how much,” power is “how fast,” and transfer behavior is “how clean.”
Choose Your Grid Instability Handling Strategy
Your system’s response depends on how it detects grid conditions and how it transitions.
- Outage detection threshold: tighter thresholds can switch sooner but may cause nuisance transfers.
- Transfer timing: some loads tolerate a short gap; others need near-continuity.
- Restart rules: after transfer, some equipment should wait before starting to avoid a surge pile-up.
Example: If you back up a sump pump and a refrigerator, both may try to start around the same time after transfer. Your objective should specify whether that’s acceptable or whether you want controlled sequencing.
Mind Map: Backup Objectives to Design Inputs
Example: Turning Goals into a Practical Plan
Suppose you want to protect food and maintain basic communication.
- Scope: refrigerator, freezer, Wi‑Fi router, modem, and a few outlets.
- Duration: 12 hours.
- Criticality: refrigeration is must-run; electronics are must-run but can tolerate brief reboot.
- Acceptable behavior: HVAC is shed; lighting is limited to essential circuits.
From this, you can set design expectations: the inverter must handle refrigerator starting surges, the battery must cover the 12-hour energy requirement including inverter losses, and the transfer should be fast enough that electronics don’t repeatedly drop offline.
Common Objective Mistakes to Avoid
- Only stating “whole home” without duration and acceptable behavior.
- Ignoring short interruptions when you care about clocks, Wi‑Fi, and some medical devices.
- Assuming cycling is free: cycling reduces average energy but still requires surge tolerance and sufficient runtime.
- Not specifying restart sequencing when multiple motor loads exist.
A well-defined objective is specific enough to be tested. If you can’t describe what happens to each major load during an outage, the system will guess—and guessing is where budgets and comfort go to lose.
1.2 Selecting Backup Scope for Whole Home Versus Critical Loads
Choosing backup scope is mostly a budgeting exercise with a side of engineering reality. The key decision is what you want to keep running during an outage, and how much complexity you’re willing to manage to do it reliably.
Start with What “Backup” Means in Your House
Backup scope usually falls into two practical patterns:
- Whole-home backup: the system supports most or all circuits through a transfer path.
- Critical-load backup: the system supports a smaller set of circuits through a dedicated critical-load panel and load management.
A useful way to frame it is to list what you’d miss first if power disappeared for 6 hours, then for 24 hours. Refrigeration and medical needs tend to show up early; comfort loads like outlets and some lighting often show up later.
Whole Home Backup: When It Makes Sense
Whole-home backup is attractive when you want fewer surprises and simpler user behavior. If you lose grid power, you don’t want to think about which circuits are on.
Best-fit situations
- You have a relatively small number of high-impact loads that you want supported continuously, such as a heat pump plus a few always-on circuits.
- Your home’s load profile is predictable and doesn’t swing wildly during normal operation.
- You prefer a single “everything important is on” experience, even if it means larger equipment.
What to watch
- Whole-home systems must handle starting surges from motors and compressors. A refrigerator is one thing; multiple HVAC stages and pool pumps at once is another.
- If you size for worst-case simultaneous loads, you may overspend. If you size for typical loads, you may need load shedding logic anyway.
Concrete example Imagine a 2,000 sq ft home with central HVAC, a well pump, and a water heater. Whole-home backup might cover the HVAC and well pump, but you still need to decide whether the water heater runs immediately after transfer or waits. Without that decision, the inverter can hit its peak limits right when the grid returns to chaos.
Critical Loads Backup: When It’s the Smarter Default
Critical-load backup focuses on keeping life-supporting and damage-preventing loads running while reducing peak demand.
Best-fit situations
- You want smaller battery and inverter sizing because you’re not trying to run everything.
- Your home has several discretionary loads that can be paused without consequences, like some kitchen circuits or nonessential outlets.
- You’re comfortable with a controlled experience, such as “the fridge, lights, and internet are on; the dryer is not.”
What to watch
- You must define critical circuits clearly, because ambiguity causes either wasted capacity or inconvenient outages.
- Load shedding is not optional in many critical-load designs; it’s how you keep the system stable.
Concrete example A common critical set includes: refrigerator, freezer, furnace/air handler control board, modem/router, a few lighting circuits, and one or two outlets for charging phones. If you also include a microwave circuit, you need to accept that it may be used intermittently, not continuously.
How to Choose: A Systematic Decision Path
Use this sequence to avoid common sizing and wiring mistakes.
-
List circuits and label them by consequence
- Tier 1: safety and preservation (refrigeration, medical devices, sump pump)
- Tier 2: essential comfort and communications (heat control, internet)
- Tier 3: convenience (most outlets, laundry, nonessential kitchen)
-
Estimate how many Tier 1 and Tier 2 loads can run at the same time
- Count likely simultaneous operation: HVAC plus well pump plus refrigerator is a realistic cluster.
-
Decide your scope rule
- Whole-home: “support most circuits; manage peaks with sizing and controls.”
- Critical: “support Tier 1 and Tier 2; shed Tier 3 automatically.”
-
Match scope to equipment and wiring complexity
- Whole-home often means a larger transfer path and more circuits on the backup side.
- Critical-load designs usually add a critical-load panel and a clearer circuit map.
Mind Map: Whole Home Versus Critical Loads
A Practical Scope Template You Can Copy
Pick a starting point, then adjust based on your actual loads.
- Tier 1: examples: refrigerator/freezer, sump pump, well pump control, furnace/boiler controls, medical outlets.
- Tier 2: examples: router/modem, a few lighting circuits, one or two general outlets, garage door opener if you rely on it.
- Tier 3: examples: dryer, dishwasher, most kitchen outlets, pool equipment, EV charging.
If you later decide you want more, you can move circuits upward in tiers. The important part is that the scope decision happens before you finalize battery capacity and inverter sizing, not after.
The One Question That Prevents Regret
When the outage starts, do you want to manage loads automatically or avoid management by supporting everything? Your answer determines whether you build a whole-home path or a critical-load path—and it shapes the entire system design that follows.
1.3 Understanding Power Quality Requirements for Sensitive Loads
Power quality is what your sensitive loads experience when the grid is stable and when it is not. In a home battery backup system, the goal is not “perfect electricity,” but predictable electricity within the limits those devices are designed to tolerate. The tricky part is that “sensitive” can mean different things: some loads care about voltage level, others about waveform shape, and others about how fast power returns after a transfer.
What Sensitive Loads Actually Need
Start with the three most common requirements.
-
Voltage tolerance: Many devices expect voltage to stay within a band. A refrigerator motor might keep running with a small dip, but a furnace control board may reset if voltage sags too far or too long.
-
Frequency stability: Inverters generate power at a nominal frequency. If frequency drifts, some clocks, variable-speed drives, and certain chargers can behave poorly.
-
Waveform quality: Some loads are picky about harmonic distortion. A typical example is a modern LED driver or a laptop power supply that uses switching electronics; it usually handles distortion well, but not always equally across all models.
A practical way to think about it: voltage and frequency are the “thermostat,” while waveform quality is the “how the thermostat signal is delivered.”
The Main Power Quality Disturbances During Backup
When the system transfers from grid to battery, several disturbances can occur.
- Transfer time: The gap between losing grid power and applying inverter power. Sensitive electronics may reset if the gap is too long.
- Voltage dip and overshoot: As the inverter starts and synchronizes, output voltage can briefly deviate.
- Harmonics: Nonlinear loads create harmonics that can stress transformers, overheat motors, or cause nuisance trips.
- Inrush currents: Motors and compressors draw high starting current. Even if the inverter can supply the peak, voltage can sag during the surge.
These events are not theoretical. For example, a heat pump compressor starting right as the transfer occurs can combine inrush with a brief voltage disturbance, which is a common recipe for a reset or a fault.
How to Translate Device Needs into System Requirements
Sensitive load requirements usually come from the device manual, but you can still plan systematically.
- Identify the load type: control electronics, motor/compressor, variable-speed equipment, or power supplies.
- Note the tolerance behavior: does it tolerate brief outages, or does it require uninterrupted power?
- Map to system limits: inverter continuous power, surge capability, allowable voltage deviation, and transfer behavior.
If you cannot find exact limits, use a conservative approach for the most interruption-sensitive devices: network gear, security systems, and medical devices. For them, prioritize short transfer time and stable output.
Mind Map: Power Quality Requirements for Sensitive Loads
Example: A Home Office Setup During an Outage
Assume you want to keep a desktop PC, a Wi‑Fi router, and a network switch running. These devices typically tolerate brief power interruptions poorly, but they do tolerate clean power once running.
- Transfer time: If your transfer switch introduces a noticeable gap, the PC may reboot. A staged approach that keeps the inverter online and reduces the interruption window improves outcomes.
- Voltage stability: If the inverter output dips during startup, the PC power supply may drop out. Ensuring the inverter has enough headroom for other loads prevents that.
- Waveform: Many modern power supplies accept modified sine or near-sine wave well, but the safest planning is to match the inverter waveform to the device’s stated input requirements.
A simple test plan is to run the office loads on battery during a controlled outage and observe whether devices reset or stay up. The goal is to confirm behavior, not guess.
Example: Refrigeration and Heat Pump Interactions
Now consider a refrigerator plus a heat pump. Both involve motors and compressors, so inrush matters.
- Surge capability: The inverter must handle the compressor start current without excessive voltage sag.
- Load step response: When the compressor starts, the inverter output should remain within the acceptable voltage band.
- Priority strategy: If you must choose, keep refrigeration on the highest priority tier. Then decide whether to delay the heat pump start until the system stabilizes.
This is where power quality meets load management: you are not only sizing energy, you are shaping the electrical environment the compressor sees.
Practical Checklist for Planning
- List sensitive loads and classify them by interruption sensitivity and motor involvement.
- Confirm inverter waveform and output stability expectations against the load’s input requirements.
- Plan transfer behavior to minimize interruption for electronics.
- Ensure surge handling and voltage stability for motor loads, especially when transfer and inrush overlap.
- Validate with a real test using the actual load mix you intend to run during outages.
1.4 Establishing Performance Targets for Runtime and Transfer Behavior
A good backup design starts with measurable targets, not vibes. “Runtime” tells you how long the system can support chosen loads, while “transfer behavior” tells you how the system transitions when utility power disappears and returns. These two targets are linked: faster transfer can reduce load interruption, but it may require tighter control settings and more careful component selection.
Define Runtime Targets That Match Real Outages
Runtime targets should be expressed as a duration under a defined load plan. Start with three inputs: (1) the outage scenario you care about, (2) the load set you intend to keep running, and (3) the acceptable performance level for those loads.
A practical approach is to set targets in tiers. For example, you might plan for 2 hours of “comfort loads” (refrigeration, internet, lighting) and 6 hours of “core loads” (refrigeration, a few outlets, minimal lighting). The key is that each tier has a specific load list and a specific energy budget.
To make the target concrete, translate loads into energy. If your core loads average 450 W and you want 6 hours, the energy requirement is 2.7 kWh. Then account for system losses: inverter efficiency, battery round-trip efficiency, and any standby consumption from controls. If you budget 85% overall efficiency, the required battery usable energy becomes 2.7 / 0.85 ≈ 3.18 kWh.
Runtime is also constrained by battery limits. Depth of discharge affects usable capacity, and inverter limits affect how much power you can draw at once. A system that can supply 2 kW continuously may still fail a “runtime” target if it cannot sustain that draw without hitting battery or inverter constraints.
Define Transfer Behavior Targets That Prevent Nuisance Problems
Transfer behavior includes transfer time, transfer method, and what happens to sensitive equipment during the transition.
First, set a transfer time target for your load types. Lighting and resistive loads usually tolerate brief interruptions. Refrigeration compressors and HVAC controls may tolerate short gaps but can be sensitive to restart timing. Internet equipment and some chargers can handle short outages but may reboot if the voltage dips too long.
Second, specify the acceptable voltage and frequency behavior during transfer. The goal is not “perfect sine waves at all times,” but stable operation within the equipment’s tolerance. If your inverter output is well regulated, the main risk becomes the transition moment: the time when the system decides whether to follow the grid or switch to inverter power.
Third, define restart and re-energization behavior. Many systems include delays to protect compressors and to avoid rapid cycling. Your performance target should state how long loads may be off after transfer. For example, you might accept a 3–5 minute compressor restart delay as long as the rest of the home stays powered.
Connect Runtime and Transfer Targets with a Dispatch Plan
Runtime targets assume a dispatch plan: which loads run immediately after transfer, which loads ramp later, and which loads are shed. Without this, the system may meet energy needs on paper but fail in practice due to startup surges.
A dispatch plan can be simple. Immediately after transfer, keep core loads on. After a short stabilization window, enable additional loads if the battery state of charge and inverter headroom allow it. This prevents the inverter from being asked to handle both high inrush and full steady-state power at the same time.
Mind Map: Performance Targets for Runtime and Transfer
Example: Setting Targets for a Typical Nighttime Outage
Assume you want core loads for 6 hours. Your measured average core load is 450 W. Using the earlier efficiency budget of 85%, you target about 3.18 kWh usable battery energy. If your battery system provides 4.0 kWh usable at your chosen depth of discharge, you have margin for efficiency variation and slightly higher loads.
Now set transfer behavior targets. You want lighting and internet to stay up with minimal reboot risk, so you choose a transfer time target that keeps interruptions short enough for your equipment class. For refrigeration and HVAC, you set an acceptable compressor restart delay window, such as 3–5 minutes, and you ensure the dispatch plan does not reapply high-demand loads immediately after transfer.
Example: Preventing a Runtime Miss Caused by Startup Surges
Consider a scenario where a well pump or heat pump has a large startup surge. If your dispatch plan turns on that equipment immediately after transfer, the inverter may hit surge limits, causing shutdown or a protective restart. That can waste energy and reduce effective runtime.
A better target-driven approach is to specify that high-inrush loads are either delayed until the inverter is stable or enabled only when the battery state of charge is above a threshold and the inverter has headroom. Your runtime target then becomes realistic because the system’s power path is not forced into its worst operating corner at the exact moment transfer completes.
Performance Target Checklist
- Runtime target includes: load tier, duration, and efficiency assumptions.
- Transfer target includes: interruption tolerance, acceptable restart delays, and dispatch timing.
- Integration includes: a dispatch plan that respects inverter surge limits and battery constraints.
- Verification includes: testing that measures both interruption duration and delivered runtime under the defined load plan.
1.5 Documenting Site Constraints for Equipment Placement and Wiring
A battery backup system is only as reliable as the physical plan behind it. Before you size anything, document site constraints that affect safety, wiring length, ventilation, service access, and how the system will behave during an outage. Think of this as building a “map of reality” that prevents expensive surprises at installation time.
Site Constraints That Actually Change the Design
Start with constraints that influence electrical topology and equipment selection.
- Electrical service and panel layout. Note the main service amperage, panel brand/model if visible, available gutter space, and whether you can add a dedicated subpanel or transfer equipment without violating clearances.
- Conduit and wiring paths. Record the shortest practical routes from battery location to inverter/charger and from inverter to the transfer mechanism. Long runs increase voltage drop and complicate troubleshooting.
- Clearances and access. Measure working space in front of panels and around disconnects. If a battery cabinet blocks a door swing or requires removing a wall panel to access fuses, you’ve already found a constraint.
- Ventilation and temperature. Batteries and inverters have operating ranges. Document where heat accumulates: mechanical rooms, attics, near water heaters, or direct sun exposure.
- Moisture and corrosion risk. Note basements, crawl spaces, exterior walls, and any history of condensation. Even “dry” locations can have seasonal humidity swings.
- Structural mounting and vibration. Identify wall stud locations, slab conditions, and whether the chosen spot can support the weight and mounting method.
- Utility and code requirements. Record any existing grounding electrode system details you can see, plus local requirements for labeling, disconnects, and equipment placement.
A Practical Documentation Workflow
Use a consistent checklist so every installer and inspector sees the same story.
- Create a site sketch. Include the service panel, proposed battery location, inverter location, and the route for conduit. Mark approximate distances.
- Capture photos and measurements. Photograph each panel and the proposed mounting surfaces. Write down measured clearances and the nearest obstructions.
- List constraints as “design rules.” Convert observations into rules the design must follow, such as “Battery must be within X feet of inverter due to conduit routing” or “Inverter must be mounted where ambient temperature stays within range.”
- Record wiring assumptions. Document conductor sizes you plan to use, expected conduit fill, and whether you anticipate bends that increase installation difficulty.
- Document safety and labeling locations. Note where disconnects, emergency shutoffs, and labels will be visible without removing covers.
Mind Map: Site Constraints to Capture
Example: Turning Observations into Wiring Decisions
Suppose the battery is desired in a garage corner, but the only practical conduit route to the inverter crosses a narrow utility chase with multiple 90-degree bends.
- Constraint recorded: “Conduit route includes three 90-degree bends and two offsets; working space is limited.”
- Design rule created: “Use larger conduit size to reduce pulling friction; plan for pull points or sweeps where allowed.”
- Wiring implication: You may need to adjust conductor routing and pulling strategy, and you’ll want to confirm bend radius requirements before finalizing conductor lengths.
This prevents the classic scenario where everything is electrically correct on paper, but the installer can’t physically pull the cables without damaging insulation.
Example: Environmental Constraints That Affect Placement
In a basement mechanical room, the water heater exhaust and dryer vent share the same wall. The battery cabinet is proposed nearby.
- Constraint recorded: “Localized heat and humidity near shared exhaust wall; seasonal condensation observed.”
- Design rule created: “Battery location must be separated from direct exhaust airflow; verify ventilation path and keep cabinet away from splash zones.”
- Wiring implication: You may choose a different mounting wall, which changes conduit length and the location of disconnects and labels.
Documentation Output That Keeps Projects Moving
End with a single “constraint sheet” you can hand to the installer and reviewer. Include measured distances, photos, and the design rules derived from them. If a constraint is uncertain, write it as a question with the measurement needed to close it, rather than leaving it as a vague note.
A good constraint sheet reads like a set of guardrails: it doesn’t tell you how to build the system, but it clearly defines where the system must fit, stay safe, and remain serviceable.
2. Electrical Fundamentals for Battery Backup Planning
2.1 AC Versus DC Architecture and Why It Matters
Home battery backup systems can be built around either an AC-first or DC-first power path. The difference sounds academic until you try to explain it to an electrician, size a system, or troubleshoot why a specific load behaves differently during an outage. The architecture determines where conversion happens, how power flows, what protections are required, and how efficiently solar can charge the battery when the grid is unstable.
Core Definitions That Actually Help
AC-first architecture typically means the battery system is integrated through an inverter that produces AC for the home. The battery energy is converted to AC early, and then the home’s loads are fed from an AC bus.
DC-first architecture keeps energy in DC longer. A DC bus ties together battery storage, solar input, and power conversion stages, with AC conversion happening later or in a more centralized way.
A practical way to remember it: AC-first is like doing the “language translation” from battery power to household power as soon as possible; DC-first delays that translation.
Power Flow During Normal Operation
In normal grid-connected operation, the system must do three jobs: supply loads, charge the battery, and manage solar production.
- AC-first example: Solar may be converted to AC by a PV inverter, then the battery charger draws from that AC through the inverter/charger stage. If the home is using power at the same time, the system coordinates AC power sharing.
- DC-first example: Solar can be routed into a DC bus (through appropriate DC conversion), and the battery can be charged from DC more directly. This can reduce the number of conversion steps in some designs.
Either approach can work well. The key is that each conversion stage introduces losses and control complexity, so the architecture affects both efficiency and how the system responds to changing solar output.
Power Flow During Outages
During an outage, the system must form a stable power source for selected loads. The architecture strongly influences how quickly the system can establish voltage and frequency, and how it handles loads with unusual electrical behavior.
- AC-first: The inverter typically becomes the source of the AC waveform. Loads see a familiar AC environment, but the inverter must handle surge currents and maintain stable frequency.
- DC-first: The system still ends up delivering AC to the home, but the inverter stage may be controlled from a DC bus that is already stabilized. This can simplify some internal control loops, while still requiring careful inverter design for surge and transient loads.
In both cases, transfer timing and control logic matter. A refrigerator compressor starting right as the system transfers can be the difference between “works fine” and “trips protection.”
Efficiency and Losses Where They Show Up
Every conversion step costs energy. In AC-first designs, energy may pass through an inverter/charger path more than once depending on how solar and charging are coordinated. In DC-first designs, some energy can remain in DC longer, potentially reducing conversion steps.
A concrete example: suppose you have 2 kW of solar available at noon and your home is using 1 kW while charging the battery with the remaining 1 kW. If the architecture forces an extra conversion stage for that charging path, the battery receives less than 1 kW-equivalent power. Over a day, that difference becomes noticeable in runtime.
Protections and Safety Requirements
Architecture changes the protection story.
- AC side protections focus on overcurrent, short-circuit behavior, grounding, and transfer switch coordination.
- DC side protections focus on DC-rated disconnects, DC fusing or breakers where required, arc suppression considerations, and battery management system limits.
A common installation mistake is treating DC and AC wiring practices as interchangeable. Even when the system “looks similar” in a diagram, the failure modes and required components differ.
Load Behavior and Why Inverter Control Matters
Some loads are forgiving; others are not.
- Resistive loads like heaters behave predictably.
- Motor loads like refrigerators and well pumps draw high starting current.
- Electronics like TVs and chargers may be sensitive to voltage dips.
AC-first and DC-first architectures both rely on the inverter’s ability to handle these loads. The architecture determines where control decisions are made, but the inverter’s surge capability, output regulation, and protection settings ultimately decide whether the system trips.
Mind Map: AC Versus DC Architecture
Example: Choosing the Architecture for a Typical Home
Imagine a home with a solar array, a battery, and a desire to keep the refrigerator, some lights, and a Wi-Fi router running during outages.
- If the system is AC-first, the design goal is ensuring the inverter can supply refrigerator start surge and that the transfer switch coordinates cleanly.
- If the system is DC-first, the design goal is ensuring the DC bus and charging path remain stable under changing solar output, while the inverter still meets surge requirements.
In both cases, the load inventory and inverter ratings drive the outcome. Architecture decides how the system gets there, not whether it can.
2.2 Single Phase Versus Split Phase Versus Three Phase Considerations
Choosing between single phase, split phase, and three phase isn’t about which one sounds fancier. It’s about how power is delivered, how loads behave when they start, and how much wiring and control complexity you’re willing to manage.
Core Concepts Before You Compare Phases
Single phase systems deliver one alternating current waveform. Split phase systems are built from two single-phase legs that are 180 degrees out of phase, creating a practical way to get both 120 V and 240 V in the same service. Three phase systems deliver three waveforms spaced 120 degrees apart, which reduces current “pulsing” and makes motor starting and continuous loads smoother.
A useful mental model is to think about how often the system reaches a peak. Three phase reaches useful peaks more frequently, so voltage dips and current surges tend to be less severe for the same power level.
Single Phase: Simple, Common, and Sometimes Tight
Single phase is common in residential settings. It’s straightforward: one voltage level (often 120 V in North America, or 230 V in many other regions) feeds your panel through breakers.
Where it works well:
- Lighting, electronics, and small appliances.
- Homes where the backup system is sized for a limited set of critical loads.
Where it gets tricky:
- Large motor loads (well pumps, HVAC compressors) can cause noticeable voltage sag during startup.
- If you try to run many mixed loads at once, the inverter may hit current limits sooner because everything shares the same waveform.
Example: A refrigerator plus a microwave plus a ceiling fan might be fine. Add a well pump starting at the same time, and the inverter may briefly struggle because the pump’s inrush current is much higher than its running current.
Split Phase: Two Legs, Better 240 V Options
Split phase is essentially two single-phase legs with opposite polarity relative to each other. This gives you two practical benefits:
- You can run 120 V loads on either leg.
- You can run 240 V loads across both legs.
Why it matters for backup planning:
- If your critical loads include a 240 V appliance (water heater, dryer, some HVAC configurations), split phase lets you power it without doubling current on a single leg.
- Load balancing becomes a real design task: you want the major loads to be distributed so one leg doesn’t get overloaded while the other stays light.
Example: Suppose your backup inverter is rated for a certain maximum current per leg. If the HVAC compressor is on Leg A and the microwave and outlets are mostly on Leg A too, you can exceed the leg limit even if the total household load seems reasonable. Moving some loads to Leg B can make the difference between “works” and “trips.”
Three Phase: Smoother Power and More Headroom
Three phase systems use three legs. For residential use, you typically see three phase where the utility service is three phase or where there’s a larger electrical infrastructure.
Where it helps:
- Motor-heavy loads run more smoothly because the torque demand is distributed across phases.
- Voltage dips during motor starting are generally less severe than in single phase at comparable power.
Where it complicates:
- Many residential backup inverters are designed around single phase or split phase output. Three phase backup often requires specific inverter models, additional configuration, or a different architecture.
- If you have a three phase service but your critical loads are mostly single phase, you still need a plan for how the system will supply them safely and predictably.
Example: A shop-style home with a three phase well pump and a three phase air compressor may benefit from three phase backup because both motors start with less disruptive sag. But if your backup equipment only outputs single phase, you might end up leaving those motors unpowered or relying on a load shedding strategy.
Mind Map: Phase Choice Impacts
Practical Decision Checklist
- List your critical loads and identify any motors. A pump or compressor changes the math more than most people expect.
- Check whether your backup inverter output matches your phase needs. If your service is three phase but your inverter is single phase, you must plan for what will be powered and what will be shed.
- For split phase, balance the legs. Treat it like a budgeting exercise: keep the biggest 120 V loads away from the same leg as the largest 240 V load.
- Validate with startup behavior, not just running watts. Inrush current and surge duration are what stress inverters and cause nuisance trips.
Worked Mini-Scenario
A home has a 240 V HVAC compressor, a 120 V refrigerator, and a 120 V microwave. With split phase, the compressor can run across the 240 V circuit while the refrigerator and microwave sit on opposite legs. If the microwave is accidentally on the same leg as the compressor, the inverter may see a higher peak current on that leg and trip. The fix isn’t “bigger inverter” first; it’s correct circuit assignment and, if needed, a small load shedding rule for the microwave during compressor start.
In short: single phase is straightforward but can be tight under motor starts, split phase adds flexibility with 240 V and requires leg balancing, and three phase offers smoother power delivery but demands more careful system integration.
2.3 Inverters, Chargers, and Power Conversion Efficiency
A home battery system is really three coordinated jobs: turning DC battery power into usable AC (the inverter), turning AC or solar power into controlled DC battery charging (the charger/charge controller), and moving energy through conversion stages with minimal losses (efficiency). The trick is that each job has limits—voltage ranges, current limits, surge behavior, and control logic—so “bigger” isn’t automatically “better.”
What Inverters Do and How They Behave
An inverter converts battery DC into AC for loads. The output is typically a sine wave, and its quality matters most for motors, compressors, and electronics with power supplies. In practice, inverter behavior shows up in three places:
- Continuous output power: what it can sustain without overheating.
- Surge capability: what it can handle briefly when motors start.
- Voltage and frequency regulation: how tightly it holds 120/240 V and 60 Hz (or the local equivalent).
Example: A refrigerator might draw 1,000 W running but briefly demand much more during compressor start. If the inverter’s surge handling is undersized, the system may transfer but then shut down or drop output when the motor kicks in.
What Chargers Do and How They Protect the Battery
A charger converts AC (from the grid or solar inverter output, depending on the system) into battery DC at the correct voltage and current. It does more than “push power in.” It also:
- Limits current to avoid exceeding battery and wiring constraints.
- Uses battery management signals to stop charging when the battery reaches safe limits.
- Manages charging stages so the battery doesn’t spend too long at high voltage.
Example: If a charger is set to an incorrect battery profile, it may terminate charging too early (short runtime) or too late (unnecessary stress). Even when the hardware is compatible, configuration still matters.
Efficiency as a System-Level Reality
Efficiency is not one number; it’s a chain of conversions. A typical path during backup might look like: battery DC → inverter power stage → AC distribution → load. During charging, it might look like: grid/solar AC → charger stages → battery.
Losses show up as heat and reduced delivered energy. Two practical implications follow.
- Runtime estimates should use usable energy, not nameplate capacity. If the inverter is 92% efficient at a given load, then 8% of energy becomes heat before it reaches the house.
- Efficiency depends on load level. Many inverters are less efficient at very light loads and also at near-maximum loads.
Example: Suppose you need 3 kWh at the loads during an outage. If the inverter efficiency at that operating point is 90%, the battery must supply about 3.33 kWh. That difference can be the gap between “works for the evening” and “runs out before bedtime.”
Conversion Stages and Where Losses Hide
Inverters and chargers often include multiple power stages: rectification, DC-DC conversion, filtering, and switching power electronics. Loss sources include:
- Switching losses in semiconductor devices.
- Conduction losses when current flows through internal components.
- Magnetic and core losses in transformers or inductors.
- Control and standby consumption that runs even when loads are small.
Example: A system that idles at a few tens of watts can noticeably reduce daily energy available for backup if the outage is long and the loads are modest.
Matching Components to Avoid “Efficiency Tax”
Efficiency improves when operating points are sensible. That means choosing inverter and charger sizing so the system spends more time near its efficient region.
- Oversizing the inverter can increase idle losses and reduce efficiency at typical loads.
- Undersizing can force the inverter to run near limits, where efficiency and thermal margins may worsen.
- Mismatched charge current limits can slow charging, leaving the battery underfilled after a short grid outage.
Example: If your household uses 600 W most of the evening and the inverter is rated far above that, the inverter may operate in a less efficient region. A slightly smaller inverter (within surge requirements) can deliver better overall energy transfer.
Mind Map: Inverters, Chargers, and Efficiency
Worked Example: From Battery Energy to Usable AC
Assume a battery provides 10 kWh usable energy under your planned depth of discharge. During an outage, you run loads that require 7.5 kWh at the AC side. If inverter efficiency at that load is 93%, the inverter delivers about 9.3 kWh to AC (10 × 0.93). Since 7.5 kWh is below 9.3 kWh, the system should cover the target runtime, assuming transfer and standby consumption are accounted for.
If the inverter efficiency were 88% instead, delivered AC energy would be 8.8 kWh. That still covers 7.5 kWh, but it leaves less margin for extra loads like a microwave plus a vacuum cleaner—exactly the kind of “small surprise” that turns planning into troubleshooting.
Practical Checklist for Selecting and Setting Power Conversion
- Verify surge capability for the largest motor/compressor load.
- Confirm charger current limits match the battery’s supported charge rate.
- Use efficiency curves or stated efficiency at relevant load levels for runtime math.
- Ensure battery profile settings align with the battery’s BMS requirements.
- Consider standby/idle consumption when outages are long and loads are light.
Power conversion efficiency is where engineering meets reality: it determines how much of your stored energy actually becomes usable electricity, and it does so through concrete behaviors like surge handling, charge termination, and load-dependent losses.
2.4 Circuit Protection, Grounding, and Safety Interlocks
A battery backup system is only as reliable as the safety plumbing around it. Circuit protection keeps faults from turning into fires, grounding keeps exposed metal at safe voltage, and safety interlocks prevent the system from doing two contradictory things at once (like feeding the grid while the grid is down). The goal is simple: when something goes wrong, the right device trips, the right path opens, and the right status is reported.
Circuit Protection: What Must Fail Safely
Circuit protection is about matching the protection device to the fault type and fault energy. In practice, you’ll see protection distributed across DC battery circuits, AC inverter output circuits, and the transfer path.
Start with the fault you’re protecting against:
- Overcurrent covers overloads and short circuits. A breaker or fuse trips when current exceeds a threshold.
- Short-circuit withstand matters because some components can survive a brief surge but not a sustained fault.
- Ground-fault behavior matters because DC systems can behave differently than AC systems, especially when insulation resistance drops.
A practical example: suppose a DC cable chafes and contacts the enclosure. If the system uses a properly sized DC fuse or breaker near the battery, the fault current rises quickly and the device opens before the cable overheats. If protection is placed too far from the battery, the cable becomes the fuse, which is not the plan.
Grounding: Keeping Touch Voltages Under Control
Grounding ties exposed conductive parts to a reference so that, during a fault, protective devices operate instead of leaving metal at a dangerous potential. In residential systems, grounding is typically coordinated with:
- Equipment grounding conductors that bond enclosures and non-current-carrying metal parts.
- Neutral and grounding relationships that must follow the system’s wiring method and inverter design.
- Surge protection where installed, which provides a controlled path for transient energy.
A concrete check: if you can measure continuity between the inverter chassis and the grounding electrode system, you’ve confirmed the bonding path is intact. If continuity is missing, a fault may energize the enclosure and the breaker may not trip as expected.
Safety Interlocks: Preventing Contradictory Power Paths
Safety interlocks ensure the system cannot backfeed the grid when it should not. They also prevent simultaneous connection of incompatible sources. Interlocks are implemented through transfer switch design, control logic, and wiring discipline.
Think of interlocks as a traffic light system:
- Grid source green means the transfer switch connects the home to utility power.
- Battery/inverter source green means the home is isolated from the utility and powered locally.
- Yellow moments are brief transitions where the system ensures one path is fully open before the other closes.
A practical example: during a grid outage, the controller detects loss of voltage, commands the transfer switch to open the utility connection, waits for confirmation, then closes the inverter output. If the waiting step is skipped or miswired, you risk a short between sources.
Coordination: Making Protection and Interlocks Work Together
Protection devices must be coordinated with the transfer behavior. If the transfer switch opens under load, the inverter must handle the resulting power interruption without creating abnormal voltages. If a breaker trips, the control system should recognize the condition and avoid repeated switching attempts.
A simple coordination workflow:
- Identify which faults are cleared by DC protection, which by AC protection, and which by transfer isolation.
- Confirm that the interlock logic blocks closing the inverter path until the utility path is confirmed open.
- Verify that grounding bonds are continuous so that fault current returns through the intended path.
Mind Map: Circuit Protection, Grounding, and Safety Interlocks
Example: Designing a Safe Fault Response
Imagine a two-stage system: a DC battery circuit with local DC protection, and an AC inverter feeding a critical-load panel through a transfer switch.
- If a DC short occurs, the DC protection opens near the battery, limiting cable heating.
- If an AC short occurs on the inverter output, the AC breaker trips, isolating the faulted branch.
- If the utility fails, the interlock sequence opens the utility connection first, then connects the inverter output, so the home never becomes a backfeed source.
The key detail is that each layer handles a different failure mode. When you design it this way, you don’t rely on one device to do everything, and you avoid the classic failure pattern: “it should have tripped, but the fault path bypassed the protection.”
2.5 Transfer Switch Types and Their Operational Implications
A transfer switch decides what your home uses during an outage: utility power, battery-backed inverter power, or (in some designs) a combination of both through controlled pathways. The type you choose affects safety, switching speed, how loads behave at the moment of transfer, and how much effort you’ll spend on commissioning and troubleshooting.
Core Concepts Before Choosing a Type
Start with three operational realities.
- Break-before-make versus make-before-break: Most safe designs prevent the utility and inverter from being connected at the same time. Break-before-make means the utility path opens before the inverter path closes.
- Transfer timing: Some switches transfer quickly; others intentionally pause to let voltages stabilize. That pause can matter for motors and sensitive electronics.
- Control intelligence: Basic switches rely on simple sensing. Advanced switches coordinate multiple signals, including interlocks and load management.
Manual Transfer Switches
Manual transfer switches are straightforward: you (or someone authorized) moves a handle or selector to switch circuits to the backup source.
Operational implications
- Predictable behavior: No surprise switching while you’re asleep.
- No automatic restoration: You must remember to move back when utility returns.
- Lower complexity: Fewer control signals and fewer failure points.
Example: A homeowner with a critical-load panel uses a manual switch feeding only the refrigerator, a few outlets, and a furnace control circuit. During an outage, the switch is moved once, and the inverter sees a stable set of loads. When power returns, the switch is moved back, preventing the inverter from fighting the grid.
Automatic Transfer Switches with Open-Transition Switching
Open-transition automatic transfer switches disconnect the utility first, then connect the inverter after conditions are met.
Operational implications
- Safety first: The utility and inverter are not paralleled.
- Short interruption: Loads experience a brief loss of power.
- Voltage and frequency sensing: The switch waits until the inverter output is within acceptable limits.
Example: Your HVAC blower starts during an outage. With open-transition switching, the thermostat may reboot briefly due to the interruption, but once the inverter is connected, the blower can run normally. If the system is configured for load priority, the blower can be allowed while nonessential circuits are shed.
Automatic Transfer Switches with Closed-Transition Switching
Closed-transition transfer switches attempt to transfer without a power interruption by synchronizing the utility and inverter waveforms.
Operational implications
- More demanding requirements: Synchronization must be tight to avoid circulating currents.
- Higher commissioning effort: Settings and verification matter.
- Not a fit for many residential battery setups: Many battery inverters are not designed to be paralleled with the utility.
Example: A closed-transition design might be used where the inverter is capable of strict synchronization and where the electrical design supports it. If synchronization is off, the switch can behave unpredictably, which is why open-transition is common for residential battery backup.
Inverter-Integrated Transfer Switches
Some battery inverters include built-in switching logic that routes power to specific circuits or an entire panel.
Operational implications
- Fewer external components: Less wiring complexity.
- Tighter coupling to inverter behavior: Transfer timing follows the inverter’s control strategy.
- Clear labeling still matters: You must know which circuits are actually backed up.
Example: A system backs up a whole-home panel through an integrated transfer mechanism. During an outage, the inverter takes over the panel, and the homeowner sees normal operation for most loads. During commissioning, the installer verifies that the backed-up circuits match the panel schedule, not just the marketing diagram.
Transfer Switches Versus Load Management
A transfer switch changes the source. Load management decides what runs.
- If you transfer too many loads at once, the inverter may hit surge limits or battery power limits.
- If you shed loads before or during transfer, the inverter can stabilize faster.
Example: A refrigerator and a well pump are both critical. The transfer switch moves power to the inverter, but a smart relay delays the pump start by a few seconds. That delay reduces the chance of a voltage dip that would otherwise cause the refrigerator compressor to cycle inefficiently.
Mind Map: Transfer Switch Types and Operational Effects
Practical Selection Checklist
When comparing options, verify these items in order: (1) whether the design prevents utility and inverter paralleling, (2) how long the interruption is expected, (3) which circuits are actually backed up, and (4) how load shedding or sequencing interacts with transfer timing. If you can answer those four points clearly, the transfer switch type becomes an engineering decision rather than a guessing game.
3. Battery Technologies and System Design Choices
3.1 Comparing Lithium Ion Chemistries for Residential Use Cases
Lithium-ion batteries share a common idea—moving lithium ions between electrodes—but the chemistry of the electrodes changes how the battery behaves under real household conditions. The goal in residential backup planning is not to pick the “best” chemistry in general; it’s to pick the one whose tradeoffs match your load priorities, temperature range, and expected cycling pattern.
Core Chemistry Families and What They Trade
LFP (Lithium Iron Phosphate) uses iron-based cathodes. It typically tolerates higher temperatures better than many alternatives and is known for stable behavior when stressed. In practice, that often means fewer “edge-case” concerns when a system runs warm during charging or sits in a garage that isn’t climate-controlled.
NMC and NCA (Nickel Manganese Cobalt / Nickel Cobalt Aluminum) use nickel-rich cathodes. These chemistries usually offer higher energy density, which can reduce physical size for a given usable capacity. The tradeoff is that they can be more sensitive to high temperatures and charging conditions, so the battery management system (BMS) and installation environment matter more.
LCO (Lithium Cobalt Oxide) is less common in modern residential backup packs because it tends to be less forgiving under stress and cycling. Where it appears, it’s often in niche applications rather than whole-home energy storage.
A useful way to compare is to map each chemistry to four household realities: temperature, cycling frequency, charging behavior, and how much usable capacity you can count on over time.
Mind Map: Chemistry Comparison for Home Backup
How Chemistry Affects Usable Backup Runtime
Backup runtime depends on usable energy, not marketing capacity. Usable energy is shaped by BMS limits that often vary by chemistry. For example, a battery may reserve a portion of its state of charge to protect longevity. If you plan for a two-hour outage with HVAC cycling, you want to know how much energy remains available at the discharge rate you’ll actually use.
Consider a simple scenario: a home needs 3 kW average for two hours, or 6 kWh delivered to the loads. If the inverter and wiring losses are 10%, the battery must supply about 6.7 kWh. If the pack’s usable energy is 7.0 kWh for your operating window, you’re fine. If the usable energy drops to 6.0 kWh due to temperature or conservative BMS limits, you miss the target. Chemistry influences how often those limits tighten.
Temperature Behavior in Real Homes
Residential systems live in garages, basements, and utility rooms. Temperature swings are common, and they affect both charging and discharging. LFP packs often maintain more predictable performance across a wider temperature range. Nickel-rich packs can still work well, but the BMS may reduce charging power or available capacity when the battery is cold or hot.
Example: If your solar produces midday power but the battery is cold in early spring, a nickel-rich pack may accept less charge until it warms. That can reduce how much energy you store for evening backup. With LFP, the system may accept charge more readily, improving the odds that your planned “solar-to-backup” energy actually arrives.
Cycling Patterns and Longevity Expectations
Backup systems don’t always cycle like daily off-grid systems, but they do cycle during outages and during solar-driven charge/discharge events. Chemistry affects how the battery tolerates repeated cycling.
A practical rule: if you expect frequent short outages, you care about cycle life at partial depth of discharge. If you expect rare long outages, you care about how the battery behaves near deeper discharge levels. LFP is commonly chosen when the design emphasizes many cycles and stable behavior. Nickel-rich chemistries can be excellent when the system is operated within a controlled window and the BMS is allowed to manage stress.
Charging Behavior and Power Limits
Charging is where chemistry differences show up quickly. The BMS sets maximum charge current and may taper charging as the battery approaches full state of charge. If your plan relies on fast charging from solar during a limited window, you want a chemistry and pack design that can accept meaningful charge power without excessive tapering.
Example: Suppose your solar array can deliver 4 kW for only three hours before clouds arrive. If the battery accepts 3 kW for most of that time, you store enough energy for evening loads. If the battery tapers early due to chemistry-sensitive limits, you may store 20–30% less than expected, even though the inverter and solar are performing normally.
Decision Checklist for Choosing Chemistry
Use this checklist to connect chemistry to your specific residential use case:
- Temperature range: Is the installation space often hot or cold?
- Expected cycling: Are outages frequent, or mostly occasional?
- Charging source: Is charging primarily from solar, grid, or both?
- Space constraints: Do you need compact kWh per cabinet?
- Usable capacity reality: Does the pack’s usable energy match your load plan under your typical operating temperatures?
Chemistry is only one piece, but it sets the “operating personality” of the battery. Once you align that personality with your home’s temperature, charging window, and outage pattern, the rest of the design—capacity, inverter sizing, and load prioritization—becomes much easier to get right.
3.2 Battery Capacity, Usable Capacity, and Depth of Discharge
Battery datasheets often list a number that sounds like “how much energy you get.” In practice, you get less, because batteries have limits on how deeply you can discharge and how much energy is safely usable at your operating rate. The goal of this section is to translate the headline capacity into usable energy you can actually budget for runtime.
Capacity Basics That Actually Matter
Start with two related quantities:
- Nominal capacity: the manufacturer’s rated capacity under specified test conditions.
- Usable capacity: the portion you can use without violating the system’s discharge limits.
Usable capacity is governed mainly by Depth of Discharge (DoD), which is the fraction of the battery’s usable energy window you draw down during a cycle. If a battery is rated for a maximum DoD of 80%, you should plan as if only 80% of its rated energy is available for that discharge event.
A quick mental model: if the battery is a pantry and DoD is how far you empty it, a conservative DoD means you stop before the shelves are bare.
Depth of Discharge from Theory to Planning
DoD is usually expressed as a percentage. For planning, you convert it into an energy budget.
Step 1: Convert capacity to energy. Many residential systems are specified in kWh. If you have kWh, you can skip conversion. If you have Ah and a nominal voltage, you can estimate energy using:
- Energy (kWh) ≈ Voltage (V) × Capacity (Ah) ÷ 1000
Step 2: Apply DoD to get usable energy.
- Usable energy (kWh) ≈ Battery energy (kWh) × DoD
Step 3: Account for practical losses. Inverter and battery efficiencies reduce delivered energy to loads. A planning margin is essential because real loads are not perfectly constant.
Mind Map: Capacity to Runtime Budget
Worked Example with Clear Assumptions
Assume a battery system rated at 10 kWh. The system configuration allows a maximum DoD of 80%.
- Usable energy ≈ 10 kWh × 0.80 = 8.0 kWh
Now suppose your inverter and battery path deliver about 90% of that energy to the AC loads after conversion losses.
- Delivered energy ≈ 8.0 kWh × 0.90 = 7.2 kWh
If your critical loads average 600 W during an outage, your runtime estimate is:
- Runtime ≈ 7.2 kWh ÷ 0.6 kW = 12 hours
Notice what this example does: it separates “battery nameplate energy” from “energy you can spend” and then from “energy your loads actually receive.” That separation prevents the common mistake of planning with the headline kWh.
Usable Capacity Depends on Discharge Rate
Even with the same DoD limit, usable capacity can shrink when you discharge quickly. Batteries have internal resistance, and higher current increases voltage drop and heat. Many systems protect themselves by limiting power output, which effectively reduces how much energy you can extract during short, high-demand periods.
Practical implication: if your outage includes a refrigerator plus a heat pump compressor cycling on and off, your average power might be moderate, but your peak power can still trigger power limits. That’s why runtime planning should use a realistic load profile rather than a single average number.
Common Planning Pitfalls and How to Avoid Them
- Using 100% DoD by default: even if the battery could technically discharge further, the system may restrict DoD to protect cycle life. Plan with the configured DoD.
- Ignoring efficiency: delivered energy to loads is not equal to usable battery energy. Apply a conservative efficiency factor consistent with your system’s behavior.
- Assuming constant load: loads vary. A load profile that includes cycling equipment will change the effective energy draw.
Mind Map: DoD Limits and Their Meaning

Quick Checklist for Turning DoD into a Usable Number
- Identify the battery’s rated energy in kWh.
- Use the system’s configured maximum DoD.
- Compute usable energy = rated kWh × DoD.
- Apply conversion losses to estimate delivered energy.
- Compare delivered energy to your load energy demand over the outage window.
With these steps, “capacity” stops being a single number on a spec sheet and becomes a disciplined budget you can trust when you’re sizing for real outages.
3.3 Round Trip Efficiency and Its Impact on Runtime
Round trip efficiency (RTE) is the fraction of energy you put into the battery that you get back as usable AC power at the loads. In a home backup system, that “put in” energy flows through multiple stages: battery charging, power conversion, and battery discharging. Each stage has losses, so RTE is never 100%—and those losses directly shorten runtime.
Start with the simplest mental model. If your battery has 10 kWh of usable energy and the system’s RTE is 90%, you should expect about 9 kWh of energy available to power loads. If the RTE is 80%, you get about 8 kWh. That difference often matters more than small changes in battery size because runtime is usually limited by energy, not by the inverter’s ability to produce watts.
Where Losses Come From
RTE is commonly treated as a single number, but it’s useful to understand its components so you can reason about tradeoffs.
-
Charging losses: When the inverter/charger converts AC from solar or grid to DC for the battery, some energy becomes heat. Charging current also affects losses; higher currents can reduce efficiency.
-
Battery internal losses: Even when the battery is “just sitting there,” chemical processes and internal resistance create heat during charge and discharge. Higher power draw increases current, which increases these losses.
-
Inverter losses: During discharge, the inverter converts DC to AC. Efficiency depends on how close you are to the inverter’s rated power and on the waveform and control strategy.
-
Standby and control loads: The system consumes energy even when loads are small—fans, communication modules, relays, and control electronics. These losses are small per hour, but they accumulate during long outages.
How RTE Changes Runtime
Runtime is energy divided by average power, but RTE changes the energy numerator.
- Usable battery energy: the portion you can safely use, after depth-of-discharge limits.
- Effective usable energy: usable energy multiplied by RTE.
- Runtime: effective usable energy divided by average load power.
Example: Suppose you plan for 6 kWh usable battery energy. Your outage target is a refrigerator plus lighting averaging 300 W (0.3 kW).
- With RTE = 90%, effective energy is 5.4 kWh. Runtime ≈ 5.4 / 0.3 = 18 hours.
- With RTE = 80%, effective energy is 4.8 kWh. Runtime ≈ 4.8 / 0.3 = 16 hours.
Two hours doesn’t sound dramatic, but it can be the difference between “overnight comfort” and “morning scramble.” Also note that average power hides peaks; peaks can increase inverter and battery losses, so real runtime can be slightly shorter than the simple calculation.
RTE Is Not Constant
Many datasheets list an RTE at a particular operating point. In practice, RTE varies with:
- Power level: Efficiency often improves at moderate loads and drops at very low or very high power.
- Temperature: Batteries and electronics behave differently when cold or hot.
- Charge/discharge rates: Fast charging or heavy discharging increases internal losses.
A practical way to handle this without getting lost in spreadsheets is to use a conservative RTE for planning and then verify with commissioning measurements.
Mind Map: Round Trip Efficiency and Runtime
Example: Comparing Two System Designs
Consider two designs with the same usable battery energy of 8 kWh.
- Design A: RTE 92% at typical loads.
- Design B: RTE 85% but includes a larger inverter and different control strategy.
If your average backup load is 400 W (0.4 kW):
- Design A runtime ≈ (8 × 0.92) / 0.4 = 18.4 hours.
- Design B runtime ≈ (8 × 0.85) / 0.4 = 17.0 hours.
The difference is 1.4 hours. If your load profile includes frequent high-power bursts, Design B’s effective RTE can drop further because inverter and battery losses rise with current.
Example: Small Loads and Standby Losses
For short, frequent outages, standby losses matter less. For long outages with small loads, standby can become a noticeable share of energy.
If the system’s control overhead is 20 W and the average load is 100 W, then overhead is 20% of the load power. Even with a decent RTE, runtime shrinks because the battery must supply both the “useful” load and the “always-on” electronics.
Practical Planning Rule
When sizing for runtime, treat RTE as the bridge between battery capacity and real delivered energy. Use a planning RTE that reflects your expected operating conditions, then confirm with measured runtime during commissioning using your actual priority load set.
3.4 Battery Management Systems and Protection Functions
A Battery Management System (BMS) is the part of the system that keeps the battery within safe electrical and thermal limits. Think of it as a traffic controller: it doesn’t decide what you want to power, but it decides whether the battery is allowed to charge, discharge, or stay idle.
Core BMS Responsibilities
First, the BMS measures. It monitors cell voltages, pack current, and temperature at multiple points. These measurements are the raw material for every protection decision.
Second, the BMS balances. Many packs are built from series-connected cells, and small differences in capacity or internal resistance cause cell voltages to drift over time. Balancing reduces the risk that one cell reaches a limit early.
Third, the BMS protects. Protection logic prevents damage from overvoltage, undervoltage, overcurrent, and overheating. When a fault is detected, the BMS can open charge and/or discharge contactors so the rest of the system stops stressing the cells.
Cell Voltage Monitoring and Limits
Cell voltage limits are the most direct guardrails. Overvoltage protection prevents lithium plating and electrolyte breakdown. Undervoltage protection prevents excessive depletion that can raise internal resistance and reduce usable capacity.
A practical example: suppose a 16-series-cell pack is charging. If cell 7 rises to the overvoltage threshold while the others are still lower, the BMS can start balancing and, if the condition persists, it can stop charging to avoid pushing that single cell beyond safe limits.
Temperature Monitoring and Thermal Protection
Temperature is monitored because electrochemistry is temperature-sensitive. High temperature increases degradation and can accelerate failure modes. Low temperature can reduce charge acceptance and increase the risk of lithium plating.
A simple scenario: during a cold morning outage, the inverter requests discharge. If the BMS sees pack temperature below the configured minimum, it may delay discharge or limit current until the cells warm to a safer operating range.
Current Sensing and Overcurrent Protection
Overcurrent protection is about both instantaneous stress and cumulative heating. The BMS uses current sensors to detect charge or discharge currents that exceed design limits.
Example: a refrigerator compressor starts and draws a surge. The inverter may request a brief peak current. If the surge is within the BMS’s allowed short-duration limit, discharge continues. If it exceeds the limit repeatedly, the BMS can trip to prevent excessive heating.
State of Charge Estimation and Control
The BMS estimates State of Charge (SoC) using voltage, current, and temperature. SoC is not just a number for display; it drives protection thresholds and balancing decisions.
Example: if SoC estimation indicates the pack is near full, the BMS may reduce charge current and increase balancing activity. If SoC is near empty, it may stop discharge earlier than a naive voltage-only approach would.
Balancing Functions and Their Practical Impact
Balancing is typically implemented as passive balancing using bleed resistors. When a cell reaches a higher voltage than its neighbors, the BMS dissipates a small amount of energy from that cell as heat, allowing the rest of the pack to catch up.
A useful mental model: balancing is slow compared to charging. That’s why good system design avoids repeatedly charging to the top of the voltage window without allowing balancing time.
Protection Actions and Fault Handling
When a fault is detected, the BMS chooses an action. Common actions include:
- Opening the charge contactor to stop charging while allowing discharge.
- Opening the discharge contactor to stop powering loads.
- Opening both contactors to isolate the pack.
- Entering a latched fault state that requires a reset after conditions normalize.
Example: if a cell temperature sensor reads an out-of-range value, the BMS may disable both charge and discharge. This prevents the system from guessing, because “unknown temperature” is not a safe operating condition.
Mind Map: BMS Measurements, Decisions, and Outcomes
Example: Mapping a Real Operating Sequence
Consider a typical day: the system charges from solar during the afternoon, then supports loads during an evening outage.
- During charging, the BMS watches the highest cell voltage and pack temperature. If one cell reaches the balancing threshold, balancing begins while charging continues.
- If the pack approaches full and balancing can’t keep up, the BMS reduces charge current or stops charging to protect the leading cell.
- During the outage, the inverter requests discharge. The BMS checks SoC and temperature, then allows discharge within current limits.
- If a surge load causes current to spike, the BMS permits it if it’s within short-duration limits; otherwise it trips to prevent overheating.
Key Design Takeaways
A well-designed BMS is not only protective; it is selective. It prevents damage while minimizing unnecessary shutdowns by using multiple signals—voltage, current, and temperature—rather than relying on a single measurement. That selectivity is what keeps a backup system useful when you actually need it.
3.5 Selecting System Components for Compatibility and Expandability
A battery backup system is only as flexible as the weakest interface: voltage, frequency, communication, protection devices, and physical space. Compatibility is not a “nice to have”; it determines whether the system transfers cleanly, charges predictably, and can grow without rewiring your life.
Component Compatibility Checklist That Actually Works
Start with the electrical “must match” items, then move to the operational “should match” items.
- AC side compatibility: Confirm inverter output type (single phase or split phase), nominal voltage, and frequency. Example: a split-phase home expects 120/240 V; a single-phase 120 V inverter cannot feed a 240 V load panel without a different architecture.
- DC side compatibility: Verify battery nominal voltage range and allowable charge/discharge current. Example: if a battery system is designed for a 48–60 V operating window, an inverter that only supports 400–500 V DC is a non-starter.
- Power path protection: Ensure the inverter’s required DC disconnects, fuses/breakers, and AC breakers align with the battery’s maximum fault current and the wiring gauge. Example: undersized DC conductors may “work” at low loads but fail inspection because voltage drop and thermal limits are exceeded.
- Transfer and control integration: Decide whether the inverter controls the transfer switch or whether a separate controller does. Example: if you choose an inverter that expects a specific transfer-switch model for grid status signals, mixing brands can force manual workarounds.
- Communication and monitoring: Check whether the inverter supports the battery’s BMS protocol and whether the monitoring app can read the same data set. Example: you might get basic operation, but lose state-of-charge accuracy if the inverter can’t interpret BMS data.
Expandability Without the “Rebuild Later” Tax
Expandability usually fails in two places: physical layout and control logic.
- Electrical expandability: Confirm whether the system supports additional battery modules in parallel or series, and whether the inverter can accept the expanded pack voltage/current. Example: adding capacity is easy when the inverter already has headroom in both voltage and current; it becomes messy when the expanded pack pushes the inverter beyond its minimum/maximum DC voltage.
- Control expandability: Some systems scale by adding battery modules within one BMS domain; others require a new inverter or a different control topology. Example: if the inverter only supports one battery “group,” adding a second group may require a different controller or a different product line.
- Protection expandability: Plan breaker and disconnect sizing so future additions do not require replacing the entire power path. Example: leaving spare conduit and breaker spaces is cheaper than redoing terminations.
Mind Map: Compatibility and Expandability Drivers
Example: A Clean Compatibility Decision
A homeowner wants backup for a critical-load panel and optional solar charging. They choose an inverter that supports the home’s split-phase output and a battery system whose nominal voltage sits inside the inverter’s DC operating window. They also select a transfer switch model that the inverter can command, so transfer timing and grid-status signals are consistent.
Next, they check expandability: the inverter’s maximum charge current must not be exceeded when the battery is expanded. They confirm the battery can add modules within the same BMS domain, so state-of-charge reporting remains accurate. Finally, they verify the DC disconnect and fuse ratings are sized for the expanded configuration, not just the initial one.
Example: When “It Fits” Still Fails
Two components can be electrically compatible yet operationally incompatible. Example: an inverter may accept the battery’s voltage range, but the battery BMS may not provide the inverter with the specific data fields needed for safe charging limits. The system may run in a conservative mode, reducing usable capacity and making runtime planning unreliable.
Practical Selection Workflow
- Gather the home’s AC requirements (voltage, phase, frequency, critical-load strategy).
- Gather the battery’s DC requirements (nominal voltage window, max current, BMS behavior).
- Match inverter power path and protection requirements to the battery’s fault and current characteristics.
- Confirm transfer-switch control and grid-status signaling compatibility.
- Confirm communication mapping for monitoring and charge/discharge limits.
- Validate expandability constraints: inverter headroom, battery scaling rules, and protection sizing for the expanded state.
When these steps are followed in order, “compatibility” becomes measurable, and “expandability” becomes a plan rather than a hope.
4. Site Assessment and Load Inventory for Accurate Sizing
4.1 Building a Load Inventory with Nameplate and Operating Data
A load inventory is the bridge between “what the house has” and “what the battery must supply.” Start with nameplate ratings to identify candidates, then replace guesses with operating data so your sizing matches reality. The goal is a list of loads with enough detail to estimate both energy (kWh) and power (kW) during an outage.
Step 1: Create a Load List from Nameplates
Walk the home and record every device that could run during an outage. Nameplates are your first filter because they tell you what the manufacturer expects under typical conditions.
For each load, capture:
- Device name and location (e.g., “Well pump, garage”).
- Rated power (W) or current (A) and voltage (V).
- Type (resistive, motor, electronics, heating).
- Operating pattern (continuous, cycling, intermittent).
- Starting behavior (if known): motors often draw higher current at startup.
Example: A refrigerator may show 120 V and 1.5 A. That implies about 180 W when running, but it also cycles, so the inventory must include duty cycle later.
Step 2: Convert Ratings into Usable Estimates
Nameplate numbers are usually “at rated conditions,” not “what you see at the meter.” Still, conversions help you build a consistent spreadsheet.
- If you have watts, use them directly.
- If you have amps, estimate watts as W ≈ V × A for single-phase loads.
- For multi-speed or multi-stage equipment, record the highest stage separately.
Keep a column for assumed power and a column for confidence. High confidence comes from measured data; medium from nameplate; low from vague labels like “about 500 W.”
Step 3: Add Operating Data to Replace Assumptions
Operating data answers: “How long does it run, and how hard does it run?” Use utility bills for daily energy totals, then refine with targeted measurements.
Collect at least one of these:
- Whole-home interval data from the utility or an energy monitor.
- Circuit-level measurements for critical loads using a clamp meter or plug-in meter.
- Runtime observations for cycling loads when measurement isn’t possible.
Example: If your interval data shows the HVAC consumes 6 kWh per day during summer, you can allocate that to heating or cooling stages based on thermostat run logs. If you only have nameplates, you might assume 3 hours of runtime at 3 kW, which can be off by a lot.
Step 4: Capture Duty Cycle and Load Profiles
Many loads are not “on/off”; they are “on for a while, then off.” Record:
- Average runtime per hour or per day.
- Typical cycling frequency (e.g., compressor cycles every 10–20 minutes).
- Seasonal differences for HVAC and water heating.
For motors and pumps, note starting surge. Even if the running watts are modest, startup can exceed inverter limits. If you can’t measure surge, treat motor loads as special cases and plan for conservative power limits.
Step 5: Organize Loads by Priority and Backup Role
Your inventory should support later load prioritization. Mark each load as:
- Critical (must run during outages).
- Important (should run if energy allows).
- Nonessential (can be shed).
Also record whether the load is continuous (e.g., modem/router) or intermittent (e.g., microwave). This determines how you translate the inventory into battery runtime.
Mind Map: Load Inventory Inputs and Outputs
Example: A Mini Inventory for a Typical Home
| Load | Type | Nameplate / Assumption | Operating Data | Backup Role |
|---|---|---|---|---|
| Refrigerator | Motor + electronics | 180 W running estimate | Cycles ~40% duty | Critical |
| Well pump | Motor | 1,200 W running estimate | Starts 2–6 times/day | Critical |
| Furnace blower | Motor | 900 W | Runs ~30 min/day in shoulder season | Important |
| Microwave | Resistive | 1,500 W | ~10 min/day total | Important |
| Lighting | Resistive | 60 W per fixture | ~2 hours/day | Nonessential |
This table is intentionally incomplete until you add measured runtime and confirm whether the well pump’s startup exceeds inverter limits. The inventory becomes “sizing-ready” only after you reconcile nameplate expectations with observed behavior.
Step 6: Validate the Inventory with a Sanity Check
Before moving on, compare your estimated daily energy from the inventory against your utility usage for a similar period. If your inventory predicts 12 kWh/day but your bill shows 28 kWh/day, you’re missing loads or underestimating runtime. Fix the biggest gaps first, not the tiny ones.
A practical checkpoint: pick one representative week from about two months ago, compute daily averages, and ensure your inventory can reproduce the same order of magnitude. When it does, you can size batteries and inverters with far fewer surprises.
4.2 Identifying Starting Loads and Inrush Sensitive Equipment
Starting loads are the electrical “first steps” a device takes when power returns. Many appliances draw more current for a short time than they do during steady operation. That brief surge can trip breakers, overload inverters, or cause voltage dips that make motors stall or electronics reboot. The goal here is to identify which loads behave like sprinters and which behave like marathoners.
Foundations: What Counts as Inrush
Inrush current is the short-lived current spike at startup. It’s common with motors (HVAC blowers, pumps, compressors), transformers (some chargers and power supplies), and certain electronic drivers (LED drivers, some induction cooktops). Two practical details matter for planning:
- Duration: Inrush may last milliseconds to a few seconds. Even if the energy is small, the peak current can be large.
- Sensitivity: Some systems tolerate dips; others need a minimum voltage or stable frequency to start cleanly.
A useful mental model is to separate peak power from average power. Batteries and inverters are sized for both, but inrush is what often causes the “it worked yesterday” problem.
Step 1: Build a Startup Load List
Start with your load inventory from the previous section, then add a “startup behavior” column for each major device. For each item, record:
- Type: motor, resistive, transformer-based, electronic driver
- Estimated startup duration: short (sub-second), medium (1–3 s), long (3–10 s)
- Expected inrush severity: low, medium, high
- Control mode: direct-on-line, soft start, inverter-driven, variable speed
Example: A refrigerator compressor is a motor-driven load with medium-to-high inrush. A microwave is mostly electronic with a high but shorter peak. A furnace blower is motor-driven and may have a longer medium inrush because it starts after a delay.
Step 2: Identify Inrush Sensitive Equipment
Not every high-current device is equally problematic. Inrush sensitive equipment is the stuff that either:
- needs a stable voltage to start, or
- has a control board that may reboot during dips, or
- has a motor that stalls if voltage sags.
Common inrush sensitive categories:
- Air conditioners and heat pumps: compressors plus outdoor fan motors.
- Well pumps and sump pumps: motor start plus possible repeated starts if water level control cycles.
- Garage door openers: motor start with mechanical load.
- Pool pumps: often variable speed, but still has startup behavior.
- Some battery chargers and EV-related chargers: transformer and rectifier behavior can create sharp peaks.
A slightly playful but accurate rule: if the device has a motor, treat it as a potential inrush event until proven otherwise.
Step 3: Use Nameplate Clues Without Overtrusting Them
Nameplate ratings help, but they don’t tell the whole story. Look for:
- Running amps and starting amps (if listed)
- Locked rotor amps for motors (rare on residential labels, common in industrial contexts)
- Voltage and frequency requirements
- Power factor notes for motor loads
If starting amps aren’t listed, you can still estimate severity by motor type and control method. Soft-start devices reduce inrush; direct-on-line motors increase it.
Step 4: Map Startup Timing and Overlap
Inrush becomes a breaker trip or inverter overload when multiple surges overlap. Overlap happens during:
- power restoration where several devices restart at once,
- thermostat calls where HVAC and fans start in sequence,
- pump cycling where level sensors cause repeated starts.
Create a “startup overlap map” for the top priority loads. For each device, note whether it restarts immediately after power returns or waits for a delay.
Mind Map: Starting Loads and Inrush Sensitive Equipment
Worked Example: Two Loads, One Problem
Assume your backup plan includes a well pump and a refrigerator. The refrigerator compressor may start shortly after power returns. The well pump starts when the pressure switch calls for water. If the pressure switch triggers right as the refrigerator compressor starts, the inverter sees two peaks close together. Even if each load alone is within limits, the overlap can exceed the inverter’s surge capability.
A practical mitigation is to stage the pump start using a relay or smart control so it waits a few seconds after grid restoration. That doesn’t reduce the pump’s inrush; it reduces the chance that two inrush events stack.
Practical Checklist for the Startup Load List
- Mark every motor load as “inrush possible.”
- Identify which devices restart automatically after power returns.
- Note any devices that can cycle repeatedly (pumps, compressors).
- Record whether soft-start or variable-speed control exists.
- Create overlap scenarios for the top priority loads.
Once you have this list, the next sizing step becomes more than math: it’s matching inverter surge behavior and battery runtime to the real-world order in which loads wake up.
4.3 Measuring Real World Consumption with Utility Data and Meters
Real-world energy use is where good battery sizing stops being a spreadsheet exercise and starts matching how your home actually behaves. Utility data and on-site meters provide the raw material; the planning work is turning that raw material into usable load patterns.
Start with What the Utility Already Knows
Most utilities provide monthly kWh and, in some cases, time-of-use (TOU) data. Begin by collecting at least 3–6 months of bills so you can see normal variation. If you only have monthly totals, you can still estimate daily energy by dividing kWh by the number of days in each billing period.
A practical step is to normalize for weather and occupancy. For example, if one month is unusually hot and HVAC runs longer, treat it as a “high-load” reference rather than an average. If you have TOU, separate usage into peak and off-peak blocks; this helps later when you decide which loads to prioritize during outages.
Understand Meter Readings and What They Actually Mean
A utility meter typically reports energy in kWh, not power in kW. kWh accumulates over time, so you need time windows to infer power. If you have interval data (15-minute or hourly), you can compute average power for each interval by dividing kWh by hours.
Also note that some meters show net usage when solar is present. Net kWh can hide how much energy your home consumed versus exported. For battery planning, you care about what your home draws from the grid (or from the solar/battery system) during outages, so you may need to interpret net readings carefully.
Build a Measurement Plan That Produces Actionable Data
Choose a measurement window that covers typical operation. A two-week window often works well if it includes both weekday and weekend behavior. If you want a concrete example, use a window like 2026-03-01 to 2026-03-14 to capture a full set of routines.
Then decide what you will measure:
- Whole-home kWh from the utility or a whole-home meter.
- Optional sub-meter data for major loads like HVAC, water heating, or refrigeration.
- Event logs for when you notice unusual behavior, such as a vacation period or a heat wave.
Convert Interval Data into Load Profiles
With hourly or 15-minute interval data, create a simple daily profile: average kW by time block. You can do this manually for a small dataset or with a spreadsheet. The goal is not perfect precision; it’s identifying patterns you can design around.
For instance, if your profile shows a consistent evening peak from 6–10 PM, that’s a strong candidate for priority planning. If midday usage spikes, it may be HVAC cycling or a large appliance schedule.
Use Examples to Avoid Common Misreads
Example 1: Monthly kWh Only Suppose a bill shows 900 kWh over 30 days. Your average daily energy is 30 kWh/day. If you plan for a 6-hour outage window, you might start with 30 kWh/day × (6/24) = 7.5 kWh, then adjust upward if your evenings are heavier than your daytime.
Example 2: Interval Data With Solar Netting If net interval data drops to near zero at midday, that doesn’t mean your home is using nothing. It may mean solar covers the load and exports excess. For outage planning, treat midday as “load covered by solar” rather than “load absent,” and rely on whole-home consumption patterns from periods with less solar contribution if possible.
Mind Map: From Utility Data to Load Decisions
Quality Control Before You Size Anything
Before using the data for battery sizing, sanity-check it against expectations. If your calculated average daily kWh is wildly inconsistent with what you know about your appliances, revisit meter interpretation (especially netting and TOU definitions). Also check for missing intervals or meter resets; a gap can flatten peaks and make your battery look smaller than it should be.
Once your profiles are consistent, you can translate them into energy needs and peak power requirements for the next steps in the chapter. The measurement work is what keeps those later calculations grounded in how your home actually runs.
4.4 Categorizing Loads by Priority and Criticality
A good load-priority plan answers one question: “If the grid disappears, what must keep running, and for how long?” Battery systems fail less often from bad hardware and more often from mismatched expectations—like powering a whole house while assuming the refrigerator and well pump will behave like LED bulbs.
Start by separating loads into three layers: critical, important, and nonessential. Critical loads are those you want during most outages with minimal interruption. Important loads can tolerate short delays or reduced runtime. Nonessential loads are the first to shed when battery energy or inverter power becomes tight.
Step 1: Define Criticality Using Real Outage Needs
Criticality is not just “how expensive the device is.” It’s about consequences and restart behavior.
- Life-safety and critical communications: medical devices (if applicable), internet gateway, security system, and any required monitoring. Example: keep the modem/router on a small backup circuit so you can receive alerts and control thermostats.
- Food preservation: refrigerators and freezers. Example: prioritize them over a microwave because they run continuously and have strict temperature limits.
- Water and sanitation: well pumps, sump pumps, and sometimes garage door openers. Example: a sump pump is critical because it may need to run during storms, not just during the first outage hour.
Step 2: Account for Power and Energy, Not Just Watts
Two different constraints drive priority:
- Inverter power limit (watts/amps at any moment): starting loads can spike. Example: a heat pump compressor or well pump may briefly draw several times its running power.
- Battery energy limit (watt-hours over time): heating, cooling, and electric water heating can drain capacity quickly.
A load can be “critical” by consequence but still be “managed” by runtime. Example: you may keep the refrigerator on critical power, but you might cycle a pool pump or reduce HVAC setpoints to stretch runtime.
Step 3: Build Priority Tiers with Clear Rules
Use priority tiers that map to actions. A tier without an action is just a label.
- Tier 1: Critical: always-on during outage. Rule: no shedding unless there’s an emergency shutdown due to inverter overload.
- Tier 2: Important: allowed to run but may be staged or duty-cycled. Rule: shed if inverter power exceeds a threshold or if battery state-of-charge drops below a target.
- Tier 3: Nonessential: shed immediately or on a schedule. Rule: only reconnect manually or after a minimum runtime buffer.
A practical example for a typical home:
- Tier 1: refrigerator/freezer, modem/router, security hub, sump pump (if present), a few outlets for essential charging.
- Tier 2: HVAC air handler fan, furnace control board, microwave (short bursts), laundry (delayed).
- Tier 3: electric dryer, whole-house fan, pool heater, most kitchen outlets.
Step 4: Use a Simple Load-Classification Worksheet
For each circuit or device, record three values: running power, starting power, and typical runtime during an outage.
- Running power helps with energy budgeting.
- Starting power helps with inverter sizing and surge behavior.
- Runtime helps with battery duration.
Example: a well pump might run 10 minutes per hour during normal conditions, but during an outage it may run longer if pressure drops. That changes both energy use and how aggressively you should stage it.
Step 5: Translate Categories into Panel and Control Design
Priority categories become real when they map to wiring and controls.
- Put Tier 1 circuits on the “always-backed-up” section of a critical-load panel.
- Put Tier 2 circuits on a controlled section that can be shed by a smart relay or load-management controller.
- Put Tier 3 circuits on the main panel side that remains disconnected during outage.
If you use a smart panel, define shedding order so the system reacts predictably. Example: shed pool equipment before shedding HVAC fan, because losing HVAC fan may cause faster temperature drift.
Mind Map: Load Priority and Criticality
Example: Priority Plan for a Mixed Load Home
Assume an outage plan where the inverter must avoid overload during a morning routine. You classify:
- Refrigerator/freezer as Tier 1 because they run continuously and should not be interrupted.
- Microwave as Tier 2 because it’s short and can be delayed until after the first surge-heavy period.
- Well pump as Tier 1 if it prevents flooding or loss of water; otherwise Tier 2 with a staged start.
- Electric dryer as Tier 3 because it’s both high power and high energy.
Then you set operational rules: keep Tier 1 always connected, allow Tier 2 for a limited window, and shed Tier 3 immediately. The result is a system that behaves consistently with how people actually use the house—without turning every outage into a guessing game.
4.5 Creating a Load Profile for Daytime and Nighttime Operation
A load profile is a time-based map of how much power your home actually uses. For battery backup planning, it’s more useful than a single “average kWh” number because batteries care about peaks, runtime, and how long high loads stay high. The goal is to separate your day into daytime and nighttime behaviors, then quantify what each period does to energy and inverter loading.
Start with two foundational ideas: (1) power (kW) drives inverter sizing and surge handling, while (2) energy (kWh) drives battery capacity. A load profile lets you estimate both without guessing.
Step 1: Choose a Time Resolution That Matches Your Loads
Use 15-minute intervals if you have smart meter data or a home energy monitor. If you only have hourly utility data, you can still build a profile, but you’ll smooth out short spikes like microwave bursts or dryer starts. For backup planning, that smoothing matters because short spikes can trip inverters even if the average looks safe.
Example: If your dryer runs for 45 minutes and draws 4 kW, hourly data might show 2 kW average. A 15-minute profile would show the dryer’s true 4 kW block, which is what the inverter must handle.
Step 2: Build a Daytime and Nighttime Skeleton
Daytime typically includes solar production, HVAC cycling, cooking, and laundry. Nighttime often includes refrigeration, standby electronics, lighting, and HVAC again—usually with different setpoints.
Create a simple timeline with these buckets:
- Morning ramp: breakfast, showers, HVAC warm-up
- Midday steady: workday loads, dishwasher, occasional cooking
- Evening peak: cooking, showers, laundry starts, lighting
- Night baseline: refrigeration, standby, overnight HVAC
You’re not trying to be perfect; you’re trying to be consistent and measurable.
Step 3: Convert Meter Data into a Usable Table
For each interval, record:
- Total load power (kW)
- Total energy (kWh for that interval)
- Notes for major events (e.g., “dishwasher start”)
If you don’t have interval data, you can approximate by using appliance schedules and nameplate ratings, but you must apply realistic duty cycles. A ceiling fan might be 0.07 kW when on; a heat pump might average 1.5–3 kW depending on temperature and staging.
Step 4: Identify Peak Power and Peak Duration
Battery systems fail in two different ways: insufficient energy for the whole outage, or insufficient power for the inverter during a surge or sustained high load.
So, for each period (daytime and nighttime), find:
- Peak interval load (highest kW)
- Sustained load blocks (how many consecutive intervals exceed a threshold)
Example: If your evening peak is 6 kW for one 15-minute interval, the inverter must tolerate 6 kW. If it’s 4 kW for four consecutive intervals, the battery must supply that energy for an hour.
Step 5: Separate Loads by Behavior, Not Just by Wattage
Group loads into behavior classes:
- Constant-ish: refrigeration, standby electronics
- Cycling: HVAC, dehumidifier
- Intermittent bursts: microwave, toaster, kettle
- Scheduled appliances: dishwasher, laundry
This matters because cycling loads can “average out” but still create repeated peaks that stress the inverter.
Step 6: Integrate Solar Effects for Daytime Charging Reality
Even if your main goal is backup during outages, solar affects daytime charging and how quickly the battery recovers.
For daytime load profiling, include two curves:
- Net load = house load minus solar production
- Battery charging availability = how much of that net load can be offset by PV
Example: If PV covers 3 kW at noon but your HVAC averages 2.5 kW, the battery might still see a small net charge. If a cloudy morning drops PV by half, the same HVAC behavior can shift from “battery charging” to “battery discharging,” changing runtime.
Step 7: Use the Profile to Create Backup Scenarios
Once you have daytime and nighttime profiles, run at least two outage scenarios:
- Outage starting at evening peak
- Outage starting at early morning baseline
This avoids the common mistake of sizing for the “average day” and then discovering the battery can’t handle the first hours.
Mind Map: Load Profile Creation for Daytime and Nighttime
Example: Turning a Typical Day into Two Profiles
Assume 15-minute intervals and these simplified observations:
- Daytime: HVAC cycles around 1.8 kW average with occasional 3.5 kW peaks; laundry starts once at 2:00 PM drawing 4.0 kW for 30 minutes.
- Nighttime: refrigeration averages 0.6 kW with brief compressor peaks to 1.8 kW; lighting and electronics average 0.4 kW; HVAC averages 1.2 kW with fewer peaks.
From this, you’d record:
- Daytime peak interval: 4.0 kW (laundry)
- Daytime sustained block: 1.8 kW for most intervals plus a 4.0 kW block for two intervals
- Nighttime peak interval: 1.8 kW (refrigeration compressor)
- Nighttime sustained block: 1.6 kW (HVAC + baseline) across many intervals
Then you size the inverter for the higher peak interval (daytime) and size the battery for the scenario with the larger sustained energy demand (often evening into night, depending on your priority loads).
Example: A Simple Threshold Method for Peak Duration
Pick a threshold such as 3 kW for “high load.” For each period, count how many 15-minute intervals exceed 3 kW.
- If daytime exceeds 3 kW for 2 intervals, that’s 30 minutes of high load.
- If nighttime exceeds 3 kW for 0 intervals, inverter stress is lower at night even if runtime is longer.
This method keeps the profile practical and directly tied to how batteries and inverters behave under real cycling and bursts.
5. Sizing Battery Capacity for Runtime and Usable Energy
5.1 Converting Load Requirements Into Energy Needs
Turning “watts” into “watt-hours” is the bridge between what equipment consumes and how long your battery can support it. The goal is to estimate energy use for each load category during the outage window, then sum it into a single energy requirement you can size against.
Step 1: Translate Nameplate Power into Operating Power
Start with the load’s rated power, but treat it as a ceiling, not a promise. Many devices list watts at a specific condition (for example, a refrigerator at a certain temperature difference, or a furnace blower at a specific speed). For planning, use one of these approaches:
- Use measured data: If you have utility or smart-meter data, pick the average watts during the outage-relevant period.
- Use typical duty-cycle estimates: For cycling loads, estimate how often they run.
- Use conservative assumptions: If you lack data, start with nameplate power and apply a reduction factor based on how the device actually behaves.
Example: A refrigerator might be labeled 700 W, but it may run only about 30% of the time. Its average operating power becomes roughly 700 W × 0.30 = 210 W.
Step 2: Convert Average Power into Energy over Time
Energy is power multiplied by time. Use watt-hours (Wh) for battery planning.
- Wh = W × hours
- kWh = (W × hours) / 1000
Example: If your “average critical loads” total is 1,200 W and you want 4 hours of support, energy is 1,200 × 4 = 4,800 Wh = 4.8 kWh.
Step 3: Handle Cycling Loads with Duty Cycles
For loads that switch on and off (refrigerators, heat pumps, well pumps), average power depends on duty cycle.
- Average Power = Rated Power × Duty Cycle
- Energy = Average Power × Hours
Example: A well pump is 1,000 W when running. If it runs 10 minutes per hour on average, duty cycle is 10/60 = 0.167. Average power is 1,000 × 0.167 ≈ 167 W. Over 6 hours, energy is 167 × 6 ≈ 1,002 Wh ≈ 1.0 kWh.
Step 4: Account for Inverter and Conversion Losses
Battery energy must cover not only load consumption but also conversion losses. Inverters and chargers are not 100% efficient, and efficiency varies with load level.
A practical method is to apply a planning loss factor to the load energy:
- Battery Energy Needed = Load Energy × (1 / Efficiency)
If you assume 90% effective efficiency for the operating range, then:
- Battery Energy Needed ≈ Load Energy / 0.90
Example: If load energy is 4.8 kWh, required battery energy is 4.8 / 0.90 ≈ 5.33 kWh.
Step 5: Include Usable Capacity Limits
Batteries have usable capacity constraints due to depth-of-discharge limits and battery management behavior. Your energy requirement must fit within usable energy, not nameplate capacity.
If a battery has 10 kWh nameplate but only 80% is usable for longevity planning, usable energy is 10 × 0.80 = 8 kWh. Your computed required energy must be ≤ 8 kWh.
Step 6: Separate Continuous Loads from Intermittent Loads
Intermittent loads still consume energy, but their timing matters for peak power and for how long they run. For energy calculations, you can still use average power, but keep the categories distinct so you don’t accidentally mix assumptions.
Example: Lighting (continuous-ish) might average 150 W, while a microwave (intermittent) might be 1,500 W for 10 minutes total during the outage. Microwave energy is 1,500 × (10/60) = 250 Wh.
Step 7: Build a Simple Energy Budget Table
A compact table prevents “math drift” and makes it easy to adjust assumptions.
| Load Category | Avg Power (W) | Outage Hours | Energy (Wh) |
|---|---|---|---|
| Refrigeration | 210 | 4 | 840 |
| Lighting | 150 | 4 | 600 |
| Internet + Router | 30 | 4 | 120 |
| Misc. outlets | 120 | 4 | 480 |
| Total Load Energy | 510 | 4 | 2,040 |
If inverter efficiency is 90%, battery energy needed is 2,040 / 0.90 ≈ 2,267 Wh ≈ 2.27 kWh.
Mind Map: Converting Load Requirements into Energy Needs
Example: One-Day Outage Energy Requirement
Assume a 12-hour outage with these average loads: refrigeration 220 W, lighting 160 W, electronics 40 W, and a sump pump that averages 300 W over the period. Total average power is 220 + 160 + 40 + 300 = 720 W. Load energy is 720 × 12 = 8,640 Wh = 8.64 kWh. With 90% effective efficiency, battery energy needed is 8.64 / 0.90 ≈ 9.60 kWh. If your battery usable energy is 9.0 kWh, this plan is short; you’d reduce runtime expectations, shed nonessential loads, or increase battery capacity.
Quick Consistency Checks
- If your computed energy seems too low, verify you used hours not minutes.
- If it seems too high, check whether you accidentally used peak watts instead of average operating watts.
- If you have cycling loads, confirm duty cycles are realistic for the outage conditions you assumed.
5.2 Accounting for Inverter Losses and Efficiency Curves
A battery system rarely delivers “nameplate” energy to your loads. The inverter converts DC from the battery to AC for household use, and that conversion costs power. If you size capacity using only load watts and runtime hours, you’ll usually end up short—especially when loads are light, because efficiency can drop near the inverter’s lower operating range.
Core Idea: Energy Accounting Beats Power Accounting
Start with energy, not just instantaneous watts. For a target runtime, you want enough battery energy to cover:
- Load energy (what you actually use)
- Inverter conversion losses (what the inverter burns)
- Any additional overhead (fans, control electronics, standby draw)
A practical workflow is:
- Estimate load energy for the outage window (kWh).
- Apply an efficiency factor that matches the expected operating point.
- Add a small overhead allowance for inverter idle and cycling.
Efficiency Curves in Plain Language
Inverter efficiency is not constant. It typically varies with output power level and sometimes with temperature. Many inverters publish a curve showing efficiency (%) versus output power (often as a percent of rated power). The curve usually peaks around mid-load and is lower at very light loads.
Example: Suppose your inverter is rated 6 kW. During an outage, your critical loads average 1.2 kW. That’s 20% of rated power. If the efficiency curve shows 92% at 20%, then each 1.0 kWh delivered to loads requires about 1.087 kWh from the battery (because 1 / 0.92 ≈ 1.087).
Step-by-Step Method for Sizing with Curves
- Build an expected load profile for the outage period. Use average power per hour or per block (e.g., 0–2 hours, 2–4 hours). If you only have one average, that’s still better than ignoring efficiency.
- Convert each block to inverter output power. If your system uses a split-phase or multi-inverter setup, use the actual inverter output that serves the backed-up panel.
- Read efficiency at each operating point from the curve. If the curve is given as “% of rated power,” compute that percent for each block.
- Compute required battery energy per block:
- Battery kWh = Load kWh / Efficiency
- Sum across blocks to get total battery energy required.
- Add overhead: include inverter standby draw and any control power. A simple approach is to add a fixed kWh per outage hour based on the inverter’s idle/standby specification.
Mind Map: Inverter Losses and How to Apply Them
Worked Example with Block Averaging
Assume you want 6 hours of backup for critical loads. Your load profile is:
- Hours 0–2: 1.8 kW average
- Hours 2–6: 0.9 kW average
Inverter rated power: 6 kW.
- Block 1 output percent: 1.8 / 6 = 30%
- Block 2 output percent: 0.9 / 6 = 15%
From the efficiency curve:
- At 30% load: 94% efficiency
- At 15% load: 91% efficiency
Compute load energy:
- Block 1: 1.8 kW × 2 h = 3.6 kWh
- Block 2: 0.9 kW × 4 h = 3.6 kWh
Convert to battery energy:
- Block 1 battery: 3.6 / 0.94 = 3.83 kWh
- Block 2 battery: 3.6 / 0.91 = 3.96 kWh
Total battery energy for conversion: 3.83 + 3.96 = 7.79 kWh.
If the inverter’s standby/control overhead is 30 W average during the outage, that’s 0.03 kW × 6 h = 0.18 kWh. Total required battery energy becomes 7.97 kWh.
Advanced Detail: Interpolation and Conservative Choices
Efficiency curves are usually plotted at discrete points. If your operating percent falls between two points, interpolate linearly between efficiencies. If you don’t have a curve point for your exact percent, use the nearest point that is at or below your expected efficiency to avoid under-sizing.
Also watch for “rated power” definitions. Some curves use AC output rating, others use inverter nameplate power. Use the curve that matches the inverter’s output side you’re sizing.
Quick Sanity Checks That Prevent Expensive Mistakes
- If your outage load is mostly low (say under 20% of inverter rating), expect efficiency to be worse than mid-load assumptions.
- If your computed battery energy is close to your usable capacity, revisit the load profile blocks; a small shift in average power can move you to a different efficiency region.
- If you have frequent cycling (loads turning on and off), treat the average power as the best estimate unless you have a detailed duty cycle.
Efficiency curves turn inverter sizing from a guess into a calculation. Once you account for the inverter’s real operating point, your battery capacity target becomes something you can defend with numbers, not hope.
5.3 Determining Target Autonomy for Outage Scenarios
Autonomy is how long your system should keep selected loads running after the grid goes away. The trick is to define it in a way that matches real outage behavior and your household’s tolerance for “not everything, just the important stuff.” A good target autonomy is specific, measurable, and tied to a load plan.
Start with Outage Scenarios That Match Your Reality
Begin by listing the outage types you actually experience or can reasonably expect based on your location and utility history. Use three tiers so you don’t design for a single worst-case that never happens.
- Short interruptions: seconds to a few minutes. These are mostly about transfer behavior and ride-through.
- Typical outages: a few hours to a day. This is where battery sizing and load prioritization matter most.
- Extended outages: multiple days. This is where you decide whether the system should conserve energy aggressively or simply maintain a small “survival set.”
A practical rule: size the battery for your typical outage and define a survival mode for extended outages using load shedding.
Convert Autonomy into an Energy Budget
Autonomy in hours becomes an energy requirement. The core relationship is:
Required usable energy (kWh) = Average supported load (kW) × Autonomy (hours) ÷ System efficiency factor
Your efficiency factor bundles inverter losses, battery charge/discharge efficiency, and any conversion losses in the power path. Rather than chasing a single perfect number, pick a conservative factor based on your system’s documentation and then validate with commissioning tests.
Example: Suppose you want 8 hours of support for a critical-load set averaging 1.2 kW. If your effective efficiency factor is 0.85, then:
- Usable energy needed = 1.2 × 8 ÷ 0.85 ≈ 11.3 kWh
If your battery has 14 kWh nominal but only 90% usable due to depth-of-discharge limits, usable energy is 14 × 0.90 = 12.6 kWh. That clears the 11.3 kWh target with margin for real-world variation.
Choose a Load Plan Before You Choose an Autonomy
Autonomy is only meaningful relative to what loads are actually running. Create a supported-load set for each scenario tier.
- Typical outage supported loads: refrigeration, internet/communications, lighting, and HVAC in a controlled mode.
- Extended outage survival loads: refrigeration plus essential lighting and communications; HVAC cycles less or not at all.
This prevents a common mistake: designing for “whole home” autonomy when the battery is really meant to run a curated set.
Account for Starting Loads and Operating Patterns
Average load is not the whole story. Two effects can reduce runtime:
- Inrush and surge: compressors, well pumps, and some appliances draw brief high power. Your inverter must handle it, and your battery must not hit current limits.
- Duty cycle changes: HVAC and refrigeration respond differently during an outage because indoor conditions drift.
Example: A refrigerator might average 150 W but can spike higher during compressor start. If your inverter is sized only for average power, it may still trip on surge. Plan for both the peak power capability and the energy impact of repeated cycling.
Use a Margin Strategy That Reflects Uncertainty
You can’t measure every variable perfectly, so build margin into the target. Use three margin sources:
- Efficiency margin: assume slightly worse performance than the best-case.
- Load margin: assume some loads will be added during an outage (like extra lighting or charging phones).
- Battery margin: respect depth-of-discharge limits and temperature effects.
A simple approach is to target 80–90% of the energy you calculate as “just enough,” then confirm with tests.
Mind Map: Autonomy Targeting
Worked Example with Scenario Tiers
Assume a household wants:
- Typical outage: 10 hours for critical loads averaging 1.0 kW.
- Extended outage: 48 hours for survival loads averaging 0.35 kW.
If efficiency factor is 0.85:
- Typical usable energy = 1.0 × 10 ÷ 0.85 ≈ 11.8 kWh
- Extended usable energy = 0.35 × 48 ÷ 0.85 ≈ 19.8 kWh
If the battery is 20 kWh nominal with 90% usable, usable energy is 18 kWh. That means the system can meet typical autonomy comfortably, and extended autonomy only if you enforce strict survival load shedding and avoid extra loads. The point isn’t to force one number; it’s to make the trade-off explicit.
Document the Target in Plain Language
Write the target autonomy as a statement you can test. For example: “During a typical outage, the system will support refrigeration, lighting, and communications for 10 hours with HVAC cycling in a controlled mode.” This turns planning into a commissioning checklist and keeps later decisions consistent.
5.4 Managing Depth of Discharge Limits for Longevity
Depth of discharge (DoD) is how much of a battery’s usable energy you take out during a cycle. For lithium-based systems, DoD is one of the biggest levers you control, and it directly affects cycle life. The practical goal is simple: use enough energy to meet your outage plan, but avoid routinely draining the battery deeper than necessary.
Foundational Concepts That Drive DoD Decisions
Start by separating three numbers that often get mixed together:
- Nameplate capacity: what the manufacturer lists.
- Usable capacity: what your system allows between limits (state-of-charge window).
- DoD: the fraction of usable capacity you actually remove during a cycle.
If your system is configured to stop at 20% state of charge (SOC), then the usable window is from 20% to 100%. A discharge down to 20% corresponds to a DoD of 80% of the usable window. Two systems can have the same battery size but different DoD behavior because their SOC limits differ.
Why Deeper DoD Usually Shortens Life
Battery wear is not linear with energy removed. Deeper discharges increase stress on cell chemistry and internal balancing. Even when the battery still “works,” the capacity may gradually shrink and the system may need more charging time to reach the same SOC. The result is that your outage runtime slowly erodes, which is why DoD management is really runtime management over the long haul.
Step 1: Choose SOC Limits That Match Your Outage Plan
A good DoD limit is the shallowest one that still covers your required runtime. For example, suppose your critical loads consume 1.2 kW on average and you need 6 hours of backup. That’s 7.2 kWh of energy at the AC side. If your inverter and battery path are 90% efficient overall, you need about 8.0 kWh from the battery. If your usable window is 10 kWh, then you need 80% of usable energy, meaning a DoD of 80% for that event.
If you instead set your minimum SOC so the usable window is 12 kWh, the same 8.0 kWh draw becomes a DoD of about 67%. That’s often a meaningful reduction in wear for the same outage coverage.
Step 2: Use a Simple DoD Budget per Event
Treat each outage as an “energy withdrawal” and track it against your DoD target. A DoD budget helps you avoid the common mistake of designing for one worst-case event and then hitting that worst case repeatedly.
Example: You plan for 6 hours of backup, but in real life you might see many shorter outages. If you set the system to allow 90% DoD every time, short outages still train the battery to swing deeply whenever the grid returns late or loads spike. A DoD budget approach says: allow deeper discharge only when the event duration and load profile justify it.
Step 3: Account for Load Spikes and Inverter Behavior
DoD is driven by energy, but energy is affected by power spikes. A refrigerator cycling on and off, a heat pump starting, or a well pump kicking can increase instantaneous draw. Even if average power looks fine, spikes can push the battery to the minimum SOC sooner than expected.
To manage this, base your sizing on energy using a realistic load profile, then add a margin for surge-heavy periods. If your system supports it, configure load priorities so that high-draw equipment is shed before the battery hits the minimum SOC.
Step 4: Keep the Battery from “Chasing” the Minimum
If your minimum SOC is set too high, the system may frequently stop discharging early and then recharge quickly, which can be inefficient. If it’s set too low, you’ll hit deep cycles more often. The sweet spot is usually where the battery reaches the minimum SOC only during events that truly require it.
A concrete way to find that sweet spot is to compare your outage plan to your typical event outcomes. If most outages are 1–2 hours, you can often set a minimum SOC that corresponds to a DoD closer to 30–50% for those events, while still allowing deeper discharge for longer outages.
Mind Map: Depth of Discharge Management
Example: Choosing a Minimum SOC Setting
Assume a battery with 14 kWh nameplate capacity and a system-configured usable window that depends on minimum SOC. Your critical loads require 9 kWh of battery energy for a target outage.
- If minimum SOC yields usable energy = 10 kWh, then DoD is 9/10 = 90%.
- If minimum SOC yields usable energy = 12 kWh, then DoD is 9/12 = 75%.
If your outage plan is met in both cases, the 75% DoD configuration is the longevity-friendlier choice. The tradeoff is that you may need slightly more charging time to restore SOC after the event, but that’s usually manageable when paired with sensible load prioritization.
Practical Checklist for Longevity-Oriented DoD Limits
- Set minimum SOC based on required energy, not just runtime hours.
- Include efficiency losses and realistic load spikes in the energy calculation.
- Use load priorities so the battery doesn’t hit minimum SOC during avoidable high-draw periods.
- Validate with measured runtime and adjust if you consistently have too much or too little margin.
When DoD limits are chosen this way, you get the outage coverage you designed for, while keeping the battery’s daily life closer to the “less stressed” end of its operating range.
5.5 Using Practical Sizing Worksheets with Example Calculations
A sizing worksheet turns “I want backup” into numbers you can defend. The goal is to estimate usable battery energy, confirm inverter power limits, and translate your load plan into a runtime that matches your target. Below is a practical, step-by-step worksheet approach with worked examples.
Worksheet Inputs You Must Collect First
Start with five inputs. If any are missing, your math will still run, but it won’t mean much.
- Load energy per hour (kWh/h) for the loads you plan to run during an outage.
- Peak power (kW) for the same load set, including starting surges.
- Battery usable energy fraction (usable kWh = nameplate kWh × usable fraction).
- System efficiency from battery to AC (inverter + wiring + conversion losses).
- Target runtime (hours) and any load shedding schedule (if you plan to reduce loads later).
A simple mind map helps keep these inputs from getting mixed up.
Mind Map: Worksheet Flow
Energy Needed from Your Load Plan
Use a load plan that matches reality. If you run the refrigerator, a few lights, and the router, your energy per hour is not the same as “everything in the house.”
Worksheet formula:
- Energy needed (kWh) = Σ (load watts ÷ 1000) × hours
Example A: Critical loads for 6 hours
- Refrigerator: 150 W average, runs 6 hours → 0.150 kW × 6 = 0.90 kWh
- Lighting: 6 × 10 W LEDs = 60 W average → 0.060 kW × 6 = 0.36 kWh
- Router + modem: 25 W average → 0.025 kW × 6 = 0.15 kWh
- Ceiling fan: 50 W average → 0.050 kW × 6 = 0.30 kWh
Total energy needed = 0.90 + 0.36 + 0.15 + 0.30 = 1.71 kWh.
Convert AC Energy Need into Battery Energy Required
Battery energy must cover losses. If your system efficiency is 0.90 (90%), you need more battery energy than the AC loads consume.
Worksheet formula:
- Battery energy required (kWh) = Energy needed ÷ Efficiency
Using Example A:
- Battery energy required = 1.71 ÷ 0.90 = 1.90 kWh.
Convert Battery Energy Required into Battery Nameplate Size
Most systems do not allow full discharge. If your usable fraction is 0.80 (for example, you limit depth of discharge to protect longevity), then:
Worksheet formula:
- Nameplate kWh = Battery energy required ÷ Usable fraction
Using Example A:
- Nameplate kWh = 1.90 ÷ 0.80 = 2.38 kWh.
Practical rounding: choose a battery size that covers margin for real-world behavior (temperature, inverter behavior, and load variation). A common worksheet step is to round up to the next available module size.
Check Inverter Power Limits with Peak and Surge
Energy sizing answers “how long,” while power sizing answers “can it turn on.” Starting surges matter for compressors, pumps, and some HVAC components.
Worksheet formula:
- Inverter continuous rating ≥ Peak continuous load (kW)
- Inverter surge capability ≥ Worst-case surge (kW for short duration)
Example B: Same critical set, but include a well pump
Assume during an outage you run:
- Refrigerator average 150 W, compressor surge 1.5 kW for a short time
- Well pump: 1.2 kW running, 3.0 kW starting surge
- Lighting + electronics: 110 W average
Peak continuous load (ignore brief surges):
- 1.2 kW (pump running) + 0.150 kW (refrigerator average) + 0.110 kW = 1.46 kW
Worst-case surge:
- Pump starting surge 3.0 kW plus refrigerator compressor surge 1.5 kW may not overlap perfectly, but your worksheet should use the conservative overlap if you cannot confirm sequencing.
- Conservative combined surge = 4.5 kW.
So your inverter should be selected for at least 1.46 kW continuous and ~4.5 kW surge (or whatever the manufacturer specifies for your exact model and configuration).
Add Load Shedding as a Two-Stage Worksheet
If you plan to shed noncritical loads after a set time, split the outage into stages.
Example C: 4 hours full critical, then 2 hours reduced
- Stage 1 (0–4 h): refrigerator (0.90 kWh), lights (0.36 kWh), router (0.10 kWh), fan (0.20 kWh) → 1.56 kWh
- Stage 2 (4–6 h): turn off fan and reduce lights by half
- Reduced stage energy: refrigerator 0.60 kWh + lights 0.18 kWh + router 0.05 kWh = 0.83 kWh
Total energy needed = 1.56 + 0.83 = 2.39 kWh.
Then apply efficiency and usable fraction exactly as before. This method prevents the common mistake of sizing for the worst-case load for the entire outage.
A Compact Worksheet Template You Can Reuse
Use this structure in a spreadsheet or notebook.
Energy section
- List each load: average watts, hours it runs, and compute kWh.
- Sum to get Energy needed (kWh).
Battery section
- Choose Efficiency (e.g., 0.90) and compute Battery energy required.
- Choose Usable fraction (e.g., 0.80) and compute Battery nameplate kWh.
Power section
- Compute Peak continuous kW.
- Compute Worst-case surge kW.
- Confirm inverter ratings.
If your energy math says “yes” but your power math says “no,” you don’t have a battery problem—you have a power-path problem. Fixing that early saves both time and panel space.
6. Sizing Inverters and Power Path Components
6.1 Continuous Power Versus Peak Power and Surge Handling
A home battery inverter is usually rated two ways: continuous power and peak (or surge) power. Continuous power is what it can deliver steadily for long periods without overheating or tripping protection. Peak power is the short burst it can handle for brief moments, typically to start motors or ride through brief load spikes. Surge handling is the practical question of whether the inverter can survive the “start-up moment” when a load demands more current than it normally would.
Continuous Power: The Steady-State Reality
Continuous power is the inverter’s “keep the lights on” number. If your backup plan includes running a refrigerator, a few outlets, and some lighting for hours, continuous power is the metric that matters most. A useful rule of thumb is to size continuous output so your expected steady load stays comfortably below the inverter rating, because real loads vary and efficiency losses add heat.
Example: Suppose you want to run a 900 W refrigerator compressor cycle plus 200 W of lighting and electronics. Even if the average is near 900–1100 W, the inverter must supply that continuously while the battery voltage and inverter efficiency shift. If the inverter is rated at 3,000 W continuous, you have margin for other small loads and for the compressor’s cycling behavior.
Peak Power: Short Bursts with Clear Limits
Peak power ratings exist because many appliances draw more power briefly. Induction motors, pumps, and some HVAC components can pull several times their running power for a fraction of a second. Peak power tells you the inverter can produce that extra output briefly, but it does not mean it can do it indefinitely.
Example: A microwave might be rated at 1,500 W and draw close to that while heating. That’s not a “surge” case; it’s a continuous-like case during operation. A sump pump, however, may run at 800 W but start with a much higher inrush. If the inverter’s peak rating is adequate, the start succeeds; if not, the inverter may shut down or the pump may fail to start.
Surge Handling: Inrush Current and Protection Behavior
Surge handling is where continuous and peak ratings meet the messy world of inrush current. Inrush is the initial current spike when a motor starts, when a transformer energizes, or when certain power supplies charge capacitors. Two inverters with the same “peak watts” can behave differently because surge capability depends on waveform, control strategy, and how protection thresholds are implemented.
Key idea: surge events are short, but they can be repeated. A refrigerator compressor might start every few minutes. A well pump might start less often but with a larger inrush. Your inverter must handle both the magnitude and the frequency of starts.
Example: You have a 2,000 W continuous inverter. Your critical loads include a 1,000 W well pump running load and a few small devices. If the pump’s start inrush is, say, 4–6× running power, the inverter must tolerate a brief demand that could exceed its peak rating. If it trips, the pump won’t start, and the “backup runtime” plan fails because the water never arrives.
How to Use These Ratings Together
Treat continuous power as your baseline budget, peak power as your “start-up allowance,” and surge handling as the real-world gatekeeper for motor and transformer loads.
- Estimate steady loads for the outage scenario.
- Identify loads with motors, compressors, pumps, and transformers.
- Check whether those loads’ start-up demands fit within the inverter’s surge capability.
- Add margin for inefficiency and for simultaneous starts.
Mind Map: Power Ratings and Load Behavior
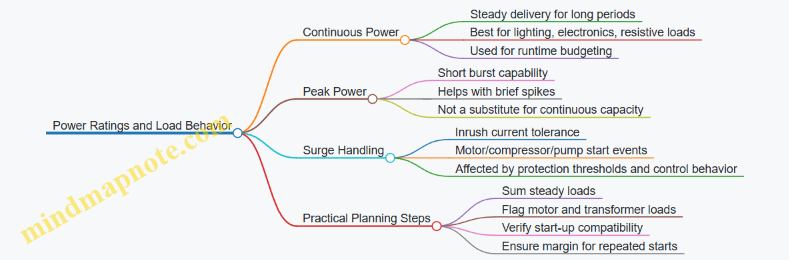
Worked Example: Choosing the Right Inverter Size
Assume you want to back up: refrigerator (running 150 W, compressor starts), a router and TV (120 W), and a sump pump (running 700 W). Steady load might average around 270 W plus cycling overhead, but the sump pump start is the risk.
If your inverter is 1,500 W continuous, it can likely handle the steady portion. The question becomes whether the sump pump’s start inrush is within the inverter’s surge handling. If the pump’s start demand is high enough to exceed peak capability, the inverter may trip during start. In that case, you either reduce the number of simultaneous motor starts (load prioritization) or choose an inverter with surge capability that matches the pump’s inrush behavior.
Quick Check: What Usually Goes Wrong
Most failures come from treating peak watts as if they were continuous watts, or from ignoring inrush on motor loads. If your plan includes pumps, compressors, or HVAC blowers, you size for continuous power for runtime and then verify surge handling for the start events. That two-step approach keeps the system predictable instead of “it worked once, so it should work again.”
6.2 Selecting Inverter Output Ratings for Mixed Load Types
Mixed loads are the normal case: your inverter must run lighting, electronics, refrigeration, and maybe a well pump or microwave. The trick is that “watts” alone rarely tell the whole story, because some loads demand short surges, some draw power in pulses, and some behave differently when the grid is present versus when you’re on battery.
Start with Load Categories That Behave Differently
Treat each connected device as one of four behavior types:
- Resistive and near-resistive: space heaters, toasters, electric ranges. They look like steady power draw.
- Inductive motors: refrigerator compressors, HVAC blowers, well pumps. They create starting surges and may stall if voltage dips.
- Power electronics: TVs, chargers, LED drivers, computers. They often draw current in short bursts and may be sensitive to waveform quality.
- Mixed appliances: microwave ovens, washing machines, some kitchen equipment. They combine electronics with motor or resistive elements.
A practical mindset: your inverter rating must cover both steady-state power and starting/peak events, plus enough headroom that voltage doesn’t sag when multiple loads overlap.
Build a Simple Rating Model from Real Numbers
Use three values per load:
- Running watts (Wrun): what it consumes once it’s stable.
- Starting watts (Wstart) or starting current: what it needs at the moment it turns on.
- Duration and overlap: how long the surge lasts and whether other loads start at the same time.
If you only have nameplate watts, estimate starting using motor type guidance from the device label or typical motor behavior. If you have a clamp meter and a watt meter, measure at least one start event. For example, a refrigerator might run at 150 W but briefly spike to 900–1,500 W during compressor start.
Choose Continuous Output for Steady Loads
Continuous rating is what the inverter can supply without overheating or shutting down. Add up the running watts of all loads that are likely to be on together.
Example: you plan to run refrigerator (150 W), LED lighting (60 W), router and TV (80 W), and a small fan (40 W). Total running watts = 330 W. If you expect occasional additional loads like a laptop charger (20 W), you might target 350–400 W continuous capacity.
In practice, you also want headroom for efficiency losses and uncertainty. A common planning approach is to size continuous capacity so your expected steady load uses roughly 60–80% of the inverter’s continuous rating.
Add Surge Capability for Motor and Mixed Loads
Surge events are where undersizing shows up. Motors can require several times running power for a fraction of a second. Inverter datasheets often specify a surge rating, but the conditions matter: surge duration, number of cycles, and whether it assumes a single motor start.
Example: if your well pump draws 1,200 W running and needs a 6× surge, the start event could be around 7,200 W for a short time. If your inverter’s surge rating is only 3,000–4,000 W, it may trip even if the continuous rating is adequate.
When multiple motors can start close together, treat it like a worst-case overlap problem. If the refrigerator compressor and a pump can both start during an outage, you must ensure the inverter can handle the combined surge scenario or prevent simultaneous starts with load management.
Mind the Inverter’s Output Voltage Stability
Even if the inverter can “make the watts,” it must keep voltage within a usable range during surges. Voltage droop can cause motor stalling, which then increases current draw and can trigger protection.
A useful check is to compare expected surge current against the inverter’s ability to maintain output voltage. If the inverter uses a stepped or modified waveform, some electronics may behave differently; however, for motor starts, the key issue is voltage stability during the first cycles.
Apply a Worked Selection Example
Assume these critical loads during an outage:
- Refrigerator: 150 W running, ~1,200 W start
- Microwave: 1,500 W running, ~1,800 W peak
- LED lighting: 60 W running
- Well pump: 1,200 W running, ~7,200 W start
Step 1: Continuous estimate. If you run refrigerator + lighting + microwave while the pump is off: 150 + 60 + 1,500 = 1,710 W. Add headroom for losses and uncertainty → target about 2,000 W continuous.
Step 2: Surge check. If the pump starts while the microwave is running, you must consider microwave peak plus pump surge. That overlap could exceed many residential inverters. The solution is either:
- Choose an inverter with surge capacity that explicitly supports that overlap, or
- Use load prioritization so the pump start is allowed while microwave is off, or
- Stage starts so only one high-surge event occurs at a time.
Mind Map: Mixed Load Inverter Rating
Quick Rule of Thumb That Still Holds Up
If your mixed-load plan includes at least one motor start, select the inverter based on the largest surge scenario you allow, then verify the continuous rating for the steady loads you expect to run during that same period. If those two requirements conflict, don’t force the inverter to guess—use load priorities so the system behaves predictably.
6.3 Parallel Inverter Configurations and Load Sharing Basics
Parallel inverter setups let you combine multiple inverters to serve the same AC bus. The goal is simple: share load current so no single inverter is overloaded, while keeping voltage and frequency stable enough for typical household equipment. The details are not magic; they are control signals, synchronization, and protection.
Foundational Concepts for Parallel Operation
Start with what must match for two inverters to “agree.” They need synchronized output frequency (so waveforms line up), coordinated voltage magnitude (so current doesn’t fight between units), and compatible control modes (so both respond to changes in the same way). In practice, parallel systems use either a master-slave arrangement or peer-to-peer sharing with a shared control bus.
Load sharing is about current distribution, not just total power. If one inverter is slightly “stiffer” (holds voltage more firmly), it can take more current, which may be fine until it hits its limits. Good systems intentionally add droop characteristics or use active current sharing so the inverters split the load predictably.
Master Slave Versus Peer to Peer Sharing
In master-slave, the master sets the reference for voltage and frequency. Slaves follow and adjust their output current to match the commanded share. This reduces complexity, but it concentrates responsibility in the master.
In peer-to-peer sharing, inverters exchange status and adjust output based on measured bus conditions and sharing signals. This can improve robustness, but it requires tighter coordination and more careful commissioning.
Either way, the system must handle the “what if” moments: one inverter trips, one inverter starts later, or a communication link hiccups. The safest behavior is usually to isolate the failing unit quickly and let the remaining units carry what they can.
Current Sharing Mechanisms That Actually Work
Two common approaches are droop-based sharing and active current sharing.
Droop-based sharing uses a controlled relationship between output current and output voltage reference. As load increases, voltage reference slightly decreases, encouraging other inverters to take more current. It’s like multiple people taking turns carrying a box: if one person starts to strain, the system nudges the others to help.
Active current sharing uses feedback signals so each inverter measures its output current and adjusts to match a target ratio. This can be more accurate, especially when inverter ratings differ or when loads are dynamic.
Protection and Isolation Requirements
Parallel operation is only safe if protection is coordinated. Each inverter needs overcurrent and overvoltage protection, and the AC bus needs a way to prevent backfeed into a tripped inverter. Anti-islanding logic matters when grid-tied behavior is involved, but even in off-grid mode you still want to prevent one inverter from “feeding” another through unintended paths.
A practical rule: treat the AC bus like a shared road. You still need lane barriers—breakers, contactors, fuses, and control interlocks—so a vehicle that breaks down doesn’t block traffic or cause a pileup.
Sizing and Dispatch with Parallel Inverters
When you parallel inverters, you size for both steady-state and surge. Refrigerators, well pumps, and some compressors can draw high starting current. The system should allocate surge capability across units rather than forcing one inverter to absorb all the inrush.
A useful planning method is to list loads by priority and then estimate both continuous watts and peak surge watts. If your peak surge exceeds a single inverter’s surge rating but fits within the combined surge capability, parallel sharing can make the difference—assuming the control system is configured to allow it.
Mind Map: Parallel Inverter Load Sharing Basics
Example: Two Inverters Sharing a Mixed Load
Assume two 5 kW inverters are paralleled to feed a critical-load panel. The home has lighting (800 W continuous), a refrigerator (150 W average, higher at startup), and a microwave (1,200 W for short bursts). If the inverters are configured for balanced current sharing, each inverter might carry roughly half the continuous load: about 475 W each for the lighting plus refrigerator average.
When the microwave starts, total power jumps. A well-configured system will momentarily increase current draw from both inverters, keeping each within its surge capability. If one inverter were misconfigured to be “too stiff” (for example, wrong droop settings or mismatched current sharing parameters), it could take most of the surge, causing an early trip even though the combined rating would have been sufficient.
Example: One Inverter Trips During an Outage
Now suppose one inverter trips due to an internal fault. A properly designed parallel system should detect the loss, open its isolation path, and continue powering the bus with the remaining inverter. The load may need to be reduced if the remaining inverter cannot cover the full demand. This is where load prioritization and load shedding settings matter: the system should drop nonessential circuits so the remaining inverter stays within safe operating limits.
Practical Commissioning Checks
Commissioning is where theory becomes reality. Verify that both inverters report synchronized frequency and that current sharing signals (or droop parameters) match the intended configuration. Confirm that breakers and contactors isolate each inverter correctly during faults. Finally, test with a controlled load step—first a moderate load, then a higher load—so you can observe whether current splits as expected rather than guessing.
Parallel inverter systems are cooperative by design. When synchronization, sharing control, and protection are aligned, the result is predictable power delivery instead of a tug-of-war between units.
6.4 Designing The Power Path For Safe Switching And Isolation
A home battery backup system is only as safe as its power path. “Power path” means the physical and electrical routes that energy takes from battery to loads, and the devices that decide when that energy is allowed to flow. Designing it well prevents backfeeding, reduces fault energy, and makes transfer behavior predictable.
Core Principles for a Safe Power Path
Start with separation. Battery DC power must be isolated from AC distribution except through controlled conversion stages. Then add controlled switching. The system should ensure that during grid outage, loads are fed from the inverter (or inverter output bus) without any path that could energize the utility side.
Next, control fault energy. Every segment of the power path needs appropriate overcurrent protection and disconnect capability. If a cable fails, the protection should clear the fault quickly enough to limit damage and keep the rest of the system stable.
Finally, design for serviceability. You want clear disconnect points so maintenance doesn’t require guessing which conductors are live. Labels and consistent wiring topology are not paperwork; they are part of the safety mechanism.
Power Path Topology from Battery to Loads
A typical architecture has these stages:
- Battery DC side: battery disconnect, DC fusing (if required), and a DC bus that feeds the inverter.
- Inverter conversion stage: DC-to-AC conversion with internal protection and monitoring.
- AC output stage: inverter output breaker or switchgear feeding a protected bus.
- Transfer and isolation stage: a transfer switch or contactor-based logic that connects either the utility source or the inverter source to the selected panel(s).
- Load distribution: breakers for branch circuits, with load shedding or priority circuits upstream if used.
The key is that the transfer stage must enforce electrical exclusivity: utility and inverter cannot be connected to the same bus at the same time.
Switching Devices and Their Roles
Transfer switches come in different operational styles, but the safety requirement is consistent: no parallel connection of sources unless the design explicitly supports it with engineered synchronization and protection. For most residential backup systems, the safe default is hard exclusivity.
Use these roles to guide selection:
- Disconnects: provide visible isolation for maintenance and fault clearing.
- Breakers: interrupt fault current based on ratings and trip characteristics.
- Contactors: switch under control logic, often used where staged transfer is needed.
- Interlocks: prevent unsafe combinations of device states.
If you use contactors, treat control wiring as part of the safety system. A “mechanically interlocked” arrangement is stronger than relying only on software logic.
Isolation Strategy for Grid Safety
Isolation is not just a transfer switch. It includes ensuring that any control paths, sensing circuits, and auxiliary power supplies cannot create unintended energization.
A practical checklist for isolation design:
- Confirm that the transfer mechanism provides positive separation between utility and inverter outputs.
- Ensure that the inverter output is blocked when it is not supposed to feed the loads.
- Verify that any neutral handling is consistent with the inverter design and local code requirements.
- Use grounding and bonding in a way that supports fault clearing without creating stray return paths.
A simple example: if a transfer switch fails closed, the system could backfeed the utility. Proper interlocking plus correct breaker placement reduces the chance that a single failure energizes the wrong side.
Fault Path Planning with Protection Coordination
Design the fault path so that faults clear locally. That means:
- DC faults are handled by DC-rated protection on the battery side.
- AC faults are handled by AC-rated breakers on the inverter output and downstream buses.
- Short-circuit current levels are considered when selecting interrupting ratings.
Example: Suppose a branch circuit short occurs in the “critical loads” panel. The branch breaker should trip first, keeping the inverter output bus intact. If the bus breaker trips instead, you lose all critical loads and increase downtime.
Control Logic for Safe Switching Behavior
Safe switching behavior is about sequencing. The system should:
- Detect grid loss using defined thresholds.
- Confirm inverter readiness.
- Switch loads to inverter output.
- Maintain stable operation until grid returns.
- Switch back with a defined return sequence.
During switching, avoid conditions where both sources could be connected. That is why interlocks and device timing matter.
Mind Map: Power Path Safety and Isolation
Example: Designing a Two-Source Exclusivity Path
Imagine a system that backs up only a critical loads panel. The power path can be arranged so the critical panel is fed from a dedicated “backup bus.” The transfer switch connects the backup bus either to utility or to the inverter output.
To keep it safe:
- Place an inverter output breaker between inverter and backup bus.
- Use a transfer switch that enforces exclusivity, not one that merely “tries” to avoid overlap.
- Add interlocks so the utility feed and inverter feed cannot be closed together.
- Coordinate breaker ratings so a fault on the backup bus trips the closest appropriate device.
This design makes the system behavior easy to reason about: when the utility is present, the inverter output is isolated; when the utility is absent, the inverter output is the only source that can reach the critical panel.
Example: Isolation Through Service Disconnects
Consider maintenance. If a technician needs to service the inverter, they should be able to open a clearly labeled disconnect that removes DC energy and prevents AC energy from reaching the loads. That typically means a battery disconnect on the DC side and an AC disconnect or breaker on the inverter output side.
When those disconnects are placed in the power path correctly, the system supports safe troubleshooting without requiring removal of covers while parts are still energized. Safety is a design property, not a hope.
6.5 Verifying Compatibility With Transfer Equipment And Panel Layout
Compatibility is less about brand matching and more about electrical behavior: how the transfer device routes power, how the panel is wired, and how the inverter expects to see the world. A good verification pass prevents the two most common surprises—either the inverter never sees a valid load path, or the transfer switch creates a momentary condition that trips protection.
Start with the Transfer Switch Behavior
First confirm the transfer switch type and its switching sequence. A make-before-break device can briefly connect sources at the same time, which is usually not what an inverter wants. A break-before-make device is typically safer because it removes one source before applying the other.
Next check whether the transfer switch is designed for inverter output characteristics. Inverters can present different waveforms and voltage regulation behavior than the utility. Verify that the transfer switch control logic is compatible with the inverter’s “grid present” detection method, if the system uses it.
Example: If your transfer switch uses a control input that expects utility voltage to be present on a specific conductor, but your inverter system feeds that conductor through a different path, the switch may refuse to transfer. The fix is wiring alignment, not inverter replacement.
Map the Panel Layout to the Power Path
Create a simple panel map before you touch settings. Mark:
- The main service disconnect and where utility power enters.
- The backup feed point(s) that the transfer switch energizes.
- Any subpanels, critical-load panels, or branch circuits that are intended to run on backup.
- Neutral and ground bonding points, including whether the system uses a neutral-to-ground bond inside the inverter.
Then verify that the backup circuits are actually connected to the transfer output, not accidentally left on the utility side. This is easy to miss when circuits are labeled but wiring is older than the labels.
Example: A refrigerator circuit is labeled “critical,” but it lands on a breaker fed from the utility bus. During an outage, the refrigerator stays off while other loads run, because the transfer switch never energizes that breaker.
Confirm Neutral Handling and Grounding Assumptions
Many inverter systems require strict neutral handling. Some designs bond neutral to ground only when operating in backup mode; others expect the neutral bond to be handled elsewhere. If the transfer switch or panel wiring introduces an unintended parallel neutral path, you can get nuisance trips or unsafe current on grounding conductors.
Check three items:
- Whether the transfer switch switches the neutral conductor.
- Whether the inverter has an internal neutral-ground bond.
- Whether the panel has a separate neutral bar and how it is bonded.
Example: If the transfer switch does not switch neutral but the inverter bonds neutral internally, you may end up with neutral current returning through ground paths when certain loads are present.
Validate Circuit Protection and Inrush Compatibility
Compatibility also includes protection coordination. The inverter output rating must cover the largest branch circuit loads you plan to run, including starting surges from motors and compressors.
Verify that:
- Breakers on the backup-fed circuits are correctly sized for the loads.
- Any AFCI/GFCI devices are compatible with inverter output and switching behavior.
- The transfer switch and inverter can handle the inrush timing when multiple loads start at once.
Example: A well pump and a garage door opener on the same backup path can cause a brief overload. Even if the inverter’s continuous rating is sufficient, the surge may trip it if both start simultaneously.
Use a Compatibility Checklist with Measurable Checks
Run a checklist that ties wiring to behavior.
- Transfer timing: confirm break-before-make behavior by observing control status during a test.
- Voltage presence: verify that the inverter sees the expected load voltage at the backup output.
- Neutral continuity: confirm neutral routing matches the inverter’s bonding requirements.
- Breaker assignment: verify each “backup” breaker is fed from the transfer output.
- Load test: test one high-inrush load at a time, then the planned combination.
Mind Map: Compatibility Verification Flow
Example: Critical Loads Panel with Transfer Output
Assume you have a critical loads subpanel fed through a transfer switch. During outage testing, you notice the microwave works but the sump pump does not.
- Panel map shows the sump pump breaker is in the critical subpanel.
- Neutral bar inspection reveals the sump pump neutral is landed on a utility-side neutral bar due to a misrouted conductor.
- The inverter’s neutral bonding mode expects neutral to be routed through the backup path.
- After correcting the neutral landing to the subpanel neutral bar fed by the transfer output, the sump pump starts reliably.
This example highlights the key idea: compatibility is proven by routing correctness and measured behavior, not by the fact that the breaker is “labeled critical.”
Common Failure Patterns to Watch For
- Backup breakers fed from the wrong bus: labels don’t guarantee wiring.
- Neutral mismatch: neutral switching and inverter bonding disagree.
- Inrush overload at transfer: multiple motor loads start together.
- Control input mismatch: transfer logic expects utility voltage on a conductor that isn’t present.
A systematic verification pass turns these from mysteries into checkable items, and it keeps the system from making decisions you didn’t intend.
7. Whole Home Versus Critical Loads Architectures
7.1 Critical Loads Panels and Load Shedding Strategies
A critical loads panel is a dedicated subpanel fed by your backup system so only selected circuits stay powered during an outage. The goal is simple: keep the essentials running without oversizing the battery and inverter for every device in the house. Load shedding strategies are the practical tools that decide what stays on, what turns off, and what comes back in a controlled way.
Critical Loads Panel Purpose and Boundaries
Start by defining “critical” in terms of behavior during an outage, not just importance during normal life. For example, a refrigerator is critical because it must maintain temperature, while a microwave is useful but not required for survival. A sump pump is critical because it prevents property damage, but it may still be acceptable to run it on a priority schedule if the battery is limited.
A critical loads panel typically includes:
- Refrigeration and freezer circuits
- Well pump or sump pump circuits
- Furnace or boiler control power
- Router, modem, and security system
- Lighting circuits that support safe movement
- Selected outlets for medical devices or charging
It usually excludes:
- Large resistive loads like space heaters and electric water heaters
- Multiple high-inrush appliances at the same time
- Nonessential entertainment circuits
This boundary matters because inverter sizing is driven by peak power and surge, while battery sizing is driven by energy over time. Keeping the panel lean reduces both.
Load Shedding Logic from First Principles
Load shedding is not just “turn things off.” It is a set of rules that respond to battery state, inverter limits, and time since transfer.
Use three layers of control:
- Circuit selection: Put only critical circuits on the critical loads panel.
- Priority tiers: Within the panel, separate loads into Tier 1 (must run) and Tier 2 (run if power allows).
- Automatic control: Use relays, smart breakers, or a load controller to drop Tier 2 when conditions tighten.
A common, easy-to-understand rule set:
- Tier 1: stays on until the battery reaches a defined low-energy threshold.
- Tier 2: turns off when inverter output approaches a set limit or when battery state of charge falls below a threshold.
- Tier 2: returns in steps after the system stabilizes, rather than all at once.
Mind Map: Critical Loads Panel Design Flow
Practical Examples That Make the Rules Real
Example: Refrigerator and Freezer with a Simple Tier Plan
Assume your critical panel includes a refrigerator and a freezer. Both cycle on compressors, so they create periodic surges. Put them in Tier 1 and avoid adding other compressor-heavy loads to the same tier. If you also want a dehumidifier, place it in Tier 2 so it can be shed when the compressors are likely to start.
A good operational habit is to observe the system during a test outage: if Tier 2 loads cause frequent compressor starts to overlap, you will see longer compressor run times and faster battery depletion.
Example: Sump Pump Priority with Inrush Awareness
A sump pump motor can draw high starting current. Even if its average power is modest, the start surge can stress the inverter. Keep the sump pump on Tier 1 and avoid pairing it with other motor starts on the same time window. If you have a second pump or a backup well pump, consider a controller that prevents both from starting simultaneously.
Example: Furnace Controls and Ignition
Furnace systems often have a control board and a blower. The control board is usually low power, but the blower can be significant. Put the control board on Tier 1 and the blower on Tier 2 if your runtime target is tight. During shedding, the furnace may still cycle safely if the blower is managed, but you must match the strategy to the furnace’s control behavior.
Advanced Details Without the Headaches
Staged Re-energization
When power returns after shedding, bring loads back in steps. If you re-energize Tier 2 circuits all at once, you can recreate the same overload condition that triggered shedding. Staging by 10–30 second intervals is often enough to separate compressor starts and motor inrush events.
Avoiding “Hidden” High Loads
Some circuits look small on paper but behave large in practice. Examples include:
- Kitchen outlets that power a toaster and a microwave
- Laundry circuits that run a dryer or iron
- Garage outlets that charge tools
If those circuits are on the critical panel, you can accidentally defeat the whole point of the design. Use either circuit selection or controlled outlets so the critical panel stays predictable.
Mind Map: Load Shedding Triggers and Actions
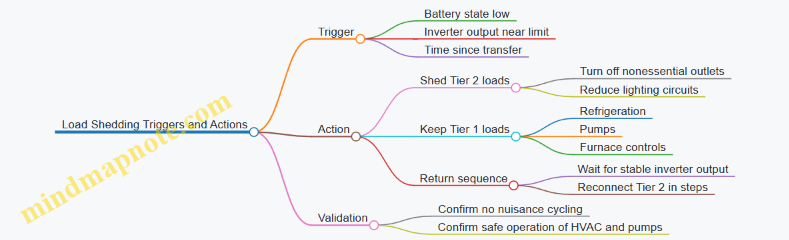
Quick Checklist for a Clean Implementation
- Every circuit on the critical loads panel has a written reason.
- Tier 1: loads are limited to those that must run continuously.
- Tier 2: loads are grouped so shedding removes the biggest energy and surge contributors.
- Return-to-service is staged to prevent simultaneous inrush.
- A test outage confirms that shedding actually improves runtime without breaking critical equipment behavior.
7.2 Whole Home Backup With Main Panel Integration
Whole home backup means the battery system can power most or all branch circuits through the home’s main distribution path. The key idea is simple: instead of feeding only a small critical-load panel, you integrate the backup source into the main panel so normal breakers can operate during an outage. The practical work is in transfer switching, interlocks, and load-path planning so the system behaves predictably when the grid is present and when it is not.
Core Architecture and Power Path
Start with the main panel as the “traffic controller.” In a whole home setup, a transfer mechanism routes either the utility service or the inverter output to the main panel bus. When the grid is healthy, the transfer device keeps the inverter isolated and the main panel receives utility power. When the grid fails, the transfer device connects the inverter to the main panel bus so the same branch circuits you normally use can run.
A common configuration uses:
- A battery inverter with AC output sized for the home’s expected backup demand.
- A transfer switch or transfer breaker arrangement that switches the service feed to the main panel.
- Required disconnects and protection devices on both sides of the power path.
A helpful mental model is “one bus, two sources, never both.” If both sources ever share the bus, you risk backfeeding the grid and creating unsafe conditions.
Transfer Switching and Interlocks
Whole home integration depends on transfer behavior that is both fast enough for comfort and safe enough for compliance. You typically choose between:
- Service-rated transfer switches that switch the entire service feed.
- Main breaker transfer schemes that coordinate the main breaker and backup source.
Interlocks ensure the main breaker and transfer contacts cannot be in conflicting states. For example, if the transfer device is in “backup connected,” the utility path must be physically or electrically prevented from energizing the main bus. If the transfer device is in “utility connected,” the inverter must be disconnected.
A good commissioning checklist includes verifying:
- Transfer timing and sequencing.
- That the inverter’s anti-islanding behavior aligns with the transfer device.
- That control wiring signals match the intended states.
Load Management Reality Check
Whole home backup does not mean “unlimited runtime with every circuit.” The inverter output and battery energy still set hard limits. The main panel will happily energize everything you have turned on, including starting loads like HVAC compressors and refrigerators.
To keep the system stable, you plan for two constraints:
- Power limit: the inverter can only supply so many watts at once.
- Energy limit: the battery can only supply so many watt-hours before it needs recharge.
A practical approach is to design a “normal outage behavior” that users can follow without guesswork. For instance, you might keep the HVAC on a temperature setpoint that reduces compressor cycling, and you might avoid running multiple high-draw appliances simultaneously during the first hour of an outage.
Example Main Panel Integration Scenario
Consider a home with a 200 A main panel and a battery inverter designed for 8 kW continuous output. The installer selects a service-rated transfer switch that switches the service feed to the main panel. During an outage, the transfer switch connects the inverter to the main bus.
If the family turns on the microwave (1.5 kW), toaster (1.2 kW), and hair dryer (1.8 kW) at the same time, the inverter may approach its limit. The system should either manage the load through inverter behavior or the user should reduce simultaneous loads. Meanwhile, the refrigerator and some lighting continue running because they are on branch circuits that remain energized through the main bus.
The win here is operational simplicity: the same breakers that work on utility power work on backup power, and the user does not need to remember which circuits are “special.” The tradeoff is that you must size the inverter and battery with realistic outage usage in mind.
Mind Map: Whole Home Backup with Main Panel Integration
Commissioning Steps That Prevent “Surprises”
After installation, verify the system under controlled conditions. Confirm that the transfer device switches cleanly, that the main panel bus is de-energized from utility during backup, and that the inverter output remains within its configured limits. Finally, label the panel and transfer controls clearly so the household understands what to expect when the grid returns and the system transitions back to utility power.
7.3 Choosing Between Manual and Automatic Load Management
Load management decides what runs during an outage when battery energy and inverter power are limited. The choice between manual and automatic approaches comes down to how quickly you want decisions made, how predictable your household loads are, and how much effort you’re willing to spend during a stressful moment—ideally zero, but reality is flexible.
Core Concept: What “Management” Actually Controls
Most residential systems can manage loads in three ways:
- Selection: which circuits are eligible to receive backup power.
- Timing: when eligible circuits are allowed to run.
- Power limiting: how much total power is permitted at once.
A manual strategy typically controls selection and timing by human action. An automatic strategy controls selection, timing, and sometimes power limiting using relays, smart panels, or inverter/EMS logic.
Manual Load Management: When It Works Best
Manual load management is simplest: you predefine a set of critical circuits, and during an outage you switch other loads off or back on as needed. It’s usually implemented with a critical loads panel, a manual transfer approach, or a load-shedding panel with manual override.
Strengths
- Predictable behavior: you decide what runs.
- Lower complexity: fewer sensors and control paths.
- Easier troubleshooting: if something is off, you can trace it to a switch position.
Tradeoffs
- Human reaction time becomes part of the system design.
- Starting loads can still surprise you. For example, a refrigerator restart plus a microwave start can exceed inverter surge capability even if the average load looks fine.
Concrete example You back up the refrigerator, router, and a few lights. When the outage starts, you leave the refrigerator on and keep the microwave and dryer off. After an hour, you turn on the microwave for 2 minutes, then turn it off again. This works because your plan matches your actual habits.
Automatic Load Management: When It Adds Real Value
Automatic load management uses logic to reduce or sequence loads without requiring immediate human action. Common implementations include smart load controllers, energy management systems, or panels that shed noncritical circuits when power or battery state crosses thresholds.
Strengths
- Fast response: it can shed loads within seconds.
- Better handling of starting surges: it can delay a high-inrush load until the inverter has headroom.
- Consistent outcomes: two outages behave similarly if conditions match.
Tradeoffs
- Configuration matters: thresholds and priorities must be set correctly.
- Debugging can be harder: a circuit may be “on” but effectively blocked by logic.
- False shedding risk: if thresholds are too tight, comfort loads may cycle unnecessarily.
Concrete example Your system prioritizes HVAC, then refrigeration, then outlets. During an outage, the controller watches inverter output and battery state. If the HVAC compressor starts and power draw spikes, the controller temporarily disables a noncritical water heater circuit for 10 minutes, then re-enables it when power drops.
Decision Framework: Choosing Between Them
Use this sequence to decide without guesswork:
-
List your highest-risk loads
- Identify loads with large inrush or frequent cycling: HVAC compressors, well pumps, garage door openers, microwave use, and EV chargers.
-
Estimate your “operator burden”
- If you expect multiple people to manage loads, manual can work well if everyone knows the plan.
- If you expect long absences or limited ability to respond, automatic becomes more attractive.
-
Match control granularity to your household
- If you only need a few circuits backed up, manual selection is often enough.
- If you want many circuits to be usable but not all at once, automatic sequencing helps.
-
Set expectations for comfort versus certainty
- Manual gives certainty about what you turned on.
- Automatic gives certainty about what the system will do when conditions change.
Mind Map: Manual Versus Automatic Load Management
Practical Hybrid Approach
Many homes benefit from a hybrid: manual selection for safety-critical circuits and automatic shedding for everything else. For instance, keep refrigeration and internet on a critical loads panel, then let the controller manage a “comfort” group that includes HVAC and outlets.
Concrete example During an outage, you never touch the critical panel. The controller manages HVAC and water heating. If the battery is low, it sheds the water heater first, then reduces HVAC duty by cycling, while keeping the refrigerator uninterrupted.
Summary: A Simple Rule That Holds Up
Choose manual when your load list is small and your household can follow a clear action plan. Choose automatic when starting surges and changing usage patterns would otherwise force you to make fast decisions. If you want both safety and convenience, combine them: keep the essentials fixed, and let the system handle the rest.
7.4 Designing Branch Circuit Routing for Backup Availability
Branch circuit routing decides what your backup system can actually power when the grid disappears. The goal is simple: keep critical loads on circuits that are reachable by your backup power path, with safe switching and predictable behavior.
Start with a clear map of your electrical “territory.” Identify the panel(s) that will be fed by the backup source—either a critical loads subpanel or the whole-home transfer arrangement. Then list every branch circuit that lands in those panels. If a circuit is in the wrong panel, it can’t be “fixed” by clever settings later; it must be physically routed or reassigned.
Next, treat circuit routing as an energy and safety problem, not just a wiring problem. Backup inverters have limits on continuous power, surge power, and allowable loads per phase. Routing determines which loads share the same inverter output and which loads can be shed together. For example, if your refrigerator and microwave are on the same branch circuit, the microwave’s surge can stress the inverter at the exact moment the refrigerator compressor starts. If they are on separate circuits, you can prioritize one and shed the other.
Step 1: Build a Circuit Inventory That Matches Your Backup Plan
Create a circuit inventory table with three columns: circuit name, load type, and backup eligibility. Load type matters because it predicts surge and runtime behavior.
- Lighting and electronics: usually steady, low surge.
- Refrigeration and HVAC: compressor start surges.
- Well pumps and garage doors: high inrush and long starts.
- Water heaters: often resistive and power-hungry.
Example: If “Kitchen Receptacles” includes a toaster and a coffee maker, you may still route it to backup, but you’ll want a priority rule that discourages simultaneous high-draw use. If you instead split “Kitchen Receptacles” into “Countertop outlets” and “Appliance outlets,” you can keep the backup circuit focused on essentials.
Step 2: Choose a Routing Strategy That Minimizes Surprises
There are two practical routing strategies.
- Panel-based routing: Move or reassign circuits so critical loads land in the backup-fed panel. This is the most straightforward because the panel becomes your “selection mechanism.”
- Circuit-based routing: Keep circuits where they are, but route their conductors through relays or switching devices that isolate them during outages. This can work well in existing homes, but it requires careful labeling and testing.
Panel-based routing is usually easier to verify. Circuit-based routing can reduce panel changes, but it demands disciplined documentation so you don’t end up with a circuit that looks “critical” on paper but isn’t actually switched.
Step 3: Plan for Surge, Not Just Watts
Branch circuits should be grouped to avoid stacking multiple surge-heavy loads onto the same backup path.
- Put compressor loads on their own circuits when possible.
- Avoid combining pump motors with other motor loads unless you have surge headroom.
- If you must share, plan load shedding so only one motor-start event is likely at a time.
Example: A typical “Laundry” circuit might include a washer and a dryer outlet. The washer is modest, but the dryer can be large and resistive or motor-driven depending on type. If the dryer is on backup, your inverter may run out quickly. Better: route washer receptacle to backup and keep dryer on grid-only, or split the dryer circuit if the wiring allows.
Step 4: Respect Phase and Neutral Behavior
In split-phase systems, branch circuits are assigned to different legs. In a backup-fed setup, you want balanced loading across legs so one leg doesn’t overload while the other sits idle.
- Identify which circuits land on each leg.
- When selecting circuits for backup, distribute high-draw loads across legs.
- Verify neutral handling in the transfer arrangement so neutral current paths remain correct.
Example: If all backup circuits are on one leg, a single high-load event can trip protection even if total system power seems adequate.
Step 5: Use Clear Labels and Physical Markers
Routing without labeling is how “mystery loads” happen. Label every circuit at the panel and at any switching device. Use consistent naming that matches your inventory.
Example: Label “CRIT-REFRIG” on the breaker and “CRIT-REFRIG” on the transfer-fed panel schedule. If you later add a device, you’ll know whether it belongs on backup.
Step 6: Validate with a Practical Test Plan
Before finalizing, verify that each backup-eligible circuit is actually energized during an outage simulation.
- Confirm transfer timing and that the backup source reaches stable output before sensitive loads are energized.
- Measure inverter output during a controlled test with representative loads.
- Confirm that load shedding works as intended when multiple priority tiers are present.
A simple test sequence: start with lighting, then add a steady load (like a fridge), then add one surge load (like a pump) while watching for trips.
Mind Map: Branch Circuit Routing for Backup Availability
Example: Routing a Common Critical Set
Assume you want backup for refrigeration, internet gear, a few lights, and a well pump.
- Route refrigerator to a dedicated backup circuit.
- Route internet and modem to a low-power lighting/electronics circuit.
- Route selected lights to a lighting circuit with no motor loads.
- Route well pump to its own circuit and ensure it is in the highest priority tier that won’t overlap with other surge loads during the same outage window.
This structure keeps surge events from competing with each other and makes your runtime behavior predictable, which is the real win of good branch circuit routing.
7.5 Example Architectures for Common Residential Layouts
A good architecture starts with two decisions: what you want to keep running during an outage, and how you want to move power from the grid to the battery. The examples below assume a typical residential setup with a battery, an inverter, and a transfer method. The key differences are where the transfer happens and how loads are grouped.
Mind Map: Architecture Choices and Load Grouping
Example: Small House with Critical Loads Panel
This layout suits homes where you want lights, internet, refrigerator, and a few outlets, but you do not need the whole HVAC system.
How it’s wired conceptually
- A critical loads subpanel receives power through a transfer device.
- The battery inverter feeds the critical loads subpanel when the grid is down.
- Noncritical circuits remain on the main panel and go dark during outages.
Load grouping approach
- Tier 1: refrigerator, modem/router, a few lighting circuits.
- Tier 2: microwave or kitchen outlets used intermittently.
- Tier 3: optional loads that you manually turn off.
Why this works
- The inverter only has to cover a smaller set of circuits, so you can size the inverter and battery for predictable runtime.
- Transfer behavior is simpler because the rest of the house is isolated.
Practical example If your refrigerator averages 150 W and your lighting averages 60 W, you can plan for several hours without needing to run large appliances. When the grid fails, you keep the critical subpanel on and avoid starting high-surge loads like a well pump or compressor.
Example: Typical Suburban House with Whole-Home Backup and Load Priorities
This layout targets comfort: most circuits stay powered, but you still manage energy during an outage.
How it’s wired conceptually
- A transfer device interfaces with the main panel so the inverter can support the home.
- A load management strategy prevents the system from trying to run everything at once.
Load management approach
- Use priority tiers inside the home’s circuits.
- When the outage starts, essential loads come first; larger loads are delayed or shed.
Practical example
- Tier 1: refrigerator, lighting, outlets for phones and laptops.
- Tier 2: HVAC blower and controls.
- Tier 3: water heater and dryer.
During an outage, the system can allow HVAC to start but shed the water heater if battery power is limited. This avoids the common failure mode where the inverter trips because multiple high-draw loads overlap.
Why this works
- Whole-home backup reduces the number of manual decisions.
- Load priorities keep the inverter within its surge and continuous limits.
Example: Large Home with Multiple HVAC Zones and Staged Shedding
Larger homes often have multiple HVAC zones, a larger water heater, and more motors. The architecture needs to handle both surge power and runtime.
How it’s wired conceptually
- Either a main-panel transfer with advanced load management, or a hybrid approach with a critical panel plus additional “managed” circuits.
- Staged shedding uses measured power and circuit control to keep the system stable.
Load management approach
- Stage 1: keep controls and one HVAC zone running.
- Stage 2: allow additional zones only if battery state and inverter headroom permit.
- Stage 3: shed nonessential motor loads first, then resistive loads.
Practical example If two zones call for heat simultaneously, the system can run one zone and pause the second until the first reaches a steady draw. This reduces the chance of repeated starts that drain the battery faster than expected.
Why this works
- Motor loads and compressor starts are where many designs get surprised.
- Staging turns a “binary” outage into a controlled sequence.
Mind Map: Load Priorities That Match Real Behavior
Validation Checklist for Any Example Architecture
Before you treat an architecture as “done,” verify three things: (1) the inverter can handle the largest expected surge, (2) the battery runtime matches the tier plan, and (3) transfer and load shedding do not cause nuisance resets. For instance, if your HVAC has a hard start or a long blower ramp, you size for that behavior rather than the nameplate rating. If your water heater is on a thermostat with a large duty cycle, you plan it as a Tier 3 load so runtime stays predictable.
8. Solar Integration with Battery Backup Systems
8.1 Solar Production Basics for Sizing and Dispatch Planning
Solar sizing starts with one simple question: how much usable energy can your panels deliver during the hours you actually need it? The answer depends on sunlight availability, system losses, and how your battery and inverter choose what to do with that energy.
Solar Inputs That Determine Energy Output
Begin with irradiance, the sunlight intensity hitting the array. In practice, you’ll use site data or utility-grade estimates expressed as peak-sun-hours (PSH). One PSH means the irradiance level equivalent to 1 kW/m² for one hour. If your location averages 4 PSH on a given day, a 10 kW DC array might produce roughly 40 kWh before losses.
Next, account for temperature. Panels typically lose efficiency when the cell temperature rises. A hotter day can reduce output even if the sky looks clear. Then consider angle and shading. Tilt and orientation affect how much of the sun’s path your panels “see,” while even partial shading can disproportionately reduce output because strings may be forced to operate at the shaded module’s limits.
Finally, include losses across the chain: DC wiring, inverter conversion, soiling, and clipping when the inverter is undersized. A practical planning approach uses a combined loss factor so you can move from “nameplate” to “expected AC energy” without pretending the system is a perfect calculator.
From Panel Nameplate to Expected Daily AC Energy
A useful planning workflow is:
- Estimate daily PSH for the season you care about.
- Multiply by array DC size to get “ideal” DC energy.
- Apply a system efficiency or loss factor to estimate AC energy.
- Convert AC energy into battery-relevant energy by considering how much of that AC energy can be stored versus used directly.
Example: Suppose you have a 8 kW DC array. In a winter month, you estimate 3.0 PSH/day. Ideal DC energy is 8 × 3.0 = 24 kWh/day. If your planning loss factor is 0.80, expected AC energy is 24 × 0.80 = 19.2 kWh/day.
That number is not yet “battery charge.” If your home uses 6 kWh during the day, the remaining 13.2 kWh is the portion that could be routed to charging (subject to inverter and battery limits).
Dispatch Planning That Matches How Energy Flows
Dispatch planning is about priorities during three periods: daytime charging, evening load support, and outage behavior.
During normal grid-tied operation, the system may use solar to power loads first, then charge the battery if there’s excess. If the battery is full, excess solar may be exported or curtailed depending on interconnection rules and inverter settings.
During an outage, the logic changes. Solar may still be available, but the system must ensure the inverter can run the loads and charge the battery without exceeding current limits. If the inverter is sized for typical loads but not for simultaneous high charging and high load draw, you can get a “works in theory, not in practice” situation.
A key planning constraint is the battery’s charge acceptance rate. Even if solar energy is available, the battery may only accept a certain power level. That means dispatch should be evaluated in power terms, not just energy terms.
Mind Map: Solar Production Basics for Sizing and Dispatch Planning
Example: Matching Solar to a Priority Load Plan
Assume your critical loads during an outage are 600 W average for lighting, internet, and refrigeration cycling. Over 6 hours, that’s 0.6 × 6 = 3.6 kWh.
Now consider a sunny afternoon outage scenario. If your expected AC solar production during those hours is 8 kWh, you might think you can run indefinitely. But if the battery is already near full, the system may limit charging and instead run the loads directly. If the loads are modest, the inverter can often handle them while solar supplies the rest. If loads spike—say a refrigerator compressor starts—the inverter must cover the surge while also respecting any charging limits.
So the planning check is simple: confirm that the inverter and battery can handle the worst-case combination of load power and charging power during the hours you expect solar to contribute.
Practical Planning Takeaways
Use PSH and a loss factor to estimate daily AC energy, then translate that energy into likely battery charge using your daytime load. Finally, validate dispatch with power constraints so the system can do what the energy math suggests—without asking it to sprint while carrying groceries.
8.2 Matching PV Array Size With Inverter and Battery Limits
A PV system is a team sport: the array produces energy, the inverter converts it, and the battery decides how much of that energy can be stored versus used immediately. Matching PV array size to inverter and battery limits prevents two common problems: clipping (wasted solar) and overdriving the battery charging path (reduced efficiency or protection events).
Start with the Inverter’s Power Ceiling
First, treat the inverter as the hard limit for how much PV power can be converted at any moment. If your PV array can produce more than the inverter’s rated AC output, the extra energy is simply not converted during those moments. This is not always bad—some clipping is normal—but sizing should be intentional.
A practical approach is to compare:
- PV array peak power (DC) to inverter rated power (AC)
- Expected midday irradiance to temperature effects
Example: If you have a 10 kW DC array and a 7.5 kW AC inverter, you are likely to see clipping on bright, cool days. If your goal is maximum backup runtime rather than maximum solar capture, that trade can be acceptable. If your goal is to minimize wasted production, you would reduce DC-to-AC ratio or add more inverter capacity.
Account for Temperature and Voltage Window
PV modules produce more power when they are cooler, which can increase the chance of clipping. They also operate within a voltage range required by the inverter. If the array is wired or configured so that string voltage falls below the inverter’s minimum at low sun angles, you lose production even on days when the rest of the system is healthy.
Example: A system that looks fine at noon on a clear day can underperform in winter mornings if string voltage drops too far. Matching PV size is not only about watts; it is also about ensuring the inverter can start and track across the seasons.
Match Battery Charging Limits to PV Output
Even if the inverter can convert the PV power, the battery may not be able to accept it all. Batteries have a maximum charge power and often a charge current limit that depends on state of charge and temperature.
So you need to ensure that, during typical charging conditions, the PV power does not routinely exceed what the battery can absorb. Otherwise, the system will either:
- divert energy to loads (if available),
- reduce charging power, or
- rely on inverter control to limit PV-to-battery flow.
Example: Suppose your battery can accept 5 kW of charging power. If your PV array frequently produces 8–9 kW at midday, you will not store the extra 3–4 kW. If your home loads are low during the day, that energy may be exported or curtailed depending on your operating mode and interconnection rules.
Use a Simple Energy Balance to Avoid “Too Big” PV
Power limits handle instant behavior; energy balance handles daily outcomes. A useful method is to estimate:
- Daily PV energy produced (kWh)
- Daily critical-load energy (kWh)
- Battery usable capacity and desired reserve
Example: If your goal is to keep the battery available for evening backup, you might not want to fully refill it every day. You can size PV so that it reliably charges the battery to your target state of charge by late afternoon without spending most of the day pushing energy into a ceiling.
Mind Map: Matching PV Array Size with Inverter and Battery Limits
Worked Example: A Coherent Sizing Target
Assume:
- Inverter rated AC output: 7.5 kW
- Battery max charge power: 5 kW
- Typical midday PV production: 6–8 kW
A coherent design would aim for PV that often lands near the inverter ceiling but does not constantly exceed battery acceptance by a large margin. If you choose a PV array that peaks around 7–8 kW DC under typical conditions, the inverter can convert most of it, and the battery will accept up to 5 kW while the remaining energy can serve loads. This keeps the system from spending most of the day “trying” to charge beyond what the battery can take.
Practical Checklist for This Matching Step
- Confirm inverter AC rating and expected clipping frequency.
- Verify string voltage stays within the inverter’s operating window across seasons.
- Compare typical PV power to battery max charge power, not just to inverter rating.
- Use daily energy estimates to ensure the battery reaches your intended reserve level.
- Re-check the plan against low-load daytime periods, since that is when battery saturation is most visible.
8.3 Charge Control Modes and Their Operational Effects
Charge control modes decide how the battery is charged, how aggressively it is pushed, and how the system behaves when solar output changes or the grid is down. The goal is simple: deliver energy safely, efficiently, and in a way that matches the battery’s limits. The practical differences show up as charging speed, battery temperature behavior, and whether the system “holds” the battery at a target state of charge (SoC) or keeps chasing the next watt.
Core Concepts That Drive Mode Behavior
A battery system typically has three moving parts: the PV source (solar), the charger (inverter/charger hardware), and the battery (with a battery management system, or BMS). The BMS enforces limits like maximum charge current, maximum charge power, and allowable voltage windows. The charger’s job is to translate those limits into a charging command.
Most charge control modes revolve around one of these control variables:
- Voltage control: the charger targets a battery voltage setpoint.
- Current control: the charger targets a charge current setpoint.
- Power control: the charger targets a charge power setpoint.
- SoC control: the charger targets a state of charge target, then backs off.
When solar output is abundant, the system can charge quickly. When solar output drops, the mode determines whether charging tapers smoothly or pauses and resumes.
Bulk, Absorption, and Float Without the Mystery
Even when a system is marketed with different names, many modes follow a familiar charging pattern:
- Bulk: push as much energy as allowed until the battery reaches a voltage or power threshold.
- Absorption: hold near a voltage target while current naturally tapers.
- Float or standby: maintain without overcharging, often at a lower voltage or reduced current.
For lithium batteries, “float” may be implemented as a low-rate maintenance or simply a reduced-charge state, depending on the manufacturer’s BMS strategy. The operational effect is that the battery stops “soaking up” energy once it reaches the intended ceiling.
Common Charge Control Modes and What They Do
Maximum Power Mode
In this mode, the system tries to use available PV power to charge the battery as much as possible, subject to BMS limits. Operationally, you’ll see higher charge current during sunny periods and a faster rise in SoC. The tradeoff is that the battery may reach its upper SoC sooner, which can reduce how much PV energy is available for later evening loads.
Example: If your PV produces 6 kW at noon and the battery can accept 4 kW, the system will typically charge at up to that 4 kW until the battery approaches its charge ceiling.
SoC Target Mode
Here, you set a desired SoC target, and the system charges until it reaches that target, then reduces or stops charging. This is useful when you want predictable backup energy for a specific time window.
Example: You set a 70% SoC target. On a cloudy morning, the system may never reach 70% before PV drops, so it transitions to a low or idle state. On a sunny day, it reaches 70% and then stops charging, preserving PV for direct loads instead of topping off the battery.
Voltage Setpoint Mode
This mode uses a voltage target to control charging. It’s common in systems where the charger can follow a voltage curve defined by the battery profile. The operational effect is stable charging behavior, but it can be less intuitive for homeowners because the “progress” is not directly tied to SoC.
Example: If the battery voltage reaches the absorption threshold, the charger reduces current automatically. You might notice that charging slows even while PV is still producing power.
Current Limit Mode
This mode caps charge current. It’s helpful when you want to protect wiring, limit thermal stress, or match a system’s electrical constraints.
Example: If the battery accepts up to 100 A but your installer set a 60 A current limit, the system will charge more slowly during peak sun and may take longer to reach the same SoC.
Time-Based or Schedule Mode
Some systems allow scheduled charging behavior, such as charging only during certain hours or avoiding charging during peak grid rates. Operationally, this mode can create “gaps” where PV is available but charging is intentionally paused.
Example: If you schedule charging to start at 10:00, the system may run PV to loads first and only begin battery charging after the start time.
Operational Effects During Grid Outages
When the grid is down, the system’s priorities shift. PV may still be available, but the inverter must manage power balance between charging and supplying loads. Charge control modes then influence whether PV is used to:
- support critical loads first,
- charge the battery when there’s surplus,
- or hold a conservative battery state to avoid running out.
A practical rule of thumb: if your mode is “maximum power,” the system may charge aggressively whenever PV surplus exists, which can be fine for short outages. If your mode is “SoC target,” it tends to behave more predictably for longer outages because it avoids pushing the battery to the ceiling too early.
Mind Map: Charge Control Modes and Effects
Worked Example with Mode Switching Logic
Assume you have a battery that can accept 4 kW and a home with a 1.5 kW average daytime load. On a sunny day, PV produces 6 kW.
- Maximum Power Mode: PV surplus after loads is 4.5 kW. The charger will likely take the full 4 kW (battery limit), raising SoC quickly.
- SoC Target Mode: If the target is reached early, charging stops and PV continues feeding loads, reducing battery cycling during the rest of the day.
On a cloudy day where PV drops to 3 kW, both modes converge: surplus after loads is only 1.5 kW, so charging becomes limited by available energy rather than by the mode’s “preference.”
Practical Selection Guidance
Choose a mode based on what you want to control most: charging speed, predictability of backup energy, or electrical protection. If you want the battery ready for evening reliably, SoC target mode usually gives the clearest outcome. If you want to maximize energy capture during short sunny windows, maximum power mode is often the better fit. If you’re managing constraints like wiring temperature or strict current limits, current limit mode keeps behavior consistent.
8.4 Handling Grid Tied Versus Off Grid Behavior During Outages
A battery backup system behaves very differently depending on whether it is normally grid-tied or normally off-grid. The goal during an outage is the same—keep selected loads powered safely—but the control logic, switching behavior, and energy flow paths change.
Core Concepts That Drive Behavior
In grid-tied mode, solar and the battery typically operate while the grid provides voltage reference and frequency. In off-grid mode, the inverter must create and maintain voltage and frequency for the home, because the grid is no longer available. That single difference explains most outage behavior: who “owns” the electrical waveform.
When the grid fails, the system must detect the loss, stop exporting power to the grid, and then either transfer to a backup source or continue supplying from the inverter. The transfer can be seamless or staged, but it always includes safety checks so the inverter never energizes an external line.
Mind Map: Grid Tied Versus Off Grid During Outages
Grid-Tied Systems During Outages
In a typical grid-tied setup, the inverter is synchronized to the grid. When the grid drops, the system must quickly stop any grid-interactive behavior. Practically, that means the inverter transitions to a “standalone” mode only after it confirms the grid is absent and the transfer switch has isolated the home.
A common operational sequence looks like this:
- Grid failure is detected using voltage and frequency thresholds.
- The system commands the transfer switch to isolate the home from the utility.
- The inverter begins supplying the backup bus as the voltage reference.
- Loads are energized according to priority rules.
The subtle part is step 4. If the system energizes everything at once, starting surges can exceed inverter limits. Many designs therefore use load shedding or staged startup so the inverter sees a manageable first wave of demand.
Off-Grid Systems During Outages
Off-grid systems already run with the inverter acting as the reference. When the grid is present, they may operate in a hybrid manner, but the outage case is simpler: the system continues forming the waveform and manages power balance using battery state of charge and available PV.
The key difference is energy budgeting. In off-grid mode, the inverter output is constrained by battery usable energy and inverter power limits. If PV is available, it can reduce battery discharge rate; if PV is not available, the system must ration energy to keep critical loads alive.
Transfer Timing and Load Priority
Transfer timing determines how much interruption sensitive loads experience. Seamless transfers aim to keep voltage and frequency within a narrow window so electronics tolerate the change. Staged transfers accept a brief interruption but reduce stress on the inverter and battery.
Load priority is the practical bridge between electrical behavior and user experience. For example:
- Refrigeration and well pumps often have higher starting currents.
- HVAC may have both a motor start and control electronics.
- Lighting and internet gear are usually easier to run but still need stable voltage.
A well-designed priority plan might energize lighting and communications first, then start refrigeration, and only then attempt HVAC if the battery state of charge supports it.
Example: Solar Available During an Outage
Assume a home has PV, a battery, and a grid-tied inverter with backup capability. During an outage at 2:00 PM, PV continues producing power. The system typically routes PV to the backup bus first, then charges the battery if there is surplus.
If the home’s critical loads are modest—say, lights, router, and a refrigerator—the battery discharge rate drops, extending runtime. If the homeowner turns on a high-demand load like a microwave, the inverter may temporarily draw from the battery to cover the surge while PV covers the baseline.
The important planning implication is that “solar available” changes the energy flow, but it does not remove the need for surge-aware load priority.
Example: Solar Not Available During an Outage
Now assume the outage happens at 9:00 PM. PV is effectively zero, so the inverter must run loads from the battery. In this case, the system’s behavior is dominated by battery state of charge and inverter power limits.
A load priority plan becomes more than convenience. If the system tries to start a well pump and HVAC immediately, the battery may hit its discharge limit or the inverter may hit surge limits, causing a shutdown or repeated restart attempts. A staged plan avoids that by delaying or cycling higher-surge loads until the inverter can sustain them.
Operational Checks That Prevent Surprises
Two checks keep grid-tied versus off-grid behavior predictable:
- Verify that the transfer switch and inverter settings match the intended backup scope, so the inverter only energizes the correct bus.
- Confirm that the system’s priority logic aligns with real starting loads, using measured or nameplate-based surge expectations.
When these are correct, the system’s behavior during outages becomes consistent: grid-tied systems isolate then form power, while off-grid systems already form power and focus on energy balance.
8.5 Practical Examples for Daytime Charging and Backup Support
Daytime charging is where battery systems earn their keep. The goal is simple: use solar when it’s available, avoid wasting energy in the power path, and still reserve enough battery energy to cover the outage window you actually care about. The tricky part is that “solar available” and “battery usable” are not the same thing, because inverter limits, charge settings, and load priorities all shape what ends up in the home.
Foundational Example Setup
Assume a typical residential setup:
- PV array: 8 kW DC
- Battery: 13.5 kWh usable (after manufacturer usable-capacity rules)
- Inverter: 5 kW AC continuous
- Backup strategy: critical loads only (fridge, router, some lighting, and one HVAC stage)
- Priority plan: critical loads run first; noncritical loads are shed during outages
We’ll walk through two daytime scenarios: a sunny day with a brief outage, and a partly cloudy day with a longer outage. Both examples use the same sizing logic but different dispatch outcomes.
Mind Map: Daytime Charging and Backup Support
Example 1: Sunny Day with a Short Outage
On a clear afternoon, PV output might average 6 kW for the hour leading up to the outage. The home’s noncritical loads draw 1.8 kW, and critical loads draw 0.9 kW. Total load is 2.7 kW.
- Energy flow before the outage
- PV covers 2.7 kW of load.
- Excess PV is about 3.3 kW.
- Battery can accept charge up to its configured max charge rate. Suppose the system limits charging to 3.0 kW AC-equivalent.
- That means roughly 3.0 kW goes into the battery while the remaining 0.3 kW is curtailed.
- Battery state at outage start If the outage begins after 30 minutes of charging, the battery gains about:
- 3.0 kW × 0.5 h = 1.5 kWh (minus conversion losses) If conversion losses are modest, you might see around 1.4 kWh net gain.
- Backup runtime during the outage During the outage, only critical loads run. Assume critical loads average 1.1 kW because HVAC cycles and refrigeration has brief peaks.
- If you configured a reserve of 20% of usable capacity, reserve energy is 0.2 × 13.5 = 2.7 kWh.
- Usable discharge energy is 13.5 − 2.7 = 10.8 kWh.
- Runtime estimate is 10.8 kWh ÷ 1.1 kW ≈ 9.8 hours.
The practical takeaway: on a sunny day, daytime charging can quickly “top off” the battery, so a short outage is usually covered without touching the reserve floor. The system still needs correct priority settings so that noncritical loads don’t sneak back in and steal energy.
Example 2: Partly Cloudy Day with a Longer Outage
Now assume PV output is unstable: it averages 2.5 kW but swings between 0.5 kW and 4 kW. The home loads are the same as before: 2.7 kW total, with 0.9 kW critical and 1.8 kW noncritical.
- Normal operation behavior
- When PV is above 2.7 kW, excess charges the battery.
- When PV drops below 2.7 kW, the battery supplies the gap.
- Because PV is erratic, the battery may oscillate between charging and discharging, which is why charge limits and reserve settings matter.
- Reserve strategy for real outages Suppose you want to guarantee at least 4 hours of backup for critical loads. Using the same critical average of 1.1 kW:
- Required energy = 1.1 kW × 4 h = 4.4 kWh.
- If you want to keep a reserve floor for battery protection and to handle short peaks, you might set reserve to 30% instead of 20%.
- Reserve energy = 0.3 × 13.5 = 4.05 kWh.
- Discharge energy available = 13.5 − 4.05 = 9.45 kWh.
- Runtime estimate = 9.45 ÷ 1.1 ≈ 8.6 hours.
That seems more than enough, but here’s the practical nuance: on a cloudy day, the battery may already be partially depleted before the outage begins because it was covering load gaps. So the key check is the state of charge at outage start, not just the theoretical runtime.
- Operational check using a simple energy balance If the battery was discharging for 2 hours before the outage because PV couldn’t keep up, and the average discharge rate was 0.8 kW, then energy used is:
- 0.8 kW × 2 h = 1.6 kWh. If the battery started that period near 70% state of charge (9.45 kWh usable), it would drop to about 7.85 kWh usable before the outage.
During the outage, you still discharge down to the reserve floor. With 30% reserve (4.05 kWh), available discharge energy is about:
- 7.85 − 4.05 = 3.8 kWh
- Runtime ≈ 3.8 ÷ 1.1 ≈ 3.5 hours
This is the “gotcha” that daytime charging examples should teach: unstable PV can prevent the battery from recharging enough before an outage, even if the system is actively charging at times.
Example 3: A Quick Dispatch Checklist You Can Actually Use
Before trusting a plan, verify these three items during daytime:
- Charge acceptance: confirm the battery is not hitting its max charge limit too early, causing unnecessary curtailment.
- Reserve behavior: ensure the reserve floor is high enough for the outage window you care about, but not so high that the battery never meaningfully supports loads.
- Priority enforcement: confirm noncritical loads remain shed during backup so critical loads stay within the runtime assumptions.
When these align, daytime charging becomes predictable: PV covers loads, excess energy fills the battery within limits, and the reserve floor provides a stable buffer for the outage you planned around.
9. Transfer Switching, Controls, and Operational Logic
9.1 Transfer Switch Selection and Wiring Requirements
A transfer switch is the traffic controller between the utility grid and your backup power source. Selecting the right type and wiring it correctly determines whether your system transfers safely, transfers quickly enough for your loads, and avoids dangerous backfeed.
Transfer Switch Types and What They Imply
Start by matching the switch type to how you want power to move.
- Open transition: breaks utility before connecting backup. It’s common and simple, but some loads may reboot during the gap.
- Closed transition: overlaps utility and backup briefly. It can reduce downtime, but it requires tighter control to avoid paralleling sources.
- Make-before-break designs**: generally not used for typical residential battery systems unless the manufacturer explicitly supports it.
For most residential battery backup systems, the practical goal is predictable behavior: utility off, backup on, with interlocks that prevent both at once.
Selection Criteria That Actually Matter
Use these criteria in order.
- Transfer method: manual vs automatic. Automatic is preferred when you want consistent uptime for critical loads.
- Switch rating: match the switch amp rating to the maximum expected load on the backed-up circuits.
- Number of poles: single-pole for limited circuits, two-pole for split-phase systems, and three-pole for three-phase. Wrong pole count can leave part of the system unprotected.
- Voltage and frequency: confirm compatibility with your inverter output and utility characteristics.
- Control compatibility: ensure the switch control inputs match your battery inverter’s signaling method.
- Code listing and installation rules: use equipment listed for the intended application, and follow the manufacturer’s wiring diagram.
Wiring Requirements and Safety Interlocks
Wiring is where “it should work” becomes “it does work.” The key requirement is preventing backfeed into the utility.
- Interlock enforcement: the transfer switch must physically or electrically prevent simultaneous connection of utility and backup.
- Neutral handling: many residential systems require careful neutral switching rules. Some transfer switches switch neutral; others do not. Follow the exact listing and inverter guidance.
- Grounding and bonding: keep grounding conductors continuous where required, and do not use the neutral as a substitute ground.
- Conductor sizing: size conductors for ampacity and temperature rating, and account for voltage drop where long runs exist.
- Overcurrent protection: protect every conductor path appropriately. The transfer switch does not replace proper breakers.
A good mental model is to treat the transfer switch as a set of controlled “windows” that open only one direction at a time.
Mind Map: Transfer Switch Selection and Wiring Requirements
Example: Critical Loads Panel with Automatic Transfer
Assume a split-phase home where you want the refrigerator, internet router, and a few outlets to stay alive.
- Choose a two-pole automatic transfer switch sized to the maximum expected current on the critical loads panel.
- Wire the utility feed to the utility side of the switch and the inverter output to the backup side, exactly as shown in the wiring diagram.
- Route the critical loads panel feed from the switch output to the panel main breaker.
- Confirm neutral behavior: if the transfer switch is listed for neutral switching, wire neutral accordingly; if it is not, keep neutral handling consistent with the inverter’s requirements.
- Add proper breakers in the critical loads panel so each branch circuit has correct overcurrent protection.
If the transfer switch is correctly wired, a utility outage causes the switch to move to backup without energizing the utility conductors.
Example: Manual Transfer for Small Loads
For a smaller setup—say, a garage circuit with a freezer—manual transfer can be acceptable.
- Use a manual transfer switch with the correct pole count and rating.
- Wire it so the garage circuit is fed from either utility or inverter, never both.
- Label the switch position clearly so the next person doesn’t treat it like a light switch.
Manual systems still require correct neutral and grounding wiring; “manual” doesn’t mean “casual.”
Verification Checklist Before Energizing
Before the first test, verify:
- Terminations are tight to manufacturer torque specs.
- Conductors are correctly landed on the labeled utility, backup, and load terminals.
- Neutral and grounding conductors follow the listing and inverter instructions.
- Breakers and fuses protect each path.
- Labels match the actual wiring so troubleshooting is faster later.
A transfer switch that’s correctly selected and correctly wired behaves predictably under stress, which is exactly what you want when the grid stops cooperating.
9.2 Control Strategies for Seamless Versus Staged Transfer
A transfer system decides what powers the home when the grid changes state. The control strategy determines how quickly loads see power, how safely the system isolates faults, and how predictably the battery and inverter behave. Two common approaches are seamless transfer and staged transfer. Both can be correct; the right choice depends on your loads, your inverter capabilities, and how much you care about minimizing interruption.
Seamless Transfer Foundations
Seamless transfer aims to keep voltage and frequency within tight bounds so sensitive loads experience little or no interruption. In practice, “seamless” usually means the inverter is already synchronized to the grid before the switch happens, or it can take over within a very short window.
Key control idea: the system continuously monitors grid presence, measures voltage and frequency, and keeps the inverter ready. When the grid drops, the inverter transitions to island mode without waiting for a long “startup” sequence.
A typical control loop includes these steps:
- Grid qualification: Confirm grid voltage and frequency are within allowed ranges for a sustained period.
- Pre-synchronization: If the inverter supports it, align inverter output to the grid waveform characteristics.
- Transfer decision: Trigger transfer when grid fails qualification or when a protective condition occurs.
- Load continuity: Maintain output within tolerance while the transfer switch changes state.
Why this matters: if the inverter must “wake up” from a cold state, the transfer will be noticeable. If it can already be producing stable power, the switch can be faster and smoother.
Staged Transfer Foundations
Staged transfer accepts that not every load needs power immediately. Instead of switching everything at once, the system powers groups in sequence. This reduces the chance of inverter overload and helps manage inrush currents from motors and compressors.
Key control idea: the system uses a priority plan and timing rules. It may start with critical loads, then add additional circuits after the battery state of charge and inverter output stabilize.
A staged strategy typically includes:
- Immediate critical loads: Essential circuits get power first so the home remains functional.
- Stabilization window: The system waits for transient conditions to settle, such as inverter ramp-up and initial load stabilization.
- Priority tiers: Noncritical loads are enabled based on time, available battery energy, or measured inverter headroom.
- Rebalancing: If a later stage causes overload risk, the controller can shed lower-priority circuits.
Why this matters: a refrigerator compressor and a heat pump start can arrive within seconds of each other. Staging gives the system a chance to avoid tripping and restarting.
Control Logic Comparison
Seamless transfer favors continuity and requires tighter coordination between grid sensing, inverter readiness, and switching hardware. Staged transfer favors robustness and predictability under heavy starting loads.
A practical way to choose is to ask: “Will my critical loads tolerate a short interruption, or do they need near-continuous power?” If the answer is “tolerate,” staged transfer often reduces stress on the inverter and battery.
If the answer is “near-continuous,” seamless transfer is worth the extra planning effort, including verifying that the inverter can pre-synchronize and that the transfer switch timing supports the transition.
Mind Map: Seamless Versus Staged Transfer Control
Example: Seamless Transfer for Mixed Electronics and Lighting
Imagine a home where the critical panel feeds an office, Wi-Fi gear, and LED lighting. These loads are sensitive to interruptions but draw modest current. With seamless transfer, the inverter can keep output synchronized while the grid is healthy. When the grid fails, the controller triggers the transfer switch quickly, and the inverter continues supplying power without a noticeable drop.
To make this work reliably, the control settings must match your hardware behavior. If the inverter requires a longer synchronization window than the transfer switch expects, you can end up with a brief sag or a protective trip. The fix is not “more patience” in the controller; it’s aligning qualification and synchronization timing so the inverter is truly ready when the switch moves.
Example: Staged Transfer for HVAC and Refrigeration
Consider a home where the critical loads include a furnace control board and a refrigerator, while the rest of the HVAC is lower priority. On outage, the controller powers the refrigerator and furnace first. After a short stabilization window, it enables the HVAC fan circuit, then waits before enabling compressor operation.
This staged approach prevents a common failure mode: the inverter sees a high inrush from the compressor at the same moment the battery is still recovering from the initial load step. By sequencing the enable signals, the controller reduces the chance of inverter overload and avoids repeated trips that would otherwise cycle the compressor.
Practical Control Rules That Keep Both Strategies Honest
Regardless of seamless or staged, good control logic includes clear thresholds and timing rules. Grid qualification should require stability for a short duration so brief sags don’t cause unnecessary transfers. Load enabling should include minimum on-times to avoid rapid toggling. When staged transfer is used, the controller should define what happens if a later stage cannot be supported, such as shedding the lowest-priority tier rather than forcing the inverter into a fault.
A final detail: the transfer switch and the inverter must agree on who is responsible for isolation at every moment. Interlocks and anti-islanding protections are not optional “nice-to-haves”; they are the guardrails that make either strategy safe and repeatable.
9.3 Anti Islanding, Interlocks, and Safety Verification
Anti Islanding, Interlocks, and Safety Verification
When the grid fails, a home battery system must stop exporting power to a de-energized utility line. That behavior is called anti-islanding, and it is enforced through interlocks, sensing, and control logic. The goal is simple: if the grid is not present and stable, the system must disconnect quickly and predictably.
Foundational Concepts That Drive the Design
Anti-islanding relies on two ideas working together. First, the system continuously measures grid conditions such as voltage and frequency. Second, it uses interlocks to prevent the inverter from energizing the grid-side conductors while the transfer path is open.
A key nuance is that “grid absent” is not a single state. A utility outage can look like a full blackout, a brownout, or a frequency drift. Good designs treat these as separate triggers with defined thresholds and timing.
Interlocks That Prevent Unsafe Power Paths
Interlocks are physical and electrical safeguards that block unsafe combinations of states. In practice, you’ll see three layers.
- Transfer interlock: ensures the inverter cannot close into the grid when the transfer switch is not in the correct position.
- Breaker and contactor interlock: prevents backfeed through breakers that are intended to be one-way.
- Control interlock: coordinates inverter enable signals with sensed grid status and switch position.
A common failure mode is “logic mismatch,” where the inverter thinks it is islanded but the switch is still transitioning. Interlocks reduce that risk by requiring multiple confirmations before enabling output.
Safety Verification Through Stepwise Testing
Verification is not a single checkbox. It is a sequence that proves the system behaves correctly under both normal and abnormal conditions.
Step 1: Confirm wiring and sensing points
- Verify the grid-sense input is connected to the correct conductors.
- Confirm CT polarity if current sensing is used.
- Check that the transfer switch auxiliary contacts match the expected positions.
Step 2: Validate interlock truth tables
- For each switch state, confirm which inverter modes are allowed.
- Ensure the system blocks export mode when the grid is unstable.
Step 3: Perform controlled grid-failure tests
- Simulate loss of grid by opening the upstream disconnect while monitoring inverter output, transfer status, and alarms.
- Confirm the inverter stops within the configured anti-islanding time window.
Step 4: Verify load-side behavior
- Confirm that critical loads remain powered only when the system is in the correct islanding state.
- Confirm that non-critical loads do not receive unintended power.
A practical detail: during testing, record the exact sequence of events—grid detect, transfer action, inverter stop, and load energization—so you can compare it to the system’s configured timing.
Mind Map: Anti Islanding and Interlocks
Example: Truth Table for Safe Enable
Imagine a system with three signals: GridStable, SwitchInIsland, and InverterEnableRequest. A safe control policy requires all conditions to align.
- If
GridStableis false, the inverter must not energize the grid-side. - If
SwitchInIslandis false, the inverter must not energize the island output. - If
InverterEnableRequestis true but either safety condition fails, the system should enter a lockout state and require a manual reset or a verified recovery sequence.
This is why interlocks often use “AND” logic across multiple confirmations rather than trusting a single sensor.
Example: Testing Without Guesswork
During commissioning, you can test anti-islanding by opening the utility disconnect while logging:
- grid-sense status (stable/unstable)
- transfer switch auxiliary contacts
- inverter output state
- critical load voltage presence
If the inverter output remains present after the switch indicates it is not in island mode, you have a control or interlock mismatch. If the transfer switch changes but loads drop too early, you may have an overly aggressive timing setting. Either way, the event log turns the problem from “it seems off” into “here is the exact sequence.”
Safety Verification Checklist for This Section
- Grid-sense wiring verified and labeled
- Transfer auxiliary contacts confirmed
- Inverter enable gated by both grid stability and switch state
- Anti-islanding stop timing confirmed during controlled outage simulation
- Load-side energization confirmed only for intended circuits
- Event sequence recorded and consistent with configured behavior
9.4 Monitoring Signals for Grid Status and System Health
A backup system is only as reliable as the signals it trusts. Monitoring grid status and system health means you can (1) decide when to transfer, (2) prevent unsafe operation, and (3) catch problems early enough to avoid a “mystery outage.” The goal is not to collect data for its own sake; it’s to translate electrical reality into clear control decisions.
Foundational Signals for Grid Status
Start with the minimum set of grid indicators your controller needs:
- Voltage presence: Detect whether the grid is available. Use thresholds that match your inverter’s transfer settings.
- Frequency: Confirm the grid frequency is within an acceptable window. This matters because some loads and inverters behave differently when frequency drifts.
- Phase relationship: For split-phase systems, confirm both legs are present and within tolerance. For three-phase, monitor all phases or use a utility-grade grid monitor.
- Rate of change: Fast events like sags and swells can cause nuisance transfers if you only use static thresholds. Many systems include delay timers and “stable for X cycles” logic.
Example: If your grid voltage drops from 120 V to 105 V for 0.2 seconds, a simple threshold might trigger a transfer. A better approach is “grid must be out of range for 2 seconds” plus a separate check for frequency stability.
System Health Signals That Prevent Bad Transfers
Grid status tells you when to transfer; system health tells you whether the backup path is ready. Monitor these signals continuously:
- Inverter readiness: Output stage enabled, no internal faults, and stable synchronization state.
- Battery state: State of charge, cell/battery temperature, and any active protection flags.
- DC bus and current limits: Detect conditions that would cause the inverter to current-limit or shut down.
- Transfer switch position feedback: Confirm the switch actually moved, not just that a command was sent.
- Communication health: If the controller loses inverter or battery telemetry, treat it as a degraded state and fall back to safe behavior.
Example: If the inverter reports “ready” but the battery temperature sensor indicates over-limit, the controller should avoid transferring critical loads that require sustained power.
Signal Conditioning and Decision Logic
Monitoring is only useful when you define how signals become actions. A systematic approach uses three layers:
- Raw measurements: Voltage, frequency, temperature, current, and switch feedback.
- Validated states: “Grid Available,” “Grid Unstable,” “Battery Usable,” “Inverter Faulted.” These states should include hysteresis to avoid flip-flopping.
- Control actions: Transfer, load shedding, start/stop charging, or alarm generation.
Use hysteresis for thresholds (different “enter” and “exit” values) and timers for stability. This prevents rapid toggling during borderline conditions.
Example: Set “Grid Available” to require voltage within range for 5 seconds, but “Grid Unstable” to trigger after 1 second out of range. This reduces nuisance transfers while still reacting quickly to real failures.
Mind Map: Grid Status and System Health Monitoring
Practical Monitoring Example for a Whole-Home Setup
In a whole-home architecture, you typically want to transfer only when the backup path can support the selected load set.
Example workflow:
- Grid monitor flags Grid Unstable.
- Controller checks Inverter Ready and Battery Usable.
- If battery is usable but state of charge is low, controller applies load shedding tier 1 before transferring.
- Transfer switch feedback confirms the switch is in the backup position.
- Controller logs the event with the measured voltage/frequency at the moment of transfer.
This sequence avoids the common failure mode where the system transfers first and then discovers it cannot sustain the load.
Operational Checks for Signal Reliability
Monitoring should be verified during commissioning and periodically during maintenance:
- Confirm switch feedback matches actual switch position by observing both the command and the reported state.
- Validate grid thresholds using controlled test conditions (for example, a deliberate voltage sag) and ensure the timing delays behave as expected.
- Check that fault codes are mapped to clear controller states so alarms correspond to actionable conditions.
Example: If a battery fault triggers an alarm but the controller still reports “Battery Usable,” you’ll get confusing behavior during the next outage. Fix the mapping so the control logic and the display agree.
Summary of What “Good Monitoring” Looks Like
Good monitoring turns messy electrical signals into dependable states. Grid status tells you when to transfer; system health tells you whether the transfer will actually work. When you add hysteresis, timers, and switch feedback validation, the system stops guessing and starts behaving predictably.
9.5 Testing Transfer Timing With Documented Benchmarks
Transfer timing is the gap between “grid is gone” and “backup is powering the loads.” Testing it with numbers turns a vague hope into an engineering check. The goal is not just to pass a test, but to understand what happens at each step so you can size runtime, avoid nuisance trips, and keep sensitive loads stable.
Define What “Timing” Means
Start by separating timing into measurable intervals:
- Grid-loss detection time: how long the controller waits after voltage/frequency falls outside thresholds.
- Transfer decision time: how long it takes to command the transfer mechanism.
- Switching time: the actual mechanical or electronic transfer duration.
- Load stabilization time: how long until the inverter output is within acceptable voltage and frequency for the loads.
- Return-to-grid time: detection plus switching back, including any retransfer delay.
A practical benchmark set includes minimum, typical, and worst-case values. “Worst-case” matters because real outages include voltage sag, noisy waveforms, and brief recoveries.
Establish Test Conditions and Acceptance Criteria
Before running tests, document the baseline configuration:
- Transfer switch type and control mode
- Inverter model and firmware revision
- Battery state of charge range you will test
- Load set used for timing (for example: refrigerator + microwave + lighting + a small HVAC blower)
- Threshold settings for grid detection
Acceptance criteria should be tied to load behavior. For example, a refrigerator compressor may tolerate a short interruption but not a long one; a furnace control board may be sensitive to undervoltage during switching. If you cannot test every load, test representative loads and record their response.
Build a Benchmark Test Plan
Use a repeatable sequence so results are comparable across days and technicians.
- Baseline verification: confirm grid voltage/frequency readings match a calibrated meter.
- Simulated grid loss: apply a controlled drop to below the grid-loss threshold.
- Record events: log controller signals and inverter status.
- Repeat: run at least three trials for each scenario.
- Test return: restore grid and measure retransfer timing.
Include at least two scenarios: a clean loss (step change) and a “chatter” scenario (brief recoveries). Chatter is where many systems show their true personality.
Instrumentation and Logging That Actually Helps
You need timestamps that align across devices. A simple approach is to log:
- Grid status input state changes
- Transfer command output
- Transfer switch contacts state
- Inverter output enable and voltage/frequency stabilization
- Optional: a power meter reading on the backup output
If you only log one device, you’ll end up guessing which interval caused the delay. If you log multiple signals, you can pinpoint whether the controller waited too long, the switch took longer than expected, or the inverter needed more time to settle.
Example Benchmark Table and How to Use It
Record results in a table you can compare later.
| Scenario | Grid Loss Detection (s) | Switching Time (s) | Stabilization (s) | Total Transfer (s) | Notes |
|---|---|---|---|---|---|
| Clean loss | 0.8 | 0.2 | 0.6 | 1.6 | Lighting steady |
| Chatter loss | 1.1 | 0.2 | 0.7 | 2.0 | Fridge restarted |
| Return to grid | 2.0 | 0.2 | 0.5 | 2.7 | Brief flicker |
Use the table to answer three questions:
- Is the system consistently within your acceptance criteria?
- Which interval is the bottleneck?
- Does load behavior match the timing you measured?
Mind Map for Transfer Timing Testing
Transfer Timing Testing Mind Map
Common Failure Patterns and What the Benchmarks Reveal
If detection time is long, the controller thresholds or filtering may be too strict, causing delayed transfer during marginal grid conditions. If switching time is inconsistent, the transfer mechanism may be operating slower than expected due to wiring, contact wear, or control power issues. If stabilization time is long, the inverter may need more time to reach acceptable voltage/frequency, or the system may be configured with conservative ramp settings.
When you see a problem, don’t just retest blindly. Use the interval breakdown to decide what to adjust, then rerun the same scenarios so the benchmark table shows improvement rather than random variation.
Documenting Benchmarks for Real-World Use
Keep a one-page “transfer timing sheet” with:
- Configuration summary
- Test scenarios used
- Benchmark table with min/typical/worst-case
- Load response notes
- Any deviations from the plan
This sheet becomes the reference for future maintenance and troubleshooting. It also prevents the classic situation where everyone remembers the test differently, and the system ends up being “fixed” by changing settings that were never measured.
10. Load Prioritization and Energy Management Workflows
10.1 Defining Priority Tiers for HVAC, Refrigeration, and Lighting
A priority tier is a simple rule for what runs first, what runs only if energy remains, and what stays off during an outage. The goal is not to run everything; it’s to keep the home livable while protecting equipment and avoiding battery brownouts. Start by separating loads into three tiers, then refine each tier with runtime behavior.
Step 1: Choose Tier Definitions That Match Real Outage Behavior
Use consistent definitions across HVAC, refrigeration, and lighting.
- Tier 1: Keep Safe and Prevent Damage
- Refrigeration that must maintain temperature.
- HVAC components that prevent freeze or overheating when outdoor conditions are extreme.
- Tier 2: Maintain Comfort With Energy Limits
- HVAC that can cycle less often.
- Lighting that supports movement and basic tasks.
- Tier 3: Optional Convenience
- Nonessential lighting, decorative loads, and other comfort items.
- HVAC features that are not required for temperature safety.
Example: If the outage is likely short, Tier 2 can behave more generously. If it’s longer, Tier 2 should tighten. You can implement this with staged load shedding or smart panel rules.
Step 2: Build a Load-Specific Priority Map
Different equipment behaves differently during outages, even if they share the same “importance.”
HVAC Priority Logic
HVAC has both steady power and startup surges. Prioritize based on whether the system is protecting against freeze/overheat or providing comfort.
- Tier 1: HVAC: Heat-pump or furnace operation when indoor temperature risks damage.
- Tier 2: HVAC: Cooling or heating for comfort when temperature is within safe bounds.
- Tier 3: HVAC: Auxiliary heat strips, dehumidifier modes, or high-fan settings that spike energy.
Concrete example: In winter, set Tier 1 to maintain a minimum indoor temperature using the most efficient heating mode available. Let Tier 2 allow comfort setbacks only if battery state of charge stays above your chosen threshold.
Refrigeration Priority Logic
Refrigeration is usually a compressor with frequent cycling. It’s sensitive to temperature drift, and it has inrush at compressor start.
- Tier 1: refrigeration: Fridge and freezer circuits.
- Tier 2: refrigeration: Optional second fridge or beverage fridge if present.
- Tier 3: refrigeration: Freezerless specialty loads or rarely used coolers.
Concrete example: If you have one freezer and one fridge, keep both on Tier 1. If you have a third unit in a garage, move it to Tier 2 so it doesn’t steal energy from the compressor cycles that matter.
Lighting Priority Logic
Lighting is often easy to run, but it can be surprisingly large if you have many fixtures on the same circuit.
- Tier 1: lighting: Entryway, kitchen task lighting, and any circuit that supports safe navigation.
- Tier 2: lighting: Living areas and bedrooms used intermittently.
- Tier 3: lighting: Decorative lighting and rarely needed rooms.
Concrete example: Put hallway and kitchen on Tier 1. Put living room and bedrooms on Tier 2. Leave outdoor lighting and decorative circuits on Tier 3.
Step 3: Add Operational Rules for Each Tier
A tier without behavior is just a label. Define what happens when energy is tight.
- Tier 1: rules
- Always available during outage.
- Allow short cycling for compressor and HVAC startup.
- Use minimum-off timers to reduce rapid restart stress.
- Tier 2: rules
- Run on a schedule or temperature band.
- Shed if battery drops below a threshold.
- Prefer “lower effort” modes, like reduced fan speed.
- Tier 3: rules
- Manual enable or automatic off during low battery.
- Keep it off by default so you don’t drain the battery on convenience.
Step 4: Mind Map for Priority Tier Design
Mind Map: Priority Tiers for HVAC, Refrigeration, and Lighting
Step 5: Example Tier Plan for a Typical Home
Assume you want 6–10 hours of reliable backup for daily routines.
- Tier 1
- Fridge and freezer circuits
- HVAC safety mode to prevent freeze or overheating
- Hallway and kitchen lighting circuit
- Tier 2
- HVAC comfort mode with wider temperature limits
- Living room lighting circuit
- One additional refrigeration circuit if present
- Tier 3
- Outdoor lighting
- Decorative lighting
- Auxiliary heat strips and high-fan settings
This structure keeps the compressor and safety heating from being interrupted by convenience loads. It also prevents lighting from becoming the “silent battery killer” when multiple rooms are on the same circuit.
Step 6: Validate with a Simple Energy Reality Check
After assigning tiers, sanity-check the plan by asking two questions.
- If Tier 1 runs continuously, does the battery runtime still meet your target?
- When Tier 2 turns on, does it cause noticeable voltage sag or frequent inverter shutdown?
If the answers are no, move the largest offenders to a lower tier or reduce their duty cycle. For HVAC, that often means widening the comfort band or limiting auxiliary heat. For lighting, it often means splitting circuits so you can keep only the essentials on Tier 1.
10.2 Scheduling Loads to Reduce Peak Demand on Battery
Peak demand is the enemy of smooth battery operation because inverters must supply the highest momentary power, not the average. Scheduling loads spreads energy use over time and also reduces surge stress from motors, compressors, and heating elements. The goal is simple: keep the inverter within its continuous rating while still meeting comfort needs.
Foundational Concepts for Scheduling
Start with three measurements: (1) each load’s typical wattage, (2) each load’s start-up behavior, and (3) your battery’s usable energy window. A refrigerator might average 150 W but briefly spike higher when the compressor starts. A microwave might be 1200 W for 2 minutes, which can be fine if it doesn’t overlap with another high-draw event.
Next, define two limits that guide scheduling:
- Power limit: the maximum watts you allow from the inverter at any moment.
- Energy limit: the total watt-hours you can spend during the outage window.
Scheduling works because it controls overlap. If you reduce the number of simultaneous high-power loads, you lower peak watts without changing total energy too much.
Build a Priority and Timing Map
Create a simple priority list for each load:
- Must run: medical equipment, internet gateway, essential refrigeration.
- Should run: cooking, laundry, lighting, comfort HVAC if available.
- Can wait: pool pump, EV charging, nonessential outlets.
Then assign timing flexibility:
- Fixed schedule: thermostats and refrigeration cycle naturally, but you can influence setpoints.
- User-driven: cooking and laundry start when you choose.
- Programmable: water heater, pool pump, dehumidifier, some HVAC stages.
A practical rule: schedule flexible loads to run when the battery has headroom and when other surge-prone loads are least likely to overlap.
Mind Map: Scheduling Logic
Scheduling Patterns That Actually Work
1) Stagger motor starts. Motors and compressors create the biggest spikes. If your refrigerator and a freezer both cycle, you can’t fully prevent overlap, but you can avoid adding another motor at the same time. For example, delay a pool pump start until you’ve observed that refrigeration has settled for 10–15 minutes.
2) Use “one big appliance at a time.” When cooking, treat the microwave, toaster oven, and induction burner as a single category. If you run the microwave, postpone the toaster oven until the microwave finishes and the inverter returns to a lower baseline.
3) Split heating into stages. If you have electric resistance heat, avoid running multiple heating elements simultaneously. Schedule one stage at a time, or reduce the thermostat so the system cycles less aggressively. Even a small setpoint reduction can reduce how often the heater calls.
4) Shift laundry and dishwashing. These are often programmable. Run them when you’re not also running cooking. A washer plus dryer can be scheduled back-to-back with a short gap so the dryer’s heating doesn’t overlap with the washer’s motor spin.
5) Protect the “quiet hours.” During the first minutes of an outage, many loads may start or resume. Add a short delay before enabling nonessential loads. For instance, keep noncritical circuits off for 5 minutes, then enable them in a controlled sequence.
Example: A Simple Outage Schedule
Assume you want to keep inverter output under 2000 W. Your essentials include refrigeration (average 150 W, occasional spikes), lighting (100 W), and internet (30 W). Flexible loads include microwave (1200 W), dishwasher (900 W), and a heat pump backup stage (1500 W when active).
A workable schedule:
- 0–5 minutes: essentials only. No user-driven appliances.
- 5–30 minutes: enable dishwasher if needed, but only if the heat pump backup stage is not active.
- 30–60 minutes: allow microwave use, but block dishwasher start during the microwave window.
- Heating control: allow backup heat only in one stage at a time; if it activates, pause microwave and dishwasher.
This schedule reduces overlap between the biggest draw items and the heating stage, which is where peak watts usually jump.
Example: Translating Rules into Control Behavior
If you use a smart panel or relays, the logic can be straightforward:
- When outage starts, keep “flex” circuits off.
- After a delay, turn on refrigeration and lighting.
- Enable dishwasher only if microwave is off and backup heat is off.
- Enable microwave only if dishwasher is off.
You don’t need complicated math to start; you need consistent overlap control.
Validation and Tuning Without Guesswork
After installation, run a controlled test. Watch real-time watts and note when peaks occur. If peaks still exceed your power cap, adjust by adding delays between categories (for example, “never start dishwasher within 20 minutes of backup heat activation”). If peaks are fine but runtime is short, reduce energy use by lowering heating calls or extending delays for flexible loads.
Scheduling is essentially a traffic plan for electricity: fewer simultaneous vehicles, smoother flow, and less stress on the inverter and battery.
10.3 Managing Thermostats and Variable Speed Equipment
Thermostats and variable speed equipment (like heat pumps, air handlers, and ECM blower motors) behave differently during outages than simple on/off loads. The goal is to keep comfort loads running without draining the battery faster than expected. That means you manage three things at once: when the equipment is allowed to run, how hard it runs, and how quickly it can recover after a power event.
Foundational Concepts for Battery-Aware Climate Control
Start with the thermostat’s job: it decides setpoints and schedules, then calls for heating or cooling. During backup operation, the thermostat still makes those decisions, but the system may have limited power and limited energy. Variable speed equipment adds another layer: it can modulate output, so the same call for heating can consume very different energy depending on airflow, compressor speed, and runtime.
A practical way to think about it is to separate “comfort control” from “power control.” Comfort control is the thermostat’s target temperature and timing. Power control is what the inverter and battery can support, plus any load shedding logic that limits runtime or reduces demand.
Priority Tiers and Control Boundaries
Assign climate loads to a priority tier before you touch settings. A common approach is:
- Tier 1: Refrigeration and critical circulation that must run to protect food or prevent freezing.
- Tier 2: Heating and cooling that can tolerate short interruptions.
- Tier 3: Dehumidification or secondary zones that can be delayed.
Then set boundaries. For example, allow Tier 2 climate calls only when battery state of charge is above a threshold and only for a maximum runtime per hour. This prevents a long, continuous compressor run from turning a “short outage” into a battery depletion event.
Thermostat Settings That Reduce Battery Stress
Use thermostat modes that match outage reality. During backup, the thermostat should avoid frequent cycling and large setpoint changes.
- Use wider setpoint bands: Instead of chasing the exact temperature every minute, allow a few degrees of drift. That reduces how often the system ramps up.
- Disable aggressive recovery features: Some thermostats try to “catch up” quickly after setbacks. During outages, that can cause higher compressor speeds.
- Set a conservative schedule: If the thermostat supports schedules, keep occupied and unoccupied setpoints closer together during backup windows.
- Prefer fan behavior that matches equipment: Continuous fan can increase blower runtime. If your system supports it, use “auto” fan so the blower runs mainly when heating or cooling is active.
Example: Heat Pump with a Two-Stage Thermostat
Assume a heat pump that can run at low and high stages. Set the thermostat so that during backup it is allowed to use only low stage. If the temperature drifts beyond a larger band, you can temporarily allow higher stage, but cap the total high-stage minutes per hour.
Variable Speed Equipment Management
Variable speed equipment can be efficient, but it can also be power-hungry when it ramps to meet demand. Manage it by controlling two levers: demand and time.
- Demand control: Limit maximum output. Many systems expose limits through installer settings, thermostat configuration, or smart controller parameters.
- Time control: Limit how long it can run before a rest period. Rest periods let battery power recover and reduce the chance of repeated high-demand starts.
A simple rule that works well in practice: allow short runs early in an outage window, then switch to longer, lower-demand runs if the outage continues. This reduces repeated high-start events.
Coordinating with Load Shedding and Whole-Home Panels
If you use a smart panel or load shedding relays, coordinate thermostat calls with shed states. The thermostat should not keep calling for heat if the system is currently shed; otherwise, you get repeated start attempts.
Use a “permission” model:
- When loads are permitted, thermostat calls can run normally within caps.
- When loads are shed, thermostat calls are either blocked or allowed to queue until permission returns.
Example: Staged Load Shedding
During a grid outage, the system permits HVAC for the first 30 minutes. After that, it sheds nonessential circuits and reduces HVAC runtime to 15 minutes per hour. The thermostat remains configured, but the controller only grants permission when the battery can support the next run.
Mind Map: Thermostats and Variable Speed Equipment Control
Worked Configuration Logic for a Typical Outage
- At outage detection, permit HVAC for a short window (for example, 20–30 minutes) to stabilize indoor temperature.
- After the window, enforce a runtime cap (for example, 10–15 minutes per hour) and restrict to low stage or reduced output.
- If battery drops further, reduce demand again by widening setpoint bands and keeping fan on auto.
- When grid returns, allow normal thermostat operation immediately, but avoid rapid “catch up” modes that can spike demand right after transfer.
This approach keeps the system predictable: the thermostat decides comfort targets, while the backup controller decides whether the equipment is allowed to chase them aggressively.
10.4 Implementing Load Shedding With Relays and Smart Panels
Load shedding is how you keep critical power available when the battery or inverter hits its limits. The key idea is simple: instead of trying to run everything at once, you temporarily reduce demand in a controlled order. The “controlled” part is where relays and smart panels earn their keep.
Foundations of Load Shedding Logic
Start by defining three things: (1) what counts as critical, (2) what can wait, and (3) what signal tells the system to act. A practical approach is to create priority tiers: Tier 1 for essentials (fridge, internet, medical devices), Tier 2 for comfort loads that can pause briefly (some outlets, laundry circuits), and Tier 3 for nonessential loads (pool pump, EV charging, decorative lighting).
Next, decide the trigger. Common triggers include low battery state of charge, low battery voltage under load, inverter overload detection, or a grid outage event combined with a runtime timer. For example, if your battery is sized for a 4-hour outage, you can shed Tier 3 immediately on outage, then shed Tier 2 when runtime approaches the target.
Finally, define the action sequence. A good sequence sheds the largest loads first, but only after confirming that Tier 1 remains stable. If you shed too aggressively, you’ll create nuisance resets and frustrated occupants; if you shed too late, the inverter may shut down anyway.
Relay-Based Shedding with Clear Wiring Boundaries
Relays are straightforward: they open or close circuits based on a control signal. Use them to switch whole branch circuits or groups of circuits rather than individual outlets. This reduces wiring complexity and makes testing easier.
A typical relay shedding design uses:
- A control input from the energy system controller or smart meter
- One relay per load group (or per critical set, depending on design)
- A manual override switch for maintenance
- Proper labeling so the next person can understand what “Group B” means
Example: Suppose you have a refrigerator (Tier 1), a microwave (Tier 2), and a pool pump (Tier 3). You can wire the pool pump through a relay that opens during shedding, while the refrigerator stays on a separate, non-sheddable circuit. The microwave can be on a second relay that opens only if the battery drops below a threshold.
Smart Panels for Automated Priority Control
Smart panels extend relay logic by adding measurement and coordination. They can monitor per-circuit power, detect which loads are actually drawing current, and shed based on real demand rather than fixed schedules.
A useful pattern is “demand-aware shedding.” Instead of shedding Tier 2 at a fixed battery percentage, you shed when total noncritical draw exceeds a set limit. This prevents unnecessary interruptions when loads are already low.
Example: During an outage, the HVAC may cycle. If the system sees that the HVAC is running and total draw is near the inverter limit, it sheds a secondary load group (like a water heater) to keep the HVAC stable. When the HVAC cycles off, the smart panel can restore the shed group after a delay.
Mind Map: Load Shedding Implementation
Systematic Implementation Steps
-
Create a circuit map and tier assignment. Mark each branch circuit as Tier 1, 2, or 3. If a circuit is ambiguous, treat it as higher priority until you confirm its behavior.
-
Group circuits by shedding behavior. Put loads with similar “pause tolerance” into the same group. For instance, pool pumps and EV chargers are often easy to shed; kitchen outlets may be harder to pause.
-
Choose relay or smart panel control points. Use relays for simple, fixed shedding. Use smart panels when you want measurement-based decisions.
-
Set thresholds and delays. Add a delay before shedding to avoid reacting to brief spikes. Add a minimum off-time before restoring to prevent rapid cycling.
-
Define restore conditions. Restore in reverse order: Tier 2 after Tier 3, and only when battery and inverter conditions are stable. This avoids the “restore, overload, shed again” loop.
-
Test with realistic loads. Run the system under normal operation, then simulate an outage. Confirm that Tier 1 stays powered while Tier 3 drops as expected.
Worked Example: Two-Stage Shedding Plan
Assume your battery system is designed for 6 hours with all nonessential loads off, and you want to preserve comfort for the first hour.
- Tier 1: refrigerator, router, essential outlets. No shedding.
- Tier 3: pool pump, EV charger. Shed immediately on outage.
- Tier 2: microwave and laundry outlets. Shed when SOC falls below a second threshold.
Restore logic:
- Restore Tier 2 only after SOC rises above the Tier 2 threshold plus a buffer and the inverter load stays below the limit for a short stabilization period.
This plan is predictable: occupants lose the biggest “time-flexible” loads first, then lose smaller convenience loads only when the battery needs help.
Testing and Tuning Without Guesswork
During commissioning, record three outcomes: (1) when each tier sheds, (2) whether Tier 1 remains stable under worst-case loads, and (3) how long restore takes. If Tier 2 sheds too early, lower its sensitivity or increase the delay. If the inverter still trips, move a larger load into Tier 3 or adjust thresholds so shedding happens before overload.
A good load shedding system feels boring during outages: it does the same sensible thing every time, with clear labels and repeatable timing.
10.5 Worked Examples for Priority Plans Under Different Outage Lengths
A priority plan answers two questions: which loads run, and for how long. The trick is that “for how long” depends on both energy (kWh) and power (kW), plus losses in the inverter and battery. Below are three worked scenarios that move from a simple load list to a practical dispatch plan.
Foundational Inputs
Assume a typical home with a battery-backed inverter and a load-shedding panel that can drop noncritical circuits.
- Battery usable energy: 9.6 kWh
- Inverter efficiency: 92% average during discharge
- Usable energy at the inverter output: 9.6 × 0.92 = 8.83 kWh
- Reserve rule: keep at least 10% battery headroom for safe shutdown and to avoid running at the edge
- Effective energy budget: 8.83 × 0.90 = 7.95 kWh
Define load tiers:
- Tier 1: critical: refrigerator, internet router, modem, security system
- Tier 2: important: lighting, kitchen outlets, some HVAC runtime
- Tier 3: noncritical: laundry, EV charging, pool pump, extra outlets
Mind Map: Priority Plan Logic
Example 1: Short Outage Plan for 2 Hours
Goal: maintain comfort basics without draining the battery.
Load assumptions (average during the outage):
- Tier 1: 0.35 kW (refrigerator cycling, electronics)
- Tier 2: 0.55 kW (LED lighting plus a few kitchen outlets)
- Tier 3: off
Energy use estimate:
- Total average power: 0.35 + 0.55 = 0.90 kW
- Energy for 2 hours: 0.90 × 2 = 1.80 kWh
Compare to budget:
- 1.80 kWh < 7.95 kWh, so runtime is safe.
Operational rules:
- Keep HVAC off unless it is already running at transfer time and the inverter has surge margin.
- Delay any high-inrush loads (microwave, hair dryer, compressor start) by requiring manual restart after transfer.
Result: Run Tier 1 continuously and Tier 2 at steady level for 2 hours.
Example 2: Medium Outage Plan for 6 Hours
Goal: preserve Tier 1 and allow limited comfort while preventing energy creep.
Load assumptions:
- Tier 1: 0.40 kW average
- Tier 2: base: 0.45 kW average (lighting and outlets)
- HVAC: 1.2 kW average during “on” periods, but only run 35% of the time
Compute HVAC average contribution:
- HVAC average: 1.2 × 0.35 = 0.42 kW
Total average power:
- 0.40 + 0.45 + 0.42 = 1.27 kW
Energy for 6 hours:
- 1.27 × 6 = 7.62 kWh
Compare to budget:
- 7.62 kWh is close to 7.95 kWh, leaving a small margin for inefficiencies and unusual loads.
Operational rules:
- Use a thermostat setback schedule: allow HVAC only during two windows (for example, early morning and late afternoon) rather than continuous cycling.
- Shed laundry and pool pump immediately.
- If the refrigerator load spikes due to door opening, reduce HVAC duty cycle by one step.
Result: Tier 1 continuous, Tier 2 steady, HVAC time-sliced to 35% duty for 6 hours.
Example 3: Long Outage Plan for 12 Hours
Goal: stretch energy by tightening both power and energy.
Load assumptions:
- Tier 1: 0.45 kW average
- Tier 2: 0.25 kW average (minimal lighting, no kitchen outlets except essentials)
- HVAC: 1.2 kW during “on” periods at 15% duty
Compute HVAC average:
- 1.2 × 0.15 = 0.18 kW
Total average power:
- 0.45 + 0.25 + 0.18 = 0.88 kW
Energy for 12 hours:
- 0.88 × 12 = 10.56 kWh
Compare to budget:
- 10.56 kWh > 7.95 kWh, so the plan must change.
Adjustment path:
- Reduce Tier 2 further by removing nonessential outlets and limiting lighting to occupancy-based circuits.
- New Tier 2: 0.12 kW
- Reduce HVAC duty from 15% to 10%.
- New HVAC average: 1.2 × 0.10 = 0.12 kW
Recompute:
- Total average power: 0.45 + 0.12 + 0.12 = 0.69 kW
- Energy for 12 hours: 0.69 × 12 = 8.28 kWh
Still slightly high, so apply the reserve rule more strictly by cutting HVAC duty to 9% and enforcing a “no door-open cooking” rule.
- HVAC average: 1.2 × 0.09 = 0.108 kW
- Total average: 0.45 + 0.12 + 0.108 = 0.678 kW
- Energy: 0.678 × 12 = 8.14 kWh
Now the plan is closer to the budget, and the remaining gap can be managed by strict load behavior during the highest-demand hours.
Result: Tier 1 continuous, Tier 2 minimal, HVAC duty around 9% with strict user behavior constraints.
Mind Map: Worked Example Decisions
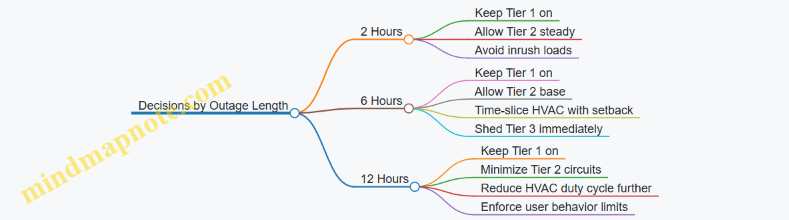
These examples show the same method each time: estimate average kW, convert to kWh for the outage duration, compare to an energy budget that includes losses and reserve, then adjust by changing duty cycles and which circuits belong to Tier 2.
11. Installation Planning, Permitting, and Code Compliance
11.1 Preparing Site Layouts for Batteries Inverters and Disconnects
A good site layout prevents the two most common installation headaches: wiring that is “just a little too short,” and access that is “technically present” but practically useless during commissioning or maintenance. Start with the physical realities—clearances, pathways, and switching locations—then map them to electrical requirements.
Site Layout Foundations That Drive Everything
Begin by identifying three zones: the battery enclosure area, the inverter and controls area, and the disconnect and switching area. Keep these zones close enough to reduce conductor length and voltage drop, but separated enough to maintain safe working space and airflow.
Next, confirm the environment for each component. Batteries and inverters both dislike extremes, but in different ways: batteries care about temperature stability and ventilation, while inverters care about heat dissipation and keeping sensitive electronics away from moisture-prone locations. If the battery is in a garage, plan for seasonal temperature swings and ensure any ventilation strategy is consistent with the manufacturer’s installation instructions.
Finally, treat access as a design requirement. You need room to open covers, read labels, and operate disconnect handles without leaning over live equipment. A layout that looks tidy on paper can still fail inspection if a disconnect is buried behind conduit or if a service panel cannot be reached with the door fully opened.
Battery Placement and Enclosure Clearances
Place the battery where you can route DC conductors to the inverter with minimal bends and without crossing walkways. Avoid routing DC cables through areas where they could be struck by moving equipment or where they would be exposed to standing water.
Plan for service access around the battery enclosure. Leave space for removing covers, checking terminations, and verifying that any required safety devices remain reachable. If the battery system uses multiple modules, ensure the layout supports module replacement without dismantling half the wall.
Inverter Placement and Cable Pathways
Mount the inverter where its cooling requirements are satisfied. Do not place it where warm air will recirculate into intake vents, such as directly under a shelf with no clearance. Keep the inverter away from direct spray sources and ensure drip loops are possible for any cable entries.
Route AC and communication cables using dedicated pathways. Keep DC and AC wiring separated where required by code and manufacturer guidance, and avoid bundling cables in a way that traps heat or complicates troubleshooting. If you expect future expansion, design cable pathways that can accept additional conduits without tearing up finished surfaces.
Disconnects and Switching Locations
Disconnects are not just “somewhere nearby.” They must be reachable, clearly labeled, and positioned so that the intended isolation is actually achievable during service. Plan the disconnect location relative to the inverter and battery so that a technician can safely de-energize the correct section.
Use a simple rule: if a disconnect cannot be operated while standing in a safe position with the equipment cover accessible, the layout is wrong. Also ensure labels are visible without removing covers or standing on a ladder.
Mind Map: Layout Decisions and Their Consequences
Example Layout Walkthrough
Imagine a single-story home with a garage utility wall. The battery is placed on the wall near the garage door side, where temperature is moderate and the enclosure can be accessed from the front. The inverter is mounted on an adjacent wall section with clear space above and around it for airflow.
DC conduits run from the battery to the inverter using a straight-ish route with gentle bends, supported at regular intervals. AC wiring runs from the inverter to the transfer equipment using a separate conduit pathway that does not share the same bundle space as DC conductors.
The battery disconnect is mounted at a height that allows operation without reaching over the inverter. The label is placed so it can be read with the inverter door closed. During commissioning, a technician can open the inverter access panel, verify terminations, and then operate the disconnect from the same standing position.
Practical Checklist for a Clean, Inspectable Layout
- Confirm each component has front access for covers and terminations.
- Verify disconnect handles can be operated without obstruction.
- Keep DC and AC pathways separated as required.
- Plan conduit routes to avoid excessive bends and unsupported spans.
- Ensure cable entries allow strain relief and drip loops where appropriate.
- Create a labeling plan that matches the physical layout and one-line diagram.
A layout that is easy to work on is also easier to verify. When the wiring route, isolation points, and access paths all line up, commissioning becomes a measurement exercise instead of a scavenger hunt.
11.2 Wiring Practices for DC and AC Runs
Good wiring is less about heroic craftsmanship and more about predictable behavior under stress: heat, vibration, moisture, and the occasional “why is this breaker tripping?” moment. This section lays out a systematic approach for both DC battery wiring and AC inverter/transfer wiring, with examples that match how systems are actually built.
Core Principles for DC Runs
DC wiring carries higher current for a given power than AC, so voltage drop and heat rise matter early. Start by treating every DC run like a controlled path: correct conductor size, correct termination method, correct routing, and correct labeling.
- Minimize length and loops. Keep the battery-to-inverter DC run as short as practical. Long runs increase voltage drop, which reduces usable power and can trigger protection behavior.
- Use appropriately rated cable and connectors. DC cable insulation must match the system voltage and temperature environment. Terminations must be rated for the conductor size and intended current.
- Plan for strain relief and mechanical protection. Route cables through conduit or protected pathways where they can’t be kicked, pinched, or exposed to abrasion.
- Control polarity and labeling from day one. Mark both ends of every DC conductor. If you can’t identify polarity without tracing, you’re building a future troubleshooting session.
Example: A 48 V battery system feeding an inverter with a 10 ft DC run. If you undersize the cable, the inverter may reach its current limit sooner during high loads. The fix is not “try again,” it’s selecting cable size based on allowable voltage drop and then verifying terminations are tight and corrosion-resistant.
Core Principles for AC Runs
AC wiring is about safe current paths, correct grounding, and predictable switching. The inverter output and transfer equipment must see wiring that respects code requirements and the equipment’s installation instructions.
- Respect breaker and conductor pairing. Match conductor ampacity to breaker ratings and installation conditions.
- Keep neutral and grounding roles clear. In many residential backup systems, neutral switching and grounding behavior are specific to the inverter design. Follow the manufacturer’s wiring diagram rather than “common sense.”
- Route away from noise sources. Keep AC conductors separated from sensitive communication wiring where required. This reduces nuisance faults and improves monitoring reliability.
- Use proper termination torque and inspection. Loose terminations create heat. Heat creates resistance. Resistance creates more heat. That loop is not a hobby.
Example: During commissioning, an inverter reports intermittent faults only when the HVAC starts. A common cause is a marginal connection at an AC output terminal or a conductor that wasn’t fully seated under a lug. Tightening to spec and rechecking torque resolves the issue.
Mind Map: DC and AC Wiring Workflow
Advanced Details That Prevent Real Problems
1. Voltage Drop Calculations Drive Cable Size. For DC, voltage drop is often the limiting factor, not just ampacity. Use the system’s expected maximum current and the run length to select cable size that keeps the inverter within its operating window.
2. Termination Quality Matters as Much as Cable Size. A properly sized cable with a poorly terminated lug can behave like a smaller cable. Inspect for correct strip length, full conductor insertion, and no stray strands.
3. Conduit Fill and Bending Radius Affect Reliability. Overstuffed conduit increases heat and complicates pulling. Sharp bends can damage insulation or make future maintenance miserable.
4. Grounding Strategy Must Match the Equipment. Some systems require specific bonding at the inverter or transfer equipment. If you add extra bonds “to be safe,” you can create fault paths that trip protection.
Example: A homeowner adds a second ground bond at a subpanel “because it’s grounded.” The system starts normally, then trips during transfer. The wiring diagram likely expects a single bonding point. Removing the extra bond restores stable operation.
Example: Typical Residential Backup Wiring Layout
- DC side: Battery disconnect → DC fusing or protection as required → inverter DC input. Keep this path short and labeled.
- AC side: Inverter AC output → appropriate breaker → transfer switch input → critical loads panel or whole-home integration point.
- Control wiring: Follow the transfer switch and inverter control wiring diagram exactly, using labeled control conductors and protected routing.
Verification Checklist Before Power-Up
- Confirm DC polarity at both ends.
- Verify conductor sizes against breaker ratings and installation conditions.
- Confirm torque on all lugs and terminations.
- Check insulation integrity and continuity where applicable.
- Verify grounding and neutral connections match the inverter and transfer switch diagrams.
- Confirm labeling is legible and corresponds to the single-line diagram.
When these steps are done in order, the system behaves like a plan instead of a guess. That’s the whole point of good wiring: it makes the rest of the commissioning work faster and the troubleshooting work rarer.
11.3 Required Labels, Signage, and Documentation for Inspectors
A good inspection starts with clarity. Labels and documentation should let a reviewer answer three questions quickly: What is installed? How is it supposed to operate during normal use and outages? How do you keep people safe while it does that? The goal is not to decorate equipment; it is to reduce ambiguity when someone is standing in front of a panel with a clipboard.
What Inspectors Look for First
Inspectors typically begin by verifying that the system is identifiable and that safety-critical information is visible without guesswork. That means consistent labeling across the battery, inverter, disconnects, transfer equipment, and the distribution panel. If a label is missing, unclear, or contradicts the wiring diagram, the inspection often stalls while the installer “figures it out.”
Minimum Label Set for a Residential Backup System
Use a consistent naming scheme across all documents and labels. For example, if the battery is called “BESS-1” on the one-line diagram, it should be “BESS-1” on the enclosure and in the panel schedule.
Include these label categories:
- Equipment identification: Manufacturer, model, and unique system name (e.g., “BESS-1”).
- Service disconnect labeling: “PV Disconnect,” “Battery Disconnect,” and “Inverter AC Disconnect” as applicable, matching the actual devices.
- Operating mode and hazard labels: “Backup Power Source” on the panel or transfer equipment feeding the backup circuits; “Shock Hazard” and “Arc Flash” markings where required by local practice.
- Circuit labeling: Clear circuit numbers or load names for the backup subpanel or critical-load branch circuits.
- Direction of power flow: Labels that indicate which conductors are energized from the inverter during outage.
A simple rule helps: if a person could accidentally assume the circuit is dead during a grid outage, the label should say otherwise.
Documentation That Prevents Rework
Labels help on-site; documentation helps when the inspector checks details. Prepare a single “inspection packet” binder or digital folder with the same naming scheme used on labels.
Core Documents
- One-line diagram showing PV (if present), battery, inverter, transfer switch, disconnects, and the backup panel or load circuits.
- Panel schedules listing circuit numbers, load descriptions, and whether each circuit is backed up.
- Wiring diagrams for the control and interlock circuits, including transfer logic inputs and any load-shedding interfaces.
- Equipment datasheets or cut sheets for major components, especially inverter and battery, highlighting ratings relevant to the installation.
- Commissioning checklist with measured results such as transfer timing and confirmation of correct load assignment.
Consistency Checks That Matter
Before you print anything, verify that these items match across all documents:
- Device names and abbreviations (BESS-1, INV-1, TS-1, etc.).
- Disconnect locations and labels.
- Circuit numbers between the panel schedule and the one-line diagram.
- Control wiring references between the wiring diagram and the actual terminal blocks.
If you change a circuit during installation, update the label and the schedule immediately. “We’ll fix it later” is how inspectors end up writing correction notices.
Signage Placement That Works in Real Life
Placement should follow the path a person would take during a safety action.
- At the main service panel or transfer equipment: label that backup power may energize circuits even when utility power is off.
- At each disconnect: label the function and the equipment it isolates.
- Near the battery enclosure: label the presence of stored energy and the safe approach steps required by the equipment instructions.
- At the backup subpanel: label which circuits are backed up and any load-shedding behavior.
Example: Clear Labeling for Critical Loads
Suppose your backup subpanel feeds “Refrigerator,” “Kitchen outlets,” and “Well pump.” Label the subpanel circuits as:
- Ckt 1: Refrigerator (Backup)
- Ckt 2: Kitchen outlets (Backup)
- Ckt 3: Well pump (Backup, Inrush)
Then add a short note on the panel schedule: “Well pump may require higher surge capacity; confirm inverter surge rating.” This helps the inspector connect the dots between load behavior and equipment sizing.
Mind Map: Labeling and Documentation Workflow
Inspection-Ready Checklist
Use this checklist to confirm nothing obvious is missing:
- Labels are readable from standing height and not blocked by conduit.
- Every disconnect has a function label that matches the one-line diagram.
- Backup circuits are clearly marked on the backup panel and/or transfer equipment.
- The one-line diagram includes all major components and shows the backup path.
- The panel schedule lists circuit numbers and load names for backed-up circuits.
- Control wiring diagrams include interlocks and transfer logic references.
When these pieces align, the inspector can verify safety and operation without hunting for information. That’s the whole point: fewer questions, fewer corrections, and a system that behaves predictably when the grid doesn’t.
11.4 Permitting Steps and Utility Interconnection Requirements
Permitting and utility interconnection are where good engineering meets paperwork reality. The goal is simple: ensure the system is installed safely, can be operated as intended, and won’t interfere with the grid or create unsafe backfeed paths.
Start with the Right Questions for Your Authority Having Jurisdiction
Begin by identifying the Authority Having Jurisdiction (AHJ) for electrical and building permits, and the utility’s interconnection office for grid-tied behavior. Ask what permit types are required for:
- Battery energy storage systems (BESS)
- Inverters and PV interconnections
- Transfer equipment and backup circuits
- Electrical service upgrades, if any
A practical approach is to prepare a one-page summary before you submit anything. Include system voltage, inverter model, battery capacity, whether the system is grid-tied with anti-islanding, and which circuits are backed up. This reduces back-and-forth because reviewers can quickly confirm they’re looking at the right scope.
Assemble a Submission Package That Matches What Reviewers Expect
Most delays come from missing documents, not from missing competence. Typical items include:
- Single-line diagram showing PV, battery, inverter(s), transfer switch, and panel routing
- Equipment datasheets for inverters, batteries, disconnects, and transfer devices
- Wiring diagrams for DC and AC sections, including labeling and conductor sizing
- Protection and control settings documentation, especially anti-islanding and interlock logic
- Site plan with equipment locations, clearances, and conduit routing
Example: If your design uses a critical loads panel, the single-line should clearly show which breakers feed the backup panel and how the transfer switch isolates the rest of the home. If it’s unclear, reviewers may require additional labeling or revised diagrams.
Understand Utility Interconnection Requirements for Grid-Tied Systems
Utility requirements vary, but they usually focus on safe synchronization, anti-islanding, and metering. Expect to address:
- Anti-islanding behavior and test procedures
- Metering configuration, including whether the utility provides a meter or requires a specific setup
- Export limits or operating modes, if applicable
- Communication or signaling requirements for advanced inverter functions, if the utility asks for them
Even if your primary goal is backup power, a grid-tied system still needs to meet interconnection rules for normal operation and outage behavior. The utility will typically want evidence that the inverter will cease exporting when the grid is unavailable.
Plan for Interlocks, Backfeed Prevention, and Safe Transfer
Your permit package should show how the system prevents unintended energization of the grid and prevents unsafe parallel paths. This is usually handled through a combination of:
- Transfer switch type and wiring method
- Inverter anti-islanding controls
- Mechanical and electrical interlocks
- Proper labeling and breaker identification
Example: If you use a transfer switch that isolates the home during outages, the diagram should show the exact point where the inverter output connects to the backed-up bus. Reviewers look for “no backfeed” paths, not just for the presence of a transfer device.
Coordinate Metering and Service Upgrades Early
If your system changes how power flows at the service, the utility may require a meter upgrade or additional metering hardware. Coordinate early because meter work can affect your installation schedule and inspection timing.
Example: A whole-home backup design may require different panel routing than a critical loads design. If the utility expects a specific metering arrangement, you’ll want your electrical layout to match it before you finalize conduit runs.
Mind Map: Permitting and Interconnection Workflow
Example: A Clean Path from Application to Approval
- Submit an electrical permit application with a single-line diagram that clearly shows the transfer switch and backed-up panel.
- Submit the utility interconnection application with inverter anti-islanding documentation and the proposed metering configuration.
- Respond to reviewer comments by updating diagrams and settings sheets, not by rewriting the entire plan.
- Schedule inspections in the order your AHJ requires, typically rough-in before final.
- Provide closeout documentation that matches what was installed, including final labels and as-built wiring confirmation.
Common Submission Pitfalls to Avoid
- Missing or inconsistent equipment model numbers across diagrams and datasheets
- Single-line diagrams that don’t show transfer points and isolation boundaries
- Protection settings described vaguely instead of documented with the actual values
- Labeling that doesn’t match breaker and panel identifiers
- Metering assumptions that conflict with the utility’s required configuration
Keep a Comment Log for Faster Revisions
When you receive review comments, track each item with a short action statement and where the change appears in your drawings. This makes resubmissions faster because you can answer “what changed” without hunting through files.
A well-prepared permitting and interconnection process doesn’t just satisfy reviewers. It also reduces installation rework, because the system’s safety behavior and power flow boundaries are clarified before the first wire is terminated.
11.5 Inspection Checklists for Common Installation Findings
Inspection Checklists for Common Installation Findings
A good inspection checklist does two things: it confirms the system is safe and it confirms the system will behave as designed when the grid disappears. Use it in order—start with physical installation, then electrical correctness, then control logic, then documentation. If you skip steps, you usually end up “fixing” symptoms instead of causes.
Foundational Visual Checks
- Equipment placement and clearances: Verify batteries, inverters, disconnects, and transfer gear have required working space, ventilation paths, and no blocked service access. Example: if a battery cabinet is installed flush to a wall, technicians may be unable to read labels or torque terminals during commissioning.
- Label completeness: Confirm each disconnect, breaker, and panel has clear identification of what it controls and the system voltage. Example: a mislabeled critical-load breaker often leads to the wrong circuits being energized during testing.
- Cable management: Check strain relief, proper routing away from sharp edges, and separation of DC and AC conductors where required. Example: a DC cable routed alongside AC conductors without separation can complicate troubleshooting and may violate installation rules.
Electrical Integrity Checks
- Polarity and phase identification: Confirm DC polarity at battery terminals and verify AC phase wiring at the inverter and transfer equipment. Example: reversed DC polarity can trigger protection faults immediately; incorrect phase wiring can cause transfer logic to behave unpredictably.
- Torque and termination quality: Inspect for correct terminal torque marks, no loose lugs, and no insulation damage at terminations. Example: a “tight enough” lug can heat under load, leading to intermittent faults that only appear during longer outages.
- Grounding and bonding: Verify grounding conductors are continuous, correctly sized, and bonded to required metal enclosures. Example: missing bonding can create nuisance faults in sensitive electronics or cause elevated touch voltage.
- Overcurrent protection coordination: Ensure breakers and fuses match the equipment ratings and that the protection strategy is consistent across the power path. Example: undersized protection may trip during normal charging, while oversized protection can fail to clear faults safely.
Transfer Switching and Control Logic Checks
- Interlocks and anti-islanding: Confirm mechanical and electrical interlocks prevent backfeeding and that control settings align with the transfer method. Example: if interlocks are bypassed during wiring, the system may energize the wrong side of the transfer during a grid event.
- Transfer timing behavior: Check that the system transitions according to the intended sequence—especially for staged load shedding. Example: if critical loads are expected to come up immediately, verify the control logic does not delay them behind noncritical circuits.
- Grid status sensing: Verify voltage and frequency sensing wiring and that thresholds match the installation design. Example: overly tight thresholds can cause frequent transfers during minor utility fluctuations.
Load Prioritization and Panel Findings
- Circuit mapping accuracy: Confirm each branch circuit is assigned to the correct priority tier and that the panel labeling matches the actual wiring. Example: a refrigerator on a noncritical circuit defeats the whole point of prioritization.
- Load shedding device placement: Inspect relays, smart breakers, or load controllers for correct wiring to the control inputs and outputs. Example: a relay wired to the wrong control signal can leave a high-draw load connected when it should be shed.
- Inrush and surge readiness: Check that starting loads (well pumps, compressors) are accounted for in inverter sizing and protection settings. Example: a pump that starts but trips the inverter indicates either surge mismatch or incorrect breaker coordination.
Documentation and Commissioning Evidence
- As-built single-line diagram: Verify the diagram matches installed breakers, transfer gear, and battery/inverter connections. Example: if the diagram shows a different breaker size, future troubleshooting will waste time.
- Test records: Confirm functional tests were performed for transfer, charging, and load support, with measured results recorded. Example: runtime claims without measured discharge data are hard to trust.
- Settings verification: Ensure inverter charge/discharge limits, backup mode parameters, and load shedding thresholds are recorded and consistent with the design.
Mind Map: Common Installation Findings Checklist
Example: A System That “Works” but Fails Inspection
During a visual review, the installer labels the critical-load panel correctly, but the wiring shows one refrigerator circuit tied to a noncritical breaker. The transfer test powers the panel as expected, yet the refrigerator remains off during the outage. The fix is not a new inverter setting; it is correcting the circuit mapping and updating the as-built diagram so the next inspection and service call match reality.
Example: A System That Trips Only During Longer Outages
A battery-backed system transfers cleanly at first, but trips after extended runtime. Inspection finds a termination with heat discoloration and a grounding bond that was not continuous. Correcting the termination and bonding resolves the fault, and the recorded runtime now matches the design target because the system is no longer fighting a hidden electrical problem.
12. Commissioning, Testing, and Maintenance for Reliable Backup
12.1 Pre Commissioning Verification of Components and Settings
Pre-commissioning is where you catch the “it powers on” problems before they become “it powers on, but not correctly” problems. The goal is simple: confirm every component is installed as intended, every setting matches the design, and every control signal behaves predictably.
Start with the Design Intent
Begin by comparing the as-built plan to the design targets. Create a one-page checklist that states: which loads are backed up, the expected runtime, the transfer behavior (seamless or staged), and the solar charging intent (battery-first, solar-first, or balanced). If the design calls for a critical loads panel, verify the branch circuits feeding that panel are actually landed there.
Example: Your design targets a 2-hour outage for refrigeration, lighting, and internet. During verification, you confirm the refrigerator circuit is on the critical loads side, the router is on a backed-up outlet circuit, and the lighting circuits are not accidentally tied to a non-backed branch.
Verify Physical Installation and Electrical Safety
Check the basics with a methodical walk-through. Confirm correct wire sizing, torque on terminations, correct polarity on DC runs, and proper labeling at every disconnect and breaker. Inspect disconnects for accessibility and ensure battery enclosures have clear ventilation paths.
For inverters and chargers, verify AC input/output wiring matches the intended power path. Confirm grounding continuity and that bonding points are not bypassed. If a transfer switch is used, verify the mechanical interlock is intact and that the switch is rated for the system voltage and current.
Example: A common failure mode is swapped DC polarity at a battery module or mis-identified AC conductors at the inverter. Pre-commissioning catches this before the system attempts to start and logs confusing errors.
Confirm Component Configuration in Software and Hardware
Now move from “installed correctly” to “configured correctly.” Use the manufacturer menus to verify:
- Inverter mode and grid-forming or grid-following behavior (as applicable)
- Battery chemistry selection and battery capacity settings
- Charge and discharge limits, including depth-of-discharge constraints
- Transfer thresholds and timing parameters
- Load shedding rules and priority tiers
Record the settings you find and compare them to the design sheet. If the system supports multiple profiles, ensure the active profile matches the outage plan.
Example: If the design limits discharge to 90% usable capacity for longevity, but the system is set to a deeper discharge limit, runtime may look fine in the short term while battery wear accelerates.
Validate Control Signals and Interlocks
Control logic is where systems behave differently than expected. Verify that the inverter receives the correct signals for grid status, generator input (if present), and transfer switch commands. Confirm that interlocks prevent simultaneous sources from feeding the same bus.
If the system includes a smart panel or relays, verify that priority tiers map to the correct circuits. Trigger a controlled “grid off” simulation and confirm the load shedding sequence matches the plan.
Example: Your plan says HVAC starts after lighting stabilizes. During simulation, you confirm the HVAC relay closes only after the inverter output reaches stable voltage and frequency.
Run Functional Tests Without Stressing Equipment
Perform short, controlled tests that confirm behavior without prolonged cycling. Typical checks include:
- Inverter startup from battery with a small known load
- Charger response when solar is available and when it is not
- Transfer timing from grid to backup and back to grid
- Monitoring accuracy for battery state-of-charge, power flow direction, and fault codes
Keep test durations brief and within the system’s guidance. The point is to verify correctness, not to “burn in” the system.
Example: Turn on a 200 W resistive load first. Confirm the inverter reports the expected output power and that the battery discharge rate matches the measurement trend.
Confirm Monitoring, Alarms, and Data Integrity
A system that cannot report its own status is like a smoke detector with the battery removed. Verify that alerts trigger for key conditions: low battery, inverter fault, transfer failure, and communication loss between components.
Check that timestamps and units are consistent across the monitoring interface. Confirm that the system logs the right events when you simulate a transfer.
Example: If the monitoring dashboard shows “charging” while the battery is actually discharging, you may have a wiring or sensor mapping issue that will mislead troubleshooting later.
Mind Map of Pre Commissioning Verification
Pre Commissioning Verification Mind Map
A Practical Verification Sequence
Use a sequence that reduces rework. Start with design intent, then physical checks, then configuration, then control validation, then short functional tests, and finish with monitoring verification. If you change a setting, repeat only the tests that depend on that setting.
Example: After adjusting battery discharge limits, rerun the low-battery threshold check and confirm the alarm triggers at the expected state-of-charge.
12.2 Functional Testing for Transfer, Charging, and Load Support
Functional testing proves the system does what the design says it will do, in the order it will do it. The goal is not just “it turns on,” but “it turns on correctly, safely, and predictably” across transfer, charging, and load support.
Test Preparation and Safety Checks
Start with a checklist that prevents the most common test failures: wrong mode, wrong breaker, wrong measurement point. Verify the system is in the intended operating mode (grid-tied, backup-ready, or test/maintenance mode if provided). Confirm all disconnects are labeled and closed as required. Confirm you can observe three things during tests: transfer state (grid vs backup), battery state (charge/discharge direction), and load state (which circuits are energized).
A practical approach is to stage loads into three groups: a small resistive load (like a microwave or toaster oven), a mixed load (like a refrigerator plus a few lights), and a high-inrush load (like a well pump or air conditioner). This lets you see whether the inverter can handle real behavior, not just nameplate ratings.
Transfer Testing for Correct Switching Behavior
Transfer testing answers: “When the grid changes, does the system switch cleanly and keep the right circuits powered?” Begin with a controlled grid interruption using the approved method for your transfer equipment. Observe transfer timing, output voltage stability, and whether any protected circuits drop out unexpectedly.
Use a simple pass/fail structure:
- Pass: The backup source takes over within the expected window, and priority circuits remain energized.
- Fail: The system oscillates between sources, drops critical loads, or trips protection.
Then test return-to-grid behavior. Many systems handle outage switching well but behave differently when grid power returns. Confirm the system transitions back without leaving the inverter in an unintended state and that charging resumes according to the configured logic.
Charging Testing for Correct Energy Flow
Charging testing answers: “Does the battery charge when it should, and does it stop when it should?” Start with a known battery state of charge. If the system supports solar charging, test both grid charging and PV charging paths where applicable.
For each charging mode, verify:
- Direction: battery current shows charging, not discharging.
- Limits: charging respects configured maximum charge current and battery temperature constraints.
- Termination: charging stops or tapers when the battery reaches its target state.
A concrete example: set a target charge level for the next outage window, then confirm the system reaches it without exceeding inverter or battery limits. If the system includes a “hold” or “reserve” setting, verify that reserve energy remains available for backup rather than being fully consumed by charging.
Load Support Testing for Power and Runtime Performance
Load support testing answers: “Can the inverter supply the selected loads, and does it do so without nuisance trips?” Start with the smallest load group and step up. Watch for inverter overload, undervoltage, or protection trips.
For runtime validation, measure actual discharge behavior. A useful method is to record battery power and inverter output power at intervals (for example, every 5–10 minutes during a short test). Compare the observed discharge rate to your design expectation. If the system includes load shedding, confirm it triggers at the intended thresholds and restores loads when power conditions improve.
Example workflow:
- Energize the resistive group and confirm stable operation.
- Add the mixed group and verify the refrigerator compressor start does not cause a trip.
- Add the high-inrush load and confirm the inverter handles surge without dropping priority circuits.
Mind Map: Functional Testing Flow
Example Test Matrix for a Typical Home
| Test | Action | What You Measure | Expected Result |
|---|---|---|---|
| Transfer to Backup | Simulate grid outage | Transfer time, output voltage, energized circuits | Priority circuits stay on, no oscillation |
| Return to Grid | Restore grid | State transition, charging start | Backup ends cleanly, charging resumes |
| Grid Charging | Set target SOC and enable charging | Battery current direction, charge taper | Charging respects limits and stops at target |
| PV Charging | Enable PV charging with stable irradiance | Charge current, reserve retention | Battery charges without consuming reserve |
| Load Step Test | Add load groups sequentially | Inverter output stability, trips | No nuisance trips; inrush handled |
| Load Shedding | Force power stress | Shedding timing, restored loads | Shedding occurs at thresholds and recovers |
Documenting Results Without Guesswork
Record the exact test conditions: battery state at start, load configuration, and any measured power or timing. If a test fails, capture the fault code and the last known good state. This turns troubleshooting from “try again and hope” into “change one variable and verify the effect.”
When all three areas—transfer, charging, and load support—pass under staged conditions, you can trust the system to behave correctly during real outages. The system still needs maintenance, but the core behavior is proven, not assumed.
12.3 Measuring Runtime Performance Against The Design Target
Runtime performance is not a single number; it’s a chain of measurable behaviors that must all land near the design assumptions. The goal is to confirm that the system delivers the intended usable energy to the intended loads, with realistic losses from conversion, wiring, and control logic.
Define the Design Target in Measurable Terms
Start by translating the design target into quantities you can measure during commissioning and later service checks.
- Autonomy target: “X hours at Y kW average with Z peak surges.”
- Usable energy target: “Battery usable kWh delivered to the AC bus.”
- Load coverage target: “Critical loads A/B/C supported simultaneously.”
- Power quality target: “Voltage and frequency remain within inverter limits during transfer and steady operation.”
A practical example: if the design says “2.5 hours for a 1.2 kW average critical load,” you should expect the system to sustain roughly 3.0 kWh of AC energy delivered to that load, after accounting for conversion losses and any load shedding rules.
Build a Measurement Plan That Mirrors the Energy Path
Measure where energy actually changes form.
- Battery side: state of charge (SoC) change over time, and battery power (charge/discharge) if the system exposes it.
- Inverter output: AC power delivered to the backup bus.
- Load side: actual watts consumed by the selected circuits.
- Control events: transfer timing, load shedding activation, and any charge mode changes.
If you only measure AC power at the inverter output, you can still estimate runtime, but you lose the ability to diagnose why performance deviates. If you measure only battery SoC, you can miss cases where the inverter limits output due to surge handling or temperature.
Instrumentation and Logging Setup
Use instrumentation that supports time alignment.
- Sampling interval: 1–5 seconds for power and SoC during the test window.
- Time synchronization: ensure inverter logs and meter logs share a common clock or are aligned manually.
- Record environmental conditions: ambient temperature near the battery and inverter matters because it affects allowable current.
A simple setup uses a clamp meter or whole-backup-bus meter for AC watts, plus the inverter’s own telemetry for battery power and SoC. For multi-inverter systems, log each inverter’s contribution to avoid averaging away a weak link.
Run a Test That Matches the Load Profile
Design tests should reflect how the home behaves, not just a steady resistive load.
- Steady segment: run the load set that represents the average critical load for at least 30 minutes.
- Transient segment: include the largest expected starting loads (for example, refrigerator compressor start, well pump start, or furnace blower).
- Thermal soak: if the system is near its limits, repeat after the inverter has been operating for a while.
Example load set for a typical “kitchen + HVAC + refrigeration” critical plan:
- Lighting and outlets: 200 W steady
- Refrigerator: 150 W average with compressor surges
- Furnace blower: 300–600 W during cycles
- Internet and controls: 30–60 W steady
Your test should include at least one full cycle of the furnace blower and one refrigerator compressor event.
Calculate Runtime Performance Against the Target
Use energy accounting rather than only elapsed time.
- Measured AC energy delivered: integrate AC watts over time during discharge.
- Delivered kWh vs target: compare measured delivered kWh to the design’s required delivered kWh.
- Stop condition: note whether runtime ended due to low SoC, inverter current limit, temperature derate, or load shedding.
A worked example: if the system ran 2.2 hours and the average measured AC power was 1.15 kW, delivered energy is about 2.53 kWh. If the design target required 2.6 kWh delivered to the critical bus, you’re short by ~0.07 kWh, which is small enough to investigate control thresholds, efficiency assumptions, or measurement alignment.
Diagnose Deviations with a Structured Mind Map
When results don’t match, the fastest path is to classify the mismatch by where it occurred.
Mind Map: Runtime Performance Measurement and Diagnosis
Validate with Repeatability and Acceptance Criteria
A single test is useful, but acceptance should include repeatability.
- Repeat the steady segment at least twice to confirm the average power and SoC slope.
- Repeat the transient segment if the system supports staged load shedding; transient behavior can vary.
- Set acceptance bands: for example, runtime within ±10% of target under the same load set, and no unexpected load shedding during the steady segment.
A good commissioning report includes the traces and the stop reason, not just the final runtime. That’s how you turn “it worked” into “it matches the design,” and how you avoid guessing when the next outage comes with a different mix of loads.
12.4 Maintenance Procedures for Batteries Inverters and Monitoring
Maintenance is mostly about preventing small issues from becoming “why is the house dark?” issues. The goal is to keep batteries within safe operating limits, keep inverters operating within their electrical and thermal envelopes, and ensure monitoring data stays trustworthy.
Maintenance Foundations That Make Everything Else Work
Start with a simple cadence: inspect, verify settings, clean and tighten where appropriate, then test the system’s behavior under controlled conditions. Use the same checklist each time so you can compare results across months. If you log only failures, you’ll learn nothing; if you log measurements, you’ll learn patterns.
A practical baseline schedule:
- Monthly: visual inspection, check monitoring alerts, verify charge/discharge behavior matches the plan.
- Quarterly: verify connections are secure, confirm ventilation paths are unobstructed, review inverter event logs.
- Semiannual: run a controlled transfer and load support test, verify battery temperature readings and sensor plausibility.
- Annual: deeper inspection of wiring terminations, confirm protective device operation, and validate calibration assumptions used by monitoring.
Battery Maintenance and Monitoring Integrity
Batteries rarely need “hands-on” care, but they do need correct conditions and correct readings.
- Visual and environmental checks
- Confirm the battery enclosure is dry and free of corrosion or dust buildup on vents.
- Ensure the battery area temperature stays within the manufacturer’s specified range; monitoring should reflect that reality.
- Connection and terminal checks
- Look for discoloration, looseness, or signs of overheating at battery terminals and DC disconnects.
- If your system uses busbars or modular battery cabinets, verify that fasteners are torqued to spec during annual service.
- Battery management system health
- Monitoring should show consistent state-of-charge (SoC) trends during charge and discharge.
- If SoC jumps sharply while power flow is steady, suspect a sensor, configuration mismatch, or a communication issue.
Example: During a monthly check, you notice SoC drops 5% in 10 minutes while the inverter reports only a small load. You pause the test, compare battery current readings to inverter power, and confirm the battery current sensor is reporting plausible values. Fixing the measurement problem restores correct runtime planning.
Inverter Maintenance That Prevents Nuisance Failures
Inverters are power electronics with fans, filters, and protection logic. Maintenance focuses on keeping airflow clean and ensuring the inverter’s operating mode matches your system design.
- Thermal management
- Inspect intake and exhaust paths; remove dust that blocks airflow.
- Verify that fan operation is normal by checking monitoring fan speed or inverter temperature rise during typical operation.
- Firmware and configuration verification
- Confirm the inverter is running the intended configuration for grid-tied or backup mode behavior.
- After any firmware update, re-check critical settings such as charge limits, grid support parameters (if applicable), and transfer timing.
- Event log review
- Look for repeated warnings like “grid voltage out of range,” “overtemperature,” or “communication lost.”
- A single event during a storm is normal; repeated events on clear days usually indicate a settings mismatch or a wiring/measurement issue.
Example: The event log shows frequent “overtemperature” warnings on hot afternoons. Monitoring also shows the battery area is within range, but the inverter cabinet intake is partially blocked by stored items. Clearing the space reduces warnings without changing any electrical settings.
Monitoring Maintenance for Accurate Decisions
Monitoring is only useful if it’s consistent. Treat monitoring like an instrument panel: it should agree with what the system is doing.
- Data sanity checks
- Compare inverter-reported power flow with meter readings when possible.
- Confirm that time stamps are correct and that the system is not mixing time zones across devices.
- Alert hygiene
- Review alerts monthly and classify them as informational, actionable, or false.
- If an alert triggers every week for the same reason, fix the root cause rather than training yourself to ignore it.
- Communication reliability
- Check signal strength or link status for battery and inverter communications.
- If monitoring shows intermittent dropouts, inspect cabling, connectors, and routing away from high-voltage conductors.
Mind Map: Maintenance Procedures and Monitoring Checks
A Simple Semiannual Test Routine That Stays Practical
Run a controlled test that exercises the transfer path and load support without turning your home into a science experiment.
- Choose a time when critical loads are minimal.
- Start with a known load set (for example, refrigerator plus a few lights).
- Trigger transfer using the system’s test mode or a documented procedure.
- Record: transfer time, inverter output stability, and whether monitoring logs the event correctly.
Example: After a semiannual test, transfer time is slightly longer than last time, but monitoring shows the same grid detection delay. You confirm the grid voltage sensor wiring is intact and that the inverter’s grid detection threshold matches the configured value. The system returns to expected behavior after the adjustment.
Maintenance Records That Actually Help
Keep a single page per system with date, technician notes, measured temperatures, key monitoring metrics, and any setting changes. Include the last controlled transfer result and the most recent event-log summary. When something changes, you’ll know whether it was electrical, environmental, or simply a monitoring configuration issue.
12.5 Troubleshooting Guides for Common Operational Issues
A good troubleshooting flow starts with the simplest question: “What changed since it worked?” Then you confirm the basics—power, configuration, and signals—before you touch settings. Most operational issues in home battery systems fall into a few repeatable patterns, so the goal is to identify the pattern quickly and verify it with measurements.
Mind Map: Common Operational Issues and First Checks
Step 1: Confirm Symptoms and Capture Evidence
Write down what you observe: when it happens, what loads are affected, and whether the system is in backup mode or charging mode. If the system logs events, note the timestamps and error codes. For example, “transfer occurred at 2:14 a.m., then the kitchen outlets lost power at 2:16 a.m.” is more useful than “it failed overnight.”
A quick evidence checklist:
- Inverter display or app: current mode, output status, and any fault code.
- Transfer switch: position indicator and any “in transition” state.
- Battery: state of charge, temperature warnings, and any communication loss.
- Loads: which circuits are on the backup panel versus off it.
Step 2: Verify Fundamentals Before Changing Settings
Many “mystery” faults are actually configuration or wiring states.
- Grid status signal mismatch
- Symptom: frequent transfers or refusal to enter backup.
- Check: confirm the system recognizes grid presence/absence correctly. If the grid input is floating or miswired, the controller may oscillate.
- Example: during a brief utility sag, the system transfers out and back repeatedly because it interprets the sag as a full outage.
- Transfer switch position not matching expectation
- Symptom: inverter runs but no house power.
- Check: verify the transfer switch contacts are in the intended position and that interlocks are satisfied.
- Example: a manual transfer left in the “grid” position will make the backup inverter appear “dead” even though it is producing power.
- Inverter output disabled or limited
- Symptom: backup mode starts, but output is low or off.
- Check: look for output enable flags, current limits, or “standby” states.
- Example: a system configured for critical loads only may keep non-critical circuits off, which can look like a failure.
- Battery availability constraints
- Symptom: short runtime or immediate shutdown.
- Check: battery state of charge, temperature limits, and any DC-side disconnects.
- Example: if the battery is near a temperature limit, the system may reduce usable power to protect the cells.
Step 3: Isolate Subsystem with Targeted Tests
Use isolation to avoid changing multiple variables at once.
Power Path Issues
- Symptom: no output during backup.
- Isolation method: confirm inverter output voltage at the output terminals (or via the system’s internal measurement screen) and confirm the transfer switch path to the backup panel.
- Example: if inverter output is present but the backup panel is dark, the issue is in the transfer path or circuit routing.
Control and Communications Issues
- Symptom: alarms about “lost communication” or inconsistent behavior.
- Isolation method: check whether the fault appears only after a reboot, only after a transfer, or only when solar is active.
- Example: if communication faults occur only during high activity, a loose connector or cable routing problem may be causing intermittent signal loss.
Load Behavior Issues
- Symptom: runtime is far shorter than expected.
- Isolation method: measure actual load during backup. Start with the largest likely contributors: HVAC, water heater, well pump, and microwave combinations.
- Example: a well pump with a high starting surge can trip inverter limits even if the average wattage seems reasonable.
Solar Charging Path Issues
- Symptom: battery not charging when sun is available.
- Isolation method: verify PV input status, charge mode, and any PV inverter faults.
- Example: if the battery charger is set to “grid-tied only” behavior, it may refuse to charge during certain outage states.
Step 4: Correct One Variable and Re-test
After you identify the likely cause, make one correction, then run a controlled functional test.
A practical re-test sequence:
- Confirm the system is in the expected mode.
- Verify the corrected setting or connection.
- Trigger a short backup test using a safe method (for example, simulating a grid loss if your system supports it).
- Observe transfer timing, output stability, and battery charging behavior.
- Record what changed and whether the symptom returned.
Example: Frequent Transfers During Brief Outages
- Symptom: transfers out for a moment, then returns, repeating several times.
- Found: grid signal was unstable during the sag, and the system’s transfer logic was set for fast response.
- Fix: confirm the grid sensing input wiring and verify the transfer timing settings match the intended behavior for your utility environment.
- Re-test: repeat the test during a controlled utility interruption window and confirm transfers occur once per event, not multiple times.
Example: Inverter Runs but Only Some Rooms Have Power
- Symptom: lights in one area work, others do not.
- Found: the backup panel circuits were correctly energized, but the non-backup circuits remained off by design.
- Fix: verify circuit mapping labels and ensure critical loads are on the intended backup breakers.
- Re-test: turn on a known critical load and confirm it powers reliably during a short backup test.
Mind Map: Troubleshooting Decision Points
A reliable troubleshooting habit is to treat every fault like a detective story with receipts: observe, verify, isolate, correct, and confirm. When you follow that sequence, you spend less time guessing and more time restoring power with confidence.