Nuclear Microreactors
1. Scope and Use Cases for Portable Nuclear Energy
1.1 Defining Portable Nuclear Energy and Microreactor Boundaries
Portable nuclear energy is nuclear power packaged so it can be transported, installed, and operated at sites that may not have grid access or the infrastructure to support large power plants. A microreactor is the nuclear heat source at the center of that package, sized and engineered so the full system can be deployed as a unit or a small set of modules with clear interfaces for power, heat, safety, and operations.
What “Portable” Means in Practice
Portability is not just about weight. It is about repeatable deployment with predictable interfaces and a defined operational envelope. In a practical sense, a portable nuclear system has:
- A transport plan that specifies how the reactor and balance-of-plant components move without breaking safety functions.
- A site readiness checklist that defines what must be available before startup (foundations, utilities, access control, and heat rejection capability).
- A commissioning sequence that turns “delivered hardware” into “verified operating system” using acceptance tests.
- An operating boundary that states what conditions are allowed during normal operation and what triggers controlled shutdown.
A useful mental model is to treat the system like a power plant with a shipping container attitude: the physics stays the same, but the logistics and verification are designed to be repeatable.
What “Microreactor” Means in Engineering Terms
A microreactor is defined by its core power scale, thermal-to-electric conversion approach, and safety concept rather than by marketing size claims. The core produces heat; the system converts that heat into electricity and, optionally, process heat. The microreactor boundary includes the components that must work together to keep the reactor in a safe state.
A boundary definition should answer three questions:
- Where does the nuclear system stop? This includes the reactor vessel or core module, primary heat transport, and any reactivity control hardware.
- Where does the power system start? This includes turbines or other conversion equipment, generators, switchgear, and grid or load interfaces.
- Where does the safety system live? This includes shutdown mechanisms, containment or confinement, radiation monitoring, and heat rejection paths that are credited in the safety case.
System Boundaries You Should Draw Before You Build
Start with a block diagram and then add “responsibility lines” that show who owns which function.
- Nuclear boundary: reactivity control, core heat generation, and primary heat transport.
- Thermal boundary: heat exchangers, coolant loops, and heat delivery to power conversion or process users.
- Electrical boundary: generator output, power conditioning, protection relays, and distribution to loads.
- Radiological boundary: shielding, controlled areas, contamination control, and monitoring.
- Operational boundary: procedures, alarms, operator roles, and maintenance access.
These boundaries are not just diagrams; they determine what can be tested where, what must be verified before transport, and what must be re-validated after installation.
Mind Map: Portable Nuclear Energy and Microreactor Boundaries
Example: Boundary Clarity for a Remote Mine Site
Imagine a remote mine that needs electricity for ventilation fans and pumps, plus steam for ore processing. A boundary-first approach might look like this:
- The nuclear boundary includes the core module and the primary heat transport system that carries heat to the heat exchanger.
- The thermal boundary includes the heat exchanger that transfers heat to a secondary loop feeding a steam generator.
- The electrical boundary includes the generator, step-up transformer, and protection equipment that ensures the system disconnects safely if the load configuration changes.
- The radiological boundary includes shielding around the reactor module, radiation monitors at access points, and procedures that define when maintenance can occur.
If a component is outside the defined boundary, you should be able to state what happens if it fails. For instance, if a steam valve sticks, the system should still be able to manage heat removal without violating the safety envelope.
Example: A “Boundary Test” During Commissioning
During commissioning, teams often run tests that confirm the system behaves correctly at the edges of its allowed conditions. A boundary test might verify that:
- The reactor can transition to a safe shutdown state when a credited heat rejection path is unavailable.
- The electrical protection responds correctly to a simulated load trip.
- Radiation monitoring alarms trigger at the expected thresholds for controlled area entry.
These tests are valuable because they confirm that the boundary definitions match reality. If the system “works” but the safety functions do not behave as the boundary assumes, the boundary definition needs revision.
The Boundary Statement That Guides Everything Else
A complete boundary definition ends up being a short, disciplined statement used across engineering, safety, and operations. It specifies what is included in the microreactor system, what interfaces exist, and what conditions are allowed. Once that statement is stable, design decisions become easier to justify: you can trace each requirement back to a boundary responsibility, rather than hoping everything will fit together later.
1.2 Mapping Remote and Industrial Energy Demands to Reactor Needs
Remote sites and industrial facilities rarely need “power” in the abstract. They need a specific mix of electricity, heat, reliability, and operating behavior. Mapping those needs to a microreactor starts with translating real demand into measurable requirements the reactor and its balance of plant can satisfy.
Step 1: Inventory Energy Services, Not Just Energy
List the site’s energy services as separate loads. Common categories include:
- Electricity for motors, controls, lighting, and communications
- Process heat for steam, hot water, or direct heating
- Thermal support for drying, melting, or chemical processing
- Backup or ride-through power for critical systems
Example: A remote mining camp may run electric compressors and pumps continuously, while a nearby processing unit requires steam only during shift hours. Treating steam as “optional” electricity is a classic mismatch that leads to undersized heat capability.
Step 2: Convert Each Load into Time-Resolved Demand
For each service, capture:
- Power level (kW or MW)
- Duration (hours per day, days per week)
- Ramp behavior (how quickly demand changes)
- Minimum operating constraints (e.g., motors that cannot cycle rapidly)
A simple worksheet works. For each load, create a daily profile with at least three bands: base, normal, and peak. If you only have annual energy totals, estimate a profile by using operational schedules (shifts, batch cycles, maintenance windows).
Example: A cement kiln might have long steady operation with short start-up transients. The reactor must cover the steady demand and the conversion system must handle transient heat extraction without violating safety limits.
Step 3: Identify Electrical Quality Requirements
Microreactors can supply electricity, but the site may care about quality more than average kWh.
Capture:
- Voltage and frequency tolerance for sensitive controls
- Power factor expectations for motor-heavy loads
- Harmonic sensitivity for drives and power electronics
- Black start or synchronization needs
Example: If the facility uses variable-frequency drives, the grid interface must manage harmonics and ensure protection settings coordinate with the reactor’s power electronics or generator behavior.
Step 4: Translate Heat Demand into Usable Thermal Output
Heat demand is not just “temperature.” It is heat rate and heat availability.
For each thermal service, record:
- Required temperature range (e.g., 120°C hot water vs 450°C steam)
- Mass flow or steam generation rate
- Pressure constraints if steam is involved
- Thermal storage feasibility (can you buffer heat during demand dips?)
Example: A process requiring 180°C water can often accept a wider operating band than one requiring saturated steam at a fixed pressure. That flexibility can reduce the required peak thermal output.
Step 5: Determine Reliability and Operating Mode Requirements
Reliability is about how the site behaves when the reactor is in a different state.
Define:
- Continuous operation vs scheduled downtime tolerance
- Allowed outage duration for maintenance
- Load-following needs (smooth tracking vs step changes)
- Critical load priority (what must stay on during disturbances)
Example: A remote hospital wing may require continuous power for life-safety systems. Even if the rest of the facility can tolerate interruptions, the mapping must reserve capacity and define how the microreactor and storage handle disturbances.
Step 6: Build the Requirement Set for Reactor and Balance of Plant
Now convert the demand inventory into a structured requirement set:
- Electrical steady-state power and peak power
- Thermal steady-state output and peak heat extraction
- Ramp rate limits for load-following
- Interface constraints for heat exchangers and steam systems
- Protection and control coordination requirements
A practical way to avoid gaps is to require every requirement to point to a load category and a time band.
Mind Map: Demand Mapping to Reactor Requirements
Example: Remote Industrial Site with Mixed Loads
A site has 2.5 MW of continuous electric demand, plus a 1.0 MW equivalent steam requirement during two 6-hour shifts. The steam temperature requirement is 160–180°C hot water, and the facility can store heat for up to 3 hours.
Mapping outcome:
- Electrical requirement: size for 2.5 MW steady with peak margin for motor start transients.
- Thermal requirement: size for shift-hour heat extraction, but reduce peak thermal sizing because storage covers the first part of the shift ramp.
- Reliability requirement: define that critical controls and safety systems must remain powered during any maintenance window, while noncritical loads can be shed.
This mapping turns “we need energy” into a concrete set of electrical and thermal capabilities, plus the interface and control behavior needed to keep the site stable while the reactor does its job.
1.3 Comparing Microreactors With Diesel Gas Turbines and Grid Extension
When you compare microreactors to diesel generators and grid extension, you’re really comparing three different ways to manage energy risk: fuel logistics, equipment complexity, and how quickly you can recover from failures. The goal isn’t to crown a winner; it’s to match the energy system to the site’s constraints.
Foundational Comparison Axes
Start with four practical axes that drive most decisions.
-
Fuel logistics and continuity: Diesel depends on frequent deliveries and storage management. Microreactors depend on a defined fuel supply and controlled handling, typically with longer operating intervals. Grid extension depends on the upstream network’s stability rather than local fuel availability.
-
Efficiency and operating profile: Diesel and gas turbines often perform best near certain load ranges, and efficiency can drop at part load. Microreactors are designed around steady thermal behavior, so the question becomes how well the plant can follow load without stressing thermal margins.
-
Time to deploy and restart: Diesel systems can be shipped and commissioned relatively quickly, and restarting after a failure can be straightforward. Grid extension can take months to years due to permitting, construction, and interconnection studies. Microreactors fall between these extremes: deployment is modular, but commissioning and safety verification are substantial.
-
Maintenance burden and spares: Diesel engines have well-known maintenance routines and widely available parts. Gas turbines add complexity in hot-section components. Microreactors shift maintenance emphasis toward balance-of-plant reliability, instrumentation, and radiation-controlled work practices.
Microreactors Versus Diesel Gas Turbines
Diesel generators are often the baseline for remote sites because they’re familiar and scalable. The trade is that fuel delivery becomes the critical path. A common failure mode isn’t the engine—it’s the supply chain: a delayed shipment, a blocked access road, or a storage tank issue. Gas turbines reduce some maintenance frequency compared to reciprocating engines, but they still require fuel quality control, air filtration discipline, and careful management of high-temperature components.
Microreactors change the failure emphasis. Instead of “Will the next fuel truck arrive?” the key question becomes “Can the plant maintain safe heat removal and reactivity control under abnormal conditions?” That’s why the comparison must include safety functions, not just power output. A microreactor’s ability to shut down safely and remove decay heat without relying on continuous operator actions is central to its operational model.
Example: Remote Industrial Site with Unreliable Roads
A mining operation needs 20 MW electrical and steady process heat. Diesel planning might assume weekly deliveries. If roads are cut for two weeks, the site either reduces output or burns through stored fuel faster than expected. A microreactor plan would size fuel inventory differently: fewer deliveries, but stricter procedures for fuel handling and a stronger emphasis on maintaining heat rejection systems. The diesel system’s “fast restart” advantage matters most when downtime is short and fuel is available; the microreactor’s advantage matters most when fuel continuity is the dominant risk.
Microreactors Versus Grid Extension
Grid extension is attractive when the network is nearby and permitting is manageable. The main risk is that the site becomes dependent on upstream outages, voltage stability, and maintenance schedules. You can add local generation to cover outages, but then you’re back to managing fuel or storage.
Microreactors are different: they reduce dependence on external supply for energy production. However, they introduce a different dependency: regulatory compliance, safety case evidence, and specialized operational practices. Grid extension also has a “construction risk” profile—delays, right-of-way issues, and interconnection constraints—whereas microreactors have “commissioning and verification risk.”
Example: Industrial Park Near a Weak Grid
Suppose an industrial park is connected to a grid with frequent voltage dips. Extending the line might improve capacity, but power quality issues can persist until protection settings and network reinforcement are addressed. A microreactor-based solution can provide stable local generation, but it still requires careful integration: switchgear coordination, protection studies, and operational procedures for islanding and synchronization.
Mind Map: Decision Logic for Comparing Options
Practical Takeaway
A useful comparison ends with a checklist: if fuel delivery is the dominant risk, diesel and gas turbines can be fragile unless logistics are robust. If upstream outages dominate, grid extension may not fully solve reliability without local backup. If safety functions and heat removal discipline are feasible to support operationally, microreactors offer a different reliability profile—less about frequent fuel logistics, more about maintaining engineered safety boundaries.
1.4 Establishing Performance Requirements for Power Heat and Reliability
Performance requirements turn “we need energy” into measurable targets that engineering, operations, and safety can all agree on. For nuclear microreactors, the key is to specify power, heat, and reliability in a way that matches how the plant actually behaves under normal operation and disturbances.
Start with Mission Energy Services
Define the energy services first, because they determine both electrical and thermal outputs.
- Power service: steady electricity for a microgrid, critical loads, or industrial drives.
- Heat service: steam, hot water, or process heat for dehydration, refining, district heating, or chemical steps.
Example: A remote mine needs 2 MW electric for pumps and 6 MW thermal as 180°C process water. The requirement is not “run the reactor,” but “deliver 2 MW electric and 6 MW thermal with specified quality and availability.”
Translate Services into Output Requirements
Convert the service needs into reactor-level output targets and quality constraints.
Electrical Output Requirements
Specify:
- Rated electrical power and allowable deviation (e.g., ±5% under steady conditions).
- Power quality: frequency stability, voltage regulation range, and harmonic limits if grid-forming.
- Start-up and ramp behavior: time to reach rated output and ramp rate limits.
Example: For a standalone microgrid, require frequency within ±0.2 Hz and voltage within ±5% during load steps. That forces the control system and power conversion to be designed for those tolerances.
Thermal Output Requirements
Specify:
- Thermal power at the heat exchanger interface.
- Supply temperature and return temperature ranges.
- Flow rate and allowable pressure drop.
- Heat delivery mode: continuous, load-following, or batch support.
Example: A steam user requires 10 bar saturated steam. The thermal requirement must include the steam generator heat transfer margin so the reactor can meet steam pressure even when feedwater temperature varies.
Define Reliability in Operational Terms
Reliability requirements should be expressed as availability and recoverability, not just component lifetimes.
Specify:
- Availability target (fraction of time meeting output requirements).
- Unplanned outage limit (frequency and duration).
- Planned maintenance window and maximum downtime per cycle.
- Graceful degradation rules: what happens when one subsystem is unavailable.
Example: If the site can tolerate only 8 hours of downtime per month, then the reliability target must support that maintenance and failure recovery schedule.
Connect Requirements to Plant States
A microreactor’s behavior is best described by discrete plant states with clear acceptance criteria.
- Normal operation: outputs within quality limits.
- Reduced output: still meets minimum service levels.
- Safe shutdown: reactor subcritical/controlled with heat removal maintained.
- Recovery: time and conditions to return to service.
Example: If a heat exchanger train is down, the plant may shift to reduced thermal output while maintaining electrical power. The requirement must state the minimum thermal level and the maximum time to reach it.
Establish Design Basis Events That Stress Outputs
Reliability is only meaningful once you define the disturbances you must survive.
Create a requirements list of events such as:
- Loss of heat sink scenarios.
- External electrical disturbances (load rejection, islanding).
- Instrument or control faults affecting power/heat regulation.
- Cooling flow interruptions and recovery times.
For each event, specify:
- Maximum allowable deviation in electrical and thermal outputs.
- Time to reach safe state.
- Heat removal capability requirements.
- Acceptance criteria for safety functions.
Example: For a loss of process water flow, require that thermal output transitions to a safe heat removal mode within a defined time and that the electrical system remains stable long enough for critical loads to ride through.
Use Performance Metrics That Engineers Can Test
Requirements must map to measurable verification activities.
- Steady-state accuracy: output within tolerance bands.
- Dynamic response: overshoot, settling time, and stability margins.
- Thermal margins: minimum heat transfer margin under worst-case conditions.
- Reliability metrics: availability, mean time to restore, and unavailability hours.
Example: Instead of “stable power,” specify “frequency settling within 5 seconds after a 30% load step, with no sustained oscillation.” That is testable.
Mind Map of Performance Requirement Flow
Mind Map: Power Heat and Reliability Requirements
Integrated Example with Clear Numbers
A coastal industrial site requires 1.5 MW electric and 4 MW thermal.
- Electrical: 1.5 MW ±5% steady; frequency within ±0.2 Hz during load steps; settle within 5 seconds after a 25% load change.
- Thermal: 4 MW thermal at the exchanger inlet; supply temperature 160°C ±10°C; maintain minimum flow of 80% of design.
- Reliability: 95% availability; unplanned outage duration under 12 hours; planned maintenance downtime under 8 hours per month.
- Events: loss of process water flow triggers safe heat removal within 60 seconds; electrical output remains within ±10% for ride-through until operators can isolate the process loop.
These requirements are cohesive because each one ties a service need to a plant state, then to testable metrics and event responses. The result is a specification that can be engineered, verified, and operated without interpretive guesswork.
1.5 Documenting Site Constraints for Deployment Planning
Portable microreactors live or die by site constraints. The goal of this section is to turn “we think the site is suitable” into a documented, testable set of requirements that engineering, safety, and operations can all use without guessing.
Site Constraints as a Structured Set of Inputs
Start by separating constraints into five buckets: physical layout, environmental conditions, infrastructure interfaces, operational logistics, and regulatory boundaries. This prevents the common failure mode where a constraint is mentioned once in a meeting and then silently ignored in a later design decision.
Physical layout includes available footprint, lifting paths, crane clearances, access roads, laydown areas, and separation distances to structures and occupied spaces. A practical example: if the transport package is 4.5 m wide and the access road has a 3.8 m clearance, you do not have a “minor inconvenience”; you have a deployment blocker.
Environmental conditions cover meteorology, flooding, seismicity, extreme temperatures, wind-driven debris, and local water chemistry if cooling water is used. For example, documenting a design basis ambient temperature of 40°C is not just a number; it drives heat rejection performance, component derating assumptions, and maintenance scheduling.
Infrastructure interfaces include power distribution points, grounding, water supply or heat sink availability, communications, and any required process tie-ins. If the site has unreliable water pressure, you document the minimum available flow and pressure and plan for buffering or alternative heat removal.
Operational logistics includes staffing access, shift patterns, security perimeter, waste handling routes, and emergency response staging. A simple but effective practice is to map “who can reach what, when” during an alarm scenario.
Regulatory boundaries include licensing jurisdiction, land ownership constraints, controlled area definitions, and documentation expectations for safety cases and quality records.
Mind Map: Site Constraint Documentation
Evidence-Backed Documentation Practices
Treat each constraint as a statement with three fields: value, basis, and impact.
- Value is the measurable requirement, such as “minimum cooling water flow: 30 m³/h.”
- Basis is the source, such as “measured during two site visits on 2026-03-14 and 2026-03-15” or “utility records for the last 12 months.”
- Impact is what changes in design or operations, such as “heat exchanger sizing margin reduced; install buffer tank; update operating limits.”
A concrete example: suppose the site has frequent fog. You document visibility and precipitation rates as they affect instrumentation cleaning, sensor fouling, and access safety. Then you connect it to maintenance intervals and protective covers, rather than leaving it as a weather note.
Building the Site Constraint Register
Create a Site Constraint Register that is easy to audit. Each entry should include: constraint ID, description, applicable system or activity, value, basis, measurement method, uncertainty, and verification plan.
A good register entry looks like this in plain language:
- Constraint: “Maximum allowable ambient temperature at air-cooled heat rejection inlets.”
- Value: “45°C peak for 10-minute average.”
- Basis: “On-site met mast data; 95th percentile from 3 years of records.”
- Impact: “Derate electrical output during peak; specify inlet filtration and cleaning cadence.”
- Verification: “Commissioning test at controlled inlet temperature; confirm alarms and control response.”
Advanced Details That Prevent Late Surprises
- Boundary conditions for interfaces: Document where the reactor system ends and the site system begins. For instance, specify the exact point of electrical connection and grounding responsibility.
- Access and maintenance geometry: Record not only whether a crane can lift the module, but also whether maintenance personnel can reach valves and panels with the required clearance.
- Controlled area logic: Define controlled area extents based on radiation protection needs and operational states, then document how fencing, signage, and monitoring placement support those extents.
- Emergency response routes: Show the route from staging to the reactor and the route for waste transport. If the routes cross, document traffic control requirements.
Example: Turning a Site Walk into Requirements
During a site walk, you notice a drainage ditch near the proposed foundation area. Instead of writing “ditch present,” you document: ditch dimensions, flow direction during heavy rain, distance to module foundation, and whether water could enter any below-grade penetrations. The impact becomes a specific action: elevate electrical cabinets, seal penetrations to the required standard, and add a drainage verification test to commissioning.
By the end of this section, the deployment plan should read like a checklist of constraints with evidence and consequences. That is what makes later design work efficient and what keeps operations from discovering problems after the hardware has arrived.
2. Reactor Fundamentals for Microreactor Design
2.1 Neutron Economy and Core Reactivity Control Basics
Neutron economy describes how many neutrons produced in fission end up causing more fissions instead of being lost to absorption, leakage, or non-fission reactions. In a microreactor, where the core is small and compact, leakage matters more than in large reactors, so neutron economy becomes a practical design target rather than a textbook concept.
Core Reactivity and the Multiplication Factor
Start with the multiplication factor, k. If k = 1, the neutron population stays roughly constant from one generation to the next. If k > 1, the population grows; if k < 1, it shrinks. Reactivity ρ is a convenient way to express how far you are from criticality:
- ρ = (k − 1) / k
- ρ = 0 means critical
- ρ > 0 means supercritical
- ρ < 0 means subcritical
A useful mental model is to treat reactivity as the “steering wheel” for neutron population. But unlike a car, the system also has “engine braking” effects from physics feedbacks, which is why control is not just about setting a number.
Prompt and Delayed Neutrons
Fission releases neutrons quickly, called prompt neutrons. A smaller fraction comes from delayed neutrons, emitted seconds after fission due to decay of fission products. Delayed neutrons are the reason operators can control power without the reactor responding instantly.
In control terms:
- Prompt neutrons dominate the immediate response.
- Delayed neutrons provide time for control systems to act.
For microreactors, the delayed fraction can still be similar in principle, but the overall dynamics can be faster because the core is compact and the neutron population changes more quickly with geometry and temperature.
Neutron Loss Paths and Why They Matter
Neutrons are lost through several mechanisms:
- Absorption without fission: Neutrons can be captured by materials in the core that do not produce fission.
- Leakage: In small cores, neutrons can escape the active region.
- Inelastic scattering and energy changes: Neutrons may be shifted in energy; whether they remain effective depends on the fuel and moderator behavior.
Neutron economy improves when the design increases the fraction of neutrons that cause fission and reduces leakage and non-fission absorption. In practice, this means careful choices of fuel composition, geometry, and (if applicable) moderation.
Reactivity Control Mechanisms
Reactivity control is the set of methods that keep ρ near zero during operation. Think of it as maintaining a balance between neutron production and losses.
Common control levers include:
- Control materials that absorb neutrons (e.g., control rods or movable absorbers).
- Burnup effects where fuel composition changes over time, typically reducing reactivity as fissile content changes.
- Temperature feedback where heating changes neutron behavior, often providing negative feedback.
A key best practice is to separate reactivity worth from timing. A control system may have large worth but slow actuation, which can be problematic during transients.
Feedback and Stability
Negative feedback helps stability. As temperature rises, many reactor designs experience reduced reactivity due to Doppler broadening in resonance absorption and changes in density or geometry. Even when the control system is doing its job, feedback effects determine how much correction is needed.
A practical example: suppose the load increases and the reactor power rises. Higher power heats the core, which then shifts neutron behavior so that reactivity decreases. If the feedback is sufficiently negative, the power rise is self-limiting and the control system only needs to trim, not fight.
Mind Map: Neutron Economy and Reactivity Control
Example: Tracking Criticality During a Power Increase
Imagine a microreactor operating at steady power where k ≈ 1. A process demand increases, and the control system commands a small increase in reactivity. Immediately, prompt neutrons respond, causing a faster power change. As power rises, temperature increases and negative feedback reduces reactivity. The control system then adjusts to restore ρ to near zero.
If the negative feedback is strong, the required control movement is small and the power settles smoothly. If feedback is weak, the control system must provide larger corrections, which can increase wear on actuators and complicate transient management.
Example: Neutron Leakage as a Design Constraint
Consider two geometries with the same fuel and material composition. The smaller core has a higher surface-to-volume ratio, so more neutrons can escape before causing fission. That reduces effective multiplication, meaning you must compensate with better neutron economy—such as improved reflector performance or geometry optimization—so that k can still reach 1 under operating conditions.
Practical Takeaways for Microreactor Design
Neutron economy is about the accounting of neutrons, not just the value of k. Reactivity control is about maintaining that accounting under changing conditions, with prompt and delayed behavior shaping how quickly the system responds. When you design for strong negative feedback and adequate control authority, you reduce the amount of “heroics” the control system must perform, which is a nice way to keep both safety margins and maintenance schedules happier.
2.2 Thermal Hydraulics Concepts for Compact Systems
Thermal hydraulics is the study of how heat moves through a coolant and how that coolant moves through the reactor and its heat exchangers. In compact microreactors, the same physics applies as in large plants, but the smaller dimensions make the details matter sooner: pressure drops rise, heat transfer surfaces shrink, and temperature gradients can become noticeable before operators can react.
Core to Coolant Heat Transfer Basics
Start with the heat path: fission power heats the fuel, heat conducts through cladding, then convects to the coolant. For compact systems, the limiting step is often the coolant-side convection, not the fuel-side conduction. A practical way to reason about this is to compare resistances in series: if one resistance is much larger than the others, it dominates the temperature difference.
Example: Suppose the fuel-to-cladding conduction is fast, but the coolant film coefficient is low because flow is sluggish. The cladding surface temperature rises even if the bulk coolant temperature changes only modestly. That’s why thermal hydraulics models track both bulk coolant temperature and near-wall heat transfer.
Flow Regimes and Why They Change Faster
Coolant motion can be laminar, transitional, or turbulent. Turbulence usually increases heat transfer by thinning the thermal boundary layer and enhancing mixing. In compact geometries, the Reynolds number can shift quickly with small changes in mass flow rate or coolant properties.
Example: If a microreactor uses forced circulation and the pump speed drops slightly during a load change, the Reynolds number may cross from turbulent to transitional in a narrow channel. The heat transfer coefficient can drop sharply, raising wall temperatures even when total power is steady.
Pressure Drop and Pumping Power
Pressure drop comes from friction along channels and from local losses at bends, valves, and heat exchanger headers. In compact designs, shorter flow paths do not automatically mean lower losses; hydraulic diameter is smaller, so frictional losses can dominate.
Best practice: When sizing pumps, compute pressure drop at multiple operating points, not just nominal flow. Then verify that the control system can maintain required flow during transients.
Example: A design that meets steady-state flow at full load might fail to keep adequate flow at partial load if the control valves reduce flow resistance in the wrong direction, causing an unexpected flow redistribution.
Heat Exchanger Thermal Hydraulics
Heat exchangers link reactor heat to the external power conversion loop. Thermal hydraulics here includes both temperature approach and pressure losses on each side. The key constraint is the minimum temperature difference, because it sets the maximum transferable heat for a given area.
Example: If the reactor coolant enters a heat exchanger hotter than expected due to reduced heat transfer in the core, the exchanger may still transfer the same heat, but the temperature approach shrinks. That can reduce margin for control and increase the risk of fouling or thermal stress.
Two-Phase Versus Single-Phase Cooling
Some microreactors use single-phase liquid cooling; others may allow subcooled boiling margins depending on design. Two-phase flow introduces additional complexity: void fraction changes, heat transfer can increase or become unstable depending on conditions, and pressure drop behavior becomes nonlinear.
Best practice: If boiling is possible, track quality-related parameters and define clear operational limits tied to safety functions. Even when boiling is avoided, thermal hydraulics must confirm that the system stays within subcooled conditions.
Example: A small reduction in inlet subcooling can move the system closer to nucleation. The model should show how that affects wall temperature and pressure drop, not just bulk temperature.
Control-Relevant Thermal Hydraulics
Thermal hydraulics is not only about equilibrium; it’s about response. The coolant has thermal inertia, and the system has time constants from heat capacity and flow residence time. These determine how quickly temperatures rise after a power change.
Example: If the core power increases, fuel temperature rises first, then cladding, then coolant bulk. The control system should use measurements and control actions that align with these delays. Otherwise, it may overcorrect because it reacts to a temperature that lags the actual heat generation.
Mind Map: Thermal Hydraulics for Compact Systems
Integrated Mini-Case Example
Consider a compact forced-circulation loop with a core heat exchanger. At steady full load, the coolant flow is turbulent and wall temperatures are within limits. During a partial-load operation, the controller reduces pump speed to save power. The Reynolds number drops, heat transfer coefficient decreases, and wall temperature rises faster than bulk coolant temperature. The heat exchanger still transfers the required heat, but the temperature approach narrows, leaving less margin for further load changes. A robust design would therefore include (1) flow and heat transfer margins across the expected operating range, (2) pump and valve sizing that preserves adequate flow regime, and (3) control logic that accounts for thermal inertia and measurement delays.
2.3 Heat Transfer Paths from Core to Power Conversion
A microreactor’s job is simple to state and tricky to execute: move heat from the fission core to a power conversion system without losing control of temperatures, materials, or performance. The “path” is not one pipe; it’s a chain of thermal resistances, flow passages, and interfaces. If you can name each link and what drives heat through it, you can reason about efficiency, safety margins, and maintainability.
Core Heat Generation and the First Temperature Gradient
Heat is produced in the fuel and deposited into the surrounding cladding and coolant. The first gradient is inside the fuel: power density creates a temperature rise from fuel centerline to fuel surface. Then heat crosses the fuel-to-cladding gap (often modeled with an effective conductance), through cladding material, and into the coolant boundary layer.
A practical way to picture this is a “stack of resistances.” Each layer adds a temperature drop proportional to heat rate. For example, if total heat is 10 MW(th) and the combined fuel-to-coolant thermal resistance corresponds to a 200°C rise from coolant bulk to fuel centerline, then any change that increases resistance—like degraded contact in the gap—raises peak temperatures even if total power stays the same.
Coolant Transport and Heat Pickup
Once heat reaches the coolant, the next link is convection: coolant carries energy away from the core. The dominant drivers are mass flow rate, coolant properties, and flow regime. In compact systems, flow paths are short, so pressure drops can be significant and pump performance matters.
A simple example: doubling coolant mass flow roughly halves the temperature rise across the core for the same thermal power, assuming heat capacity and heat transfer coefficients don’t change dramatically. That reduces peak cladding temperatures, but it increases pumping power and may change boiling margins if the design is near saturation.
Heat Exchanger Interfaces the Bridge to Power Conversion
Power conversion rarely uses the same fluid as the core coolant. A heat exchanger transfers heat across a barrier, turning “thermal energy in coolant” into “thermal energy in a secondary loop.” The interface is where many real-world constraints show up: fouling, corrosion, thermal stresses, and leakage control.
There are two common modeling approaches. The first uses an overall heat transfer coefficient and a log-mean temperature difference to estimate exchanger effectiveness. The second treats the exchanger as multiple segments where local temperatures and heat transfer coefficients vary.
Example: suppose the secondary loop enters 50°C cooler than the coolant bulk and leaves 30°C below the coolant outlet. If the exchanger has a limited approach temperature at the hot end, the system may be constrained by the smallest temperature difference rather than by total heat capacity. That’s why designers track “minimum temperature approach” instead of only average temperatures.
Power Conversion Loop Choices and Their Thermal Demands
After heat reaches the secondary loop, the power conversion system imposes its own temperature targets. Options include steam generation with turbines, supercritical cycles, or other closed-loop arrangements. Regardless of the cycle, the conversion system typically needs:
- A sufficiently high hot-side temperature to achieve useful efficiency.
- A stable cold-side sink temperature to avoid excessive condensation or cycle instability.
- Controlled pressure levels to prevent unwanted phase changes.
Example: if a cycle requires a hot-side outlet temperature of 500°C for rated output, then any reduction in core-to-secondary heat transfer effectiveness forces either higher core temperatures or reduced power. In a microreactor, those tradeoffs must be managed with clear operating limits.
Thermal Control Strategies That Keep the Path Predictable
Heat transfer paths become unpredictable when control actions change multiple links at once. Good practice is to define control variables that map cleanly to thermal outcomes.
Common control levers include:
- Reactor power control to set the heat generation rate.
- Coolant flow control to set the convection heat pickup.
- Secondary loop flow or feedwater control to set exchanger driving temperatures.
Example: if load increases, raising reactor power increases heat at the core and also raises coolant outlet temperature. If secondary flow is not adjusted, the exchanger may see a reduced driving temperature difference, limiting heat transfer and causing a temperature lag. Coordinated control keeps the thermal path “well behaved” by maintaining adequate temperature differences across the exchanger.
Mind Map: Heat Transfer Path from Core to Conversion
Worked Example: A Full Path with Temperature Accounting
Assume 5 MW(th) core power. Let the effective temperature rise from coolant bulk to fuel centerline be 150°C, and the core coolant bulk rise across the core be 60°C. If the coolant enters at 300°C, then coolant bulk exits at 360°C, and fuel centerline is about 510°C.
Now consider a heat exchanger transferring heat to a secondary loop. If the minimum temperature approach on the hot end is 20°C, and the secondary hot-side outlet must be 430°C, then the secondary hot-side inlet must be high enough to satisfy the exchanger driving temperatures while meeting the cycle’s pressure and phase constraints. The key point is that each link’s temperature drop adds up, and the smallest temperature approach often sets the practical limit.
Practical Checklist for Reasoning About the Path
- Identify the dominant resistance at each stage: fuel conduction, gap conductance, convection, exchanger transfer.
- Track temperature margins at the hottest relevant points: fuel centerline, cladding, hot-side exchanger approach.
- Verify that control actions change one thermal lever at a time or are coordinated to prevent exchanger driving temperatures from collapsing.
- Use temperature accounting with clear assumptions so operators can interpret sensor readings without guessing.
When these steps are followed, the “core to conversion” path becomes a map you can read, not a black box you hope is behaving.
2.4 Fuel Types and Cladding Considerations for Compact Reactors
Fuel selection in compact reactors is a three-way trade between neutronics, heat removal, and how the fuel and cladding behave under long service. The goal is not just “more power in less space,” but predictable performance with clear safety margins.
Fuel Types for Compact Cores
Most compact microreactors use solid fuel in a sealed or semi-sealed core. The main fuel families differ in how they handle heat, how they swell, and how they release fission products.
Uranium-based fuels are common because they are well understood and can be fabricated in many geometries. In compact designs, the fuel is often configured to keep peak temperatures low enough for the cladding and to limit reactivity swings over the operating interval.
Low-enriched uranium variants are frequently paired with designs that aim for long core life. A practical way to think about this is to treat the core as a “heat and reactivity budget.” If you spend too much of the reactivity budget early, you may need operational constraints later.
High-assay or alternative uranium forms can appear in some concepts, but the engineering consequences are similar: you still must manage thermal expansion, fission gas behavior, and the mechanical integrity of the cladding.
Carbide and nitride fuels tend to conduct heat well, which can reduce temperature gradients. The trade is that their chemical compatibility with cladding materials and their response to irradiation must be carefully matched.
Oxide fuels are widely used in power reactors and can be robust, but they may require tighter control of temperature and gap behavior to avoid excessive stresses.
A useful rule of thumb for engineers is: if the fuel conducts heat better, the cladding may see a more uniform temperature, but the fuel-cladding chemical interaction can become the limiting factor.
Cladding Roles and Failure Modes
Cladding is the barrier between fuel and coolant, and it also provides mechanical support. In compact reactors, cladding must handle:
- Thermal stress from temperature gradients.
- Swelling from neutron damage and fission product effects.
- Creep under sustained temperature.
- Chemical interaction with fuel and coolant.
- Fission gas release that can increase internal pressure.
Common failure pathways include loss of barrier integrity due to cracking, excessive deformation, or corrosion/chemical attack. Even if the cladding does not fail catastrophically, gradual degradation can raise uncertainty in heat transfer and reactivity feedback.
Material Compatibility and Selection Logic
Cladding material choice is a compatibility problem, not a “best material” problem. Compatibility depends on fuel chemistry, coolant chemistry, temperature range, and neutron spectrum.
For example, if the fuel is a carbide, the cladding must resist chemical reactions that could form brittle layers. If the coolant is chemically aggressive, corrosion rates can dominate. If the design uses higher temperatures, creep becomes more important than at lower-temperature systems.
Engineers typically evaluate compatibility using a combination of:
- Thermodynamic reasoning to identify likely reaction products.
- Empirical corrosion and diffusion data for relevant temperature and chemistry.
- Mechanical models for stress, swelling, and creep.
- Irradiation test results to confirm that the barrier remains effective.
Geometry Choices That Affect Cladding Stress
Fuel geometry influences cladding stress through power density and heat flow paths. Two practical examples:
Example: Pellet-in-tube behavior
A solid fuel pellet inside a cladding tube can develop a fuel-cladding gap that changes over time. If the gap closes early, the cladding may experience higher contact heat transfer and higher thermal stress. If the gap remains too large, peak fuel temperatures can rise. Designers manage this by selecting fuel form, enrichment, and initial gap conditions.
Example: Tristructural or coated particle concepts
If fuel is in coated particles, the cladding sees heat through a more distributed structure. This can reduce local hot spots, but it shifts the attention to coating integrity and fission product retention within the particle layers.
Mind Map: Fuel and Cladding Considerations
Integrated Example: Choosing a Fuel-Cladding Pair
Suppose a compact reactor design targets a long operating interval with tight limits on peak cladding temperature. If you choose a fuel form with good thermal conductivity, you can reduce fuel-to-cladding temperature gradients, which helps thermal stress. However, you must then verify that the cladding material does not form problematic reaction layers with that fuel at the expected temperature and irradiation conditions. If the coolant chemistry increases corrosion risk, you may need a cladding alloy with better corrosion resistance even if it is slightly worse for mechanical swelling. The “best” pair is the one that keeps both heat transfer and barrier integrity within limits for the full service period.
Practical Checklist for Engineers
- Confirm the fuel form’s heat conduction and expected temperature profile.
- Identify likely fuel-cladding chemical interactions at operating temperatures.
- Evaluate cladding mechanical response to swelling, creep, and thermal cycling.
- Assess fission gas behavior and its effect on cladding stress.
- Check that geometry choices keep hot spots within cladding limits.
- Ensure the safety case assumptions match the fuel-cladding performance evidence.
2.5 Shutdown Mechanisms and Reactivity Safety Functions
A microreactor’s shutdown system is not just a “stop button.” It is a set of engineered functions that drive the reactor from operating conditions to a subcritical state, and then keep it there while heat is removed. The key idea is simple: reactivity must be controlled so that, even if normal control fails, the reactor still trends toward shutdown.
Core Concepts for Shutdown
Shutdown begins with the reactivity balance. If the effective multiplication factor \(k_{eff}\) is below 1, the neutron population decreases and power falls. A shutdown mechanism therefore aims to provide a rapid, reliable negative reactivity insertion, plus margin against uncertainties such as temperature effects, manufacturing tolerances, and measurement error.
Two terms matter in practice:
- Shutdown margin: how much negative reactivity is available relative to the most challenging operating condition.
- Safety function: a defined action (or sequence) that achieves a safety goal, such as reaching and maintaining subcriticality.
A useful mental model is to separate “how fast” from “how sure.” Fast insertion reduces peak power during upset; sure insertion ensures the system still works when conditions are less friendly.
Shutdown Mechanism Categories
Most microreactor designs use more than one mechanism so that a single failure does not defeat the safety function.
-
Control Rod or Absorber Insertion
- Mechanism: neutron-absorbing material moves into the core.
- Typical behavior: gravity-assisted drop, spring-assisted actuation, or motor-driven insertion with fail-safe power loss.
- Best practice: design the motion path to avoid jams from misalignment and to tolerate debris or thermal distortion.
- Example: if a motor loses power, a spring releases the absorber to fall into position, rather than waiting for a human to intervene.
-
Boron or Neutron Absorber Injection
- Mechanism: soluble absorber is introduced into a coolant or moderator region.
- Typical behavior: chemical or mechanical injection provides negative reactivity.
- Best practice: verify mixing time and stratification effects so the absorber reaches the intended region quickly.
- Example: a small tank pressurizes a metering line; the design ensures the first portion of injected absorber reaches the core before the tank pressure decays.
-
Passive Reactivity Feedback and Self-Limiting Behavior
- Mechanism: temperature and other feedbacks reduce reactivity as power rises.
- Typical behavior: as the core heats, material properties shift so \(k_{eff}\) decreases.
- Best practice: quantify the feedback coefficients over the full operating range, not just at nominal conditions.
- Example: if coolant temperature increases, moderator effectiveness drops, reducing reactivity without requiring actuation.
-
Engineered Trip Signals and Actuation Logic
- Mechanism: sensors trigger the shutdown system when thresholds are exceeded.
- Best practice: use diverse sensing where possible and apply voting logic to reduce nuisance trips while still meeting safety goals.
- Example: a trip requires either two out of three independent temperature channels to exceed a limit, or a separate neutron flux channel to indicate abnormal power growth.
Reactivity Safety Functions and Their Structure
A reactivity safety function is usually described as a sequence:
- Detect an upset using defined instrumentation.
- Initiate the shutdown action through a logic solver.
- Actuate the mechanism to insert negative reactivity.
- Verify the reactor reaches and maintains subcriticality using available evidence.
- Maintain safe conditions while decay heat is removed.
The “verify” step deserves attention. In practice, you rarely measure \(k_{eff}\) directly during operation. Instead, you infer shutdown state using proxies such as neutron flux level, absorber position, and temperature trends.
Best practice is to define acceptance criteria that are robust to sensor drift and calibration uncertainty. For instance, a low neutron flux threshold can be paired with absorber position confirmation so that a stuck absorber is not mistaken for a successful shutdown.
Mind Map: Shutdown Mechanisms and Safety Functions
Example Shutdown Scenario with Integrated Reasoning
Consider a loss of normal heat removal that causes core temperature to rise. The safety function should not rely on operators to “catch up.”
- Detection: temperature sensors exceed a trip setpoint, and the logic solver confirms the pattern is consistent with loss of cooling rather than a single faulty sensor.
- Initiation: the trip logic commands absorber insertion.
- Actuation: the absorber moves into the core using a fail-safe method that does not require external power.
- Verification: neutron flux drops to a predefined low band, and absorber position sensors confirm the mechanism is fully inserted.
- Maintenance: the reactor remains subcritical while decay heat is carried to the heat sink through the designed thermal path.
This scenario shows why shutdown systems are designed as a chain. If actuation works but verification is missing, a stuck mechanism could be misread. If verification exists but actuation depends on power, a power loss could defeat the safety function. The integrated design prevents those mismatches.
Practical Design Checks for Shutdown Reliability
To keep shutdown behavior predictable, designers typically check:
- Single-failure tolerance: one credible failure does not prevent subcriticality.
- Timing budget: sensor response, logic delay, and mechanical insertion time are consistent with safety margins.
- Environmental robustness: actuation works across expected temperatures, vibrations, and transport conditions.
- Testability: shutdown functions can be tested in a way that builds confidence without compromising safety.
A shutdown system that is easy to test and hard to defeat is usually the one that behaves the same way in real life as it does on paper. That’s the goal: not just stopping the reactor, but doing it in a way that can be trusted.
3. Microreactor Power Conversion and Balance of Plant
3.1 Electrical Output Architectures for Standalone Operation
Standalone microreactors must turn steady thermal power into usable electricity while keeping protection, control, and power quality predictable. The architecture is easiest to reason about if you treat it as four layers: generation, conversion, distribution, and protection.
Foundational Requirements for Standalone Electrical Output
Begin with what “standalone” means electrically. There is no grid to absorb imbalances, so frequency and voltage must be held by the plant itself. That implies:
- A stable reference for frequency and voltage, usually produced by a generator and its excitation or by an inverter that locks to a local control reference.
- A load management strategy so sudden load steps do not cause unacceptable frequency droop or voltage dips.
- A protection philosophy that isolates faults quickly without collapsing the entire site.
A simple example: a remote base has a 500 kW load that includes pumps and compressors. When one compressor starts, it may draw 3–6× rated current for a short time. The architecture must prevent that inrush from tripping protection or causing undervoltage that makes other equipment fault.
Generation Options and Their Electrical Behavior
Standalone systems typically use one of two generation paths.
Synchronous generator path: A turbine drives a synchronous alternator. The alternator naturally sets frequency through rotor speed, and voltage through excitation. This is a good fit when you want straightforward short-circuit behavior and robust motor starting.
Inverter-based path: A generator produces AC that is rectified to DC and then inverted to grid-like AC. This can decouple control of voltage and frequency from mechanical speed, which helps when the prime mover speed varies slightly.
A practical rule of thumb: if the site has many induction motors and you want predictable starting performance, synchronous generation is often simpler. If you need tight control of power quality for sensitive loads, inverter-based conditioning can be advantageous.
Power Conversion and Conditioning
Regardless of generation type, you need to manage power conversion losses and ensure the output meets site needs.
- Rectifier and DC link (in inverter architectures): The DC link smooths power fluctuations. Its size matters because it determines how much the system can ride through short disturbances.
- Inverter stage: It shapes output voltage waveform and controls reactive power behavior. For standalone operation, it must also manage frequency and voltage references.
- Harmonic control: Loads like variable-speed drives create harmonics. Filters or control strategies keep harmonic distortion within equipment tolerances.
Example: if a facility uses multiple variable-speed drives, the inverter output must avoid stacking harmonics that overheat transformers or cause nuisance trips in protection relays.
Site Distribution and Load Segregation
Standalone sites benefit from dividing loads into categories with different tolerance for disturbances.
- Critical loads: controls, safety instrumentation, communications, and essential process equipment. These should be fed through the most stable path, often via an uninterruptible or fast-transfer arrangement.
- General loads: lighting, HVAC, non-critical pumps.
- High-inrush loads: compressors, large motors, and starting-heavy equipment.
A concrete approach: put high-inrush motors on a separate feeder with controlled start sequencing. Even if the electrical architecture is capable, sequencing prevents avoidable voltage dips.
Protection, Control, and Fault Ride-Through
Protection must clear faults without turning a local fault into a site-wide outage.
- Generator protection: overcurrent, earth fault, loss of excitation (for synchronous machines), and over/under frequency.
- Feeder protection: fuses or breakers sized for expected fault currents and coordination with upstream devices.
- Islanding and synchronization: even in standalone mode, you still need logic to prevent accidental connection to an external source.
Control must coordinate with protection. For example, if the system uses an inverter, it should support fault ride-through long enough for downstream breakers to operate correctly, rather than collapsing immediately.
Mind Map: Electrical Output Architecture for Standalone Operation
Example Architecture: Two-Feeder Standalone Site
Consider a site with 300 kW critical loads and 700 kW mixed loads including motor starts.
- Generation: turbine-driven synchronous generator.
- Distribution: two feeders from a main switchboard.
- Feeder A supplies critical loads through a fast transfer switch and a small conditioning unit if needed.
- Feeder B supplies general loads.
- Motor starting: compressor starts are sequenced with a short delay between large motors.
- Protection: generator overcurrent and earth fault protection coordinate with feeder breakers so a fault on Feeder B does not trip Feeder A.
The key reason this works is that the architecture treats electrical disturbances as events with timing: inrush happens quickly, faults must clear fast, and critical loads need continuity. Standalone operation is less about “having power” and more about controlling what happens when power is challenged.
3.2 Thermal Output Integration for Process Heat and Steam
A microreactor’s thermal output is only useful if it can be delivered to a process in the right form, at the right temperature, with the right reliability. The integration problem is mostly about matching heat sources to heat sinks while keeping the reactor’s safety functions intact. A good starting point is to treat “steam” and “process heat” as two different delivery products, even if they share the same heat exchanger hardware.
Thermal Product Definitions and Boundaries
Process heat typically means hot water, hot oil, or direct heating of a process stream. Steam means a phase change product with a defined pressure and dryness fraction. In both cases, the microreactor provides heat to an intermediate loop so that the reactor coolant and the process do not need to share the same chemistry, filtration, or contamination controls.
A practical best practice is to define three temperatures and one flow rate before you pick any equipment:
- Reactor-to-intermediate loop heat exchanger outlet temperature
- Intermediate loop supply temperature to the process heat exchanger
- Process-side return temperature
- Intermediate loop mass flow rate needed to meet peak demand
Example: If a remote cement plant needs 6 MW of thermal energy for kiln preheating and can tolerate supply temperatures between 140°C and 160°C, you size the intermediate loop to deliver that range without forcing the reactor to chase every load fluctuation.
Intermediate Loop Architecture
Most designs use a primary-to-intermediate heat exchanger, then an intermediate-to-process heat exchanger. This separation helps with maintenance and reduces the chance that process fouling degrades reactor-side performance.
Key integration choices include:
- Intermediate fluid selection and allowable pressure drop
- Heat exchanger type and cleaning strategy
- Control valve placement to avoid unstable loop behavior
A simple control rule prevents many headaches: keep the intermediate loop temperature controlled by varying heat transfer on the process side, not by rapidly changing reactor power. That keeps safety margins steadier and reduces thermal cycling.
Steam Generation Pathways
Steam integration usually follows one of two patterns.
Pattern A: Indirect steam generation uses an intermediate loop to boil water in a steam generator. The process receives steam at a controlled pressure, and condensate returns to the feedwater system.
Pattern B: Direct steam generation transfers heat more directly to the water/steam system. This can reduce equipment count, but it increases the coupling between reactor-side thermal behavior and steam system chemistry and maintenance.
Best practice for Pattern A is to include a condensate polishing and degassing strategy in the steam circuit design. Even small dissolved gas loads can increase corrosion risk and reduce heat transfer coefficients.
Example: A biomass drying facility might use low-pressure steam. If condensate return is unreliable, you size makeup water handling and include a buffer tank so the steam generator does not see sudden feedwater temperature swings.
Heat Exchanger Sizing Logic
Sizing is not just about total watts; it’s about temperature driving force across the exchanger. For steam generators, the driving force is often the difference between intermediate loop temperature and saturation temperature at the steam pressure. For hot water systems, it’s the log-mean temperature difference between supply and return.
A systematic approach:
- Establish peak thermal demand and minimum stable load.
- Define allowable supply temperature range to the process.
- Select intermediate loop setpoints that keep heat exchangers within their effective heat transfer regime.
- Add margin for fouling and partial load operation.
Example: If a refinery unit requires 120°C hot water but the process return can vary from 90°C to 105°C, you compute exchanger performance at both extremes. The worst-case temperature difference often determines the exchanger size.
Controls and Stability Across Loops
Thermal integration fails most often due to control interactions: valves, pumps, and setpoints fighting each other. A robust strategy is to assign each loop a clear job.
- Reactor power control maintains reactor-side thermal conditions.
- Intermediate loop control maintains a stable supply temperature or stable heat transfer capacity.
- Process-side control manages steam pressure or hot water flow.
To avoid oscillations, use rate limits on valve movements and ensure pump control does not create unnecessary flow hunting. If you have multiple process users, consider a thermal buffer tank so short spikes do not immediately change exchanger duty.
Mind Map: Thermal Integration
Example Workflow for a Remote Steam User
Suppose a remote facility needs 3 MW of thermal energy as 3 bar(g) steam. You start by selecting an intermediate loop temperature that provides sufficient driving force above the steam saturation temperature. Next, you size the steam generator for peak demand and verify performance at the facility’s minimum operating load.
Then you design the condensate return path: include a buffer tank and a strategy for makeup water so the steam generator feed temperature does not jump when operators switch between production modes. Finally, you verify control stability by testing step changes in steam demand and confirming that intermediate loop temperature remains within the defined band.
The result is a thermal integration that behaves predictably: the reactor supplies heat within its operating envelope, the intermediate loop smooths variability, and the process receives steam or hot water with stable conditions.
3.3 Heat Exchanger Selection and Maintenance Planning
Heat exchangers turn reactor heat into something useful—steam, hot water, or electricity—while keeping the reactor’s primary boundary where it belongs. Good selection starts with matching heat duty and temperature approach, then ends with maintenance realities: access, fouling, inspection, and how you’ll prove performance later.
Start with Heat Duty and Temperature Approach
Begin by calculating the required heat duty from the process:
- For steam: use required steam mass flow and enthalpy rise from feedwater to steam.
- For hot water: use mass flow and temperature rise, then include heat losses to the insulated piping.
Next, set the minimum temperature approach. If the approach is too small, the exchanger becomes sensitive to small temperature measurement errors and fouling. A practical rule is to specify a design approach that still leaves margin after you account for expected fouling and control valve behavior. Example: if the process needs 90°C water and your hot side can only reliably deliver 95°C under load, you must plan for a very small approach and therefore a higher risk of underperformance unless you oversize or improve cleaning access.
Choose the Heat Exchanger Type by Service Conditions
Select based on whether you need single-phase or two-phase transfer, how corrosive the secondary side is, and how often you can clean.
- Shell-and-tube: common for robust duties and easier mechanical inspection. Best when you can tolerate some pressure drop and want straightforward maintenance access.
- Plate heat exchangers: compact and efficient, often with lower hold-up volume. Best when you can manage gasket life and keep the secondary side reasonably clean.
- Air-cooled exchangers: useful when water is scarce. They trade water handling for higher footprint and fan power; maintenance includes fin cleaning and fan checks.
Example: a remote site with limited water may choose an air-cooled condenser for the secondary loop, but the design must include seasonal temperature effects and a cleaning plan for dust and salt.
Match Materials and Surfaces to Corrosion and Fouling
Material choice is not just chemistry; it’s also about temperature and oxygen exposure.
- For wet secondary loops, consider corrosion mechanisms like oxygen-driven corrosion and scaling from dissolved minerals.
- For plate exchangers, gasket compatibility matters as much as metal compatibility.
Fouling is the silent performance killer. Plan for it explicitly by estimating fouling resistance for each side and by defining a target cleaning interval. Example: if the secondary loop uses river water, you may expect scaling and biological growth. In that case, you either add filtration and biocide controls (and still plan cleaning) or you oversize the exchanger so the process stays within limits between cleanings.
Define Operating Envelope and Control Strategy
Heat exchangers must survive not only steady operation but also transitions: startup, load changes, and shutdown.
- Specify allowable ranges for inlet temperatures, flow rates, and differential pressures.
- Ensure the exchanger can handle partial loads without creating stagnant zones that accelerate fouling.
- Align control valves and pumps so the exchanger sees stable flow during regulation.
Example: if you modulate reactor power while keeping secondary flow constant, the exchanger may experience lower driving temperature and higher relative fouling impact. A better approach is to coordinate flow control with heat duty so the exchanger maintains a consistent approach.
Plan Maintenance Around What You Can Actually Inspect
Maintenance planning should answer four questions: What degrades? How will you detect it? How will you clean it? How will you verify it’s back to spec?
Detection methods
- Track heat transfer performance using temperature and flow measurements.
- Monitor pressure drop across the exchanger; rising ΔP often signals fouling.
Cleaning methods
- Mechanical cleaning for accessible tube bundles.
- Chemical cleaning where compatible with materials and where you can contain and dispose of cleaning fluids.
- For plate exchangers, plan gasket-safe cleaning and strict inspection of plate surfaces.
Verification
- Re-run a performance check using the same measurement points and procedures as the baseline.
- Compare calculated heat duty and approach against acceptance criteria.
Example: after a scheduled cleaning, you should not just confirm that temperatures “look right.” Use the baseline method to compute heat duty and confirm that the exchanger meets the required outlet temperatures at the specified flow and inlet conditions.
Mind Map: Heat Exchanger Selection and Maintenance Planning
Example Workflow for a Remote Steam Loop
- Compute steam duty and set design inlet/outlet temperatures for the secondary side.
- Choose exchanger type based on water availability and expected secondary cleanliness.
- Select materials for the secondary chemistry and operating temperatures.
- Estimate fouling resistance and set a cleaning interval that keeps the process within temperature limits.
- Define control coordination so secondary flow maintains a stable approach during load changes.
- Establish baseline performance tests and acceptance criteria.
- After each cleaning, repeat the baseline method and confirm both heat duty and pressure drop are back within limits.
This workflow keeps the exchanger from becoming a “set it and forget it” component. It’s more like a predictable tool: you measure, you clean when needed, and you verify that it still does the job you designed it to do.
3.4 Power Conditioning Protection and Grid Interface Requirements
A microreactor’s power output is only useful if it can be delivered safely to the loads that need it. “Power conditioning” covers the electronics and protection that shape voltage and frequency, while “grid interface requirements” cover how the unit connects to a microgrid or utility system without creating unsafe conditions for people, equipment, or other generators.
Foundational Concepts for Interface Design
Start with three quantities: voltage quality, frequency stability, and fault behavior. Voltage quality includes steady-state accuracy (how close the delivered RMS voltage is to the setpoint) and transient behavior (how much it dips or overshoots when load changes). Frequency stability matters because many industrial drives, compressors, and process controls assume a narrow frequency band. Fault behavior is the part that keeps the system from turning into a short-circuit fireworks show: the interface must detect abnormal conditions and isolate quickly.
A practical way to think about the interface is as a chain of responsibilities:
- Convert and regulate power (inverters, transformers, rectifiers).
- Measure and decide (sensors, protection relays, control logic).
- Act and isolate (breakers, contactors, fuses, bypass paths).
- Prove it worked (event logs, relay targets, commissioning tests).
Protection Philosophy and Coordination
Protection is not just “having relays.” It is coordination: each device must act at the right time for the right fault, without unnecessary trips.
Key protection functions typically include:
- Overcurrent for phase and ground faults, with time-current curves coordinated across upstream and downstream devices.
- Overvoltage and undervoltage to prevent equipment damage and to avoid operating outside allowable power quality.
- Frequency protection to disconnect when the system cannot maintain stable frequency.
- Anti-islanding for grid-tied operation, ensuring the microreactor does not continue energizing a de-energized utility line.
- Ground fault detection appropriate to the grounding scheme (solid, resistance, or ungrounded).
Easy example: Suppose a feeder cable develops a phase-to-phase fault. The downstream breaker should clear first if the fault is within its protected zone. If it fails, the upstream breaker clears next. This staged behavior reduces downtime and prevents the entire site from losing power for a fault that could have been isolated locally.
Grid Interface Modes and Their Requirements
Interface requirements differ depending on whether the microreactor operates:
- Standalone (islanded microgrid): the interface must establish voltage and frequency references.
- Parallel with a microgrid: the interface must synchronize and share load without oscillations.
- Parallel with a utility grid: the interface must meet utility interconnection rules, including anti-islanding and fault ride-through expectations.
Synchronization basics for parallel operation include matching phase angle, frequency, and voltage magnitude within defined tolerances before closing the breaker. A common commissioning check is to verify that the synchronizer refuses to close when phase angle error exceeds the allowed window.
Easy example: If the microreactor’s controller closes the breaker while the phase angle is too far off, the resulting inrush current can stress transformers and switchgear. The synchronizer’s tolerance limits are therefore protection in disguise.
Power Conditioning Hardware and Protection Integration
Power conditioning hardware often includes a transformer, switchgear, and power electronics. Protection must be integrated with these components rather than bolted on afterward.
- Transformers: protect against inrush and internal faults. Differential protection is used when appropriate, while overcurrent and temperature monitoring handle external faults and thermal limits.
- Inverters and converters: protect semiconductor devices using overcurrent sensing, DC-link voltage limits, and thermal monitoring. Fast current limiting prevents device damage during short circuits.
- Filters and harmonic mitigation: include protection for filter components and monitoring to ensure the system does not exceed harmonic limits that could interfere with protection or sensitive loads.
Easy example: A capacitor bank used for power factor correction can amplify certain harmonics. If the interface includes harmonic filters, protection should monitor filter currents and voltages so a degraded filter does not silently worsen power quality.
Measurement, Control, and Trip Logic
Protection relays rely on measurements: current transformers, voltage transformers, and sometimes direct sensors for fast response. Measurement accuracy matters because thresholds are set in terms of physical units.
Trip logic should be deterministic and testable:
- Define which faults trigger immediate trips versus delayed trips.
- Ensure interlocks prevent conflicting actions (for example, blocking reclosing after a severe fault).
- Use event logging to record the measured values and relay states at the moment of trip.
Easy example: If undervoltage protection trips the interface, the system should not attempt to reconnect until voltage returns within limits for a defined time. Otherwise, it can “chatter” between connected and disconnected states, stressing switchgear.
Mind Map: Power Conditioning and Grid Interface Requirements
Example: Fault-to-Isolation Walkthrough
Consider a site microgrid with a microreactor interface feeding a motor-heavy process. A phase-to-ground fault occurs on a distribution feeder.
- Current sensors detect abnormal current and ground fault indicators.
- The protection relay compares the measured values against configured thresholds.
- The feeder breaker trips first, isolating the faulted section.
- If the fault persists, the upstream breaker trips as backup.
- The microreactor interface remains online if the fault is cleared within its ride-through capability; otherwise it trips to protect its power electronics.
- Event logs show the sequence of measurements and relay operations for troubleshooting.
This sequence demonstrates the core requirement: the interface must protect itself while minimizing unnecessary loss of power to the rest of the site.
3.5 Instrumentation and Control Integration with Balance of Plant
A microreactor’s balance of plant (BoP) is where nuclear heat becomes useful work. Instrumentation and control (I&C) integration is therefore not just “wiring sensors to a controller.” It is the disciplined mapping of measurements to control actions, with clear boundaries between safety functions and operational control.
Foundational Integration Goals
Start with three practical goals.
- Correct variables, correct locations. If you measure reactor outlet temperature but control a steam header, you will eventually control the wrong thing. Place sensors where the controlled variable actually forms.
- Deterministic safety behavior. Safety functions must not depend on the same signals or logic as routine control. Think of safety as the “do not negotiate” layer.
- Stable plant-wide dynamics. BoP control loops interact. A valve controller that moves too aggressively can create oscillations that make both operators and equipment unhappy.
A good integration practice is to write a one-page “signal intent” sheet for each measurement: what it represents, where it is measured, what it influences, and whether it is safety-related.
Control Architecture from Sensors to Actuators
Most systems can be described as four layers.
Measurement Layer
Key measurements typically include:
- Reactor primary-side temperatures and pressures
- Secondary-side steam pressure, feedwater flow, and drum level (if applicable)
- Electrical output parameters such as generator load, bus voltage, and frequency
- Heat sink indicators such as cooling water temperature and flow
Example: If the BoP uses a steam generator, measure primary outlet temperature and secondary steam pressure. Then control steam pressure by adjusting feedwater flow, while using primary temperature as a constraint for safe operation.
Control Layer
Operational control usually includes:
- Power-to-heat regulation using reactivity control or thermal power setpoints
- Steam pressure control using feedwater valves or bypass paths
- Load following that coordinates electrical demand with thermal output
A simple best practice is to separate setpoint generation from setpoint execution. For instance, an operator or load controller sets a thermal power target, while a dedicated control module executes it through the reactor control system.
Actuation Layer
Actuators include:
- Feedwater control valves and steam bypass valves
- Pump speed drives
- Generator excitation and governor interfaces
Example: When steam pressure rises above target, the feedwater controller should open the feedwater valve only if primary-side constraints allow. Otherwise, it should route the plant to a safe operating mode rather than “fighting” the constraint.
Protection and Safety Layer
Safety functions typically include:
- Reactor trip logic based on safety-grade signals
- Heat removal assurance actions such as isolating or starting cooling paths
- Containment or confinement monitoring triggers
Best practice: implement safety-grade channels with independent sensing paths and independent logic where required. Operational controllers may use the same type of measurement, but not the same safety channel.
Signal Quality and Timing
Integration fails quietly when signal quality is ignored.
- Filtering: Use filtering that matches the physical time constants. Over-filtering makes control sluggish; under-filtering makes it noisy.
- Sampling and latency: BoP loops often run faster than operator interfaces. Document loop rates and ensure control actions arrive within expected timing.
- Fail states: Define what happens when a sensor disagrees with redundant channels or goes out of range.
Example: For a temperature sensor pair, you can require agreement within a tolerance for operational control, while safety logic uses separate trip thresholds. If they disagree, operational control can degrade gracefully (e.g., hold last good setpoint) while safety remains conservative.
Human-Machine Integration
Operators need clarity, not a wall of numbers.
- Display controlled variables (steam pressure, feedwater flow, electrical load) and constraints (primary temperature limits, heat sink availability).
- Provide alarms that explain the immediate cause and the plant response.
Example: If the cooling water flow drops, alarm “Heat Sink Flow Low” should also indicate whether the system is reducing thermal output, switching to an alternate pump, or initiating a protective action.
Mind Map: Instrumentation and Control Integration
Example: Coordinated Steam Pressure and Load Following
Assume the plant must follow an electrical load while maintaining steam pressure.
- The load controller sets an electrical demand.
- A coordination module converts demand into a thermal power setpoint, respecting primary-side temperature limits.
- The steam pressure controller adjusts feedwater flow to keep steam pressure at target.
- If cooling water flow becomes insufficient, the constraint module reduces thermal power setpoint and, if needed, triggers a protective mode.
The key integration detail is that steam pressure control does not blindly chase its setpoint when heat removal constraints are violated. It either yields to constraints or hands off to a protection sequence.
Integration Checklist for Commissioning
Use a commissioning-focused checklist to keep the system honest.
- Verify sensor placement against controlled variable definitions.
- Confirm safety-grade channels use independent logic and thresholds.
- Test control loop interactions for oscillation and overshoot.
- Validate alarm messages against actual plant response.
- Exercise degraded modes using sensor faults and actuator limits.
When these items are complete, the BoP does not merely “run with the reactor.” It behaves as a coordinated system where measurements lead to appropriate actions, and safety remains the final authority.
4. Fuel Cycle and Operational Models for Microreactors
4.1 Fuel Forms and Fabrication Pathways for Microreactor Cores
Fuel for microreactors is less about “what’s inside” and more about how that material behaves when it is hot, irradiated, and handled by people who are not running a chemistry lab 24/7. The goal is a fuel form that can survive the expected power history, transfer heat efficiently, and be fabricated and qualified with repeatable quality.
Fuel Form Foundations
A fuel form is the physical arrangement of fissile material with its surrounding structures. In compact cores, the most common fuel forms are:
- Solid fuel pellets inside cladding, where the fuel and cladding are separate materials.
- Coated particles embedded in a matrix, where fuel is microscale and the matrix provides mechanical support.
- Cermets or composites that blend fuel and structural phases to improve heat conduction.
- Plates or pins that package fuel into geometry optimized for heat removal and neutronics.
A useful way to reason about fuel form choice is to track three constraints: heat path, mechanical integrity, and reactivity control margins. For example, if heat must move quickly from fuel to coolant, a fuel form with better thermal conductivity reduces peak temperatures, which in turn reduces swelling and fission-product release risk.
Key Material Behaviors Under Irradiation
Fabrication pathways must anticipate how fuel changes over time. The main behaviors to account for are:
- Swelling from fission products and damage, which can stress cladding or distort coated-particle layers.
- Gas release from within the fuel, which can raise internal pressure and affect dimensional stability.
- Thermal conductivity degradation, which increases temperature for the same power.
- Microcracking and phase changes, which can alter heat transfer and mechanical strength.
A practical example: if a fuel form is known to develop microcracks at higher temperatures, fabrication should aim for a microstructure that delays crack growth, such as controlling particle size distribution or sintering parameters.
Cladding and Interface Engineering
Fuel rarely exists alone. Cladding or surrounding structures manage corrosion, provide containment, and shape heat transfer. The interface between fuel and cladding matters because it controls gap conductance—the thermal “shortcut” through any small void between materials.
Two common interface strategies are:
- Controlled gap and contact evolution, where the initial gap is designed to close predictably as materials expand.
- Interlayers or bonding layers, which can improve thermal contact but must be stable under irradiation.
Example: if the design expects gap closure, fabrication must control pellet diameter, surface roughness, and concentricity so closure occurs within the intended temperature range rather than prematurely or not at all.
Fabrication Pathways from Powder to Core
Most solid-fuel pathways start with powder processing and end with dimensional verification of finished fuel elements.
Powder Preparation and Forming
- Powder selection and characterization: particle size, morphology, impurity levels, and oxygen content.
- Mixing and homogenization: ensuring uniform distribution of fissile material and any additives.
- Forming: pressing pellets, coating particles, or producing composite feedstock.
Example: if powder has wide particle size variation, sintering can produce uneven densification. That leads to local hot spots during operation because thermal conductivity and heat capacity differ across the pellet.
Sintering and Densification
Sintering drives densification and microstructure formation. Key controls include temperature profile, atmosphere, and time.
- Too little sintering leaves porosity, increasing thermal resistance.
- Too much sintering can cause grain growth that may reduce mechanical robustness.
A systematic check is to measure density and microstructure after sintering and compare them to qualification targets. If density is low, the fabrication record should explain whether the issue came from powder behavior, press parameters, or furnace atmosphere.
Coating and Matrix Processing for Particle Fuel
For coated-particle fuel, fabrication often includes:
- Kernel preparation
- Coating deposition with multiple layers
- Tristructural composite or matrix embedding
Example: coating thickness variation can create uneven stress under irradiation. Even if average thickness meets spec, localized thin spots can become the weak link.
Assembly into Fuel Elements
After fuel bodies are produced, they are assembled into pins, plates, or other geometries. Steps typically include:
- Cladding preparation and surface conditioning
- Fuel loading with controlled alignment
- Sealing and verification of weld or closure quality
- Dimensional metrology for concentricity, length, and straightness
Example: a small misalignment can increase local coolant flow resistance, raising local temperatures. That’s why metrology is not “paperwork”; it’s thermal safety.
Quality Assurance That Matches the Physics
Fabrication quality must map to what the reactor cares about. A good practice is to link each manufacturing step to a measurable property:
- Pressing parameters → pellet density and green strength
- Sintering profile → microstructure and thermal conductivity
- Coating deposition → layer thickness and defect rate
- Assembly tolerances → gap conductance and coolant flow
Integrated Example Workflow
Consider a pellet-in-cladding pathway for a compact core. The workflow might look like this:
- Characterize powder oxygen and particle size.
- Press pellets with controlled pressure and binder content.
- Sinter using a temperature program that targets a specific density range.
- Machine or finish pellet dimensions to tight tolerances.
- Condition cladding surfaces and load pellets with controlled alignment.
- Seal cladding and verify weld integrity.
- Measure final dimensions and inspect for defects.
At each step, the fabrication record should explain how the measured property supports the thermal and mechanical expectations. If a pellet density is below target, the record should trigger a corrective action plan because the physics consequence is higher thermal resistance and higher operating temperatures.
Summary of What to Remember
Fuel form selection and fabrication are inseparable. Choose a fuel form that supports the required heat path and mechanical stability, then build a fabrication pathway that produces consistent microstructure and geometry. Quality assurance should connect manufacturing measurements to the behaviors that matter under irradiation, so the core’s performance is not a hope—it’s a documented outcome.
4.2 Refueling Strategies and Core Life Management
Refueling is where microreactor design meets real-world logistics. The goal is simple: keep the core within its allowable reactivity and thermal limits while minimizing operational disruption. In practice, that means choosing a refueling approach that matches the fuel form, the reactor’s reactivity control method, and the maintenance model at the deployment site.
Core Life Starts with What You Can Measure
Core life management begins by defining what “end of life” means. For microreactors, it typically includes limits on reactivity margin, peak fuel temperature, cladding integrity, and allowable radiation levels for handling. A practical best practice is to treat these as separate “gates” rather than one combined number. For example, a core might still meet thermal limits while reactivity margin becomes too small for safe operation. When you track gates independently, you avoid the classic failure mode: extending operation past the point where one safety-relevant margin is already gone.
A simple example: suppose the reactor uses a fixed reactivity control strategy and relies on burnup to reduce power capability. You can schedule refueling when the reactivity gate is reached, even if the thermal gate has not yet been reached. That keeps the plant within its defined operating envelope without guessing.
Refueling Strategy Types and How They Fit Microreactors
Microreactors generally fall into two operational patterns: replaceable fuel modules and sealed long-life cores.
Replaceable fuel modules are refueled by swapping a defined fuel-bearing unit. This approach supports planned maintenance windows and can reduce downtime because the rest of the plant can remain operational while the module is handled.
Sealed long-life cores are designed to be operated for a defined period without on-site refueling. The “refueling” event happens at a higher level of logistics, usually involving return or replacement of the entire core module. This reduces on-site radiological handling steps, but it increases the importance of accurate life prediction and robust transport planning.
A useful rule of thumb for planning: if the design expects on-site handling, your refueling strategy must include clear dose-rate expectations, shielding assumptions, and tool compatibility. If it expects sealed operation, your strategy must focus on verifying that the core will remain within limits for the entire operating interval.
Reactivity Management over Time
Reactivity changes during operation due to fuel burnup and material effects. Core life management therefore needs a reactivity accounting method that ties together initial conditions, operating history, and conservative uncertainty.
A systematic workflow looks like this:
- Establish initial core state and allowable operating range.
- Define how power history affects burnup and reactivity.
- Apply uncertainty margins for measurement error and model limitations.
- Convert the reactivity margin into a refueling trigger.
Concrete example: if the reactor load varies, burnup is not uniform. You can manage this by using an “energy accounting” approach where the refueling trigger is based on integrated power (or thermal energy) rather than calendar time alone. That way, a period of reduced load extends life appropriately, while a period of higher-than-nominal load shortens it.
Thermal and Mechanical Limits During Refueling Windows
Refueling is not just about the core; it’s about what happens around it. Before any module swap, the system must be in a state that supports safe handling. That includes decay heat considerations, cooldown time, and ensuring that structural components remain within allowable stresses.
A practical best practice is to define a “handoff state” checklist: reactor shut down, verified subcritical condition, measured temperature within handling limits, and confirmation that containment and shielding configurations are correct. Even if the design is inherently safe, the checklist prevents procedural drift.
Mind Map: Refueling Strategy and Core Life Management
Example: Scheduling a Module Swap Using Energy Accounting
Assume a microreactor has an allowable operating energy budget before the reactivity margin gate is reached. During the first month, it runs at 70% of nominal power for 30 days. During the second month, it runs at 90% for 20 days, then at 60% for 10 days.
Instead of using calendar time, you compute integrated energy relative to nominal. If the cumulative energy reaches the refueling trigger threshold at the end of the second month, you schedule the module swap for the next maintenance window. This approach prevents two common planning errors: waiting too long because the calendar looks fine, or swapping early because the average power seems low without accounting for the actual run profile.
Verification After Refueling
After a refueling event, core life management continues immediately. You verify that the plant is configured correctly, that instrumentation readings are consistent with expected ranges, and that the operational history restarts cleanly in the life accounting model.
A good practice is to treat post-refueling verification as a data integrity step, not just a safety step. If the life model uses the wrong module identifier or the wrong initial state, the refueling trigger can drift even when the physical reactor is fine. Clean configuration control keeps the math aligned with reality.
4.3 On Site Handling of Activated Components and Waste Streams
On site handling starts with a simple rule: treat anything that has been near the core as potentially radioactive until measurements say otherwise. That rule drives the layout, the paperwork, and the daily habits.
Foundational Concepts for Activated Items
Activation happens when materials absorb neutrons and become radioactive. In microreactors, the activated inventory is often smaller than in large plants, but it is still enough to require controlled handling. The practical workflow is measurement-led: identify the item, estimate its activation category, measure it, then decide the handling path.
A useful mental model is three buckets:
- Activated components: hardware that was exposed to neutron flux, such as control rod mechanisms, reflectors, or piping segments.
- Contaminated items: surfaces that may carry radioactive material, often from leaks or maintenance activities.
- Clean items: items that have not been exposed or have been verified as below clearance limits.
Example: After a planned maintenance window, a technician brings a valve body to the staging area. The team first checks exposure records, then performs a surface dose-rate survey. If the reading is consistent with “activated component” expectations and no contamination smear is detected, the valve follows the activated-component route rather than the contamination route.
Site Layout and Work Zoning
A good layout reduces mistakes. Use zones that match the handling decisions:
- Controlled work zone for activated handling and any work that could generate contamination.
- Staging and measurement zone where items are surveyed before moving onward.
- Storage zone with shielding and segregation.
- Support zone for tools, PPE donning, and paperwork.
Keep the flow one-directional where possible: staging → measurement → packaging → storage. If you allow back-and-forth movement, you also allow “mystery contamination” to appear.
Measurement Strategy and Decision Thresholds
Measurements should answer two questions: “How much radiation?” and “Is there radioactive material on surfaces?” Radiation is handled with dose-rate surveys; contamination is handled with smear or wipe tests.
A systematic approach:
- Pre-job checks: confirm survey meters are calibrated and batteries are healthy.
- Item identification: tag the component with reactor exposure history.
- Dose-rate survey: map dose rates at standardized distances.
- Contamination checks: perform wipe tests on accessible surfaces.
- Classification: activated component, contaminated item, mixed item, or clean.
- Documentation: record readings and classification in the job package.
Example: A small heat exchanger segment is removed. The dose-rate survey shows elevated gamma dose rates, but wipe tests are negative. The item is treated as activated hardware and packaged with shielding, without contamination controls beyond standard controlled-zone practices.
Packaging, Shielding, and Segregation
Packaging is not just a container; it is part of the radiation control system. Shielding reduces external dose rates, while containment prevents spread of contamination.
Key practices:
- Use shielding matched to the dominant radiation. If gamma dominates, shielding thickness and material selection matter more than surface sealing.
- Segregate by hazard. Activated items and potentially contaminated items should not share the same storage volume.
- Label clearly with item ID, measured dose rate, and handling constraints.
Example: Two components are removed during the same outage. Component A has high dose rates but no contamination; Component B has low dose rates but positive smears. They go into different packages and different storage areas, even if both are “radioactive” in a broad sense.
Waste Stream Categories and Handling Paths
Waste streams typically include:
- Solid activated waste: gloves, rags, tools, and component fragments with neutron activation.
- Contaminated solids: wipes, filters, and debris with surface contamination.
- Liquid waste: wash water, condensate, or decontamination fluids.
- Gaseous waste: only if applicable to the system design and ventilation strategy.
A practical handling path is “measure first, then choose the container.” For solids, you typically compact or bag with appropriate liners, then verify dose rate and contamination before storage. For liquids, you verify radionuclide presence via sampling and then store in compatible containers with secondary containment.
Example: After decontamination of a workbench, the team collects rinse water into a sealed container. They sample and measure activity indicators, then store it in a designated liquid waste area with spill control materials nearby.
Storage, Inventory Control, and Retrieval Discipline
Storage should support two goals: keep dose rates low and keep records accurate. Inventory control means every package has a traceable identity and a known location.
Minimum discipline points:
- Unique package IDs tied to measurement records.
- Location control using a simple map of storage positions.
- Retrieval planning so packages are not moved repeatedly.
Example: A package stored “near the door” because it was convenient becomes a recurring source of dose exposure during later retrieval. Better practice is to store by retrieval frequency and keep the access route predictable.
Mind Map of on Site Handling Flow
Mind Map: On Site Handling of Activated Components and Waste Streams
Integrated Example from Removal to Storage
Consider a planned maintenance task on a neutron-exposed component. The team removes the part into the controlled work zone, tags it with the exposure record, and brings it to the staging and measurement area. They perform a dose-rate survey at fixed distances and run wipe tests on accessible surfaces. The results classify it as an activated component with no contamination.
Next, they select a shielded package designed for the measured dose-rate range and place the component inside with internal supports to prevent movement. The package is labeled with the component ID and measured dose rate. Finally, the package is stored in the activated-component storage area using a location map, and the inventory record is updated so later retrieval does not require guesswork.
This sequence works because each step reduces uncertainty before the next step adds complexity. The goal is not to be perfect on the first try; it is to make the system robust against the kinds of errors that happen when people are busy and time is limited.
4.4 Transportation Packaging Interfaces for Fuel and Components
Transportation packaging is the physical and procedural “handshake” between the reactor system and the logistics chain. For microreactors, the interface must protect three things at once: the fuel form, the component integrity, and the people handling the package. The goal is not just to survive a trip; it’s to arrive in a state that lets the receiving team perform safe, repeatable actions.
Foundational Interface Requirements
Start with what the receiving site must be able to do on day one. The package must provide:
- Mechanical stability during vibration, drops, and lifting operations.
- Thermal control so temperatures stay within allowable limits for the fuel and any seals.
- Radiological containment and shielding so dose rates around the package remain within transport limits.
- Operational accessibility for verification steps like leak checks, identification, and connection of handling tools.
A practical way to make this concrete is to treat the package like a “toolbox with a lock.” The lock is the shielding and containment; the toolbox layout is the internal restraint and the external lifting points. If either is wrong, the receiving team can’t do the next step safely.
Package-to-Component Mechanical Interfaces
Microreactor fuel and activated components often have tight tolerances and fragile interfaces. Packaging must therefore define:
- Lifting and tie-down points that match approved rigging hardware.
- Internal supports that prevent relative motion between fuel, baskets, and structural members.
- Impact management so a drop doesn’t translate into unacceptable stresses at the fuel-to-cladding or cladding-to-basket interfaces.
Example: If a fuel insert is designed to sit in a basket with a small clearance, the packaging must include spacers or compliant elements that maintain that clearance after thermal cycling. Otherwise, the insert can shift, and the receiving team may find it “looks seated” but is not seated within the required tolerances.
Thermal and Seal Interfaces
Many microreactor packages rely on seals, gaskets, or welded containment boundaries. The transportation interface must specify:
- Allowable temperature ranges for seals and any absorbent materials.
- Ventilation or pressure management approach when applicable.
- How the receiving team verifies seal integrity without damaging the package.
Example: A gasketed lid may be acceptable for transport but not for repeated handling. The interface should therefore include a clear rule: if the lid is opened, the package is no longer “transport-qualified” and must be reprocessed under the site’s approved procedure.
Radiological Interfaces and Handling Zones
Radiological performance is often communicated as dose rate limits at defined distances and as contamination control requirements. Packaging interfaces should also define the workflow:
- Establishing controlled areas around the package based on measured dose rates.
- Tooling and handling that avoids unnecessary exposure time.
- Contamination checks at defined points in the receiving sequence.
A helpful mental model is to map the package to a “traffic plan.” The package dictates where people can stand, where equipment can roll, and where wipe tests must occur. If the plan is missing, the team will improvise, and improvisation is where dose and contamination control drift.
Identification, Documentation, and Traceability
Transportation interfaces are not complete without traceability that survives real-world logistics delays. Each package should include:
- Unique identifiers for the package and contents.
- Markings that match the shipping papers and the receiving inventory system.
- Configuration data needed to confirm the correct handling tools and procedures.
Example: Two components may look identical externally but differ in shielding thickness or internal restraint geometry. The receiving team should not rely on appearance; the interface must force correctness through labels, paperwork, and a receiving checklist.
Receiving and Transfer Interfaces
The final interface is the moment the package meets the reactor site equipment. Define:
- Lifting interface compatibility between package lifting trunnions and site cranes.
- Alignment features for docking into storage or installation fixtures.
- Verification steps that confirm the package state before any connection or opening.
Example: If the site uses a transfer cask or hot cell fixture, the package must include alignment features that prevent “almost aligned” docking. A small misalignment can lead to binding, which then leads to force, which then leads to damage.
Mind Map: Transportation Packaging Interfaces
Integrated Example Workflow
- Pre-receipt review: confirm package ID matches shipping documents and the site’s approved handling procedure.
- Controlled area setup: establish boundaries based on measured or declared dose rates.
- Mechanical handling: lift using approved points; verify no visible damage to external restraint features.
- Thermal and seal checks: perform required checks that do not compromise containment.
- Contamination verification: run wipe tests at specified locations before moving the package into tighter areas.
- Transfer to storage or installation fixture: dock using alignment features; verify correct seating before any opening.
This sequence keeps the interface systematic: each step reduces uncertainty before the next step adds complexity. The package arrives as a known object, not a mystery box with good intentions.
4.5 Operational Modes Including Load Following and Steady Operation
Microreactors usually run in one of two practical patterns: steady operation, where output is held near a setpoint for long stretches, or load following, where electrical and thermal outputs track demand changes. The key idea is simple: the reactor core and its heat removal path must remain within allowable reactivity and temperature limits while the power conversion system adjusts to the grid or process load.
Core Control Logic from Setpoints to Safety Functions
Start with the operator’s intent: a target electrical power, a target thermal output, or both. The control system then translates that intent into commands that affect reactivity and heat removal. In most designs, reactivity control is not “free”; it is constrained by safety functions that must always have authority to return the system to a safe state.
A useful way to think about the control loop is three layers:
- Power demand layer: chooses the setpoint based on grid requirements or process steam demand.
- Reactivity and heat removal layer: adjusts control elements and/or coolant flow to keep core power and temperatures within limits.
- Safety layer: monitors key parameters and enforces protective actions when limits are approached.
A practical best practice is to define “normal control” and “protective control” boundaries in the operating procedures. For example, if core outlet temperature approaches a limit, normal load following should reduce demand tracking aggressiveness before any safety action is needed.
Steady Operation for Predictable Thermal Behavior
Steady operation is the default mode when demand is stable or when the process can buffer energy. The reactor is held at a near-constant thermal power, and the power conversion system maintains electrical output with routine regulation.
Example: A remote mineral processing site uses a steam header with a large thermal mass. Operators keep reactor thermal power constant and modulate steam valves to match process flow. If the process demand drops for 30 minutes, the steam header absorbs the change, preventing large swings in turbine inlet conditions.
Steady operation simplifies several operational tasks:
- Fewer transitions reduce wear on valves and rotating equipment.
- Temperature gradients stay more consistent, which helps maintenance planning.
- Data trends are easier to interpret because the system is not constantly changing operating points.
A slightly playful but real rule: if you can store energy cheaply, you should. Thermal buffering often costs less than constantly chasing load changes with tight control.
Load Following for Matching Demand Changes
Load following is used when electrical demand, process heat demand, or both change frequently. The control system must respond quickly enough to keep the plant stable, but not so aggressively that it drives large temperature swings or forces frequent reactivity adjustments.
Example: A microgrid supplying a remote town experiences a daily pattern: morning start-up increases load, midday demand dips, and evening peaks. The reactor follows a scheduled power curve with a limited ramp rate. When demand drops, the system reduces core power while maintaining adequate heat removal so that fuel and cladding temperatures remain within allowable ranges.
Load following typically requires three operational disciplines:
- Ramp rate limits: define maximum changes in power per unit time to control thermal inertia.
- Minimum stable operating regions: avoid operating points where control authority is reduced.
- Coordinated electrical and thermal targets: if the reactor is coupled to both electricity and process heat, the control strategy must decide which output is primary during transients.
A common integrated practice is to specify “primary and secondary” outputs for each transient type. For instance, during a sudden electrical load increase, electrical output may be primary while process heat is temporarily held constant using a buffer tank.
Transition Management Between Modes
Switching between steady operation and load following should not be treated as a casual toggle. Transitions change the control objectives and can introduce transient thermal stresses.
Example: Operators plan to move from steady operation to load following when a new industrial line comes online. They first confirm that the thermal buffer is at a suitable state, then enable ramp-limited tracking, and finally widen the tracking band once temperatures and control element positions settle.
This approach reduces the chance of “control wrestling,” where the system tries to correct the same deviation in multiple layers at once.
Mind Map: Operational Modes and Control Boundaries
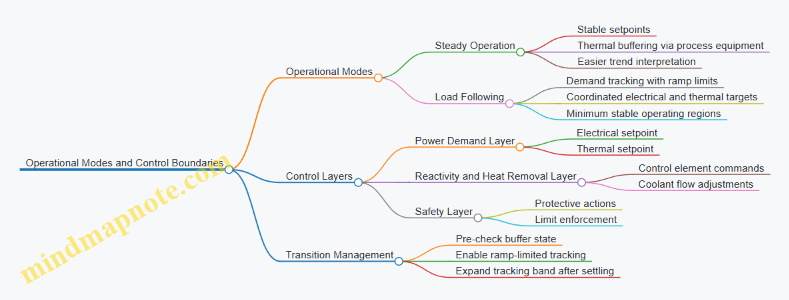
Operational Checklists That Prevent Common Mistakes
A reliable operating procedure includes specific checks before changing mode:
- Buffer readiness: confirm thermal storage or process tanks can absorb the expected deviation.
- Ramp capability: verify the planned ramp stays within defined limits for both core power and heat removal.
- Instrumentation confidence: ensure key sensors used for control and safety are within calibration and health criteria.
- Setpoint hierarchy: state which output is primary during transients and which is allowed to deviate.
Example: During a scheduled maintenance window, the plant runs in steady operation at reduced power. When maintenance ends, operators return to load following by first restoring the primary output setpoint, then re-enabling tracking, and only then allowing secondary outputs to resume normal regulation.
The result is operational clarity: the plant knows what it is trying to do, the control system knows how to do it safely, and the operators know what “normal” looks like when demand changes.
5. Safety Case Foundations and Regulatory Documentation
5.1 Building a Safety Case From Design Basis to Evidence
A safety case is the structured argument that a microreactor design is acceptably safe for its intended use. It is not a folder of reports; it is a chain of reasoning where each claim is supported by evidence. For a portable nuclear system, the chain must also survive contact with reality: transport, installation, operator actions, and maintenance.
Start with the Design Basis
The design basis is the set of requirements and assumptions that define what the plant must handle. It includes:
- Intended use: standalone power, process heat, remote operation, and expected duty cycles.
- Site and operational envelope: temperature ranges, seismic or wind considerations, installation footprint, and expected staffing.
- Safety functions: what must work to prevent unacceptable radiological consequences.
- Design basis events: normal operation upsets, anticipated operational occurrences, and accident conditions.
Example: If the design basis assumes loss of external power, the safety case must show how the system maintains heat removal and reactivity control without relying on grid electricity.
Translate Requirements into Safety Claims
Safety claims are specific statements that the system will achieve safety objectives. A practical approach is to organize claims by safety functions:
- Reactivity control: maintaining subcriticality or controlled criticality.
- Heat removal: ensuring decay heat is transferred to an adequate heat sink.
- Confinement: preventing release pathways from fuel to environment.
- Radiation protection: limiting dose to workers and the public.
Example: A claim might read: “Decay heat is removed by passive heat transfer pathways under loss of active systems for the required duration.” That claim is precise enough to test.
Map Claims to Arguments and Evidence
For each claim, build an argument that explains why the design features work. Then attach evidence that demonstrates performance.
A useful structure is:
- Claim → Argument → Evidence
- Assumptions → Limits → Verification method
Example: If the argument relies on natural circulation, the evidence should include validated thermal-hydraulic analysis and supporting test results that cover relevant flow regimes and temperature ranges.
Mind Map of the Safety Case Chain
Mind Map: Safety Case from Basis to Evidence
Build Traceability Without Making It Bureaucratic
Traceability links each safety claim to design requirements, analyses, tests, and verification activities. The goal is to answer: “If this claim is wrong, where would the chain break?”
Example: Suppose a confinement claim depends on cladding integrity. Traceability should connect:
- material selection and qualification
- manufacturing controls
- inspection methods
- acceptance criteria
- the analysis that translates degradation mechanisms into performance margins.
Define Acceptance Criteria and Show Compliance
Evidence becomes persuasive when it is judged against acceptance criteria. These criteria should be measurable and aligned with the safety functions.
Common categories include:
- Functional performance: response times, temperature limits, reactivity margins.
- Radiological outcomes: dose constraints under defined scenarios.
- Reliability and availability: where applicable, proof that required functions are maintained.
- Quality and verification: demonstration that safety-related components meet specified standards.
Example: For a heat removal claim, acceptance criteria might specify maximum fuel or cladding temperatures under the design basis event, plus the duration for which heat transfer remains effective.
Include Operational and Human Factors as Evidence, Not Footnotes
Portable systems are operated by people under constraints: limited space, shift changes, and maintenance windows. The safety case should treat human actions as part of the system behavior.
Example: If operators must perform a startup sequence that enables a safety function, evidence should include procedure design, training assumptions, and verification that the sequence cannot bypass safety interlocks.
Assurance Activities That Keep the Argument Honest
A safety case is only as good as its integrity controls. Assurance typically includes:
- Quality management for safety-related work
- Configuration control so evidence matches the delivered design
- Independent review of the argument and calculations
- Consistency checks across documents and terminology
Example: If a design change alters a thermal boundary condition, the safety case should show which claims are affected and whether existing evidence still applies.
Present the Safety Case as a Coherent Narrative
A readable safety case uses consistent structure and avoids gaps between sections. Each chapter should answer a specific question:
- What is required? (design basis)
- What must be true? (claims)
- Why is it true? (argument)
- How do we know? (evidence)
- How do we prevent drift? (assurance)
Example: A well-structured section ends with a clear mapping from safety functions to evidence sets, so a reviewer can trace from a single claim to the underlying proof without hunting through unrelated material.
A Practical Mini-Template for the Section
- Scope: intended use and boundaries.
- Design Basis Summary: safety functions and design basis events.
- Claims List: one per safety function, written testably.
- Argument Structure: mechanisms and interactions.
- Evidence Mapping: analysis, tests, inspections, and verification.
- Acceptance Criteria: measurable limits and outcomes.
- Assurance and Traceability: configuration control and review.
Example: If the section covers heat removal, it should explicitly state the event, the safety function, the performance limits, the evidence type, and the verification method that supports the claim.
5.2 Defense in Depth and Safety Function Definitions
Defense in depth means you do not rely on a single barrier or a single action. Instead, you stack multiple layers so that if one layer underperforms, the next layer still prevents unacceptable outcomes. In a microreactor, this is especially important because compactness reduces physical separation and can concentrate failure modes. The goal is to define safety functions clearly, then show how design features and operating procedures satisfy them.
Safety Functions as Measurable Outcomes
A safety function is a required action or condition that maintains control of the reactor and limits radiation or other hazards. Good safety functions are written so they can be verified. Each one should specify: (1) what must be achieved, (2) under what initiating conditions, and (3) what success looks like.
Start with foundational outcomes:
- Control of reactivity to prevent power escalation.
- Removal of heat to keep fuel and cladding within limits.
- Confinement of radioactive material to prevent release.
- Protection of people through shielding, access control, and monitoring.
Then map these outcomes to safety functions. For example, “Maintain subcriticality after a trip” is more useful than “Ensure shutdown.” The first tells you what state matters and how to judge it.
Layering Barriers and Actions
Defense in depth is often described as barriers, but it also includes actions. A practical way to structure it is to separate layers into:
- Prevention: keep abnormal conditions from starting.
- Control: keep abnormal conditions from growing.
- Mitigation: limit consequences if control fails.
- Recovery: restore safe conditions without creating new hazards.
For microreactors, prevention might include robust fuel design and conservative operating margins. Control might include automatic trips and reactivity feedback management. Mitigation might include passive heat removal and confinement integrity. Recovery might include controlled restart steps after verification.
Defining Initiating Conditions and Success Criteria
Safety functions must be tied to initiating events. Use a structured set of initiating condition categories such as:
- Loss of normal power to auxiliaries
- Loss of heat sink capability
- Sensor faults or spurious signals
- Mechanical degradation affecting coolant flow paths
- Human errors during operation or maintenance
For each initiating condition, define the safety function’s success criteria. Example criteria formats:
- State criteria: “Reactor remains subcritical with margin X.”
- Thermal criteria: “Fuel temperature remains below limit Y for duration Z.”
- Confinement criteria: “Containment boundary integrity maintained; leakage below threshold.”
- Radiological criteria: “Dose to workers remains below specified limits under defined assumptions.”
A helpful best practice is to write success criteria in the same units used in analyses and test plans, so the safety case does not become a translation exercise.
Mind Map: Defense in Depth and Safety Functions
Example: From Initiating Condition to Safety Function
Consider a loss of normal electrical power to control electronics. A well-defined defense-in-depth response might include:
- Prevention layer: design electronics with fail-safe behavior and power supply hold-up where applicable.
- Control layer safety function: “Upon loss of power, reactor trips to a subcritical state within required time.” Success is judged by trip timing and reactivity margin.
- Mitigation layer safety function: “Maintain heat removal by passive pathways such that fuel temperature stays below limit for the specified duration.” Success is judged by thermal analysis and passive flow performance.
- Confinement safety function: “Maintain confinement boundary integrity under thermal and pressure loads.” Success is judged by structural and leak-rate criteria.
Notice how each safety function has a different measurable target. That prevents the common failure mode where everything is described as “safe” without specifying what “safe” means.
Example: Sensor Faults Without Overreacting
Sensor faults can trigger unnecessary trips or, worse, mask real problems. A defense-in-depth approach defines safety functions that tolerate credible faults:
- Control safety function: “Detect inconsistent sensor readings and transition to a conservative control mode.” Success is judged by detection logic performance and resulting reactor state.
- Heat removal safety function: “Maintain heat removal using redundant or conservative assumptions when sensor data is unreliable.” Success is judged by thermal margin under worst-case interpretation.
This is where slightly playful engineering discipline helps: you treat sensors as fallible, then design safety functions that do not require perfect information to stay within limits.
Integrating Safety Functions into the Safety Case
Once safety functions are defined, the safety case should show traceability from:
- initiating conditions → safety functions → design features and procedures → verification evidence.
A practical best practice is to maintain a safety function register that lists each function, its success criteria, the responsible system, and the evidence type. That keeps the safety case coherent when teams change or when design iterations occur.
Defense in depth is not a slogan; it is a structured set of decisions. When safety functions are specific and measurable, the layers stop being a list and start behaving like a system.
5.3 Licensing Pathways and Documentation Packages
Licensing a microreactor is less about finding one magic approval and more about assembling a consistent story: what the design is, what it can do, what it must never do, and how you prove both with evidence. The pathway depends on jurisdiction and reactor type, but the documentation logic stays steady.
Start with the Regulatory Questions
Most licensing frameworks ask the same core questions, even when the paperwork names differ. First, what are the credible initiating events and how do safety functions respond? Second, how do you prevent unacceptable radiation doses and releases? Third, how do you ensure the plant is built, operated, and maintained to the required quality?
A practical way to keep the answers aligned is to create a “requirements trace” worksheet early. Example: if the safety function is “maintain subcriticality during normal operation and anticipated transients,” then every related design feature, control action, and test must map back to that requirement.
Choose the Licensing Pathway and Match the Evidence
Common pathways include design approval, site approval, construction authorization, and operating authorization. Some jurisdictions combine steps; others separate them. Regardless of sequencing, your documentation package should be organized so reviewers can find the same evidence at each stage.
A helpful mental model is to treat each stage as a checkpoint on three axes:
- Safety case completeness: do you have the right arguments and analyses?
- Engineering maturity: is the design sufficiently defined to support the safety claims?
- Quality and control: can you show the work was done under controlled processes?
Build the Documentation Package with Clear Roles
A licensing package typically includes a safety analysis report, technical specifications, and supporting quality and verification documents. For microreactors, reviewers also expect clarity on interfaces: fuel handling, heat removal, power conversion, and radiation protection during maintenance.
Use a “document owner” rule. Every document should have a named technical owner responsible for content accuracy, and a separate quality owner responsible for controlled revisions. Example: the thermal-hydraulics basis document might be owned by the thermal engineer, while the configuration management procedure is owned by quality.
Safety Analysis Report Structure That Actually Helps
A safety analysis report should be readable by someone who is not living inside your design. Organize it so each chapter answers a licensing question.
Recommended internal structure
- Design basis: what you assume and why.
- Safety functions: what must happen, in what time window, under what conditions.
- Event analysis: how you treat normal operation, anticipated events, and design-basis accidents.
- Radiological consequences: how dose and release limits are met.
- Verification and validation: how you know the analyses are credible.
- Operational limits: what operators are allowed to do.
Example: if you claim passive heat removal prevents fuel damage for a loss-of-heat-sink scenario, the report should link the passive mechanism to the heat transfer calculations, then to the acceptance criteria used in component testing.
Technical Specifications and Operational Limits
Technical specifications translate safety analysis into operational rules. They define limits, surveillance requirements, and actions when parameters drift.
A concrete example is a surveillance interval for a key instrumentation channel. If the safety case depends on that channel to trigger a protective action, then the surveillance program must demonstrate the channel remains within calibration tolerance. The licensing reviewer will look for consistency between the safety function timing and the maintenance schedule.
Quality Assurance and Configuration Control
Quality assurance is not a separate universe; it is how you keep the safety case true after design changes. Configuration management should cover drawings, software versions, setpoints, test procedures, and acceptance criteria.
Example: if a control algorithm update changes the trip threshold by a small amount, you must show whether the safety analysis assumptions still hold, and whether any verification tests need to be repeated.
Mind Map of Licensing Documentation Flow
Mind Map: Licensing Pathways and Documentation Packages
Example Package Assembly for a Single Safety Claim
Suppose the safety claim is: “In a loss of external power, the reactor maintains safe heat removal long enough for operators to restore power or initiate a controlled shutdown.” Your package should include:
- A design description of the power-loss response and passive heat removal path.
- The event analysis showing time margins against acceptance criteria.
- The technical specification that sets the operational actions and surveillance for the relevant sensors.
- Verification evidence: component tests or system-level tests demonstrating the passive heat removal performance.
- Configuration control records showing the control logic and setpoints used in the analysis match the installed system.
When these items agree, the reviewer’s job becomes checking logic rather than chasing inconsistencies. That is the real goal of a licensing documentation package: make the safety case easy to audit, not just easy to write.
5.4 Probabilistic and Deterministic Analyses for Safety Demonstration
Safety demonstration usually needs two complementary stories: deterministic analysis explains what happens under defined conditions, while probabilistic analysis explains how often things go wrong and how uncertainty affects that frequency. Together, they help you show that safety functions are credible, not just theoretically possible.
Deterministic Analysis Foundations
Deterministic analysis starts with a set of design basis events and postulated failures. Each event is paired with acceptance criteria such as peak fuel temperature limits, maximum cladding damage fractions, containment pressure limits, and dose constraints. The best practice is to keep the event list traceable to the hazard assessment and to ensure every safety function has a clear “trigger, action, and outcome” chain.
A practical example: suppose a loss of forced circulation occurs. Deterministic modeling should show that natural circulation establishes sufficient heat removal, that reactivity control remains within safe margins, and that the heat sink remains available long enough for the event duration. If the model assumes operator action, the analysis must include timing and success criteria consistent with the safety case.
Probabilistic Analysis Foundations
Probabilistic analysis quantifies risk using event frequencies and consequence pathways. The core artifacts are fault trees for component failures, event trees for system-level sequences, and a model that maps sequences to safety function performance. A common best practice is to separate “model completeness” from “numerical accuracy”: first prove that all relevant initiating events and system responses are represented, then refine probabilities.
For microreactors, the analysis often emphasizes dependencies that are easy to miss in compact designs, such as shared power supplies, common-cause failures in sensors, and heat sink availability across multiple trains. A simple example is a single cooling water pump failure: deterministic analysis might show safe cooldown with one pump out, while probabilistic analysis checks how often the remaining pump is also unavailable due to common-cause causes like freezing or maintenance errors.
How They Work Together
Deterministic results provide the “physics and limits” for each sequence outcome. Probabilistic results provide the “how likely” part and help prioritize which deterministic cases matter most. A cohesive workflow is:
- Define initiating events and safety functions.
- Run deterministic analyses for representative sequences to establish performance boundaries.
- Use those boundaries in probabilistic mapping from event tree branches to consequence categories.
- Check that the probabilistic model does not contradict deterministic constraints.
This avoids a classic failure mode: a probabilistic model that counts many sequences as acceptable because it uses overly optimistic success criteria, while deterministic models show those criteria are not physically achievable.
Mind Map: Analysis Structure and Evidence
Deterministic Modeling Details That Matter
Model credibility depends on assumptions that can be audited. For microreactors, pay attention to: (a) heat transfer coefficients and fouling assumptions, (b) reactivity feedback implementation, (c) timing of actuation and sensor validation, and (d) heat sink interface conditions such as temperature and flow availability.
A concrete example: if your safety case claims passive heat removal, deterministic analysis should show the transition from forced to natural circulation and confirm that the modeled driving head is consistent with the actual geometry and elevation differences.
Probabilistic Modeling Details That Matter
Probabilistic analysis must show that the model is complete and that dependencies are represented. Common best practices include using a dependency matrix for shared components and explicitly modeling “no action” branches when automatic safety functions fail. Human actions are treated with conservative timing and success probabilities, and the analysis should document what actions are credited and what are not.
Example: for a control system failure, the event tree branch might assume the reactor trips automatically. The fault tree must include sensor and logic failures that could prevent trip, and the mapping must reflect deterministic evidence that the trip timing still keeps temperatures within limits.
Integration Checks and Acceptance
Integration is demonstrated through consistency checks: deterministic success criteria used in the probabilistic mapping must match the deterministic definitions, and the probabilistic model must not credit safety functions that deterministic analyses show cannot meet timing or performance.
A useful acceptance checklist:
- Every safety function appears in both analyses with aligned definitions.
- Each design basis event has a trace to at least one probabilistic initiating event or sequence category.
- Dominant contributors identified probabilistically have corresponding deterministic evidence.
Example: A Single Sequence Worked Through
Consider an initiating event “loss of external power.” Deterministic analysis shows that the reactor remains subcritical or safely controlled via inherent reactivity behavior and that heat removal continues using passive paths. Probabilistic analysis then counts sequences where backup power fails, sensors fail, or heat sink availability is lost. The consequence mapping uses deterministic temperature and confinement results to categorize outcomes, ensuring the frequency estimate is tied to physically demonstrated performance.
Case Study: Evidence Traceability Snapshot
A good safety case includes a traceability chain from hazard assessment to event selection, from event selection to deterministic calculations, and from those calculations to probabilistic consequence categories. For example, if a flooding hazard drives an initiating event, the deterministic model must justify the assumed heat sink conditions under flooding, and the probabilistic model must represent the dependency between site utilities and cooling availability.
Mind Map: Evidence Traceability
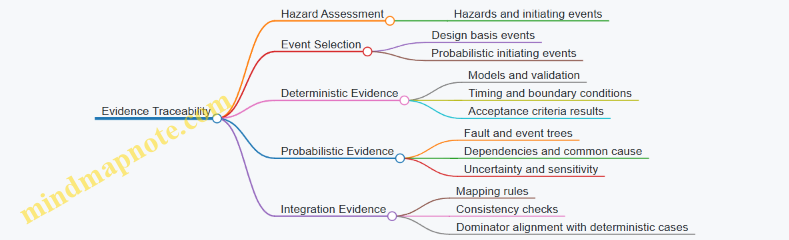
Closing the Loop
When deterministic and probabilistic analyses agree on safety function performance, the safety demonstration becomes easier to defend: deterministic work shows “can it be safe,” probabilistic work shows “how often and under what uncertainties.” The combined result is a coherent argument with fewer hand-wavy gaps and more auditable reasoning.
5.5 Quality Assurance and Configuration Control for Safety Systems
Quality assurance (QA) and configuration control are the two hands that keep a safety system consistent from design intent to day-to-day operation. QA answers, “Are we building and verifying the right thing the right way?” Configuration control answers, “Even if we change something, do we still have the right thing?” Together they prevent a quiet failure mode: the system that was proven safe on paper becomes different in the field.
Foundational Principles and Evidence
Start with a clear safety system definition: which functions it performs, what conditions it must handle, and what performance limits apply. Then build evidence in layers.
- Requirements traceability: every safety function requirement maps to design inputs, verification activities, and acceptance criteria.
- Verification planning: test, analysis, inspection, and review are chosen based on what can realistically demonstrate compliance.
- Independent review: critical safety artifacts are checked by people not directly responsible for the original creation.
Example: If a shutdown system must achieve a specified reactivity reduction within a time window, the requirement should link to actuator sizing, control logic timing, sensor accuracy, and a test procedure that measures the full chain end-to-end.
Configuration Items and Baselines
Configuration control works best when you know what you are controlling. Define configuration items such as:
- Safety function software modules and logic diagrams
- Sensor and actuator models and calibration parameters
- Wiring diagrams, interlock logic, and safety PLC configurations
- Safety instrument setpoints and alarm thresholds
- Procedures that define how safety functions are tested and restored
Then establish baselines: a frozen set of approved documents and settings that represent the “as-designed” and “as-built” state. Baselines should be versioned, searchable, and tied to the safety case evidence.
Example: A setpoint change to a temperature sensor threshold is not just a number. It can alter the sequence of safety actions, so it must be treated as a configuration item change with traceability to the safety function analysis.
Change Control Workflow That Does Not Stall Operations
A practical workflow balances rigor with speed. A typical path looks like this:
- Change request with problem statement and affected configuration items
- Impact assessment covering safety function performance, verification status, and documentation consistency
- Approval by the right authority for safety-relevant changes
- Implementation with controlled access to tools and repositories
- Verification of the change, including regression checks where relevant
- Release updating baselines and records
Example: Suppose a maintenance team replaces a component with an equivalent part. The change request should confirm compatibility: electrical characteristics, calibration method, and whether the replacement affects timing, thresholds, or failure modes.
Mind Map: QA and Configuration Control for Safety Systems
Nonconformances and Corrective Actions
QA is not only about preventing defects; it is also about handling them correctly when they appear. When a nonconformance is found, the response should answer three questions: what is wrong, what else might be affected, and how do we prevent recurrence.
- Containment: stop use of the affected item or configuration.
- Root cause analysis: focus on process and system causes, not just individual mistakes.
- Corrective and preventive actions: update procedures, training, templates, or verification steps.
- Effectiveness checks: confirm the fix works, not just that it was documented.
Example: If a test procedure was missing a required timing measurement, the corrective action might include revising the procedure template and adding a checklist item, then verifying that future tests include the missing measurement.
Safety System Testing and Configuration Integrity
Testing can accidentally change configuration if it is not controlled. Treat test activities as configuration-sensitive work.
- Use test modes that are explicitly defined and reversible.
- Ensure setpoints and interlocks return to baseline after tests.
- Record test results in a way that links to the configuration version used.
Example: During a functional test of an interlock, technicians may temporarily bypass a condition to simulate a sensor fault. Configuration control requires that the bypass is time-limited, logged, and automatically cleared or verified before returning the system to normal safety configuration.
Configuration Control for Software and Logic
Software and logic are often the most change-prone parts of a microreactor safety system. Apply QA and configuration control together:
- Version control with access restrictions
- Traceability from requirements to code modules
- Review of changes by qualified personnel
- Verification that includes timing behavior and fault handling
Example: A logic change that adjusts a sensor filtering window must be checked for both normal operation and fault detection timing, because the safety function may depend on how quickly a fault is recognized.
Practical Checklist for Day-to-Day Consistency
Before releasing a safety system configuration, confirm:
- The change request identifies affected configuration items.
- The impact assessment covers safety function performance and verification status.
- Baselines are updated and records are complete.
- Test results reference the exact configuration version.
- Restoration after maintenance returns the system to the approved safety configuration.
When QA and configuration control are working, the safety system behaves the same way for the next test, the next shift, and the next maintenance event—because the evidence and the configuration agree.
6. Passive Safety Features and Inherent Protection Mechanisms
6.1 Understanding Passive Heat Removal and Natural Circulation
Passive heat removal is the set of heat-dissipation paths that work without active pumps, without operator actions, and without relying on electrical power. In a microreactor, the goal is simple: if the normal heat removal train is unavailable, the reactor should still move heat away from the core and keep fuel temperatures within design limits.
Natural circulation is the engine that makes passive heat removal practical. It uses density differences in the coolant to create flow. As coolant heats up in the core, it becomes less dense and rises. Cooler, denser coolant from a heat sink region flows back down, completing a loop. The “circulation” happens because gravity is free and pumps are not required.
Passive Heat Removal Building Blocks
A passive system typically combines three elements: a heat source, a flow path, and a heat sink.
- Heat source: the core produces heat continuously during operation and also after shutdown due to decay heat.
- Flow path: the geometry and elevations create a loop where buoyancy can drive coolant movement. Clearances, bends, and flow restrictions matter because they set the resistance to flow.
- Heat sink: heat is transferred to an external medium—often air, water, or a dedicated heat exchanger—through surfaces that do not require active circulation.
A useful mental model is to treat the loop like a slow thermos. If the heat sink can reject heat to the environment, the coolant will keep circulating as long as the buoyancy force can overcome loop resistance.
Natural Circulation Mechanics
Natural circulation is driven by a pressure difference created by buoyancy. The buoyancy pressure difference grows with:
- Core-to-sink temperature difference: hotter coolant in the core reduces density, increasing the driving head.
- Vertical height difference: larger elevation changes increase the buoyancy effect.
- Coolant properties: density and thermal expansion coefficients influence how strongly temperature changes translate into pressure.
Flow resistance reduces circulation. It increases with:
- Frictional losses in pipes and channels.
- Local losses from fittings, valves, and sudden area changes.
- Two-phase behavior if boiling occurs, which can either limit flow or change the loop dynamics depending on design.
A practical best practice is to verify that the loop has a stable operating point: after a disturbance, the system should settle into a new temperature and flow level without oscillating wildly or stalling.
Shutdown Heat and Why Passive Matters
After shutdown, decay heat is smaller than full-power heat but not zero. Passive heat removal must handle this residual heat so that fuel temperatures do not climb to unacceptable values.
A concrete example: imagine a microreactor that normally uses a forced-circulation loop to a heat exchanger. If power is lost, the forced loop stops. The passive loop must then provide enough buoyancy-driven flow to keep the core-to-heat-sink temperature difference within limits. If the passive heat sink is sized so that it can reject decay heat at a moderate temperature rise, the system stabilizes. If the heat sink is undersized, temperatures rise until either boiling limits heat transfer or material limits are approached.
Design Reasoning from Core to Environment
Passive systems are easiest to understand when traced end-to-end.
- Core heat generation sets the required heat removal rate.
- Coolant loop converts that heat into a buoyancy-driven flow rate.
- Heat transfer surfaces determine how effectively coolant transfers heat to the sink.
- External heat rejection limits the sink temperature rise.
Each step has a “bottleneck.” If the heat transfer coefficient on the sink side is low, the external surface temperature rises, which reduces the driving temperature difference and can reduce overall heat removal.
Mind Map: Passive Heat Removal and Natural Circulation
Example: Loop with and Without Adequate Heat Sink Capacity
Consider two identical natural-circulation loops. In both, the core produces the same decay heat after shutdown.
- Case A: The heat sink can reject that decay heat with a reasonable temperature rise. Coolant warms in the core, rises, and transfers heat to the sink. The loop finds a steady state where buoyancy balances resistance.
- Case B: The heat sink rejects less heat than the core produces. Coolant temperatures rise, which increases buoyancy but also increases thermal stresses and can push the system toward boiling-limited heat transfer. The loop may still circulate, but the heat removal rate cannot keep up, so fuel temperatures trend upward.
The difference is not the circulation mechanism; it is the end-to-end capacity from core heat to environmental rejection.
Practical Best Practices for Understanding and Verification
- Track the loop from elevations to temperatures: buoyancy needs height and temperature difference.
- Quantify resistance early: small geometric restrictions can dominate the pressure balance.
- Use shutdown heat as the design anchor: passive systems are often sized for decay heat stability.
- Look for bottlenecks: the limiting step may be heat transfer on the sink side, not the core side.
- Confirm stability, not just peak values: a system that reaches limits after oscillations is not “safe enough,” even if average temperatures look acceptable.
Passive heat removal and natural circulation are not magic; they are a set of coupled physical balances. When the buoyancy-driven loop and the external heat sink are matched, the reactor can keep heat moving in the right direction even when the usual machinery is silent.
6.2 Reactivity Feedback Effects and Temperature Driven Behavior
In a microreactor, reactivity is not a static number. As the core heats up or cools down, physical properties shift and the reactor responds. “Reactivity feedback” is the collection of these temperature-dependent effects, and “temperature driven behavior” is what you observe when those effects couple to heat removal and power generation.
Core Idea: Power Changes Temperature, Temperature Changes Reactivity
Start with the chain: neutron population determines power; power produces heat; heat changes temperatures in fuel, cladding, and coolant; those temperature changes alter reactivity; altered reactivity changes neutron population. The key is that many feedbacks are negative, meaning higher temperature tends to reduce reactivity and push power back toward a stable level. That is the reactor’s built-in “thermostat,” though it is not magic—its strength depends on design and operating conditions.
Main Temperature Dependent Reactivity Terms
Reactivity feedback is usually discussed as a sum of contributions. In microreactors, the dominant terms often include:
- Fuel temperature effect: As fuel temperature rises, Doppler broadening increases resonance absorption, typically reducing reactivity.
- Coolant temperature effect: If coolant density decreases with temperature, moderation and absorption change. The sign depends on the spectrum and coolant role.
- Structural and cladding effects: Thermal expansion can change geometry and material densities, shifting reactivity.
- Void or boiling effects: If the coolant can form vapor, the neutron moderation and absorption change sharply. Even small void fractions can matter.
A practical way to reason about signs is to ask: “Does heating make the core more or less able to sustain neutrons?” For many compact designs, the answer trends toward “less able,” which is why negative feedback is a central safety feature.
How Feedback Couples to Heat Removal
Temperature does not rise in isolation. It is set by the balance between heat generated and heat removed. If heat removal is strong, temperatures rise less for a given power level, and feedback effects are weaker. If heat removal is limited, temperatures rise more, and feedback effects strengthen.
A simple example: imagine a microreactor operating at a steady power. If an external disturbance reduces coolant flow, heat removal drops. Fuel and coolant temperatures increase. Negative feedback then reduces reactivity, lowering power. The system can settle into a new steady state where heat generation again matches heat removal.
Time Scales: Why Some Responses Look Instant and Others Lag
Feedback is not one-speed. Different parts of the system respond on different time scales:
- Fast neutron effects: Reactivity changes can influence power quickly.
- Fuel thermal inertia: Fuel temperature changes more slowly than neutron population.
- Coolant thermal and flow dynamics: Coolant temperature and density evolve with flow and mixing.
This separation matters for stability. A strong negative feedback with a slower thermal response can still stabilize the reactor, but the transient shape depends on how quickly temperatures move relative to power.
Mind Map: Temperature Driven Reactivity
Example: Flow Reduction and the “Thermostat” Response
Consider a scenario where coolant flow decreases by 20% due to a pump slowdown. Immediately, the reactor power does not drop to match the new heat removal rate; instead, temperatures begin to rise. As fuel temperature increases, Doppler broadening reduces reactivity. If the coolant temperature effect is also negative, the combined feedback reduces reactivity further.
What you would see in instrumentation is a delayed power reduction relative to the flow change, along with a temperature rise that peaks and then declines as the system reaches a new balance. The exact peak depends on thermal inertia and the feedback coefficients. The important operational lesson is that temperature trends are not just “symptoms”—they are the causal pathway through reactivity.
Example: Approaching Boiling Conditions
If the coolant can approach boiling, the void fraction can change rapidly with temperature. This can create a strong reactivity shift. In many designs, the intent is to keep operation in a regime where boiling is either prevented or limited so that feedback remains predictable and negative. If boiling were to occur, the reactivity response could become nonlinear, and the transient could be sharper than in single-phase operation.
Operational best practice is to treat the onset of boiling as a boundary condition: define allowable temperature margins, verify that feedback remains favorable within those margins, and ensure that control and protection actions do not rely on “waiting for feedback” to do the heavy lifting.
Advanced Detail: Feedback Coefficients and Correlation Checks
Engineers often summarize feedback strength using coefficients such as fuel temperature coefficient and coolant temperature coefficient. These coefficients are not constants; they vary with power level, spectrum, and geometry. A robust operational approach is to check that measured temperature changes correlate with expected reactivity trends.
A concrete check: during a controlled load change, you expect a consistent direction of power response relative to temperature. If the observed correlation reverses, it can indicate that the system is operating in a different regime than assumed—such as altered coolant state, unexpected thermal stratification, or instrumentation mismatch.
Summary: What Temperature Driven Behavior Means in Practice
Temperature driven behavior is the practical expression of reactivity feedback. It ties together neutron physics, thermal hydraulics, and control strategy into one cause-and-effect chain. When negative feedback is properly designed and verified, disturbances like reduced flow lead to a moderated power response rather than runaway escalation. When boiling or other nonlinear regimes are possible, the same chain becomes more sensitive, so margins and protection logic must be defined with care.
6.3 Containment and Confinement Approaches for Compact Designs
Containment and confinement are not the same thing, but they work together like a well-designed pair of gloves: one aims to keep radioactive material inside, the other aims to keep any leakage from spreading where it shouldn’t. For compact microreactors, the challenge is that the system has less physical volume, fewer redundant pathways, and tighter integration between reactor, heat removal, and power conversion. That means the design must be deliberate about where material could go, how it would be detected, and how it would be prevented from reaching occupied areas.
Foundational Concepts and Design Targets
Start with the material inventory you are trying to control. In most microreactor concepts, the primary concern is the release of fission products from the fuel matrix and their transport through any available gaps, coolant paths, or structural penetrations. The design targets typically include:
- Containment: a barrier that is intended to remain intact under design-basis conditions and limit the fraction of radioactive material that escapes.
- Confinement: a secondary barrier or controlled environment that limits the spread of any leaked material and provides a place to capture it.
- Pressure and flow management: keeping flow directions and pressure differentials aligned so that leakage tends toward controlled systems rather than outward.
A practical way to think about this is to map “escape routes” from the fuel region outward. If you can’t eliminate a route, you can at least make it longer, less likely, and easier to detect.
Barrier Strategy for Compact Geometries
Compact designs often use multiple barriers in series. A typical chain looks like this:
- Fuel form and cladding: the first barrier, designed to retain fission products.
- Primary coolant boundary: the next barrier, which prevents transport of activity via coolant.
- Reactor vessel or pressure boundary: a structural barrier that also supports leak detection.
- Containment housing: a sealed enclosure around the reactor and primary systems.
- Confinement ventilation and filtration: controlled air handling that captures any airborne activity.
The “compact” part changes how you implement these. For example, a large building can provide passive volume for dilution, but a microreactor module may not. So confinement often relies more heavily on engineered airflow paths and filtration than on sheer space.
Pressure Differentials and Controlled Airflow
Confinement is easiest when the system is biased so that any leakage goes inward-to-outward in the correct direction. A common approach is to maintain the containment housing at a slightly higher pressure than surrounding areas when you want to prevent outside air ingress, or slightly lower when you want to prevent any leaked air from leaving the module. The choice depends on where filtration and monitoring are located.
Example: Suppose the module has a sealed containment housing with a dedicated exhaust duct to a filter unit. If the housing is kept at a lower pressure than the surrounding work area, any small leak tends to pull air from the work area into the housing, not the other way around. That means the filter unit becomes the “sink” for any airborne activity.
To make this work reliably, you need:
- stable pressure control logic,
- dampers and flow paths that fail to a safe configuration,
- and instrumentation that can confirm the direction of leakage.
Leak Detection and Monitoring That Actually Helps
Containment without detection is like a door with no handle: you can’t tell whether it’s doing its job. For compact systems, monitoring must be sensitive enough to detect small releases and robust enough to operate during normal operations.
Common monitoring elements include:
- Differential pressure sensors across containment boundaries.
- Airborne activity monitors on confinement exhaust streams.
- Coolant activity sampling where applicable.
- Helium or tracer leak testing during commissioning to establish baseline integrity.
Example: During commissioning, you can perform a tracer test on the containment housing and record the measured leak rate. Later, if pressure control behaves oddly or a monitor shows unexpected activity, you can compare against the baseline to decide whether the issue is control-related or integrity-related.
Confinement Ventilation and Filtration Design
Confinement ventilation provides a controlled pathway for any leaked gases or aerosols. In compact modules, filtration is typically sized for the expected leak scenarios and maintenance intervals.
Key best practices:
- Zoning: separate areas with different contamination potential so you don’t spread activity through shared ductwork.
- Redundancy: at least two filtration trains or a maintenance-friendly arrangement so you can service one without losing confinement.
- Duct sealing and inspection: duct joints and penetrations are frequent weak points.
Example: If the module has a service bay, you can route confinement exhaust from the reactor enclosure directly to the filter unit, rather than through the service bay. That reduces the number of surfaces that could become contaminated.
Mind Map: Containment and Confinement for Compact Designs
Example Workflow for Reasoning Through Design Choices
A systematic way to validate the approach is to walk through a single “credible leakage” scenario:
- Assume a small breach at a defined boundary (for example, a penetration seal).
- Determine the transport path: does material move via coolant, via gas space, or via air?
- Apply pressure logic: which direction does the leakage tend to flow?
- Identify the capture mechanism: containment housing integrity, then confinement exhaust filtration.
- Check detectability: which sensor should respond first, and what threshold triggers action?
- Confirm maintainability: can the filtration and monitoring be serviced without breaking confinement during normal work?
If each step has a clear answer, the design is coherent. If one step is vague, it usually means the module is relying on “it probably won’t happen” rather than on barriers, airflow control, and measurement.
Practical Takeaways
For compact microreactors, containment and confinement succeed when they are treated as an integrated system: barriers in series, pressure and airflow that bias leakage toward controlled capture, and monitoring that provides actionable evidence. When these pieces are aligned, the module can be compact without becoming fragile—like a toolbox with fewer drawers, but each drawer labeled and reachable.
6.4 Emergency Core Cooling and Heat Sink Interfaces
Emergency core cooling is the part of the safety story that answers a simple question: if normal heat removal is lost, how does the core still get rid of decay heat and prevent fuel damage? In microreactors, the “interface” is where the reactor meets the heat sink—water, air, or a dedicated passive reservoir—and where signals, valves, and flow paths must behave predictably.
Foundational Interface Goals
An emergency heat sink interface must satisfy three practical goals. First, it must provide a heat removal path without requiring operator action. Second, it must keep flow and temperature within design limits for the full accident timeline, not just the first few minutes. Third, it must fail in a safe direction: if power is lost, the interface should not accidentally block cooling.
A helpful way to reason about this is to separate “cooling availability” from “cooling effectiveness.” Cooling availability means the heat sink can be reached by the coolant or heat transfer medium. Cooling effectiveness means the interface can transfer heat at the required rate despite boiling, stratification, or nonuniform temperatures.
Heat Sink Types and Interface Implications
Most microreactor designs use one or more of these heat sink concepts: a passive water pool, a dedicated heat exchanger connected to a water or air loop, or a combination of passive and engineered paths. Each choice changes the interface details.
- Passive water pool interfaces rely on gravity-driven circulation, natural convection, or boiling heat transfer. The interface must manage vapor formation so that the heat transfer surface stays wetted or is designed for stable film boiling.
- Air-cooled interfaces depend on natural draft and large surface areas. The interface must avoid flow stagnation and ensure that air-side heat transfer surfaces are not blocked by installation constraints.
- Engineered heat exchanger interfaces add pumps or valves in normal operation, but emergency operation should either remove those dependencies or guarantee their safe state.
A concrete example: if a passive pool is the emergency sink, the interface should be arranged so that when coolant level drops, the remaining water still contacts the relevant heat transfer surfaces. Otherwise, the system can transition from “good cooling” to “dry surfaces” at the worst time.
Flow Path Design and Valve Logic
Emergency cooling interfaces typically include isolation valves, check valves, and flow restrictors. The design challenge is to ensure that the intended flow path opens when it should and does not reverse when it shouldn’t.
Best practice is to treat valve states as part of the safety function, not as an afterthought. For instance, a normally closed isolation valve should be fail-safe to the open position for emergency cooling, or it should be bypassed by a passive path. Check valves should be selected and oriented to prevent backflow that could drain the heat sink or short-circuit the intended circulation.
A simple mental model: draw the interface as a one-way street for coolant. If the street can be turned into a two-way road during a power loss, you must show that the resulting flow still cools the core.
Thermal-Hydraulic Coupling and Interface Limits
The interface is not just plumbing; it is a thermal device. Key phenomena include:
- Natural circulation onset: the interface must provide enough driving head (density difference) to start and sustain flow.
- Boiling and two-phase behavior: heat transfer coefficients can change sharply with void fraction.
- Thermal stratification: in a pool, hot and cold layers can form, affecting the effective heat sink temperature.
To keep this systematic, define interface performance metrics such as minimum heat transfer rate, maximum cladding temperature, and time to reach a stable cooling regime. Then verify that the interface can meet these metrics under the design basis loss of normal heat removal.
Instrumentation and Confirmation of Cooling Availability
Even when emergency cooling is passive, instrumentation should confirm that the interface is doing what it is supposed to do. Useful measurements include coolant temperatures at interface boundaries, differential pressure across flow restrictors, and level indicators for passive reservoirs.
A practical example: if the emergency sink is a water pool, a level sensor can confirm that the pool has not been inadvertently drained during maintenance. If the interface uses a heat exchanger, temperature measurements on both sides can confirm that heat is actually transferring rather than merely circulating.
Mind Map: Emergency Cooling Interface Elements
Interface Testing and Acceptance Criteria
Testing should verify both mechanical behavior and thermal performance. Mechanical checks confirm valve travel, check valve cracking behavior, and leak-tightness. Thermal tests confirm that the interface reaches the required cooling regime within the specified time.
A good acceptance criterion is not only “cooling starts,” but “cooling maintains temperatures below limits for the required duration.” For example, if the interface is expected to remove decay heat for several hours, the test should demonstrate stable heat transfer without oscillations that could indicate unstable two-phase flow.
Operational Integration During Maintenance
Emergency cooling interfaces must remain reliable even when the plant is not in its most convenient configuration. Maintenance activities can introduce blocked vents, mispositioned valves, or removed insulation that changes heat transfer.
A practical best practice is to use a maintenance checklist that explicitly references the emergency interface: verify valve positions, confirm heat sink inventory, and check that any temporary bypasses are removed before returning to service. The goal is to prevent a “paper-correct” safety function from being undermined by a real-world setup.
6.5 Safety System Testing and Verification Requirements
Safety systems are only useful if they work when you need them, in the conditions you actually have. Testing and verification therefore cover three things: the design intent, the installed hardware, and the operational behavior under realistic demands. A good program treats each safety function like a checklist with evidence, not like a one-time “it passed” stamp.
Foundations for Verification
Start with the safety function definition: what must happen, within what time window, to what performance threshold, and under which initiating conditions. Then map each safety function to its actuators, sensors, logic, power supplies, and heat removal or containment interfaces. This mapping becomes the backbone of test planning.
A practical best practice is to write a short “testable requirement” for each safety function. Example: “On loss of forced heat removal, the system must initiate passive heat removal within 10 seconds and maintain coolant temperature below the specified limit for 30 minutes.” That sentence forces clarity on timing, triggers, and acceptance criteria.
Test Strategy and Evidence Types
Use a layered approach so you don’t rely on a single test method.
- Design verification confirms the analysis and assumptions match the intended behavior. Example: verify that sensor placement and signal conditioning produce the correct trip point under expected temperature gradients.
- Component qualification checks that individual parts meet their specs across relevant environmental ranges. Example: confirm that a valve actuator can reach position within tolerance at the minimum supply voltage.
- System integration testing proves the full chain from signal to action. Example: simulate an initiating event and verify that logic, actuation, and feedback signals all agree.
- On-site commissioning testing demonstrates readiness after installation. Example: verify wiring continuity, correct channel mapping, and correct interlocks with the balance of plant.
- In-service testing maintains confidence over time. Example: periodic functional checks that do not require full plant stress.
Each evidence type should be traceable to the safety case. If a test cannot be tied to a requirement, it’s usually a distraction.
Test Categories and How They Work
Functional tests verify that the safety function performs its required action. Example: trigger a simulated high-temperature condition and confirm the correct shutdown or heat removal pathway engages.
Performance tests verify margins and timing. Example: measure actuation time under worst-case hydraulic or pneumatic conditions.
Environmental tests verify survivability and operability. Example: confirm that electronics remain within acceptable drift limits after vibration and temperature cycling.
Failure mode tests verify that safety logic behaves correctly when signals are missing or inconsistent. Example: if a sensor channel fails high, the system should either trip conservatively or enter a defined safe state according to the safety design.
Acceptance Criteria and Measurement Discipline
Acceptance criteria must be explicit and measurable: trip setpoints, actuation times, allowable overshoot, and required feedback confirmation. A common pitfall is using “it looked fine” criteria for timing or thresholds.
Measurement discipline matters because safety systems often rely on fast signals and tight tolerances. Use calibrated instruments, record raw data, and define how you handle noise, filtering, and sensor lag. Example: if a temperature sensor has a known response delay, the test should account for it when comparing observed trip timing to the requirement.
Test Execution Planning
Plan tests so they are safe, repeatable, and minimally disruptive.
- Pre-test checks confirm correct configuration, correct firmware or logic version, and correct interlock states.
- Test sequencing ensures the system is in a known baseline state before initiating the event.
- Post-test verification confirms the system returns to a safe, ready state and that no latent faults were introduced.
A simple best practice is to use a “three-pass” checklist: configuration verified, stimulus applied, and outcome verified with recorded evidence. If any pass fails, the test result is not valid.
Mind Map: Safety System Testing and Verification
Integrated Example Workflow
Consider a safety function that must initiate passive heat removal when forced circulation is lost.
- Requirement: initiate within 10 seconds and maintain temperature below the limit for 30 minutes.
- Functional test: simulate loss of forced circulation signal and confirm the passive pathway opens and feedback indicates correct state.
- Performance test: apply the worst-case signal and verify actuation timing and early temperature response.
- Failure mode test: simulate a stuck sensor or missing signal and verify the logic selects the conservative safe state.
- Commissioning test: repeat the functional test on-site with installed wiring and confirm channel mapping.
- In-service test: perform periodic functional checks using non-invasive stimuli and verify that timing remains within tolerance.
If any step fails, you don’t just “fix and rerun.” You document the nonconformance, determine whether the failure is a calibration issue, a configuration mismatch, a component drift, or a logic gap, and then update the evidence chain accordingly.
Documentation and Configuration Control
Testing is only as credible as its configuration control. The test procedure, the logic version, the sensor calibration state, and the wiring configuration must be recorded so the result can be reproduced. When changes occur, re-verify only what is affected, but do it with traceability back to the safety function requirements.
Finally, ensure that test results are reviewed by personnel independent of the test execution. That review checks for both technical correctness and whether the evidence actually supports the safety case claims.
7. Shielding and Radiation Protection for Portable Deployment
7.1 Radiation Types and Dose Metrics for Operational Planning
Operational planning starts with two questions: what kind of radiation is present, and what “dose” means for people and equipment. Radiation types matter because they interact with matter differently, and dose metrics matter because they translate physical energy into biological impact.
Radiation Types You Will Actually Plan For
Alpha particles are heavy and carry charge, so they travel only a short distance in air and are stopped by skin or a sheet of paper. The operational risk is usually internal: if alpha-emitting material is inhaled or ingested, it can deposit energy directly in tissue.
Beta particles are lighter and can travel farther in air than alpha. They are stopped by a few millimeters of plastic or glass, but they can still create skin dose and, with sufficient energy, eye dose. Beta sources also raise contamination concerns because they can be produced on surfaces.
Gamma rays and X-rays are penetrating photons. They are the reason shielding thickness and controlled access zones exist. For planning, photons are the “distance and time” problem: reduce time near the source, increase distance, and use shielding.
Neutrons are uncharged and interact differently than photons. They can penetrate deeply and require hydrogenous materials (for slowing) plus other materials (for capture). Neutron dose planning often drives specialized shielding and more careful assumptions about source term and geometry.
Dose Metrics That Turn Physics into Decisions
Dose planning uses multiple metrics because different decisions need different views.
Absorbed dose measures energy deposited per unit mass (gray, Gy). It is a physical quantity and is useful for engineering comparisons, but it does not directly represent biological harm.
Equivalent dose converts absorbed dose to account for radiation type using a radiation weighting factor (sievert, Sv). This is the bridge from “energy deposited” to “biological effectiveness.”
Effective dose further accounts for the varying sensitivity of different organs (Sv). It is useful for comparing scenarios that involve different exposure patterns across organs.
Operational dose rates are typically expressed as dose per unit time (for example, µSv/h). These rates feed into work planning: how long can a task take, and what shielding or distance changes are needed.
Contamination metrics complement external dose. Surface activity (for example, Bq/cm²) and airborne concentration (for example, Bq/m³) help determine whether respiratory protection, decontamination steps, or exclusion zones are required.
A Practical Planning Workflow
- Identify the radiation field: For each task, decide whether the dominant hazard is external photons, beta, neutrons, or contamination.
- Define the geometry: Distance from the source and shielding configuration are not details; they are inputs. A small change in layout can change dose rate by orders of magnitude.
- Select the relevant metric: Use dose rate for time budgeting, effective dose for overall planning, and contamination measures for internal exposure controls.
- Apply constraints: Translate regulatory and internal limits into actionable work instructions, such as maximum task duration and required protective measures.
- Verify with monitoring: Use area monitors and personal dosimetry to confirm that the assumed dose rates match reality.
Mind Map: Radiation Types and Dose Metrics
Worked Example for Operational Planning
Assume a maintenance task near a photon-emitting component produces an area dose rate of 10 µSv/h at the worker’s planned location, with shielding in place. If the task duration is 2 hours, the planned external dose is 20 µSv (ignoring attenuation changes during movement). If the worker must also enter a region where the dose rate rises to 25 µSv/h for 20 minutes, that segment adds (25 µSv/h) × (1/3 h) = 8.3 µSv. Total planned dose for the task becomes 28.3 µSv.
Now add a contamination check: if removable contamination on nearby surfaces is measured at a level that could lead to inhalation risk during disassembly, the plan must include respiratory protection and controlled handling steps. In that case, the task is no longer “just external dose budgeting”; internal exposure controls become part of the dose management.
Common Planning Mistakes to Avoid
- Treating all dose as the same: absorbed dose is not equivalent dose, and equivalent dose is not effective dose.
- Planning with dose rate but ignoring geometry changes, like moving closer to the source during tool retrieval.
- Assuming contamination is only a cleanup problem; it is also a dose pathway.
- Using a single metric for every decision when tasks involve both external fields and contamination.
With radiation types and dose metrics aligned to the actual hazards, operational planning becomes a set of concrete, checkable steps rather than a collection of vague safety intentions.
7.2 Shielding Design Methods for Compact Geometries
Compact microreactors compress the shielding problem into a smaller volume, which means geometry matters more than usual. The goal is to keep dose rates within limits during normal operation, maintenance, and credible off-normal conditions, while staying realistic about weight, heat, and manufacturability.
Start with What You Must Protect
Begin by listing the radiation protection targets in plain terms: who is present, where they stand, and what time they spend. Convert that into dose-rate requirements at specific locations such as operator access points, equipment rooms, and transport interfaces. A simple example: if a technician may spend 2 hours per day near a service hatch, and the allowable dose for that task is 0.5 mSv per year, you can translate the annual allowance into an approximate maximum dose rate for that location. This step prevents “perfect shielding” that is perfect everywhere except where it counts.
Next, define the radiation fields to be controlled. For microreactors, neutron leakage often dominates shielding mass, while gamma radiation can dominate close-in regions depending on fuel form and power level. Also identify whether you need to limit activation of structural materials, not just external dose.
Build a Source Model That Matches the Geometry
Shielding calculations are only as good as the source term. For compact cores, treat the source as distributed rather than a single point. Use spatial distributions consistent with the core power density and neutron/gamma production locations. For gamma sources, include prompt gammas and any significant delayed components relevant to the operational scenario.
A practical method is to create a “source-to-surface” map: for each shielding-relevant surface (outer shell, hatch plane, cable penetration region), record the expected particle flux or intensity. This helps you later decide whether to thicken the whole shell or focus on a local feature.
Choose Shielding Materials by Function
In compact geometries, you rarely rely on one material doing everything. A common integrated approach is:
- Neutron attenuation: hydrogenous materials (for slowing) plus neutron-absorbing components to capture thermalized neutrons.
- Gamma attenuation: high-density materials for Compton scattering and photoelectric absorption.
- Activation control: select materials and thicknesses that reduce problematic activation products.
Example: if you use a hydrogen-rich layer near the core to slow neutrons, you still need a gamma-attenuating layer outside it because capture gammas can increase the external gamma field. The order matters because neutrons must slow before they can be efficiently captured.
Use Layered Geometry and Local Thickening
Compact designs often have penetrations: instrumentation feedthroughs, coolant interfaces, and maintenance access. These features can create streaming paths that bypass bulk shielding.
A systematic method is to treat shielding as a set of regions:
- Core-adjacent region for neutron moderation and capture.
- Mid region for gamma attenuation and structural support.
- Outer region for dose-rate control at boundaries.
- Penetration corridors where you add local shielding, labyrinth paths, or thicker inserts.
Example: if a cable penetration is a straight line through the shield, the dose rate at the cable tray can exceed the surrounding area even when the average shield thickness looks adequate. Adding a small “plug” insert around the penetration can reduce the streaming component without increasing the entire shield thickness.
Apply Calculation Methods with the Right Level of Fidelity
Use a staged workflow:
- Screening calculations to estimate required thicknesses and identify dominant contributors.
- Detailed transport simulations to compute dose rates at specific points and along surfaces.
- Variance reduction and mesh refinement where gradients are steep, such as near the core boundary or around penetrations.
For compact geometries, streaming and near-field effects are sensitive to small geometric details. That is why you should model penetrations, interfaces, and material boundaries explicitly rather than smoothing them away.
Validate with Benchmarks and Sanity Checks
Before trusting results, run sanity checks that catch common mistakes:
- Confirm that increasing shielding thickness reduces dose rates monotonically in the expected direction.
- Compare neutron and gamma contributions to ensure the dominant radiation type matches the material strategy.
- Check that boundary conditions and source normalization are consistent.
Example: if you add a gamma-attenuating layer but the computed dose barely changes, it may indicate that neutron leakage and capture gammas are still dominating, or that the added layer is not in the path of the streaming component.
Mind Map of Shielding Design Methods
Worked Example of a Compact Shielding Layout
Assume you need dose-rate control at an outer boundary and at a nearby service hatch. You model a core-adjacent neutron-slowing layer, followed by a gamma-attenuating structural layer. Then you add a local hatch insert that is thicker than the surrounding shell.
In the simulation results, you find:
- Outer boundary dose is acceptable with the baseline shell.
- Hatch-region dose is high because the hatch opening creates a streaming corridor.
You respond by increasing only the insert thickness around the hatch plane and adding a short offset labyrinth to break the straight-line path. After recalculation, the outer boundary remains similar, while the hatch-region dose drops to the target range. This is the practical payoff of compact-geometry methods: you fix the path that matters, not the average that looks good on paper.
7.3 Controlled Areas Access Control and Work Planning
Controlled areas are where radiation protection rules become real, not theoretical. For microreactors, the goal is simple: keep authorized people in the right place for the right job, for the right duration, using the right tools—while making it hard for preventable mistakes to survive contact with reality.
Foundations of Controlled Area Boundaries
Start by defining the boundary as a physical and administrative line. Physically, it is fencing, doors, signage, and controlled access points. Administratively, it is the set of rules that determine who may enter, under what conditions, and with what preparations.
A practical best practice is to tie each access point to a specific purpose. For example, one entry lane can be for routine operations staff, another for maintenance crews, and a third for escorted visitors. When each lane has a clear purpose, the paperwork and the behavior tend to match.
Access Control Roles and Responsibilities
Access control works only when responsibilities are explicit. Use three layers:
- Area Owner: accountable for the controlled area rules and for approving changes.
- Radiation Protection Lead: defines dose-related constraints, monitoring requirements, and work permits.
- Work Supervisor: ensures the crew follows the permit conditions and stops work when conditions change.
A simple example: if a maintenance task changes from “inside shielding enclosure” to “near the access hatch,” the Work Supervisor requests an updated work permit rather than assuming the original one still fits.
Authorization, Training, and Competency
Authorization should be role-based, not person-based. Define which roles can perform which tasks: operating panel work, sampling, component replacement, and housekeeping. Then map each role to training and competency checks.
A concrete approach is to use a short competency checklist for each task category. For instance, “component replacement” includes verifying tools, confirming contamination control steps, and understanding stop-work triggers. The checklist is signed before the job starts, not after the job ends.
Work Planning Workflow That Prevents Surprises
A controlled-area work permit is the bridge between radiation protection requirements and actual job steps. Build it as a workflow, not a form.
Step-by-Step Permit Logic
- Job description: what is being done, where, and why.
- Radiological basis: expected radiation fields, contamination likelihood, and monitoring points.
- Time and distance plan: estimated time in each zone and how distance will be maintained.
- Shielding and access method: whether temporary shielding or remote handling is used.
- Monitoring and PPE: required dosimeters, survey instruments, and protective clothing.
- Contingencies: what to do if dose rates are higher than expected or if contamination is detected.
- Stop-work criteria: clear thresholds that trigger immediate pause and reassessment.
Example: a filter change planned for Zone B includes a contingency if survey results show Zone C conditions. The crew pauses, the Radiation Protection Lead reassesses, and the Work Supervisor updates the permit before continuing.
Zone Design and Signage That People Can Use
Zones should be labeled in a way that supports quick decisions. Use consistent zone naming across the site and ensure signage matches the permit language.
A useful habit is to include “what you do here” on the signage. For example, Zone B signage can state: “Authorized maintenance only; dosimeter required; survey before exit.” This reduces the need for memory under stress.
Monitoring, Entry/Exit Checks, and Record Integrity
Entry and exit checks should be routine enough to be boring, which is exactly the point.
- Before entry: confirm dosimeters are worn, verify instrument calibration status, and ensure the correct PPE is available.
- During work: perform surveys at defined milestones, not only at the end.
- Before exit: survey for contamination and confirm tools and materials are accounted for.
Record integrity matters because it supports dose tracking and incident review. Keep records tied to the permit ID and the specific work scope, so later investigations don’t turn into scavenger hunts.
Mind Map: Controlled Areas Access Control and Work Planning
Example: Maintenance Task Near an Access Hatch
A maintenance crew plans to replace a gasket at an access hatch.
- The permit specifies the zone, expected dose rate range, and the maximum allowed time in the higher-dose sub-area.
- The plan requires a survey at the start, after gasket removal, and before reassembly.
- The crew uses a tool length that supports maintaining distance during alignment.
- If the survey shows higher dose rates, the Work Supervisor stops work and requests an updated permit with revised time limits.
The result is not just compliance; it is predictability. Everyone knows what “good” looks like, and everyone knows what to do when reality refuses to match the estimate.
7.4 Monitoring Systems for Personnel and Environmental Protection
Monitoring systems do two jobs at once: they keep people safe during normal work and they confirm that safety functions are doing what the safety case says they will do. For microreactors, the challenge is not only radiation physics, but also compact layouts, short distances between work areas, and the need for clear alarms that match real operational decisions.
Foundations of Radiation Monitoring
Start with what you measure and why. Personnel monitoring focuses on dose, while environmental monitoring focuses on release pathways and trends. A practical rule is to align each measurement with a specific action: if a reading changes, someone should know whether to stop work, adjust access, or investigate.
Dose monitoring is typically split into:
- External dose from gamma and neutron fields.
- Internal dose from inhalation or ingestion, which is why air sampling and contamination control matter.
Environmental monitoring is split into:
- Airborne releases using stack or area sampling.
- Liquid pathways using tank, drain, and effluent sampling.
- Surface contamination using wipe tests and fixed detector checks.
Personnel Monitoring Architecture
A robust personnel monitoring setup uses layered measures rather than a single “magic sensor.” The layers are:
- Area monitoring to control access and verify shielding performance.
- Personal dosimetry to quantify individual dose.
- Contamination monitoring to prevent spread of contamination.
- Work controls that translate readings into procedures.
Area monitors should be placed where people actually stand and where shielding boundaries are crossed. For example, if maintenance requires passing through a corridor to reach a service hatch, place a monitor at the corridor entrance and another near the hatch access point. This catches both general radiation fields and localized streaming.
Personal dosimetry should match the expected radiation types. If the dominant field is gamma, a dosimeter designed for photon response is appropriate. If neutrons are relevant, include neutron-sensitive elements and ensure calibration covers the energy range expected for the reactor spectrum.
Contamination monitoring should be practical for glove-and-sleeve work. A common approach is a portal or handheld survey meter workflow: survey hands and footwear after removing protective gear, then repeat after any task that could disturb surfaces.
Alarm Philosophy and Human Factors
Alarms are only useful if they are actionable. Use three thresholds:
- Informational alarms for early awareness.
- Operational alarms that trigger procedural steps.
- Safety alarms that require immediate protective action.
Example: if an area monitor near a service hatch rises above the operational threshold, the procedure might require pausing work, verifying shielding position, and re-surveying before resuming. If it rises above the safety threshold, the procedure might require evacuation of the controlled area and notification of the radiation protection lead.
To avoid alarm fatigue, define alarm logic so that one physical event does not create multiple redundant alarms. For instance, if a contamination monitor indicates a surface issue, suppress unrelated dose-rate alarms that are known to be insensitive to that specific condition.
Environmental Monitoring and Release Pathways
Environmental monitoring should be tied to pathways, not just locations. A release pathway is a chain: source term, transport mechanism, and sampling point.
- Airborne pathway example: If there is a ventilation exhaust from a controlled area, sample at the exhaust and compare to baseline. Also monitor differential pressure and filter status so you can interpret changes.
- Liquid pathway example: If there are sumps or process drains, sample at the lowest practical point before any dilution. Track flow rate so concentration changes are not misread as release changes.
- Surface pathway example: If contamination could be spread during component handling, perform wipe tests on high-contact surfaces and on “shadow” areas that are hard to see.
A simple but effective practice is to maintain a baseline period during commissioning. Then, during operations, compare current readings to baseline using predefined acceptance ranges.
Mind Map: Monitoring System Coverage
Example Workflow for a Maintenance Task
Consider a routine task that requires opening a service hatch in a controlled area.
- Pre-job checks: verify area monitor status, confirm dosimetry is worn correctly, and check contamination monitors are operational.
- During access: maintain controlled-area boundaries; if an area monitor changes, pause and verify shielding position.
- Post-job checks: survey hands, tools, and footwear; perform a targeted wipe on the hatch rim and any surfaces likely to be touched.
- Record and interpret: log readings, compare to baseline or expected ranges, and document any deviations with the immediate corrective action.
This workflow keeps the monitoring system from being a passive display. Each reading is connected to a decision, and each decision leaves a trace that radiation protection can review later.
Verification, Calibration, and Quality Control
Monitoring systems must be trustworthy under the conditions they will face. That means:
- Calibration at appropriate intervals and after maintenance.
- Functional checks before shifts or critical tasks.
- Drift tracking so small changes are noticed before they become misleading.
A practical quality control habit is to define acceptance criteria for each check and to require that operators document pass/fail outcomes. If a monitor fails a functional check, the procedure should specify whether work stops immediately or whether alternative controls are used while the monitor is repaired.
7.5 Waste Handling Radiation Controls and Decontamination Planning
Waste handling in microreactor operations is mostly about controlling two things: where radiation can go and how contamination can spread. The practical goal is simple—keep dose to workers and the public as low as reasonably achievable while ensuring waste is classified, packaged, and documented correctly.
Foundational Concepts for Radiation Controls
Start with the two-layer model used in day-to-day planning.
-
External exposure control: reduce time near sources, increase distance, and use shielding. For example, if a technician must inspect a component with residual gamma activity, the work order should specify a maximum time window and the required shielding configuration.
-
Contamination control: prevent radioactive material from leaving controlled areas. This is managed through barriers, controlled airflow where applicable, contamination surveys, and disciplined tool handling.
A useful operational rule is to treat every item leaving a controlled area as potentially contaminated until surveys prove otherwise. That mindset prevents “it looks clean” errors.
Waste Stream Mapping and Classification
Before any decontamination plan exists, identify waste streams by origin and expected contamination type.
- Solid waste: wipes, gloves, filters, disposable tools, contaminated packaging.
- Liquid waste: decontamination rinses, floor wash water, coolant residues from maintenance.
- Gaseous waste: off-gas from systems with filtration or controlled venting.
Classification should be tied to measurable criteria such as contamination levels, radionuclide identity when known, and physical form. For an easy example, a set of used protective gloves from a routine inspection is handled as solid potentially contaminated waste until wipe tests confirm whether it meets release or disposal thresholds.
Radiation Control Measures for Handling and Packaging
Controls should be designed around the highest-risk step: moving waste from where it is generated to where it is stored.
- Controlled area boundaries: define entry/exit points, staging zones, and survey points. A practical layout includes a “dirty staging” area where waste is collected and a “survey station” where items are checked before leaving.
- Survey discipline: use a consistent survey sequence—visual check, contamination wipe or direct survey, record the result, then label. If a survey fails, the item goes back to the decontamination loop rather than being “temporarily” moved.
- Labeling and segregation: label containers with waste category, date, and responsible work order. Segregate by waste type and compatibility; for instance, liquids should not share secondary containment with solids.
- Shielded storage when needed: if residual activity is significant, store in shielded casks or cabinets. Even when shielding is present, plan work so that the technician’s time near the container is minimized.
Decontamination Planning Workflow
Decontamination planning should be systematic and tied to the work scope.
- Define the contamination scenario: surface contamination, embedded contamination, or activated material. A surface wipe removal strategy is not the same as handling activated components.
- Select decontamination method by mechanism:
- For removable surface contamination, use controlled wiping, rinsing, or approved chemical cleaning.
- For stubborn contamination, use mechanical methods only if they do not create additional spread.
- Plan waste generation from decontamination: every cleaning step creates secondary waste (wipes, rinse water, spent solutions). Predefine where those go.
- Set acceptance criteria: specify survey thresholds and the measurement method. For example, a component is considered acceptable for release from a controlled area only after direct survey and/or wipe results meet the defined limits.
- Document the loop: record method, parameters, survey results before and after, and any deviations.
A simple example: after removing a contaminated gasket, the team performs a direct survey, wipes the surface with a defined technique, and records results. If contamination remains above the threshold, they repeat cleaning and re-survey until the acceptance criteria are met.
Mind Map: Waste Handling and Decontamination Controls
Practical Example: From Work Order to Container Release
Consider a maintenance task that requires opening a service panel and removing a contaminated filter.
- The work order specifies the controlled area boundaries, required PPE, and the survey station location.
- After removal, the filter is placed into a labeled container in the dirty staging zone.
- The container is surveyed at the exit point. If contamination is detected on the container exterior, the exterior is cleaned and re-surveyed.
- The filter is then classified based on measured contamination and physical form, and stored in the designated waste area.
- If the filter housing is reusable, decontamination is performed on the housing, followed by acceptance surveys before it returns to general equipment storage.
This sequence works because it prevents “cleanup later” behavior and ensures every handoff has a measurement and a record.
Advanced Details That Prevent Common Failure Modes
- Survey method consistency: changing instruments or technique midstream can invalidate comparisons. Use the same measurement approach for before-and-after results.
- Secondary contamination control: decontamination tools and rinse containers can become contaminated. Treat them as part of the waste stream unless they are surveyed and cleared.
- Container integrity checks: verify lids, seals, and secondary containment before moving waste through traffic areas.
- Human factors in labeling: labels should be legible and placed where they are visible during handling, not only at the time of storage.
When these controls are integrated into the work process, waste handling becomes less about improvisation and more about repeatable steps—boring in the best possible way.
8. Site Engineering and Deployment Logistics
8.1 Site Selection Criteria Including Geotechnical and Flooding Constraints
Choosing a site for a nuclear microreactor is less about finding a “perfect” location and more about proving that the ground and water behavior won’t undermine the safety functions. For portable systems, the site decision also has to match how you will transport, lift, connect, and operate the unit without turning routine work into a scavenger hunt.
Foundational Site Questions
Start with three basics: what loads the unit will see, what water can do to the unit and its services, and what access you need to operate and maintain it.
- Loads: Determine the expected weight of the reactor module plus shielding, support structures, and any attached balance-of-plant equipment. Then confirm the site can handle static loads and dynamic loads from transport staging, lifting operations, and wind.
- Water: Identify flood sources (river, storm surge, rainfall runoff, groundwater rise) and the pathways water could take to reach the module, electrical rooms, heat rejection equipment, and fuel handling areas.
- Access: Verify that roads, crane pads, and laydown areas can support equipment movement and that emergency response routes remain usable during adverse weather.
A practical habit: write these three questions on one page and require every later decision—foundation design, drainage, cable routing—to trace back to them.
Geotechnical Constraints That Actually Matter
Geotechnical work should focus on how the ground will behave under the unit’s footprint and under water exposure.
Soil Strength and Bearing Capacity
You need to know whether the soil can support the foundation without excessive settlement. Excess settlement can misalign piping, stress seals, and complicate maintenance access.
Example: If the module base is supported on a shallow foundation, and the soil has low bearing capacity when saturated, you may need either deeper foundations or a ground improvement plan. The “easy” option is not always the one that survives wet seasons.
Settlement and Differential Movement
Even when total settlement is acceptable, differential settlement can bend structures and strain connections.
Example: Two adjacent foundation pads can settle differently if one sits on fill and the other on native soil. A site with mixed materials often needs either uniform foundation treatment or a design that tolerates small relative movements.
Groundwater and Corrosion Environment
Groundwater affects both bearing behavior and long-term corrosion risk for embedded components.
Example: If groundwater is shallow and seasonal, you may need corrosion-resistant materials, protective coatings, and drainage that keeps the foundation zone from staying wet.
Seismic and Slope Stability
If the site is near slopes, embankments, or areas with known seismic hazard, you must confirm stability under expected shaking and under saturated conditions.
Example: A slope that looks stable during dry months can become unstable after heavy rainfall. Your geotechnical report should explicitly connect slope stability to water conditions, not just dry strength.
Flooding Constraints and Water Pathways
Flooding analysis should treat water as a system: where it comes from, how it flows, and what it touches.
Flood Level and Duration
You need flood elevations and how long the site could remain inundated. Duration matters because equipment cooling, electrical safety, and access routes degrade over time.
Example: A short, shallow flood might not reach the module, but it could flood switchgear and cable trenches, forcing shutdown and cleanup.
Inundation Pathways
Water can reach the module through surface flow, storm drains, culverts, groundwater seepage, or overtopping of berms.
Example: A berm that blocks surface water may still allow seepage through the foundation zone if drainage is inadequate. That’s why drainage design and geotechnical design should be reviewed together.
Drainage, Culverts, and Backflow
Confirm that drainage systems can handle rainfall intensity and that culverts won’t backflow during high external water levels.
Example: If a site relies on a low-lying ditch, a culvert can become a “reverse funnel” during river flooding. Backflow prevention and pump capacity should be sized to the same flood scenario used for the site elevation decision.
Integrated Decision Mind Map
Mind Map: Site Selection Logic
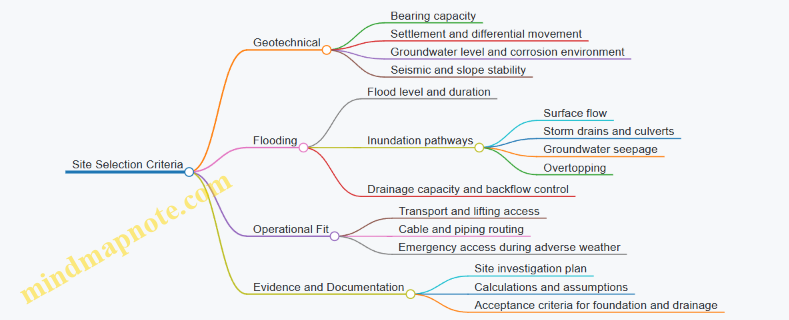
Practical Site Screening Workflow
- Collect baseline site data: topography, drainage map, known flood history, soil borings plan, and access constraints.
- Define the module footprint and service zones: separate the reactor module area from electrical, heat rejection, and fuel handling zones.
- Run a combined water-ground review: check whether the same water scenario that drives flooding also drives groundwater rise and saturation.
- Set acceptance criteria: specify allowable settlement, allowable flooding reach for each zone, and required drainage performance.
- Plan verification: confirm that the final design assumptions match what the site investigation can support.
Example: If the acceptance criterion says the electrical zone must remain above the flood level for the design duration, then drainage and backflow controls must be validated for that same duration, not just for peak water height.
Example: Two Candidate Sites Compared
- Site A: Higher elevation but with shallow groundwater and clay fill under part of the footprint. Flooding may not reach the module, but saturation could increase settlement risk and affect foundation alignment.
- Site B: Slightly lower elevation but well-drained native soil and robust culverts with backflow prevention. Flooding might reach peripheral areas, yet the module and electrical zone can be kept dry with controlled drainage.
The winner is the site where the combined geotechnical and flooding evidence supports the safety-relevant functions and keeps installation and maintenance practical.
8.2 Foundations Lifting and Transport Interfaces for Modular Units
A modular microreactor unit is only as deployable as its interfaces. Foundations determine whether loads land where the design expects them; lifting and transport interfaces determine whether the unit arrives intact and can be set without forcing alignment. The goal is simple: predictable geometry, controlled load paths, and repeatable procedures.
Foundations That Accept Loads Without Surprises
Start with the load cases you must support: static weight, dynamic transport loads, lifting reactions, seismic or wind loads where applicable, and thermal effects from operation. Best practice is to define a “foundation envelope” early: allowable settlement, maximum tilt, and surface flatness at the bearing pads. For example, if the module uses four bearing skids, specify the maximum differential height between pads so the module frame does not twist during setdown.
Next, plan for interfaces between foundation and module. Use keyed features or dowel locations to control lateral position. If the module relies on grout, define grout thickness tolerances and curing time in the installation procedure. A practical example: when grout thickness varies, the module can end up slightly rotated, which then forces later alignment work on piping and electrical terminations.
Lifting Interfaces That Control Load Paths
Lifting interfaces include lifting trunnions, lifting lugs, spreader bars, and attachment points for hydraulic jacks. The key concept is that lifting hardware must transfer load into the module frame, not into thin-walled components. Mark lifting points with load ratings and permitted lift angles. A good procedure includes a pre-lift checklist: verify center of gravity assumptions, confirm spreader bar geometry, and ensure no lifting point is overloaded due to sling angle.
Example: if the module is lifted with two-point slings, the sling angle changes the load share. A simple calculation in the lift plan prevents “looks fine” rigging. Also specify temporary restraints for components that could shift during lift, such as loose covers or removable shielding blocks.
Transport Interfaces That Protect Geometry
Transport interfaces cover how the module is secured to trailers or skids, how shock and vibration are managed, and how you prevent relative motion between module and support frame. Use transport saddles that match the module’s structural bearing points. Avoid clamping on surfaces that are meant to be sealed or radiologically controlled.
A practical example is the use of adjustable transport supports. If the module frame must remain within a tight tolerance on flatness, then transport supports should be set using the same reference points used at installation. That way, you reduce the chance that the module arrives “straight enough” only after you spend time correcting it.
Systematic Interface Mapping
Treat the module as a set of interface layers: structural, mechanical, thermal, electrical, and safety-related. For each layer, list the physical interface points and the acceptance criteria. This prevents the classic mismatch where the unit is structurally seated but electrical connectors cannot mate without stress.
Mind Map: Systematic Interface Mapping
Example Workflow for Installation Readiness
- Survey and mark foundation reference points, then measure flatness and pad heights. If you exceed tolerance, correct before any module movement.
- Assemble lifting rigging using only approved attachment points, then perform a dry run with minimal lift to confirm balance.
- Transport the module on saddles aligned to the same reference points used for installation.
- Set the module onto bearing pads, confirm seating contact, and verify tilt and position before tightening any interface fasteners.
- Only after structural acceptance, proceed to mechanical and electrical mating so you do not “pull” interfaces into alignment.
Case Study:
A remote site had tight crane access and limited laydown space. The team used a foundation envelope with strict pad height tolerances and keyed dowels for lateral position. During lifting, they used a spreader bar with fixed geometry to keep sling angles within limits. After setdown, they verified tilt before connecting the process piping. This avoided a later rework cycle where misalignment would have forced gasket replacement and delayed commissioning.
8.3 Installation Sequencing and Commissioning Readiness Checks
A good installation sequence prevents the classic problems: rework from wrong interfaces, missing documentation at the worst moment, and commissioning tests that fail because the site is not ready. The goal is simple: make every prerequisite true before you start the next step.
Foundational Sequencing Principles
Start with boundaries. Define what “installed” means for each system: mechanical set, electrical termination, instrumentation calibration, and functional verification. Then sequence by dependency, not by convenience. For example, you cannot commission heat rejection if the cooling loop is not pressure-tested and instrumented.
A practical rule is to group work into four lanes that run in parallel but synchronize at clear gates:
- Mechanical readiness: foundations, lifting, alignment, penetrations, and leak checks.
- Electrical and control readiness: power distribution, grounding, cabling, I/O mapping, and safety system wiring verification.
- Thermal and process readiness: heat sink connections, valves, flow paths, insulation, and test instrumentation.
- Administrative readiness: procedures, permits, test plans, traceability, and sign-offs.
Installation Sequencing Workflow
-
Site preparation and interface verification
Confirm foundation elevations, anchor patterns, and embedded items before the module arrives. A quick example: if the anchor template is off by even a few millimeters, you may spend days “fixing” alignment with shims that later complicate sealing and inspection. -
Module placement and mechanical completion
Use a lifting plan that matches the module’s center of gravity and includes weather limits. After set-down, perform alignment checks, torque verification, and seal integrity checks for penetrations. -
Utilities and heat path installation
Install and verify the heat rejection path early. For a remote site, a common pitfall is assuming the cooling water supply will be available on schedule. Instead, verify the water quality, filtration approach, and flow measurement locations before commissioning. -
Electrical termination and grounding
Terminate cables with correct labeling and routing. Verify grounding continuity and insulation resistance. Example: if a sensor cable is routed near power conductors without separation, you may see noisy signals that look like process instability during commissioning. -
Instrumentation calibration and functional checks
Calibrate sensors to the required uncertainty and confirm signal direction and scaling. Then run “dry” functional checks: alarms trigger, interlocks block outputs, and safety channels respond as designed. -
System integration and pre-commissioning tests
Perform integrated tests without initiating full power operations. Validate valve actuation, pump start/stop logic, flow permissives, and data logging.
Commissioning Readiness Gates
Commissioning readiness checks should be staged so you can stop early with clear reasons.
Gate A: Documentation and traceability
- Approved installation drawings and as-built records plan.
- Test procedures and acceptance criteria ready for each system.
- Calibration certificates and instrument lists match the control system configuration.
Gate B: Safety function readiness
- Safety system wiring verification completed.
- Interlock logic reviewed against the safety case design basis.
- Proof tests scheduled with defined pass/fail thresholds.
Gate C: Thermal and flow readiness
- Heat sink loop pressure and leak tests complete.
- Flow measurement devices installed and verified.
- Insulation and heat tracing installed where required.
Gate D: Control system readiness
- I/O mapping validated from field to control cabinet.
- Alarm setpoints and trip thresholds confirmed.
- Cybersecurity controls and access procedures verified for operational use.
Gate E: Operational readiness
- Staffing and shift handover procedures tested.
- Emergency response equipment staged and checked.
- Work permits and controlled area boundaries verified.
Mind Map: Installation Sequencing and Commissioning Readiness Checks
Example: A Readiness Checklist That Prevents Rework
Imagine commissioning is scheduled for a specific week. Two days before, you discover that a flow sensor was installed but not wired to the correct channel. If you had run Gate D I/O mapping validation earlier, you would have caught it during installation rather than during commissioning. The fix then is not “debugging under time pressure,” but correcting a known mismatch with traceable evidence.
Example: Sequencing a Heat Path Before Control Tuning
If you tune control loops before the heat rejection loop is pressure-tested and instrumented, you may tune to a signal that later changes due to flow instability. A better sequence is to complete Gate C first, then proceed to control tuning and integrated tests. The commissioning team gets stable inputs, and the acceptance criteria mean what they say.
8.4 Utilities Requirements Including Water Electrical and Data Links
Portable microreactors still need “boring” utilities to behave like reliable power plants. This section treats utilities as three coupled systems: water for heat removal and process needs, electrical for starting and control, and data links for monitoring and safe operation. The goal is to define what must be available, what can be buffered, and what must be fail-safe.
Foundational Utility Roles and Interfaces
Start by separating utilities into functional roles:
- Heat removal role: water circuits that carry heat from the reactor’s thermal path to a sink (cooling tower, river intake, air cooler loop, or industrial process heat exchanger).
- Process role: water used directly for steam generation, hot water loops, or demineralized make-up.
- Electrical role: power for pumps, valves, instrumentation, control computers, and battery chargers.
- Data role: communications for operator displays, historian logging, remote support, and safety system status reporting.
A practical best practice is to draw a single “utility boundary” diagram for the deployment package. For example, label which valves and pumps are inside the microreactor skid versus which are site-supplied. If a site-supplied valve fails closed, does the system still reach a safe state? Answering that early prevents late surprises.
Water Requirements Including Quality and Flow
Water needs are usually split into primary cooling and secondary or process circuits.
Primary cooling typically demands stable flow and predictable temperature rise. A simple check is to compute the allowable temperature increase across the heat exchanger using:
- Required heat transfer = reactor thermal output × fraction to that circuit
- Temperature rise = heat transfer ÷ (water flow × specific heat)
If the site water supply is seasonal, plan for a buffer: a recirculation tank or a controlled bypass strategy that maintains minimum flow to safety-relevant heat removal paths.
Water quality matters because scaling and corrosion can reduce heat transfer and foul small passages. A straightforward approach is to define target ranges for:
- Conductivity and dissolved solids for make-up water
- pH and alkalinity for corrosion control
- Suspended solids for filtration sizing
Example: If the site uses river water, install strainers sized for the worst expected debris load and specify a cleaning interval tied to differential pressure. That turns “we’ll clean it when it looks dirty” into an operational rule.
Electrical Requirements Including Starting Power and Protection
Electrical utilities include both AC power and DC power. Even when the microreactor produces electricity, you still need power for:
- control system operation
- safety instrumentation power supplies
- pump and valve actuation during startup and transitions
A robust design specifies a power availability ladder:
- normal site AC supply (if used)
- on-site generation or microgrid connection
- battery-backed control power
- emergency power for essential loads
Best practice: define “essential loads” by function, not by device count. For instance, “keep heat removal pumps commanded and monitored” is clearer than “keep pump A and B powered.”
Protection coordination should be planned as a system. Use selective breakers and clear fault isolation so a short circuit in a nonessential auxiliary circuit does not trip safety-critical loads. Example: If a workshop outlet circuit faults, the reactor control cabinet should remain powered and continue to log safety status.
Data Links Including Safety Separation and Operational Logging
Data links serve two audiences: operators and safety functions. Safety-related signals must not depend on nonessential networks.
A practical rule is to separate data into:
- Safety status data: reactor protection state, trip confirmations, and safety function health indicators
- Operational data: temperatures, flows, valve positions, power conversion metrics
- Maintenance data: vibration, pump hours, filter differential pressure, and calibration history
Best practice: implement a “minimum viable telemetry” set for remote monitoring. Example: If the site loses the full network, the system should still provide a compact status view over a resilient channel, while local displays remain authoritative.
Mind Map: Utilities Requirements and Their Checks
Integrated Example: Remote Site with Limited Water and Intermittent Power
Assume a remote industrial site with intermittent grid power and river water. The deployment plan specifies:
- A recirculation tank sized to maintain minimum cooling flow during short water intake interruptions.
- Strainers with a differential pressure alarm that triggers cleaning when ΔP exceeds a set threshold.
- A battery-backed control bus sized for safe shutdown and heat removal command continuity.
- A selective breaker scheme so faults in nonessential workshop circuits do not drop control power.
- A two-tier data approach: local safety status is always available on-site, while remote monitoring receives a reduced telemetry set over a resilient link.
The integrated reasoning is simple: water stability prevents thermal surprises, electrical stability prevents control surprises, and data separation prevents safety surprises. When these three utilities are treated as one system, commissioning becomes a checklist rather than a scavenger hunt.
8.5 Operational Readiness Documentation and Turnover Procedures
Operational readiness documentation is the bridge between “the unit works in tests” and “the unit works on a real site with real people.” Turnover procedures make that bridge repeatable, auditable, and boring in the best possible way.
Operational Readiness Documentation
Readiness Package Purpose and Scope
A readiness package answers three questions: What is installed, what is verified, and who is responsible for what. Keep the scope tight: include only documents needed to operate, maintain, and respond to abnormal conditions.
Example: A remote mine site receives a microreactor module. The package includes the installed configuration record, the approved operating limits, the alarm response guide, and the maintenance plan. It does not include every design drawing from the factory.
Configuration and As-Built Records
Start with an as-built configuration baseline. Capture reactor module identity, serial numbers, firmware/software versions, setpoints, sensor calibration dates, and any site-specific modifications.
Best practice: Use a single “configuration index” page that points to each controlled document. If a sensor is replaced, the index updates and the old calibration record is clearly marked superseded.
Verified Operating Limits and Setpoints
List the operational envelope in plain language: allowable power range, heat rejection constraints, minimum instrumentation requirements, and any interlocks that must remain active.
Example: If the unit requires a minimum cooling flow to maintain thermal margins, the readiness package states the minimum flow, the acceptable measurement method, and the action if flow drops.
Safety Function Evidence Summary
Provide a concise evidence map: which safety functions exist, what triggers them, and what verification supports each function.
Best practice: Include a “safety function checklist” that links each safety function to its test record and acceptance criteria.
Procedures for Normal, Abnormal, and Emergency Conditions
Organize procedures by operator intent:
- Normal operation steps and start-up/shutdown sequences
- Abnormal condition responses (alarms, degraded modes)
- Emergency actions (protective actions, evacuation triggers, communications)
Example: For an alarm indicating loss of a non-safety sensor, the procedure specifies whether the unit can continue, what compensating measurement is used, and how long the operator may operate before maintenance is required.
Training Records and Competency Sign-Off
Document who is authorized to operate and who is authorized to perform maintenance. Include training completion, simulator or supervised operating hours, and sign-off for each role.
Best practice: Require role-based authorization. A technician may be competent for maintenance but not for approving configuration changes.
Maintenance Readiness and Spare Parts Availability
Confirm that preventive maintenance tasks have assigned owners, schedules, and required tools. List critical spares with reorder thresholds and storage conditions.
Example: If a specific valve actuator is known to be a common replacement item, the readiness package states the expected service interval, the spare part number, and the acceptance test after replacement.
Turnover Procedures
Handover Roles and Responsibilities
Define the boundary between commissioning and operations. Typical roles include commissioning lead, operations supervisor, safety officer, maintenance lead, and control room operator.
Best practice: Use a responsibility matrix that assigns each document and each procedure to a named role.
Acceptance Criteria and Walkdown Sequence
Turnover should include a structured site walkdown: physical checks, instrumentation verification, control system checks, and final functional tests.
Example: During walkdown, verify cable labeling matches the configuration index, confirm sensor mounting torque records exist, and check that alarm setpoints in the control system match the approved list.
Control System and Data Integrity Checks
Before operations begin, verify that logging is enabled, time synchronization is correct, alarm routing works, and operator displays match the approved control philosophy.
Best practice: Perform a “paper-to-screen” check: each required alarm has a corresponding display and response procedure.
Communications and Escalation Paths
Establish who gets notified, how quickly, and what information must be included. Include escalation for both technical issues and safety-significant events.
Example: If a safety-related interlock trips, the escalation path requires the operator to record the trip time, the active alarms, and the immediate operator actions before notifying the safety officer.
Final Briefing and Controlled Release to Operations
Conduct a final briefing that covers: current configuration, verified limits, active maintenance constraints, and the exact start date/time for operational authority.
Best practice: Require sign-off that the readiness package is complete and controlled, not “mostly done.” If something is missing, operations authority is delayed until the gap is resolved.
Mind Map: Operational Readiness Documentation and Turnover Procedures
Example: Readiness Checklist Snapshot
A practical checklist for the first day of operations includes: configuration index completed, operating limits posted in the control room, safety function checklist signed, alarm response procedures accessible at the console, training sign-off for each operator role, and confirmation that critical spares are on site.
Example: Turnover Day Flow
- Morning walkdown and document cross-check
- Control system integrity verification and alarm routing test
- Functional test evidence review against acceptance criteria
- Final briefing and sign-off for operational authority
- Start of operations with a recorded baseline log entry
9. Operations and Maintenance for Microreactor Fleets
9.1 Staffing Models Training Requirements and Competency Management
A microreactor’s staffing plan should match the plant’s operational reality: most work is routine, but the few non-routine moments must be handled correctly under time pressure. Competency management is the system that keeps those rare moments from becoming “we’ll figure it out” moments.
Core Roles and Coverage Model
Start with a coverage model that answers three questions: Who operates, who maintains, and who verifies safety functions? For a remote site, assume limited on-site personnel and define what must be done locally versus what can be supported remotely.
A practical baseline staffing set includes:
- Shift Operator: monitors reactor and balance of plant, performs controlled startup/shutdown steps, and responds to alarms.
- Maintenance Technician: performs preventive maintenance, component swaps, and basic troubleshooting within defined work packages.
- Safety and Systems Engineer: owns safety function definitions, reviews test results, and approves changes that affect safety.
- Radiation Protection Lead: manages controlled areas, dosimetry program, and work planning for radiation tasks.
- Quality and Configuration Coordinator: ensures procedures, drawings, and software versions match the approved configuration.
For remote deployments, define a two-layer response: on-site personnel handle immediate stabilization and safety actions; a second layer provides technical guidance and documentation interpretation.
Training Pathway from Fundamentals to Task Authorization
Training should be staged so that knowledge grows into authorization. A common mistake is to train people on everything at once, then test them on details they never used. Instead, align training with the tasks they will actually perform.
- Foundational training covers reactor basics, radiation fundamentals, and site emergency expectations. Example: an operator learns what “reactivity control” means in plain terms and practices recognizing abnormal trends in power and temperature.
- Systems training focuses on the specific microreactor configuration. Example: a technician learns the heat removal path and practices identifying which valves and pumps belong to normal versus safety heat removal.
- Procedure training uses the exact work instructions the person will follow. Example: shift operators run a simulator session using the site’s startup checklist, including how to verify interlocks before proceeding.
- Task authorization grants permission only after demonstrated competence. Example: radiation protection staff are authorized to approve work packages only after they can correctly estimate dose drivers and set access controls.
Competency Matrix and Evidence-Based Qualification
Competency management works best when it is measurable. Use a competency matrix that links each role to required competencies, training modules, and evidence.
Evidence types should be varied so competence is not just “test-day knowledge.” Examples of evidence:
- Simulator performance for abnormal alarm sequences.
- Procedure walkthroughs where the trainee explains the “why,” not only the “what.”
- Observed work execution for maintenance tasks using controlled work packages.
- Independent checks for safety-critical steps, such as verifying interlock status.
Alarm Handling and Shift Handover Competency
Operators need a repeatable approach to alarms. Training should include a structured response: confirm the alarm, identify the affected system, check for common-cause indicators, and then follow the procedure.
Example scenario: an alarm indicates a temperature rise in the heat exchanger inlet. The operator practices distinguishing whether it is a measurement issue (sensor plausibility checks) or a process issue (flow and pump status), then selects the correct procedure branch.
Shift handover competency should be treated like a safety function. Require a standardized handover format that includes current operating state, active work, known deviations, and pending procedure steps.
Example: if a maintenance task is paused due to a minor leak check, the outgoing operator records the exact valve positions, the test result summary, and the next verification step so the incoming operator does not restart from assumptions.
Recertification, After-Change Training, and Competency Maintenance
Competency decays when people stop using skills. Recertification should be scheduled based on role criticality and how often tasks occur.
- Periodic re-tests for safety-critical actions, such as controlled shutdown and emergency heat removal initiation.
- After-change training whenever procedures, software, instrumentation mappings, or safety function logic changes. Example: if an alarm threshold is updated, operators must demonstrate they can interpret the new alarm meaning and follow the updated response steps.
- On-the-job refreshers for maintenance tasks that are infrequent. Example: technicians perform a supervised mock replacement of a non-safety component using the same tools and torque/verification steps.
Practical Implementation Checklist
To make the system work on real sites, manage it like a living document set:
- Maintain a role-based competency matrix.
- Track training completion and authorization status.
- Require evidence capture for each authorization.
- Review competency performance after drills and procedure deviations.
- Ensure handover and alarm response practices are included in assessments.
When staffing and training are connected through authorization and evidence, the organization can scale from one deployment to many without turning competence into a hope-based activity.
9.2 Routine Operations Surveillance and Performance Monitoring
Routine operations surveillance is the day-to-day practice of proving that the microreactor is behaving as designed. Performance monitoring is the same idea, but focused on trends: not just whether a parameter is within limits right now, but whether it is drifting toward an edge. The goal is simple—catch problems early enough that corrective actions are boring, not heroic.
Foundational Concepts for What You Watch
Start with three layers of evidence.
- Safety function status: Are the systems that protect the reactor available and responding correctly? Examples include scram actuation readiness, heat removal path availability, and reactivity control system health.
- Process health: Are the thermal and electrical paths behaving normally? Examples include coolant temperature profiles, heat exchanger differential pressures, and generator output stability.
- Condition indicators: Are there early signs of wear, fouling, or sensor issues? Examples include pump vibration trends, valve stroke time changes, and instrument calibration drift.
A practical rule: every monitored variable should map to a reason. If you cannot explain why a measurement matters, it probably belongs in a log, not in an alarm.
Monitoring Architecture and Data Discipline
A typical monitoring setup separates safety-related and operational data streams.
- Safety-related monitoring emphasizes availability, state, and response. It should be conservative about thresholds and clear about what action is required.
- Operational monitoring emphasizes performance and trend. It can use wider bands and statistical methods, as long as it cannot mask safety limits.
Data discipline prevents false confidence. Use consistent units, time synchronization, and clear naming conventions. For example, record temperatures with a defined reference point and sensor ID, not just “T1.” If a sensor is replaced, treat it as a new instrument for trend baselines.
Surveillance Routines That Actually Work
Routine surveillance is usually a mix of continuous monitoring and periodic checks.
Continuous monitoring should cover:
- Reactor power and heat removal indicators
- Coolant or primary loop temperatures and flow proxies
- Electrical output and protection trips
- Key alarms and interlocks status
Periodic checks should cover:
- Calibration verification for critical sensors
- Visual inspections of accessible components
- Functional tests of non-safety actuators that influence performance
- Review of maintenance actions and their effect on trends
A good example is pump performance surveillance. If pump vibration rises while flow proxy drops and differential pressure increases, you likely have partial blockage or bearing wear. The corrective action is not “wait and see”; it is to follow the maintenance decision path tied to those indicators.
Performance Metrics and How to Interpret Them
Use metrics that connect directly to physics and engineering constraints.
- Thermal margin indicators: Compare measured temperatures and heat transfer effectiveness against conservative limits.
- Heat exchanger health: Track differential pressure and approach temperature. If approach temperature worsens while differential pressure rises, fouling is a likely culprit.
- Electrical stability: Track frequency, voltage regulation behavior, and protection events. A pattern of near-miss protection trips is often a control tuning or load interface issue.
Interpretation should include sensor sanity checks. If two redundant sensors disagree, do not average them blindly. Instead, verify plausibility using nearby measurements. For instance, if one temperature sensor jumps but flow and other temperatures remain steady, suspect the sensor before suspecting the core.
Mind Map: Routine Surveillance and Performance Monitoring
Example: Turning Trends into Corrective Actions
Assume the microreactor is operating steadily and the daily report shows:
- Differential pressure across a heat exchanger has increased by 15% over two weeks.
- Approach temperature has increased by 8% over the same period.
- Pump vibration shows a gradual rise, but flow proxy remains within normal bounds.
A systematic response is:
- Confirm sensor plausibility by checking related temperatures and flow proxies for consistency.
- Compare the trend against the defined maintenance trigger thresholds for heat exchanger performance.
- Schedule a maintenance window to inspect for fouling or partial blockage.
- After maintenance, re-baseline the approach temperature and differential pressure so the next trend has a clean starting point.
This approach keeps the work grounded: you are not reacting to a single number, and you are not ignoring a pattern.
Example: Handling Sensor Disagreement Without Guessing
If redundant temperature sensors disagree by more than the allowed tolerance, treat it as a measurement integrity issue until proven otherwise.
- Check whether the disagreement correlates with any maintenance activity or known sensor events.
- Compare the outlier sensor to nearby temperatures and to heat exchanger approach temperature.
- If the outlier is inconsistent with the rest of the thermal picture, flag the sensor for calibration verification or replacement.
The key is to protect decision quality. Surveillance is not just collecting data; it is ensuring the data is trustworthy enough to drive action.
9.3 Preventive Maintenance Planning for Compact Components
Preventive maintenance (PM) for microreactors is less about “more wrenching” and more about timing the right checks before small degradations become safety-relevant. Compact components compress space, shorten heat paths, and concentrate interfaces, so PM plans must be explicit about what you inspect, how you measure, and what you do when results drift.
Foundational Goals and Boundaries
PM planning starts with three goals: (1) preserve safety functions, (2) maintain performance margins, and (3) keep maintainability predictable. For example, if a heat exchanger fouls, the reactor may still be safe, but the system could lose margin for heat removal during abnormal conditions. A good PM plan therefore ties each maintenance task to a measurable parameter and a decision threshold.
A practical boundary rule: never treat “maintenance” as a substitute for design verification. If a component’s failure mode is not understood well enough to set thresholds, the PM plan should include an evidence-building step (such as additional measurements during the next outage) rather than guessing.
Component Inventory and Criticality Mapping
Create a compact-component inventory that includes: function, operating environment, interfaces, failure modes, and inspection accessibility. Then rank components by criticality using a simple matrix: safety impact, performance impact, and detectability.
Example: A compact pump that drives coolant flow has high performance impact and may have moderate detectability because vibration trends can be subtle. In contrast, a valve position sensor might have lower performance impact but high safety relevance if it feeds safety logic. PM frequency should reflect both impact and how early you can detect degradation.
Maintenance Strategy Selection
Use a layered strategy:
- Time-based checks for items with known wear-out patterns.
- Condition-based monitoring for items where trends reveal degradation.
- Event-based actions after abnormal transients, maintenance work, or component replacements.
Example: For a heat exchanger, time-based cleaning might be risky if fouling depends on water chemistry. A better approach is condition-based monitoring using differential pressure and heat transfer effectiveness, with a scheduled inspection window to verify the instruments.
Task Design with Clear Acceptance Criteria
Each PM task should specify: task steps, required tools, measurement method, acceptance criteria, and documentation. “Acceptance criteria” should be numeric when possible.
Example: For a gasketed flange, define a torque verification method and a leak test criterion. If the plan only says “check for leaks,” you will get inconsistent outcomes across shifts and sites.
A helpful trick: write the task so a new technician can perform it without improvising. If a step depends on judgment, define the judgment inputs (for instance, allowable vibration band and how to interpret spectra).
Outage Planning and Work Sequencing
Compact systems often require careful sequencing because access is limited and components share thermal and mechanical constraints. PM planning should include a work order that respects dependencies: isolate energy sources, verify safe states, perform inspections, then execute any corrective actions.
Example: If you must inspect a cable run near a heat exchanger, do it before you disturb nearby shielding or conduit supports. Otherwise, you may create new alignment or routing issues that later look like “mysterious” faults.
Mind Map: Preventive Maintenance Planning Flow
Condition Monitoring That Actually Helps
Condition monitoring should be tied to specific degradation mechanisms. For compact components, common measurable signals include temperature differentials, pressure drops, vibration signatures, and actuator response times.
Example: If a control valve response time increases, it may indicate sticking or actuator wear. A PM plan can include a periodic “response time test” and a corrective trigger when response exceeds a defined band. The key is to separate sensor drift from real mechanical change by cross-checking with at least one independent measurement.
Corrective Action Triggers and Escalation Paths
PM plans must state what happens when results exceed thresholds. A simple escalation ladder works well:
- Minor deviation: re-measure and verify instrument health.
- Confirmed deviation: schedule targeted inspection or component service.
- Safety-relevant deviation: follow safety procedures and place the system in the appropriate operational state.
Example: If differential pressure across a compact heat exchanger rises beyond the “watch” threshold, you might first confirm sensor calibration. If it remains high after verification, you schedule inspection of flow passages and consider cleaning during the next outage.
Documentation and Traceability
Finally, PM planning must include traceability: what was measured, by whom, with what calibration status, and what decision was made. This matters because compact designs make it harder to “hide” uncertainty. When you can’t explain a change in performance, you need a record trail to find whether it came from the component, the measurement, or the operating conditions.
A well-run PM plan reads like a checklist with reasons: every task exists because a specific degradation pathway can be detected early enough to act without compromising safety or reliability.
9.4 In Service Inspection Methods and Acceptance Criteria
In-service inspection is where design intent meets reality. The goal is simple: confirm that the microreactor’s barriers, cooling paths, and monitoring functions still perform as assumed, and that any wear or degradation stays within defined limits. The inspection program should be systematic enough to repeat across units, yet flexible enough to respond to what the unit actually shows.
Core Inspection Philosophy
Start with three questions for every inspection activity: What could fail? What would it change in measurable terms? How will we decide the unit is still acceptable?
A practical way to structure this is to treat each inspection as a chain:
- Target: a component or function (for example, heat exchanger tube integrity).
- Mechanism: how it could degrade (for example, corrosion, fouling, vibration wear).
- Observable: what you can measure (for example, pressure drop trend, leak test results).
- Acceptance Criterion: the pass/fail boundary tied to safety and performance.
- Action: what happens if you fail (for example, isolate, repair, or schedule deeper inspection).
Inspection Methods by System and Function
Reactor and heat removal boundary. For compact systems, the most important inspection targets are the paths that remove heat and the barriers that prevent leakage. Methods commonly include visual checks where accessible, nondestructive testing where geometry allows, and leak integrity tests at defined intervals.
Example: If a shell-and-tube heat exchanger is part of the heat removal chain, you can track secondary-side pressure drop during operation. A rising trend can indicate fouling, while a sudden change can indicate blockage or damage. Acceptance criteria should specify both an absolute limit and a rate-of-change limit so you catch both slow degradation and abrupt events.
Instrumentation and control. Sensors and actuators are inspected to ensure they still measure and respond correctly. Typical methods include calibration checks, functional tests of alarms and interlocks, and verification of signal plausibility.
Example: During a routine inspection, you can compare redundant temperature sensor readings. If the difference exceeds the allowed band for more than a defined duration, the criterion fails and the unit either switches to the validated sensor set or enters a controlled operating state until resolved.
Containment and confinement. Even when the design relies on robust barriers, you still verify that seals, penetrations, and ventilation paths remain within specification. Methods include seal integrity checks, airflow verification, and inspection of gasket condition where permitted.
Example: For a confinement boundary with monitored pressure, acceptance criteria can require that pressure decay rates remain within a defined range after a controlled isolation test.
Acceptance Criteria That Engineers Can Actually Use
Acceptance criteria should be written so a technician can apply them without interpreting the intent. Each criterion should include:
- Metric: what is measured.
- Limit: the maximum or minimum allowed.
- Basis: the reason it matters, tied to safety function or performance.
- Test Conditions: operating state, temperature range, and measurement method.
- Uncertainty Handling: how measurement error is accounted for.
A useful pattern is to separate criteria into hard limits and trend limits.
- Hard limits are pass/fail boundaries that directly affect safety margins. Example: leak test results must show no detectable leakage under specified conditions.
- Trend limits are early-warning boundaries that trigger deeper inspection rather than immediate rejection. Example: a gradual increase in heat exchanger pressure drop beyond a threshold requires cleaning or internal inspection.
Mind Map: Inspection and Acceptance Workflow
Example Inspection Package for a Routine Outage
A routine outage inspection can be organized into a checklist with explicit criteria.
1) Heat removal path check
- Measure primary-to-secondary heat exchanger performance indicators.
- Acceptance criterion: pressure drop within the specified band; no abrupt step change since last baseline.
- If not met: perform targeted internal inspection or cleaning plan before returning to full load.
2) Sensor and interlock verification
- Calibrate key temperature and flow sensors.
- Test alarm thresholds and interlock actuation logic.
- Acceptance criterion: measured values within calibration tolerance; interlock response time within specified limit.
- If not met: switch to validated sensor set and correct before resuming normal operation.
3) Confinement boundary verification
- Verify seal condition and perform a controlled isolation test.
- Acceptance criterion: pressure decay rate and recovery behavior within limits.
- If not met: investigate seal/penetration integrity and repeat the test after corrective action.
Documentation and Evidence Mapping
Every inspection result should be traceable to a safety function or performance requirement. A clean approach is to record the configuration state, the measurement method, the acceptance criterion used, and the decision outcome in one place. That way, when a future inspection repeats the same method, you can compare like with like and avoid “mystery differences” caused by changed operating conditions.
Finally, keep a short “why this criterion exists” note in the report. It prevents the common failure mode where teams treat criteria as paperwork instead of as the measurable expression of safety and reliability.
9.5 Maintenance Outage Planning and Restart Procedures
A maintenance outage is a controlled interruption of normal operation, planned so the reactor remains in a safe configuration and the plant returns to service with verified readiness. The goal is simple: do the work, prove the safety functions still work, and then restore power and heat output in a way that matches the site’s actual load.
Outage Planning Foundations
Start with a clear outage boundary: what changes, what stays running, and what is isolated. For example, if you replace a pump in the secondary heat loop, you typically keep instrumentation and safety channels powered while you isolate the affected hydraulic section. Define the maintenance scope in three layers: equipment list, functional impact, and required verification.
Next, build a work-to-safety map. Every task gets a “safety function touchpoint” such as reactivity control, heat removal, confinement, or radiation protection. A practical example: if you open a containment boundary for inspection, you schedule verification of sealing integrity and monitoring coverage before any return to power.
Then plan the outage sequence around dependencies. Many delays come from waiting on access, permits, or calibration. A useful method is to schedule “verification windows” after each major work package, so you catch issues early rather than at restart.
Pre-Outage Readiness Checks
Before the unit is taken down, confirm that the plant can reach and maintain the required safe state. This includes verifying:
- Shutdown system status and trip path integrity
- Instrument channel health for safety and non-safety functions
- Heat sink availability and flow paths for passive or engineered cooling
- Radiation protection readiness such as survey equipment calibration and access control setup
Example: if the outage involves sensor replacement in a temperature measurement rack, you verify the replacement’s calibration certificate, then perform a functional check that the signal reaches the control system and alarms behave as expected.
Outage Execution Controls
During the outage, use configuration control like it’s part of the job, because it is. Label temporary bypasses, lock out electrical work, and record any changes to setpoints or logic. If a technician needs to disable an interlock for a test, the plan must specify the duration, the compensating controls, and the exact moment it returns to normal.
Work permits should reference the specific system state. For instance, “mechanical work on the heat exchanger” is not enough; the permit should state the loop is isolated, drained as required, and that any residual heat is accounted for in the work plan.
Restart Procedures and Verification
Restart is not a single button press. It is a sequence of state transitions with checks at each step. A typical structure is:
- Restore configuration to the approved baseline
- Perform pre-start functional tests for safety-related instrumentation and actuators
- Verify heat removal paths and flow establishment
- Conduct controlled power ascension with defined hold points
- Confirm stable operation against acceptance criteria
Example of a hold point: after bringing the system to a low power level, you verify that temperature margins remain within limits and that control responses match expected behavior. If a parameter drifts, you stop and troubleshoot before continuing.
Mind Map: Maintenance Outage Planning and Restart Procedures
Restart Checklist Example
Use a checklist that ties actions to evidence. For a restart after replacing a valve actuator in the heat loop:
- Confirm actuator wiring and feedback signals match the as-built configuration
- Verify valve stroke time and position indication
- Establish flow through the loop and confirm no abnormal pressure behavior
- Perform a low-power trial and verify temperature control stability
- Record results and sign off readiness for the next power step
Diagram: Restart State Machine
stateDiagram-v2
  state "Safe State" as Safe_State
  state "Maintenance Configuration" as Maintenance_Configuration
  state "Pre-Start Checks" as Pre_Start_Checks
  state "Heat Removal Verified" as Heat_Removal_Verified
  state "Low Power Hold" as Low_Power_Hold
  state "Stable Operation" as Stable_Operation

  [*] --> Safe_State
  Safe_State --> Maintenance_Configuration: Isolation and verification
  Maintenance_Configuration --> Pre_Start_Checks: Work complete
  Pre_Start_Checks --> Heat_Removal_Verified: Flow established
  Heat_Removal_Verified --> Low_Power_Hold: Controlled ascension
  Low_Power_Hold --> Stable_Operation: Acceptance criteria met
  Stable_Operation --> [*]
  Low_Power_Hold --> Troubleshooting: Criteria not met
  Troubleshooting --> Pre_Start_Checks: Corrective actions
Common Failure Points and How to Prevent Them
A frequent issue is “paper readiness” where the checklist is complete but the plant state is not. Prevent this by requiring evidence that matches the current configuration, such as instrument readings and actuator position confirmations.
Another issue is restarting too quickly after a test. Prevent it by using hold points with explicit acceptance criteria, so the team has time to interpret trends rather than just react to alarms.
Finally, avoid restart ambiguity. Every step should specify the expected plant behavior and what to do if it doesn’t happen. That turns restart from a hope-based activity into a procedure-based one, which is exactly what you want when you’re dealing with nuclear systems.
10. Instrumentation Control and Cybersecurity for Nuclear Systems
10.1 Instrumentation Architecture for Safety and Non Safety Functions
A microreactor’s instrumentation architecture separates what must work in abnormal conditions from what mainly supports efficient operation. The goal is simple: safety functions should not depend on the same sensors, power paths, software, or communication links that non-safety functions use.
Foundational Concepts for Safety and Non Safety Separation
Start by classifying functions:
- Safety functions detect conditions and drive protective actions such as reactor trip, isolation, or engineered heat removal.
- Non-safety functions monitor performance, support control, log data, and manage normal plant transitions.
A practical rule of thumb is to treat safety instrumentation like a seatbelt: it may be simple, but it must be independent, testable, and reliable. Non-safety instrumentation can be more optimized for usability, but it should not be able to block safety actions.
Sensor Layer and Measurement Choices
Safety and non-safety systems often measure the same physical variables, but they do it differently.
For example, consider core outlet temperature:
- Safety measurement may use redundant, diverse sensors (e.g., two independent temperature measurement chains) feeding a trip logic.
- Non-safety measurement may use additional sensors for trend analysis and control tuning.
Key best practices:
- Redundancy with independence: multiple sensors should not share the same failure mode, such as a single power supply or a single cable run.
- Range and survivability: sensors must cover expected operating ranges and remain functional during design-basis conditions.
- Calibration strategy: define how calibration affects safety channels, including how you verify that a calibration does not silently degrade trip thresholds.
Signal Conditioning and Data Paths
Between sensors and controllers, signal conditioning can introduce failure points. Use separate conditioning paths for safety and non-safety signals when feasible.
Concrete example: neutron flux indication.
- Safety channels may use dedicated preamplifiers and analog-to-digital conversion sized for fast response.
- Non-safety channels may sample more slowly and apply filtering for operator displays.
Best practices:
- Fail-safe signal behavior: define what happens when a sensor goes out of range, loses power, or saturates.
- Time alignment: if safety logic compares multiple signals, ensure their timing uncertainty is bounded.
- Isolation: keep safety signal wiring separated from non-safety wiring to reduce common-cause electrical noise.
Safety Logic and Actuation Interfaces
Safety logic should be deterministic and auditable. It typically uses hardwired logic or safety-rated controllers with constrained software behavior.
Example trip chain:
- Two-out-of-three safety channels detect neutron flux exceeding a setpoint.
- Logic verifies plausibility using independent criteria such as temperature or flow agreement.
- Trip output energizes a shutdown mechanism and simultaneously triggers alarm annunciation.
Best practices:
- Plausibility checks without masking: plausibility logic should reduce nuisance trips, but it must not prevent a genuine trip.
- Actuation independence: trip outputs should not share power rails with non-safety actuators.
- Test points: design for proof testing by exposing safe, measurable signals without dismantling the system.
Control, Monitoring, and Human Interfaces
Non-safety control uses instrumentation to regulate power and heat output. Monitoring provides operators with clear, actionable context.
Example operator display set:
- Reactor power (with uncertainty band)
- Core outlet temperature trend
- Heat sink status and flow rate
- Alarm list with time stamps and channel health
Best practices:
- Alarm rationalization: alarms should correspond to specific operator actions or safety-relevant awareness.
- Channel health indicators: show sensor validity and voting status, not just the final computed value.
- Consistent units and scaling: avoid mixing engineering units across displays and logs.
Cyber and Communication Boundaries
Even when safety logic is local, communication can still matter for alarms, logging, and remote monitoring. Treat safety-critical decision-making as local and bounded.
Best practices:
- Network segmentation: safety systems should not require access to general-purpose networks.
- Read-only remote views: remote systems should receive data without being able to influence safety logic.
- Time synchronization discipline: if time stamps are used for event correlation, define how clock drift is handled.
Mind Map: Instrumentation Architecture
Example Integrated Architecture Walkthrough
Imagine a remote industrial site with limited staffing. During normal operation, non-safety instrumentation supports load following by adjusting control setpoints based on measured temperature and flow. If a safety threshold is crossed, the safety channels detect it independently, vote the result, and command a trip without relying on the non-safety network or operator actions.
The operator still benefits: alarms show which safety channels voted, what the measured values were, and whether a sensor channel is degraded. That reduces troubleshooting time and prevents “guess-and-check” behavior.
Verification, Validation, and Proof Testing
Instrumentation architecture must be testable throughout its life.
Best practices:
- Channel-by-channel proof testing: verify sensor response and logic thresholds on a defined schedule.
- Configuration control: treat changes to setpoints, scaling, and wiring maps as safety-relevant.
- End-to-end tests: periodically confirm that a simulated input produces the correct trip output and annunciation.
A good architecture makes the safe path obvious, the non-safe path helpful, and the boundary between them hard to accidentally cross.
10.2 Control Strategies for Power and Heat Output Regulation
Portable microreactors must regulate two coupled outputs: electrical power and useful heat. The control system’s job is to keep reactor power and coolant temperature within limits while meeting load demands, even when the load changes faster than the plant’s thermal inertia. A practical way to think about this is to separate control into layers: fast protection, medium-speed regulation, and slower supervisory coordination.
Foundational Control Objectives
Start with what “good” looks like. First, reactor power should track a commanded setpoint without oscillation. Second, heat removal should remain adequate so that fuel and cladding temperature margins are preserved. Third, the system should behave predictably during disturbances such as step changes in process steam demand or electrical load.
A useful mental model is a chain of cause and effect:
- Control action changes reactivity or heat removal.
- Reactivity changes neutron power.
- Neutron power changes heat generation.
- Heat generation changes coolant and fuel temperatures.
- Temperature feedback changes reactivity and system behavior.
Because temperature feedback is part of the physics, the controller must be designed with feedback in mind rather than treated as an afterthought.
Control Architecture from Protection to Regulation
Most microreactor designs use multiple safety functions that override normal control when limits are approached. Normal regulation should not “fight” safety logic; instead, it should keep the plant away from those triggers.
A typical layered architecture:
- Protection layer: trips and safety actions based on hard limits.
- Regulation layer: maintains power and temperature targets.
- Supervisory layer: selects setpoints based on external demand and operational mode.
This separation prevents a common failure mode: a controller that tries to correct everything at once, then saturates and causes instability.
Power Regulation Strategy
Power regulation usually uses reactivity control through control rods, soluble poison, or other mechanisms, depending on the reactor concept. The controller compares measured reactor power to a setpoint and commands reactivity to reduce the error.
Key practical details:
- Measurement filtering: neutron flux signals can be noisy; filtering reduces false control action. Too much filtering adds delay and can cause oscillation.
- Gain scheduling: controller gains may change with operating point because system dynamics differ at low versus high power.
- Rate limiting: limiting how quickly reactivity can change prevents overshoot and respects mechanical constraints.
Example: If electrical load drops suddenly, the supervisory layer may reduce the power setpoint. The power controller then adjusts reactivity to bring neutron power down. Meanwhile, thermal inertia means coolant temperature may lag; the controller should avoid aggressive reactivity changes that would chase temperature too quickly.
Heat Output Regulation Strategy
Heat regulation focuses on maintaining coolant temperature targets and ensuring sufficient heat transfer to the power conversion or process heat loop. In many systems, heat removal is influenced by:
- coolant flow rate or pump speed,
- heat exchanger valve positions,
- steam generator feedwater or bypass routing,
- secondary loop control such as condensate return.
A practical approach is to treat heat removal as the “actuator” for temperature and treat reactor power as the “actuator” for generation. That division reduces coupling and makes tuning more stable.
Example: During a process steam demand increase, the secondary loop valve opens, increasing heat extraction. If reactor power is not adjusted promptly, coolant temperature may fall below target. A coordinated strategy uses a supervisory setpoint ramp for power while the heat loop responds immediately to demand.
Coordinated Control for Coupled Power and Heat
Because power and heat are linked, coordination matters. One robust method is a two-loop structure:
- Inner loop: power-to-reactivity control with fast response.
- Outer loop: temperature or heat balance control that adjusts the power setpoint rather than directly commanding reactivity.
This prevents the temperature controller from directly “pushing” reactivity and causing interaction with the power controller.
Mind Map: Control Loops and Signals
Disturbance Handling with Concrete Scenarios
Scenario: Electrical load step down. Supervisory logic reduces the power setpoint with a ramp to avoid sudden reactivity demand. The power controller brings neutron power down. Heat removal continues to follow the secondary demand; if steam demand is unchanged, the system may temporarily shift heat distribution between electrical conversion and process heat.
Scenario: Process heat step up while electrical load stays constant. The supervisory layer increases the heat extraction setpoint for the process loop. The outer temperature/heat balance loop adjusts the power setpoint upward so coolant temperature remains near target. The power controller then changes reactivity to match the new generation requirement.
Practical Tuning and Validation Checks
Before relying on the controller in the field, validate with structured tests:
- Step response tests for power and temperature to check overshoot and settling time.
- Interaction tests where both electrical and process demands change to confirm coordination.
- Saturation tests to ensure rate limits and actuator bounds do not cause runaway error.
A simple acceptance criterion is that the system returns to steady state without sustained oscillations and without approaching safety limits during transients. If it doesn’t, the fix is usually not “more gain,” but better coordination, filtering, and setpoint ramping.
Example: Coordinated Setpoint Ramping
A supervisory setpoint ramp can be expressed conceptually as:
- choose a ramp rate that respects reactivity actuator limits,
- ensure the ramp does not demand more heat extraction than the secondary loop can provide,
- keep the temperature outer loop from saturating.
Example: If the secondary loop can increase heat extraction quickly but the reactivity mechanism is slower, ramp power setpoint moderately and let the heat loop handle the immediate demand. The outer loop then fine-tunes the setpoint based on measured coolant temperature error.
10.3 Data Logging Alarm Management and Human Factors Considerations
Data Logging and Alarm Management
Data logging turns “what happened” into “what can be proven.” For microreactors, the goal is not to record everything, but to record the right signals at the right time resolution so alarms can be interpreted without guesswork.
Start with an alarm lifecycle view: detect, announce, guide action, and confirm outcome. Detection requires consistent sensor scaling and validated thresholds. Announcement requires alarm messages that map to operator actions, not just technical states. Guidance requires procedures that match the alarm’s meaning. Confirmation requires logged evidence that the operator’s response produced the expected system behavior.
A practical best practice is to define an “alarm interpretation bundle” for each alarm: the sensor(s) that trigger it, the related safety function status, the relevant actuator state, and the key process variables that show whether the system is stabilizing. Example: if an alarm indicates abnormal coolant temperature rise, the bundle should include flow indication, heat exchanger differential pressure, and the control system’s power or heat removal command. Without these, operators may respond correctly but still lack confirmation that the response worked.
Alarm Prioritization and Human Factors
Operators experience alarms as a workload. If alarms compete, the most important one loses its job. Prioritization should follow a simple rule: alarms that demand immediate action must be few, distinct, and time-critical; alarms that indicate monitoring needs should be grouped and rate-limited.
Use three layers of severity aligned to expected operator behavior:
- Safety-critical alarms: require immediate procedural action and have clear “what to do next.”
- Operational alarms: require controlled response, often within a defined time window.
- Advisory alarms: support awareness and trend review, not urgent action.
Human factors also depend on how alarms are presented. Keep alarm text consistent with the procedure language. If the procedure says “verify shutdown system status,” the alarm should not say “check interlock condition” unless those terms are mapped and trained. Consistency reduces cognitive translation.
Rate limiting prevents alarm storms. For example, if a valve chatters due to a control loop oscillation, you may see dozens of “position deviation” alarms. Instead, log the high-rate raw signal, but present a single alarm that captures the condition and includes a timestamped summary. The operator gets one clear prompt; the engineering log still contains the detail.
Data Logging Design for Alarm Context
Logging must support both real-time response and post-event reconstruction. Use event-triggered logging for alarm conditions and periodic logging for baseline monitoring.
A systematic approach:
- Define time resolution: choose sampling rates that capture the dynamics behind the alarm. A slow sampling rate can make a fast transient look like a steady drift, which changes operator interpretation.
- Define pre-trigger buffer: store data from before the alarm so operators can see the lead-up. A common failure mode is starting logs only when the alarm fires.
- Define post-trigger window: store enough time to observe whether the system returns toward normal.
- Define data integrity checks: include sensor health flags and time synchronization status so operators know whether a reading is trustworthy.
Example: during a load change, power and heat removal commands may shift within seconds. If the log captures only once per minute, the alarm will appear “mysteriously late,” and the operator will have no evidence of the cause.
Mind Map: Alarm Management and Logging
Example: Interpreting an Alarm Without Guesswork
Consider an alarm: “Heat Exchanger Differential Pressure High.” A good alarm interpretation bundle includes:
- Differential pressure sensor value and range limits
- Heat exchanger flow indication
- Pump speed or valve position
- Control command for heat removal
- Safety function status for heat removal capability
- A short trend of upstream and downstream temperatures
Operator action should be supported by a procedure step sequence such as: verify sensor health, check flow path configuration, confirm pump/valve response, and verify that differential pressure decreases while temperatures stabilize. After the response, the log should show the differential pressure trending down and the temperatures returning toward expected bounds. If the differential pressure remains high but temperatures stabilize, the operator can conclude the system is behaving safely even if the alarm condition persists.
Human-Centered Alarm Review and Continuous Improvement
Alarm management is not “set thresholds and forget.” After each event or near-miss, review whether the alarm meaning matched operator actions and whether the logged context was sufficient. Track three outcomes: whether the alarm was understood, whether the response was correct, and whether confirmation data was available.
A simple metric set keeps the review grounded:
- Alarm-to-procedure match: did the procedure step sequence address the alarm’s stated condition?
- Time-to-corrective action: how long until the system shows the expected response?
- Evidence completeness: were the key signals in the interpretation bundle present and valid?
When gaps appear, fix the system where the confusion originated: message wording, sensor scaling, logging windows, or procedure alignment. The point is to reduce operator uncertainty, not to generate more alarms.
10.4 Cybersecurity Controls for Operational Technology Environments
Operational technology (OT) in a microreactor context includes controllers, sensors, safety systems, protection relays, historians, engineering workstations, and the network paths that carry commands and status. Cybersecurity controls here must protect safety and availability first, because a “secure” system that cannot run is just a different kind of outage.
Foundational Principles for OT Security
Start with three practical rules.
-
Separate safety and non-safety paths. Safety functions should not depend on the same network services used for routine monitoring.
-
Assume the network is hostile. Even if you trust the site, you still design for misconfiguration, accidental exposure, and credential mistakes.
-
Control changes like you control reactivity. If you can’t explain what changed and why, you can’t safely operate.
A simple way to apply these rules is to treat OT as a set of zones with strict boundaries: safety zone, control zone, operations zone, and maintenance zone. Each boundary has rules for who can talk to whom, and what they can do.
Asset Inventory and Data Classification
Before controls, you need an inventory that matches reality. Include not only servers and PLCs, but also:
- Engineering workstations and laptops used for commissioning
- Serial-to-Ethernet gateways and protocol converters
- Remote access appliances
- Time sources (NTP/PTP) and logging collectors
Then classify data flows:
- Safety-critical signals (trip, permissives, interlocks)
- Control signals (setpoints, mode commands)
- Operational telemetry (temperatures, flows, radiation monitors)
- Maintenance data (diagnostics, firmware logs)
Example: If a historian can read telemetry but cannot write setpoints, you prevent an entire class of mistakes where “view-only” tools accidentally gain write access.
Network Segmentation and Boundary Controls
Use segmentation to limit blast radius. A typical pattern is:
- Safety zone: minimal connectivity, no direct internet access
- Control zone: restricted access from operations and engineering
- Operations zone: monitoring and reporting systems
- Maintenance zone: temporary access for updates and diagnostics
Boundary controls include firewalls or industrial firewalls, allowlists for required ports/protocols, and protocol-aware filtering where feasible.
Example: Instead of allowing all traffic from a maintenance laptop to the control zone, permit only the specific management protocol to the specific device IP, and only during a maintenance window.
Identity, Authentication, and Authorization
OT systems often outlive passwords. Use unique accounts, strong authentication, and least privilege.
- Unique accounts per person or role, not shared logins
- Role-based access for operators vs engineers vs vendors
- Multi-factor authentication for remote access and administrative actions
- Time-bound privileges for maintenance tasks
Example: An operator account can acknowledge alarms and view trends, but cannot change control modes. An engineer account can change modes only after a documented change ticket is approved and the system is in the correct operational state.
Secure Remote Access and Vendor Connectivity
Remote access is where “convenience” tends to win. Make it boring and controlled.
- Use a dedicated jump host in the maintenance zone
- Require MFA and per-session authorization
- Record session activity and command outcomes
- Limit protocols to what is necessary
Example: A vendor needs to read firmware version and apply a patch. The remote session is restricted to those actions, and the patch is staged offline so the control zone never receives arbitrary files.
Monitoring, Logging, and Alerting
Logging must support both incident response and routine verification.
Collect:
- Authentication events (success and failure)
- Configuration changes (who, what, when)
- Network flows across boundaries
- Safety and control mode transitions
Alerting should be tied to operational meaning, not just volume. For instance, alert on repeated failed logins to an engineering workstation, or on an unexpected attempt to write to a controller configuration.
Example: If a historian service account suddenly attempts to access a controller write interface, that is a clear anomaly even if the traffic volume is small.
Change Management and Configuration Control
Controls are only as good as the process around them.
- Maintain a baseline configuration for each device class
- Require signed firmware and verified configuration packages
- Use staged rollouts in a test environment when available
- Enforce rollback plans for failed updates
Example: Before applying a controller update, export the current configuration, store it with an integrity check, and verify the new package in a staging setup that mirrors the production network rules.
Mind Map: OT Cybersecurity Controls
Example Control Set for a Typical Deployment
A practical baseline for a microreactor deployment might look like this:
- Safety zone has no direct remote access; only local maintenance during controlled states.
- Operations zone can read telemetry and alarms but cannot write control setpoints.
- Maintenance zone uses a jump host with MFA and session recording.
- Firewalls enforce allowlists for required protocols only.
- Every configuration change requires a ticket, approval, and an integrity-verified package.
If you implement these controls together, you get layered protection: even if credentials are misused, segmentation and least privilege prevent unsafe actions.
Diagram: OT Control Flow Overview
    flowchart TD
  A[Maintenance Laptop] -->|MFA + Jump Host| B[Jump Host]
  B -->|Allowlisted protocols| C[Maintenance Zone Devices]
  C -->|Staged update package| D[Control Zone Controllers]
  E[Operators Workstation] -->|Read-only telemetry| F[Operations Zone Historian]
  E -->|Acknowledge and view| G[Alarm and HMI]
  D -->|Safety signals| H[Safety Zone Protection Systems]
  D -->|Telemetry| F
  H -->|Trip and interlock outputs| I[Actuators and Field Devices]
  subgraph Boundaries
    J[Industrial Firewall Rules]
    K[Logging and Alerting]
  end
  B --- J
  E --- J
  D --- K
  H --- K
10.5 Verification Validation and Change Management for Control Systems
Control systems for microreactors sit at the intersection of safety, reliability, and maintainability. Verification answers “did we build it right?” while validation answers “does it do the right thing in the real operating context?” Change management ensures that the answer stays true after updates, repairs, or configuration tweaks.
Verification Foundations for Control Software and Hardware
Start with a clear separation of concerns: requirements, design, implementation, and tests. A practical best practice is to assign each requirement a unique identifier and require that every test case references one or more identifiers. For example, if a requirement states that a safety function must trip within a defined time window, the test plan should include both a timing test and a fault-injection test that proves the timing behavior under realistic signal delays.
Verification typically includes:
- Static checks: coding rules, model consistency, interface contracts, and configuration sanity checks.
- Model-based verification: simulation of control logic against plant models to confirm correct sequencing.
- Hardware verification: I/O mapping tests, sensor plausibility checks, and watchdog behavior.
A concrete example: suppose the controller uses two redundant temperature sensors and triggers a protective action if both exceed a threshold. Verification should include cases where one sensor is stuck high, one is noisy, and both disagree. The expected behavior must be specified, not guessed.
Validation in Operational Context
Validation proves that the control system performs correctly when the plant behaves like a plant, not like a spreadsheet. This includes realistic disturbances, sensor noise, actuator limits, and operator interactions.
A useful approach is scenario-based validation. Define scenarios that mirror operational modes: startup, steady operation, load changes, and shutdown. For each scenario, validate both safety functions and operational control loops.
Example scenario: during a step increase in process heat demand, the controller should adjust power or heat extraction without violating safety margins. Validation should confirm that intermediate states are safe: for instance, that the system does not briefly command an unsafe combination of power level and heat removal rate.
Validation also covers human factors in a controlled way. If an operator can select an operating mode, validation should confirm that the mode selection changes the correct setpoints and that alarms remain meaningful. A common failure mode is “the system did what it was told,” but the told part was ambiguous.
Traceability and Evidence Management
Verification and validation only help if the evidence is retrievable and consistent. Maintain a traceability matrix that links:
- requirements → design elements → test cases → test results → reviewed approvals.
Keep configuration records for the exact software build, parameter sets, and hardware revisions used during testing. For instance, if a trip threshold is stored as a parameter rather than hard-coded, the test evidence must record the parameter value and its source.
Change Management for Control Systems
Change management prevents small edits from causing large surprises. Treat changes as controlled work items with defined scope, impact assessment, and approval gates.
A systematic workflow:
- Change request: describe what changes and why, including affected requirements.
- Impact assessment: identify which safety functions, control loops, and interfaces are affected.
- Verification plan update: update or add tests that cover the changed behavior.
- Validation scope decision: determine whether existing validation evidence remains valid or whether new scenarios are required.
- Configuration update: update software, parameters, and documentation together.
- Independent review: ensure someone not involved in the change checks the evidence.
- Release and monitoring: deploy with defined acceptance criteria and post-change checks.
Example: a parameter change that adjusts a control loop gain might not require a full retest of every scenario, but it should trigger targeted verification of stability margins and validation of at least the most sensitive operating transitions, such as load-following.
Mind Map: Verification Validation and Change Management
Practical Example: A Controlled Parameter Update
Imagine updating a control parameter that limits maximum heat extraction rate to protect downstream equipment. The change request states the affected requirement and the reason. Impact assessment identifies the operational control loop and the safety margin calculation path. Verification adds tests that sweep extraction commands near the limit and confirms that protective actions trigger correctly when limits are exceeded. Validation runs the load-change scenario to ensure the system transitions safely. Finally, release evidence records the exact parameter value, software build, and test results, so the next troubleshooting session has something solid to stand on.
11. Waste Management and Decommissioning Planning
11.1 Categorizing Waste Streams from Operation and Maintenance
Waste from a microreactor is easiest to manage when you treat “waste” as a set of categories with clear boundaries: what it is, why it is radioactive or contaminated, how much there is, and what packaging and handling it needs. The goal is not to guess; it is to classify using observable properties and documented process history.
Foundational Waste Categories
Start with two primary axes: (1) radiological status and (2) physical form.
-
Radioactive waste includes materials that contain radionuclides above clearance or exemption limits. In practice, this often comes from activated components, contaminated tools, and filters.
-
Non-radioactive waste includes clean construction debris, packaging, and general refuse that never contacts radioactive areas.
-
Potentially contaminated waste is material that may have been exposed but is not yet characterized. Treat it as radioactive until measurements prove otherwise.
Then split by physical form:
- Solid: rags, gloves, resins, insulation, metal parts.
- Liquid: demineralized water with trace activity, cleaning solutions, coolant residues.
- Gaseous: off-gas from controlled ventilation systems, sampled and filtered.
A practical example: during a routine filter change, the used filter is solid and likely contaminated. The new filter is clean. The plastic bag used to carry the used filter is potentially contaminated because it touched the used item.
Operational Sources and Typical Streams
Waste streams should be mapped to the activities that create them.
- Core and primary system maintenance: activated metal components, gaskets, and seals.
- Water and purification systems: spent ion-exchange media, contaminated resins, and any drained residues.
- Ventilation and filtration: spent HEPA filters, charcoal cartridges (if used), and duct deposits.
- Decontamination activities: wipes, swabs, rinse water, and protective clothing.
- Tooling and consumables: gloves, coveralls, drill bits, and cutting fluids used in controlled areas.
A useful rule of thumb: if an item’s contamination pathway includes a controlled boundary (airborne particulates, liquid splashes, or direct contact), it belongs in a characterization queue.
Characterization and Decision Logic
Classification becomes reliable when you standardize measurements and decision points.
- Identify the process history: where the item was used, what it contacted, and whether it was inside controlled zones.
- Perform radiological measurements: surface contamination checks for solids, activity concentration for liquids, and sampling for gases.
- Determine waste form and packaging: compressible solids, sharps, liquids requiring containers, and filters requiring sealed canisters.
- Assign a waste class based on regulatory thresholds and facility acceptance criteria.
Example: a stainless-steel pump seal removed during maintenance is solid and likely activated. If dose rate measurements exceed clearance limits, it is radioactive waste. If it is below thresholds and contamination surveys confirm cleanliness, it may be handled as non-radioactive scrap under controlled procedures.
Integrated Mind Map
Mind Map: Categorizing Waste Streams from Operation and Maintenance
Practical Examples by Waste Type
Solid example: After decontamination, wipes are collected in a labeled container. They are treated as potentially contaminated until swipe tests confirm contamination levels. If confirmed, they are packaged as solid radioactive waste; if not, they may be reclassified as non-radioactive refuse.
Liquid example: A small volume of rinse water from a controlled-area cleaning step is sampled. If activity concentration is above acceptance limits, it is transferred to an approved container for radioactive liquid waste. If below limits, it follows the facility’s controlled discharge or disposal pathway.
Gaseous example: Ventilation filters are replaced on a schedule. Each used filter is sealed immediately to prevent handling spread. Measurements determine whether it is radioactive waste or can be cleared under documented criteria.
Documentation That Makes Classification Work
Classification is only as good as the records behind it. Each waste container should have:
- origin activity (which maintenance step created it)
- controlled area status (yes/no)
- measurement results and survey method
- assigned waste class and container type
- operator sign-off and date
A simple example: a container label for spent resin should reference the purification loop it came from and the survey results used to classify it. That prevents “mystery waste,” where the only answer is “we think it was contaminated.”
Common Failure Modes and How to Avoid Them
- Skipping process history: without it, measurements are harder to interpret.
- Mixing waste streams: combining liquids with solids or different contamination levels complicates packaging and increases disposal burden.
- Late labeling: if labels are applied after handling, traceability breaks.
A disciplined approach keeps waste categorization consistent across shifts and across modules, which is especially important when operations are frequent and maintenance is modular.
11.2 Storage Packaging and Interim Handling Practices
Interim storage packaging is the bridge between “we shut down” and “we move to the next step.” For microreactor operations, the goal is simple: keep radiation levels, contamination risk, and heat removal within limits while the hardware sits safely in a controlled area. The practices below assume you are handling activated components and any sealed fuel or fuel-bearing hardware that remains under regulatory controls.
Start with What You Are Protecting
Begin by separating items into three practical categories: (1) sealed fuel or fuel-bearing modules, (2) activated structural components, and (3) contaminated tools, filters, or secondary waste. Each category drives packaging choices.
A useful rule of thumb: if the item can shed contamination under rough handling, treat it like a contamination source even if dose rates look modest. For example, a gasket removed from a service port may have low external dose but can still contaminate surfaces if it is not contained.
Packaging Functions and Their Evidence
A packaging system should provide four functions, each with measurable evidence:
- Containment: barriers that prevent release of radioactive material.
- Shielding: materials and geometry that reduce external dose.
- Criticality safety: configuration limits that prevent unintended neutron multiplication.
- Heat management: pathways that keep temperatures within limits.
Evidence is not just paperwork. For instance, containment is verified through leak testing or validated integrity checks, while shielding is verified through dose-rate surveys after loading and through modeling that matches measured geometry.
Selecting Packaging Types by Item Behavior
Choose packaging based on how the item behaves during handling.
- Sealed fuel or fuel-bearing modules: use packaging that preserves the sealed boundary and provides shielding around the module. If the module includes a transfer interface, ensure the packaging does not stress seals during lifting.
- Activated components: use rigid containment (often a sealed canister or cask insert) plus shielding. If the component has sharp edges, include impact protection so the container does not deform.
- Secondary waste: use liners or drums with verified closure methods. A common best practice is to standardize closure hardware so operators can repeat the same torque or locking procedure.
Concrete example: when storing a set of activated heat exchanger tubes, place them in a basket that prevents tube-to-tube contact. That reduces abrasion and helps keep contamination where it belongs.
Interim Handling Workflow That Prevents Surprises
Interim handling should follow a repeatable sequence:
- Radiological characterization: measure dose rates and contamination smear results.
- Pre-pack checks: verify packaging integrity, gaskets, seals, and closure tools.
- Load planning: confirm lifting points, center of gravity, and allowable orientation.
- Packaging and closure: apply the same closure method every time, with checklists.
- Post-closure verification: perform external dose-rate survey and contamination checks.
- Labeling and records: record item ID, measurements, and storage location.
Example: if a component’s dose rate is higher than expected, do not “make it fit.” Re-plan shielding thickness or distance. Trying to compensate by moving faster is how small errors become big ones.
Storage Area Controls and Layout
Storage areas should be designed around practical constraints: access control, segregation, and heat removal.
- Segregation: keep items with different contamination potentials in separate zones.
- Distance and shielding: arrange containers so routine access does not require frequent repositioning.
- Ventilation and monitoring: ensure airflow and radiation monitors are placed where they can detect releases.
A simple layout practice is to define “walk-up” routes that avoid passing close to high-dose containers. Operators should not have to improvise paths during busy periods.
Temperature and Heat Removal Basics
Even when power is off, decay heat can matter. Packaging must include a heat removal pathway that matches the storage environment.
For example, if containers rely on natural convection, avoid stacking that blocks airflow. If forced cooling is used, treat it as a safety-relevant support system and include monitoring for fan failure and temperature rise.
Documentation and Traceability That Actually Helps
Interim storage records should let someone answer three questions quickly: what is inside, where it is, and how it was verified.
Minimum records typically include:
- item identification and category,
- pre- and post-pack measurements,
- packaging configuration and closure verification,
- storage location and monitoring plan,
- transfer history and any deviations.
If you use standardized forms, include fields that force measurement entry rather than leaving “N/A” as a default.
Mind Map of Storage Packaging and Interim Handling Practices
Mind Map: Storage Packaging and Interim Handling Practices
Example: Packaging a Set of Activated Components
Assume you have multiple activated components with similar geometry but slightly different dose rates. First, measure each component and assign it to a shielding class. Next, load components into a basket that prevents contact and supports lifting without bending. Close the containment canister using a standardized closure method, then perform a post-closure external dose-rate survey at fixed points.
Finally, store the canister in a pre-assigned location that matches the shielding class. The key practice is consistency: the same measurement points, the same closure method, and the same storage logic each time. That consistency is what keeps interim handling from turning into a series of one-off experiments.
11.3 Transport Interfaces for Radioactive Materials and Records
Transport interfaces are the practical bridge between “we have radioactive material” and “it arrived where it needs to be, with the right documents and controls.” For microreactors, the interface is not only about moving fuel or components; it also covers how records travel, how responsibilities are handed off, and how packaging and labeling match the paperwork.
Foundational Concepts for Transport Interfaces
A transport interface has four moving parts: the physical item, the packaging, the transport mode, and the documentation set. Each part must agree with the others. A common failure mode is a mismatch: the package is prepared for one radionuclide inventory or heat output, while the shipping papers describe a different configuration. The fix is to treat the interface as a controlled workflow with checks at every handoff.
Start with item classification. Even when the reactor design is compact, the shipped items can differ: fresh fuel, irradiated fuel, activated components, or maintenance tools that became contaminated. Each category drives different limits for dose rate, contamination control, and documentation fields.
Next, define packaging interfaces. Packaging is not just a container; it is a set of engineered boundaries with acceptance criteria. For example, a cask or shielded overpack has limits on external dose rate and surface contamination. Those limits must be verified before the shipment is released, and the verification results must be traceable to the record set.
Finally, define record interfaces. Records include shipping papers, certificates of compliance, radiation survey results, chain-of-custody forms, and any transport authorization documents required by the applicable framework. Records should be complete enough that a receiving party can confirm identity, condition, and compliance without guessing.
Documentation Set and Handoff Logic
Use a “shipper-to-carrier-to-receiver” handoff model. The shipper prepares a document packet that matches the physical configuration. The carrier verifies that the package is properly marked and that the paperwork is present and legible. The receiver confirms receipt condition and performs acceptance checks.
A practical approach is to standardize a checklist that ties each document to a specific verification step. For instance, if the package marking indicates a maximum external dose rate, the receiver’s acceptance check should include a survey method and acceptance threshold aligned to that value. If the shipment includes activated components, the receiver should have the survey results and contamination limits that were used to clear the package.
Records also need to survive the real world. Paper can be damaged, and electronic files can be incomplete. A robust interface includes redundant copies and a clear indexing scheme so that “what page shows what” is obvious during audits and incident investigations.
Physical Interfaces That Must Match Records
Three physical interfaces deserve special attention because they are easy to get wrong:
- Identity interface: The item description on the paperwork must match the package contents. If the shipment is “irradiated fuel assembly,” the package must contain that exact item type and configuration.
- Condition interface: The package condition at release must be consistent with the declared contamination and dose rate. If a survey is performed, the survey method and date should be recorded.
- Thermal and mechanical interface: Some shipments include heat-generating items. Packaging acceptance criteria often include thermal limits and mechanical restraints. The shipping plan should document how those restraints are secured and verified.
Mind Map: Transport Interfaces for Radioactive Materials and Records
Example: Matching a Shipment to Its Record Packet
Imagine a shipment of activated reactor internals to a maintenance facility. The shipper prepares a packet that includes: (1) the package identification and serial number, (2) the declared external dose rate at release, (3) the contamination clearance survey results, and (4) a chain-of-custody form listing custody transfers.
At carrier acceptance, the check is simple but strict: confirm the package markings correspond to the declared package ID and that the paperwork is complete. At receiver acceptance, the team performs a dose rate survey at the same reference points used during release verification. If the measured values exceed the declared limits, the receiver does not “fix it by paperwork”; instead, they hold the package and document the discrepancy.
For records, the receiver logs the packet’s index and version, then stores the original documents with the package ID so that later audits can trace every survey back to the specific shipment.
Example: Chain of Custody for a Multi-Stop Route
For a multi-stop route, chain of custody prevents “who had it when” from becoming a vague story. Each custody transfer records time, location, and the condition of seals. If a seal is found damaged, the interface requires immediate documentation and escalation rather than continuing the route.
A small but effective practice is to include a seal status field on the chain-of-custody form that can be checked quickly. For example, a receiver can mark “intact” or “damaged” and attach a photo if damaged. That single field reduces ambiguity during later reviews.
Practical Checklist for Transport Interfaces
A transport interface is complete when the following are true:
- The physical item identity matches the declared contents.
- The packaging serial number and configuration match the certificate set.
- Release surveys are recorded with method and reference points.
- Package markings align with the shipping papers.
- Chain of custody is recorded at every custody transfer.
- Receiver acceptance checks are defined and documented.
- Records are indexed, version-controlled, and stored with package identifiers.
When these conditions are met, the transport process becomes auditable and repeatable, which is exactly what you want when the stakes are high and the paperwork has to be as disciplined as the hardware.
11.4 Decommissioning Planning for Modular Reactor Units
Decommissioning planning starts while the unit is still operating, because the easiest time to decide what to do with hardware is before it becomes waste. For modular reactor units, the plan must cover three realities: the reactor will be shut down in a controlled way, components will cool and change radiological character over time, and the modular structure will require practical disassembly steps rather than a single “remove everything” action.
Foundational Planning Inputs
Begin with the end state you want to reach at the site level. Common end states include removal of the reactor module and associated primary systems, leaving only structures that meet release criteria, or leaving certain shielding structures in place if they are integral to dose reduction. Then map the unit’s inventory: fuel, activated components, contaminated systems, and non-radioactive materials. A simple inventory table helps prevent surprises during dismantling.
Example inventory categories for a modular unit:
- Fuel and fission products: handled as spent fuel or contained waste depending on the contract and licensing basis.
- Activated metals: reactor vessel internals, control rod components, and nearby structural parts.
- Contaminated surfaces: piping, heat exchanger surfaces, and any areas with removable contamination.
- Clean materials: structural steel, electrical cabinets, and most balance-of-plant items.
Next, define the shutdown pathway that the decommissioning plan assumes. If the unit uses a particular shutdown mechanism and coolant chemistry control, those choices affect activation levels and the ease of later cleaning.
Decommissioning Strategy Options
A modular unit typically supports two broad approaches: immediate dismantling and deferred dismantling. Immediate dismantling reduces the time components sit in place, but it increases dose rates and may require more shielding and remote handling. Deferred dismantling waits for radioactive decay to reduce dose rates, which can simplify cutting and handling. The plan should state which approach is used and why, based on dose constraints, logistics, and the availability of storage capacity.
A practical best practice is to define a “decision gate” timeline. For example, after shutdown, the plan can specify that radiological surveys and dose-rate measurements will be repeated at set milestones, and the dismantling scope will be confirmed based on measured conditions rather than assumptions.
Work Breakdown Structure for Modular Hardware
Treat the reactor module like a system of modules, not a single object. A work breakdown structure (WBS) should separate tasks into: preparation, defueling, decontamination, disassembly, waste packaging, and site restoration. Each task should list the equipment needed, the expected radiological conditions, and the acceptance criteria.
Example WBS elements:
- Module isolation and draining: verify valves, confirm no residual coolant in target locations.
- Defueling and transfer: use approved casks and verify transfer records.
- Primary system decontamination: select methods that match contamination type and material compatibility.
- Segmented disassembly: cut or unbolt in a sequence that maintains structural stability.
- Waste characterization and packaging: align packaging type with waste category.
- Final surveys and release documentation: confirm that surfaces and zones meet criteria.
Radiological Characterization and Survey Plan
Decommissioning is only as good as the measurements behind it. The survey plan should specify survey methods, sampling strategy, and how results feed into waste classification. For modular units, the plan should also address “hidden” activation zones such as crevices, weld seams, and areas behind shielding plates.
A useful practice is to create a radiological map that links each component to expected activation and contamination pathways. Then, during dismantling, compare measured results to the map and update waste routing when needed.
Waste Management and Packaging Interfaces
Waste handling must be planned as an interface between operations and disposal. The decommissioning plan should define waste streams, packaging types, labeling requirements, and interim storage conditions. It should also specify who signs off on waste characterization and how nonconforming waste is handled.
Example: if a heat exchanger segment shows higher-than-expected contamination, the plan should state whether it is re-cleaned, reclassified, or packaged as a different waste form.
Stakeholder Roles and Documentation Package
Modular decommissioning involves multiple roles: operations staff, radiation protection, engineering, quality assurance, and contractors for specialized cutting or lifting. The plan should define responsibilities for: radiological work permits, method statements, hold points, and final acceptance.
Documentation should include a decommissioning safety case update, method statements for dismantling steps, waste handling procedures, and final survey records. A clean way to keep this organized is to tie each document to a WBS task and a specific acceptance criterion.
Mind Map: Decommissioning Planning Flow
Example: A Modular Unit Dismantling Sequence
- Pre-shutdown preparation: isolate module systems, confirm coolant inventory, and set up radiation work zones.
- Defueling: transfer fuel to approved casks, record chain-of-custody, and verify cask integrity.
- Cooling and surveys: perform post-shutdown surveys at defined milestones to confirm activation levels.
- Segmented disassembly: remove shielding panels first, then cut or unbolt activated components in a sequence that preserves stability.
- Waste routing: classify each segment based on measured contamination and activation, then package accordingly.
- Final surveys: survey remaining surfaces and zones, document results, and close the work package.
This sequence works because it respects the order of physical reality: you cannot characterize what you have not isolated, you cannot package waste without measurements, and you cannot release a zone without final surveys. The plan should make that logic explicit so the field team is never guessing what “done” means.
11.5 Site Release Criteria Documentation and Final Disposition Records
A site release is not a single signature; it is a chain of evidence that shows the facility has returned to an agreed radiological and physical state. For microreactors, the chain must cover both the reactor unit and the surrounding deployment area, including temporary structures, utilities, and any materials that could have become contaminated.
Foundational Concepts for Release
Start by defining what “release” means in your project documents. Typically, release criteria are expressed as measurable limits tied to the intended end state: unrestricted use, restricted use, or controlled access. The documentation package should state the basis for the limits, the measurement methods, and the acceptance thresholds.
A practical way to keep this systematic is to separate three ideas:
- Release criteria: the numeric or categorical thresholds you must meet.
- Verification: the measurements and inspections you perform to show compliance.
- Disposition records: what you did with items that did not meet criteria, including how they were packaged, tracked, and transferred.
Example: If the deployment area will become a normal industrial yard, your criteria should reflect that end state. If a portion must remain under controlled access, your records should clearly identify the boundary and the reason.
Documentation Package Structure
Your release documentation should be organized so an auditor can follow it without guessing. Use a consistent folder logic:
- Release Plan: scope, boundaries, sampling strategy, measurement equipment, and acceptance criteria.
- As-Built and As-Left Records: what was installed, removed, or modified.
- Decontamination Records: what cleaning or removal actions were taken, including waste volumes.
- Survey Results: maps, raw readings, calibration status, and uncertainty handling.
- Nonconformance and Corrective Actions: what failed, why it failed, and how it was resolved.
- Final Disposition Records: transfers, storage identifiers, and chain-of-custody evidence.
- Management Review and Approval: sign-offs tied to specific responsibilities.
A small but important best practice is to include a “boundary statement” that defines the exact area considered for release, including any buffer zones. Without it, survey results can be technically correct yet practically unusable.
Mind Map: Evidence Chain for Site Release
Survey and Acceptance Workflow
A systematic workflow reduces surprises. First, confirm the measurement plan matches the physical layout after removal. Then verify instrument readiness: calibration status, detector checks, and background characterization. Next, perform surveys using the agreed methods, and record results with enough detail to reproduce the evaluation.
Acceptance should be evaluated against the criteria using a documented method. If a result is near a threshold, your records should show how you treated uncertainty and whether you performed confirmatory measurements.
Example: A concrete pad shows a localized elevated reading. The release plan might require confirmatory scans at a finer grid spacing. If confirmatory results remain above the threshold, the disposition record should document the corrective action, such as removal of the affected layer and re-survey.
Final Disposition Records That Actually Help
Disposition records must connect physical items to paperwork. For every removed component, waste container, or potentially contaminated material, record:
- Unique identifiers (container ID, component serial, survey tag)
- Material classification used for handling
- Packaging and storage location
- Transfer destination and date
- Responsible parties and approvals
Use chain-of-custody language that is specific rather than generic. “Transferred to storage” is less useful than “Container C-104 transferred from Yard Bay 2 to Licensed Storage Vault B on 2026-03-15 with custody handoff signatures.”
Mind Map: Disposition Records and Traceability
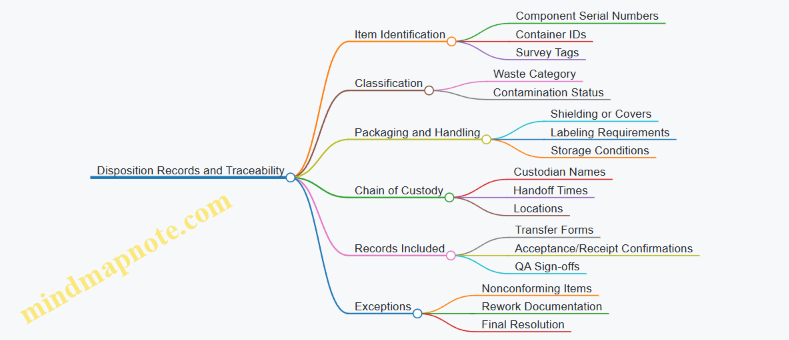
Integrated Example: From Release Plan to Final Approval
Assume the reactor unit is removed and the surrounding area is prepared for release. The release plan defines a boundary that includes the pad, access path, and staging area. Surveys are performed with calibrated instruments, and results are mapped to show coverage. A localized hotspot triggers confirmatory measurements; corrective action removes the affected surface layer. Waste containers are labeled, tracked, and transferred with custody records. Finally, management review checks that survey coverage matches the plan, that acceptance criteria were applied consistently, and that disposition records reconcile with decontamination volumes.
The final approval document should reference the release plan version, list the survey reports and disposition records by identifier, and state the release outcome tied to the defined end state. When these links are explicit, the site release becomes a verifiable conclusion rather than a paperwork scavenger hunt.
12. Practical Design and Engineering Workflows
12.1 Load Profile Matching for Remote Power and Process Heat
Remote microreactors rarely “just run.” They must follow a load pattern that includes electrical demand, process heat demand, and constraints from thermal storage, heat exchangers, and safety limits. Load profile matching is the disciplined way to decide how the reactor’s steady output, thermal buffer, and power conversion behave so the site gets what it needs without forcing awkward cycling.
Step 1: Write the Load Profile as Two Linked Curves
Start by separating the site demand into:
- Electrical load curve: kW or MW versus time, including critical loads that must never drop.
- Thermal load curve: heat rate versus time, including steam, hot water, or process heat requirements.
Then link them with the site’s conversion logic. For example, if the plant produces steam using a heat exchanger fed by reactor heat, the thermal curve determines the steam flow, which may indirectly affect electrical demand (e.g., pumps and controls). A simple practice is to create a one-page table with hourly values for both curves, plus a column for “minimum acceptable electrical power” and “minimum acceptable steam temperature or flow.”
Example: A remote mine needs 1.2 MW average electrical power but has a 2.0 MW peak during shift change. Its process heat requirement is steady at 6 MWth, except for a 30-minute shutdown window when it drops to 3 MWth.
Step 2: Choose the Operating Philosophy That Fits the Hardware
Microreactors typically have a preferred operating mode that balances efficiency, component stress, and control stability. Your load matching strategy should decide which variable you allow to move:
- Move the thermal side using hot water or steam storage.
- Move the electrical side using power conditioning and load shedding rules.
- Move the reactor output only within allowed control margins.
A practical rule: if the thermal system has storage capacity, use it to smooth short-term thermal swings. If the electrical system has critical loads, use it to define hard constraints for power delivery.
Example: If the mine’s process heat dips for 30 minutes, you can store excess heat during the preceding hours and avoid asking the reactor to chase the dip.
Step 3: Define Constraints as “Musts” and “Shoulds”
Convert engineering constraints into operational ones:
- Musts: minimum heat delivery to prevent process equipment freezing, maximum allowable temperatures in heat exchangers, and minimum electrical power for safety systems.
- Shoulds: limits on how fast power can change, preferred operating ranges for efficiency, and maintenance-friendly cycling frequency.
This is where best practices become concrete. For each constraint, specify a measurement and an action. For instance, “steam outlet temperature must stay above X” becomes “if temperature drops below X for Y minutes, switch to stored heat and reduce noncritical electrical loads.”
Step 4: Build a Matching Method Using Energy Balance First
Before control logic, do an energy balance over each time block (e.g., 15 minutes or 1 hour):
- Reactor thermal output provides heat.
- Heat exchangers transfer heat to the process.
- Thermal storage charges or discharges.
- Losses to ambient are accounted for.
Then convert thermal availability to electrical output using the power conversion efficiency curve. Even if efficiency varies with operating point, you can start with a conservative constant efficiency for planning and refine later.
Example: Over a 1-hour block, the mine needs 6 MWth average. If reactor thermal output is 7 MWth and losses are 0.5 MWth, the remaining 0.5 MWth can charge storage. During the 30-minute dip to 3 MWth, storage discharges at roughly 3 MWth minus any losses, while the reactor can stay near its preferred output.
Step 5: Translate the Plan into Control Actions
A load matching plan should specify a hierarchy of actions:
- Protect musts: never violate minimum heat delivery or critical electrical power.
- Use storage: buffer thermal swings first.
- Adjust noncritical electrical loads: shed or defer controllable loads.
- Use reactor control within margins: only when storage and load actions cannot meet constraints.
This hierarchy reduces the chance that control fights itself. It also makes commissioning testing straightforward: you can test each layer by forcing a known disturbance and verifying the expected action order.
Mind Map: Load Profile Matching Workflow
Example: Two-Day Schedule with Peaks and Dips
Day 1: Electrical peaks occur for 20 minutes twice per shift. Thermal demand is steady. Strategy: keep reactor near a steady thermal setpoint, charge storage during low electrical periods, and rely on power conditioning to handle electrical peaks as long as thermal-to-electric conversion capacity is available.
Day 2: Thermal demand drops for 45 minutes while electrical demand rises. Strategy: discharge storage to maintain thermal delivery quality, then use noncritical electrical load shedding during the period when conversion capacity is constrained by the thermal buffer.
The key is that the plan is consistent: every decision is traceable to an energy balance and a constraint, not to “it seems to work.”
12.2 Thermal Integration With Industrial Steam and Hot Water Loops
Industrial steam and hot water loops are where a microreactor’s heat turns into something operators already know how to run. The goal is simple: move reactor heat into a stable, controllable thermal service without creating new failure modes or confusing the plant’s existing control logic.
Foundational Concepts That Drive Integration
A microreactor produces heat at a primary boundary, then a power conversion system turns some of that heat into electricity while the remainder can be routed to a thermal user. Thermal integration is therefore a boundary-management problem: you must keep the reactor’s primary conditions separated from the plant’s steam or hot water conditions, while still delivering the required temperature, pressure, and flow.
Start by defining three temperatures and two interfaces:
- Primary-side temperature range at the heat exchanger inlet and outlet.
- Secondary-side steam or hot water supply temperature range.
- Return temperature from the process back to the heat exchanger.
- The heat exchanger interface that transfers heat.
- The control interface that coordinates flow, pressure, and safety trips.
A practical rule: design the thermal loop so that the heat exchanger always sees a predictable approach temperature. If the approach temperature collapses, control becomes twitchy and fouling effects show up as sudden performance loss.
Loop Types and How They Behave
Steam Loop Integration
Steam loops typically include a steam header, pressure control valves, condensate return, and a deaerator or feedwater conditioning system. Your integration target is usually one of these:
- Saturated steam at a controlled pressure.
- Slightly superheated steam to stabilize downstream equipment.
Because steam systems are pressure-driven, the microreactor thermal control must manage heat input to match steam demand while respecting minimum flow and heat exchanger safety limits.
Hot Water Loop Integration
Hot water loops are flow-driven and often serve space heating, process jackets, or district heating. Here, the key variables are supply temperature, return temperature, and flow rate through the process coils or plate exchangers.
Hot water integration is often easier to stabilize than steam because you can modulate heat transfer by controlling secondary flow and bypass paths without forcing phase change.
Heat Exchanger Selection and Operating Constraints
Choose a heat exchanger type based on fouling tolerance, pressure separation needs, and maintenance access. Common choices include shell-and-tube and plate heat exchangers.
- Shell-and-tube often tolerates some fouling and provides robust separation.
- Plate exchangers can be compact and efficient but require careful attention to gasket materials and cleaning strategy.
Regardless of type, define these constraints before controls are designed:
- Minimum secondary flow to prevent overheating of the heat transfer surface.
- Maximum allowable secondary pressure.
- Maximum temperature difference across the exchanger to avoid thermal stress.
- Allowable condensate quality or dissolved solids limits if steam is involved.
A simple example: if the plant’s steam demand drops quickly, the secondary side may approach low flow. Your control system should then reduce primary heat input and open a bypass or dump condenser path so the exchanger never runs dry on the secondary side.
Control Strategy That Matches Plant Reality
Thermal integration works best when the microreactor control system treats the industrial loop as a “load” with known operating modes.
Steam Control Pattern
A common pattern uses:
- Steam pressure control on the secondary side.
- Primary-side heat input modulation to track the steam control valve position.
- Safety interlocks that enforce minimum secondary flow and maximum primary temperature.
Operators like predictable behavior. So, when steam pressure rises above setpoint, the system should reduce heat input and route excess energy to a controlled sink rather than relying on abrupt valve closures.
Hot Water Control Pattern
A common pattern uses:
- Supply temperature control using a mixing valve or variable flow.
- Primary-side heat input modulation to maintain the exchanger approach temperature.
- Return temperature monitoring to detect process-side throttling or blockage.
If return temperature suddenly increases while flow stays constant, that often indicates reduced heat transfer in the process equipment. The microreactor should then avoid “chasing” the temperature error by overdriving the exchanger.
Mind Map: Thermal Integration with Steam and Hot Water Loops
Integrated Example: Steam Header with Load Steps
Assume the plant supplies saturated steam at 6 bar(g) to a process line. Steam demand drops by 30% over 2 minutes.
- Steam pressure rises toward setpoint.
- The steam control valve closes partially, reducing secondary flow through the heat exchanger.
- Primary-side heat input is reduced using a heat exchanger control loop that tracks valve position and secondary temperature.
- A bypass or dump condenser path absorbs residual heat if secondary flow approaches the minimum limit.
- Interlocks prevent operation if secondary flow falls below the minimum safe value.
The result is that steam pressure stays within a narrow band, the heat exchanger remains within safe thermal limits, and the plant’s steam header does not experience a “surprise” pressure excursion.
Integrated Example: Hot Water Loop with Return Temperature Clues
A hot water loop supplies 90°C water to a process coil. Flow remains constant, but return temperature climbs from 60°C to 72°C.
- The supply temperature controller may attempt to correct the error by increasing heat input.
- Return temperature monitoring flags reduced process heat transfer.
- The control system limits primary heat input to protect the exchanger approach temperature.
- Operators can then investigate the process side (e.g., fouling, partial valve closure, or air binding) without the microreactor masking the symptom.
This approach keeps thermal integration from becoming a “fix everything by adding heat” strategy, which is how small process problems turn into expensive ones.
Commissioning and Verification That Prevents Control Surprises
Commissioning should include step tests and low-demand scenarios:
- Step changes in steam demand or hot water flow.
- Verification of minimum flow interlocks.
- Checks of approach temperature stability under partial loads.
- Validation that safety trips move the system to a safe thermal state without creating secondary pressure or temperature overshoots.
When these checks are done, thermal integration becomes a predictable utility: the microreactor supplies heat, the plant loop distributes it, and neither side has to guess what the other is doing.
12.3 Electrical Integration with Microgrids and Critical Loads
Electrical integration is where a microreactor stops being a heat source and becomes a dependable power plant. The goal is simple: deliver usable voltage and frequency to the right loads, with the right protections, in the right operating mode. The steps below move from foundational concepts to practical wiring and commissioning decisions.
Foundational Concepts for Microgrid Electrical Behavior
A microgrid is not just “a generator plus wires.” It has an electrical reference: frequency and voltage must be controlled or accepted. In grid-connected mode, the utility sets frequency and voltage, and the microreactor follows. In islanded mode, the microreactor must provide those references. That difference drives control strategy, protection settings, and even how you test the system.
Start by listing critical loads and their tolerance. For example, a data room may tolerate brief voltage dips but not long frequency excursions, while a pumping system may tolerate frequency variation but not loss of power to motor starters. A practical best practice is to classify loads into tiers:
- Tier 1: Must ride through disturbances with minimal interruption (controls, safety systems, communications).
- Tier 2: Must operate continuously but can accept short transfer delays (process control, refrigeration).
- Tier 3: Can be shed during abnormal conditions (nonessential lighting, comfort loads).
Then define the power quality targets for each tier: allowable frequency deviation, voltage range, and maximum transfer time.
Power Flow Architecture and Switching Strategy
Electrical integration usually uses one of two architectures:
- Single-bus with selective transfer: The microreactor and storage (if present) feed a common bus; critical loads connect through breakers or transfer switches.
- Dedicated critical bus: The microreactor feeds a main bus, and a separate critical bus is supplied through a transfer scheme with tighter protection and faster restoration.
A concrete example: a remote industrial site with a control room, a well pump, and a compressor. The control room and safety PLCs go to the critical bus. The compressor goes to the main bus. If the microreactor trips, the critical bus can be supported by a small battery-backed UPS for a short ride-through window while the reactor restarts.
Switching strategy matters because protection and control depend on what is energized when. Use interlocks to prevent unintended backfeed into the utility when grid-connected, and ensure islanding logic is coordinated with breaker states.
Generator Output Conditioning and Grid Interface
Microreactors typically produce electrical power through a generator and power conversion chain. Integration requires matching generator behavior to the microgrid.
Key items to specify and verify:
- Voltage regulation method: droop control for parallel operation, or voltage control for standalone operation.
- Frequency control mode: governor response for islanded operation, or synchronization-following for grid-connected.
- Harmonic performance: especially if loads include drives, rectifiers, or large inverters.
A practical best practice is to define a “synchronization envelope” for islanding and reconnection tests. For instance, require that voltage magnitude and phase angle be within set limits before closing the breaker. During commissioning, record actual measured values and compare them to the envelope; if you see consistent drift, adjust control gains or measurement filtering rather than just widening tolerances.
Protection Coordination for Critical Loads
Protection is where good intentions meet physics. The microgrid must clear faults quickly without unnecessary trips that would drop Tier 1 loads.
Coordinate protection in layers:
- Upstream protection: generator and main feeder breakers with settings that protect the source.
- Downstream protection: feeder breakers and motor protection that isolate the faulted branch.
- Load-side protection: UPS bypass logic, sensitive relay settings, and selective coordination for control power.
Example: a fault on a motor feeder should trip the motor breaker, not the entire critical bus. Achieve this by using selective time-current curves and by ensuring relay CT/PT ratios and wiring are correct. A simple but effective commissioning check is to inject secondary current into each relay and confirm the expected pickup and trip order.
Control Integration and Operational Modes
Electrical integration includes control logic that decides what the microreactor does when the microgrid changes.
Common operational modes:
- Grid-connected: synchronize, share load, and respond to utility disturbances within defined limits.
- Islanded: establish voltage and frequency references and manage load changes.
- Black-start or recovery: bring up essential auxiliaries first, then critical loads, then noncritical loads.
A best practice is to implement load sequencing explicitly. For example, start with reactor auxiliaries and essential cooling, then energize the critical bus, then close feeders for Tier 2 loads. This prevents inrush current from causing voltage dips that trigger protective relays.
Mind Map: Electrical Integration
Example Integration Walkthrough
Consider a remote site with a critical control building, a water treatment skid, and a utility tie line.
- Define tiers: control building and safety systems are Tier 1; pumps are Tier 2; lighting and workshops are Tier 3.
- Choose architecture: install a dedicated critical bus fed through a transfer scheme with fast changeover.
- Set control modes: in islanded operation, the microreactor provides voltage and frequency; in grid-connected operation, it follows utility references.
- Coordinate protection: ensure a feeder fault trips only the affected branch by selective breaker settings.
- Commission with evidence: run synchronization tests, verify breaker interlocks, and confirm that Tier 1 loads remain powered during simulated feeder faults.
When these pieces align, the microreactor behaves like a stable electrical neighbor rather than a temperamental guest. The system becomes predictable, and predictability is what critical loads actually require.
12.4 Safety Case Evidence Mapping to Design Basis Events
A safety case is only as useful as the chain from a design basis event to the evidence that supports safety functions. Evidence mapping is the method that keeps that chain intact when the project grows, requirements change, or teams work in parallel. The goal is simple: for every design basis event, you can point to the specific safety functions, the specific acceptance criteria, and the specific evidence that demonstrates compliance.
Step 1: Start with Design Basis Events and Boundaries
Begin by listing design basis events in a structured table: event name, initiating mechanism, time window, affected systems, and the safety functions expected to respond. For microreactors, make the boundaries explicit: what counts as “on-site,” what counts as “normal operation,” and what counts as “loss of support systems.”
Example: If the design basis includes “loss of electrical power to balance of plant,” define whether the reactor core protection relies on passive reactivity feedback and decay heat removal, or whether it also assumes active instrumentation power. If the evidence depends on passive behavior, say so in the event definition.
Step 2: Translate Events into Safety Functions and Acceptance Criteria
For each event, identify safety functions in plain language, then convert them into measurable acceptance criteria. Safety functions should be testable or analyzable; acceptance criteria should be checkable.
Example: For an event like “blocked heat removal path,” a safety function might be “maintain fuel temperature below a specified limit by ensuring heat is removed through alternate paths.” The acceptance criteria could be expressed as peak fuel temperature, cladding integrity margin, or maximum allowable pressure in a containment boundary.
A practical best practice is to keep acceptance criteria consistent in units and definitions across disciplines. If thermal limits are defined in terms of cladding temperature but electrical limits are defined in terms of power, you still need a clear mapping between them through the thermal model.
Step 3: Build the Evidence Inventory
Evidence is not just calculations. It includes design documentation, test results, inspections, component qualification, operating experience, and verification activities. Create an evidence inventory with fields: evidence ID, evidence type, scope, assumptions, applicable event(s), and confidence level.
Example: A passive heat removal claim might be supported by (1) component-level heat transfer tests, (2) system-level thermal-hydraulic analysis, and (3) verification that instrumentation used for monitoring does not affect the passive path.
Step 4: Map Evidence to Event Logic with Traceability
Traceability is the backbone of evidence mapping. For each design basis event, document the logic chain:
- initiating event → system response sequence → safety function activation → predicted performance → acceptance criteria check → evidence supporting each link.
Use a “one event, one page” approach for readability. Each page should show the event logic sequence and the evidence IDs that support each step.
Step 5: Validate Assumptions and Coverage
Many evidence gaps are really assumption gaps. For each evidence item, list assumptions and verify they match the design basis event conditions. Then check coverage: every safety function for the event must have at least one primary evidence source, and every acceptance criterion must be tied to an analysis or test result.
Example: If an analysis assumes a certain ambient temperature range, confirm that the design basis event specifies the same range. If not, either adjust the analysis bounds or document why the mismatch is acceptable.
Step 6: Handle Uncertainty and Conservative Choices
Evidence mapping should record how uncertainty is treated. If the thermal model uses conservative heat transfer coefficients, note where that conservatism enters. If test data is used, record the test conditions and how they bound the event.
A useful rule of thumb: if you can’t explain how the model stays conservative for the event, you don’t yet have evidence—you have a story.
Mind Map: Evidence Mapping Structure
Example: Mapping a Loss of Heat Sink Event
Design basis event: loss of external heat sink for a defined duration.
Safety functions: (1) remove decay heat via passive pathways, (2) prevent fuel temperature from exceeding the design limit, (3) maintain confinement boundary integrity.
Acceptance criteria: peak fuel temperature below limit; confinement leakage below threshold; no exceedance of pressure boundary limits.
Evidence mapping:
- Passive heat removal analysis supports peak fuel temperature prediction (Evidence A1).
- Heat exchanger and flow path test data supports heat transfer coefficients used in A1 (Evidence T2).
- Structural and materials qualification supports confinement integrity under thermal loads (Evidence Q3).
- Verification of instrumentation independence supports that monitoring does not alter passive behavior (Evidence V4).
The mapping page ends with a coverage check: every acceptance criterion has a linked evidence item, and every safety function has at least one primary evidence source.
Step 7: Keep the Map Alive Through Change Control
When requirements or designs change, evidence mapping must update with them. The minimum update set is: event definitions, safety function definitions, acceptance criteria, and the evidence inventory links. If a change affects assumptions, record the new assumption set and re-run the coverage check.
A small but effective practice is to require that any change request includes a “traceability impact” section: which event pages are affected and which evidence IDs need revision. That prevents silent drift where the safety case still looks complete, but the logic no longer matches the design.
12.5 Commissioning Test Plans Including Acceptance Criteria
Commissioning turns a design into a working system by proving that each safety and operational requirement is met on the actual hardware, in the actual environment. A good test plan starts with what must be true, then defines how you will measure it, and finally states what counts as “good enough.” For microreactors, the plan should cover both the reactor core behavior and the surrounding balance of plant, because most commissioning surprises show up at interfaces: heat removal paths, instrumentation wiring, and control logic.
Commissioning Scope and Evidence Strategy
Begin by listing the requirements in three buckets:
- Safety functions: shutdown, reactivity control, confinement, and heat removal.
- Operational functions: start-up sequence, power/heat regulation, load following, and normal protection trips.
- Support systems: electrical distribution, cooling loops, ventilation, radiation monitoring, and data logging.
For each requirement, define the evidence type: direct measurement (sensor readings), indirect evidence (derived parameters like heat flux), or functional evidence (a simulated trigger causes the expected state change). A simple rule helps: if a requirement cannot be measured, it must be demonstrated through a controlled functional test.
Test Phasing from Cold Checks to Power Proof
Commissioning should proceed in phases so that failures are diagnosable and containment of risk is practical.
Phase 0: Documentation and Configuration Checks
- Verify software versions, parameter sets, and interlock logic against the configuration baseline.
- Example: confirm that the trip setpoints used in the controller match the safety case values by running a “dry” logic review and a signal mapping check.
Phase 1: Instrumentation and Actuation Proof
- Calibrate sensors and verify actuators move to commanded positions.
- Example: command a shutdown actuator test mode and verify position feedback reaches the expected state within the specified time window.
Phase 2: Thermal System Integrity
- Prove heat paths without relying on reactor power.
- Example: run a full flow and temperature ramp through the primary loop and confirm that temperature gradients remain within allowable limits and that alarms trigger at the correct thresholds.
Phase 3: Subcritical and Low-Power Behavior
- Demonstrate control stability and protection response while reactivity is limited.
- Example: perform step changes in control rod position (or equivalent reactivity control) and verify that measured power proxies track expected trends without oscillation.
Phase 4: Power and Heat Output Verification
- Establish that steady-state and transient responses meet performance criteria.
- Example: execute a controlled load-following profile and confirm that heat output follows the command while safety margins remain intact.
Acceptance Criteria Design Principles
Acceptance criteria should be specific, measurable, and tied to the requirement. Use three layers:
- Pass/Fail thresholds for key parameters (timing, temperature limits, flow rates, dose-rate alarms).
- Trend and stability criteria for control behavior (no sustained oscillations, bounded overshoot).
- Interface criteria for cross-system consistency (derived heat balance agrees within tolerance).
A practical example: for a thermal protection function, acceptance might include “trip occurs within X seconds after the measured parameter crosses Y,” plus “the measured parameter returns to safe range within Z seconds,” plus “no spurious trips occur during a defined ramp.” This prevents a common failure mode where the system trips correctly once, but behaves poorly during normal operation.
Mind Map: Commissioning Tests and Evidence
Example Test Matrix Entry with Clear Criteria
Test Name: Shutdown Function Response Time Verification
- Objective: Prove that the shutdown command results in the required reactivity reduction and safe state entry.
- Setup: Reactor in a controlled low-power condition; instrumentation channels verified; actuators enabled in test mode.
- Procedure Summary: Trigger the shutdown command using the defined test input; record time stamps from command issuance, actuator movement feedback, and protection state change.
- Acceptance Criteria:
- Actuator feedback reaches required position within T1 seconds.
- Measured power proxy decreases to P_safe within T2 seconds.
- No additional protection faults occur during the event.
- Data completeness: all required channels recorded with no gaps.
Records, Deviations, and Final Acceptance
Commissioning is not just running tests; it is managing evidence quality. Each test should produce a procedure reference, measured data, pass/fail result, and any deviations with documented corrective actions. Final acceptance should include a traceability summary mapping each requirement to its test evidence, so the commissioning record answers one question: “What exactly proved compliance, and where is the proof?”
A small but important detail: when a test is repeated after a fix, acceptance should be based on the original criteria unless the requirement itself is formally changed. Otherwise, you end up with a system that passes tests but not the requirements they were meant to represent.