Petroleum Refining and Fuel Processing Essentials
1. Overview of Refining Operations and Product Slate
1.1 Refinery Purpose, Boundaries, and Common Product Categories
A refinery’s job is simple to state and tricky to execute: take crude oil as it arrives, separate it into fractions, and convert some of those fractions into saleable products that meet specifications. The “purpose” is not just producing barrels; it’s producing the right barrels, in the right proportions, with the right properties, while keeping the plant safe and stable.
Refinery Purpose
Start with the crude. Crude oil is a mixture of hydrocarbons that differ in boiling range, chemical reactivity, and contaminant content. The refinery first separates by boiling range using distillation, then treats and converts streams using processes such as hydrotreating, catalytic reforming, hydrocracking, and thermal conversion. Each process has a target: remove contaminants, improve stability, raise octane or cetane, or increase the amount of valuable lighter products.
A practical way to think about purpose is to track three outcomes:
- Separation outcome: Which fractions you can obtain directly from distillation.
- Quality outcome: Which properties you can achieve through treating and conversion.
- Balance outcome: How you allocate limited feed and unit capacity to match the product slate.
Refinery Boundaries
Refinery boundaries define what the plant controls and what it receives from outside. On the “in” side, boundaries include crude supply, water and power utilities, hydrogen supply, and chemical additives. On the “out” side, boundaries include product storage, loading, and documentation for contract specs.
Within the fence, boundaries are often described as unit-to-unit interfaces:
- Material boundaries: Stream temperatures, pressures, and phase behavior at the battery limits.
- Quality boundaries: Sulfur, nitrogen, metals, aromatics, distillation curve, and stability limits.
- Operational boundaries: Maximum allowable fouling rates, catalyst life targets, and turnaround constraints.
A common best practice is to treat these interfaces like agreements. If a downstream unit expects a stream with low chloride, the upstream handling must prevent chloride carryover rather than “fix it later.” Fixing later usually costs more and may reduce yield.
Common Product Categories
Refineries typically organize products into categories that map to customer needs and regulatory requirements. The categories below are common; exact naming varies by region and company.
Transportation Fuels
- Liquefied petroleum gas (LPG): Propane and butane used for heating and as a feedstock for petrochemical units.
- Gasoline: Blends targeting octane rating, volatility control, and cleanliness.
- Jet fuel and kerosene: Emphasis on freezing point, smoke point, and thermal stability.
- Diesel and heating oil: Focus on cetane, cold-flow properties, and sulfur limits.
- Marine fuels: Often higher viscosity grades; may require blending and treating to meet sulfur and stability requirements.
Chemical Feedstocks
Some refinery streams are sold to chemical plants because they contain useful hydrocarbon types.
- Naphtha: A versatile feed for steam cracking and other processes.
- Reformate and aromatics-rich streams: Valuable for producing aromatics and related chemicals.
- Light olefins and condensates: Where integrated systems exist, certain refinery-derived streams can support olefin production.
Industrial and Specialty Products
- Lubes and base oils: Require careful removal of contaminants and control of viscosity and color.
- Bitumen and residuals: Used for paving and roofing; quality depends on penetration, softening point, and stability.
Residuals and Byproducts
Not everything becomes a transportation fuel. Residual streams may be upgraded, blended, or used as feed for thermal conversion. Byproducts include refinery gases used as fuel or processed for recovery.
Mind Map: Refinery Purpose, Boundaries, and Product Categories
Example: How Boundaries Shape Product Outcomes
Imagine a refinery producing diesel with a strict sulfur limit. The hydrotreating unit can remove sulfur, but it cannot compensate for a crude handling problem that introduces excessive metals or chlorides into the feed. If the desalter underperforms, salts can carry into downstream units, increasing corrosion and fouling risk. The boundary lesson is straightforward: upstream boundaries protect downstream quality.
A second example is gasoline blending. The refinery may generate multiple gasoline components with different octane and volatility profiles. Blending is not just mixing; it is meeting a set of constraints simultaneously. If a component’s distillation curve is too heavy, it can cause vapor pressure issues. If it’s too light, it can hurt drivability. The boundary here is the specification set, which blending must satisfy using the components the refinery actually produces.
Practical Takeaway
A refinery is best understood as a system of interfaces: crude characteristics determine what separation can do, unit boundaries determine what quality can be preserved, and product categories determine what the system must deliver. When those three pieces are aligned, the plant can run with fewer surprises and more predictable results.
1.2 Crude Oil Characteristics And How They Drive Refinery Configuration
Crude oil is not just “feedstock.” It is a bundle of properties that decide which units are worth building, how they should be operated, and what product quality is realistically achievable. Refinery configuration is therefore a matching exercise: crude traits are paired with process capabilities, and the pairing is constrained by safety, economics, and reliability.
Core Crude Properties That Matter
API Gravity and Distillation Behavior
API gravity is a quick proxy for how light or heavy a crude is. Lighter crudes typically yield more naphtha and middle distillates with less residue, while heavier crudes push more volume into vacuum gas oil and residue. Distillation curves refine this picture by showing where material boils, which directly influences cut points and the expected yields from atmospheric and vacuum distillation.
Sulfur and Nitrogen
Sulfur drives the need for desulfurization. Higher sulfur content increases hydrogen consumption and catalyst loading in hydrotreating units, and it can also raise corrosion risk if water and chlorides are present. Nitrogen behaves similarly but with additional complications: it can poison catalysts and forms nitrogen-containing species that must be removed to meet product specs.
Metals and Salts
Metals such as nickel and vanadium often concentrate in heavier fractions and can accelerate catalyst deactivation and fouling. Salts, especially chlorides, can cause severe corrosion in preheat trains and heat exchangers. This is why crude pre-processing is not optional for many crudes; it is part of the configuration.
Carbon Residue and Conradson Carbon
Carbon residue indicates how much material tends to form coke under thermal stress. High values warn that thermal units and residue handling will be harder: heaters foul faster, drums coke more aggressively, and vacuum systems may struggle to maintain stable operation.
Viscosity and Emulsion Tendency
Viscosity affects pumpability and heat tracing requirements. Emulsions—oil-water mixtures stabilized by natural surfactants—can defeat desalters and increase water carryover, which then increases corrosion and reduces separation efficiency.
How These Properties Translate Into Unit Choices
A refinery’s unit lineup is shaped by where the crude wants to go during processing.
Distillation First, Because It Creates the Problem Set
Atmospheric distillation separates crude into naphtha, kerosene, gas oils, and residue. Vacuum distillation then reduces residue pressure so lighter components can be recovered without excessive thermal cracking. If the crude is heavy with high residue yield, vacuum capacity and heat integration become critical configuration drivers.
Hydrotreating and Hydroprocessing Where Contaminants Concentrate
Sulfur and nitrogen concentrate in gas oils and residues. That means hydrotreating capacity is often sized around those fractions, not around the crude as a whole. If sulfur is high, the refinery may need more severe conditions, more catalyst volume, or additional stages to meet jet and diesel specs.
Catalytic Upgrading Depends on Feed Quality and Hydrogen Availability
Naphtha upgrading units respond to what the crude produces. If naphtha is low in stability or high in sulfur, it may require additional treating before reforming. Hydrogen balance also matters: hydrotreating produces hydrogen demand, while reforming consumes hydrogen circulation. Configuration therefore includes both unit selection and hydrogen management.
Thermal and Resid Upgrading Reflect Coke Propensity
High carbon residue and metals push refiners toward careful residue conversion strategies. Thermal units can increase distillate yield, but they also intensify fouling and coke handling. Configuration decisions often reflect a trade: more conversion versus more downtime risk.
Practical Example: Two Crudes, Two Different Configurations
Consider Crude A: API 35, low sulfur, low metals, moderate residue. Atmospheric and vacuum distillation produce a healthy middle distillate slate. Hydrotreating is sized to meet sulfur specs with reasonable catalyst life, and naphtha upgrading can focus on octane and aromatics.
Now consider Crude B: API 18, high sulfur, high metals, high carbon residue. Vacuum distillation yields a larger residue fraction, and the vacuum system must handle a heavier, more fouling-prone stream. Desalting and filtration become stricter upstream steps to control corrosion and water carryover. Hydrotreating is expanded and staged to manage higher contaminant loads, and residue conversion is approached with tighter severity control because coke formation and heat exchanger fouling are more likely.
Mind Map: Crude Characteristics to Configuration Decisions
A Simple Configuration Checklist
When reviewing a crude assay, start with what it will produce (distillation yields), then what it will break (corrosion, fouling, catalyst poisoning), and finally what it will demand (hydrogen, catalyst, and conversion severity). If those three answers are consistent with the proposed unit lineup, the configuration is coherent. If they are not, the mismatch will show up as chronic off-spec products, unstable operations, or excessive maintenance—usually in that order.
1.3 Process Units and Typical Material Flow Through a Refinery
A refinery is best understood as a set of linked “conversion and separation” steps. Each unit changes either the composition (chemistry) or the distribution (separation), and the outputs become inputs to other units. The flow is not one straight line; it is a network where streams are routed, blended, recycled, and sometimes sent to treatment before they can be used.
Core Unit Roles
Crude pre-processing prepares the feed so downstream equipment does not get clogged or poisoned. Separation units split crude into fractions by boiling range. Conversion units reshape molecules to increase the amount of valuable products. Finishing and treating units remove contaminants and stabilize product quality. Finally, blending and dispatch turn treated streams into spec products.
A useful mental model is: remove what causes trouble, separate what you can, convert what you must, then clean and blend what you sell.
Typical Material Flow from Crude to Products
-
Crude receiving and storage
Crude is sampled, then stored to even out short-term variability. Blending at the tank farm is a practical “quality buffer”: if one delivery is heavier, the next can be balanced so the distillation feed stays steady. -
Desalting and water removal
Before distillation, salts and water are reduced. This matters because salts promote corrosion and foul heat exchangers, while water can carry chlorides into later units. A common operational goal is to keep chloride levels low enough that downstream metallurgy and catalyst systems remain manageable. -
Atmospheric distillation
The desalted crude enters the atmospheric column to produce: light ends (often routed to gas processing), naphtha-range material, kerosene/jet-range material, gas oils, and a residue. The column overhead and side draws are not “products” yet; they are intermediate streams that may require treating or conversion. -
Vacuum distillation
The atmospheric residue is heated and sent to vacuum distillation to avoid excessive thermal cracking. Vacuum reduces the boiling temperature, which helps preserve valuable distillate yields. Outputs typically include vacuum gas oils and vacuum residue. -
Hydrotreating and hydroprocessing
Distillate streams and some naphtha-range streams are commonly hydrotreated to remove sulfur and nitrogen and to improve stability. The unit also saturates reactive compounds that would otherwise cause gum formation or catalyst issues later. -
Catalytic conversion units
Depending on the refinery configuration, several conversion options may be used:
- Catalytic reforming upgrades naphtha to higher-octane gasoline components and produces hydrogen.
- Fluid catalytic cracking converts heavier gas oils into gasoline-range material and distillate, while producing coke and gas that are handled elsewhere.
- Hydrocracking converts heavier feeds into distillate and gasoline-range products with strong control of product distribution.
-
Thermal conversion units
Some refineries use thermal units to handle residues or to increase conversion. These units typically produce a mix of lighter products and heavier byproducts that must be routed to further treatment or blending. -
Gas processing and sulfur recovery integration
Light gases and off-gas streams are collected, compressed, and treated. Acid gases are removed and sent to sulfur recovery. This integration is essential because sulfur compounds can otherwise contaminate fuels and catalysts. -
Product treating, blending, and dispatch
Treated streams are blended to meet specifications such as sulfur limits, distillation curves, stability, and volatility. Additives may be used, but the foundation is correct base-stream quality. The final product is then sent to storage and loading.
Where Streams Commonly Split and Recombine
Material flow becomes clearer when you track “stream families.”
- Light ends often go to gas processing and then to fuel blending.
- Naphtha-range streams may be treated and then reformed or blended.
- Middle distillates (jet and diesel range) are frequently hydrotreated for sulfur and stability.
- Heavy gas oils and residues are routed to cracking or upgrading units.
- Off-gas and recycle hydrogen loop back to hydroprocessing and reforming systems.
Mind Map: Typical Refinery Material Flow
Example: Tracking One Barrel Through a Typical Path
Assume a barrel of medium sour crude. After desalting, it enters atmospheric distillation and yields a naphtha fraction, a jet-range fraction, and a heavier gas oil fraction. The naphtha is hydrotreated to reduce sulfur, then sent to reforming to increase octane and generate hydrogen. The jet-range stream is hydrotreated to meet sulfur and stability requirements, then blended into jet fuel. The heavier gas oil is routed to a conversion unit (such as cracking or hydrocracking) to produce additional gasoline and distillate components. Throughout, off-gases and acid gases are routed to gas processing and sulfur recovery so that sulfur is captured rather than carried into final products.
This example shows the key idea: the “barrel” becomes multiple streams, and each stream follows a route determined by boiling range, contaminant level, and the refinery’s unit capabilities.
1.4 Quality Specifications for Fuels and Feedstocks: What “Meets Spec” Means
“Meets spec” means a stream’s measured properties fall inside agreed limits, using defined test methods, sampling rules, and acceptance criteria. It is not a vibe, a target, or a guess—it’s a contract between the lab, the process, and the customer.
What Specifications Actually Specify
A specification is usually a set of property limits tied to a test method. For fuels, common categories include:
- Composition and performance: octane number, cetane index, volatility, aromatics.
- Contaminants: sulfur, nitrogen, metals, water, sediments.
- Physical behavior: density, viscosity, freezing point, distillation curve.
- Stability and safety: oxidation stability, gum formation, flash point.
For feedstocks, the logic is similar, but the “why” often points to downstream unit protection. For example, high metals in a hydroprocessing feed can accelerate catalyst deactivation, so the spec limit is really a reliability limit.
The Three-Part Test: Method, Sample, Limit
To judge “meets spec,” you need three pieces to line up.
-
Sampling: The sample must represent the bulk. If you grab a sample from a low-flow corner, you can measure “clean” while the tank is not. Good practice is to use defined sampling points, mixing procedures, and time windows.
-
Test method: The same property can yield different numbers depending on the method. Octane by one procedure is not automatically interchangeable with octane by another. Specifications therefore name the method (or an equivalent).
-
Acceptance limits: Limits can be hard bounds (must be ≤ or ≥) or ranges (must fall between). Some specs include additional rules, like “no single value above X” or “average over Y days.”
How Specs Map to Real Process Control
Specs are outcomes, but refineries control inputs. That’s why “meets spec” is usually achieved by controlling upstream variables that influence the property.
- Distillation curve is influenced by cut points, column pressure, reflux, and feed quality. If you shift a cut slightly, you can change volatility and downstream blending behavior.
- Sulfur depends on crude sulfur content and the effectiveness of desulfurization units. If hydrogen availability drops, sulfur removal can slip.
- Water and sediments relate to desalting performance and tank handling. A unit can be fine while storage practices quietly reintroduce water.
A practical way to think about it: every spec has at least one “lever” upstream. If you can’t name the lever, you’ll struggle to fix the problem when results come back.
Example: Octane Meets Spec (Without Guessing)
Suppose a gasoline blend must meet a target octane range. The refinery can influence octane through:
- Component selection: reformate, isomerate, alkylate, and straight-run components have different octane contributions.
- Blending ratios: small changes in high-octane components can move the blend number.
- Volatility constraints: raising octane with certain components can also raise RVP risk, so you check multiple specs together.
A “meets spec” decision here is not “octane looks close.” It is: the measured octane using the specified method is within the allowed range, and the blend also satisfies related constraints like distillation and RVP.
Example: Diesel Sulfur Meets Spec (And Why It’s Not Just One Number)
Diesel sulfur spec might be “≤ 10 ppm.” If a batch tests at 9 ppm, it meets spec. But the refinery also checks whether the result is consistent with process conditions:
- If hydrotreating reactor performance is drifting (for example, due to catalyst aging), the next batch may trend upward.
- If sampling is inconsistent, the 9 ppm could be misleading.
So “meets spec” is typically paired with process confirmation: the lab result matches what the unit’s operating data suggests.
Mind Map: What “Meets Spec” Means
Common Failure Modes That Break “Meets Spec”
- Wrong sample: the lab did its job, but the sample didn’t represent the stream.
- Method mismatch: the number is real, but not comparable to the spec method.
- Single-property thinking: passing one property while violating another can still fail the contract.
- Process drift: results pass today, but the unit conditions indicate tomorrow’s batch may not.
A Simple Acceptance Checklist
When you see “meets spec,” you can sanity-check it by confirming:
- The sampling was representative.
- The test method matches the specification.
- The measured values fall inside all required limits.
- Related specs were also checked, not just the headline property.
That’s what “meets spec” means in practice: a disciplined chain from stream to sample to measurement to decision.
1.5 Practical Example: Mapping a Crude Assay to a Product Slate
A crude assay is a bundle of measurements that describe what you have and how it behaves when heated. Mapping that assay to a product slate means choosing which refinery units will process each fraction so the final products meet targets like gasoline octane, diesel sulfur, and vacuum gas oil (VGO) quality. The trick is to treat the assay as a set of constraints, not a wish list.
Step 1: Translate the Assay Into Fraction Yields
Start with the crude’s distillation curve (often TBP or ASTM D86). Pick practical cut ranges that match your column and downstream unit feeds. For example, a simplified mapping might look like this:
- Light ends: naphtha range (C5–C9)
- Middle distillates: kerosene and diesel range (roughly 150–400°C)
- Heavy gas oils: VGO range (roughly 350–550°C)
- Resid: atmospheric bottoms and vacuum resid
Best practice: keep cut points consistent across planning and operations. If your planning model uses one set of cut points but your actual column control uses another, you’ll chase “mystery” yield differences.
Step 2: Convert Fraction Properties Into Unit Suitability
Each fraction has properties that determine which units can handle it.
- Naphtha: reforming and/or isomerization feed suitability depends on sulfur, nitrogen, and olefin content. High sulfur pushes you toward hydrotreating first.
- Kerosene and diesel: hydrotreating severity depends on sulfur and nitrogen. If cetane is low, you may need blending adjustments or deeper conversion upstream.
- VGO: hydrocracking or catalytic cracking feed depends on metals, Conradson carbon residue (CCR), and nitrogen. High metals and CCR increase fouling and catalyst deactivation risk.
- Resid: coking or resid upgrading depends on CCR, viscosity, and asphaltenes. High CCR generally means more coke-forming tendency.
Easy example: Suppose the assay shows elevated sulfur in the naphtha cut and moderate sulfur in the diesel cut. You can still meet diesel sulfur by hydrotreating, but you’ll likely need stronger naphtha hydrotreating (or route naphtha to a different pool) to avoid contaminating downstream reforming catalyst.
Step 3: Build a “constraint-first” slate
A slate is not just yields; it’s a set of product specs. Treat the tightest specs as constraints.
Common constraints:
- Sulfur limits for gasoline, diesel, and jet
- RVP targets for gasoline
- Distillation curve shapes for blending
- Aromatics limits or targets depending on product
- Hydrogen availability for hydrotreating and hydrocracking
Best practice: check hydrogen balance early. If hydrogen is tight, you may have to reduce conversion severity or reroute streams to units that require less hydrogen.
Step 4: Assign Streams to Units with a Routing Logic
Use a routing logic that reflects both chemistry and equipment reality.
- Atmospheric distillation overhead and light naphtha: to stabilization and blending pools
- Straight-run naphtha: to hydrotreating then reforming/isomerization
- Kerosene and diesel: to hydrotreating then blending
- VGO: to catalytic cracking or hydrocracking depending on sulfur/CCR and desired product slate
- Resid: to visbreaking/coking/resid upgrading depending on CCR and desired distillate yield
A practical routing rule: route the “most contaminated” fractions to the “most tolerant” units first, then use hydrotreating to clean up the streams that must meet strict catalyst or product specs.
Step 5: Quantify the Slate with a Simple Mass-And-Quality Sketch
You don’t need a full simulator to see whether the plan is coherent. Make a sketch that tracks:
- Mass yields by cut
- Key quality drivers by stream (sulfur, nitrogen, CCR, metals)
- Unit conversion assumptions (how much heavy material becomes distillate)
- Blending pools and final spec checks
Example numbers (illustrative):
- 1000 bbl/day crude
- Distillation yields: 120 bbl/day naphtha, 320 bbl/day kerosene/diesel, 280 bbl/day VGO, 280 bbl/day resid
- If diesel sulfur spec requires deep hydrotreating, assume a higher hydrogen consumption for the 320 bbl/day pool.
- If VGO CCR is high, prefer hydrocracking with appropriate catalyst protection or route part of it to a unit that can tolerate higher carbon residue.
The goal is internal consistency: if your assumed unit severities imply hydrogen demand far above your available hydrogen, the slate is not feasible even if yields look good.
Mind Map: Crude Assay to Product Slate Mapping
Step 6: Validate with a “Spec Closure” Checklist
Finish by checking each product pool against its specs using the routed streams.
A simple closure checklist:
- Gasoline pool: RVP and sulfur met after blending and any stabilization
- Jet pool: sulfur and distillation range met after hydrotreating
- Diesel pool: sulfur met, cetane target met via blend components
- Heavy fuel pool (if present): viscosity and stability met
- Off-spec risk: identify which stream quality uncertainty would most likely break the spec
Easy example: If the diesel pool meets sulfur comfortably but is near the cetane limit, you can adjust by shifting a small portion of higher-cetane component from the VGO-derived product pool, rather than increasing hydrotreating severity across the entire diesel pool.
This is the essence of mapping: start from assay-derived yields, apply property-driven routing, enforce the tightest constraints, and close the loop with spec checks. When the slate is coherent, the refinery plan stops being a collection of unit targets and becomes a single, traceable path from crude to products.
2. Crude Oil Handling, Assay, and Pre-Processing
2.1 Receiving, Storage, and Blending Strategies for Stable Feed Quality
Stable feed quality starts before the refinery ever sees a pump. It begins with how crude is received, how tanks are managed, and how blending decisions are made so downstream units get predictable properties rather than surprises.
Receiving Foundations
Receiving is where you turn “a delivery” into “a controlled feed.” Start with a clear sampling plan: where samples are taken, how they are composited, and how long they wait before analysis. A common mistake is assuming that one sample represents the whole batch; in reality, stratification can happen in tank cars and barges, especially when temperature and viscosity vary.
Next, verify identity and basic compatibility. Confirm the crude type against paperwork, then check for red flags like unusual density, unexpected sulfur levels, or abnormal water content. If you have multiple sources, treat each as its own quality stream until proven otherwise.
Finally, control transfer conditions. Temperature affects viscosity and water separation. If you pump a cold, waxy crude aggressively, you can carry more solids and water into storage. A practical best practice is to set transfer temperature targets based on viscosity and demulsifier performance, then enforce them with operating limits.
Storage Strategy for Consistent Properties
Storage is not just holding; it is conditioning. Tanks should be operated to minimize property drift and contamination.
Tank selection and layout. Use dedicated tanks for crudes with very different contaminant profiles when possible. If you must commingle, do it intentionally with a defined blend target and a plan for how you will clean out between campaigns.
Water and sediment control. Water and sediment are the quiet saboteurs of desalter performance and catalyst life. Maintain water draw schedules based on interface behavior, and avoid letting tanks sit long enough for solids to settle into stubborn layers. If you see increasing sediment over successive draws, adjust mixing, heating, or draw frequency.
Temperature management. Keep tank temperatures within a band that supports stable flow and predictable separation. Too hot can increase volatility and vapor losses; too cold can increase viscosity and hinder settling.
Mixing discipline. Gentle circulation can homogenize properties, but overmixing can keep solids suspended. A good rule is to mix enough to reduce batch-to-batch variability, then allow time for separation before desalter feed.
Blending Logic That Downstream Units Can Live With
Blending is where you translate crude variability into a stable feed slate. The goal is not to “average everything,” but to meet key constraints that control unit performance.
Start by choosing blend targets tied to process needs: typical examples include sulfur, density, metals, total acid number, and distillation behavior (often represented by TBP curve characteristics). Then add operational constraints such as maximum allowable water and sediment.
Use a simple mass-balance mindset. If you know each crude’s property and planned volumes, you can predict the blended property. For nonlinear properties, rely on measured correlations from your own historical data rather than generic rules.
Example: Suppose you have two crudes.
- Crude A: 2.0 wt% sulfur, density 0.88, low sediment
- Crude B: 3.5 wt% sulfur, density 0.92, higher sediment If your target sulfur for desalter and downstream hydrotreating is 2.6 wt%, then the required fraction of B is:
- 2.6 = 2.0(1−x) + 3.5x
- 2.6 = 2.0 + 1.5x
- x = 0.4 So you plan 40% B and 60% A by mass (or by volume adjusted for density). Then you check whether the higher-sediment behavior of B still keeps water and sediment within limits.
Integrated Control Loop: From Receipt to Desalter Feed
A stable feed program uses feedback, not just planning.
- Receipt verification confirms identity and baseline quality.
- Tank management reduces drift and controls water/sediment.
- Blend calculation sets targets for key properties.
- Pre-desalter checks confirm that the actual feed matches the plan.
- Adjustment rules define what you do when results differ.
Adjustment rules should be specific. If sulfur is high, you may reduce the fraction of the high-sulfur crude in the next blend. If water is high, you may extend settling time or increase interface draw frequency rather than changing blend composition immediately.
Mind Map: Receiving, Storage, and Blending for Stable Feed Quality
Practical Example: Keeping Desalter Feed Predictable
Imagine a refinery that runs a desalter train feeding two distillation columns. The desalter performance depends strongly on water content and emulsion stability.
If a new shipment arrives with slightly higher density and higher water, you do not immediately change the overall blend ratio. Instead, you route the shipment to a tank where you can manage settling time and interface draws. After you confirm that water and sediment are within the desalter envelope, you incorporate the tank into the blend plan. This approach keeps the desalter from compensating for upstream variability, which is usually cheaper than forcing the desalter to “fix” a feed that was never prepared for it.
Stable feed quality is a chain. Each link—sampling, transfer, tank behavior, blend targets, and feedback—reduces the chance that downstream units will inherit variability they cannot tolerate.
2.2 Desalting and Water Removal: Objectives and Operating Controls
Desalting and water removal exist for one practical reason: crude oil is rarely “just oil.” It arrives with dissolved salts, suspended water, and fine solids. If you send that mixture downstream, salts can form hard deposits in heaters and exchangers, and water can accelerate corrosion and create unstable separation behavior in later units. The goal of desalting is simple to state and detailed to execute: reduce salt and water to levels that protect downstream equipment and improve product quality.
Objectives That Translate Into Measurements
Start with three measurable objectives.
- Salt removal: Lower chloride content in the crude so that chloride-driven corrosion and fouling are minimized. A common control target is chloride concentration in the desalted crude, often expressed as mg/L or ppm by mass.
- Water removal: Reduce free water so that corrosion risk drops and downstream separation becomes easier. Water is tracked by BS&W (basic sediment and water) and by water-in-oil trends.
- Solids management: Keep fine solids from carrying through. Solids can trap salts and water, so “less water” and “less salt” often improve together when solids are controlled.
A useful mental model is that salts mostly ride along with water droplets and fine solids. Remove the droplets and you remove the salts.
How Desalters Work in Plain Terms
Most desalters are electrostatic units. Crude is mixed with wash water, then heated and sent through an electric field. The field encourages water droplets to coalesce into larger drops that separate more easily. The wash water also provides a path for salts to migrate out of the oil phase.
Key operating controls are therefore grouped into four levers: mixing, temperature, electric field strength, and residence/separation.
Operating Controls That Matter Most
Wash Water Rate and Quality
Wash water should be enough to dissolve and carry salts away, but not so much that you create excessive emulsion or overload the separation system. A practical approach is to adjust wash water based on chloride trends and water carryover.
Easy example: If chloride in desalted crude is high and BS&W is also high, increase wash water slightly and check emulsion stability. If chloride is high but BS&W is low, the issue may be insufficient mixing or inadequate electric field performance.
Temperature Control
Temperature affects viscosity and emulsion behavior. Too cold, and droplets don’t coalesce well; too hot, and you can worsen emulsion stability or increase energy costs without improving separation.
Easy example: If the desalter outlet water rate rises after a heater setpoint increase, the crude may be forming a more stable emulsion. Return temperature toward the operating window and verify demulsifier performance.
Demulsifier and Mixing Intensity
Demulsifier helps break emulsions and lets droplets merge. Mixing intensity controls droplet size distribution and contact between wash water and salt-bearing phases.
Easy example: If chloride removal improves but water removal worsens, you may be over-breaking the emulsion in a way that increases water carryover. Reduce demulsifier dosage slightly or adjust mixing to target coalescence rather than fragmentation.
Electric Field Strength and Electrode Performance
Electrostatic desalters rely on stable electric field conditions. Electrode fouling, poor grounding, or incorrect voltage can reduce droplet coalescence.
Easy example: If chloride removal drops suddenly while flow and temperature remain steady, check for electrode scaling and verify voltage/current readings. Fouling can act like insulation.
Separation Geometry and Residence Time
Even with good coalescence, separation needs time and proper phase disengagement. Interface level control prevents oil carryover into the water outlet and water carryover into the oil outlet.
Easy example: If water in oil increases, the interface may be too high, letting water slip into the oil outlet. Correct interface control and confirm that the water outlet isn’t overloaded.
Integrated Control Strategy
Treat desalting as a closed loop: adjust one lever at a time, watch the right indicators, and avoid chasing noise.
- Primary indicators: desalted crude chloride, desalted crude BS&W, water outlet rate, and interface level.
- Supporting indicators: crude viscosity, emulsion behavior, wash water rate, demulsifier dosage, and electric field readings.
A good practice is to define “cause-and-effect” expectations before changing setpoints.
Mind Map: Desalting and Water Removal Controls
Case-Style Example: Interpreting a Control Upset
Assume desalted crude chloride rises over two hours. Temperature and flow are steady. BS&W also rises.
A systematic interpretation is: salts are not leaving the oil phase effectively, and water droplets are not separating cleanly. The most likely causes are insufficient wash water contact (mixing), emulsion stability issues (demulsifier), or reduced electric field effectiveness (electrode condition). The next step is to check wash water rate and mixing performance first, then demulsifier dosage history, and finally electrode readings. Adjusting voltage without confirming wash contact often wastes time because the droplets cannot coalesce if they never form the right size distribution.
When desalting is controlled this way—objectives tied to measurements, and each lever tied to a specific mechanism—salt and water removal become predictable rather than mysterious.
2.3 Filtration, Settling, and Solids Management in Crude Systems
Crude systems rarely fail because the crude is “bad.” More often, the system fails because solids, water, and scale move through the wrong place at the wrong time. Filtration and settling are the refinery’s way of keeping those particles from turning into fouling, plugging, catalyst poisoning, and corrosion.
Foundations: What Solids Do in Crude
Solids in crude typically include sand, silt, corrosion products, and precipitated salts. When they travel with the oil, they can:
- Plug strainers and control valves, causing pressure drops and unstable flow.
- Accelerate corrosion by holding water and chlorides against metal surfaces.
- Form deposits in heat exchangers, raising tube skin temperatures and worsening coking risk downstream.
- Carry metals that later poison catalysts in hydrotreating and cracking units.
A practical mindset is to treat solids as a “mass transfer problem.” Particles don’t just sit there; they move with flow, settle based on density and particle size, and get trapped when the system’s pressure drop and surface area allow it.
Settling: Using Gravity Without Creating New Problems
Settling is usually the first line of defense because it is simple and low-energy. The goal is to give particles time and a calm zone to drop out.
Key practices include:
- Residence time control: If the vessel is too small for the flow rate, particles never settle. If it is oversized, you may accumulate sludge and create a new solids problem.
- Temperature management: Warmer crude lowers viscosity and helps water separate, but excessive heat can increase salt precipitation later. Operators typically balance separation temperature with downstream needs.
- Water management: Settlers and tanks rely on removing separated water. If water stays, solids and salts keep circulating.
Example: A crude with visible sand arrives at a rate that spikes during a tank switch. The operator notices rising differential pressure across upstream strainers. A settling tank that previously worked now underperforms because the flow surge shortens effective residence time. The fix is not “more filtration” first; it is stabilizing feed rate to restore settling performance, then adjusting strainer cleaning frequency.
Filtration: Strainers, Filters, and Differential Pressure Discipline
Filtration captures what settling misses. In crude service, filtration is often staged: coarse protection first, finer capture later.
Common filtration elements:
- Strainers: Coarse mesh or perforated screens that protect pumps and downstream equipment.
- Cartridge or bag filters: Higher capture efficiency but more sensitive to plugging.
- Backflush or self-cleaning filters: Useful when solids loading is variable.
Best practices focus on pressure drop and cleaning strategy:
- Track differential pressure trends, not single readings. A slow rise signals gradual plugging; a sudden jump suggests a slug of solids.
- Clean on condition. Cleaning too early wastes downtime; cleaning too late risks bypassing or damaging elements.
- Avoid bypassing trapped solids. If a filter element is bypassed or ruptures, the solids load can surge downstream.
Example: A pump trips on low suction pressure. Inspection shows the strainer basket is partially plugged with wet solids. The operator finds that cleaning was scheduled by clock time, not by differential pressure. Switching to condition-based cleaning aligns maintenance with actual solids loading.
Solids Management: Sludge, Scale, and System Cleanliness
Even with good settling and filtration, solids accumulate as sludge in tanks and as scale in heat exchangers.
Integrated practices:
- Tank bottom management: Regular sludge removal prevents thick deposits that later break loose during mixing or temperature changes.
- Water draw control: Keeping separated water low reduces the transport of dissolved salts and suspended solids.
- Heat exchanger protection: Use upstream filtration to protect exchanger surfaces, then monitor fouling indicators such as rising pressure drop and reduced heat transfer.
- Material compatibility: Corrosion products can become solids themselves; controlling water chemistry and oxygen exposure reduces the “solids factory.”
Mind Map: Filtration, Settling, and Solids Management
Putting It Together: A Systematic Control Loop
A reliable crude solids program links three observations to three actions.
Observations:
- Differential pressure across strainers and filters.
- Water separation quality in tanks or settlers.
- Heat exchanger performance indicators.
Actions:
- Adjust feed rate or mixing to restore settling effectiveness.
- Clean or backflush filtration elements based on DP trends.
- Remove tank sludge and verify water draw practices.
Example: After a change in crude source, the operator sees faster water separation but also a quicker DP rise across strainers. The likely cause is not “more solids everywhere,” but a shift in particle size distribution and salt behavior. The response is to confirm settling performance first, then tune filtration cleaning frequency to the new loading pattern.
When settling and filtration are treated as a coordinated system rather than separate chores, solids stay where they belong: out of the equipment that hates them.
2.4 Crude Assay Methods and Interpreting Distillation Curves
A crude assay is the refinery’s way of answering two practical questions: “What’s in this barrel?” and “How will it behave when heated?” The first question is composition; the second is how material separates by boiling range. Distillation curves connect both by translating temperature history into fraction yields.
Foundational Concepts for Assay and Distillation
Distillation curves are built from a controlled heating experiment. As the crude heats, vapors form and are condensed into fractions. The curve plots cumulative volume (or mass) recovered versus temperature. Two details matter immediately: the heating method (atmospheric vs vacuum) and the measurement basis (true boiling point vs equivalent). If you compare curves from different methods without adjusting for these differences, you’ll get misleading “yield” conclusions.
A second foundational idea is that crude is not a single substance. It’s a mixture where lighter components vaporize earlier, while heavier components require higher temperatures. That’s why the curve’s slope is informative: a steep rise suggests a narrow boiling range, while a long gradual climb suggests a broader spread.
Core Assay Methods Used in Refineries
Crude assays typically combine several measurements, each covering a different slice of the problem.
- Physical property tests: density, viscosity, and water/sediment. These help predict pumping behavior, desalter performance, and heat-tracing needs.
- Elemental and contaminant tests: sulfur, nitrogen, metals, and salts. These guide pretreatment severity and catalyst protection.
- Simulated distillation: a model-based boiling range distribution derived from density, viscosity, and boiling points. It’s fast and consistent, but it depends on the model assumptions.
- True boiling point distillation: a lab method that measures boiling behavior more directly. It’s slower and more resource-intensive, but it gives a more faithful boiling profile.
A practical best practice is to treat simulated distillation as a “working map” and true boiling point distillation as the “calibration check” when you’re making major cut-point decisions.
Interpreting Distillation Curves Step by Step
Start by reading the curve like a timeline.
- Identify the initial point: the temperature where the first measurable fraction distills. A higher initial point often indicates fewer very light components.
- Track the mid-curve region: this is where most atmospheric fractions form. If the curve rises quickly here, you’ll likely get higher yields of mid-distillates for the same cut temperatures.
- Examine the tail: the heavy end near the maximum temperature. A long tail usually signals more residue-forming material and can increase fouling risk in downstream heaters.
- Compare atmospheric and vacuum behavior: vacuum distillation handles the portion that would decompose under atmospheric conditions. A vacuum curve that shows a heavy tail can mean more vacuum residue and less vacuum gas oil.
To make this concrete, consider a crude whose atmospheric curve shows a broad mid-range. If you set cut points to maximize kerosene and diesel, you may still end up with a residue that is “heavier than expected,” because the tail contributes more than the curve’s midpoint suggests. That’s why cut-point selection should be based on cumulative recovery, not just a single temperature.
Mind Map: Assay Logic and Curve Reading
Example: Using a Curve to Choose Cut Points
Suppose you have two crudes, A and B, with similar density but different curve shapes.
- Crude A: steep rise from 160–260°C, then a moderate tail.
- Crude B: gradual rise across 160–300°C, with a longer tail.
If you choose atmospheric cut points at the same temperatures, you might expect similar yields. But cumulative recovery tells a different story: Crude B has more material still boiling in the “mid” region, so it tends to shift more volume into heavier fractions and residue. The operational implication is straightforward: you may need to adjust cut points or accept different product yields to keep downstream hydrotreating and blending within spec.
Example: Linking Curve Shape to Practical Unit Behavior
A refinery heater and column system cares about how quickly material vaporizes. A curve with a steep mid-section often corresponds to a more concentrated boiling range, which can reduce internal reflux demands for separation. In contrast, a broad curve can increase the “smearing” of components across trays, making it harder to hit sharp product endpoints. That doesn’t mean one curve is better; it means the separation strategy must match the curve.
Quality Checks That Prevent Common Misreads
Before using a curve for decisions, verify that the curve and assay are consistent with the crude’s handling history. If the crude has recently changed (new source, blending ratio, or contamination event), the curve may no longer represent the current feed. Also confirm that the curve’s temperature basis matches the unit’s operating basis; mixing different conventions can shift apparent cut points and create avoidable off-spec outcomes.
In short, distillation curves are not just graphs of temperature. They are cumulative yield maps that, when read carefully, connect lab measurements to column performance and product quality.
2.5 Practical Example: Designing a Desalter Strategy for High-Salt Crudes
High-salt crudes bring a simple problem with complicated consequences: salt and water form an emulsion, the emulsion carries chlorides into downstream units, and chlorides accelerate corrosion and foul heat exchangers. A desalter strategy is therefore a chain of decisions that starts with crude characterization and ends with a measurable reduction in salt-in-water and chloride carryover.
Step 1: Start with the Crude Reality
Assume a crude with these typical indicators from the assay and tank sampling: salt 600–1200 lb/1,000 bbl, basic sediment and water (BS&W) 3–6 vol%, and an emulsion tendency that produces stable water-in-oil droplets. The goal is not “remove all water,” but reduce salt concentration in the oil leaving the desalter to a level that protects the downstream furnace and atmospheric column.
Best practice: define a target chloride level in the desalted crude based on metallurgy and corrosion allowance. If you do not have a firm target, use a conservative interim target and tighten it after you see exchanger fouling and corrosion rate trends.
Step 2: Choose the Desalter Type and Operating Philosophy
For high-salt crudes, a common choice is an electrostatic desalter with wash water and chemical demulsifier. The operating philosophy is: break the emulsion, coalesce droplets, separate water, and minimize re-entrainment.
Key design levers:
- Wash water rate: enough to dilute salt and provide a phase for droplet coalescence.
- Demulsifier injection: timed and dosed to destabilize the emulsion without creating excessive sludge.
- Electric field strength: high enough to promote droplet coalescence, not so high that you cause arcing or excessive power draw.
- Temperature: warm enough to reduce viscosity and improve settling, but not so hot that you worsen vaporization or destabilize separation.
Step 3: Set a Baseline Operating Window
A practical baseline for a high-salt crude is:
- Desalter temperature: 120–160°F (adjust to crude viscosity and heat integration limits).
- Wash water: 3–10 vol% of crude, tuned by salt reduction performance.
- Electric field: set to the manufacturer’s safe operating range, then optimized by monitoring droplet coalescence and effluent quality.
- Residence time: based on droplet settling behavior; start with the design residence time and adjust only after data review.
Best practice: treat the desalter as a controlled separation system, not a “set it and forget it” vessel. Small changes in wash water rate or demulsifier dosage can shift the emulsion behavior quickly.
Step 4: Build the Chemical and Water Balance
Salt removal is driven by how much salt ends up in the separated water phase. Wash water dilutes salt and provides a medium for salt transfer from oil droplets into water droplets.
Example calculation (simplified):
- Crude feed: 10,000 bbl/day
- Salt in crude: 900 lb/1,000 bbl → 9,000 lb/day salt
- Assume 70% of salt transfers to the water phase in the desalter under baseline conditions.
- If separated water rate is 5% of crude (500 bbl/day), then salt concentration in water is roughly 12,600 lb/1,000 bbl water.
- If oil leaving the desalter retains 30% of salt, then salt in oil is about 2,700 lb/day.
Your target is to reduce the retained fraction by improving emulsion breaking and coalescence, not by only increasing wash water indefinitely. Too much wash water can increase water carryover and create downstream handling issues.
Step 5: Instrumentation and Control That Actually Matters
To avoid guessing, monitor:
- Salt in desalted crude (via chloride/salt analysis)
- BS&W in desalted crude
- Desalter interface level and water draw rate
- Demulsifier injection rate and mixing quality
- Electrical parameters (field voltage/current, power draw)
Best practice: use a structured test matrix rather than one-factor-at-a-time changes. For example, vary wash water rate and demulsifier dosage together while keeping temperature and field strength constant.
Step 6: Practical Optimization Loop
A typical optimization sequence for high-salt crude:
- Stabilize temperature and interface control.
- Confirm demulsifier mixing location and residence time before the desalter.
- Run a short test at baseline wash water.
- If salt-in-desalted-crude is high, increase wash water modestly and adjust demulsifier dosage to avoid sludge.
- If BS&W is high, reduce wash water slightly and check demulsifier over-dosing.
- If separation is slow, verify crude viscosity, heating performance, and electric field stability.
Mind Map: Desalter Strategy for High-Salt Crudes
Example: Interpreting a Common Outcome
Suppose after a baseline run you measure salt in desalted crude still above target, but BS&W is acceptable. That pattern usually indicates insufficient salt transfer to the water phase, not a gross separation failure. The first adjustments are wash water rate and demulsifier dosage, while keeping temperature and electric field within their stable ranges.
If instead BS&W is high and salt is only moderately reduced, the emulsion may be breaking poorly or re-entrainment may be occurring due to interface instability. In that case, focus on interface control, mixing quality, and avoiding demulsifier over-dosing that can create persistent emulsions.
Step 7: Close the Loop with Downstream Evidence
A desalter is successful when downstream units show fewer chloride-driven problems: reduced exchanger fouling rate, stable furnace performance, and lower corrosion indicators. Use those observations to confirm that your salt target is correct and that the desalter is not merely producing “clean-looking” oil while still carrying harmful chlorides.
A good desalter strategy ends with numbers you can defend: salt-in-desalted-crude trend, BS&W trend, and stable interface behavior over multiple operating days.
3. Distillation and Fractionation Fundamentals
3.1 Atmospheric Distillation: Feed Conditioning and Column Operation
Atmospheric distillation separates crude into fractions by boiling range at near-ambient pressure. The column’s job is simple to state and hard to do well: keep the feed stable, prevent thermal damage, and maintain predictable vapor-liquid contact so cut points land where the product specs expect them.
Feed Conditioning: Getting the Column a Clean, Predictable Job
Start with the feed’s physical state. Most crude enters as a hot liquid with dissolved gases and entrained water. Conditioning aims to reduce variability in viscosity, remove free water, and limit solids that would foul internals.
1) Heat the feed to the right temperature. If the feed is too cold, the column must do extra work to vaporize it, raising reboiler duty and shifting cut points. If it is too hot, you risk premature vaporization in the feed system and unstable reflux behavior. A practical control approach uses feed temperature targets tied to column pressure and expected vapor rate.
2) Remove water and salts before the column. Free water flashes in the preheat train and column, causing pressure swings and carryover. Salts can deposit on trays or packing, increasing pressure drop and reducing separation efficiency. Desalting upstream is the main defense, but operators still verify that the feed to the atmospheric unit has low water and chloride levels.
3) Manage solids and prevent plugging. Even small amounts of solids can accumulate in distributors, downcomers, and packing. Filtration or settling upstream helps, but the column still needs robust distributor design and routine inspection of pressure drop trends.
4) Control feed rate and composition. Atmospheric columns are sensitive to changes in crude assay. When feed rate rises without matching heat input, vapor velocity increases and separation worsens. When composition shifts toward heavier material, the same heat input yields lower vaporization fraction and different cut points.
Example: Suppose a crude blend becomes heavier by adding a residue-rich component. If the operator keeps the same feed temperature and furnace outlet temperature, the column will generate less vapor per unit feed. The result is a heavier overhead and wider product cuts. The fix is not “turn everything up,” but to adjust heat input and reflux so vapor rate and internal liquid traffic return to the operating window.
Column Operation: Pressure, Vapor-Liquid Contact, and Internal Stability
Atmospheric distillation runs at pressures high enough to avoid excessive air ingress but low enough to reduce boiling temperatures and minimize cracking. The column’s separation quality depends on stable vapor-liquid contact across trays or packing.
1) Maintain column pressure stability. Pressure affects boiling behavior and the temperature profile. A rising pressure can increase vaporization temperature, which can push heavier components toward cracking and increase gas formation. A falling pressure can reduce vapor density and alter vapor velocity, changing tray efficiency.
2) Balance reflux and draw rates. Reflux provides liquid to wash rising vapor and sharpen separation. Too little reflux makes overhead and intermediate cuts overlap; too much reflux can flood sections, raising pressure drop and lowering effective contact.
3) Control vapor rate through heat input. Vapor rate is driven by furnace duty and feed preheat. Operators watch not only temperatures but also differential pressure across the column and the stability of overhead condensation.
4) Prevent flooding and weeping. Flooding occurs when liquid and vapor traffic exceed the capacity of trays or packing, leading to loss of separation and higher pressure drop. Weeping is the opposite failure mode where liquid trickles through vapor pathways, reducing contact. Both show up as changes in pressure drop and temperature gradients.
5) Keep overhead condensation reliable. Overhead is condensed to control reflux and remove light ends. If cooling water performance drops, overhead temperature rises, reflux ratio changes, and the light product becomes less stable.
Practical Operating Checks That Tie Everything Together
Operators typically confirm performance using a small set of signals that reflect the whole system: overhead temperature, side-draw temperatures, furnace outlet temperature, column pressure, and pressure drop across internals.
Example: If side-draw temperatures start trending upward while overhead temperature stays steady, the column may be losing separation in the midsection due to flooding or fouling. The operator checks differential pressure first, then verifies feed quality and distributor performance before adjusting reflux.
Mind Map: Feed Conditioning and Column Operation
A Simple Mental Model for Cut Points
Think of the column as a set of “contact stages” where vapor rises and liquid flows downward. Feed conditioning sets how much vapor is created and how clean the contact surfaces remain. Column operation sets how long and how effectively vapor and liquid interact. When both are stable, the temperature profile becomes predictable, and the cut points behave like they were designed rather than like they were guessed.
3.2 Vacuum Distillation: Preventing Thermal Decomposition and Coking
Vacuum distillation separates heavy fractions that would decompose in atmospheric pressure. The core idea is simple: lower pressure reduces boiling temperatures, so the residue can be fractionated with less thermal stress. The practical challenge is that “less boiling temperature” does not mean “no thermal risk.” Heat still drives reactions, and coking still forms when residence time, wall temperature, and feed quality line up badly.
Foundations of Thermal Decomposition Control
Thermal decomposition in vacuum systems typically comes from two places: the heater outlet and the transfer lines. In both locations, the feed can experience high wall temperatures even if the bulk fluid temperature looks reasonable. That’s why operators focus on controlling heater severity and minimizing time at high temperature.
A useful mental model is a three-factor rule:
- Temperature level: higher temperatures accelerate cracking and polymerization.
- Residence time: longer time at elevated temperature increases coke yield.
- Surface contact: deposits form where hot surfaces contact heavy components.
Vacuum operation adds another constraint: the system must maintain low pressure without letting air in. Air increases oxygen availability, which can change deposit character and accelerate corrosion.
Vacuum System Design Choices That Reduce Coking
Vacuum distillation columns are usually fed after a heater. The heater must provide enough vaporization to support separation, but not so much that the feed “cooks” before it reaches the column. Best practice is to treat the heater outlet temperature as a controlled variable tied to feed quality.
Key design and operating elements include:
- Heater outlet temperature limits based on feed Conradson carbon residue (CCR), metals, and asphaltene content.
- Short transfer lines and insulation to reduce heat soak and hot spots.
- Column pressure stability using reliable vacuum pumps and ejectors, because pressure swings change boiling behavior.
- Distributor and tray/packing cleanliness to avoid localized flow maldistribution that can create stagnant zones.
Operating Discipline for Heater and Lines
A common failure pattern is “quiet” overheating: the heater setpoint drifts upward, or fouling increases required firing duty, and the outlet temperature rises without an obvious alarm. Monitoring should therefore include both temperature and indicators of heater performance.
Practical controls:
- Track heater duty vs. differential pressure across the heater and downstream exchangers. If duty rises while temperatures creep up, suspect fouling.
- Use outlet temperature as the primary severity lever, not just steam or fuel flow.
- Minimize hold-up by keeping line velocities adequate and avoiding unnecessary throttling.
Example: Suppose a vacuum residue feed has higher CCR than usual. If the operator keeps the same heater outlet temperature, the cracking rate increases and coke forms faster on hot surfaces. A better approach is to reduce heater severity and compensate separation by adjusting reflux or draw rates, while keeping pressure stable.
Column Internals and Separation Without Overheating
Inside the column, separation depends on vapor-liquid contact and reflux. But internally, the column is not a magic shield from coking. Heavy components can still deposit if vapor velocities are too low, if liquid distribution is poor, or if the top of the column becomes too hot due to pressure loss.
Operational best practices:
- Maintain stable vacuum so the overhead temperature profile stays within the intended range.
- Avoid flooding by watching pressure drop and temperature gradients.
- Keep reflux balanced to prevent excessive residence time in the upper sections.
Mind Map: Vacuum Distillation Coking Prevention
Example: Diagnosing a Rising Coke Rate
Imagine the vacuum column starts producing heavier bottoms with increasing drum coking in the downstream system. Heater outlet temperature is nominal, but the heater duty has been creeping upward for several days. That combination suggests fouling is increasing heat transfer resistance, pushing wall temperatures higher than before.
A systematic response:
- Confirm heater performance trends using duty and pressure drop.
- Check vacuum stability for pressure excursions that could raise effective boiling temperatures.
- Inspect line and exchanger fouling indicators to localize the hot spot.
- Reduce severity by lowering heater outlet temperature and, if needed, adjusting draw rates to preserve separation.
This approach targets the actual mechanism: higher wall temperature and longer effective residence time, not just the bulk temperature reading.
Summary of the Section
Vacuum distillation prevents coking by lowering boiling temperatures, but it still requires tight control of heater severity, residence time, and vacuum stability. When feed quality changes, the safest response is to adjust operating balances to keep wall temperatures and hold-up under control, while ensuring the vacuum system stays stable and oxygen-free.
3.3 Fractionation Products: Naphtha, Kerosene, Gas Oils, and Residues
Fractionation turns a crude’s broad boiling range into streams that match downstream unit needs. The key idea is simple: the column doesn’t “create” products; it separates by volatility and boiling behavior, then trims purity with reflux and internal contacting. If you keep that in mind, most operating decisions make sense.
Foundational Concepts That Drive Product Cuts
A fractionator column is built around three practical levers: cut points, reflux, and internal efficiency. Cut points are the temperatures or overhead/bottoms draw points used to define where one product ends and the next begins. Reflux is condensed overhead returned to the column, improving separation by giving rising vapor more chances to exchange heat and mass with descending liquid. Internal efficiency reflects how well trays or packing promote contact; poor efficiency widens product overlap and increases off-spec risk.
A useful mental model is “overlap management.” Every pair of adjacent products has a boiling-range overlap. The column tries to shrink that overlap by increasing reflux or improving efficiency. If you can’t, you compensate elsewhere—often by adjusting downstream unit severity or blending.
Naphtha: Light Ends with Big Downstream Jobs
Naphtha typically includes the gasoline-range material and is often the feed for reforming or steam cracking. Its quality is usually judged by properties tied to reactivity and stability: sulfur content, olefin levels, and distillation curve shape. High olefins can cause gum formation and catalyst fouling in reforming; high sulfur can poison catalysts and raise emissions.
Best practice: treat naphtha as a “spec-sensitive” stream. For example, if your column shows naphtha sulfur trending upward, check whether the desalter performance slipped or whether overhead condensation is carrying more sour components into the naphtha cut. A small change in upstream contamination can look like a column problem.
Example: Suppose the naphtha end point drifts higher by 10–15 °C. You may see reformate yield drop because heavier components crack less favorably and increase coke tendency. The column didn’t fail; it just shifted the feed chemistry.
Kerosene: The Middle Distillate That Likes Clean Separation
Kerosene sits between naphtha and gas oil and is commonly used for jet fuel and heating applications. Its separation goals focus on freezing behavior, smoke point, and distillation characteristics. Contaminants matter too: too much sulfur can push you into tighter hydrotreating requirements.
Best practice: control kerosene draw stability. If the column experiences feed quality swings, kerosene can become a “catch-all” for overlap from both sides. That shows up as volatility instability or unexpected density changes.
Example: If kerosene freezing point worsens after a crude change, verify whether the kerosene cut point moved or whether internal efficiency dropped due to flooding. A higher cut point can bring in heavier waxy material, even if the column temperature profile looks “close enough.”
Gas Oils: Diesel and Feedstock for Conversion Units
Gas oils include diesel-range material and heavier fractions that feed hydrotreating, hydrocracking, or catalytic units. Their quality is often judged by cetane-related behavior, sulfur, nitrogen, and metals. Metals and asphaltenes can accelerate fouling in heat exchangers and reactors.
Best practice: manage gas oil overlap with residues. When the gas oil cut point drifts too heavy, downstream hydrotreating may run at higher severity to hit sulfur and stability targets. When it drifts too light, you may lose yield and increase the burden on other units.
Example: If diesel cetane is consistently low, check whether the gas oil cut is too light (more naphtha-like material) or whether hydrotreating is underperforming. Column fractionation and reactor performance can both influence the final number, so you need to trace the chain.
Residues: The Heavy End with Fouling and Stability Constraints
Residues are the bottom product and can be used as fuel oil or as feed to thermal conversion and upgrading units. Residues are characterized by viscosity, carbon residue, metals, and asphaltene content. These properties strongly affect pumpability, heat transfer, and coking tendency.
Best practice: protect downstream heat transfer. Residue fractionation is where you often see the cost of poor separation: if too much lighter material leaves with the residue, viscosity rises and thermal units may coke faster. If too much heavy material leaves with gas oil, your diesel-range stream can become unstable and your conversion units may face higher contaminant loads.
Example: A residue viscosity spike after a crude change might be blamed on “the crude,” but a column cut shift can amplify the effect. If the residue draw is too heavy, you effectively concentrate the problematic components.
Mind Map: Fractionation Product Logic
Putting It Together with a Simple Column-to-Product Reasoning Flow
When product quality slips, don’t start with blame. Start with a chain: feed quality → column separation performance → cut point overlap → downstream unit response → final spec.
Example: If diesel sulfur is high, you can’t assume the reactor is at fault. First confirm whether the gas oil cut point shifted toward heavier, more sulfur-rich material. Then check whether column efficiency dropped (flooding, poor contacting, or pressure issues). Only after that should you adjust reactor severity or catalyst management.
    flowchart TD
  A[Crude Feed Quality] --> B[Column Separation Performance]
  B --> C[Cut Points and Overlap]
  C --> D[Naphtha Quality]
  C --> E[Kerosene Quality]
  C --> F[Gas Oil Quality]
  C --> G[Residue Quality]
  D --> H[Downstream Naphtha Unit Response]
  E --> I[Downstream Kerosene Unit Response]
  F --> J[Downstream Gas Oil Unit Response]
  G --> K[Downstream Residue Unit Response]
  H --> L[Final Product Specs]
  I --> L
  J --> L
  K --> L
3.4 Column Performance: Trays vs. Packing, Efficiency, and Pressure Drop
Column performance is the practical bridge between thermodynamics and hardware. Two knobs dominate: how well the column contacts vapor and liquid (efficiency) and how much resistance it adds to flow (pressure drop). Trays and packing both aim to create many effective contact stages, but they do it with different mechanics.
Foundational Concepts: Stages, Efficiency, and Driving Force
A distillation column is often described as if it had discrete stages. In reality, each stage has a finite ability to approach equilibrium, so we use efficiency to connect the ideal stage concept to real contact.
- The driving force for mass transfer is the difference between the actual vapor composition and the equilibrium vapor composition corresponding to the liquid composition.
- Efficiency reflects how much of the ideal equilibrium approach you actually get per stage.
- Pressure drop matters because it changes vapor density and can shift operating points, especially in vacuum service.
A useful mental model: higher efficiency usually requires more contact area or more mixing, which often increases pressure drop. The design task is to get enough efficiency without choking the column.
Trays: Discrete Contact and Predictable Hydraulics
Trays create contact by forcing vapor to bubble through liquid on the tray. Each tray provides a relatively uniform contact zone, which makes performance easier to estimate and troubleshoot.
Key tray behaviors:
- Weeping and flooding define the safe operating window. Weeping occurs when liquid leaks through the vapor path; flooding occurs when vapor flow overwhelms liquid drainage and the tray becomes hydraulically overloaded.
- Downcomers and liquid holdup influence residence time and mixing. More holdup can improve separation but increases pressure drop.
- Bubble-cap, sieve, and valve trays differ in how they distribute vapor and handle varying loads.
Best-practice example: If a tray column is trending toward flooding, operators typically reduce vapor rate or adjust reflux/feed distribution to restore the hydraulic margin. The separation often recovers because the contact regime returns to the intended bubbling behavior.
Packing: Continuous Contact and High Area
Packing provides contact through a large surface area and promotes film-to-film mass transfer. Instead of discrete trays, liquid flows downward over packing surfaces while vapor flows upward around them.
Key packing behaviors:
- Pressure drop comes from friction as phases move through void spaces.
- Liquid distribution is critical. Poor distribution creates channeling, where vapor bypasses wetted surfaces and efficiency collapses.
- Flooding still exists, but it is governed by the balance between vapor velocity and the ability of liquid to drain and spread.
Best-practice example: In a packed column, a gradual rise in pressure drop with stable product quality can indicate progressive wetting changes or fouling. A quick check of differential pressure trends across sections helps distinguish normal load changes from distribution problems.
Efficiency: How Trays and Packing Differ in Practice
Trays and packing both have an “effective stage” concept, but the sources of inefficiency differ.
- Tray inefficiency often comes from incomplete mixing, non-ideal residence times, and deviations from equilibrium due to limited interfacial area and bubble dynamics.
- Packing inefficiency often comes from mass transfer limitations in liquid films, vapor-side resistance, and maldistribution.
A concrete example: Suppose you need to separate a light naphtha cut where relative volatility is modest. If you choose trays, you may need more trays to compensate for tray efficiency below ideal. If you choose packing, you may need sufficient packing height and correct liquid distribution to avoid channeling that wastes the available area.
Pressure Drop: Why It Changes the Design Choice
Pressure drop is not just a nuisance; it can determine whether the column can operate at all.
- In atmospheric service, pressure drop affects pump sizing, overhead pressure control, and energy use.
- In vacuum service, pressure drop is often the limiting factor because the allowable absolute pressure is tight. Even small additional drop can force the column to operate at a less favorable temperature/pressure combination.
Trays generally have pressure drop that scales with vapor rate and liquid holdup, with a strong dependence on hydraulic regime. Packing pressure drop scales with vapor velocity and liquid load, and it can increase sharply as flooding approaches.
Mind Map: Column Performance Tradeoffs
Example: Choosing Between Trays and Packing for a Typical Cut
Imagine a column section that must achieve a target separation with limited allowable pressure drop. If the service is near atmospheric and the feed rate varies widely, trays can be attractive because the hydraulic window is well characterized and performance is easier to interpret during load changes. If the service is vacuum-limited and every millibar counts, packing often wins because it can deliver high efficiency per unit height with careful distribution design.
In both cases, the “best” choice depends on the same practical checks:
- Hydraulic margin: stay away from flooding/weeping limits.
- Distribution quality: ensure liquid reaches packing uniformly or liquid level is stable across trays.
- Pressure drop budget: confirm the column can meet the required operating pressure at the expected loads.
When these three checks are satisfied, the efficiency and pressure drop behavior become predictable enough to support stable operation and consistent product quality.
3.5 Practical Example: Selecting Cut Points to Balance Yield and Quality
Cut points are the boundaries that decide which molecules end up in which product pool. In distillation and fractionation, they are not just “where the line is drawn”; they control how much of each fraction’s key properties you capture, and how much you accidentally drag along from neighboring cuts. A good cut-point strategy starts with a property map, then uses operating constraints to keep the column stable.
Foundational Idea: Properties Change Smoothly, but Specs Do Not
As boiling range increases, typical trends move in predictable directions: density rises, viscosity increases, sulfur and nitrogen often increase, and volatility decreases. Specs, however, are hard edges. For example, jet fuel volatility limits are tight, while diesel cetane and distillation endpoints have their own boundaries. The practical problem is that the column produces a distribution, not a perfect rectangle. If you choose a cut point too aggressively, you may meet one spec while violating another.
A useful mental model is to treat each cut point as a “probability gate.” The closer you place the gate to the desired boundary, the more you reduce off-spec carryover, but the more you risk losing yield because some in-spec material sits on the wrong side of the gate due to the distribution.
Step 1: Translate Product Specs Into Target Property Windows
Pick the properties that actually drive the specification for each product. For a typical light-to-middle refinery split, you might focus on:
- Naphtha: initial boiling point, end point, and sometimes aromatics or gum-forming tendencies.
- Kerosene/Jet: smoke point, freeze point, and distillation endpoints tied to volatility.
- Diesel: 95% point, cetane-related behavior, and sulfur limits.
Then convert those into boiling-range targets using your lab data and historical correlations. If you have a crude assay and a distillation curve, you can estimate where the “spec boundary” likely falls.
Step 2: Use the Column’s Separation Ability to Estimate Overlap
Separation ability is captured by how sharp the cut is. In practice, you can infer sharpness from:
- Number of theoretical stages and reflux ratio
- Pressure and temperature profile
- Tray/packing performance and fouling state
If the column is operating with high efficiency and stable hydraulics, the overlap between adjacent cuts is smaller. That means you can place cut points closer to the spec boundary without as much off-spec carryover.
If efficiency drops, overlap grows. In that case, the same cut point can suddenly start producing systematic contamination, even if the operator hasn’t changed anything else.
Step 3: Balance Yield and Quality with a Simple Accounting Approach
For each candidate cut point, estimate three quantities:
- Recovered in-spec mass for the target product
- Contaminant mass that leaks into the product from neighbors
- Material displaced into the adjacent cut (which may be beneficial or harmful)
A practical way to do this without heavy math is to use a “mass split table” built from historical fractionation data or simulated product distributions. You then apply spec thresholds as pass/fail filters.
Mind Map: Cut Point Selection Logic
Example: Choosing a Kerosene Cut Between Naphtha and Diesel
Assume you are selecting the cut point that defines the boundary between a kerosene (jet) product and the adjacent diesel-range product. Your jet spec is sensitive to volatility, so you want to minimize heavy carryover that increases the end point.
-
Start with a boiling-range target
- Suppose your jet end-point spec corresponds to a boundary around a certain temperature on the column.
- Historical data shows that when the cut is placed slightly too low, you lose jet yield because some in-spec material shifts to the diesel pool.
-
Test two candidate cut points
- Cut A (more conservative): place the boundary slightly lower to reduce heavy carryover into jet.
- Cut B (more aggressive): place the boundary slightly higher to capture more jet yield.
-
Estimate outcomes using overlap behavior
- With Cut A, jet yield drops because part of the lighter end of the diesel-range distribution is now excluded from jet.
- With Cut B, jet yield increases, but heavy molecules begin to leak in, raising the jet end point and potentially pushing it out of spec.
-
Apply a margin rule
- Instead of aiming at the spec line, aim for a margin that accounts for normal operating variation. If your column temperature control typically drifts within a small band, you should choose the cut point so that even with that drift, the jet end point remains inside the limit.
-
Check the displaced product
- Material excluded from jet becomes part of the diesel pool. That can be helpful if it improves diesel properties, but it can also worsen diesel sulfur or distillation endpoints depending on the feed.
- The best cut point is the one that makes the overall product slate meet all critical specs, not just the one you’re focusing on.
Step 4: Turn the Choice Into an Operating Plan
Once you select the cut point, you must ensure the column can maintain the separation needed. If the cut point is tight, small changes in reflux or feed rate can change overlap. A practical operating plan includes:
- Confirming that reflux and heat duties keep the column within its stable range.
- Monitoring key indicators tied to cut sharpness, such as temperature profile stability and product draw rates.
- Using a “spec-first” response: if jet end point trends high, adjust to reduce heavy leakage rather than chasing yield.
The core lesson is simple: cut points are a trade between yield and contamination, and the column’s separation ability decides how fine that trade can be. When you choose cut points with property windows, overlap estimates, and spec margins, the refinery stops treating distillation like guesswork and starts treating it like controlled measurement.
4. Feedstock Pretreatment and Contaminant Control
4.1 Sulfur, Nitrogen, Metals, and Halides: Sources and Impacts
Crude oil is not just hydrocarbons; it also carries a small but consequential “impurity package.” In refining, those impurities show up in different units, react with catalysts, foul equipment, and determine whether products can meet sulfur, nitrogen, and corrosion-related specifications. The key is to track where each impurity comes from, how it behaves during heating and separation, and what failure modes it triggers.
Sulfur
Sulfur enters refineries in multiple chemical forms: hydrogen sulfide (H2S) and mercaptans in lighter fractions, and thiophenic and other sulfur compounds in heavier fractions. During distillation, sulfur largely follows the boiling range: lighter streams concentrate more volatile sulfur species, while heavier streams carry more refractory sulfur compounds.
Impacts depend on the unit. In hydrotreating, sulfur consumes hydrogen and poisons catalysts, reducing activity and increasing the time between regenerations. In FCC and other catalytic processes, sulfur can promote coke formation and shift product distribution. In combustion-related products, sulfur affects emissions and can also contribute to deposit formation in engines and boilers.
A practical best practice is to treat sulfur as a balance problem, not a single-number problem. If you know the sulfur content and cut points of your feed streams, you can anticipate which downstream unit will “feel” the highest sulfur load and plan pretreatment accordingly.
Nitrogen
Nitrogen is often present as basic compounds (like pyridines) and as more complex structures in heavier fractions. Unlike sulfur, nitrogen compounds can be more strongly associated with specific fractions, so crude selection and cut-point strategy matter.
In hydrotreating, nitrogen compounds consume hydrogen and can form ammonia. Ammonia can then contribute to corrosion risk and can interfere with downstream separation and product stability. In catalytic cracking, nitrogen can poison acid sites and reduce conversion.
A simple example: if a crude has higher nitrogen in the gas oil range, the hydrotreating reactor may show faster activity loss even when sulfur levels look manageable. That pattern is a clue that nitrogen is driving catalyst deactivation.
Metals
Metals in crude typically include iron, nickel, vanadium, and sometimes sodium and calcium. They often exist as organometallics or as salts suspended in the crude. During heating, some metals remain in the liquid phase and concentrate in heavier fractions; others can deposit on hot surfaces.
Metals are especially troublesome in catalytic units because they can deposit on catalysts and block pores. In thermal units, metals can accelerate fouling and corrosion. Vanadium and nickel are notorious for forming deposits that are hard to remove, and iron can catalyze unwanted reactions that increase coke.
A practical control is to reduce metals before they reach sensitive units. Desalting and filtration help remove salt-associated metals, while careful handling of water and solids prevents metal carryover.
Halides
Halides, mainly chlorides and sometimes fluorides, usually come from formation water and salts. They tend to follow the water and salt behavior rather than the pure hydrocarbon boiling range.
Chlorides are a corrosion and catalyst issue. In the presence of water and oxygen, chlorides can form corrosive species that attack equipment materials. In catalytic systems, chlorides can also affect catalyst performance and regeneration behavior.
A useful mental model is: halides are “where the water is.” If desalting performance is inconsistent, chloride levels in downstream feeds can swing, and you may see corrosion-related symptoms or unexpected unit upsets.
Mind Map: Impurities and Their Refinery Impacts
Integrated Example: Tracing Impurities Through a Typical Flow
Consider a refinery that routes atmospheric gas oil to a hydrotreating unit and then sends hydrotreated product to a catalytic process. If the crude has elevated nitrogen in the gas oil fraction, the hydrotreating unit may show higher ammonia formation and faster catalyst activity loss even if sulfur removal is on target. If the same crude also carries higher salt and metals, poor desalting can raise chloride and metal carryover, increasing corrosion risk and catalyst deposition. The integrated takeaway is that “meeting sulfur spec” does not guarantee stable catalyst life or corrosion control; each impurity has its own pathway and failure mode.
Practical Checklist for Operators and Process Engineers
- Track impurity by fraction, not only by whole-crude averages.
- Use desalting and water management to control halides and salt-associated metals.
- Monitor catalyst performance indicators alongside sulfur and nitrogen removal.
- Treat metals as a deposition risk and plan upstream cleanliness to protect sensitive units.
- When symptoms appear, map them to the impurity most likely to reach that unit in the relevant fraction.
4.2 Hydrotreating Feed Preparation: Mixing, Heating, and Filtration
Hydrotreating catalysts dislike surprises. Feed preparation is where you remove the “surprises” that cause poor conversion, rapid catalyst deactivation, and unstable operation. This section follows a simple logic: first make the feed uniform, then bring it to the right temperature and phase behavior, then remove particles and water that would otherwise foul internals or consume hydrogen.
Mixing for Uniformity and Stable Operation
Hydrotreating units often receive multiple incoming streams: straight-run gas oils, hydrotreated recycle, naphtha cutbacks, and sometimes vacuum gas oil blends. Each stream can differ in sulfur, nitrogen, metals, and boiling range. If you mix poorly, the reactor sees local pockets that are richer in contaminants or heavier than intended.
A practical mixing approach starts with a clear target: the reactor inlet should match the design feed properties used for catalyst performance and heat balance. Operators typically control mixing by:
- Using measured flow rates with tight instrumentation so blend ratios stay within a defined window.
- Ensuring adequate residence time in the mixing vessel so composition gradients dissipate.
- Avoiding stratification when lighter and heavier components are combined; gentle agitation and correct vessel level control help.
Example: Suppose Stream A is a low-sulfur gas oil and Stream B is a higher-sulfur, metal-bearing stream. If the blend ratio drifts by 10% during a shift change, the reactor inlet sulfur can jump enough to increase hydrogen sulfide formation. That can raise downstream acid gas load and shift the unit toward more severe conditions than planned.
Heating for Correct Phase Behavior and Reaction Readiness
Heating is not just about reaching a setpoint temperature. It also ensures the feed behaves consistently as it enters the reactor system. Hydrotreating feed may contain dissolved gases, light ends, and trace water. Temperature affects viscosity, vapor-liquid distribution, and heat transfer.
Key heating best practices include:
- Using heat exchangers with stable approach temperatures so the outlet temperature does not swing with fouling.
- Maintaining stable pressure to avoid flashing that can change flow distribution.
- Preheating in a controlled sequence so you don’t create hot spots that accelerate coking in upstream equipment.
Example: If a feed line heats too aggressively right before a filter, the lighter components can partially vaporize. The filter then sees changing flow regimes, which can increase differential pressure and lead to premature plugging.
Filtration for Particle and Water Removal
Filtration protects the reactor and catalyst bed by removing solids and reducing the risk of water-driven corrosion and catalyst damage. Particles can include rust, scale, catalyst fines from upstream units, and sand-like contaminants. Water can be present as free water droplets or as emulsified water.
A systematic filtration strategy includes:
- Choose the right filtration stage based on what you expect to remove.
- Coarse filtration targets larger solids.
- Fine filtration targets smaller particles that can still foul catalyst.
- Control differential pressure and establish changeout criteria.
- Prevent filter bypass by interlocking or alarm logic so you don’t “keep running” with unfiltered flow.
- Manage water by ensuring upstream desalting and dehydration are effective; filtration is not a substitute for desalting.
Example: Consider a feed with elevated iron from upstream corrosion. Even if the iron is low in mass, it can deposit on catalyst surfaces. Over time, this increases pressure drop and reduces activity. A properly sized filter train catches the solids before they reach the bed.
Integrated Workflow from Blend to Reactor Inlet
The three activities—mixing, heating, and filtration—should be treated as one chain. If mixing is off, filtration can plug faster because the feed contains uneven heavy fractions. If heating is unstable, filtration performance changes. If filtration is neglected, catalyst life shortens and hydrogen consumption rises.
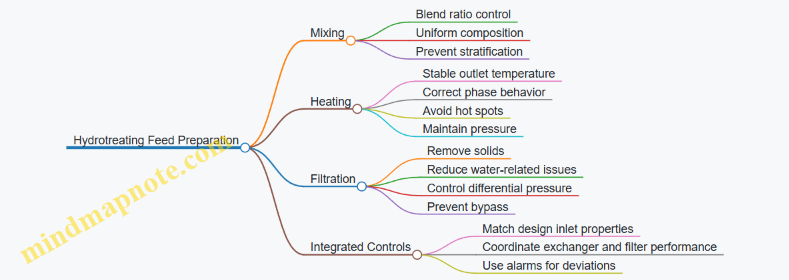
Practical Example: Preparing a Gas Oil Blend
Assume a unit plans to process a blended gas oil for diesel-range hydrotreating. The operator receives two feeds: one from a desalter-treated tank and one from a different tank with slightly higher solids.
A robust preparation sequence looks like this:
- Mix the two feeds in a controlled ratio using measured flow signals, then verify blend stability by checking key properties (such as density or sulfur proxy) before the heating train.
- Heat the blended feed through exchangers to the reactor inlet temperature target while keeping pressure high enough to avoid flashing.
- Filter the heated feed using a staged filter setup sized for the expected solids load, then monitor differential pressure and enforce filter changeout before plugging reduces flow.
If differential pressure rises faster than normal, the operator checks whether the blend ratio drifted (mixing issue), whether exchanger fouling changed the outlet temperature and viscosity (heating issue), or whether upstream solids increased (filtration issue). Each check points to a specific control action, which is the real goal of feed preparation: make the reactor conditions predictable.
4.3 Coke and Fouling Prevention: Thermal Management and Cleanliness
Coke and fouling are cousins: both reduce heat transfer and flow area, but coke is typically a carbonaceous deposit formed by thermal cracking, while fouling can include salts, asphaltenes, polymers, and corrosion products. In practice, they show up together because the same root causes—too much residence time, too high temperature, and dirty feed—push multiple mechanisms at once.
Foundations: What Drives Deposit Formation
Start with three levers: temperature, time, and chemistry.
- Temperature controls reaction rate. Higher temperatures accelerate cracking reactions that form coke precursors.
- Time controls how long precursors have to grow into solid deposits. Longer residence time increases the chance that sticky intermediates become hard.
- Chemistry controls whether the feed contains components that readily form deposits. Heavy aromatics, asphaltenes, and metals can promote deposition and catalyze side reactions.
A practical way to think about it is to treat the process like a kitchen timer. If the pan is too hot and you leave the food too long, you get burnt bits. If the ingredients are already prone to sticking, you get burnt bits faster.
Thermal Management: Controlling Severity Without Guesswork
Thermal units and high-temperature sections often operate near the edge of acceptable deposition. The goal is to reduce “thermal severity” while still meeting conversion or product targets.
-
Match heat input to duty
- Use exchanger performance data to ensure you are not compensating for fouling by over-heating. If an exchanger is losing heat transfer, raising outlet temperatures can worsen coke formation downstream.
-
Control outlet temperatures and ramp rates
- Deposits tend to form where temperatures are highest and where vapor-liquid contact is favorable for precursor formation. Keep temperature profiles stable during steady operation and avoid unnecessary ramping during transitions.
-
Minimize residence time in hot zones
- If you can increase flow rate within design limits, you reduce time for precursors to polymerize and solidify. Watch for unintended throttling or valve issues that quietly increase residence time.
-
Manage phase behavior
- Coke often forms at interfaces where heavy components concentrate. Ensure that vaporization and condensation patterns are consistent with design. Sudden changes in pressure or temperature can shift where heavy material accumulates.
Cleanliness: Feed and System Practices That Actually Matter
Even perfect temperature control struggles if the feed brings in “deposit starters.” Cleanliness is not just about filters; it is about preventing contaminants from reaching hot surfaces.
-
Remove water and salts early
Water can carry dissolved salts that deposit as solids when heated. Desalting effectiveness and water separation performance directly influence fouling propensity. -
Control solids and catalyst fines
Solids act like nucleation sites. If upstream filtration or separation is inconsistent, deposits can start sooner and grow faster. -
Reduce metal carryover
Metals can catalyze cracking and promote coke. Monitor upstream sources and ensure separation equipment is maintained. -
Keep equipment surfaces clean
Deposits are easier to prevent than to remove. Maintain gasket integrity, avoid bypassing filtration, and verify that cleaning procedures are performed on schedule for critical exchangers and heaters.
Where Deposits Form: A Systematic Map of Risk
Deposits usually appear in predictable locations: high-temperature heater tubes, transfer lines with long residence time, and exchanger surfaces where heavy components concentrate.
Practical Examples: Turning Principles Into Actions
Example 1: Exchanger performance drift
If an exchanger’s approach temperature worsens over several days, resist the urge to immediately raise heater outlet temperature. First check whether fouling is already reducing heat transfer. Raising temperature increases cracking severity and can accelerate coke formation in downstream hot sections. A better sequence is to confirm fouling indicators, inspect differential pressure trends, and verify feed cleanliness before adjusting thermal setpoints.
Example 2: High-temperature line throttling
A partially closed control valve can increase residence time in a hot transfer line. Even if temperatures look “normal” at the sensor, the fluid spends longer in the hottest region, increasing deposit growth. Correcting the valve position and verifying control loop behavior can reduce fouling without changing chemistry.
Example 3: Salt breakthrough after desalter upset
Suppose desalter performance degrades due to emulsion stability issues. Salt carryover increases, and exchanger fouling accelerates. The deposit may look like “mystery scale,” but the pattern often matches upstream water/salt control problems. Restoring desalter operation and confirming water separation effectiveness typically reduces fouling rate.
Operational Checks That Close the Loop
Prevention is easiest when you connect observations to causes.
- Track pressure drop across exchangers and filters as early warning.
- Monitor heater outlet temperatures and flow stability to catch residence time changes.
- Review feed assay trends for heavy components, metals, and water/salt indicators.
- Use inspection findings to refine which equipment is most sensitive, then focus cleanliness and thermal controls there.
Coke and fouling prevention is not a single trick. It is a coordinated routine: keep thermal severity controlled, keep the feed clean, and respond to early performance signals before the process turns “slightly dirty” into “expensively dirty.”
4.4 Corrosion and Scale Control: Water, Chlorides, and Oxygen Management
Corrosion and scale are often treated as separate problems, but in refinery service they usually share the same cast of characters: water, chlorides, and dissolved oxygen. Water provides the electrolyte path. Chlorides accelerate localized attack and keep protective films from behaving. Oxygen determines how aggressively metals are driven toward stable oxides. Manage those three, and you typically reduce both corrosion rate and the tendency to form hard deposits.
Foundations: What Corrosion Needs to Happen
Corrosion is an electrochemical process. You need an anode (metal surface), a cathode reaction (commonly oxygen reduction in many aqueous systems), and an electrolyte (water with dissolved ions). In refinery equipment, the electrolyte is rarely pure water; it contains chlorides, sulfides, acids, and sometimes suspended solids. When oxygen is present, the cathodic reaction is faster, which increases corrosion current. When chlorides are present, they increase conductivity and destabilize passive layers, so localized pitting becomes more likely.
Scale is different but related. Scale forms when dissolved species precipitate as temperature, pH, or concentration changes. Chlorides themselves usually don’t form scale, but they influence chemistry that leads to scale, and they can concentrate at the metal surface as water evaporates or as flow patterns create local gradients.
Water Management: Keep the Electrolyte Under Control
Start by controlling where water enters and how it is distributed. In crude and intermediate services, water can come from desalting inefficiency, condensation of overhead vapors, or leaks from seals and instrument air systems. A practical best practice is to treat water as a measurable contaminant: track water content in feed streams, monitor drum levels, and verify that drain systems are functioning.
Operationally, avoid stagnant wetting. Dead legs and low-flow corners allow oxygen and salts to concentrate. If you see recurring water accumulation, correct the cause rather than relying on periodic draining.
Chloride Control: Prevent Localized Attack and Concentration
Chlorides are notorious because they promote pitting and under-deposit corrosion. They also tend to concentrate where water evaporates or where heat transfer is uneven. That’s why the same chloride concentration can be harmless in one location and damaging in another.
In practice, chloride control is a chain: crude desalting performance, dehydration of downstream streams, and preventing carryover of brine droplets. For example, if a desalter is underperforming, you may observe higher chloride in overhead condensate and increased corrosion in downstream exchangers. The fix is not only “more chemical” but also verifying electric field strength, residence time, wash water rate, and emulsion breaking.
A simple diagnostic approach is to compare chloride trends across boundaries. If chloride jumps after a specific exchanger or separator, you likely have carryover, poor separation, or a leak path.
Oxygen Management: Slow Down the Cathodic Reaction
Oxygen-driven corrosion is common in systems that contact air or have oxygen ingress through seals, vents, or leaks. In closed cooling and water systems, oxygen can also enter via air entrainment or poor deaeration.
Two practical controls are common:
- Exclude oxygen by maintaining tight seals, correct venting, and proper inerting where applicable.
- Reduce oxygen concentration using deaeration or chemical oxygen scavengers in water circuits.
For a concrete example, consider a heat exchanger in a service where condensate returns to a tank. If the tank is vented to air and the return line is not blanketed, oxygen dissolves into the condensate. That oxygen then accelerates corrosion on the exchanger tube side. Switching to a controlled blanket and ensuring consistent condensate routing can reduce corrosion without changing metallurgy.
Coupling Effects: How Water, Chlorides, and Oxygen Team Up
When chlorides and oxygen coexist, you often get the worst combination: oxygen reduction drives corrosion current, while chlorides destabilize protective films and promote pits. Under deposits, oxygen can be depleted at the metal surface while oxygen remains in the deposit outer region, creating differential aeration cells. This explains why scale and corrosion can appear together even when bulk oxygen seems moderate.
Advanced Details: Where Problems Show Up and Why
Hot spots: Corrosion and scale often concentrate where temperature gradients are steep, such as exchanger inlet sections or fouling-prone areas. Higher temperature can increase reaction rates and also change solubility, promoting precipitation.
Flow regime: Turbulence can reduce boundary-layer concentration and slow scale growth, while laminar or low-velocity regions allow salts to concentrate. That’s why similar chemistry can yield different outcomes across the same unit.
Materials and coatings: Carbon steel and low-alloy steels are sensitive to oxygen and chloride pitting. Stainless steels resist general corrosion better but can still pit in chloride-rich, oxygenated water. Coatings and linings help only if they remain intact and well adhered; underfilm corrosion can occur if water and chlorides get under the coating.
Mind Map: Corrosion and Scale Control Logic
Example: Diagnosing a Chloride and Oxygen Corrosion Pattern
A refinery reports increased tube-side corrosion in a condensate exchanger. Chloride analysis shows a moderate increase, but oxygen measurements in the condensate are high. The exchanger is located downstream of a tank that is intermittently vented to air. The likely mechanism is oxygen ingress into the condensate, which increases corrosion rate, while chlorides contribute to localized pitting once the protective film is destabilized.
Corrective actions follow the logic: first, stop oxygen ingress by changing venting/blanketing and verifying seal integrity. Second, confirm desalting and dehydration performance to prevent chloride carryover. Third, inspect for deposits that could create differential aeration; cleaning and improved water chemistry control reduce both corrosion and scale formation.
Practical Checklist for Operating Discipline
- Verify water sources and ensure drainage paths are clear.
- Track chloride trends across unit boundaries, not just at one sampling point.
- Control oxygen ingress through vents, seals, and condensate handling.
- Inspect hot spots and low-velocity areas where concentration effects are strongest.
- Treat deposits as part of the corrosion system, not just a maintenance item.
4.5 Practical Example: Reducing Catalyst Poisoning via Upstream Pretreatment
Catalyst poisoning is rarely a single villain. It is usually a chain: contaminants enter the process, survive pretreatment gaps, reach the reactor, and then either block active sites or trigger irreversible chemistry. This example walks through a systematic upstream pretreatment approach for a hydrotreating feed that is trending toward higher nitrogen and metals, with occasional chloride spikes.
Foundational Idea: Match the Contaminant to the Control Point
Start by separating contaminants into three buckets, because each bucket responds to different pretreatment actions.
- Site blockers: metals (Ni, V), iron, and fine solids that deposit on catalyst surfaces.
- Chemistry poisons: nitrogen compounds that consume hydrogen and form strongly adsorbing species.
- Corrosion and halide-driven issues: chlorides and related salts that can promote corrosion and accelerate catalyst damage.
A good pretreatment plan targets the earliest point where the contaminant can be removed without creating new problems like emulsions, excessive pressure drop, or unstable separation.
Step 1: Confirm the Feed Problem with a Tight Data Set
Before changing equipment settings, collect a small but decisive set of measurements for the same operating window:
- Metals and solids: ICP results for Ni and V, plus a solids/particle count trend.
- Nitrogen: total nitrogen and a quick check of ammonia or basic nitrogen presence.
- Chlorides: chloride in the crude-derived stream, and whether it correlates with water content.
- Water and emulsion stability: BS&W and basic sediment behavior.
If chloride spikes align with higher water, the pretreatment focus shifts toward water removal and salt control rather than only catalyst-side mitigation.
Step 2: Stabilize Upstream Separation So Contaminants Don’t Ride Through
Assume the feed comes from a desalted atmospheric residue or heavy gas oil line. The pretreatment goal is to keep salts and fine solids out of the hydrotreating reactor.
Best practice actions
- Desalter performance check: verify electric field strength, wash water rate, and temperature. A common failure mode is “good desalting on average, poor desalting during upsets,” which shows up as intermittent chloride spikes.
- Water management: keep water in the desalter and upstream separators within a stable range. Too little wash water can leave salts; too much can worsen emulsions.
- Filtration discipline: ensure strainers and filters are not bypassed during high solids periods. Pressure drop trends are your early warning system.
Concrete example
When operators observed chloride rising from a stable baseline to a higher level for a few hours at a time, they checked desalter logs and found wash water flow had been reduced during a minor pump vibration event. Restoring wash water and correcting the pump control logic reduced chloride excursions, and the subsequent catalyst run showed fewer signs of rapid activity loss.
Step 3: Reduce Nitrogen Load Before the Reactor
Nitrogen compounds can poison catalysts by forming strongly adsorbing species and by consuming hydrogen during conversion. Upstream pretreatment can reduce the load that reaches the reactor.
Best practice actions
- Mixing and residence time: ensure uniform blending of incoming streams so nitrogen-rich slugs do not hit the reactor inlet.
- Hydrogen availability at the reactor inlet: maintain stable hydrogen partial pressure so nitrogen reactions proceed without leaving unreacted intermediates.
- Ammonia management: if ammonia is present, confirm that upstream gas-liquid separation is removing it rather than carrying it forward.
Concrete example
A plant noticed that nitrogen in the hydrotreating feed was “on spec” by average, yet reactor performance was inconsistent. The root cause was batch-to-batch blending variability. Tightening the blending sequence so nitrogen-rich components entered gradually reduced the frequency of off-spec reactor outlet nitrogen and improved catalyst stability.
Step 4: Prevent Metals Deposition with Solids Control and Correct Operating Targets
Metals deposition is strongly tied to particle size, residence time, and how well solids are removed before the reactor.
Best practice actions
- Remove fine solids: optimize filtration and ensure no bypass paths exist during maintenance.
- Avoid thermal shocks: keep heating ramps controlled so emulsions break consistently and solids don’t agglomerate.
- Monitor pressure drop: a rising pressure drop across pretreatment equipment often precedes catalyst fouling.
Concrete example
After improving filtration maintenance schedules, the plant saw a slower rise in reactor inlet differential pressure and a longer interval before catalyst activity decline became noticeable.
Step 5: Verify the Improvement with a Catalyst-Facing Checklist
Pretreatment success should show up in both feed metrics and catalyst behavior.
- Feed metrics: lower chloride excursions, lower solids/particle counts, and reduced nitrogen variability.
- Reactor indicators: slower activity decline, more stable temperature rise across the bed, and fewer signs of abnormal pressure drop growth.
Mind Map: Upstream Pretreatment to Reduce Catalyst Poisoning
Example: Putting It Together as an Operating Checklist
- Review desalter logs for wash water and upset periods.
- Check chloride and solids trends for correlation with water.
- Confirm blending sequence reduces nitrogen slugs.
- Verify filtration bypass status and pressure drop behavior.
- Compare reactor inlet stability and bed temperature rise patterns to the prior run.
When these steps are applied together, catalyst poisoning becomes less of a mystery and more of a controllable outcome: fewer contaminants reach the catalyst, and the ones that do arrive in a steadier, more manageable form.
5. Catalytic Reforming and Naphtha Upgrading
5.1 Reforming Objectives: Octane Enhancement and Aromatics Production
Reforming is built around two practical outcomes: raising gasoline octane and producing aromatics-rich streams that can be used as chemical feedstocks or blending components. These goals are linked because the reactions that increase octane also tend to form aromatic compounds and hydrogen.
Octane Enhancement as a Measurable Target
Octane is not a vibe; it is a specification. Reforming typically targets higher research octane number (RON) and/or motor octane number (MON) by converting less desirable molecules into more knock-resistant structures. In plain terms, reforming shifts the fuel’s molecular “shape” toward rings and branching patterns that burn more smoothly under engine conditions.
A key operational reality is that octane improvement is not uniform across the whole product. The reformate’s octane depends on how much of the feed is converted, what fraction of products ends up in the gasoline boiling range, and how much hydrogen is available to control side reactions. That is why reforming objectives are expressed as both product quality and process balance.
Aromatics Production as a Co-Objective
Aromatics—especially benzene, toluene, and xylenes—are valuable because they are stable, high-octane components and also useful for downstream chemical routes. Reforming produces aromatics by dehydrogenating naphthenes and then rearranging and dehydrogenating resulting intermediates. The same chemistry that makes aromatics also tends to increase octane.
However, aromatics production is constrained by product requirements. If a refinery needs a gasoline pool with tight aromatics limits, the reforming objective becomes “make enough aromatics to raise octane, but not more than the blend can tolerate.” If the refinery instead needs aromatics for feedstock, the objective shifts toward maximizing the aromatic yield while keeping the reformate within volatility and stability limits.
The Core Reaction Logic
Reforming commonly includes three reaction families:
- Dehydrogenation of naphthenes to aromatics: increases aromatic content and produces hydrogen.
- Isomerization: improves octane by rearranging carbon skeletons without changing carbon count.
- Dehydrocyclization of paraffins: forms rings from straight chains, raising octane but also increasing the tendency toward coke formation.
Hydrogen is not just a byproduct; it is a tool. It helps suppress reactions that lead to catalyst deactivation and supports maintaining activity over time. That is why hydrogen circulation and separation are part of the objective, not an afterthought.
Catalyst Activity and the Trade-Off with Yield
A reforming unit runs on a catalyst that gradually loses activity due to coke deposition. This creates a built-in trade-off: pushing conversion harder can raise octane and aromatics, but it also accelerates coke formation and shortens run length.
A practical best practice is to treat conversion as a controlled lever rather than a constant setting. Operators monitor catalyst performance indicators and adjust severity to keep the unit producing on-spec reformate while maintaining a reasonable cycle length. When the unit drifts toward higher coke rates, the objective becomes “protect catalyst life while holding octane.”
Process Integration with the Product Slate
Reforming objectives must fit the refinery’s product slate. Reformate is blended into gasoline, but its properties also affect downstream units. For example, reformate volatility influences blending stability and vapor pressure, while aromatics content influences both octane and regulatory compliance.
A systematic way to integrate objectives is to define three targets up front:
- Octane target for the final gasoline pool.
- Aromatics target for either gasoline or chemical feed needs.
- Operational target for catalyst cycle length and hydrogen balance.
Then the unit is operated to satisfy the tightest constraint first.
Example: Choosing Severity for Octane and Aromatics
Suppose a refinery has a reformate stream that currently yields gasoline blending octane slightly below target. The feed contains a moderate fraction of naphthenes and some paraffins. Increasing severity (higher temperature and/or lower pressure) typically increases conversion, which raises aromatics and octane.
But there is a catch: lower pressure and higher temperature also increase coke formation risk. A practical approach is to increase severity in small steps while tracking:
- reformate octane trend
- aromatic yield trend
- hydrogen production trend
- signs of catalyst deactivation (indirect indicators such as rising required temperature to maintain conversion)
If octane rises but aromatic yield overshoots a gasoline aromatics limit, the objective shifts to holding aromatics steady while still meeting octane, often by adjusting blend strategy or feed routing rather than pushing conversion further.
Mind Map: Reforming Objectives
Summary of What “Success” Looks Like
Success in reforming means meeting octane and aromatics objectives simultaneously while keeping catalyst deactivation within acceptable bounds. The unit’s operating strategy is essentially a controlled negotiation between conversion, hydrogen balance, and coke formation—so the refinery gets on-spec reformate without sacrificing the next cycle.
5.2 Reactions and Mechanisms: Dehydrogenation, Isomerization, and Cyclization
Catalytic reforming turns low-octane naphtha into higher-octane reformate by rearranging molecules on a metal–acid catalyst. The metal sites handle hydrogen-related steps, while the acid sites steer carbon skeleton rearrangements and ring formation. In practice, you can think of three recurring reaction families that often happen in parallel: dehydrogenation, isomerization, and cyclization.
Dehydrogenation
Dehydrogenation removes hydrogen to create unsaturation, which then enables aromatics formation. A common starting point is a naphthene (cycloalkane). When a cycloalkane dehydrogenates, it becomes an aromatic ring after further rearrangements and hydrogen transfer steps.
A simple example: cyclohexane can dehydrogenate to benzene through a sequence that effectively removes three hydrogen molecules overall. The key operational consequence is hydrogen production. That hydrogen is not just a byproduct; it shifts equilibria and helps suppress coke precursors by keeping surfaces cleaner.
Mechanistically, dehydrogenation proceeds through adsorption on metal sites, formation of a surface intermediate, and desorption of hydrogen. If hydrogen partial pressure is too low, the system tends to favor condensation reactions that build larger, less volatile molecules.
Isomerization
Isomerization changes the carbon skeleton without changing the molecular formula. On reforming catalysts, it typically converts straight-chain paraffins into branched paraffins and rearranges naphthenes into other naphthenes. Branched structures generally have higher octane because they burn more favorably under engine conditions.
A concrete example: n-butane can isomerize to isobutane. The acid sites form a carbocation-like intermediate (or a closely related surface species), then a hydride shift and re-protonation yield the branched product. The metal sites assist by providing hydrogen for steps that stabilize intermediates and by enabling hydrogen transfer.
Operationally, isomerization is sensitive to acid strength and temperature. Too little temperature slows rearrangement; too much can accelerate side reactions that reduce selectivity.
Cyclization
Cyclization turns linear or cyclic intermediates into rings, which are the gateway to aromatics. There are two common pathways you’ll see in reforming chemistry: cyclization of dienes/olefins formed after dehydrogenation and cyclization of naphthenes via rearrangement and further dehydrogenation.
Example: a straight-chain paraffin can undergo dehydrogenation to form an olefin, then additional dehydrogenation can create a diene. The diene can cyclize to a cycloalkane, which then dehydrogenates to an aromatic ring. Each ring formation step increases the tendency to produce high-octane aromatics, but it also increases the risk of polyaromatic growth if hydrogen availability and residence time are not managed.
How the Three Families Work Together
In a reforming reactor, molecules rarely follow a single neat route. Dehydrogenation creates unsaturation; isomerization rearranges skeletons to more reactive shapes; cyclization locks those rearranged structures into rings. Hydrogen shifts equilibria toward dehydrogenated and aromatics-forming states while also limiting coke-forming condensation.
A practical way to connect this to unit behavior is to track three signals: hydrogen yield, aromatic yield, and coke tendency. If hydrogen yield drops while aromatic yield rises sharply, it often indicates that hydrogen is being consumed in side reactions or that condensation is outpacing controlled aromatization.
Mind Map: Reaction Families and Their Roles
Example: Following One Molecule Through the Reactor
Start with a cyclohexane molecule. It adsorbs on a metal site and dehydrogenates to an unsaturated intermediate. That unsaturation can rearrange on acid sites, and ring-stabilized intermediates can progress toward aromatic formation. Meanwhile, hydrogen produced in the process helps keep other intermediates from condensing into coke-like species.
If you repeat the same thought experiment with a straight-chain paraffin, the first step is usually dehydrogenation to olefin, then isomerization can create a more reactive shape, and cyclization can form a ring that ultimately aromatizes. The catalyst is doing three jobs at once; the operating conditions decide which job dominates.
5.3 Catalyst Systems, Regeneration, and Chloride Management
Catalytic reforming and related upgrading units run on a careful bargain: the catalyst provides the right reaction environment, and the operator keeps it from being poisoned, deactivated, or chemically shifted into the wrong behavior. Catalyst systems are therefore designed as a package—metal function, support, promoters, and a regeneration strategy—then operated with chloride management as a first-class control variable.
Catalyst System Foundations
Most reforming catalysts use a porous support (commonly alumina) carrying metal sites (often platinum-group) plus promoters that influence acidity and hydrogen transfer behavior. The support’s acidity helps isomerization and cyclization, while the metal function supports dehydrogenation and hydrogenation steps that prevent coke from growing unchecked. The catalyst is not “one thing”; it is a set of functions that must stay balanced.
A practical way to think about catalyst health is to separate three failure modes:
- Coke deposition blocks pores and covers active sites.
- Metal sintering or loss of dispersion reduces accessible metal surface.
- Poisoning by heteroatoms or contaminants changes surface chemistry and reaction pathways.
Chloride is central because it modifies the catalyst’s acidity and stabilizes certain active states. Too little chloride can make the catalyst too “aggressive” in ways that increase coke and reduce selectivity. Too much chloride can suppress desired reactions and increase corrosion risk downstream.
Chloride’s Role in Reaction Performance
Chloride is typically introduced and maintained through a controlled chloride-containing feed component and/or a deliberate addition strategy during operation. In reforming, chloride affects:
- Acid site strength and distribution, which influences isomerization and ring formation.
- Metal-support interactions, which can change how readily dehydrogenation occurs.
- Coke tendency, because the surface chemistry that governs polymerization and condensation is chloride-dependent.
Operators manage chloride by tracking trends in product quality and unit behavior, not just by measuring chloride in one stream. For example, a gradual shift toward higher gas make and lower liquid yield can indicate that the catalyst is losing the chloride-driven balance, even before a single lab number looks alarming.
Regeneration Logic and What It Restores
Regeneration aims to remove coke and restore accessible active sites. The core idea is simple: coke is carbonaceous and can be burned off or hydrogenated to reduce its blocking effect, but the catalyst’s chemical state must be preserved.
A typical regeneration sequence includes:
- Depressurization and controlled cool-down to safe handling conditions.
- Coke removal step using an oxidizing environment or a staged approach that limits hot spots.
- Post-treatment to re-establish the desired chemical state, often involving hydrogen and then chloride adjustment.
- Re-commissioning with gradual return to operating severity.
The “what it restores” depends on the regeneration chemistry. Burning coke restores pore access, but it can also alter metal dispersion and support properties if temperature and oxygen exposure are not controlled. Hydrogen steps can help stabilize metal sites and remove residual oxygen-containing species.
Chloride Management During Operation
Chloride management is not only about adding chloride; it is about preventing drift and avoiding swings.
Key practices include:
- Maintain consistent feed chloride input by controlling upstream blending and ensuring the feed system does not dilute or concentrate chloride unexpectedly.
- Use a chloride balance mindset across the unit: chloride enters with feed, partitions into products and off-gas, and can be lost through purge or deposition.
- Monitor corrosion-sensitive indicators in downstream systems, because chloride that leaves the catalyst bed can create problems in heat exchangers and piping.
A concrete example: suppose a reformer shows rising chloride in overhead condensate and increasing corrosion rate in a downstream cooler. That pattern suggests chloride is being carried more aggressively out of the bed, often due to altered catalyst chemistry or operating conditions that change vapor-liquid contact. The response is not “add more chloride”; it is to re-check chloride input, bed temperature profile, and whether the catalyst is becoming less effective at retaining chloride.
Chloride Management During Regeneration
Regeneration changes the catalyst’s chemical state. Coke removal can reduce the amount of chloride associated with the catalyst surface, and oxidation can change how chloride is held. After regeneration, operators typically re-establish chloride to the target level before returning to full severity.
A systematic approach is to treat chloride reintroduction as a controlled ramp:
- Start with conditions that allow chloride to distribute without causing excessive chloride carryover.
- Confirm the catalyst response through early-cycle product indicators such as hydrogen yield and liquid selectivity.
- Adjust chloride addition based on measured trends rather than single-point values.
If chloride is reintroduced too quickly, the unit can show early-cycle instability: higher chloride in product streams and a temporary shift in selectivity. If reintroduced too slowly, coke formation can rise because the catalyst acidity balance is not yet restored.
Mind Map: Catalyst Systems, Regeneration, and Chloride Management
Example: Interpreting Chloride Drift and Choosing the Response
Consider a reformer where, after a period of stable operation, the unit begins producing slightly higher light gas and lower reformate yield. Lab analysis shows chloride in the product condensate has increased, while catalyst activity indicators suggest the bed is not holding its chemical state as effectively.
A disciplined response sequence is:
- Verify feed chloride input stability and check for blending or storage changes.
- Review bed temperature profile and operating severity to see whether vapor-liquid contact increased carryover.
- Check corrosion indicators in downstream equipment to confirm chloride is leaving the bed more readily.
- If regeneration is due, plan chloride reintroduction as a ramp and confirm response using early-cycle selectivity and hydrogen yield trends.
This approach prevents the common mistake of treating chloride as a single number to chase. Chloride is a system variable: it affects reaction chemistry, deactivation rate, and where the catalyst’s chemistry ends up after regeneration.
5.4 Process Configuration: Fixed-Bed Reactors, Hydrogen Circulation, and Separation
Fixed-bed reactors are common in reforming and hydrotreating because they handle large throughputs with stable catalyst beds. The configuration is basically a choreography: feed conditioning, hydrogen-rich reaction environment, controlled contact time, then separation that returns hydrogen to the loop and routes products to downstream units.
Fixed-Bed Reactor Layout and Flow Logic
A typical fixed-bed setup uses multiple catalyst beds in series, often with inter-bed cooling. The reason is simple: reactions can be strongly temperature-dependent, and the catalyst does not like big temperature swings. Inter-bed cooling also helps manage hot spots that can accelerate coking or sintering.
Feed enters after heating and mixing with recycle hydrogen. The hydrogen-to-oil ratio is not just a number for “more hydrogen”; it sets reaction selectivity and helps keep sulfur and nitrogen species from building up on catalyst sites. In practice, operators control hydrogen partial pressure using a combination of recycle flow, make-up hydrogen, and purge strategy.
A key best practice is to design for uniform distribution. Maldistribution leads to channeling, where some paths run hotter and foul faster while other paths under-react. Distributor plates, careful nozzle design, and maintaining proper viscosity and temperature at the reactor inlet are the usual safeguards.
Hydrogen Circulation Strategy
Hydrogen circulation has three jobs: maintain partial pressure, remove heat effects through gas-phase mixing, and sweep reactive species away from the catalyst surface. Because hydrogen is separated from products after the reactor, most of it is recycled.
Hydrogen circulation is typically managed with:
- Recycle compression to overcome pressure losses across the reactor and separation train.
- Make-up hydrogen to replace hydrogen consumed by reactions.
- Purge or vent to prevent inert buildup (for example, methane and light gases).
A practical example: suppose a hydrotreating unit sees rising methane in the recycle loop. That usually means more cracking than expected or a change in feed composition. If the purge rate stays fixed, inert accumulation increases recycle pressure drop and can shift reactor temperature profiles. Operators respond by checking feed quality, verifying reactor temperature distribution, and adjusting purge to keep the loop stable.
Separation Train and Hydrogen Recovery
After the reactor, the effluent contains hydrocarbons, hydrogen, light gases, and reaction byproducts. Separation aims to recover hydrogen for recycle while producing stable product streams.
A common sequence is:
- High-pressure flash to knock out most of the condensed hydrocarbons.
- Cooling to condense additional liquids.
- Low-pressure flash or separator to remove remaining dissolved gases.
- Gas treatment to remove acid gases or trace contaminants when required.
The separation design is tightly linked to reactor conditions. If the reactor outlet temperature is higher than intended, more hydrocarbons remain in the gas phase, increasing hydrogen losses and compressor load. If it is too low, you risk liquid carryover that can foul downstream equipment.
A best practice is to size separators using realistic vapor-liquid equilibrium and to verify that demister performance matches expected liquid rates. Demister failure shows up as liquid entrainment, which then causes foaming or plugging in downstream gas compressors and treaters.
Integrated Control: Keeping Reactor and Separation in Sync
The reactor and separation system behave like one unit. For example, changing hydrogen circulation affects reactor partial pressure, which affects reaction extent, which changes gas composition leaving the reactor, which then changes separator vapor loads.
Operators typically monitor and control:
- Reactor inlet hydrogen partial pressure and total pressure.
- Reactor bed outlet temperatures and temperature rise across each bed.
- Separator pressure and temperature to maintain consistent phase splits.
- Gas composition trends, especially light ends and acid gas indicators.
A simple integrated example: if bed outlet temperatures rise while separator liquid rates fall, the unit may be running with higher conversion and more gas formation. That can be good for desulfurization but can also increase hydrogen consumption. The response is not just “add hydrogen”; it is to confirm whether feed quality changed, verify purge strategy, and check whether separator conditions are still producing the intended phase split.
Mind Map: Fixed-Bed Configuration and Hydrogen Loop
Example: Diagnosing a Shift in Reactor Performance
Imagine a reforming or hydrotreating unit where the hydrogen recycle flow increases to maintain reactor temperature, but product sulfur (or another key impurity) stops improving. The configuration suggests a likely mismatch: either hydrogen partial pressure is not actually increasing at the catalyst (distribution issue, leaks, or separator upset), or the separation is losing more hydrogen than expected.
A systematic check sequence works well:
- Confirm separator pressures and temperatures match setpoints.
- Compare gas composition leaving the separator to historical baselines.
- Check recycle compressor suction conditions and differential pressure.
- Verify reactor inlet mixing and distributor performance indicators.
If separator liquid carryover increased, the gas leaving the separator may look “fine” while hydrogen recovery drops. That forces higher recycle flow, yet the catalyst does not see the intended hydrogen environment. Fixing separation stability restores both hydrogen recovery and reactor performance.
5.5 Practical Example: Troubleshooting Low Reformate Octane and Hydrogen Balance
Low reformate octane usually points to either (1) the chemistry in the reformer not producing the right mix of aromatics and isomers, or (2) the unit not operating in the conditions that make those reactions favorable. Hydrogen balance issues often share the same root causes because reforming reactions both generate hydrogen and depend on catalyst state and reactor severity.
Step 1: Confirm the Symptom with the Right Numbers
Start by separating “octane is low” from “octane is low for the wrong reason.” Compare these against the last stable run:
- Reformate C5+ research octane (RON) and any measured component trends (aromatics %, light ends, naphthenes).
- Reactor inlet temperature profile and average bed temperatures.
- Hydrogen production rate and hydrogen partial pressure in the recycle loop.
- Feed properties: sulfur, nitrogen, olefins, and water content.
A common pattern is: octane drops while hydrogen production also drops. That combination strongly suggests catalyst deactivation or feed poisoning rather than a simple blending or analyzer issue.
Step 2: Build a Cause Map from Operating Variables
Use this mind map to organize checks from “fast and cheap” to “deep and slow.”
Step 3: Interpret Hydrogen Balance Like a Detective, Not a Fortune Teller
Hydrogen balance in reforming is best treated as a set of linked measurements:
- If hydrogen generation falls, reforming reactions are not proceeding as expected.
- If hydrogen generation is normal but net hydrogen recovery is low, separation or recycle control is likely at fault.
A practical check is to compare:
- Reactor outlet gas composition trends (H2, C1–C4, light hydrocarbons).
- Gas-liquid separator differential pressure and level control behavior.
- Recycle gas flow and compressor discharge pressure.
If H2 in the reactor outlet gas is low, suspect catalyst or feed. If H2 in the outlet gas is normal but recovered H2 is low, suspect separation or measurement.
Step 4: Use a Structured Troubleshooting Sequence
- Verify feed quality first. If sulfur or nitrogen rises, hydrogen consumption and catalyst poisoning increase. Example: a small change in upstream hydrotreating performance can raise sulfur in reformer feed from 0.5 ppm to 5 ppm, and octane can drop within days while hydrogen production trends downward.
- Check for coke-promoting conditions. Coke formation increases when severity is effectively reduced in a way that changes residence time and hydrogen partial pressure. Example: if recycle gas flow control drifts low, hydrogen partial pressure can fall, shifting reaction pathways and increasing coke tendency, which then reduces future hydrogen generation.
- Confirm reactor severity and pressure. Reforming favors dehydrogenation and aromatization at appropriate temperature and pressure. Example: if pressure control tightens and reactor pressure creeps upward by 0.5–1.0 bar, hydrogen partial pressure rises, and equilibrium shifts can reduce hydrogen generation and aromatics formation.
- Inspect regeneration history and catalyst age. If the unit recently regenerated, incomplete burn-off or residual contaminants can cause both low octane and low hydrogen. Example: a regeneration that ended early due to temperature constraints can leave coke residues that later suppress reaction rates.
Step 5: Tie Observations to Likely Root Causes with Examples
- Low octane + low hydrogen + feed sulfur high: catalyst sulfur poisoning is the leading suspect.
- Low octane + low hydrogen + bed temperatures trending low: severity is not being delivered; check heater performance, temperature control loops, and feed rate.
- Low octane + normal hydrogen in outlet gas but low recovered hydrogen: separator level control or gas handling is likely.
- Low octane + low hydrogen + increased light ends in gas: side reactions or altered cracking behavior may be consuming hydrogen.
Step 6: Decide Corrective Actions Without Guessing
Corrective actions should match the root cause:
- If feed contaminants are high, adjust upstream treating targets and verify with lab results before changing reformer severity.
- If severity is low, restore bed temperature targets using stable control tuning and confirm feed rate and heat input.
- If catalyst deactivation is suspected, review regeneration conditions and catalyst performance indicators, then plan the appropriate regeneration or operational response.
- If separation is suspected, verify separator internals performance, level control stability, and gas flow measurement accuracy.
Step 7: Close the Loop with a Measurable Success Criterion
After adjustments, track a short list of indicators:
- Octane trend over the next stable operating window.
- Hydrogen production rate trend and hydrogen partial pressure.
- Aromatics and naphthenes balance in reformate (even if approximate from routine analysis).
When the root cause is correct, octane and hydrogen typically move in the same direction because the same reaction system is being restored. When they move in opposite directions, the issue is usually measurement, separation, or a feed/blending mismatch rather than pure catalyst chemistry.
6. Hydroprocessing: Hydrotreating and Hydrocracking
6.1 Hydroprocessing Objectives: Desulfurization, Denitrogenation, and Saturation
Hydroprocessing aims to make messy refinery streams behave like good feed for downstream units and final products. The three core objectives—desulfurization, denitrogenation, and saturation—are tightly linked because the same hydrogen-rich environment and catalyst bed can address multiple contaminants at once.
Desulfurization Objectives
Sulfur shows up in crude-derived streams as thiols, sulfides, and more stubborn species like thiophenes. In hydroprocessing, sulfur compounds react with hydrogen to form hydrogen sulfide (H2S), which can then be removed in gas treating systems. The practical goal is not just “lower sulfur,” but achieving a sulfur level that prevents catalyst poisoning and meets product specifications.
A useful way to think about it: the easier sulfur species convert quickly, while ring-structured sulfur compounds require harsher conditions and more catalyst activity. That’s why operating severity and catalyst selection matter. For example, if a diesel feed contains mostly simple sulfides, a moderate temperature may reduce sulfur effectively. If the same sulfur level comes from thiophenes, the unit may need higher temperature or longer residence time to reach the same result.
Best practice: track H2S formation rate and compare it to feed sulfur. If H2S rises faster than expected, it can indicate a feed change toward more reactive sulfur forms. If H2S rises slowly, it can indicate a shift toward refractory sulfur species or catalyst performance loss.
Denitrogenation Objectives
Nitrogen compounds—amines, amides, and especially basic nitrogen like pyridines—are problematic because they can neutralize acidic sites on catalysts used for cracking, reforming, and isomerization. Denitrogenation converts nitrogen to ammonia (NH3), which is removed with the hydrogen recycle gas.
Denitrogenation is often more sensitive than desulfurization because nitrogen compounds can strongly adsorb on catalyst surfaces. That means even small nitrogen levels can cause outsized impacts on downstream performance. A systematic approach is to monitor NH3 slip and correlate it with feed nitrogen type. If the feed shifts toward more basic nitrogen, the same operating conditions may yield less nitrogen removal.
Best practice: manage hydrogen partial pressure and avoid catalyst temperature excursions. Lower hydrogen availability can slow hydrogenation steps that precede nitrogen removal, leaving nitrogen to linger and occupy active sites.
Saturation Objectives
Saturation refers to converting unsaturated hydrocarbons—olefins and diolefins—into saturated components. This matters because unsaturates can form gums and coke precursors, and they can also increase instability in product streams.
In hydroprocessing, saturation typically occurs alongside contaminant removal. Olefins hydrogenate to paraffins, reducing reactivity that would otherwise drive polymerization or deposit formation. The operational nuance is that saturation can be achieved at milder conditions than deep sulfur and nitrogen removal, but it still depends on catalyst activity and hydrogen availability.
Example: imagine a naphtha stream with a noticeable fraction of olefins. If you send it to a downstream unit without adequate saturation, you may see higher pressure drop from fouling and poorer product stability. With proper saturation, the same stream becomes easier to fractionate and less likely to generate deposits.
Integrated Objective Map
Mind Map: Hydroprocessing Objectives
How the Objectives Work Together
A single catalyst bed can simultaneously reduce sulfur, nitrogen, and unsaturates, but the “dominant constraint” changes with feed composition. If sulfur is high and nitrogen is low, desulfurization may consume most of the catalyst’s effective activity. If nitrogen is high, denitrogenation can dominate because nitrogen adsorption can block active sites. If unsaturates are high, saturation can reduce coke formation, which indirectly preserves catalyst performance for the other reactions.
Best practice: treat hydroprocessing as a system, not three separate reactions. Hydrogen supply, gas-liquid contacting, and downstream gas treating all influence whether H2S and NH3 are removed efficiently. If removal is poor, partial pressures in the recycle gas can shift, affecting reaction rates and equilibrium behavior.
Practical Example: Interpreting a Feed Change
Suppose a unit processes a diesel blend. After a feed change, sulfur removal remains on target, but nitrogen removal drops and the unit’s differential pressure increases slightly. A coherent interpretation is that the new feed contains more basic nitrogen and more reactive unsaturates. Basic nitrogen can occupy catalyst sites, reducing denitrogenation rate, while unsaturates can increase deposition tendency, raising pressure drop. The corrective action is not just “turn up temperature.” It should include checking hydrogen partial pressure, verifying gas treating performance for NH3 and H2S removal, and confirming that pretreatment is still controlling solids and water.
When you connect the three objectives to measurable signals—H2S rate, NH3 rate, and fouling indicators—you get a clear, actionable picture of what the catalyst is doing and why.
6.2 Hydrotreating Reaction Pathways and Typical Operating Variables
Hydrotreating turns “trouble molecules” into “boring molecules” using hydrogen, heat, and a catalyst. The main pathways depend on what contaminants are present in the feed and how aggressively the unit is run. A practical way to think about it is: first remove heteroatoms (sulfur, nitrogen, oxygen), then manage aromatics and olefins, and finally protect downstream units by controlling product stability.
Mind Map: Hydrotreating Pathways and What Drives Them
Sulfur Removal Pathways and Operating Variables
Most hydrotreating units target sulfur first because sulfur compounds poison catalysts and create emissions problems. Sulfur removal proceeds through hydrodesulfurization (HDS). Simple sulfides and thiols react relatively quickly, while ring-containing sulfur compounds like thiophene and substituted thiophenes require harsher conditions.
Typical operating variables that shape HDS include:
- Temperature: Higher temperature increases reaction rates, especially for ring sulfur.
- Hydrogen partial pressure: More hydrogen drives the equilibrium toward desulfurized products and helps prevent side reactions that consume hydrogen.
- Space velocity (LHSV): Lower LHSV increases contact time, improving conversion but raising the risk of over-hydrogenation and higher hydrogen consumption.
- Hydrogen-to-oil ratio: This affects hydrogen availability and helps maintain stable operation when feed composition changes.
Example: If a feed shifts from mostly straight-chain sulfides to more thiophenic sulfur, maintaining the same temperature and LHSV often leads to higher sulfur in the product. Operators typically respond by increasing temperature slightly, increasing hydrogen partial pressure, or reducing LHSV to restore conversion.
Nitrogen Removal Pathways and Operating Variables
Nitrogen removal uses hydrodenitrogenation (HDN). Nitrogen compounds are more stubborn than many sulfur species because they often exist in aromatic rings. HDN generally benefits from higher temperature and sufficient hydrogen availability, but it also increases ammonia formation, which must be managed in downstream gas handling.
Key variables:
- Temperature: Strong influence on HDN of aromatic nitrogen.
- Catalyst condition: Deactivated catalysts reduce HDN performance faster than HDS in many cases.
- Hydrogen partial pressure: Helps keep reactions moving and reduces formation of nitrogen-containing residues.
Example: A unit producing diesel with stable sulfur suddenly sees nitrogen rise after a period of high-sulfur feed. The sulfur load can accelerate catalyst deactivation, reducing HDN capability. The fix is usually not “more hydrogen only,” but a combination of severity adjustment and catalyst management.
Oxygen Removal Pathways and Operating Variables
Oxygen removal occurs via hydrodeoxygenation (HDO). Oxygen compounds include phenols, ethers, and oxygenated species that can form from upstream processing or crude variability. HDO often proceeds through multiple steps, including hydrogenation and bond cleavage, producing water.
Key variables:
- Hydrogen availability: Oxygen removal is sensitive to hydrogen partial pressure.
- Residence time: Adequate contact time helps complete multi-step pathways.
- Feed pretreatment quality: Water and solids can interfere with catalyst performance and heat transfer.
Example: If an upstream change increases oxygenates in the feed, the unit may show higher water formation and a tendency toward higher product instability unless operating severity is adjusted and gas handling is tuned.
Olefin Saturation and Aromatic Management
Hydrotreating also hydrogenates olefins to prevent gum formation and improves color and stability. Aromatic saturation is usually limited compared with heteroatom removal, but partial saturation can occur at higher severity.
Key variables:
- Hydrogen partial pressure and temperature: Both increase hydrogenation extent.
- LHSV: Lower LHSV increases conversion of olefins.
Example: When a naphtha stream contains more olefins than usual, operators may reduce LHSV or increase hydrogen partial pressure to keep product stability within spec, while avoiding unnecessary hydrogen consumption.
Typical Operating Variable Map for a Trickle-Bed Reactor
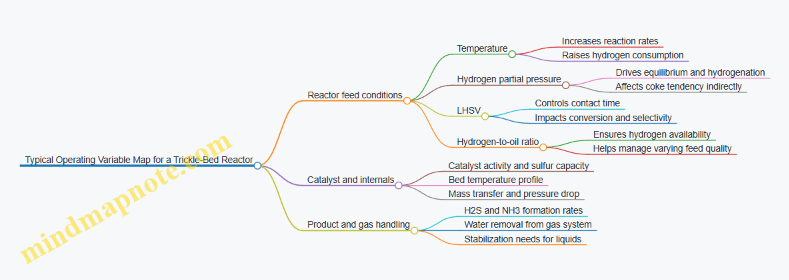
Putting It Together with a Systematic Example
Consider a diesel hydrotreating case where the feed sulfur rises and the nitrogen fraction increases slightly. A systematic response is to adjust variables in a way that targets the limiting pathway:
- Check sulfur conversion trend to confirm HDS is the primary limitation.
- Increase temperature modestly if sulfur is ring-dominated.
- Verify hydrogen partial pressure is not limiting, especially if hydrogen consumption rises.
- Watch nitrogen and ammonia handling to ensure HDN improves without creating downstream constraints.
- Reassess LHSV if conversion remains low despite temperature and hydrogen adjustments.
This approach keeps changes grounded in reaction pathways rather than treating the unit like a black box. The catalyst does the chemistry, but the operating variables decide which chemistry wins.
6.3 Hydrocracking: Product Distribution and Reactor/Separation Integration
Hydrocracking turns heavier, more complex molecules into lighter ones by combining hydrogenation with cracking over an acidic catalyst. The “product distribution” is not just a chemistry outcome; it is the result of how the reactor effluent is separated, recycled, and blended. Integration matters because the same reactor severity can look good or bad depending on how quickly you remove distillate-range products and how effectively you route unconverted material back to the reactor.
Core Idea: Severity Sets Chemistry, Integration Sets What You Keep
In the reactor, higher temperature and lower space velocity generally increase conversion and shift the balance toward lighter products. But the reactor effluent still contains a mix of cracked liquids, dissolved gases, unconverted feed, and hydrogen. If separation is slow or inefficient, more material stays in the system longer, increasing secondary reactions and changing the final cut yields.
A practical way to think about it: the reactor creates a “reaction mixture,” and the separation train decides which parts become stable products versus which parts return to the reactor as recycle.
Reactor Effluent Composition and Why It Drives Separation
Hydrocracking effluent typically includes:
- Light gases (H2, C1–C4, some H2S/NH3 depending on feed)
- Naphtha and middle distillate-range liquids
- Unconverted gas oil or residue-range material
- Dissolved hydrogen and trace contaminants
Because hydrogen solubility and gas evolution affect phase behavior, the first separation step is usually designed to reduce pressure and remove gases without stripping valuable liquids. If you drop pressure too aggressively, you can lose liquid yield to the gas system.
Separation Train Logic: Knockout, Fractionation, and Recycle
A common integrated approach uses a sequence like this:
- High-pressure gas-liquid separation to remove most free gas while keeping liquids in the liquid phase.
- Hydrogen-rich recycle loop where gas is compressed and returned to the reactor.
- Stabilization and fractionation to split naphtha, distillates, and heavier bottoms.
- Recycle of unconverted material (often called heavy recycle or feed recycle) back to the reactor feed system.
The key integration decision is where to draw the line between “product” and “recycle.” If the cut between distillate product and recycle is too tight, you send too much product to the reactor and risk overcracking. If it is too loose, you leave unconverted material in the product pool, which can raise sulfur, nitrogen, density, and instability issues.
Product Distribution Mechanisms: Primary Cracking vs Secondary Reactions
Hydrocracking yields are influenced by two reaction pathways:
- Primary cracking that forms the desired lighter molecules.
- Secondary cracking that continues breaking molecules if residence time and temperature remain high.
Integration affects secondary cracking through how long the effluent stays at elevated temperature before it is cooled and separated. A well-designed heat removal and quench strategy reduces the time window for secondary reactions.
Mind Map: Reactor/Separation Integration for Hydrocracking
Example: How Cut Points Change Yield Without Changing Reactor Severity
Assume a unit is set to produce a jet-range product and a diesel-range product from a gas oil feed. The reactor severity is fixed, so the “true” distribution in the effluent is constant.
Now compare two separation strategies:
- Strategy A: The fractionator draws the jet cut at a slightly higher boiling point, sending more mid-boiling material to the jet product.
- Strategy B: The jet cut is drawn earlier, sending that same mid-boiling material to heavy recycle.
With Strategy A, jet yield increases, but the jet product may carry more unconverted molecules, which can raise density and worsen stability. With Strategy B, jet yield drops slightly, yet the jet product quality improves because the recycle returns those molecules to the reactor where they can be further hydrogenated and cracked.
This is why integration is not a paperwork exercise. The separation cut points are effectively part of the “process chemistry,” because they determine what gets another pass.
Example: Pressure Drop and Liquid Loss to Gas
Suppose the first knockout separator is operated with a rapid pressure letdown. Light gases expand and can entrain fine liquid droplets. Those droplets travel with the gas stream, reducing liquid recovery and increasing downstream gas compression load.
A simple operational check is to compare gas system liquid carryover indicators with product yield trends. If product yield falls while gas flow rises without a corresponding change in reactor conversion, entrainment is a likely culprit.
Integration Summary: The Three Questions to Ask
- What does the reactor effluent contain? (conversion, dissolved gases, unconverted fraction)
- How fast and how gently do we separate it? (cooling, pressure drop, knockout performance)
- Where do we draw the product-recycle boundary? (cut points, recycle ratio, quality consequences)
When these three are aligned, product distribution becomes predictable: reactor severity sets the baseline, and integrated separation ensures the refinery actually keeps what the reactor makes.
6.4 Catalyst Deactivation and Regeneration: Sulfur Management and Metal Deposition
Catalyst performance in hydrotreating and hydroprocessing is mostly a story of what gets on the catalyst and what gets stuck there. Two common culprits are sulfur-related deactivation and metal deposition. Both reduce active site availability and change how easily reactants reach those sites, so the operating goal is not just “remove sulfur,” but manage where sulfur and metals end up.
Foundations of Deactivation Mechanisms
Sulfur deactivation typically happens because sulfur compounds adsorb strongly on active sites, especially on hydrogenation and hydrodesulfurization functions. Even when the process is designed to remove sulfur, the catalyst sees a continuous feed of sulfur species. If hydrogen availability, temperature, or residence time are not balanced, sulfur coverage increases and reaction rates drop.
Metal deposition is different in feel but similar in outcome. Metals such as nickel and vanadium can deposit from organometallics and fine particulates. They can form stable sulfides and oxides depending on conditions, and they may block pores or create additional diffusion resistance. The result is often a gradual loss of activity plus a rise in pressure drop across the reactor.
A practical way to think about both mechanisms is “site poisoning versus transport blockage.” Sulfur tends to poison sites; metals tend to block pathways and can also contribute to site coverage.
Sulfur Management for Stable Activity
Sulfur management starts with understanding the catalyst’s job. In hydrotreating, sulfur removal is a reaction that consumes hydrogen and produces hydrogen sulfide. That means sulfur removal is not free: if the system cannot keep hydrogen partial pressure high enough, sulfur removal slows and sulfur coverage rises.
Best practice is to monitor hydrogen-to-oil ratio, reactor inlet temperature, and outlet H2S. If H2S rises while temperature is held constant, it usually signals that the catalyst is losing hydrodesulfurization capacity. Operators often respond by increasing temperature or adjusting hydrogen circulation, but the more disciplined approach is to check whether the change is driven by sulfur kinetics or by mass transfer limitations.
Easy example: imagine a reactor running at the same temperature and flow rate. If feed sulfur increases by 20% and the unit does not compensate with higher hydrogen partial pressure, the catalyst will likely reach higher sulfur coverage. You may see slower desulfurization and a higher H2S concentration at the outlet even though the catalyst is still “working.”
Metal Deposition and How to Recognize It
Metal deposition is usually tied to upstream feed quality and to how well solids and organometallics are controlled before the reactor. If metals are present as fine particles, they can also contribute to fouling in exchangers and lines, not just on catalyst.
Signs that point toward metal deposition include:
- Rising differential pressure across the reactor train.
- Slower activity decline than sulfur poisoning alone, but with increasing transport resistance.
- Greater sensitivity to feed changes in metals or asphaltenes.
Easy example: if a crude switch increases vanadium and nickel, the unit might initially maintain conversion because sulfur is still being removed effectively. Over time, pressure drop rises and conversion declines, reflecting pore blockage and reduced effective surface.
Regeneration Logic and Constraints
Regeneration restores activity by removing deposited species and re-establishing accessible active sites. The key constraint is that regeneration must not damage the catalyst structure. For sulfur-related deactivation, regeneration often involves controlled removal of sulfur and coke-like deposits, typically through oxidation steps that must be carefully staged.
For metal deposition, regeneration can be less straightforward. Metals may not fully volatilize or detach under typical regeneration conditions. Instead, regeneration can reduce some blocking deposits while leaving a portion of metal sulfides or oxides on the catalyst. That is why metal management upstream matters: regeneration is not a magic eraser.
A systematic approach is to separate “what is removable” from “what is structural.” Sulfur and coke are generally more removable than metals. Therefore, regeneration procedures should be designed around the dominant deactivation mode.
Integrated Mind Map
Catalyst Deactivation and Regeneration Mind Map
Example Workflow for Choosing Regeneration Actions
Start with trend data: if activity loss correlates with rising H2S at steady pressure drop, sulfur poisoning is likely dominant. If activity loss correlates with rising pressure drop, metal deposition and pore blockage are likely dominant.
Then check whether the unit’s operating envelope is being used effectively. If hydrogen partial pressure is low relative to feed sulfur, the catalyst may be deactivated by sulfur coverage rather than irreversible damage. In that case, correcting operating conditions can slow deactivation and extend run length.
Finally, when regeneration is required, align the procedure with the dominant mechanism. If sulfur and coke dominate, regeneration severity can focus on removing those deposits. If metal deposition dominates, regeneration may recover some performance but will not fully reverse pore blockage, so upstream feed control should be tightened alongside regeneration.
This is the practical takeaway: sulfur management protects active sites, metal deposition control protects pathways, and regeneration is most effective when it matches the dominant deactivation mode.
6.5 Practical Example: Designing a Multi-Stage Hydrotreating Train for Jet and Diesel
A multi-stage hydrotreating train is a practical way to hit two different targets at once: remove sulfur and nitrogen enough for product specs, and also control aromatics, stability, and color for jet and diesel. The trick is to use the right severity in the right place, while keeping hydrogen use and catalyst life under control.
Step 1: Start with Feed Reality
Assume a straight-run gas oil feed with these typical issues:
- Sulfur: 1,500–3,000 ppmw
- Nitrogen: 200–600 ppmw
- Metals: low to moderate (from upstream corrosion and entrained fines)
- Aromatics: moderate
- Water and chlorides: low after desalting, but not zero
Best practice: verify the feed’s sulfur and nitrogen by consistent lab methods and confirm the presence of catalyst poisons (especially metals and any chlorides). If the feed is unstable (changing sulfur week to week), you design the train to respond with operating flexibility rather than assuming one fixed condition.
Step 2: Define Product Targets and Constraints
Jet and diesel specs differ in how they “feel” in operation:
- Jet: low sulfur, good thermal stability, controlled aromatics, and clean appearance
- Diesel: low sulfur, good cetane, and stability against gum formation
Design constraint examples:
- Jet sulfur must be met without over-cracking that would harm yield
- Diesel must meet sulfur and stability while avoiding excessive hydrogen consumption
Step 3: Choose a Two-Stage Train Layout
A common integrated layout is:
- Stage 1: Hydrotreating for bulk sulfur and nitrogen removal
- Stage 2: Polishing hydrotreating for final sulfur and stability
Why two stages? Stage 1 handles most contaminant removal efficiently at higher activity, while Stage 2 “finishes” with lower severity to protect yield and manage hydrogen use.
Step 4: Set Severity by What Each Stage Must Fix
Use a simple rule of thumb: Stage 1 is where you do the heavy lifting; Stage 2 is where you prevent surprises.
Example operating intent (illustrative ranges):
- Stage 1: higher temperature and space velocity adjusted to drive deep desulfurization and denitrogenation
- Stage 2: slightly lower temperature with similar or reduced space velocity to reach final sulfur without unnecessary saturation
Hydrogen management is part of severity. If hydrogen partial pressure drops, sulfur removal slows and nitrogen removal becomes harder. So you design for hydrogen availability with margin.
Step 5: Build the Train Around Reactor and Separation Logic
Each stage needs:
- Feed heating and mixing with recycle hydrogen
- Reactor with guard bed upstream if metals or fines are present
- Effluent cooling and high-pressure separation
- Gas purification and recycle compression
- Liquid product polishing and stabilization as required
Best practice: treat the gas recycle loop as a first-class design object. Poor gas-liquid separation causes hydrogen loss and can carry contaminants into downstream units.
Step 6: Add Practical Safeguards
Integrated safeguards that prevent off-spec outcomes:
- Guard bed for metals and particulates
- Water management to avoid catalyst deactivation and corrosion
- Chloride control through upstream desalting and careful handling of any contaminated streams
- Monitoring of differential pressure across beds to catch early fouling
Mind Map: Multi-Stage Hydrotreating Train Design
Step 7: Walk Through a Concrete Example Outcome
Suppose the feed sulfur is 2,500 ppmw and nitrogen is 400 ppmw.
- After Stage 1, you aim for a large reduction, for example to around 200–400 ppmw sulfur and a much lower nitrogen level.
- After Stage 2, you target final sulfur for jet and diesel, for example single-digit to tens of ppmw depending on the product slate and local spec.
A practical control strategy is to adjust Stage 2 temperature first when sulfur drifts, because it has the most direct impact on final sulfur without disturbing the bulk conversion already achieved in Stage 1.
Step 8: Validate with a Mass Balance Mindset
Even without detailed simulation, you can sanity-check:
- Hydrogen consumption should correlate with sulfur and nitrogen removal
- If sulfur drops but hydrogen use spikes, something else is happening (for example, excessive cracking or poor separation)
- If hydrogen use is steady but sulfur doesn’t improve, catalyst activity or hydrogen partial pressure is likely the limiter
Diagram: Integrated Train Flow Logic
graph TD
A[Crude Gas Oil Feed] --> B[Mix With Recycle Hydrogen]
B --> C[Guard Bed]
C --> D[Stage 1 Hydrotreating Reactor]
D --> E[High-Pressure Separator]
E --> F[Gas Purification and Recycle Compression]
E --> G[Stage 2 Hydrotreating Reactor]
G --> H[Final Separation and Product Split]
F --> B
H --> I[Jet Product]
H --> J[Diesel Product]
Step 9: Summarize the Design Logic
A good multi-stage hydrotreating train is not just two reactors in series. It is a coordinated system where feed conditioning, hydrogen partial pressure, separation efficiency, and stage-specific severity work together so jet and diesel both meet sulfur and stability requirements without wasting hydrogen or catalyst activity.
7. Thermal Conversion: Visbreaking, Coking, and Resid Upgrading
7.1 Thermal Cracking Objectives and Where Thermal Units Fit in a Refinery
Thermal cracking is a family of processes that break large hydrocarbon molecules using heat, without relying on catalysts to drive the chemistry. The goal is not “more reactions at any cost,” but controlled conversion that produces useful lighter streams while managing coke, gas composition, and product quality.
Objectives of Thermal Cracking
-
Increase Distillate and Light Product Yield
Thermal units convert heavier feed (often vacuum gas oil or resid fractions) into lighter components such as naphtha-range liquids and fuel-gas constituents. A practical way to think about it: you trade some heavier, harder-to-use material for streams that can be blended into gasoline, diesel components, or petrochemical feed. -
Create a Manageable Residue for Blending
Not everything can become a clean distillate. Thermal cracking typically leaves behind a residue that must be stabilized and blended carefully to avoid poor stability, excessive color, or unacceptable viscosity. -
Control Severity to Balance Conversion and Coke
Higher temperature and longer residence time generally increase conversion, but they also increase coke formation. Coke is not just an inconvenience; it directly affects heat transfer, pressure drop, and run length. Operators therefore tune severity to hit conversion targets while keeping coke within practical limits. -
Produce Streams With Predictable Downstream Behavior
The cracked liquids and gases must be compatible with downstream units. For example, cracked naphtha may be routed to reforming or hydrotreating depending on its stability and contaminant levels.
Where Thermal Units Fit in the Refinery
Thermal cracking usually sits after crude distillation and vacuum distillation, where heavier fractions are available. The key is matching the unit’s feed quality to its strengths and ensuring the products can be handled by downstream processing.
- Upstream inputs: vacuum gas oil, atmospheric residue fractions, or other heavy streams with sufficient thermal cracking potential.
- Downstream outputs: cracked naphtha, light gas oil, fuel gas, and a residue that goes to blending or further upgrading.
- Integration logic: thermal units often complement catalytic units by providing additional feed to hydrotreating, reforming, or blending pools.
A helpful mental model is “thermal makes the molecules smaller; catalytic makes them cleaner.” Thermal cracking reduces molecular weight and generates reactive fragments; hydrotreating and other upgrading steps then remove sulfur and stabilize the products.
Process Building Blocks and Operating Levers
Thermal cracking performance depends on a few levers that operators can actually influence.
- Heat input: sets the energy available for bond breaking.
- Residence time: controls how long molecules stay in the hot zone.
- Temperature profile: affects reaction pathways and coke tendency.
- Quench and separation: determines whether cracked vapors are rapidly cooled to limit secondary cracking.
- Furnace and transfer line cleanliness: impacts heat transfer and effective severity.
A common best practice is to treat “effective severity” as the real driver, not just the furnace setpoint. If heat transfer worsens due to fouling, the same setpoint can behave like a higher severity condition, pushing coke formation upward.
Mind Map: Thermal Cracking Objectives and Refinery Placement
Example: Choosing Severity for a Vacuum Gas Oil Feed
Suppose a refinery receives a vacuum gas oil that is too heavy for direct blending into middle distillates. The thermal unit is tasked with producing a cracked naphtha-range stream and a lighter gas oil component.
- If operators increase temperature to raise conversion, they may see higher yields of lighter liquids, but they also risk faster coke buildup in hot sections.
- If they reduce temperature to slow coking, conversion drops and more material remains in the heavier residue pool.
A practical operating approach is to run short, controlled adjustments while tracking: conversion, coke rate indicators, pressure drop trends, and the stability of the cracked naphtha. The “right” setting is the one that meets product quality and run length targets simultaneously, not the one that maximizes conversion on paper.
Example: Routing Cracked Products to Downstream Units
Cracked naphtha often contains more unsaturated components than straight-run naphtha. If it is sent directly to a blending pool without stabilization, it can cause volatility or stability issues. A typical integrated response is to route cracked naphtha to a treating or stabilization step so it becomes compatible with the refinery’s gasoline blending requirements.
Meanwhile, cracked gas is usually handled by gas compression and fractionation systems, where composition affects whether it becomes fuel gas, LPG components, or feed to other treating steps.
Summary of the Section
Thermal cracking aims to convert heavy molecules into lighter, useful streams using heat, while controlling coke and ensuring downstream compatibility. In a refinery, it typically follows vacuum distillation, then feeds cracked liquids and gases into treating, fractionation, and blending systems. The unit’s success is measured by balanced conversion, manageable coke behavior, and product streams that behave well in the rest of the refinery.
7.2 Visbreaking: Severity Control, Conversion, and Gas/Liquid Product Handling
Visbreaking turns heavy residues into lighter, more blendable components by thermal cracking in a furnace and soaking section. The core operating challenge is controlling severity so you get useful conversion without creating excessive coke, unstable liquids, or unmanageable gas.
Foundational Concepts of Severity
Severity is the combined effect of temperature, time, and how well the unit controls heat transfer. In practice, operators manage it through furnace outlet temperature, residence time in the soaking drum, and the ability to keep the system hydraulically stable. A simple way to think about it: higher severity increases conversion and gas yield, but also increases coke formation and shifts liquid quality toward heavier, more reactive species.
A practical control mindset uses three linked targets:
- Conversion target: enough reduction in viscosity and boiling range to meet blending needs.
- Coke target: limited drum and heater fouling so decoking frequency stays reasonable.
- Product stability target: liquids that won’t generate excessive gums or pressure during storage.
Severity Control Methods That Actually Matter
Start with feed preparation. Consistent feed viscosity and solids content reduce variability in heat transfer and residence time. If the feed contains entrained solids or water, you can see faster fouling and more erratic cracking.
Next, manage furnace performance. Operators typically watch heater skin temperatures, pressure drop trends, and outlet temperature control quality. If outlet temperature control is “tight” but pressure drop is drifting, the unit may be fouling internally, which changes effective heat flux and makes conversion less predictable.
Then, manage soaking time. Soaking drum level and flow distribution influence how long material experiences the intended thermal environment. A stable drum level helps maintain consistent residence time distribution.
Finally, manage quench and vapor handling. Quenching reduces secondary cracking and helps limit coke precursors in the liquid phase. If quench effectiveness drops, you often see both higher gas and poorer liquid stability.
Conversion and Product Split Logic
Conversion in visbreaking is not just “how much cracked,” but how the cracked material partitions into gas, distillate-like liquids, and coke. As severity rises, gas increases and liquid becomes heavier and more prone to instability. That’s why conversion targets must be paired with downstream blending and storage requirements.
A useful operational check is to compare expected boiling range shifts against actual distillation results. If conversion looks good by viscosity reduction but distillation shows minimal shift, you may have achieved “thermal stress” without productive cracking, which can still harm stability.
Gas Handling: From Formation to Recovery
Gas from visbreaking is typically a mix of light hydrocarbons and hydrogen-rich species, plus small amounts of sour components depending on feed. The handling goal is to remove it safely, prevent condensation in the wrong places, and keep compressors and knockouts from becoming tarry.
Key best practices:
- Keep vapor lines hot enough to avoid condensation that can carry heavy droplets.
- Use knockouts and reflux management to separate entrained liquids before compression.
- Monitor compressor suction conditions because wet gas increases fouling and can raise discharge temperatures.
A concrete example: if you increase severity to chase conversion, you may also increase gas rate. If the knockout liquid level rises because vapor carries more heavy droplets, you can end up with compressor fouling even though the gas is “dry” on paper. The fix is usually quench tuning and vapor-liquid separation discipline, not just changing compressor settings.
Liquid Handling: Stability and Blending Readiness
Visbreaking liquid is often blended into fuel oil or further processed. Its usability depends on stability, color, and distillation behavior. The unit must produce a liquid that doesn’t form gums or create excessive pressure during storage.
Best practices include:
- Control quench and drum outlet temperature to limit secondary reactions.
- Manage stripping steam if used, to remove light ends that can destabilize storage.
- Blend with compatible streams so the final product meets viscosity and stability requirements.
Example: Suppose a refinery blends visbreaker bottoms into a heavy fuel pool. If severity is raised, the bottoms may show lower viscosity but higher tendency to form sediment. A practical response is to adjust blending ratios and, if needed, reduce severity or increase quench effectiveness to bring stability back in line.
Mind Map: Severity Control and Product Handling
Example: A Systematic Severity Adjustment
An operator increases furnace outlet temperature slightly to improve conversion. The first sign of success is a modest viscosity reduction and a measurable boiling range shift. The next checks are gas and stability: gas rate should rise, but knockout liquid should not surge, and compressor suction should remain within normal wetness limits. If knockout liquid rises, the likely cause is increased droplet carryover from poorer quench or altered vapor-liquid equilibrium. The corrective action is to restore quench effectiveness and separation performance before making further severity changes.
Key Takeaways for Reliable Operation
Visbreaking severity is a coupled system: temperature, time, quench, and feed consistency jointly determine conversion, coke tendency, and product stability. Gas handling protects downstream equipment by preventing heavy carryover, while liquid handling ensures the cracked material is blendable and storage-stable. When you adjust severity, verify the whole chain—heater behavior, drum residence, vapor separation, and final liquid stability—so the unit earns its conversion rather than just producing more gas.
7.3 Delayed Coking: Coke Formation, Drum Operation, and Decoking Cycles
Delayed coking turns heavy residues into lighter products while leaving a solid carbon-rich material in the drums. The core idea is simple: heat the feed enough to crack it, then keep the cracked vapors moving so they don’t re-condense into more liquid that would foul the system. The practical challenge is that coke formation is both the goal and the problem, because it determines cycle length, heat transfer, pressure behavior, and decoking workload.
Coke Formation Mechanisms and What You Can Control
Coke forms through a chain of reactions that start with thermal cracking and end with polymer-like solids. Early in the process, the feed breaks into smaller molecules and reactive fragments. As residence time and temperature increase, those fragments recombine into larger aromatics and eventually into coke precursors that deposit on hot surfaces.
Key controls are feed temperature, heater outlet temperature, drum pressure, and vapor residence time. A useful operational rule is to treat coke as a “surface chemistry + time” problem. If you raise temperature without managing residence time, you may accelerate cracking but also increase the rate of coke precursor formation. If you lower pressure too much, you can change vapor-liquid behavior and shift how quickly condensable species reach the drum walls.
Example: Suppose a residue with high Conradson Carbon forms coke faster than expected. If the heater outlet temperature is held constant but drum pressure rises, more condensable material can stay in the vapor phase longer and later condense in the drum, increasing wall deposition. Operators often respond by adjusting pressure and feed rate together rather than changing only temperature.
Drum Operation Fundamentals
A delayed coker typically uses two or more drums so one can be filling while another is decoking. During the fill stage, feed enters the heater and then flows to the drum where cracking occurs. Vapors rise and exit overhead while liquid and coke precursors deposit on the drum wall.
Drum operation is managed through three linked behaviors:
- Heat transfer: Coke thickness reduces heat transfer, so the same heater duty produces less effective cracking as the cycle progresses.
- Hydrodynamics: Feed distribution and vapor flow affect where deposition occurs.
- Pressure and fractionation: Overhead pressure influences how much condensable material returns to the drum.
Operators monitor drum outlet temperature, overhead system pressure, and differential pressure across the fractionation train. When coke grows, the system often shows increasing temperature gradients and changes in overhead composition because the cracking severity and condensation patterns shift.
Example: If overhead pressure drifts upward, the drum may show faster wall growth even if heater outlet temperature is unchanged. A practical response is to correct pressure control and verify that feed rate and heater duty are still aligned with the intended cycle severity.
Decoking Cycles and Drum Switching Logic
Decoking removes coke from the drum so it can be reused. The cycle is usually staged: fill, soak, and decoke. The soak period allows reactions to complete and helps stabilize coke structure, which can make decoking more predictable.
Decoking commonly uses steam and/or inert gas to heat and fluidize the coke, followed by water or steam for coke removal depending on the design. The goal is to avoid excessive thermal shock that can damage drum internals while still achieving effective coke removal.
A clean cycle depends on timing and sequencing:
- End-of-fill decision: Choose when coke thickness reaches the target limit for heat transfer and pressure constraints.
- Soak: Maintain conditions long enough to reduce variability in coke structure.
- Decoke initiation: Introduce steam/inert to raise coke temperature and mobilize deposits.
- Coke removal and quench: Remove coke while controlling water carryover and managing downstream handling.
- Return to service: Purge and verify readiness before refilling.
Example: If decoking starts too early, coke may be softer and harder to remove cleanly, increasing carryover and fouling in downstream lines. If it starts too late, coke becomes harder and can require more aggressive steam, increasing thermal stress and potentially raising drum maintenance risk.
Mind Map: Coke Formation, Drum Operation, and Decoking Cycles
Practical Example: Choosing a Cycle End Point
Imagine two consecutive cycles with similar feed quality, but the second cycle ends with higher overhead pressure and earlier temperature rise in the fractionation train. That pattern suggests faster coke growth or increased condensables reaching the drum walls. A systematic approach is to compare heater outlet temperature history, drum pressure setpoints, and feed rate during the last third of the cycle. If pressure control lagged or feed rate increased slightly, the end-of-fill decision should be adjusted by tightening pressure response and aligning feed rate with the intended cracking severity.
The operational takeaway is that delayed coking is not just “run until it’s time.” It is “run until the system signals that coke growth has reached the limit,” then decoke with a sequence that preserves drum integrity and downstream cleanliness.
7.4 Resid Upgrading and Blending: Managing Distillate Yield and Stability
Resid upgrading aims to turn the heaviest, most contaminated refinery streams into usable distillates while keeping product stability within spec. The practical tension is simple: the harsher the conversion, the more distillate you can make, but the more you risk instability, higher coke formation, and worse handling properties. Good practice is to manage conversion severity, hydrogen availability, and downstream blending constraints as one system.
Foundational Concepts for Yield and Stability
Resid upgrading typically uses thermal conversion (visbreaking, coking) or catalytic/hydrogen-assisted conversion (hydrotreating, hydrocracking, or residue hydroprocessing). Thermal routes rely on cracking and coke formation; catalytic routes rely on reactions that can reduce coke tendencies when hydrogen and catalyst are managed well.
Distillate yield is not just “how much liquid comes out.” It is the fraction of upgraded material that falls into your distillate boiling ranges and remains stable under storage and distribution conditions. Stability is usually expressed through measures such as gum formation tendency, oxidation behavior, color, and sediment formation. Even if a stream meets distillation cut points, it can still fail stability if it contains reactive species, fine particulates, or unstable dissolved components.
A useful mental model is to treat upgraded resid as a bundle of properties: boiling range, heteroatom content, aromaticity, unsaturates, and contaminants. Blending then becomes a controlled averaging process, not a “mix and hope” step.
Managing Distillate Yield Without Creating Unstable Streams
Start with feed preparation and unit operating discipline. Resid streams often carry metals, asphaltenes, and salts that promote fouling and catalyst poisoning. If the unit runs dirty, you may get less conversion and more heavy carryover, which then forces blending to compensate.
For thermal conversion, severity control is the lever. Higher severity increases conversion but also increases coke and produces more unstable light ends and reactive fragments. A practical approach is to define a severity window using three signals: conversion (liquid yield), coke rate, and downstream stability indicators on representative blend candidates. If stability fails, you do not automatically reduce conversion; you first check whether the failure is tied to a specific fraction (for example, a narrow boiling range that carries instability).
For hydrogen-assisted upgrading, hydrogen availability and catalyst condition matter. Low hydrogen partial pressure can shift reactions toward condensation and coke precursors, which later show up as poor stability. Catalyst deactivation from metals and sulfur reduces activity and selectivity, again pushing the product toward heavier, more reactive components.
Blending Strategy That Respects Stability Constraints
Blending should be planned around both target properties and “do not exceed” limits. A common best practice is to create a blending matrix that includes: distillate yield contribution by cut, stability test results by candidate blend, and contaminant limits such as metals carryover. Then you adjust component ratios to satisfy both boiling and stability.
A simple example: suppose you have two upgraded distillate components from resid conversion—Component A has good stability but lower yield, while Component B has higher yield but borderline stability. If you blend them directly to hit a target boiling range, you might still fail stability because Component B contributes reactive material disproportionately. Instead, you can use Component A as a stabilizing “diluent” and keep Component B below its stability threshold, even if that means accepting slightly lower overall yield.
Another example involves blending with straight-run distillate. Straight-run material often has fewer reactive species than thermally cracked material. If your upgraded distillate is unstable, you can reduce the fraction of cracked component and increase straight-run contribution while maintaining the same end points. This works because stability is sensitive to chemical reactivity, not only to boiling range.
Practical Workflow for Resid Upgrading and Blending
- Define product targets: boiling range endpoints, stability criteria, and contaminant limits.
- Characterize upgraded streams: distillation curve, metals/contaminants, and stability-relevant indicators.
- Run unit trials within a severity window: track conversion and coke rate alongside stability on representative blend candidates.
- Build a blending matrix: include component-to-property relationships, not just component-to-boiling-range.
- Validate with representative testing: confirm stability on the final blend, not only on individual components.
Mind Map: Resid Upgrading and Blending Controls
Example: Turning Borderline Stability Into a Passing Blend
Assume an upgraded resid distillate fraction meets the desired end point but fails a stability test due to gum-forming tendency. The blending matrix shows that the failing behavior correlates strongly with the fraction that boils slightly below the target mid-cut. The fix is not necessarily to reduce overall conversion. Instead, you can:
- Reduce the contribution of the unstable sub-fraction by adjusting cut points or internal recycle routing.
- Increase the fraction of a more stable distillate component that shares the same boiling range but has lower reactivity.
- Re-test the final blend to confirm that stability passes without drifting outside the boiling specification.
This approach keeps distillate yield as high as possible while addressing the actual cause of instability, which is usually tied to specific chemical reactivity rather than the overall amount of liquid produced.
7.5 Practical Example: Balancing Resid Conversion vs. Coke Quality and Handling
A refinery runs a delayed coking unit on a vacuum resid feed. The operating team wants higher conversion to maximize distillate yield, but they also need coke that is safe to handle, easy to decoke, and consistent in sulfur and metals. The trick is to treat “conversion” and “coke quality” as coupled outcomes of temperature, residence time, and heat-transfer behavior.
Foundational Levers That Link Conversion to Coke
Conversion increases when more of the resid cracks into vapors and lighter liquids. In practice, that means higher severity (reactor temperature and/or longer effective residence time) and better heat transfer into the feed. Coke quality depends on how completely the coke-forming reactions proceed and how much heteroatom and metal content ends up trapped in the solid.
Key coupling mechanisms:
- Severity vs. structure: Higher severity can raise conversion but may produce more porous coke that can be harder to decoke cleanly if drum-wall heat flux is uneven.
- Residence time vs. volatiles: Longer residence time can drive off more volatiles, increasing fixed carbon, but it can also increase gas-phase secondary reactions that shift sulfur partitioning.
- Heat transfer vs. fouling: Poor heat transfer leads to localized over-heating, which can create hard-to-remove coke patches and higher variability across drums.
Practical Operating Objective and Constraints
Set a target window for:
- Resid conversion (e.g., measured by mass balance and product yields)
- Coke sulfur (from feed sulfur and partitioning)
- Coke metals (vanadium, nickel, iron)
- Decoking performance (steam/heat-up time, decoke yield, and downtime)
A useful rule of thumb: if conversion rises while decoking time also rises, you likely gained conversion by pushing severity into a regime that increases coke hardness or heterogeneity.
Step-by-Step Example Workflow
Step 1: Establish a baseline drum performance
Use recent campaigns to compare two or three operating points. Track: reactor outlet temperature, drum pressure, cycle time, steam rate during decoke, and observed decoke completeness.
Example baseline:
- Reactor temperature: 485°C
- Effective cycle: 48 hours
- Decoke steam: 1.2 t/h per drum
- Observed coke: higher sulfur than spec and occasional “hard spots” near the feed inlet region
Step 2: Identify the limiting constraint
If coke sulfur is high, you may need to reduce residence time or adjust fractionation so that more sulfur-bearing components exit as vapor rather than staying in the coke matrix. If decoking is the problem, you likely need to reduce localized overheating and improve heat distribution.
Step 3: Make a controlled change
Try a small severity adjustment rather than a big swing. For instance:
- Reduce reactor temperature by 5°C
- Increase cycle time by 2–3 hours to keep overall conversion near target
This often preserves conversion while changing the reaction pathway toward less aggressive coke formation.
Step 4: Verify with a coke handling checklist
Before declaring success, confirm practical handling metrics:
- Coke bulk density and apparent porosity
- Decoke completeness and fines generation
- Ease of coke cutting and transfer without excessive dusting
If fines spike, you may have shifted toward a more friable coke that increases dust and makes conveying harder, even if conversion improved.
Mind Map: Balancing Conversion and Coke Handling
Example Decision Outcome
After the controlled change (−5°C temperature, +2–3 hours cycle), the team observes:
- Conversion stays within 1–2% of baseline
- Coke sulfur drops because more sulfur-bearing components leave with vapors during the slightly gentler cracking regime
- Decoking time decreases because the coke forms more uniformly, reducing hard spots
The final operating point is not the highest conversion; it is the one that keeps conversion stable while improving decoking predictability and meeting coke quality constraints. In other words, the unit earns its efficiency by being boringly consistent—like a well-tuned clock that also happens to make useful products.
8. Gas Processing and Light Ends Recovery
8.1 Gasoline, LPG, and Off-Gas Systems: Collection and Compression Basics
Gasoline, LPG, and refinery off-gas are handled differently because their vapor pressures, compositions, and safety requirements differ. The common thread is that each system must collect hydrocarbons reliably, keep them within safe pressure and temperature limits, and deliver them to the next step with predictable flow and quality.
System Roles and Boundaries
Gasoline systems typically collect stabilized gasoline from fractionation and send it to storage or blending. LPG systems collect propane and butane-rich streams from fractionation and gas treating, then route them to refrigeration, compression, or storage depending on the refinery’s configuration. Off-gas systems collect light gases from multiple units—often including hydrogen-rich streams, methane/ethane, and small amounts of heavier hydrocarbons—then route them to fuel gas, recovery, or further treatment.
A practical way to avoid confusion is to define the boundary at the first major pressure letdown or separation step. Everything upstream of that boundary is “collection and compression basics”; everything downstream is “product handling and end-use.”
Collection: Keeping Vapors Where You Want Them
Collection starts with preventing losses and preventing contamination.
-
Use the right header pressure philosophy. If the collection header pressure is too low, vapors can flash and carry liquid aerosols downstream. If it is too high, you increase compressor work and risk overpressure in upstream vessels.
-
Provide phase separation before compression. Compressors do not like liquid carryover. A knockout drum or separator upstream of compression removes entrained droplets and reduces corrosion and seal damage.
-
Control temperature to manage condensation. For LPG, cooling helps keep propane and butane in the liquid phase for easier metering and storage. For off-gas, excessive cooling can create unwanted condensate in lines and valves.
-
Maintain drainage and venting discipline. Low points should drain to appropriate sumps, and vents should route to a safe system. A “mystery puddle” in a line is usually a drainage design issue, not a chemistry issue.
Compression: Matching Equipment to the Gas
Compression is chosen based on gas composition, expected flow range, and the presence of contaminants.
- Centrifugal compressors are common for large, steady off-gas flows. They are efficient but require stable suction conditions and good liquid removal.
- Reciprocating compressors are often used where flow is intermittent or where higher pressure ratios are needed. They tolerate some variability but still require liquid protection.
- Liquid-ring or screw options may appear in specific service, but the core idea remains: remove liquids and solids before compression.
Key operating variables include suction pressure, suction temperature, discharge pressure, and interstage cooling (when used). Interstage cooling reduces compressor work and helps keep heavier components from condensing inside the machine.
Safety and Reliability Basics That Actually Matter
Compression systems fail in predictable ways.
- Overpressure protection: Relief valves and rupture disks must be sized for credible scenarios, and discharge routing must be designed for the actual gas composition.
- Seal and instrument integrity: Seal failures often trace back to poor suction separation or contaminated gas. Differential pressure across seals should be monitored.
- Anti-surge control: Centrifugal compressors need surge protection. Surge is not a “minor vibration”; it can damage internals quickly.
- Corrosion control: Chlorides, water, and oxygen can turn small leaks into big problems. Keeping water out of the suction and ensuring proper dehydration upstream reduces corrosion risk.
Mind Map: Collection and Compression Logic
Example: Preventing Liquid Carryover in Off-Gas Compression
Assume an off-gas header receives vapors from a fractionator overhead. During a feed change, the overhead composition shifts slightly heavier, increasing the tendency to condense in cooler sections of the line.
A good practice is to ensure the knockout drum upstream of the compressor has:
- sufficient residence time for droplet removal,
- a controlled level (not “set and forget”), and
- a drain path that returns liquid to the correct downstream system.
If liquid carryover occurs, you typically see rising seal temperature, increased vibration, and unstable suction pressure. Fixing the symptom by lowering compressor speed may reduce vibration temporarily, but correcting the upstream separation and temperature control addresses the root cause.
Example: LPG Phase Management for Stable Storage
For LPG, consider a scenario where propane-rich vapor enters a suction line that is too warm. The line may remain partially vapor, causing the receiving vessel level control to oscillate.
A systematic response is to:
- cool the stream to maintain the intended phase before metering,
- keep insulation and tracing consistent with design temperature,
- verify that the separator or heat exchanger duty matches the expected composition.
When phase is stable, the downstream storage system sees predictable flow and the compressor (if used) operates with less condensation risk.
Practical Checklist for Operators
- Confirm suction conditions match compressor design assumptions.
- Verify knockout drum level control and drainage paths.
- Check interstage cooling performance where installed.
- Ensure relief devices and discharge routing are unobstructed.
- Monitor seal differential pressure and suction stability.
These basics keep gasoline, LPG, and off-gas systems predictable: collection captures the right material, separation prevents liquid problems, and compression delivers it safely to the next step.
8.2 Gas Sweetening and Acid Gas Removal: Sulfur Recovery Integration
Acid gases in refinery off-gas systems usually mean hydrogen sulfide (H2S) and carbonyl sulfide (COS), with smaller amounts of mercaptans and carbon disulfide. “Sweetening” removes these contaminants so downstream units and product streams don’t inherit sulfur, corrosion risk, or odor. The removed sulfur compounds are then routed to a sulfur recovery unit (SRU) so the refinery can convert them into elemental sulfur rather than venting them.
Foundational Concepts and System Boundaries
Start by separating two jobs: (1) capture sulfur species from gas streams and (2) regenerate the capture medium to release a concentrated acid gas feed to the SRU.
In a typical refinery integration, sour gas enters a sweetening unit, treated gas exits to fuel gas, flare, or further processing, and the spent solvent or sorbent is regenerated. Regeneration produces a “rich” acid gas stream that is sent to the SRU. The SRU converts H2S (and often COS after hydrolysis) into sulfur using controlled combustion and catalytic steps.
A practical best practice is to track sulfur in three places: inlet sour gas, treated gas slip, and SRU sulfur product. Even if you don’t have perfect measurements, a sulfur balance forces you to notice when a unit is quietly underperforming.
Sweetening Methods and What They Control
Most refinery sweetening uses either chemical absorption (commonly amines) or physical/chemical solvents designed for specific gas compositions.
Key operating targets include:
- Absorber temperature and pressure: higher pressure improves absorption; temperature affects solvent capacity.
- Solvent circulation rate: too low reduces capture; too high increases energy use and can worsen foaming.
- Lean solvent loading: the “lean” solvent should be regenerated enough that it can still absorb H2S effectively.
- Water management: water supports absorption but excessive water can cause corrosion and carryover.
Example: If an absorber shows rising H2S in the treated gas, first check solvent condition (degradation, contamination), then check contact efficiency (packing flooding, tray weeping), and only then assume the feed composition changed. This order prevents chasing the wrong variable.
Acid Gas Conditioning Before Sulfur Recovery
SRUs are happiest with concentrated H2S and manageable impurities. Before sending acid gas to the SRU, refineries often condition it by:
- Hydrolyzing COS into H2S and CO₂ so sulfur conversion is predictable.
- Removing amine carryover and solvent aerosols that can foul catalysts or create unwanted byproducts.
- Controlling moisture so downstream combustion and condensation behave consistently.
A simple operational check is to compare SRU feed H2S concentration trends with sweetening unit solvent loading trends. If solvent loading rises but SRU feed H2S doesn’t, you likely have a routing or separation issue.
Sulfur Recovery Integration Logic
The SRU typically includes a thermal step to oxidize H2S to SO2, followed by catalytic conversion of SO2 to sulfur. Tail gas treatment reduces residual sulfur compounds.
Integration is not just piping; it’s matching operating conditions. For example, if sweetening produces an acid gas stream with high oxygen demand or unusual contaminants, the SRU may require different air/oxygen ratios to maintain stable combustion and catalyst performance.
Worked Example: Tracing a Treated-Gas H2S Upset
Suppose treated gas H2S rises from 5 ppmv to 30 ppmv. A systematic response:
- Confirm measurement validity by checking analyzer calibration and sample line integrity.
- Check absorber performance: look for packing flooding indicators, abnormal differential pressure, or temperature drift.
- Check solvent condition: verify lean loading, solvent strength, and whether foaming or emulsions are present.
- Compare with regenerator data: if lean loading is high, regeneration may be underperforming, which points back to steam rate, reboiler temperature, or condenser performance.
- Check SRU feed routing: if acid gas conditioning is bypassed or misrouted, SRU conversion may still be fine, but treated gas slip remains high because the sweetening unit is not operating as intended.
This approach avoids the common trap of assuming the SRU is “the problem” when the sweetening unit is actually failing to capture.
Practical Integration Best Practices
- Keep a sulfur balance routine: reconcile inlet sour gas sulfur with SRU sulfur product and treated gas slip.
- Prevent solvent carryover: maintain demister performance and monitor solvent losses.
- Maintain COS hydrolysis effectiveness: verify conversion so SRU stoichiometry stays consistent.
- Stabilize SRU feed composition: acid gas conditioning should reduce swings in moisture and contaminants.
- Use cause-and-effect checks: absorber lean loading should correlate with treated gas H2S; if it doesn’t, investigate routing and measurement first.
When these pieces work together, sweetening becomes a controlled capture step and the SRU becomes a predictable conversion step, with sulfur ending up where it belongs: in a recoverable product stream rather than in the treated gas or the atmosphere.
8.3 Fractionation of Light Ends: Stabilization and Product Recovery
Light ends are the refinery’s “small stuff” that still matters a lot: they include LPG-range components, naphtha-range material, and off-gas constituents that can end up as fuel, feedstock, or both. Fractionation is the step that separates these mixtures into streams with predictable composition, then stabilization ensures the most volatile products can be stored and shipped without pressure surprises.
Stabilization as a Control Problem
Stabilization aims to remove dissolved light components from a heavier product so that the product’s vapor pressure stays within spec. Think of it as reducing how much “stuff that wants to boil” remains in the liquid. For example, if a naphtha product contains too much C3–C4, it may meet distillation targets but still fail storage requirements because it flashes in tanks.
A stabilization column typically uses a reboiler to supply heat and a condenser to remove overhead vapor. The key operating levers are:
- Reboiler duty: increases stripping of light ends from the bottoms.
- Overhead condensation rate: determines how much vapor returns as reflux versus leaving as product.
- Column pressure: affects boiling points and separation sharpness; lower pressure can improve volatility separation but changes equipment constraints.
A practical best practice is to treat stabilization like a mass balance exercise, not just a temperature exercise. If overhead composition shifts, you should check whether feed rate, reflux ratio, or reboiler duty changed, because the column will respond to the overall light-end inventory.
Fractionation Logic for Light Ends
Fractionation usually follows a sequence: collect light ends, remove contaminants, then separate by volatility. The most common starting point is a stabilized feed from upstream units such as reforming or hydrotreating off-gas systems, or a naphtha/condensate stream from gas recovery.
A systematic approach is to define separation goals first:
- Overhead product: often LPG components or a stabilized light naphtha cut.
- Side draws: sometimes used to isolate a specific range for blending.
- Bottoms product: the target stable liquid for storage and blending.
Separation quality depends on relative volatility and column efficiency. If the feed is contaminated with water or heavy oxygenates, you can see poor performance because additional phases and non-ideal behavior disrupt vapor-liquid equilibrium.
Mind Map: Stabilization and Product Recovery
Example: Stabilizing a Naphtha Cut for Storage
Suppose a naphtha blend target requires a maximum vapor pressure. The incoming feed contains a significant fraction of C3–C4. If the stabilization column bottoms vapor pressure is high, the likely cause is insufficient stripping.
A straightforward operating response is to increase reboiler duty in small steps while monitoring:
- Bottoms vapor pressure trend
- Overhead flow rate and composition
- Column pressure stability
If reboiler duty increases but overhead composition does not shift toward lighter components, the issue may be poor heat transfer or maldistribution in the reboiler or feed distribution. In that case, simply adding more duty can waste energy without improving separation.
Product Recovery and Handling
Recovered overhead and side streams must be routed to the right destination. LPG-range overhead may go to a gas plant for further fractionation or to blending tanks if composition fits. Bottoms typically go to storage or blending pools.
Two integrated practices reduce losses and quality drift:
- Condensation reliability: ensure cooling water or refrigerant performance is stable so overhead doesn’t “leak” as vapor to flare or fuel gas.
- Inventory tracking: reconcile light-end inventories across the gas recovery system and stabilization column so that changes in one unit don’t surprise another.
Advanced Details Without the Mystery
At higher throughput, column hydraulics become as important as thermodynamics. Flooding reduces effective separation by limiting contact between vapor and liquid. Packing systems can also be sensitive to liquid distribution; a small change in feed quality can trigger a big change in pressure drop.
To keep separation predictable, operators monitor pressure drop, reflux stability, and reboiler performance. When quality drifts, the fastest path to a correct fix is to compare measured overhead and bottoms compositions to what the column should produce at the current operating point, then adjust the lever that most directly changes the light-end inventory in the bottoms.
Quick Checklist for Good Stabilization Performance
- Bottoms vapor pressure meets spec with margin.
- Overhead recovery is consistent with condenser duty.
- Distillation curve of bottoms matches blending intent.
- Column pressure drop and reflux remain stable.
- Water and contaminants are controlled upstream so separation stays sharp.
Fractionation and stabilization are not separate chores; they are a single workflow that turns “volatile uncertainty” into streams with known behavior in tanks, pipelines, and blending systems.
8.4 Treating and Drying: Water, Mercaptans, and Trace Contaminants
Treating and drying in light-ends and product recovery systems is mostly about removing three troublemakers: free water, mercaptans (and other sulfur compounds), and trace contaminants that quietly ruin stability, corrosion resistance, and downstream performance. The key idea is to remove contaminants in the order that prevents them from reappearing later. Water can carry dissolved salts and oxygen, mercaptans can react with metals and create odor and corrosion issues, and trace solids can foul filters and packing.
Foundational Concepts and Where Contaminants Appear
Water shows up from condensation in coolers, leaks in seals, and carryover from upstream separators. In gas and vapor systems, water often condenses in low points, then migrates with reflux or condensate. Mercaptans typically enter with sour or partially treated streams, especially where sulfur species were not fully converted or where contact time was insufficient. Trace contaminants include fine solids, corrosion products, and entrained aerosols from compressors, pumps, and drums.
A practical best practice is to identify the “phase” of each contaminant at the point of treatment. Water in the vapor phase becomes liquid in cool sections; mercaptans remain in the hydrocarbon phase but can partition into condensed liquids; solids follow the liquid phase more readily. That phase awareness determines whether you use coalescing, adsorption, chemical treating, or filtration.
Water Removal and Drying Strategy
Start with free-water control. Coalescers and demisters are designed to separate liquid droplets from gas or vapor. For condensate systems, gravity separation and proper drum internals prevent water from being re-entrained. Once free water is removed, drying targets dissolved and residual moisture.
Common drying approaches include:
- Glycol dehydration for gas streams where water is the main impurity.
- Molecular sieves or solid desiccants for tighter moisture control on hydrocarbon streams.
- Heater and vapor management to reduce condensation by keeping equipment above dew point.
A simple example: if a stabilized naphtha line shows recurring water in the tank, the root cause is often not “bad drying,” but condensation upstream due to a cooler that is too cold or a poorly insulated section. Fixing temperature control reduces the load on the dryer and improves reliability.
Mercaptan Control and Odor-Causing Sulfur
Mercaptans are often addressed with chemical treating and/or selective adsorption. The goal is to convert or remove sulfur species that cause odor, corrosion, and specification failures.
Two integrated practices work well together:
- Preventive sulfur management upstream: ensure desulfurization or sweetening steps are operating within expected conversion.
- Polishing treatment downstream: use a guard bed or treating step to catch residual mercaptans.
A concrete example: suppose a product blend fails an odor-related customer requirement even though total sulfur is within spec. That pattern can happen when mercaptans are present at low total sulfur levels but high odor potency. A polishing bed (or mercaptan-specific treating) can reduce mercaptans without materially changing bulk properties.
Operationally, monitor both sulfur spec indicators and treating performance indicators such as bed differential pressure, breakthrough behavior, and changes in product sulfur spec components. If differential pressure rises quickly, solids or emulsions may be loading the bed, which also reduces effective contact.
Trace Contaminants and Cleanliness Practices
Trace contaminants are usually small in concentration but large in impact. Fine solids can plug strainers and foul coalescers. Corrosion products can accelerate corrosion by providing sites for wetting and oxygen transfer.
Integrated cleanliness practices include:
- Upstream filtration before adsorption or polishing steps.
- Coalescer inspection and replacement based on differential pressure trends.
- Drum and separator maintenance to prevent carryover.
- Material compatibility checks for treating chemicals and contact surfaces.
A practical example: if a drying bed shows early breakthrough, check whether the inlet filter is bypassing or whether the coalescer is failing. Dryers can only remove what reaches them; if water droplets are passing through, the bed capacity is consumed faster and the product can still carry moisture.
Mind Map: Treating and Drying Logic
Integrated Example Workflow
Consider a hydrocarbon stream routed to storage after light-ends recovery. First, ensure separators and coalescers remove free water so the dryer is not overloaded. Next, apply mercaptan control as a polishing step if odor or mercaptan-specific indicators are problematic. Finally, protect the polishing and drying equipment with filtration and cleanliness checks so trace solids do not shorten bed life. Verification is done by tracking moisture and sulfur component indicators, plus bed differential pressure trends that reveal fouling before it becomes a spec issue.
8.5 Practical Example: Stabilizing a Naphtha Stream to Meet Reid Vapor Pressure and RVP Targets
Reid Vapor Pressure (RVP) is a practical measure of how readily a liquid naphtha fraction turns into vapor at a specified temperature. For storage and blending, the goal is usually to keep RVP within contract limits by controlling volatility, composition, and stability. In this example, you have a naphtha blend that is slightly too volatile, and you need to bring RVP down without breaking downstream octane, sulfur, or stability requirements.
Step 1: Confirm the Measurement Basis and Identify the Volatility Driver
Start by verifying the test method and conditions used for the RVP result. Then compare the naphtha’s distillation curve and light-end content against the target blend. A common pattern is that RVP is high because the stream contains too much material in the gasoline-range light ends, often C4–C6 components and low-boiling aromatics.
Best practice: Treat RVP as a composition problem first, not a “mystery property.” If the distillation curve shows a heavier-than-expected initial boiling point depression, you already have a direction.
Example: A naphtha with an initial boiling point that is 10–20 °C lower than the historical norm typically produces higher RVP, even if the bulk boiling range looks similar.
Step 2: Use a Simple Mass Balance to Choose the Control Lever
RVP reduction usually comes from removing or reducing the lightest components, or from changing how the stream is blended. The most common refinery lever is a stabilization column (or a stabilization step within a broader fractionation train).
You can think in terms of two streams:
- Stabilized naphtha: lower light-end content, lower RVP
- Overhead gas: contains the removed light ends
Best practice: Before changing hardware settings, estimate how much light-end removal is needed. Use a simplified balance based on light-end yield or a surrogate such as C5–C6 fraction.
Example: If the overhead rate increases by 2–3% of feed while maintaining similar bottoms draw, you often see a measurable RVP drop because the removed fraction is disproportionately volatile.
Step 3: Stabilization Column Operating Targets
A stabilization column separates naphtha into vapor overhead and stabilized bottoms. The key operating variables are:
- Reflux ratio: increases separation sharpness
- Reboiler duty: increases stripping and light-end removal
- Overhead pressure: affects vapor-liquid equilibrium and thus volatility separation
- Feed temperature and feed quality: influences where the feed vaporizes and how the column behaves
Best practice: Adjust one variable at a time and watch both RVP and column indicators. If you change reflux and reboiler duty simultaneously, you lose the ability to attribute the outcome.
Example: If RVP is high, you typically increase reboiler duty slightly to strip more light ends, then confirm that the overhead composition shifts toward lighter components rather than simply increasing total vapor rate.
Step 4: Manage Side Effects Like Loss of Valuable Components
More stripping can reduce RVP but also remove components that contribute to octane or blending value. The trick is to remove enough light ends to meet RVP while keeping the desired boiling range and aromatics content.
Best practice: Track at least three measurements during the adjustment window:
- RVP of the stabilized bottoms
- Distillation curve endpoints or key cut points
- Overhead gas rate and composition (to confirm you are removing the intended light ends)
Example: If RVP drops but the stabilized naphtha’s mid-boiling fraction shifts downward, you may be over-stripping and losing material that should stay in the naphtha pool.
Step 5: Confirm Stability Beyond RVP
RVP is not the only stability concern. Naphtha must also resist gum formation and meet storage stability expectations. Light ends removal helps, but you still need to ensure the stream is not carrying reactive contaminants.
Best practice: Pair RVP checks with a basic stability indicator such as existing refinery stability test results for the same stream family. If RVP is corrected but stability worsens, the issue is likely contamination rather than volatility.
Mind Map: Stabilizing Naphtha for RVP Control
Example: A Practical Adjustment Sequence
Assume the stabilized naphtha RVP is 0.3 psi above target. The distillation curve shows an overly light initial region.
- Increase reboiler duty slightly to enhance stripping of light ends.
- Keep reflux ratio constant for the first trial to isolate the effect.
- Hold overhead pressure steady to avoid shifting equilibrium behavior.
- Sample stabilized bottoms after the column reaches steady state and measure RVP.
- If RVP is still high, increase reflux ratio modestly to sharpen separation rather than continuing to strip aggressively.
Best practice: Use steady-state timing that matches the column holdup and sampling lag. Measuring too early can mislead you because the column composition profile changes gradually.
Step 6: Document the Operating Window and Blend Implications
Once you hit the target, record the operating window: reboiler duty range, reflux ratio range, overhead pressure, and feed conditions. Also note how the stabilized naphtha distillation curve changed so blending teams can anticipate the impact.
Example: If the RVP target is met at a higher reboiler duty, you may expect slightly lower light-end content and a small shift in blending behavior. That’s not a problem; it’s just information you want before the next batch.
9. Sulfur Recovery, Treating, and Environmental Control
9.1 Sulfur Sources in Refining: Where Sulfur Enters the Process
Sulfur shows up in a refinery in more places than most people expect. The key idea is simple: sulfur enters with the crude and then moves between units as different fractions are separated, treated, and blended. If you track sulfur by stream and unit, you can explain most “mysteries” in product sulfur, sour gas loads, and catalyst wear.
Foundational Sulfur Inputs
Crude oil sulfur content is the starting point. Sulfur exists in multiple chemical forms, and those forms behave differently during distillation and processing. In general, heavier fractions concentrate more sulfur, so residues and heavy gas oils are usually the main sulfur carriers.
Natural gas and purchased feedstocks can also contribute sulfur. If the refinery imports sour gas, LPG, or other hydrocarbon streams, they may carry hydrogen sulfide (H2S), mercaptans, or sulfur compounds that later appear in off-gas systems and product streams.
Utilities and recycle streams matter too. Steam, water, and recycle gas can carry trace sulfur species, especially when they contact sour hydrocarbons or acid gas systems. This is why “small” sulfur sources can still affect treating unit performance.
How Sulfur Moves Through Separation
Atmospheric distillation separates crude into lighter cuts and a residue. Sulfur does not disappear; it mostly follows the boiling range. As a result, the naphtha fraction may have low sulfur while gas oils and vacuum residues carry much higher sulfur.
Vacuum distillation further concentrates sulfur into heavier fractions. Vacuum residue is often the dominant sulfur sink before any upgrading. If you ever wonder why a hydrotreating unit seems “underfed” or “overloaded,” check whether the sulfur-rich residue fraction is being routed as expected.
Fractionation and blending then redistribute sulfur among intermediate streams. A blend tank is not a chemical reactor, but it is a sulfur mixing point. The sulfur concentration you measure in a tank is the weighted average of its incoming streams.
Where Sulfur Appears as Reactive Species
Sulfur compounds can be present as organic sulfur (thiols, sulfides, thiophenes) or as inorganic sulfur (H2S). Organic sulfur tends to remain in hydrocarbon phases, while H2S is more likely to partition into gas phases and acid gas systems.
During heating and processing, some sulfur species can convert or decompose, especially in thermal units. Even when the main conversion happens in hydrotreating, upstream thermal exposure can change the distribution between gas and liquid phases.
Unit-by-Unit Sulfur Entry Points
Desalting and crude washing primarily remove salts and water. Sulfur removal is limited, but sulfur can still shift between hydrocarbon and water phases. If sour water is not handled correctly, sulfur can re-enter downstream systems.
Hydrotreating and hydroprocessing are the main sulfur removal steps. They convert sulfur to H2S, which then goes to gas treating and sulfur recovery. This creates a predictable pattern: product sulfur drops, while acid gas load rises.
Catalytic reforming and other non-hydrogenation units usually do not remove sulfur efficiently. Sulfur can poison catalysts and increase off-gas sulfur. That is why feed sulfur limits exist for many catalytic units.
Thermal conversion units such as visbreaking and coking can generate additional sulfur-containing gases and increase sulfur in coke or heavy residues. The exact split depends on severity and feed composition.
Gas processing and stabilization can concentrate sulfur species into off-gas or stabilize them into liquid products depending on volatility and phase behavior. If a stabilized product is still high in sulfur, the issue is often upstream feed quality or incomplete treating.
Mind Map of Sulfur Sources and Pathways
Mind Map: Where Sulfur Enters the Process
Integrated Example: Tracing Sulfur from Crude to Product
Assume a crude assay shows 2.5 wt% sulfur. After atmospheric and vacuum distillation, the refinery routes:
- Naphtha to reforming
- Gas oils to hydrotreating
- Vacuum residue to a thermal unit
If the hydrotreating unit removes sulfur by converting it to H2S, the acid gas system will show higher H2S flow and the sulfur recovery unit will process more feed. Meanwhile, the treated gas oil products meet sulfur spec because sulfur has been removed from the liquid phase.
If reforming feed still causes high off-gas sulfur, the likely cause is that the naphtha cut contains sulfur compounds that were not reduced upstream, or that blending introduced a small amount of higher-sulfur stream. The fix is not “more reforming,” but tighter control of stream routing and feed sulfur limits.
Practical Best Practice: Sulfur Accounting Mindset
Treat sulfur like a budget. For each unit, ask two questions: where does sulfur leave (product, off-gas, residue, wastewater), and where does it enter (feed streams, recycle, utilities contact)? When you can balance sulfur across the refinery, you can explain why a change in one unit’s operation affects another unit’s gas treating load or product sulfur.
9.2 Acid Gas Removal and Regeneration: Solvent Selection and Operation
Acid gases in refinery gas streams usually mean hydrogen sulfide (H2S) and carbon dioxide (CO₂). Removing them matters because they poison catalysts, corrode equipment, and interfere with downstream treating. The solvent system has two jobs: capture acid gases efficiently at absorber conditions, then release them in a regenerator so the treated gas can be routed onward.
Core Solvent Choices and What They Trade Off
Most refinery units use chemical solvents for H2S and physical or mixed solvents for CO₂. Chemical solvents react with H2S, which is why they can achieve low H2S slip even when the gas is not very lean.
- Amines (chemical): Common for H2S removal and sometimes CO₂. They form heat-stable salts and can degrade with oxygen and contaminants.
- Physical solvents (physical): Examples include certain hydrocarbons or glycols used for CO₂ capture. They are less selective for H2S unless specially formulated.
- Mixed solvents (hybrid): Designed to balance CO₂ capacity with H2S removal performance.
A practical selection starts with three inputs: acid gas composition, required outlet spec, and solvent tolerance to impurities. If the feed contains oxygen, ammonia, or heavy hydrocarbons, you plan for solvent management rather than assuming the solvent will “just work.”
Mind Map: Solvent Selection and Operation
Absorber Operation: Getting Capture Right
In the absorber, sour gas contacts solvent in a packed column or tray tower. The solvent enters as “lean” (low acid gas loading), and it leaves as “rich” (high loading). Two operating variables dominate performance: temperature and solvent circulation.
- Temperature: Lower absorber temperature generally increases absorption for many systems, but it can also increase viscosity and promote foaming. A common best practice is to keep the absorber within a controlled temperature band using intercoolers or lean-solvent cooling.
- Solvent circulation: Too little flow leads to high H2S in the treated gas; too much flow can cause flooding or unnecessary solvent losses. Operators often tune circulation to maintain stable mass transfer without pushing the column into high pressure drop.
A simple example: suppose a gas stream has 2000 ppmv H2S and you need 5 ppmv in the outlet. If the solvent is under-circulated, the rich loading rises quickly and the top of the column stops providing enough driving force. The treated gas then tracks the feed. Increasing circulation and slightly lowering absorber temperature can restore the driving force, but you must watch for foaming.
Regenerator Operation: Releasing Acid Gas Efficiently
The regenerator takes rich solvent and drives acid gases out using heat in a reboiler and often stripping steam. The goal is to produce a “lean” solvent with low loading while minimizing solvent degradation and energy use.
- Reboiler duty: Higher duty increases stripping, but it also increases solvent thermal stress and can accelerate degradation. Operators manage duty to hit the target lean loading rather than chasing maximum stripping.
- Stripping steam: Steam improves mass transfer and helps remove H2S and CO₂. Too much steam increases solvent carryover and can raise condenser load.
- Condenser and reflux: These reduce solvent losses by condensing overhead vapors and returning reflux to the column.
A concrete operating pattern looks like this: if H2S in the treated gas rises, you first check whether the regenerator is producing truly lean solvent. If lean loading is high, the absorber cannot achieve the required driving force even if circulation is correct. Corrective action typically focuses on reboiler duty, steam rate, and overhead condensation performance.
Solvent Management: Keeping the Chemistry Under Control
Even a well-chosen solvent loses performance if impurities accumulate. Heat-stable salts form in amine systems when certain contaminants react with the solvent. These salts reduce effective absorption capacity and increase viscosity.
Best practices include:
- Oxygen control: Oxygen can accelerate solvent degradation. Many units manage oxygen ingress through upstream gas handling and operating discipline.
- Ammonia and hydrocarbons: These can increase foaming and salt formation. Filtration and upstream cleanup reduce the load.
- Reclaim or purge strategy: Periodic solvent reclaim removes degraded material and salts. Purge rates are balanced against solvent losses.
Mind Map: Common Operating Symptoms and Likely Causes
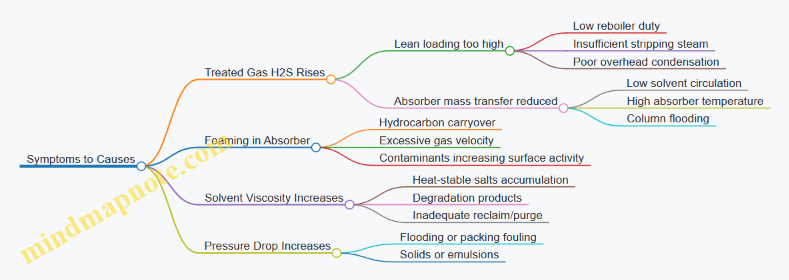
Example: Diagnosing a Regenerator Underperformance
Imagine the unit meets CO₂ removal but H2S slip increases after a period of stable operation. The absorber temperature and circulation are unchanged, and column pressure drop remains normal. The next check is the regenerator lean loading trend. If lean loading has drifted upward, the regenerator is not stripping to the expected endpoint. Operators then verify reboiler duty and steam flow, and confirm that overhead condensation is returning reflux rather than sending solvent overhead. Once lean loading returns to the target range, the absorber regains the driving force and H2S slip drops back to spec.
The solvent system is therefore not just a chemical choice; it is an operating loop. Solvent selection sets the baseline performance, and solvent operation keeps the baseline from drifting.
9.3 Claus and Tail Gas Treatment Converting H2S to Elemental Sulfur
Refineries convert hydrogen sulfide (H2S) from acid gas streams into elemental sulfur using the Claus process. The core idea is simple: burn part of the H2S to form sulfur dioxide (SO2), then react the remaining H2S with SO2 to make sulfur and water. The “part of the H2S” is not a guess; it is set by stoichiometry and tuned by catalyst and heat management.
Foundations: Reactions and Stoichiometry
The primary Claus reactions are:
- Combustion step:
- 2 H2S + 3 O2 → 2 SO2 + 2 H2O
- Main Claus step:
- 2 H2S + SO2 → 3 S + 2 H2O
A practical target is a near-ideal SO2/H2S ratio for the main reaction. If you feed too much oxygen, you create excess SO2 that later becomes difficult to remove. If you feed too little oxygen, unreacted H2S slips through and increases sulfur losses.
Process Layout: From Acid Gas to Sulfur Recovery
A typical Claus train starts with:
- Feed conditioning: Remove particulates and manage moisture so the burner and catalyst see stable conditions.
- Thermal section: Partially combust H2S to generate SO2.
- Heat recovery and sulfur condensation: Cool the gas to condense molten sulfur.
- Catalytic section: Use alumina or similar catalysts to drive the main reaction.
- Multiple passes: Repeat heat recovery and catalytic beds to increase conversion.
A key best practice is controlling temperature profiles. Too hot can increase side reactions and reduce sulfur yield; too cool can cause premature condensation and plugging. Operators often use staged cooling and carefully designed condensers to keep sulfur in the right phase.
Integrated Best Practices: Air, Oxygen, and Water Balance
Oxygen control is the first lever. A simple way to think about it is that the thermal section “manufactures” the SO2 needed for the catalytic reaction. Instrumentation should track O2, H2S, and SO2 so the oxygen feed can be adjusted to keep the SO2/H2S ratio near the desired band.
Water balance matters because sulfur formation produces water. Excess water can affect condensation behavior and corrosion risk in downstream equipment. Too little water can shift equilibrium and change gas composition. In practice, feed drying and controlled steam management help keep the sulfur recovery section stable.
Condensation and Sulfur Handling
After each reaction zone, the gas is cooled to condense sulfur. Condensed sulfur is removed from knock-out drums and collected in tanks. A common operational goal is to avoid sulfur carryover, which can foul condensers and reduce overall recovery.
Two practical checks:
- Temperature approach: Ensure condenser outlet temperatures are low enough for condensation but not so low that equipment experiences severe plugging.
- Drain discipline: Keep drains clear and maintain proper steam tracing where required so sulfur does not solidify in lines.
Why Tail Gas Treatment Exists
Even with good Claus performance, some H2S and SO2 remain in the tail gas. Tail gas treatment converts these residuals to additional sulfur while meeting environmental limits. The Claus unit alone is not designed to remove everything; it is designed to recover most sulfur efficiently.
Tail Gas Treatment: Common Pathways
Tail gas systems generally fall into two categories:
- Direct conversion of H2S to sulfur using catalytic or sorbent-based steps.
- Conversion of SO2 to sulfur by reducing it, often using hydrogen-rich streams.
A typical integrated approach is Claus + enrichment + tail gas unit. Enrichment increases the effective conversion of the main Claus train by reducing the amount of oxygen and improving the SO2/H2S balance before the catalytic beds.
Mind Map: Claus and Tail Gas Treatment
Example: Tuning Oxygen to Reduce Tail H2S
Assume a Claus feed contains H2S with a measured SO2/H2S ratio after the thermal section that is too low. That means not enough H2S was oxidized to create SO2. In the catalytic beds, the main reaction then has insufficient SO2, so H2S slips to the tail gas.
A systematic response is:
- Verify O2 flow and burner air distribution.
- Check for incomplete mixing in the thermal section.
- Adjust oxygen slightly upward to raise SO2 generation.
- Confirm by measuring SO2 and H2S after the thermal zone.
If tail H2S decreases while sulfur recovery remains stable, the oxygen adjustment improved stoichiometry rather than just shifting where sulfur condenses.
Example: Preventing Condenser Plugging
Suppose sulfur carryover increases after a condenser. The likely causes include insufficient cooling, poor drainage, or temperature gradients that cause sulfur to solidify in the wrong place. The corrective sequence is:
- Confirm condenser outlet temperature and cooling water performance.
- Inspect steam tracing and drain valves for proper operation.
- Check for upstream carryover due to knock-out drum performance.
When condenser performance is restored, tail gas composition often improves because less sulfur is lost as aerosols.
Putting It Together: How Claus and Tail Treatment Work as One System
Claus trains aim for high sulfur recovery with controlled reaction and condensation. Tail gas treatment then cleans up the remainder using conversion or reduction steps designed for low concentrations. Good results come from treating the whole system as a set of linked balances: oxygen sets the SO2/H2S ratio, heat sets condensation behavior, and tail treatment handles what remains without trying to force the Claus unit to do everything.
9.4 Wastewater and Sour Water Stripping: Contaminant Removal and Reuse
Refineries generate wastewater from equipment washing, desalting, sour water collection, cooling systems, and occasional leaks or spills. The key challenge is that “water” can carry dissolved gases and reactive contaminants—especially hydrogen sulfide (H2S), ammonia (NH3), phenols, and dissolved salts. Sour water stripping is the workhorse for removing volatile contaminants so the remaining water can be treated further or reused.
Foundational Concepts and What Stripping Actually Does
Sour water stripping relies on gas–liquid contact in a packed column or tray tower. As the water flows down, an overhead gas flows up, carrying volatile species out of the liquid. Steam is commonly used as the stripping gas because it provides heat and mass transfer in one package.
The practical goal is not “remove everything,” but to reduce specific contaminants to levels that downstream units can handle. For example, if H2S is removed effectively, the remaining water is far easier to treat biologically or chemically without constant odor and corrosion issues.
Contaminant Map and Removal Targets
Typical sour water contaminants include:
- H2S and light mercaptans: drive odor and corrosion; removed by stripping.
- Ammonia: volatile under stripping conditions; removed and later recovered or converted.
- Phenols and light organics: partially volatile; removal improves downstream performance.
- Dissolved salts: largely nonvolatile; stripping does not remove them, so blowdown and water balance still matter.
A useful operating mindset is to separate “volatile” from “nonvolatile.” Stripping is strong on the volatile fraction; salts require separate management.
System Layout and Material Flow
A typical system collects sour water in a tank, pumps it to the stripping column, and sends the overhead to an acid gas system or sulfur recovery train. The stripped bottoms go to further treatment such as polishing, biological treatment, or reuse-oriented filtration and clarification.
Good practice starts with collection discipline. If you mix relatively clean streams with sour water, you increase stripping load and can dilute the effectiveness of downstream treatment. Simple segregation—based on where the water originates—often beats adding more steam.
Column Operation and Key Operating Variables
Stripping performance depends on:
- Steam rate: higher steam increases stripping driving force but raises energy use.
- Water flow rate: higher flow can reduce residence time and reduce removal efficiency.
- Column pressure: lower pressure can increase volatility but may affect overhead condensation and downstream handling.
- Packing or tray condition: fouling reduces contact efficiency; stable pressure drop is a sign of healthy hydraulics.
A practical control approach is to regulate steam-to-water ratio using overhead H2S and ammonia targets. If overhead H2S rises, the first check is usually steam rate and column flooding margin.
Controlling Fouling, Corrosion, and Emulsions
Sour water can contain suspended solids, oil, and corrosion products. These can foul packing and create channeling.
Best practices that pay off quickly:
- Provide upstream solids removal such as settling or filtration where feasible.
- Manage oil carryover with basic separation before the column.
- Use corrosion-resistant internals where H2S and ammonia coexist, and ensure materials match expected pH after condensation.
If the column pressure drop trends upward while overhead removal worsens, assume fouling or flooding and inspect packing condition and feed quality.
Overhead Handling and Downstream Integration
Overhead vapors typically contain H2S, ammonia, and water vapor. Condensation and gas treatment determine whether contaminants end up in sulfur recovery, wastewater, or off-gas.
A common integrated strategy is:
- Condense water from overhead to reduce vapor load.
- Send noncondensables and remaining acid gases to an acid gas system.
- Route condensate to the appropriate water treatment path.
This integration matters because “good stripping” that sends contaminants to the wrong place can simply move the problem.
Practical Example: Improving H2S Removal Without Overheating
Suppose a unit targets low H2S in stripped bottoms for reuse. Operators notice overhead H2S is higher than normal.
A systematic response:
- Check steam header pressure and confirm steam flow measurement accuracy.
- Verify column pressure and ensure it is within the operating window.
- Inspect feed temperature and confirm it is not lower than expected; colder feed reduces stripping efficiency.
- Confirm packing pressure drop is stable; a rising pressure drop suggests fouling or flooding.
If steam rate is already high, increasing it further may waste energy while only marginally improving removal. In that case, improving feed quality and contact efficiency often restores performance more effectively.
Mind Map: Sour Water Stripping Contaminant Removal and Reuse
Case-Style Example: Reuse Readiness Checklist
Before claiming reuse, verify that stripped bottoms meet the treatment unit’s assumptions. For instance, if biological treatment is used downstream, ammonia and phenols must be within ranges that prevent inhibition. If reuse is for noncritical cooling applications, suspended solids and residual odor compounds must be controlled so the water does not create operational nuisance.
A simple checklist ties measurements to decisions: overhead H2S and NH3 confirm stripping effectiveness; bottoms turbidity and conductivity confirm whether solids and salts are being managed; and corrosion monitoring confirms whether the chemistry is stable for the intended service.
9.5 Practical Example: Closing the Loop on Sulfur Balance Across Multiple Units
Sulfur balance is the accounting system that tells you where sulfur goes: into products, into emissions, into wastewater, or into internal inventories. In a refinery, the same sulfur atom can appear in multiple places as it moves through desalter, distillation, hydrotreating, sulfur recovery, and product blending. The practical goal is simple: make the measured sulfur flows add up, so you can spot the “missing sulfur” before it shows up as off-spec product or an environmental exceedance.
Foundational Setup
Start by defining the system boundary. For this example, include crude pre-processing through sulfur recovery and product blending. Exclude utilities unless they are a known sulfur source (for instance, sulfur-containing fuel gas used in heaters).
Next, choose a consistent basis for all sulfur numbers. Use mass flow of total sulfur (wt% × mass rate) for liquids and H2S/SO2 for gases. Convert everything to a common unit such as kg S per day. If you have both analyzer data and lab data, use lab values for product sulfur spec checks and analyzer values for continuous mass-balance closure.
Mind Map: Sulfur Balance Logic
The Balance Equation You Actually Use
A workable daily balance looks like this:
Sulfur In = Sulfur In Products + Sulfur In Elemental Sulfur + Sulfur In Emissions + Sulfur In Wastewater + Sulfur In Losses
“Losses” is not a place you want to keep sulfur; it is a bucket for measurement uncertainty and untracked internal holdup. Your job is to shrink that bucket by improving data alignment and accounting.
Practical Example with Integrated Reasoning
Assume a refinery processes 100,000 bpd of crude at 2.5 wt% sulfur. Crude sulfur in is:
- 100,000 bpd × 7.33 bbl/tonne (approx.) is a conversion step you would do with your plant’s density and mass conversion. For illustration, treat the crude sulfur in as ~1,825,000 kg S/day after proper mass conversion.
Now trace the main pathways.
-
Desalter and overhead handling: If desalter wash water removes salts and some sulfur compounds, sulfur can leave with overhead water. Measure sulfur in sour water and desalter overhead condensate. If the wash water sulfur is higher than expected, you may see a higher sulfur load to sour water stripping.
-
Distillation cuts: Atmospheric and vacuum columns separate sulfur by boiling range. Heavier cuts typically carry most of the sulfur into vacuum gas oil and residues. Use cut-by-cut sulfur from lab assays or validated correlations from boiling range and crude assay.
-
Hydrotreating and hydrocracking: In hydrotreaters, sulfur is converted mainly to H2S in the gas phase. The key closure check is whether the H2S produced in the reactor system matches the sulfur removed from liquid feed. If you see low H2S in the gas but high sulfur in treated liquids, the issue is usually catalyst performance, gas-liquid separation, or sampling mismatch.
-
Amine and gas sweetening: H2S captured by amines becomes acid gas to sulfur recovery. Measure H2S slip in treated gas and sulfur in amine regenerator off-gas. If H2S slip rises, sulfur recovery load drops, and stack SO2 may rise.
-
Claus and tail gas: Claus converts H2S to elemental sulfur. Track sulfur in elemental sulfur product and SO2 in stack. Tail gas treatment determines how much sulfur remains as SO2 versus being reduced back to H2S or captured.
-
Product blending: Final product sulfur is the last “sink” you can verify against contracts. If diesel sulfur is low but total sulfur in products is high, the excess may be in gasoline or naphtha, or it may be in off-spec streams not counted.
Closure Checks That Find the Missing Sulfur
Use three targeted checks rather than chasing everything at once.
-
Sampling alignment check: Compare the sulfur in hydrotreating feed and treated liquid using the same time window as the gas H2S analyzer. If the gas data is averaged over a different period than the liquid grab samples, the balance will look wrong even when the process is fine.
-
Inventory reconciliation check: Sulfur can sit in tanks and drums. If you ignore inventory changes, you will misclassify holdup as “losses.” Include tank level changes and product transfers for the balance day.
-
Analyzer sanity check: Verify that H2S analyzer calibration and amine system measurements are consistent with known stoichiometry. A small bias in H2S ppm can translate into a large sulfur mass error.
Example Outcome and Action
Suppose your initial balance shows 2% sulfur in “losses”. After aligning sampling windows, you find that the hydrotreating gas H2S analyzer was reading low during a shift change, and the amine regenerator off-gas flow was underestimated due to a temporary instrument range change. Recalculating with corrected gas flow and H2S concentration reduces losses to 0.3%, and the product sulfur totals now match lab trends.
The operational takeaway is practical: when sulfur balance closure improves, you can trust the next layer of decisions—like whether to adjust hydrotreating severity, desalter wash rate, or sulfur recovery operating setpoints—because the accounting system is no longer lying to you.
10. Fuel Blending, Additives, and Quality Assurance
10.1 Blending Fundamentals: Octane, Cetane, Volatility, and Density Control
Blending is the practical bridge between refinery outputs and customer specs. A blend is not just “mixing streams”; it is managing how properties respond to composition. Four properties dominate many fuel decisions: octane (gasoline knock resistance), cetane (diesel ignition quality), volatility (how easily the fuel vaporizes), and density (a proxy for energy content and volumetric behavior).
Core Property Links to Composition
Octane is driven by how easily the fuel resists auto-ignition under compression. In gasoline, higher-octane components often include aromatics and isomerized hydrocarbons, while straight-chain components tend to knock more. A blend’s octane is usually treated as a weighted outcome of component octane numbers, but the “weights” are not purely linear across all ranges.
Cetane measures how readily diesel fuel ignites. Higher cetane components are typically more paraffinic and less prone to long ignition delays. Aromatics generally reduce cetane, and higher boiling, heavier fractions can raise cetane if they are the right type of molecules.
Volatility is about distillation behavior and vapor pressure. For gasoline, volatility affects cold starts and warm drivability; for diesel, it influences ignition and smoke. Volatility is controlled by the distribution of lighter and heavier fractions, not by a single “lighter is better” rule.
Density affects volumetric energy delivery and blending by volume. Density also correlates with composition: heavier, more aromatic, or higher-boiling components often increase density. Density control matters when contracts and pumps use volume-based accounting.
Mind Map: Blending Levers and What They Affect
Practical Blending Workflow
-
Confirm stream assays and temperatures. Density and volatility are temperature-sensitive. If you blend at one temperature and test at another without correction, you can chase phantom errors.
-
Choose the blending basis. Many refineries blend by volume for operational convenience, but contracts may be mass- or energy-referenced. Decide the basis early and keep it consistent.
-
Use property models, not just intuition. A component with high octane might also raise density and shift volatility. A good blending plan checks all targets together.
-
Plan for interactions. Octane and cetane response can show non-ideal behavior, especially when blending across wide composition ranges. That is why blending models are calibrated with historical data.
-
Verify with a “sanity check” calculation. Before running the blend, estimate whether the result is physically plausible. If the predicted volatility is wildly off, the stream data or cut points are likely wrong.
Example: Gasoline Octane and Volatility Trade-Off
Suppose you have three gasoline components:
- Stream A: high-octane reformate, higher density, slightly heavier end
- Stream B: alkylate, high octane, lighter end
- Stream C: straight-run gasoline, lower octane, higher volatility
You need to meet a target octane and a volatility window. If you only chase octane by adding more Stream A, you may push the blend’s distillation curve too heavy, hurting volatility and cold-start behavior. A better approach is to use Stream B to “carry” octane while keeping the lighter fraction balance, then use Stream A to fine-tune octane without overshooting the volatility end points.
A simple operational rule of thumb: when volatility is tight, treat the light-end components and cut points as the first lever, then adjust octane with the components that least disturb the distillation shape.
Example: Diesel Cetane and Density Control
Imagine two diesel stocks:
- Stock D: hydrotreated gas oil with moderate cetane and lower density
- Stock E: heavier, more paraffinic component with higher cetane and higher density
If the customer requires both cetane and density limits, you cannot treat cetane as the only target. Increasing Stock E raises cetane but also increases density, which can push the blend out of spec. The practical solution is to blend D and E to hit density first (or within a narrow band), then adjust cetane using smaller incremental changes or a cetane improver if your system allows it.
Advanced Details That Prevent “Spec Surprises”
- Sensitivity matters. Gasoline octane often has different behavior between RON and MON. A blend that meets one number can still fail the other if sensitivity shifts.
- Tank stratification changes volatility. If a tank is not well mixed, the top and bottom can differ in light ends, leading to inconsistent RVP or distillation results.
- Additives are part of the property budget. Even when dosed in small amounts, additives can affect density and sometimes measured properties indirectly through test methods.
- Reconcile calculations with sampling. If lab results disagree with predictions, check sampling representativeness before blaming the blending model.
In short, blending fundamentals are about coordinated control: octane and cetane respond to molecular character, volatility responds to fraction distribution, and density responds to overall composition. When you manage all four together, the blend stops being a guess and becomes a controlled outcome.
10.2 Additives for Performance and Stability: Antioxidants, Corrosion Inhibitors, and Demulsifiers
Additives are small in dose and big in impact: they protect equipment, preserve product quality, and prevent messy phase behavior. In fuel and refinery blending, the best additive choice starts with three questions—what problem you’re preventing, where it shows up (storage, distribution, or unit operation), and what constraints you must respect (compatibility, treat rate limits, and spec targets).
Antioxidants for Fuel Stability
Oxidation is a slow reaction that turns stable hydrocarbons into gums, acids, and sediments. The practical symptoms are familiar: increased induction time failures, darkening, filter plugging, and deposits in tanks and fuel systems.
Antioxidants work by interrupting radical chain reactions. A useful mental model is “stop the dominoes before they start.” Many antioxidant packages are designed to work alongside metal control, because metals like copper can accelerate oxidation.
Best-practice handling
- Dose based on measured oxidation tendency, not just a generic treat rate. If you only know the blend recipe, you’re guessing.
- Mix thoroughly before storage. Poor blending creates pockets with low inhibitor concentration, which then become the first failure points.
- Avoid contamination with strong oxidizers or reactive contaminants that can overwhelm the inhibitor.
Easy example
If two diesel blends have the same sulfur and viscosity but one has a lower induction time, the difference is often trace metals, unsaturates, or prior oxidation history. Adding antioxidant to the “worse” blend at the same treat rate as the “better” one may not be enough; you need to confirm the induction time improvement.
Corrosion Inhibitors for Metal Protection
Corrosion in fuels is usually electrochemical, driven by water, dissolved acids, and ionic species. Even when the bulk fuel is “dry,” small water droplets can form at interfaces, especially in storage tanks.
Corrosion inhibitors form a protective film or neutralize corrosive species. Film-formers are common for steel and copper systems, while other chemistries target acid components or help keep water from becoming aggressively conductive.
Best-practice handling
- Match inhibitor chemistry to the metals present. A package that protects steel may not protect copper equally well.
- Control water and acidity first. Additives are not a substitute for removing the root cause.
- Verify compatibility with other additives and with the base fuel. Some inhibitor systems can interact with detergents or demulsifiers, changing performance.
Easy example
A jet fuel system shows increased copper corrosion after a storage period. If water content is slightly elevated and the fuel contains trace acids, an inhibitor that forms a stronger copper-protective film can reduce corrosion rates—provided the fuel is also kept within water and acidity limits.
Demulsifiers for Water Separation
Demulsifiers address a different failure mode: persistent emulsions. When water and fuel form stable droplets, separation slows down, and downstream equipment sees more water than expected.
Demulsifiers destabilize the emulsion by altering droplet surface properties so droplets coalesce and settle. They’re often used where water removal is critical, such as in tank bottoms management or before polishing steps.
Best-practice handling
- Treat based on emulsion behavior, not just water content. Two samples with the same water percentage can separate at very different rates.
- Ensure the additive reaches the emulsion phase. If dosing is too far upstream or mixing is poor, the demulsifier may never contact the droplets effectively.
- Monitor separation time and water drawdown performance after dosing.
Easy example
Suppose a kerosene blend repeatedly fails a water separation check. Increasing demulsifier dose blindly can sometimes worsen separation by creating too-stable interfacial films. A better approach is to test separation time versus treat rate and confirm the emulsion type.
Integrated Selection Logic
A practical selection workflow is to identify the dominant failure mechanism, then choose the additive type that targets it.
- If the problem is oxidation-related deposits and induction time loss, start with antioxidants and metal control.
- If the problem is tank or line corrosion, start with water and acidity control, then select a metal-appropriate inhibitor.
- If the problem is slow water separation or persistent emulsions, select a demulsifier and verify separation kinetics.
When multiple additives are used together, compatibility testing matters because the “best” chemistry for one mechanism can interfere with another mechanism.
Mind Map: Additive Functions and Practical Controls
Example: One Blend, Three Problems, One Plan
A storage tank shows three issues: higher sediment, mild corrosion on steel coupons, and slow water settling. The systematic approach is to test and address each mechanism in order of what drives it.
- Run oxidation stability tests to confirm whether antioxidant is needed and whether metals are contributing.
- Measure water and acidity to ensure corrosion inhibitors are not compensating for poor base fuel control.
- Perform emulsion separation tests to determine whether a demulsifier is required and at what treat rate.
After dosing, re-test the same indicators. If sediment improves but water separation does not, you’ve learned the antioxidant helped oxidation but didn’t fix emulsion stability. If corrosion improves but sediment worsens, the inhibitor may be changing interfacial behavior, and you may need to adjust the additive package for compatibility.
This is the core idea: additives are tools, not magic. The right one targets the right failure mechanism, and the validation tests confirm the mechanism was actually addressed.
10.3 Meeting Regulatory and Contract Specs RVP Sulfur Aromatics and Distillation Curves
Regulatory and contract specifications for fuels are not just paperwork; they are constraints that shape how you blend, treat, and verify product quality. The practical goal is to meet every limit simultaneously, because fixing one parameter often nudges another. A clean way to work is to treat each spec as a measurable “knob” with known drivers, then use blending logic and test discipline to keep the whole system inside the fence.
Foundations of Spec Compliance
Start with what the numbers actually represent.
- RVP (Reid Vapor Pressure) reflects volatility and vapor formation at specified conditions. Higher RVP increases evaporative emissions and can affect vapor lock risk.
- Sulfur is tied to emissions and catalyst poisoning in downstream systems. It also influences corrosion risk when combined with water and other contaminants.
- Aromatics often correlate with octane and solvency, but excessive aromatics can raise health and emissions concerns depending on the jurisdiction and fuel type.
- Distillation curves (IBP, 10%, 50%, 90%, FBP or similar points) describe volatility distribution. They connect to cold-start behavior, warm-up, and combustion characteristics.
A useful mindset is: RVP is a “single-point volatility” indicator, while distillation curves are a “volatility distribution” map. Sulfur and aromatics are composition constraints that can indirectly affect volatility and stability.
How Blending Choices Drive Each Spec
RVP drivers typically include light components, naphtha cut quality, and how much low-boiling material you include. For example, if you increase the fraction of a light reformate blendstock, RVP usually rises because more material boils near the RVP test range.
Sulfur drivers are straightforward: high-sulfur components push sulfur up. But the nuance is that sulfur can be uneven across cuts. If you blend a small amount of a high-sulfur side stream into a finished pool, the final sulfur may still land above spec even when the average feed looks acceptable.
Aromatics drivers include reformate-rich streams and certain cracked components. If you chase octane by adding aromatics, you may overshoot aromatics limits even if RVP remains acceptable.
Distillation curve drivers are about cut points and the distribution of boiling ranges. If you add a heavier component to improve stability or reduce RVP, you might shift the 90% point upward and fail distillation limits.
Integrated Mind Map for Spec Control
Mind Map: Meeting Fuel Specs
Practical Example: One Recipe, Four Constraints
Assume you are preparing a gasoline pool with these contract limits: RVP maximum, sulfur maximum, aromatics maximum, and a distillation curve window. You have three blendstocks:
- Stream A: light naphtha, low sulfur, moderate aromatics
- Stream B: reformate-rich, low sulfur, high aromatics
- Stream C: heavier straight-run component, low aromatics, moderate sulfur
A common mistake is to start with aromatics and sulfur because they feel “composition-like,” then discover the distillation curve fails. Here is a systematic approach.
- Lock sulfur first. Choose a starting ratio that keeps sulfur under the limit even with normal variability. If Stream C has higher sulfur than A, reduce C until the sulfur margin is comfortable.
- Check distillation points early. If the distillation window requires a certain light-end behavior, adjust the A-to-C ratio before adding B. Increasing C can lower RVP but can also push the 90% point too high.
- Add B for octane while monitoring aromatics. Raise B only until aromatics reaches its ceiling. If aromatics is tight, you may need to compensate with A for volatility rather than adding more B.
- Finalize RVP with light-end tuning. If RVP is high, reduce A slightly and increase C or adjust the light-end fraction. If RVP is low, the opposite adjustment is needed, but watch the distillation curve so you don’t break the 10% or 50% points.
This sequence works because it respects how constraints interact: sulfur and distillation often set the “shape” of the blend, while aromatics and RVP fine-tune the composition.
Distillation Curve Interpretation That Prevents Surprises
When you compare a measured distillation curve to the contract window, focus on the points that are most sensitive to your blend changes.
- If IBP or 10% is out of range, your light-end content is off. That usually means the RVP will also be affected.
- If 50% shifts, the mid-range volatility distribution changed, often due to swapping between similar-boiling components.
- If 90% or FBP is out of range, the heavy tail is wrong. This can happen when you “fix” RVP by adding too much heavier material.
A good blending practice is to treat distillation points as linked outcomes of component cut ranges, not isolated targets.
Verification and Release Discipline
Before release, ensure sampling and testing reflect the actual blend. Use a composite sample strategy that matches how the batch was produced, and reconcile lab results with expected trends from blend calculations. If a result is inconsistent, investigate sampling integrity and mixing effectiveness before changing the recipe. That saves time and prevents chasing the wrong problem.
Finally, document the decision logic: which spec was the limiting constraint, what adjustment was made, and how the next test should confirm the correction. When the process is systematic, meeting RVP, sulfur, aromatics, and distillation curves becomes less like juggling and more like controlled engineering.
10.4 Laboratory Testing and Data Interpretation: ASTM Methods and Common Pitfalls
Laboratory testing turns refinery measurements into decisions: blend adjustments, unit operating changes, and release approvals. ASTM methods provide the shared language, but the method number alone does not guarantee usable data. The quality comes from sample handling, instrument condition, operator technique, and correct interpretation of results.
Foundations of ASTM Testing
Start with what an ASTM method actually specifies. Most methods define the sample type, preparation steps, test temperature or pressure, apparatus, calculation approach, and acceptance criteria. If any of those inputs drift, the result may still look precise while becoming wrong.
A practical way to stay grounded is to treat each test as a chain. For example, a distillation test depends on representative sampling, correct vapor-liquid equilibrium behavior in the apparatus, and consistent thermometer calibration. If sampling is biased toward lighter material, the curve shifts even if the apparatus is perfect.
Sampling and Chain of Custody
Sampling is where many “mystery” data problems begin. Use a sampling plan that matches the product’s variability. A tank with stratification needs different sampling than a well-mixed line. For volatile products, minimize time between sampling and test start, and keep containers sealed to reduce evaporation.
Record chain-of-custody details: tank number, draw time, sample volume, container type, storage temperature, and any delays. When results later conflict with expectations, these notes often explain the discrepancy faster than re-running the test.
Interpreting Results with Method Context
ASTM results are not just numbers; they come with method-specific meaning. Consider sulfur determination. A method may report total sulfur, but the underlying chemistry and detection limits differ by technique. If the product is near the method’s lower limit, small contamination or baseline drift can dominate.
For distillation and volatility tests, interpret the curve or property in relation to the product’s intended use. A small shift in initial boiling point can change blending behavior because it affects downstream vaporization and combustion characteristics.
Mind Map: ASTM Data Workflow
Common Pitfalls and How to Spot Them
1. Evaporation and sample aging. Volatile components can escape between sampling and testing. A quick check is to compare density or vapor pressure trends with historical patterns for the same material. If volatility-related properties move together in a way that matches expected loss, the sample handling likely caused the shift.
2. Calibration drift and unverified instrument state. Instruments can drift without obvious alarms. Many labs run standards or control samples each day. If control results are off, treat product results as suspect until the instrument state is corrected.
3. Unit mistakes and correction factors. ASTM methods often require temperature corrections, density corrections, or conversion between observed and reported quantities. A classic failure mode is using the right number with the wrong correction factor. When a result is consistently high or low by a plausible conversion amount, suspect the calculation path.
4. Endpoint misreading and operator technique. Some tests rely on visual or semi-visual endpoints. Even when the method is followed, subtle differences in lighting, timing, or observation can change the endpoint. Repeatability checks help: if duplicates spread more than expected, pause and review the endpoint procedure.
5. Contamination from glassware, solvents, or residues. Residual detergent, solvent, or prior sample components can bias trace measurements. A practical safeguard is to standardize cleaning steps and verify with blanks. If blanks show unexpected signal, stop and fix the cleaning or preparation.
Example: From Raw Data to a Blend Decision
Suppose a diesel blend target requires sulfur below a contract limit and cetane index above a minimum. The lab runs sulfur analysis and reports a value slightly above spec. Before rejecting the batch, check whether the method’s detection limit is close to the measured value and whether the control sample passed. If the control is within limits but the sample is near the detection threshold, re-run with careful preparation and confirm no contamination.
Next, interpret cetane-related results in context. If cetane index is low while density and distillation cuts indicate a heavier, higher-boiling shift, the blend likely needs component adjustment rather than a “mystery” chemical issue. The best interpretation connects the test result to the physical behavior implied by other measurements.
Advanced Details Without the Headaches
When results are inconsistent, avoid the reflex to keep re-testing blindly. Instead, classify the problem: sampling, instrument, method conditions, or calculation. Then use targeted checks. If duplicates disagree, focus on execution quality. If duplicates agree but the result contradicts other properties, focus on sampling representativeness or calculation correctness.
Finally, document the interpretation decision. A short note stating what was checked and why the result is accepted or rejected prevents future confusion and makes the next batch easier to manage.
10.5 Practical Example: Formulating a Diesel Blend to Meet Cetane and Sulfur Requirements
You have two diesel-range components and one hydrotreated blendstock. The goal is a finished diesel that meets a cetane index target and a maximum sulfur limit, while staying within volatility and density constraints so the fuel behaves predictably in engines.
Step 1: Translate Specs Into Blend Constraints
Start with the two hard constraints:
- Sulfur: finished fuel sulfur must be at or below the contract limit.
- Cetane: finished fuel cetane index must be at or above the target. Then add the “don’t break the engine” constraints:
- Density or API gravity range for pump calibration.
- Distillation cut behavior so the fuel doesn’t run too light or too heavy.
A practical habit: treat every constraint as a measurable variable you can compute from component properties, not as a wish.
Step 2: Gather Component Properties
Assume you have these blend components, all already within their own handling specs:
- Component A: hydrotreated gas oil, low sulfur, moderate cetane.
- Component B: straight-run diesel, higher sulfur, higher cetane.
- Component C: catalytic diesel blendstock, very low sulfur, lower cetane.
Example property set (mass basis):
- Sulfur (wt%): A = 0.010, B = 0.350, C = 0.002
- Cetane index: A = 48, B = 55, C = 42
- Density at 15 C: A = 0.845, B = 0.860, C = 0.830
Finished targets:
- Sulfur ≤ 0.050 wt%
- Cetane index ≥ 48
- Density between 0.842 and 0.850
Step 3: Build the Blend Math
Sulfur is approximately additive on a mass basis:
- S_finish = xA·SA + xB·SB + xC·SC Cetane index is not perfectly additive in reality, but for formulation work it is commonly treated as a linear approximation for screening. You then confirm with lab testing.
- CI_finish ≈ xA·CIA + xB·CIB + xC·CIC Density is also treated as additive on mass basis for first-pass screening.
- ρ_finish ≈ xA·ρA + xB·ρB + xC·ρC And the fractions must sum to 1:
- xA + xB + xC = 1
Step 4: Solve with a Systematic Search
A quick, reliable approach is to pick a sulfur-feasible region first, then check cetane and density.
Try a starting point that limits sulfur by keeping B low:
- Let xB = 0.10 Then sulfur becomes:
- S_finish = 0.10·0.350 + xA·0.010 + xC·0.002 Since xA + xC = 0.90:
- S_finish = 0.035 + 0.010xA + 0.002(0.90 − xA)
- S_finish = 0.035 + 0.010xA + 0.0018 − 0.002xA
- S_finish = 0.0368 + 0.008xA To meet 0.050 wt%:
- 0.0368 + 0.008xA ≤ 0.050 → xA ≤ 1.6625 That constraint is automatically satisfied because xA cannot exceed 0.90. So sulfur is fine at xB = 0.10.
Now check cetane:
- CI_finish = 0.10·55 + xA·48 + (0.90 − xA)·42
- CI_finish = 5.5 + 48xA + 37.8 − 42xA
- CI_finish = 43.3 + 6xA To meet CI ≥ 48:
- 43.3 + 6xA ≥ 48 → xA ≥ 0.7833 So xA must be at least 0.7833, meaning xC = 0.90 − xA ≤ 0.1167.
Finally check density:
- ρ_finish = 0.10·0.860 + xA·0.845 + (0.90 − xA)·0.830
- ρ_finish = 0.086 + 0.845xA + 0.747 − 0.830xA
- ρ_finish = 0.833 + 0.015xA To stay within 0.842 to 0.850:
- 0.842 ≤ 0.833 + 0.015xA ≤ 0.850
- 0.009 ≤ 0.015xA ≤ 0.017
- 0.60 ≤ xA ≤ 1.133 The density constraint is satisfied automatically if xA is between 0.7833 and 0.90.
A feasible blend is:
- xA = 0.80, xB = 0.10, xC = 0.10 Check quickly:
- Sulfur = 0.10·0.350 + 0.80·0.010 + 0.10·0.002 = 0.035 + 0.008 + 0.0002 = 0.0432 wt%
- Cetane index ≈ 0.10·55 + 0.80·48 + 0.10·42 = 5.5 + 38.4 + 4.2 = 48.1
- Density = 0.10·0.860 + 0.80·0.845 + 0.10·0.830 = 0.086 + 0.676 + 0.083 = 0.845
All targets are met on screening math, so the next step is lab confirmation and adjustment if needed.
Step 5: Operational Best Practices That Prevent “Math Meets Reality” Failures
- Use mass-basis fractions consistently across sulfur and density calculations; volume-basis shortcuts can drift.
- Keep blend components within their own stability and contamination limits before mixing; sulfur and cetane won’t fix a dirty fuel.
- Verify that the final blend’s distillation range matches the engine-relevant cut behavior, not just cetane and sulfur.
- When you adjust for cetane in practice, do it by component fraction changes that do not push sulfur back over the limit.
Mind Map: Diesel Blend Formulation Logic
Example: One-Line Adjustment When Cetane Falls Short
If lab testing shows cetane index is 0.8 points low, increase the fraction of the higher-cetane component B slightly while compensating with a sulfur-lower component C to keep sulfur under the limit. Then re-check density so the pump calibration doesn’t get surprised.
11. Petrochemical Feedstocks and Co-Processing Pathways
11.1 Identifying Chemical-Grade Streams: Naphtha, Reformate, and Light Olefins
Chemical-grade streams are refinery cuts intended for downstream chemical processes, where small impurities can cause big headaches. The goal is to identify which streams are suitable for chemical use and which need additional treating, fractionation, or blending first. Think of it as matching a stream’s “impurity profile” to the tolerance of the receiving unit.
Foundational Concepts: What “Chemical-Grade” Really Means
Chemical specifications are usually stricter than fuel specs because chemical reactions are sensitive to catalyst poisons, polymerization inhibitors, and trace contaminants. For naphtha and reformate, the key themes are (1) hydrocarbon composition, (2) sulfur and nitrogen levels, (3) metals and halides, and (4) stability and color. For light olefins, the themes shift to (1) olefin purity and isomer balance, (2) removal of diolefins and acetylene-type species, and (3) control of sulfur compounds that can poison catalysts.
A practical way to classify streams is by asking: “What is the receiving process, and what does it hate?” For example, a catalytic reforming unit may tolerate certain impurities for fuel blending, but a petrochemical reactor may not tolerate the same levels of sulfur, nitrogen, or reactive contaminants.
Naphtha: The Base Feed That Still Needs Sorting
Naphtha is a broad term, so chemical-grade naphtha is not just “a boiling range.” It is a boiling range plus a composition and impurity package. Typical chemical uses include steam cracking and aromatics production. For steam cracking, the feed needs to be consistent in volatility and low in catalyst poisons.
Best-practice identification steps:
- Confirm the cut range using distillation data so the receiving unit’s furnace and fractionation sections can operate as designed.
- Check sulfur and nitrogen because these can poison cracking catalysts and downstream hydrogenation catalysts.
- Screen for metals and halides since they can accelerate corrosion and foul catalysts.
- Assess stability by looking for gums or reactive species that can form deposits during heating.
Easy example: If two naphtha streams have similar boiling ranges but one has higher sulfur, the “fuel-like” stream might still blend into gasoline, yet it may force extra treating before steam cracking. The chemical-grade label should follow the treating requirement, not just the boiling range.
Reformate: Aromatics-Rich with Impurity Traps
Reformate is rich in aromatics and typically used as a feed for aromatics extraction or as a component in chemical-grade blendstocks. Chemical-grade reformate identification focuses on aromatics content and impurity control.
Key checks:
- Aromatics content and composition because downstream separation performance depends on how much benzene, toluene, and xylenes are present.
- Sulfur and nitrogen because these can interfere with extraction solvents and poison catalysts in hydrogenation steps.
- Halides and metals because they can cause corrosion and catalyst deactivation.
- Color and stability since trace reactive compounds can affect separation and product quality.
Easy example: A reformate stream with slightly higher sulfur might still meet a fuel sulfur spec, but it can increase solvent losses or require more frequent filtration in aromatics extraction. Chemical-grade identification therefore includes “process impact,” not only lab numbers.
Light Olefins: Purity Is a Composition, Not a Vibe
Light olefins (commonly ethylene, propylene, and mixed C3/C4 streams) are used in polymerization and chemical synthesis. Here, “chemical-grade” is tightly tied to impurity reactivity.
For olefins, the most important impurity categories are:
- Diolefins and acetylenes because they can cause unwanted polymer formation, gum, or catalyst fouling.
- Sulfur compounds because they poison catalysts and can degrade product quality.
- Oxygenates and moisture because they can affect downstream catalyst performance and corrosion.
- Hydrogen and paraffin balance where relevant, since it influences separation efficiency and reactor behavior.
Best-practice identification steps:
- Use component analysis (not just total olefin) to confirm diolefin and acetylene levels.
- Verify drying and sweetening status so moisture and sulfur are controlled.
- Confirm fractionation performance by checking whether the stream meets the receiving unit’s separation assumptions.
Easy example: Two propylene streams may have the same “propylene wt%,” but the one with higher acetylene content can trigger faster catalyst deactivation in polymer-grade purification. Chemical-grade identification must therefore track the reactive impurities.
Systematic Screening Workflow
A reliable workflow prevents “spec surprises” later. Use this sequence:
- Define the receiving process and its known impurity sensitivities.
- Collect baseline data: distillation curve, sulfur, nitrogen, metals, halides, and stability indicators for naphtha/reformate; component breakdown plus reactive impurity targets for olefins.
- Compare to chemical tolerances and identify the limiting impurity.
- Decide the path: accept as-is, blend to reduce the limiting impurity, or route through additional treating and fractionation.
Mind Map: Chemical-Grade Stream Identification
Practical Example: Choosing Between Two Naphtha Candidates
Suppose you have Naphtha A and Naphtha B with similar boiling ranges. Lab results show Naphtha A has lower sulfur but slightly higher metals. The receiving unit is steam cracking followed by catalyst-sensitive hydrogenation. In this case, sulfur is likely the limiting impurity for catalyst poisoning, while metals may be manageable with filtration and guard beds. The chemical-grade decision should therefore favor Naphtha A if the downstream system can handle the metals level with planned controls.
The key takeaway is that chemical-grade identification is not a single spec sheet. It is a structured comparison between stream composition, impurity reactivity, and the receiving unit’s tolerance—then choosing the simplest path that prevents downstream trouble.
11.2 Separation and Purification for Chemical Use: Distillation and Fractionation Strategies
Chemical-grade streams rarely tolerate the “good enough” mindset used for fuel blending. Distillation and fractionation are the workhorses for turning refinery cuts into feedstocks with controlled composition, low contaminants, and predictable downstream behavior.
Foundations: What Separation Must Achieve
Start with three targets: (1) remove light ends that cause pressure and stability problems, (2) remove heavy ends that raise viscosity and foul reactors, and (3) control trace impurities that affect color, catalyst life, or polymerization performance. For example, a reformate-derived aromatic stream for chemical use often needs tight limits on sulfur and nitrogen, not just a target boiling range.
Distillation works because components distribute between vapor and liquid according to relative volatility. Fractionation is the practical implementation: multiple equilibrium stages, reflux control, and careful cut-point selection. A useful rule of thumb is that sharper separations require either more stages, higher reflux, or a system with favorable volatility differences.
Distillation Modes and When They Fit
Batch distillation is flexible for small quantities and unusual compositions, but continuous fractionation is the norm for steady refinery-to-chemical supply. Within continuous operation, the key design choices are column pressure level and reflux ratio.
Lower pressure reduces boiling temperatures, which helps protect thermally sensitive components. Higher pressure can improve separation for some systems but may increase the risk of side reactions for reactive feeds. The column’s pressure profile also affects overhead condensation duty and downstream storage conditions.
Column Internals and Stage Efficiency
Trays and packing both create contact between phases, but they behave differently. Trays provide discrete stages and are often easier to model with stage-to-stage assumptions. Packing can offer lower pressure drop and better performance at lower flow rates, but it requires attention to wetting, maldistribution, and flooding.
Stage efficiency matters because it converts ideal equilibrium separation into real performance. If efficiency is lower than expected, the column may still meet a broad boiling range while missing tight impurity targets. That’s why chemical specifications often drive tighter control than fuel specs.
Cut-Point Strategy: The Part That People Underestimate
A cut point is not just a temperature. It’s a decision about how much of each component reports to each product. In chemical service, the “wrong” component can be small in mass fraction yet large in impact.
Example: Suppose you need a naphtha fraction low in heavy aromatics for a downstream alkylation feed. If the cut point is too high, heavy aromatics slip into the product, raising color and increasing catalyst fouling rate. If the cut point is too low, you may lose valuable yield and force blending workarounds later.
Best practice is to define cut points using both temperature and composition targets, then verify with lab data from the actual product draw schedule. Sampling location matters too: a side draw can differ from the top or bottom composition even when the temperature profile looks similar.
Impurity Control: More Than Boiling Range
Chemical purification often targets specific contaminants:
- Sulfur and nitrogen compounds: affect odor, catalyst poisoning, and corrosion.
- Oxygenates and peroxides: can destabilize some processes.
- Halides and metals: can accelerate corrosion and contaminate catalysts.
Distillation can remove many impurities by volatility differences, but not all. Some impurities form azeotropes or track with the desired component. When that happens, distillation alone may not meet spec, and a polishing step such as adsorption or mild chemical treating may be required upstream of the column.
Practical Design Logic for Fractionation Trains
A common integrated approach is to use a primary fractionator to establish broad cuts, then polish with a second column or side-stream polishing.
- Primary column: separates into light, main, and heavy fractions based on boiling range.
- Polishing column: tightens composition around the chemical-grade window.
- Recycle and reflux management: reduces off-spec excursions by returning intermediate material to the right region of the column.
This staged strategy reduces the burden on a single column to do everything at once, which improves operability and sampling confidence.
Mind Map: Distillation and Fractionation for Chemical Use
Example: Turning a Broad Naphtha Cut into a Chemical-Grade Stream
Assume a refinery produces a naphtha cut intended for chemical use. The broad cut meets a boiling range but fails a sulfur limit.
- Pre-check feed variability: confirm that sulfur spikes correlate with upstream crude changes or blending ratios.
- Choose the separation target: decide whether sulfur compounds are more volatile than the bulk or whether they track with aromatics.
- Set a cut-point window: use temperature profile plus lab composition to define the draw region.
- Use reflux to tighten purity: increase reflux modestly to reduce impurity carryover without excessive energy cost.
- Validate with product sampling: compare overhead, side draw, and main product samples to ensure the draw schedule matches the spec intent.
If the sulfur compounds are close in volatility to the desired components, the column may meet boiling range but not sulfur. In that case, the best practice is to add an upstream polishing step before the fractionator rather than forcing the column to do impossible work.
Case Study: When Packing Beats Trays and When It Doesn’t
Consider a chemical fractionator handling a feed with moderate flow and a need to limit pressure drop to protect downstream equipment. Packing can be advantageous because it reduces pressure drop and can handle varying flow rates smoothly when properly designed.
However, if the feed contains components that cause heavy fouling or if liquid distribution is inconsistent, trays may outperform packing due to more robust stage behavior. The decision should be based on expected fouling tendency, liquid load range, and the ability to maintain stable hydraulics.
Summary of Best Practices
Define separation targets in terms of chemical specs, not just boiling range. Use column pressure and internals to match the feed’s volatility and sensitivity. Treat cut points as composition decisions supported by sampling discipline. Finally, recognize when distillation is a primary tool and when it needs help from upstream impurity control.
11.3 Olefin Production and Integration With Refinery Streams (Where Applicable)
Olefin production in a refinery context usually means turning refinery-derived cuts into light olefins such as ethylene and propylene, or producing higher olefins that can be cracked or upgraded later. The key idea is integration: you do not treat olefin units as isolated chemistry islands. You feed them with streams whose composition and contaminants are already managed by upstream refinery operations, and you route their products into the refinery’s existing separation, storage, and blending logic.
Foundational Building Blocks
Olefin units need three things to run smoothly: the right hydrocarbon range, acceptable contaminant levels, and a predictable vapor-liquid behavior for downstream separation.
-
Feed range: Ethylene and propylene production typically targets naphtha-range or gas-oil-range hydrocarbons depending on the process route. If the feed is too heavy, you increase coke formation and reduce conversion efficiency. If it is too light, you may lose yield to methane and other light gases.
-
Contaminants: Sulfur, nitrogen, and metals can poison catalysts or foul reactors. Chlorides can accelerate corrosion and interfere with downstream treating. Even when a unit is “tolerant,” the tolerance is not infinite; it is usually a budget you spend.
-
Separation behavior: Olefin products are rarely pure on day one. You must plan for fractionation that can separate ethylene/ethane, propylene/propane, and remove byproducts like diolefins, aromatics, and heavier saturates.
Process Routes and How They Connect to Refinery Streams
Most refinery-integrated olefin production falls into two practical categories.
A) Steam cracking of suitable refinery cuts
Steam cracking converts hydrocarbons into smaller molecules using high-temperature residence times. In an integrated refinery, the “suitable cut” is often a naphtha fraction that has already been stabilized and treated to reduce sulfur and metals. The integration work happens upstream: you choose a cut that balances conversion potential with manageable coke risk.
B) Catalytic conversion routes where applicable
Some refineries integrate catalytic pathways that convert heavier hydrocarbons into olefin-rich products. These routes still depend on upstream pretreatment because catalyst life is sensitive to sulfur, nitrogen, and metals. The refinery’s hydrotreating and fractionation steps become olefin unit enablers.
Integration Logic That Prevents Common Headaches
A good integration plan answers four questions for every candidate feed stream.
-
What is the feed’s carbon number distribution? If a stream contains a lot of heavy components, you expect more coke and more frequent decoking or regeneration cycles. If it is too light, you may see lower olefin yield and higher gas losses.
-
What is the contaminant profile? A stream with low sulfur but high metals can still cause rapid fouling. A stream with low metals but high nitrogen can create different deactivation patterns. Treating targets should match the olefin unit’s failure modes.
-
How will the product mixture be separated? Olefin units generate close-boiling pairs. Your fractionation design must handle the expected composition swings from feed variability. If upstream blending changes the feed, downstream separation must be able to track it.
-
Where do byproducts go? Cracking and catalytic conversion create fuel gas, aromatics-rich fractions, and heavier residues. Integration means deciding which byproducts are recycled, used as refinery fuel, sent to other units, or routed to storage.
Olefin Production and Integration Mind Map
Example: Integrating a Naphtha Cut Into an Olefin Unit
Suppose a refinery has two candidate naphtha fractions from atmospheric/vacuum distillation: one is rich in straight-chain components, the other contains more aromatics and heavier saturates. The first fraction typically supports higher conversion with less coke per unit throughput, but it may require tighter control of sulfur and metals because it can carry more reactive impurities from upstream blending. The second fraction can be easier to source consistently, yet it often increases coke formation and shifts the product distribution toward heavier byproducts.
A practical integration approach is to blend the two fractions into a target feed window that meets contaminant limits and keeps the carbon number distribution within a narrow band. Then you set downstream fractionation to handle the expected ethylene/ethane and propylene/propane composition range. If the refinery later changes crude slate and the naphtha assay shifts, the integration response is not “turn the olefin unit harder.” It is to adjust the cut selection and blending so the olefin unit sees the same feed behavior it was designed for.
Example: Contaminant Mismatch and Its Operational Symptoms
If a feed stream meets sulfur spec but has elevated metals, the olefin unit may show faster fouling in transfer lines and higher pressure drop across heat exchangers. Conversion may remain initially stable, but separation performance can degrade because heavier deposits increase residence time and alter vapor-liquid equilibrium. The integration lesson is straightforward: contaminant specs must align with the unit’s dominant failure mechanisms, not just with a single measured impurity.
In integrated refineries, olefin production works best when upstream fractionation and treating treat the olefin unit as a downstream customer with clear requirements. That mindset turns “feed variability” from a nuisance into a managed input with defined boundaries.
11.4 Managing Contaminants for Chemical Specifications: Metals, Sulfur, and Color
Chemical-grade refinery streams are judged by more than boiling range. Metals, sulfur species, and color-related impurities can determine whether a downstream process runs smoothly or spends its time cleaning itself. The trick is to manage contaminants as a system: where they enter, how they move, how they concentrate, and what each unit operation can realistically remove.
Foundational Contaminant Map
Metals in refinery streams typically come from crude (iron, nickel, vanadium) and from corrosion products in upstream equipment. Sulfur appears as hydrogen sulfide, mercaptans, thiophenes, and sulfones depending on where the stream sits in the process. Color is not a single chemical; it’s a proxy for a mix of aromaticity, conjugated species, and trace contaminants that absorb visible light.
A practical way to think is: metals are mostly “solid-ish” problems that ride on particulates or form deposits; sulfur is a “reactivity and catalyst poisoning” problem; color is a “quality and stability” problem that often correlates with other impurities.
Metals Control for Chemical Specifications
Metals cause catalyst deactivation, fouling, and filter plugging. The first best practice is to prevent metals from entering sensitive units by controlling upstream corrosion and solids carryover. If a stream is filtered before it reaches a catalyst bed, you reduce both particulate metals and the surface area that helps metals stick.
Next, manage where metals concentrate. Distillation tends to push metals into heavier fractions and residues because metals don’t volatilize. That means a “clean” light cut can still be contaminated if the column internals are fouled or if reflux drum carryover occurs.
Example: Suppose a naphtha cut shows elevated iron. Instead of assuming the naphtha itself is the source, check upstream desalter performance, crude heater fouling, and filter differential pressure. If the desalter is bypassing or underperforming, water droplets can transport corrosion products into the crude system, which then migrate into downstream cuts.
Sulfur Control for Chemical Specifications
Sulfur matters because many sulfur species poison catalysts and can form off-spec products in downstream reactions. The key is speciation: total sulfur alone can hide the difference between easily removed mercaptans and more stubborn thiophenic sulfur.
Hydrotreating is the main workhorse for sulfur removal, but it must be matched to the stream’s chemistry. If the feed contains nitrogen and metals, catalyst life drops unless pretreatment is adequate. Also, sulfur removal changes hydrogen consumption and can shift product distribution, so the operating target should be “meet chemical spec with stable unit performance,” not “maximize conversion at any cost.”
Example: A reformate-like stream intended for chemical use may meet total sulfur targets but still fail a catalyst activity requirement because sulfur is concentrated in the most reactive fractions. In that case, verify whether the treating severity and temperature profile are sufficient for the harder sulfur species, and confirm that downstream separation isn’t blending in a small high-sulfur side stream.
Color Control for Chemical Specifications
Color is often treated as a lab number, but it’s driven by chemistry and contamination. Trace metals can catalyze oxidation reactions that darken product over time. Sulfur compounds can also contribute to color through reaction pathways during storage or processing.
The best practice is to control oxygen exposure and residual reactive species. If a stream is prone to oxidation, minimizing air ingress and using appropriate storage handling reduces color drift. Filtration and polishing can remove suspended solids that scatter light and inflate color measurements.
Example: A light aromatic stream meets sulfur and metals specs but shows high color after a week in storage. That pattern suggests slow oxidation or contamination from storage equipment. Check for oxygen ingress, verify tank cleaning and water content control, and confirm that any corrosion inhibitors or residual cleaning agents are not interacting with the stream.
Integrated Control Strategy
Use a “source-to-spec” approach: identify likely contaminant sources, track them through unit operations, and apply the right control method at the right point.
Practical Example Workflow
- Start with the chemical spec failure mode: metals too high, sulfur too high, or color too high.
- Trace upstream unit operations that influence that contaminant class: solids control for metals, treating and separation for sulfur, and storage/oxidation handling for color.
- Confirm whether the contaminant is truly in the stream or being introduced via blending, carryover, or tank conditions.
- Apply the smallest effective correction: improve filtration if differential pressure indicates solids; adjust treating profile if sulfur spec fails despite adequate total sulfur; reduce oxygen exposure and verify tank cleanliness if color drifts over time.
This approach keeps the refinery from chasing symptoms. It also makes lab results actionable, because each corrective action is tied to a specific transport mechanism and a specific unit boundary.
11.5 Practical Example: Producing a Clean Aromatics-Rich Stream for Downstream Chemical Processing
A chemical unit typically wants an aromatics-rich feed that is low in sulfur, nitrogen, oxygenates, and heavy metals. Refinery streams that look “aromatics-rich” on paper can still fail downstream because trace contaminants drive catalyst poisoning, color formation, and off-spec product properties. The goal here is to turn a refinery aromatics source into a stable, clean, specification-ready stream using a systematic control strategy.
Step 1: Choose the Aromatics Source and Define the Target Spec
Start with a realistic feed candidate. Common aromatics-rich sources include reformate, light reformate, or a separated aromatics fraction from reforming/BTX recovery. Define targets in terms of what the downstream unit actually measures: sulfur (ppm), nitrogen (ppm), total metals (ppb–ppm), water (ppm), and boiling range cut points. Also define “what not to bring”: oxygenates that can increase gum formation, and heavy ends that can foul heat exchangers.
Example target set for a downstream aromatics conversion unit:
- Sulfur: < 1–5 ppmw
- Nitrogen: < 1 ppmw
- Metals: < 0.5 ppmw (as a practical limit)
- Water: < 50 ppmw
- Boiling range: tight enough to exclude heavy residue and light gases
Step 2: Map Contaminant Pathways Back to Upstream Units
Aromatics streams inherit contaminants from upstream processing:
- Sulfur and nitrogen often come from crude-derived heteroatoms that survive reforming.
- Metals come from corrosion products and catalyst fines that migrate with vapor/liquid carryover.
- Water and oxygenates come from incomplete dehydration and from poor separation of polar components.
A practical best practice is to build a “contaminant ledger” for the stream: list each contaminant, its likely origin unit, and the control lever available (treating, separation, filtration, or polishing). This prevents the common mistake of only treating the final stream while ignoring the source of the problem.
Step 3: Use a Train of Separation and Polishing, Not One Big Fix
A clean aromatics stream is usually achieved by combining fractionation with targeted treating.
3A. Fractionation for Boiling Range and Heavy-End Removal
Use distillation to remove heavy ends and light ends before treating. Heavy ends increase coking risk in downstream reactors and foul exchangers. Light ends can raise vapor pressure and cause handling issues.
Concrete example: If the aromatics unit rejects anything above the C9–C10 region, set a cut so that the top product removes lighter components and the bottoms remove heavy residue. Then verify with a simulated distillation profile, not just a single TBP point.
3B. Guard Bed for Metals and Particulates
Before chemical-grade treating, install filtration or a guard bed to capture catalyst fines and corrosion particles. This is especially important when the upstream unit has frequent maintenance or when differential pressure trends show carryover.
Example practice: Monitor guard bed differential pressure. If it rises faster than expected, inspect upstream demister performance and check for entrainment during column upsets.
3C. Polishing Hydroprocessing for Sulfur and Nitrogen
Even after reforming, sulfur and nitrogen can remain. A mild hydrotreating step can reduce these to the required levels while keeping aromatics largely intact.
Example operating logic:
- Keep severity low enough to avoid excessive hydrogenation of aromatics.
- Use hydrogen purity and recycle management to prevent oxygen ingress.
- Ensure feed is well-dehydrated to protect catalyst and reduce side reactions.
3D. Dehydration and Water Control
Water can come from upstream condensation, desalting carryover, or incomplete separation. Dehydration prevents catalyst deactivation and reduces downstream color issues.
Example practice: Use a dehydration step (commonly via adsorption or controlled hydroprocessing conditions) and verify with a water-in-oil measurement method appropriate for the concentration range.
Step 4: Instrumentation and Sampling That Actually Prove “Clean”
Downstream units care about trends, not just one-off lab results. Use a sampling plan that matches the process reality:
- Sample after each major barrier: after fractionation, after guard bed, after polishing treating, and after final dehydration.
- Track key indicators: sulfur, nitrogen, metals proxy (dP or particle counts), water, and boiling range.
A simple acceptance rule: do not release the stream unless it meets both composition and stability indicators (boiling range within limits and no abnormal rise in gums/solids during hold time).
Mind Map: Clean Aromatics Stream Production
Step 5: Integrated Example Workflow with a Release Check
Assume you start with a reformate cut intended for downstream aromatics conversion.
- Distill to remove heavy ends and reduce light gases.
- Pass through a guard bed to remove fines.
- Hydrotreat mildly to reduce sulfur and nitrogen.
- Dehydrate to protect downstream catalyst and reduce color-forming tendencies.
- Confirm boiling range and contaminant levels, then release.
Release check example:
- If sulfur is high but boiling range is correct, the issue is likely treating effectiveness or hydrogen quality.
- If metals are high, the guard bed or upstream carryover is the likely cause.
- If water is high, dehydration performance or condensation control is the likely cause.
This approach keeps each barrier focused: separation handles the “where it boils,” guard beds handle “what particles ride along,” polishing handles “what heteroatoms remain,” and dehydration handles “what water sneaks in.”
12. Process Safety, Reliability, and Practical Troubleshooting
12.1 Hazard Identification in Refining: Flammability, Toxicity, and Pressure Hazards
Hazard identification in a refinery starts with a simple question: what can go wrong, how could it happen, and what would the consequences be if it did? The “what” is usually a release of energy or material—fuel, solvent, toxic gas, steam, or pressure. The “how” is the failure path: loss of containment, ignition source, oxygen availability, or overpressure. The “consequences” depend on the inventory, the release rate, and the people and equipment exposed.
Foundational Concepts That Make Hazards Identifiable
A refinery contains three recurring hazard families.
-
Flammability: hydrocarbons and hydrogen can form ignitable mixtures with air. The key variables are flash point, autoignition temperature, vapor concentration, and ignition control.
-
Toxicity: many refinery hazards are not “poison gas” in the movie sense; they are corrosive or harmful at relatively low concentrations. Typical examples include H2S, light hydrocarbons with asphyxiating effects, and solvent vapors.
-
Pressure: pressure hazards come from blocked-in thermal expansion, failed pressure control, or runaway reactions. The key variables are maximum credible pressure, relief system capacity, and the integrity of pressure boundaries.
A practical best practice is to identify hazards at the equipment level first (tanks, pumps, compressors, columns, reactors, heat exchangers, piping), then map them to credible release scenarios. This avoids the common mistake of listing chemicals without connecting them to release mechanisms.
Flammability Hazards and How to Spot Them
Flammability hazard identification focuses on where flammable vapors can accumulate and where ignition sources can exist.
- Where vapors accumulate: pump seals, compressor suction/discharge areas, tank ullage spaces, low points in piping, and instrument impulse lines.
- Where ignition sources hide: hot surfaces, electrical equipment not rated for the area, static discharge during transfers, and mechanical sparks from rotating equipment.
A simple example: during crude or product transfer, a small leak at a hose connection can generate a vapor cloud. If the area is not classified correctly or if bonding/grounding is missing, static discharge can provide the ignition source. The hazard identification step is to confirm both the release point and the ignition control measures.
Toxicity Hazards and How to Spot Them
Toxicity hazards require attention to both the substance and the exposure pathway.
- Substance: H2S is the classic example because it is both toxic and can be present in sour gas streams. Ammonia and light mercaptans can also appear depending on unit configuration.
- Exposure pathway: inhalation is dominant for gases and vapors, while skin contact can matter for corrosive liquids.
A concrete example: a sour water stripper off-gas line can carry H2S. If a maintenance activity opens a flange without verifying gas composition and without proper ventilation and gas detection, workers may be exposed during the initial release. Hazard identification should therefore include “maintenance mode” scenarios, not only normal operation.
Pressure Hazards and How to Spot Them
Pressure hazards are identified by asking: what is the maximum pressure the system can reach, and what prevents it from exceeding safe limits?
- Overpressure sources: blocked valves, failed control valves, fire exposure to tanks, and thermal expansion in closed lines.
- Protection layers: pressure relief valves, rupture disks, vent systems, and proper set points.
Example: a pump discharge line with an isolation valve can become a “closed-in” system if flow stops while the line remains heated. Thermal expansion raises pressure until the relief device acts. Hazard identification should confirm that the relief path is not blocked, that the discharge is routed to a safe system, and that the relief device capacity matches the credible heat input.
Mind Map: Hazard Identification Logic
Integrated Example: From Equipment to Scenario
Consider a pump handling a sour hydrocarbon stream.
-
Flammability check: the pump seal area can release hydrocarbon vapor. Hazard identification confirms whether the area is classified and whether bonding/grounding is in place during any transfer operations.
-
Toxicity check: if the stream contains H2S, the same seal leak can create a toxic exposure risk. The hazard identification step includes verifying gas detection coverage near the seal and ensuring ventilation is adequate during normal and maintenance conditions.
-
Pressure check: if discharge flow is blocked while the line is heated, thermal expansion can overpressure the discharge piping. Hazard identification confirms the relief path is open, the relief device is sized, and the discharge is routed to a safe system.
When these checks are performed as one integrated scenario, the resulting action list is clearer: it may include seal maintenance intervals, detection placement, area classification verification, and relief system operability checks. That is the point of systematic hazard identification: it connects the “can happen” to the “what we will do about it,” without relying on guesswork.
12.2 Operating Discipline: Startups, Shutdowns, and Upsets Without Spec Violations
Operating discipline is the habit of making the next move match the spec you’re trying to protect. In a refinery, “spec” is not one number; it’s a set of constraints across composition, stability, emissions, and safety limits. The goal during startups, shutdowns, and upsets is to keep the unit in a controllable region long enough for downstream blending and compliance systems to stay within bounds.
Foundations That Prevent Spec Drift
Start by separating three things that often get mixed together:
- Process stability: pressure, temperature, and flow staying within control limits.
- Product quality stability: properties staying within target ranges.
- System cleanliness: avoiding carryover of contaminants like water, catalyst fines, or sour components.
A spec violation usually comes from one of four mechanisms: wrong feed, wrong operating mode, poor separation during transients, or contamination introduced during handling. Discipline means you plan for these mechanisms before you need them.
Startups Without Spec Violations
A startup is a controlled transition from “no product” to “product that meets spec.” The first discipline is sequence: heat-up and circulation steps must follow the unit’s design intent so that reactions and separations reach the right regime before product is declared.
Core practices
-
Define a “quality gate” before declaring product. For example, a hydrotreating unit may require stable reactor temperature profile and stable H2S removal before sending effluent to product tanks. The gate is not a feeling; it’s a checklist tied to measured variables.
-
Use conservative ramp rates. If you increase feed rate faster than the separation system can handle, you create transient carryover. Example: during distillation startup, if reflux and draw rates lag behind feed introduction, light components can smear into heavier cuts, pushing RVP or distillation endpoints out of range.
-
Manage hold-up and line switching. Lines that were previously in service can contain residual material that doesn’t match the new campaign. Example: when switching from a high-sulfur feed to a low-sulfur feed, the first material in the product line may still carry the old sulfur level. Discipline is to route initial flow to a segregated tank or to a controlled recycle until the line is “cleared.”
-
Keep sampling aligned with the transient. A single grab sample taken too early can miss the period when quality is worst. Example: for gasoline blending, sampling only at the end of stabilization can miss the early volatility spike caused by incomplete stabilization.
Shutdowns Without Spec Violations
Shutdown discipline is about preventing “last-minute surprises.” The unit is still producing material while you’re changing conditions, and that material can end up in the wrong place if routing isn’t planned.
Core practices
-
Plan product routing for the entire shutdown curve. Example: when stopping a hydrotreater, you may need to divert effluent to a slop or intermediate tank until reactor temperature and conversion fall to a predictable level.
-
Avoid thermal shocks that change separation behavior. Rapid cooling can alter viscosity and phase behavior, which can increase water carryover or change emulsion stability. Example: in gas oil handling, sudden temperature drops can increase the tendency for water to separate poorly, leading to downstream filter plugging.
-
Preserve catalyst and metallurgy where applicable. Even if the shutdown is short, oxygen ingress or uncontrolled cooling can create conditions that later cause off-spec performance. Discipline here is procedural: inerting, controlled cooldown, and correct venting.
-
Close the loop on “what’s in the system”. Before you declare the unit down, confirm what remains in drums, lines, and vessels so you don’t accidentally treat residual as if it were already safe to route.
Upsets Without Spec Violations
An upset is a deviation that threatens stability, quality, or both. The discipline is to treat upsets as a sequence: detect, contain, stabilize, then recover.
Core practices
-
Detect early with the right signals. Quality often changes after a process variable shifts. Example: in sulfur control, a rise in H2S in the off-gas can precede product sulfur drift. If you respond to the off-gas trend, you can divert before tanks accumulate off-spec material.
-
Contain by routing, not by hope. When a control loop saturates or a compressor trips, the immediate spec risk is misrouting. Example: if a fractionator loses reflux control, divert the affected cut to a rework or intermediate tank until separation returns.
-
Stabilize to a known operating mode. After containment, bring the unit back to a regime where control is possible. Example: after a feed switch during an upset, return to the established feed conditioning steps before resuming normal product routing.
-
Use “hold and sample” rules. If you can’t confirm quality quickly, hold product in segregation. Example: for jet fuel, if flash point or freezing point indicators are uncertain during an upset, keep the material segregated until lab results confirm compliance.
Mind Map: Operating Discipline During Transients
Example: A Practical Startup Discipline Flow
A reformer startup illustrates the logic. First, you establish hydrogen circulation and confirm temperatures are within the expected profile. Next, you keep product routing in a controlled path until octane-related indicators stabilize and separation systems are behaving normally. Only then do you switch to the normal product tank. If the unit is still warming when you switch, the first material can be compositionally different, and blending can’t fix a bad cut without creating another problem.
Example: Upset Containment That Saves a Batch
During a hydrotreating upset, a compressor trip reduces hydrogen partial pressure. Reactor conversion drops, and sulfur removal slows. The discipline response is to divert effluent to a segregated tank as soon as the leading indicators show the conversion trend is moving. After hydrogen pressure and temperatures return to the controlled regime, you resume normal routing. This prevents a full batch from being “technically produced” but practically unusable.
Practical Checklist Mindset
Treat every transient as a short project with three deliverables: stable operation, controlled routing, and verified quality timing. If any deliverable is missing, segregation is the default move, not the exception.
12.3 Instrumentation and Control: Key Loops, Interlocks, and Alarm Management
Instrumentation and control in a refinery are less about fancy logic and more about making sure the right variable is held in the right range, at the right time, by the right layer of protection. A good mental model is layered control: continuous control loops manage normal operation, interlocks prevent specific unsafe states, and alarms help humans notice when the layers are drifting out of alignment.
Key Control Loops and Their Roles
A control loop has four practical parts: measurement, signal conditioning, control logic, and final control element. For example, a pressure control loop on a distillation column top uses a pressure transmitter, a controller (often PID), and a control valve on reflux or overhead pressure relief routing. The loop’s job is to keep pressure stable so condensation and vapor-liquid balance stay predictable.
Common loop types map cleanly to refinery needs:
- Temperature control: stabilizes reaction severity or separation efficiency. A furnace outlet temperature loop typically manipulates fuel or firing rate.
- Level control: prevents pump cavitation and avoids flooding or dry running. A reflux drum level loop manipulates reflux pump discharge or control valve position.
- Flow control: maintains feed rates to protect catalyst beds and column hydraulics. A feed flow loop often uses a control valve with a flow transmitter.
- Ratio control: keeps two variables aligned, such as hydrogen-to-oil ratio in hydrotreating. Ratio control reduces operator workload and helps keep catalyst conditions consistent.
Best practice is to match controller action to process direction. If increasing valve opening increases pressure, the controller direction must be set correctly; otherwise the loop will fight itself and oscillate. Another practical habit is to verify sensor range and units before tuning. A transmitter scaled in bar but interpreted as psig can create “perfectly stable” control that is perfectly wrong.
Interlocks and Safety Instrumented Functions
Interlocks are not “extra alarms.” They are designed to take the process to a safer state when defined conditions occur. A typical example is a compressor trip interlock tied to low suction pressure and high discharge temperature. When the interlock trips, the system should move to a predefined safe configuration, such as closing recycle valves, stopping the compressor, and preventing further heat input.
Interlocks are usually implemented as safety instrumented functions with defined logic, voting, and proof testing. Two common design patterns are:
- Permissive interlocks: allow a start only if prerequisites are met, such as pump running confirmation before opening a valve that would otherwise cause dry operation.
- Trip interlocks: force shutdown or isolation when a dangerous threshold is exceeded, such as high-high level in a drum.
A key operational detail is bypass management. Bypasses should be time-limited, documented, and reviewed. If a bypass is left in place during maintenance, the alarm may still sound, but the protection layer will not respond.
Alarm Management That People Can Use
Alarms are for action, not for noise. A refinery alarm system should be organized so that each alarm has a clear cause, a clear consequence, and a clear operator response. If an alarm fires frequently without requiring action, it becomes background radiation.
A practical alarm workflow looks like this:
- Detect: a measured variable crosses a threshold.
- Classify: determine whether it is advisory, warning, or trip-level.
- Diagnose: check related variables to identify the likely root cause.
- Respond: adjust the process within safe limits or request a controlled shutdown.
To keep diagnosis fast, alarms should be grouped by equipment and function. For instance, a “high column pressure” alarm should be accompanied by related indicators such as overhead temperature, reflux flow, and relief valve position. When those are visible, the operator can distinguish between a blocked condenser and a downstream restriction.
Mind Map: Loops, Interlocks, and Alarms
Example: Column Pressure Control with Protection Layers
Consider a column overhead pressure control scenario. The continuous loop uses a pressure transmitter and a valve that modulates reflux or overhead routing to maintain target pressure. If the condenser cooling fails, the pressure may rise. The pressure controller will try to correct by changing valve position, but it may reach valve travel limits.
At that point, alarms should guide the operator: a “high overhead pressure” warning prompts checking condenser outlet temperature and cooling water flow. If pressure continues to rise, a high-high trip interlock can isolate feed and open an appropriate relief path. The important detail is that the interlock threshold is not just “a higher alarm.” It is tied to a safety objective and should be set with consideration for relief capacity, sensor reliability, and process dynamics.
Example: Hydrogen Ratio Control with Interlock Boundaries
In hydrotreating, hydrogen-to-oil ratio control helps maintain catalyst performance. The ratio controller adjusts hydrogen flow based on measured oil feed flow and hydrogen flow. If an upstream valve fails or a flow transmitter becomes unreliable, the ratio loop may behave oddly. Alarms should flag instrument inconsistency, such as a deviation between redundant measurements or a stuck valve indication.
Interlocks then define what cannot be allowed. For example, a low-hydrogen condition may trigger a controlled reduction of feed or a trip, depending on the unit’s safety basis. The operator response is supported by alarm context: hydrogen partial pressure, reactor inlet temperature, and feed flow should be visible so the response is not guesswork.
Practical Checklist for Good Loop and Alarm Design
- Confirm sensor scaling, units, and range before tuning.
- Ensure controller direction matches process gain.
- Use ratio control where alignment matters, not where it merely looks neat.
- Treat interlocks as safety functions with strict bypass discipline.
- Make alarms actionable by linking them to equipment, consequence, and response.
- Group alarms so diagnosis is possible in one screen, not five.
12.4 Common Failure Modes: Fouling, Catalyst Deactivation, Leaks, and Corrosion
Refinery units fail in patterns, not surprises. Most “mystery” problems trace back to a few failure modes that share the same root logic: something accumulates, something poisons a surface, something escapes containment, or something attacks metal. The best troubleshooting starts by separating these categories, then confirming with measurements rather than guesses.
Fouling
Fouling is the unwanted buildup of solids, heavy organics, or salts on heat-transfer surfaces, internals, and lines. It shows up as rising pressure drop, decreasing heat duty, higher temperatures for the same duty, or unstable product quality.
Common fouling sources include:
- Salts and solids from crude handling that slip through desalter performance.
- Asphaltenes and heavy aromatics that precipitate when temperature or solvent quality changes.
- Polymer-forming species in hydrocarbon services when residence time and temperature align.
Best-practice controls are simple and measurable: keep feed filtration effective, manage temperature profiles to avoid crossing precipitation thresholds, and use planned decoking or wash cycles where applicable. For example, if a furnace outlet temperature rises while flow stays constant, check whether fouling is reducing heat transfer rather than assuming the feed has “changed.”
Catalyst Deactivation
Catalyst deactivation reduces activity or selectivity, often by blocking pores, depositing metals, or changing the catalyst’s chemical state. The key is that deactivation is not one thing; it is several mechanisms that can be distinguished by symptoms.
Main deactivation mechanisms:
- Coking from insufficient hydrogen availability or overly severe conditions.
- Metal deposition from upstream feeds containing nickel and vanadium.
- Poisoning from sulfur, nitrogen, or halides that bind active sites.
- Sintering or thermal damage from temperature excursions.
A practical way to troubleshoot is to track performance indicators against operating history. If conversion drops and differential pressure rises, pore blockage is likely. If conversion drops with little pressure change, active-site poisoning or loss of intrinsic activity may be the issue. For instance, a hydrotreating unit that suddenly produces higher sulfur in product may have a hydrogen distribution problem or catalyst poisoning rather than “bad crude.”
Leaks
Leaks are containment failures that range from pinholes to gasket blowouts. They are dangerous because they can combine with ignition sources and because small leaks often grow when they are ignored.
Leak pathways include:
- Flange and gasket failures from thermal cycling, improper torque, or chemical attack.
- Valve packing and seal failures from wear, loss of lubrication, or seal incompatibility.
- Corrosion under insulation that hides thinning metal until a leak appears.
- Threaded connection issues where makeup procedures were inconsistent.
Good practice is to treat leak detection as a system, not a hero activity. Use consistent inspection intervals, verify instrument calibration for gas detection, and correlate leak reports with service type. If you see repeated leaks on the same flange area, check alignment, gasket selection, and whether the service includes wetting or thermal cycling.
Corrosion
Corrosion is metal loss driven by chemical reactions, often accelerated by water, oxygen, chlorides, acids, or sour components. The trick is to identify the corrosion mechanism because mitigation depends on it.
Common corrosion mechanisms in refining include:
- General corrosion from acidic or wet conditions.
- Localized corrosion such as pitting from chlorides and stagnant water.
- Sulfidation in sour gas and high-temperature environments.
- Stress corrosion cracking where specific chemistries meet tensile stress.
Corrosion controls are built around three levers: remove corrosive species, control water and oxygen, and manage metallurgy and inhibitors. For example, if corrosion rates spike after a turnaround, review whether water control changed, whether insulation was reinstalled correctly, and whether inhibitor dosing was verified.
Mind Map: Failure Mode Logic
Example: Systematic Troubleshooting Flow
Start with what changed: performance, pressure, temperature, or containment. Then match the symptom to a failure mode.
- If heat duty drops and furnace outlet temperature rises, suspect fouling on heat-transfer surfaces.
- If conversion drops and differential pressure rises, suspect coking or pore blockage in a catalyst bed.
- If gas detection alarms increase near a specific flange or valve, suspect leaks and check gasket/packing history.
- If inspection finds wall thinning in wet or sour zones, suspect corrosion and confirm water control and chemistry.
A useful habit is to log the evidence in one place: operating parameters, lab results, inspection findings, and maintenance actions. When the evidence points to multiple modes, treat them as interacting rather than competing explanations. For example, fouling can reduce heat transfer and push a unit toward higher severity, which can then accelerate catalyst coking.
Mind Map: Evidence to Action
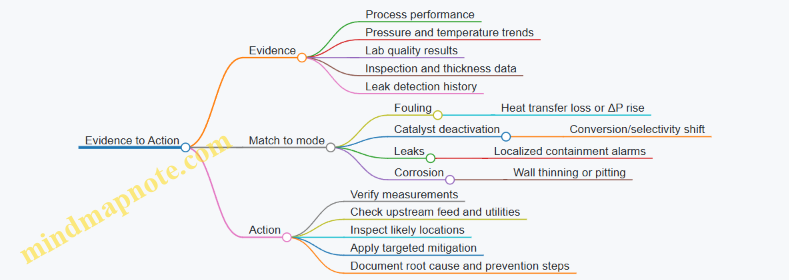
This section’s goal is not to memorize causes, but to practice the same reasoning loop every time: observe the pattern, connect it to the mechanism, then confirm with the next best measurement. That approach keeps troubleshooting grounded and prevents “fixing” the wrong layer of the problem.
12.5 Practical Example: Root-Cause Analysis for a Unit Producing Off-Spec Sulfur or Octane
A hydrotreating unit starts producing diesel with sulfur above contract limits, and the downstream reformer feed shows lower octane than expected. The goal is to find the specific mechanism, not just the symptom. A good root-cause workflow keeps you from chasing ghosts like “operator error” or “bad crude” when the real issue is narrower.
Step 1: Confirm the Off-Spec Pattern
First, verify the measurements and the timing. Compare lab results to online analyzers for sulfur (e.g., XRF/UV methods versus analyzer trends) and compare reformate octane to the reformer feed properties and hydrogen balance. If sulfur is high only on certain tanks or only during a particular shift, the cause is likely operational or feed-related. If both sulfur and octane drift together, the cause may be upstream contamination or a shared constraint like hydrogen availability.
Example evidence: Sulfur in diesel rises from 10 ppm to 35 ppm over two days. Reformate octane drops by 2–3 RON. Hydrogen consumption in the hydrotreating reactor decreases slightly, while reactor inlet temperature control shows more frequent valve cycling.
Step 2: Build a Cause Map from Process Physics
Off-spec sulfur usually comes from insufficient conversion of sulfur compounds, catalyst deactivation, or poor contact between gas and liquid. Off-spec octane often comes from feed composition changes, insufficient reforming severity, or altered separation performance.
Mind Map: Root-Cause Paths
Step 3: Check the “Fast” Variables First
Start with the variables that can change quickly and affect both units.
- Hydrogen availability: Review compressor discharge pressure, recycle rates, and any acid gas removal changes that could alter hydrogen purity. If hydrotreating hydrogen partial pressure drops, sulfur conversion falls.
- Temperature control: Look at furnace outlet temperatures, reactor inlet temperature, and control valve positions. Valve cycling often points to poor instrument tuning, fouling in valve trim, or a stuck actuator.
- Feed sulfur and boiling range: Confirm the actual feed assay entering the hydrotreating unit. A higher sulfur crude or a blending change can overwhelm catalyst capacity.
Example evidence: Hydrogen purity analyzer shows stable composition, but hydrotreating reactor inlet temperature is 8–12 °C lower than setpoint during valve cycling events. Diesel sulfur rises during those same windows.
Step 4: Isolate the Mechanism
Now connect the observed variable to the chemistry.
- If temperature is low, hydrogenation reactions slow, and sulfur compounds convert less effectively. The result is higher sulfur in the product.
- If hydrogen consumption drops, it can mean fewer reactions are occurring, consistent with low temperature or reduced catalyst activity.
- If reformer octane drops, it may be because reformer feed is now “heavier” or more contaminated (e.g., higher sulfur/nitrogen), or because the reformer is receiving a different naphtha cut due to upstream fractionation changes.
Example evidence: The reformer feed sulfur increased by 20 ppm, and the naphtha boiling range shifted slightly heavier by about 5 °C. That shift matches a fractionator cut point adjustment made during the same period as the hydrotreating temperature control issues.
Step 5: Validate with Targeted Checks
Use checks that confirm or rule out each branch without adding new uncertainty.
- Valve and control loop inspection: Verify actuator response time, position feedback accuracy, and any evidence of sticking. Compare historical valve travel versus temperature deviations.
- Catalyst activity indicators: Review pressure drop trends across the bed, differential pressure, and any signs of fouling. A rising pressure drop with stable temperature suggests plugging; stable pressure drop with low temperature suggests control rather than catalyst.
- Sampling strategy: Take synchronized samples at hydrotreating reactor inlet, intermediate, and diesel outlet during stable operation to confirm conversion behavior.
Example evidence: Differential pressure across the hydrotreating reactor is flat, suggesting no major plugging. The temperature deviation correlates with a control valve whose position feedback lags actual travel.
Step 6: Root Cause and Corrective Actions
Root cause: The hydrotreating temperature control valve position feedback drifted, causing the controller to under-command heater duty. This reduced reactor temperature, lowered sulfur conversion, and increased sulfur in the naphtha routed to the reformer. The reformer then produced lower octane, compounded by a small upstream cut shift.
Corrective actions:
- Calibrate and repair the temperature control valve position transmitter and verify tight control performance.
- Re-tune the control loop using stable data after calibration.
- Reconfirm fractionator cut settings and validate naphtha boiling range and sulfur before returning to normal blending.
- Re-run a short stabilization period with synchronized sampling to confirm sulfur and octane meet spec.
Step 7: Prevent Recurrence with Practical Discipline
Prevention is about making the same failure harder to repeat.
- Define alarm thresholds for “temperature setpoint minus measured” sustained duration.
- Require periodic verification of critical valve position feedback health using simple step tests.
- Maintain a change log linking fractionator cut adjustments to downstream product quality so correlations are visible, not guessed.
Example outcome: After valve calibration, reactor inlet temperature returns to setpoint, diesel sulfur drops back to 9–12 ppm, and reformate octane recovers to the expected range within the normal stabilization window.