Soap and Detergent Manufacturing Essentials
1. Scope, Product Families, and Manufacturing Overview
1.1 Cleaning Product Categories: Soaps, Syndets, Detergents, and Specialty Cleaners
Cleaning products are easier to control when you first sort them by chemistry and intended use. The four main categories below differ in how they form ions in water, how they behave with hard water, and what kind of soil they handle best.
Soaps
Soaps are salts of fatty acids. When you dissolve them in water, they produce fatty-acid ions that grab onto oily soil and help it disperse. The classic “soap scum” problem is also built into the chemistry: calcium and magnesium ions in hard water react with soap ions to form insoluble salts, which show up as residue on sinks, tubs, and glass.
Practical example: If you wash a greasy pan with a soap bar in hard water, you may notice more streaking on the first rinse and a film that needs extra wiping. In softer water, the same bar usually rinses cleaner because fewer calcium and magnesium ions are available to form residue.
Best-fit use cases: hand washing where mildness matters, body cleansing, and products where you want a straightforward fatty-acid based system.
Syndets
Syndets are “synthetic detergents” designed to mimic soap’s cleaning feel without soap’s hard-water residue. Instead of fatty-acid salts, they use surfactants that do not form insoluble scum with calcium and magnesium as readily.
Practical example: A syndet bar used in a shower with hard water typically lathers and rinses with less film. You still get good grease removal, but the surface tends to stay clearer after drying.
Best-fit use cases: personal cleansing, products targeting sensitive skin, and formulations where consistent performance in hard water is important.
Detergents
Detergents are surfactant-based cleaning agents used broadly for laundry, dishwashing, and general cleaning. They may be anionic, nonionic, cationic, or amphoteric, and they are often paired with builders, chelants, and other additives to manage water hardness and improve soil removal.
A key distinction from soaps is that detergents are engineered to stay effective in the presence of calcium and magnesium. Builders (like carbonates or zeolites) and chelants bind hardness ions or prevent them from interfering with surfactant performance.
Practical example: In laundry, detergents are formulated so that the same dose removes sweat and food soils across a range of water hardness. If you switch to a soap-based product without builders, you may need higher dosing and still see reduced cleaning.
Best-fit use cases: fabric cleaning, dishwashing, and industrial or institutional cleaning where performance consistency matters.
Specialty Cleaners
Specialty cleaners are designed around a specific soil type, surface, or constraint. They may include solvents, acids, alkalis, oxidizers, enzymes, or targeted surfactant systems. Unlike the broad categories above, specialty cleaners are defined by function: removing scale, degreasing machinery, lifting protein stains, or cleaning glass without streaking.
Practical example: An acid-based descaler targets mineral scale by dissolving carbonate and related deposits. A glass cleaner often uses surfactant and solvent balance to reduce streaks and speed drying.
Best-fit use cases: bathrooms, kitchens, automotive interiors, food-service equipment, and any scenario where the soil is specific enough to justify a tailored chemistry.
How Categories Differ in Water and Soil Behavior
A useful way to compare categories is to track three questions: what ions form in water, how hardness affects them, and what soil they are optimized to disperse.
- Soaps: fatty-acid ions; hardness can form insoluble residue.
- Syndets: synthetic surfactants; designed to reduce scum formation.
- Detergents: engineered surfactant systems plus water-management additives.
- Specialty cleaners: chemistry chosen for a specific soil or surface.
Mind Map: Cleaning Product Categories
Example: Choosing the Right Category by Problem
If the problem is grease on dishes, detergents are usually the starting point because they are built for oil dispersion and often include water-management components. If the problem is soap scum on bathroom surfaces, syndet-style surfactant systems or specialty cleaners aimed at mineral residue are more appropriate than adding more soap. If the problem is mineral scale, specialty chemistry that reacts with the deposit is the logical choice, because surfactants alone cannot dissolve minerals.
Example: A Simple Decision Checklist
- What is the dominant soil: oil/grease, body soils, mineral scale, or protein stains?
- What is the surface: skin, fabric, glass, ceramic, metal?
- What is the water hardness: soft, moderate, or hard?
- What outcome matters most: rinsing without film, fast action, or strong stain removal?
Answering these four questions maps directly to the category, and it also sets up the later chapters on reaction chemistry and process control.
1.2 Typical Form Factors: Bars, Liquids, Powders, Granules, and Concentrates
Form factor is the product’s physical “shape,” but it also dictates the chemistry you can use, the equipment you need, and the quality checks you must run. A good way to think about it: the same cleaning goal can be met with different form factors, yet each form factor has its own constraints on viscosity, solubility, stability, and packaging.
Bars
Bars are usually made from soap (fatty acid salts) or syndet blends (surfactants plus structure builders). The bar must be firm enough to survive handling, but not so hard that it dissolves too slowly.
Key manufacturing implications:
- Water content and structure: Bars rely on a controlled moisture level and a solid matrix. Too much water can soften the bar; too little can make it brittle.
- Crystallization and texture: Soap bars can show graininess or haze if the fatty phase crystallizes unevenly. Cooling and mixing consistency matter.
- Rinsability balance: A bar that feels “clean” but rinses poorly often means the formulation is too hydrophobic or the salt balance is off.
Practical example: If a bar feels tacky after a few days, check free fatty acid and moisture. A small shift in neutralization can leave excess fatty material that migrates to the surface.
Liquids
Liquid cleaners include clear solutions, pearlescent liquids, and opaque suspensions. Liquids are forgiving in one way—customers can see the product—but strict in another—everything must stay dissolved or stably dispersed.
Key manufacturing implications:
- Viscosity control: Viscosity affects dosing, filling, and consumer feel. It is shaped by polymers, salts, and temperature.
- Solubilization and clarity: Surfactant systems may form micelles that keep oils and fragrances in place. If the system is under-salted or the pH drifts, cloudiness can appear.
- Phase stability: Suspensions need particle size control and enough wetting to prevent settling.
Practical example: If a liquid becomes cloudy after storage, compare batch pH and water hardness to the target. Hard water can shift salt balance and destabilize the micelle structure.
Powders
Powders are typically made by drying a base and then blending in actives and additives. The powder must dissolve quickly without clumping.
Key manufacturing implications:
- Bulk density and flow: Poor flow causes inconsistent dosing. Granulation and particle size distribution are central.
- Hygroscopicity management: Many builders and salts attract moisture. If the powder absorbs water, it can cake.
- Compatibility: Some ingredients react or degrade in the presence of moisture or high pH environments.
Practical example: If powder lumps form near the top of a bag, it often points to moisture ingress. Improve packaging seal integrity and consider ingredient-level moisture control.
Granules
Granules sit between powders and liquids: they are easier to handle than fine powders and often dissolve more predictably. Granulation can also protect sensitive ingredients by embedding them into a more stable matrix.
Key manufacturing implications:
- Granule strength: Granules must resist abrasion during transport but still break down in water.
- Layering and distribution: Actives can be distributed more evenly by controlling how additives are sprayed or mixed during granulation.
- Dissolution rate tuning: Particle size and surface properties determine how fast granules release surfactants and builders.
Practical example: If granules dissolve too slowly, check binder level and spray rate during granulation. Over-binding can create a shell that delays wetting.
Concentrates
Concentrates are about reducing packaging volume while keeping performance. They can be liquids or solids, but the defining feature is high active loading.
Key manufacturing implications:
- Solubility limits: Higher active levels push formulations toward the edge of clarity or stability. That means tighter control of temperature, mixing order, and water content.
- Rheology and dosing: Concentrates often require careful viscosity and yield-stress management so they pour and dose consistently.
- Quality sensitivity: Small deviations in pH, hardness tolerance, or neutralization can cause noticeable performance changes.
Practical example: If a concentrate separates, verify the order of addition for surfactants and builders. Adding a builder too early can reduce solubilization capacity and promote phase separation.
Mind Map: Form Factors and Their Process Demands
Choosing the Right Form Factor Without Guesswork
A practical selection method is to start with the constraints you can measure: required viscosity range, acceptable clarity or haze, target dissolution time, and packaging compatibility. Then map those constraints to the chemistry you can support—soap systems behave differently from syndets, and high-active concentrates demand tighter control than standard formulations. The result is fewer surprises at filling, fewer returns, and more consistent cleaning performance from batch to batch.
1.3 Core Unit Operations: Reaction, Neutralization, Saponification, Mixing, and Finishing
Core unit operations are the “physics and chemistry” behind everyday cleaning products. In soap and detergent manufacturing, you typically move through a reaction step, then neutralize to lock in the right chemical form, then finish to reach the final physical product. Mixing is the thread that makes the chemistry behave, and finishing is where the product stops being a chemical mixture and becomes a stable, usable item.
Reaction: Turning Feedstocks Into Reactive Intermediates
Reaction starts with the right inputs in the right state. For soap, the key transformation is converting fatty triglycerides or fatty acids into soap-forming species. In practice, the reactor is set up to control three variables: temperature, agitation, and addition rate.
A simple example: if you heat a fat and water mixture too quickly without adequate agitation, you can create local hot spots. Those hot spots accelerate side reactions and can also cause uneven conversion, which later shows up as inconsistent free fatty acid (FFA) levels.
Neutralization: Choosing the Chemical Form
Neutralization adjusts acidity or alkalinity so the product reaches the target salt form and pH. In soap systems, neutralization is often used to control the balance between soap and free fatty acid. In detergent liquids, neutralization also supports solubilization and viscosity development.
A practical rule: neutralization is not “just add base.” You control it by monitoring pH and/or titratable acidity while adding neutralizing agent at a controlled rate. If you overshoot pH, you may increase harshness or destabilize the system; if you undershoot, you may end up with excess FFA or poor performance.
Saponification: The Soap-Specific Reaction Path
Saponification is the reaction pathway that produces soap salts from fatty materials. It is sensitive to water content, temperature, and mixing intensity because the reactants must contact each other and the reaction must proceed uniformly.
Consider a batch where the reactor is well mixed but water is low. The reaction can still proceed, but the mixture may thicken early, slowing further mass transfer. That can leave unreacted material and increase variability between batches. The fix is not only “more heat,” but also correct water management and agitation to maintain workable viscosity throughout the reaction.
Mixing: Making Chemistry and Heat Agree with Each Other
Mixing is often treated as a utility, but it is a process control tool. Good mixing reduces concentration gradients, improves heat transfer, and helps you reach reaction end-point consistently.
In a soap reactor, mixing must handle changing phases: fats can melt, emulsions can form, and viscosity can rise as salts build. If agitation is too low, you can get incomplete conversion and uneven neutralization. If agitation is too aggressive, you may increase foaming or entrain air, which complicates downstream finishing and can affect appearance.
A straightforward example: during neutralization, adding base into a poorly mixed reactor can create a pH “front.” The region near the addition point neutralizes quickly, while the rest lags. The result is a batch that passes pH at the probe location but fails titration for FFA elsewhere.
Finishing: Converting Reaction Mixture Into a Stable Product
Finishing is where you shape the final physical properties: clarity or haze, viscosity, texture, and stability. In soap, finishing commonly includes steps that separate phases, remove excess water or impurities, and prepare the product for molding, cutting, or drying. In detergent liquids, finishing includes final adjustments, deaeration, filtration or polishing, and hold-time management.
A useful way to think about finishing is “end-point plus tolerances.” Reaction and neutralization set the chemical targets; finishing ensures the product meets physical specifications. For example, if you finish too early, you may trap unstable emulsions and see separation later. If you finish too late, you may allow degradation reactions to continue, shifting color or odor.
Mind Map: Core Unit Operations Flow
Integrated Example: One Batch, Five Decisions
Start with reaction: heat to the target range while maintaining agitation so conversion proceeds uniformly. Next neutralization: add neutralizing agent slowly while tracking pH and titration, aiming for the correct soap-to-FFA balance. Then saponification: verify that viscosity and phase behavior allow continued mass transfer; if it thickens too early, correct water or mixing rather than just increasing heat. During mixing, keep agitation consistent through transitions so the probe reading reflects the whole batch. Finally finishing: complete separation and physical conditioning only after chemical targets are met, and limit hold time to prevent property drift.
When these operations are treated as a connected system, you reduce the classic “it met pH but not performance” problem. The chemistry sets the potential; mixing makes it real; finishing turns it into a product that behaves the same way every time.
1.4 Quality and Performance Targets: Cleaning Power, Rinsability, Viscosity, and Stability
Quality targets for soap and detergent products are easiest to manage when they are written as measurable outcomes tied to specific formulation and process levers. In practice, you want four “headline” properties—cleaning power, rinsability, viscosity, and stability—plus a small set of supporting checks that explain why the headlines moved.
Cleaning Power
Cleaning power is the ability to remove soil from a surface under realistic conditions. In manufacturing, you typically control it indirectly through surfactant system strength, builder performance, and water-condition tolerance.
A practical way to define it is with a standardized soil removal test (for example, a greasy soil on a defined substrate) measured as percent removal or reflectance change. Then connect results to formulation levers:
- Surfactant selection and ratio: Higher active content often improves grease removal, but too much can hurt rinsability.
- Builder choice: Builders help by softening water and supporting soil suspension. If hardness rises, cleaning power should not collapse.
- pH and temperature: Many systems clean best within a pH window; temperature affects both reaction completion (for soap) and surfactant performance.
Example: A liquid detergent formulated for soft water may show strong grease removal in lab water but weak performance in hard water. The fix is usually not “more surfactant” first; it is often adjusting builder level or builder type so calcium and magnesium do not steal the surfactant’s job.
Rinsability
Rinsability is how easily the product rinses away without leaving residue that can cause dullness, tackiness, or film. It is closely linked to micelle behavior, foam characteristics, and the balance between detergency and deposition.
Define rinsability with a simple, repeatable method: rinse time to reach a clear rinse, residue mass on a standardized surface, or a sensory/visual film score with strict criteria. Then control it through:
- Surfactant-to-builder balance: Excess builder can increase residue risk in some systems.
- Solubilization and clarity: If the product is cloudy due to incomplete dissolution or phase issues, rinsing often worsens.
- Soap content and free fatty acid: In soap systems, free fatty acid and excess alkali can increase scum and residue.
Example: A batch that passes viscosity but leaves a noticeable film may have slightly higher free fatty acid. A targeted titration check can confirm the chemistry, and a process adjustment to neutralization endpoint can reduce residue without changing the entire formula.
Viscosity
Viscosity affects consumer experience and manufacturing stability: it influences pumping, filling accuracy, and how well the product stays uniform in the bottle. Viscosity is also a proxy for whether the system is truly dissolved or only “mostly there.”
Set viscosity targets as a range at a specified temperature and shear condition. For liquids, record viscosity at the same temperature every time because viscosity can shift noticeably with temperature. Control viscosity using:
- Neutralization level and ionic strength: Especially for soap, the salt form strongly affects viscosity.
- Polymer or thickener performance: If used, thickener hydration depends on mixing time and order of addition.
- Mixing uniformity: Poor dispersion can create local concentration gradients that later show up as viscosity drift.
Example: Two batches with identical ingredient weights can differ in viscosity if one batch had shorter mixing after adding thickener. The difference often traces to incomplete hydration, which later appears as “lumps that aren’t visible” but still change flow.
Stability
Stability is the product’s ability to remain within specs over time and handling. It includes chemical stability (no unacceptable drift in pH, active content, or free fatty acid) and physical stability (no separation, precipitation, gelation, or unacceptable viscosity change).
Use a structured stability plan:
- Short-term accelerated checks: Observe clarity, phase separation, and viscosity change after controlled temperature holds.
- Chemical endpoints: Track pH, free fatty acid/free alkali (for soap), and active content.
- Physical endpoints: Record sediment, haze, and layer formation with defined acceptance criteria.
Example: A detergent that stays clear initially but develops haze after a week may be experiencing salt precipitation or incomplete solubilization. A practical fix is to adjust addition order and ensure full dissolution before final viscosity or packaging steps.
Mind Map: Quality Targets and How They Connect
Integrated Example Workflow
Start with a target spec sheet: cleaning power method, rinsability acceptance, viscosity range, and stability endpoints. Then run a “spec-to-cause” loop during development or troubleshooting:
- If cleaning power drops, check water hardness tolerance and active content.
- If rinsability worsens, check free fatty acid/free alkali and clarity.
- If viscosity drifts, verify neutralization endpoint, thickener hydration, and mixing uniformity.
- If stability fails, connect the failure mode (haze, separation, gelation) to dissolution and neutralization steps.
This approach keeps the four headline targets from becoming four separate battles. They are different measurements of the same underlying reality: the chemistry must be right, and the process must let that chemistry stay right.
1.5 Process Flow Mapping: From Raw Materials Receiving to Packaging
A process flow map is the “single picture” that shows how soap and detergent ingredients become finished product. It should be detailed enough to guide daily operations, yet structured enough that quality and safety teams can trace problems back to a specific step. A good map also makes handoffs obvious: who receives, who approves, who transfers, and who releases.
Step 1: Define the Product Scope and Map Level
Start by choosing the product family you are mapping, such as liquid detergent, powder detergent, or bar soap. Then decide the map granularity. For example, you might map “Neutralization” as one block, while “Neutralization” could be broken into “Charge base,” “Add acid,” “Mix to endpoint,” and “Hold for verification” if you frequently see endpoint-related defects.
A practical rule: if a step has a measurable control point (pH, temperature, viscosity, active content), it deserves its own box.
Step 2: Raw Materials Receiving and Verification
Receiving is where many downstream issues begin, especially with oils, surfactants, and powders that vary by supplier lot.
Typical flow:
- Deliver and unload to a designated chemical receiving area.
- Check documentation (COA, lot number, spec sheet, hazard labels).
- Perform incoming inspection using sampling plans.
- Quarantine until results meet acceptance criteria.
- Release to storage with clear labeling and FIFO rules.
Example: A surfactant lot arrives with slightly higher water content. If you only check appearance and viscosity, you may miss the real impact: the formulation’s final concentration shifts, and the batch may fail active content specs. The map should show where moisture or assay is measured before the material enters production.
Step 3: Storage, Conditioning, and Pre-Processing
Storage is not passive. Many ingredients need conditioning so they behave consistently in the reactor.
Common pre-processing steps:
- Heating oils or fatty feeds to reduce viscosity for pumping.
- Tempering surfactants to stabilize viscosity and reduce foaming during transfer.
- Sieving powders to remove oversized particles.
- Preparing solutions (for example, dissolving builders) when the process requires it.
Example: If a builder solution is prepared with inconsistent water quality, you can see cloudiness or precipitation later. The map should include water source selection and any filtration or softening steps.
Step 4: Weighing, Order of Addition, and Charging
Charging is where chemistry meets procedure. The map should capture:
- Weighing method (mass balance, calibrated scales, batch tickets).
- Order of addition (especially for surfactants and polymers).
- Transfer controls (closed transfer for volatile or dusty materials).
- Mixing start conditions (impeller running before addition, target speed range).
Example: Adding a polymer thickener before the surfactant can cause clumping. The map should show the intended sequence and the mixing conditions that prevent it.
Step 5: Reaction and Process Control Loops
For soap and detergent systems, the map should show control points, not just equipment.
Include boxes for:
- Reaction stage (saponification or neutralization).
- Endpoint checks (titration, pH target, temperature hold).
- In-process holds (if required for phase stabilization).
- Rework triggers (what happens when a control point is out of range).
Example: If pH drifts during neutralization, the map should indicate whether the operator adjusts with incremental dosing and how the next sample is scheduled.
Step 6: Finishing, Filtration, and Bulk Holding
After reaction, many products require finishing steps to meet appearance and stability requirements.
Typical flow:
- Cooling or heating to a target viscosity window.
- Homogenization for uniformity.
- Filtration to remove particulates.
- Bulk hold with agitation or recirculation if separation is possible.
Example: Liquid detergent that is not mixed during bulk hold can show separation in the bottle. The map should show agitation requirements and hold time limits.
Step 7: Packaging, Labeling, and Release
Packaging is the final quality gate.
Include:
- Final batch sampling and release decision.
- Filling with metering controls and viscosity compensation.
- Capping and sealing checks.
- Labeling and batch coding tied to the batch record.
- Case packing, palletizing, and storage.
Example: If batch coding is not linked to the released batch record, you can end up with correct product in the wrong paperwork. The map should show the reconciliation step before pallets leave the line.
Mind Map: End-to-End Process Flow
Example: A Simple Mapping Template You Can Reuse
Use consistent labels across the map so teams can compare batches.
- Input: ingredient lot number and spec.
- Operation: equipment and mixing conditions.
- Control Point: what is measured and the acceptance range.
- Output: intermediate or bulk material with status.
- Decision: release, hold, or rework.
A map that follows this template makes it easier to spot where a defect first appears, whether it’s a pH drift, a viscosity mismatch, or a packaging seal failure.
2. Raw Materials, Specifications, and Supplier Qualification
2.1 Fatty Feedstocks and Oils: Composition, Impurities, and Impact on Saponification
Soap and detergent chemistry starts with what you feed the reactor. Fatty feedstocks are mostly triglycerides (fats and oils) or fatty acids, but their exact composition and impurity profile determine how smoothly saponification runs and how consistent the soap quality ends up.
Composition of Common Fatty Feedstocks
Most vegetable oils and animal fats are triglycerides: three fatty acid chains attached to glycerol. During saponification, the triglyceride is converted into glycerol and the fatty acid salts (soap), typically after hydrolysis and neutralization. The fatty acid chains vary in length and saturation.
- Chain length affects melting behavior and bar hardness. Longer chains generally yield harder, more solid soaps.
- Saturation level affects crystallization. More saturated fats tend to form firmer solids; more unsaturated fats can soften and may oxidize more readily.
- Minor components include sterols, pigments, and natural antioxidants. These don’t usually participate directly in saponification, but they influence color, odor, and stability.
Example: If you switch from a palm-based feedstock with a higher fraction of saturated chains to a more unsaturated oil, you may see softer bars and different clouding behavior in finished products, even if you hit the same target alkali charge.
Impurities That Matter in Saponification
Impurities fall into two practical groups: those that consume reactants and those that interfere with phase behavior and product appearance.
-
Free Fatty Acids (FFA)
- FFA react with alkali immediately, so they consume caustic that you might otherwise allocate to triglyceride conversion.
- High FFA can increase soap yield on paper but reduce control margin because the reaction becomes less predictable.
-
Water and Moisture
- Water can promote hydrolysis, which sounds helpful, but uncontrolled moisture changes reaction rate and can increase foaming during mixing.
- Moisture also affects dosing accuracy when feedstock is weighed by mass.
-
Peroxides and Oxidation Products
- Oxidized oils contain peroxides and secondary oxidation products that can darken soap and create off-odors.
- These species can also contribute to instability and color drift across batches.
-
Phospholipids and Gums
- Common in crude vegetable oils, these can form sticky emulsions and slow separation.
- They may increase haze and complicate clarification steps.
-
Metals and Catalyst Residues
- Trace metals can accelerate oxidation or catalyze side reactions.
- Even small levels can matter when you care about color and odor over time.
Example: A crude oil with elevated phospholipids may produce a soap that looks fine in the kettle but yields a hazier, less uniform product after salting-out because the emulsion breaks differently.
How Composition and Impurities Change the Process
Saponification is not just “add alkali and heat.” The feedstock determines how much alkali you need, how fast the reaction proceeds, and how well the soap separates.
- Alkali Demand: FFA increase immediate alkali consumption. If you don’t account for FFA, you can end up with excess free alkali or, conversely, insufficient neutralization.
- Reaction Kinetics: Moisture and emulsifying impurities can change mass transfer and mixing efficiency, affecting how quickly triglycerides convert.
- Phase Behavior: Oxidation products and gums can stabilize emulsions, delaying separation and increasing the time spent in downstream clarification or finishing.
- Color and Odor: Pigments, oxidation products, and metal residues influence the final appearance and smell, even when chemical conversion is on target.
Practical Feedstock Qualification Workflow
A systematic approach reduces surprises.
- Receive and sample using a plan that reflects lot variability.
- Measure key indicators: FFA (as mg KOH/g or %), moisture, peroxide value, and appearance/color.
- Check for contaminants: phospholipids/gums (where relevant) and metal residues if you have a history of odor or color issues.
- Translate results into dosing: adjust alkali charge based on FFA and set reaction conditions that match the feedstock’s behavior.
Example: If FFA rises from 2% to 6% between lots, the alkali charge must increase accordingly. Otherwise, you risk free alkali carryover, which later shows up as harshness and poor rinsability.
Mind Map: Fatty Feedstocks and Saponification Impact
Worked Example for Alkali Adjustment
Suppose a feedstock lot has 4% FFA. If your formulation assumes 2% FFA, you effectively have an extra 2% of fatty acid equivalents that will neutralize caustic before triglycerides fully react. The practical outcome is either:
- Too much free alkali if you keep the original caustic charge, or
- Lower conversion margin if you reduce caustic without rebalancing the triglyceride reaction plan.
The fix is straightforward: measure FFA for each lot and adjust alkali charge so the neutralization target matches the actual fatty acid equivalents present.
In short, composition sets the “shape” of the soap, impurities set the “speed and separation behavior,” and both together determine whether saponification ends with a predictable, spec-ready product.
2.2 Surfactant Inputs: Anionic, Nonionic, Cationic, and Amphoteric Options
Surfactants are the “workhorse” ingredients that let water wet surfaces, lift soils, and rinse away without leaving a film. In practice, the surfactant you choose is less about chemistry trivia and more about how it behaves in your exact water, pH, and formulation. The four common families—anionic, nonionic, cationic, and amphoteric—differ mainly in charge, which controls compatibility, cleaning style, and stability.
Core Concepts That Drive Selection
Start with three questions.
-
What is your product pH? Anionic surfactants often prefer neutral to alkaline conditions; cationics prefer acidic to neutral; amphoterics can tolerate a wide pH range.
-
What salts and hardness are present? Hard water introduces calcium and magnesium that can reduce performance, especially for some anionic systems.
-
What else is in the formula? Thickeners, solvents, enzymes, and preservatives can change solubility and viscosity, which indirectly affects surfactant performance.
A practical way to think about it: charge determines how surfactant molecules pack into micelles, and micelles determine how soils are solubilized and how stable the product remains.
Anionic Surfactants
Anionic surfactants carry a negative charge in solution. They are widely used because they generate strong detergency and foam, and they are usually cost-effective.
Common types: alkyl sulfates, alkyl ether sulfates, and sulfonates.
Strengths: good grease and particulate removal, effective at lower surfactant levels, and typically strong cleaning in hard-to-moderate water when builders are present.
Common gotchas:
- Hard water sensitivity: calcium can form less soluble complexes, causing haze or reduced cleaning.
- pH constraints: very acidic conditions can reduce performance or destabilize some systems.
Easy example: If you formulate a hand dish liquid at pH ~7–9 with an alkyl ether sulfate and a carbonate builder, you can often achieve good grease removal while keeping viscosity stable. If the same formula is tested in very hard water without enough builder, you may see reduced wetting and slower grease breakdown.
Nonionic Surfactants
Nonionic surfactants have no net charge. They tend to be more tolerant of water hardness and electrolytes.
Common types: alcohol ethoxylates, alkyl polyglucosides, and certain ethoxylated surfactants.
Strengths: compatibility with many other ingredients, stable performance across a broader pH range, and good solubilization of oily soils.
Common gotchas:
- Foam behavior: foam can be lower or foam quality can differ from anionic systems.
- Cost and dosing: some nonionics require higher dosage for the same cleaning impact.
Easy example: A floor cleaner that must work across variable water conditions can benefit from a nonionic co-surfactant. Pairing a nonionic with an anionic often improves wetting and reduces the “works in lab water, not in real water” problem.
Cationic Surfactants
Cationic surfactants carry a positive charge. They are excellent at conditioning and can provide strong antimicrobial effects in some contexts, but they are usually not used as the primary detergent surfactant in standard soap/detergent formulations.
Common types: quaternary ammonium compounds.
Strengths: strong interaction with negatively charged surfaces, good fabric conditioning, and effective antimicrobial action.
Common gotchas:
- Incompatibility with anionics: mixing cationic and anionic surfactants often leads to precipitation or loss of performance.
- Material interactions: they can interact with certain polymers and can affect viscosity.
Easy example: If you are making a fabric softener, cationic surfactants make sense because the goal is deposition on fibers. If you are making a dish detergent, using cationic surfactants alongside anionic detergents usually creates a compatibility headache.
Amphoteric Surfactants
Amphoteric surfactants can behave as anionic or cationic depending on pH. This gives them a practical “middle ground” for compatibility and mildness.
Common types: betaines and amine oxides.
Strengths: good tolerance to pH changes, compatibility with both anionic and nonionic systems, and often improved mildness.
Common gotchas:
- Foam and viscosity effects: they can alter foam stability and thickening behavior.
- Salt sensitivity varies: some amphoterics handle electrolytes well, others less so.
Easy example: A mild body wash formulated around amphoteric surfactants can maintain clarity and stable viscosity when pH drifts slightly during manufacturing or storage. Pairing amphoterics with an anionic can also help reduce irritation while keeping cleaning strength.
Mind Map: Surfactant Families and Practical Implications
Integrated Selection Workflow
- Set the pH target based on your product type and stability needs.
- Choose a primary cleaning family (often anionic or nonionic) that matches your pH and water conditions.
- Add a compatibility helper (amphoteric or nonionic) to stabilize clarity, viscosity, and performance under real-world water.
- Avoid incompatible pairings by checking charge interactions early—especially cationic with anionic.
- Validate with simple bench checks: observe clarity, measure viscosity, and run a quick soil removal test in water that matches your expected hardness.
This approach keeps surfactant selection grounded in behavior you can observe, rather than relying on ingredient names alone.
2.3 Builders and Additives: Carbonates, Silicates, Zeolites, Polymers, and Chelants
Builders are the “support crew” for cleaning: they reduce the impact of hard water, help surfactants work efficiently, and keep soils from redepositing. In practice, builders also shape viscosity, pH, corrosion risk, and how stable a formulation stays during storage. A good builder choice starts with two questions: what kind of water is the customer using, and what soils are being targeted (grease, particulate, protein, or mixed).
Foundational Roles of Builders
Most builders act through one or more mechanisms:
- Water softening: bind calcium and magnesium so surfactants and soils don’t get trapped in insoluble salts.
- pH control: raise alkalinity to improve grease removal and support surfactant performance.
- Soil suspension and anti-redeposition: keep particles dispersed so they rinse away instead of settling back.
- Corrosion and compatibility management: influence how aggressive the product is toward metals and how it interacts with packaging.
A simple example: if you’ve ever seen white streaks from a detergent in hard water, that’s often calcium-related precipitation or redeposition. Builders reduce the chance of that happening.
Carbonates
Carbonates (commonly sodium carbonate) provide alkalinity and some softening. They are relatively straightforward to use and often appear in powders and some liquids.
- What they do well: raise pH and help remove fatty soils.
- Where they struggle: they don’t always control calcium as strongly as silicates or zeolites, especially at higher hardness.
- Process and formulation implications: carbonates can increase solution conductivity and affect viscosity indirectly through salt strength.
Example: In a hand dishwashing liquid, carbonate can improve grease removal, but if the formulation also contains sensitive ingredients (like certain enzymes), pH and stability must be balanced.
Silicates
Silicates (typically sodium metasilicate or related forms) contribute strong alkalinity and corrosion resistance. They also help keep soils dispersed.
- What they do well: enhance cleaning in hard water and reduce redeposition.
- Where they struggle: they can be harsh on skin and can be incompatible with some formulations if pH or ionic strength is not managed.
- Practical control point: silicate solutions can change viscosity and clarity depending on concentration and temperature.
Example: A laundry detergent targeting oily stains may use silicate to boost performance, but the formulator must check metal compatibility for equipment and ensure the final pH stays within the intended range.
Zeolites
Zeolites (often sodium aluminosilicates) are widely used in powders. They soften water by exchanging sodium ions for calcium and magnesium.
- What they do well: strong water softening and good soil suspension.
- Where they struggle: they can increase abrasiveness and affect flow properties in dry products.
- Operational detail: zeolite performance depends on particle size distribution and how well they disperse during dissolution.
Example: If a powder detergent dissolves slowly, zeolite ion exchange may be delayed, and you’ll see reduced cleaning in cold wash cycles. Adjusting granulation and dissolution behavior can fix that.
Polymers
Polymers help keep soils from reattaching by dispersing particles and controlling rheology. They also stabilize formulations by reducing unwanted aggregation.
- What they do well: anti-redeposition, improved suspension, and viscosity tuning.
- Where they struggle: polymers can be sensitive to pH, ionic strength, and surfactant type.
- Practical control point: polymer selection should match the formulation’s ionic environment.
Example: In a liquid detergent, a polymer can prevent particulate dirt from settling in the bottle. If the polymer is poorly matched, you may get stringiness or phase separation.
Chelants
Chelants bind metal ions directly, reducing their ability to interfere with cleaning. They are especially useful when you need reliable performance across variable water hardness.
- What they do well: consistent calcium control and improved stability of surfactant systems.
- Where they struggle: they can increase formulation cost and may require careful dosing to avoid over-binding that affects other ingredients.
- Practical control point: chelant effectiveness depends on pH and the presence of competing ions.
Example: A concentrated all-purpose cleaner may use a chelant to maintain clarity and prevent mineral-related haze when customers use different water sources.
Integrated Selection Logic
A builder system is rarely “one ingredient does everything.” Formulators often combine alkalinity (carbonates or silicates) with softening and dispersion (zeolites and polymers) and add chelation when consistency is critical.
- Use carbonates for baseline alkalinity.
- Use silicates when you need stronger alkalinity and corrosion resistance.
- Use zeolites for effective softening in powders.
- Use polymers to keep soils suspended and tune viscosity.
- Use chelants for robust metal control, especially in variable water.
Mind Map: Builders and Additives
Example: Choosing a Builder System for a Powder Laundry Detergent
Suppose the target is good cleaning in hard water with acceptable dissolution in cold wash. A practical starting point is:
- Carbonate for baseline alkalinity.
- Zeolite for ion-exchange softening.
- Polymer for anti-redeposition and improved suspension.
- Optional chelant only if testing shows persistent mineral interference or haze.
Then you verify with simple checks: dissolution time, clarity of the wash liquor, and whether soils remain suspended rather than settling. If calcium-related redeposition appears, you adjust the balance toward stronger softening or better dispersion rather than just increasing alkalinity.
2.4 Solvents, Hydrotropes, and Processing Aids: Selection Criteria and Compatibility
Solvents, hydrotropes, and processing aids help cleaning formulations dissolve, stay uniform, and process smoothly. The trick is to treat them as part of the system, not as standalone “helpers.” A good selection starts with what you must achieve—clear dissolution, controlled viscosity, stable clarity, or easier pumping—and then checks compatibility with surfactants, builders, electrolytes, and packaging.
Foundational Roles and What They Change
A solvent reduces viscosity and improves wetting during mixing. In liquids, it can also slow down phase separation by keeping components solvated. Hydrotropes are special: they increase solubility of surfactant systems, especially when surfactant concentration is high or when the formulation contains salts. Processing aids include dispersants, anti-foam agents, chelants, and viscosity modifiers that reduce operational headaches like foaming, poor dispersion, or inconsistent pump performance.
A practical way to think about selection is to map each additive to a measurable outcome. For example, if the problem is “surfactant won’t dissolve,” hydrotrope selection matters more than solvent choice. If the problem is “mixing is too slow and the batch stalls,” a solvent or a viscosity modifier may be the faster fix.
Selection Criteria That Actually Prevent Failures
1) Solubility and dissolution behavior
Check whether the additive dissolves in the formulation’s water phase at the working temperature. If it only dissolves when hot, you may get cloudiness after cooling. Example: a mid-polarity solvent might dissolve surfactant during heating, but after cool-down the system can separate into a hazy phase.
2) Compatibility with surfactants and micelles
Hydrotropes can change micelle size and the balance between solubilization and viscosity. That’s why you should test at the target surfactant concentration, not at a diluted lab sample. Example: adding too much hydrotrope can lower viscosity and make the product feel “thin,” even if it looks clear.
3) Electrolyte tolerance
Builders and salts (like carbonates, silicates, or chlorides) can reduce solubility of some additives. If your formulation uses hard-water-tolerant strategies, verify performance with representative electrolyte levels. Example: a hydrotrope that works in deionized water may precipitate or cause gel-like lumps when calcium is present.
4) pH and chemical stability
Many systems are alkaline. Confirm that the additive remains stable across the process pH range and does not react with oxidizers, reducers, or strong acids used in cleaning-in-place. Example: some processing aids degrade faster at high pH, which can shift viscosity over time.
5) Odor, color, and sensory impact
Even if an additive is chemically compatible, it can contribute odor or color that shows up in the finished product. Example: a solvent with a strong baseline odor may mask fragrance poorly, leading to “off” notes after aging.
6) Regulatory and material compatibility
Compatibility includes both formulation chemistry and packaging. Verify that the additive does not attack seals, gaskets, or coatings. Example: certain solvent-rich blends can swell elastomers, causing slow leaks.
Compatibility Checks You Can Run in a Day
Start with small-scale jar tests that mirror the real order of addition. Keep temperature and mixing speed consistent. Then evaluate:
- Clarity after cooling: measure visual haze at room temperature.
- Viscosity trend: record viscosity at a fixed shear rate if available.
- Sedimentation or phase split: observe over a set hold time.
- Foam during mixing: note whether anti-foam is needed.
- pH drift: confirm the additive doesn’t shift pH unexpectedly.
A simple acceptance rule: if the additive improves dissolution but causes phase separation after cooling, it’s not a win. If it keeps clarity but makes viscosity unstable, you still have a process control problem.
Mind Map: Solvents, Hydrotropes, and Processing Aids
Example: Choosing a Hydrotrope for a High-Surfactant Liquid
Suppose a liquid detergent uses a high level of anionic surfactant plus carbonate builder. During pilot mixing, the batch looks clear at 70°C but turns hazy at 25°C. You test three hydrotrope candidates at the same dosage range, keeping surfactant and builder constant.
- Candidate A improves hot dissolution but haze forms after cooling.
- Candidate B maintains clarity and keeps viscosity within the target band.
- Candidate C reduces viscosity too much and increases foam during mixing.
The selection outcome is Candidate B, because it satisfies the system-level requirements: stable clarity, acceptable viscosity, and manageable processing behavior.
Example: Solvent Choice for Pumpability Without Phase Issues
If the formulation is too viscous to pump at start-up, you consider a solvent to reduce viscosity. You test a low-odor solvent and a higher-solvency option. The higher-solvency solvent lowers viscosity quickly, but it also increases the risk of phase separation when the product is diluted in use. The low-odor solvent gives a smaller viscosity reduction, but it preserves the intended dilution behavior and reduces customer complaints about “unexpected cloudiness” in the sink.
Example: Processing Aid to Fix Dispersion, Not Just Appearance
In a powder or granular system, poor dispersion can look like “it dissolves slowly,” even when the formulation is chemically correct. A dispersant or wetting aid can reduce clumping and improve dissolution rate. You confirm by measuring dissolution time in a controlled agitation test, not by relying on the first-minute appearance.
In all cases, the selection logic is the same: choose additives that solve the specific failure mode, then verify compatibility with surfactants, builders, temperature changes, and packaging materials. That’s how you avoid the classic situation where the batch looks great in the kettle and behaves badly in the bottle.
2.5 Water Quality, Sampling Plans, and Incoming Inspection Documentation
Water is the quiet ingredient that decides whether your chemistry behaves. In soap and detergent manufacturing, water quality affects reaction completion, pH stability, solubility, viscosity, clarity, and even how well builders perform. The goal of this section is simple: define what “good” means, verify it consistently, and record it so the next batch doesn’t have to guess.
Water Quality Foundations for Cleaning Product Manufacturing
Start by separating water quality into three practical buckets.
-
Ions that cause hardness and scaling: calcium and magnesium can tie up builders and interfere with dissolution. Even if your formulation is correct on paper, hard water can shift performance.
-
Ions that affect pH and conductivity: sodium, chloride, sulfate, and alkalinity influence conductivity readings and can change neutralization behavior.
-
Impurities that affect appearance and stability: suspended solids, iron, and organic contamination can contribute to haze, discoloration, and inconsistent viscosity.
A useful mindset is to treat water as a variable that you either control (soften, deionize, filter) or measure and compensate for (adjust formulation or process targets). Either way, you need data.
Sampling Plans That Actually Represent the Water
Sampling is where good intentions go to die, usually because the sample doesn’t represent the bulk. Build your plan around where the water is used and how it moves.
Choose the sampling point carefully. If you draw from a tank, sample from the recirculation line or a well-mixed location, not from a dead-end valve. If you draw from a manifold, sample after the final treatment step.
Define sample timing. Water quality can drift with filter loading or resin exhaustion. For routine incoming checks, sample at a frequency that matches your treatment system’s stability. For example, if a softener regenerates on a predictable schedule, sampling right after regeneration and again near the end of the cycle helps you see the range.
Use consistent sample handling. Label containers before sampling, use clean bottles, and avoid contamination from caps or tubing. If you measure parameters like pH or conductivity, measure promptly or store under conditions that don’t change the sample.
Incoming Inspection Documentation That Supports Decisions
Incoming inspection documentation should answer three questions: What was measured, what it means, and what you did about it.
Document the test method and acceptance criteria. Record the method name (or internal procedure ID), instrument used, calibration status, and the numeric limits that define pass/fail. If your acceptance criteria differ by product family, note the applicable rule.
Record the sampling details. Include sampling point ID, date, time, operator, and any deviations such as unusual operating conditions.
Link results to disposition. If water fails, document the disposition path: hold, re-test, route to a different use, or treat again. If water passes, record the approval so production can proceed without rework.
A practical example: suppose conductivity is high and hardness is borderline. Your documentation should show whether you held the batch, blended with softened water, or adjusted process targets. Without that link, the next investigation becomes detective work.
Mind Map: Water Quality Control and Documentation
Example: Routine Incoming Water Check
Assume your plant uses treated water from a softener followed by filtration. Your incoming inspection includes hardness (as CaCO₃), conductivity, and pH.
- You sample from the recirculation line after the final filter.
- You test hardness, conductivity, and pH using the same internal methods each time.
- You compare results to acceptance limits for the product family being produced.
- If hardness is slightly above the limit, you document whether the batch was held for re-treatment or whether blending with softened water brought the effective hardness into range.
The key is that the record captures the decision, not just the numbers.
Example: Handling a Failed Result Without Guessing
If pH is within range but conductivity is high, you might suspect increased dissolved salts rather than hardness. Your documentation should record the failed parameter, the likely reason based on your treatment system behavior, and the disposition action. If you re-test, record the time between tests and whether the sampling point changed. This prevents “pass by accident” outcomes from hiding the real issue.
Practical Documentation Checklist
Use a consistent checklist so nothing important gets skipped:
- Sampling point ID and treatment stage
- Sampling date and time
- Operator name
- Test methods and instrument IDs
- Calibration status
- Measured values and acceptance criteria
- Product family applicability
- Disposition decision and any re-test details
- Deviations and corrective actions
When these items are complete, water quality becomes a controlled input rather than a recurring mystery. That’s the boring part that keeps the chemistry working.
3. Chemistry Foundations for Soap and Detergent Reactions
3.1 Fatty Acid and Triglyceride Chemistry: Hydrolysis, Transesterification, and Saponification
Fatty acids and triglycerides are the chemical “starting blocks” behind many soaps and detergent systems. In most manufacturing routes, you begin with triglycerides (oils and fats), then convert them into fatty acids or their salts. The three reactions—hydrolysis, transesterification, and saponification—share a common theme: they rearrange how carbon chains are attached to oxygen-containing groups.
Core Structures and What They Mean
A triglyceride is a glycerol backbone esterified with three fatty acid chains. Each fatty acid chain is long and nonpolar, which is why it helps with grease removal. The ester linkages are the reactive points. When you break or replace those linkages, you change solubility and reactivity.
A fatty acid is a long-chain carboxylic acid. The carboxyl group is polar and can form salts. Soap is typically the sodium or potassium salt of a fatty acid, where the polar head can interact with water and the nonpolar tail can interact with oils.
Hydrolysis: Breaking Esters Into Fatty Acids and Glycerol
Hydrolysis cleaves ester bonds using water. In practice, it can be acid-catalyzed or base-catalyzed, but the manufacturing goal is usually to increase free fatty acid content.
Mechanistic idea: water attacks the ester carbonyl, leading to a tetrahedral intermediate and then cleavage into a fatty acid and glycerol. The reaction is sensitive to water availability and mixing. If water distribution is uneven, you get uneven conversion and inconsistent free fatty acid levels.
Easy example: Suppose an oil feed has a high moisture uptake or you add water unevenly during pretreatment. You may see higher free fatty acid formation, which can later change neutralization demand and affect bar hardness or liquid viscosity.
Process control implication: monitor free fatty acid (FFA) early and adjust neutralization targets. Hydrolysis is not just chemistry; it’s a bookkeeping problem for stoichiometry.
Transesterification: Swapping the Alcohol Partner
Transesterification replaces the glycerol portion’s ester environment with a new alcohol, producing fatty acid alkyl esters and a glycerol byproduct. In soap manufacturing, transesterification is more common in biodiesel contexts, but the underlying logic is useful: it teaches how ester exchange changes downstream behavior.
Mechanistic idea: an alcohol (often methanol or ethanol) attacks the ester, forming a new ester and releasing glycerol or a related intermediate. Catalysts (acid or base) accelerate the exchange by making the ester carbonyl more reactive.
Why it matters for soap chemistry: if you have esterified intermediates or residual alkyl esters in your feed, they can behave differently during saponification. They may consume alkali without producing the expected soap salt profile.
Easy example: If a feedstock contains a noticeable fraction of alkyl esters, the alkali requirement for “soap yield” may not match calculations based purely on triglyceride content. The result can be excess free alkali or lower active soap content.
Process control implication: characterize feed composition. Even a simple titration-based approach for FFA plus a basic ester content check can prevent stoichiometric surprises.
Saponification: Converting Fatty Acids Into Soap Salts
Saponification is the reaction of fatty acids (or triglycerides under conditions that generate fatty acids in situ) with a base to form soap salts. The classic base is sodium hydroxide for sodium soaps or potassium hydroxide for potassium soaps.
Mechanistic idea: the carboxylic acid group is deprotonated by hydroxide to form a carboxylate. If starting from triglycerides, hydrolysis must occur first (either intentionally or as part of the overall process), producing fatty acids that then neutralize.
Stoichiometry is the heart of control. For fatty acids, each mole of fatty acid needs one mole of hydroxide to form the salt. For triglycerides, the effective requirement depends on how completely you convert ester bonds to fatty acids before neutralization.
Easy example: If you target a specific soap concentration but your FFA measurement is off by 1%, you can end up with either free alkali (too much base) or incomplete conversion (too little base). Free alkali can raise pH and irritate skin; incomplete conversion can reduce cleaning performance and change texture.
Reaction Pathways and How They Connect
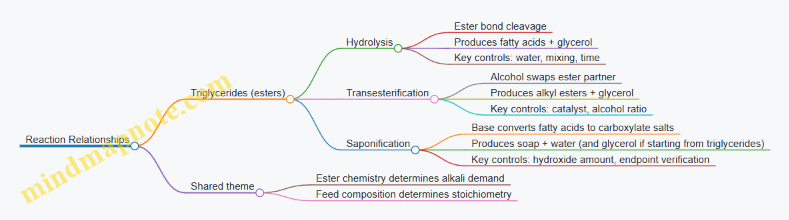
A practical way to think about the chemistry is as a pathway from triglycerides to fatty acid salts, with hydrolysis as the bridge and saponification as the salt-forming endpoint. Transesterification is a detour that can appear in feed preparation or upstream processing, and it changes what “reactive groups” you actually have.
Mind Map: Reaction Relationships
Endpoint Thinking: From Chemistry to Acceptance
In manufacturing, “done” means the product meets chemical targets, not just that time passed. For soap systems, common endpoints include free fatty acid level, free alkali level, and overall active matter. These are linked to the reactions above.
A simple mental checklist: (1) How much reactive material did you start with (triglycerides vs FFA vs esters)? (2) Did hydrolysis occur as expected? (3) Did hydroxide neutralize the right fraction? (4) Do analytical results match the stoichiometric plan?
When those answers align, the chemistry and the process control stop arguing with each other, and the soap behaves predictably in the next unit operations.
3.2 Neutralization and Salt Formation: pH, Stoichiometry, and Phase Behavior
Neutralization is the step where you convert reactive acid or base into a more stable salt form, and it’s also where pH, solubility, and product appearance start behaving like a team with a shared agenda. In soap and detergent systems, the “salt” is often the water-soluble partner that determines whether the product stays clear, gels, clouds, or separates.
Foundational Concepts
Start by identifying what you are neutralizing. In soap manufacture, free fatty acids are neutralized with an alkali (commonly NaOH or KOH) to form fatty acid salts. In liquid detergents, neutralization may be used to bring an acid form into a soluble salt form so the system thickens and stays uniform.
A neutralization reaction is usually a simple acid-base stoichiometry problem:
- Acid equivalents + base equivalents → salt + water (or other byproducts depending on the system).
The key practical idea is that pH is not just a “reading”; it’s a proxy for how much acid or base is left unreacted. If you stop too early, you carry excess free acid (or free fatty acid). If you overshoot, you carry excess free alkali. Either way, you’ll see downstream effects in performance and stability.
Stoichiometry That Actually Shows Up in the Tank
Stoichiometry is easiest when you work in equivalents rather than mass. Convert your acid input to acid equivalents (for fatty acids, this is tied to acid value). Then compute the required base equivalents for complete neutralization.
A practical workflow looks like this:
- Determine the acid equivalent content of the fatty acids or acid-form ingredients.
- Calculate theoretical base needed for full conversion.
- Add base in controlled increments while monitoring pH.
- Hold at a target pH range and verify with a chemical assay for free acid or free alkali.
Example: Suppose you have a batch with fatty acids that require 100.0 kg of NaOH for theoretical full neutralization. In practice you might add 98–99% of that amount initially, then finish with small additions while pH approaches the target. The last few percent are where measurement uncertainty and mixing differences live.
pH as a Control Variable
pH depends on concentration, temperature, and the buffering capacity of the formulation. In soap systems, pH also correlates with the fraction of fatty acids converted to their salt form.
Two common targets illustrate the logic:
- For many bar soap formulations, you aim to minimize free fatty acid and free alkali while achieving a pH that supports consistent bar hardness and mildness.
- For liquid detergent bases, you often target a pH that ensures the salt form is soluble and that viscosity development is stable.
Because pH probes can drift and because temperature affects readings, you should standardize measurement conditions. Calibrate probes, record temperature, and use the same measurement protocol each batch.
Phase Behavior and Why Salt Formation Changes Everything
Salt formation changes solubility and can trigger phase transitions. The system may move between:
- Single-phase clear solutions
- Cloudy or hazy states from partial solubilization
- Two-phase separation from insoluble salt or precipitation
- Gel or semi-solid structures when the salt network forms
The main drivers are:
- Ion type and concentration (Na+ vs K+ changes solubility and texture)
- Water hardness (Ca²⁺ and Mg²⁺ can form less soluble salts with fatty acids)
- Temperature (affects solubility and reaction completion)
- Composition balance (surfactant-to-builder-to-salt ratios)
Example: If you neutralize fatty acids in hard water, calcium can compete with sodium for the fatty acid anion. The result can be a cloudy mixture or even a precipitate-like haze. The fix is not “change the pH and hope”; it’s to manage water quality, adjust neutralization strategy, and confirm free fatty acid levels.
Integrated Best Practices for Neutralization
Control addition rate. Add base gradually to avoid local high-pH zones that can cause uneven salt formation. Local overshoot can create transient precipitation that later dissolves—or doesn’t.
Mix consistently before and during pH checks. pH is measured in a specific location. If mixing is weak, you’ll chase a moving target.
Use a two-step acceptance approach. pH tells you the direction; chemical assays confirm the endpoint. A batch can hit target pH yet still contain excess free acid or free alkali due to buffering effects.
Watch for temperature effects. If you neutralize while the mixture is warming or cooling, solubility can change mid-reaction. Track temperature and keep it within a defined operating window.
Mind Map: Neutralization and Salt Formation
Example: From Target pH to Stable Product
Imagine a liquid detergent base that turns slightly cloudy after neutralization. First check whether pH is truly at the target under the same temperature conditions used for calibration. Then measure free acid or free alkali to see whether the cloudiness is linked to incomplete conversion or overshoot. Finally, review water hardness and the salt-forming balance of the formulation. Often the root cause is not “wrong pH,” but the combination of endpoint overshoot and ion competition that pushes the system into a less soluble salt form.
Neutralization is where chemistry and process control meet. If you treat it as a stoichiometry problem, a pH problem, and a phase behavior problem at the same time, the batch tends to behave like it was designed—because it was.
3.3 Surfactant Formation and Function: Micelles, CMC, and Solubilization Mechanisms
Surfactants are molecules that carry two personalities: a water-avoiding tail and a water-loving head. When you add them to water, they do not simply “mix and behave.” They self-organize to reduce the energy cost of keeping tails away from water. This organization is the foundation for micelles, the critical micelle concentration (CMC), and solubilization.
Micelle Formation from Molecular Packing
Micelles form when surfactant concentration is high enough that the system benefits from clustering. Below the CMC, most surfactant molecules remain as individual monomers. As concentration rises, monomers compete for the same water environment, and the solution reaches a point where additional surfactant prefers to aggregate.
A practical way to picture it: imagine each tail wants to hide, and each head wants to stay in water. At low concentration, there are enough “hiding spots” for tails to remain dispersed. At higher concentration, tails can collectively hide inside a core while heads line the outside, creating a stable structure.
Micelle shape depends on surfactant type and conditions. Nonionic surfactants often form relatively flexible aggregates, while ionic surfactants face electrostatic effects that can influence size and stability. In real formulations, salts, temperature, and the presence of builders can shift micelle size and behavior.
CMC as the Concentration Threshold
CMC is the concentration where micelle formation becomes significant. It is not a cliff; it is a transition region. Still, it is useful because many properties change around it.
Key behaviors near the CMC include:
- Surface tension drops quickly as monomers accumulate at the air–water interface.
- After micelles form, surface tension decreases more slowly because extra surfactant mostly goes into micelles rather than the interface.
- Solubilization capacity increases sharply because micelles provide internal space for hydrophobic substances.
Example: Suppose you test a detergent solution and measure surface tension. At low dose, adding surfactant noticeably reduces surface tension. Once you reach the CMC, further additions produce smaller surface tension changes, even though cleaning performance may continue improving due to increased micelle population.
Solubilization Mechanisms for Oils and Grease
Solubilization is the process of incorporating hydrophobic materials into a micellar structure so they remain dispersed rather than separating as an oil layer.
There are two common pathways:
- Partitioning into the micelle core: Hydrophobic soil migrates from the bulk liquid into the micelle interior. The micelle then carries the soil through the wash water.
- Interfacial adsorption followed by micellar uptake: Surfactant first adsorbs at oil–water interfaces, weakening the interface. Once the interface is sufficiently disrupted, micelles can capture the loosened oil droplets or fragments.
The effectiveness of solubilization depends on micelle size, core polarity, and the match between soil polarity and micelle interior. If the soil is too hydrophobic for the micelle core to accommodate, you may see poor dispersion even when the solution is above the CMC.
Example: In a lab beaker, a small amount of cooking oil added to a surfactant solution may initially form droplets. If the formulation is above the CMC and the micelle core is compatible, droplets shrink and disappear over time. If the solution is below CMC, droplets persist because there are too few micelles to capture the oil.
Mind Map: Micelles, CMC, and Solubilization
Process-Relevant Control Points with Concrete Checks
In manufacturing, you rarely measure micelles directly, so you infer behavior through measurable proxies.
- Dose relative to CMC: If a liquid concentrate is diluted in use, the final use concentration may fall near or below CMC. That can explain why a product “works in the lab” but underperforms in real dosing.
- Salt and hardness effects: Ionic surfactants can be sensitive to counterions. Builders can either support micelle formation or interfere with it, depending on chemistry.
- Temperature and viscosity: Higher temperature can change micelle size and solubilization kinetics. Higher viscosity can slow soil transport, making solubilization appear sluggish even when micelles exist.
Example: A formulation that solubilizes grease well at 30°C might show slower grease removal at 10°C. The micelles may still form, but the rate at which soil partitions into them can drop because diffusion and interfacial dynamics slow down.
Micelles, CMC, and solubilization are connected: CMC marks when micelles become abundant, and micelles provide the internal environment that allows hydrophobic soils to disperse. Once you connect those links, formulation decisions stop being guesswork and start being cause-and-effect.
3.4 Reaction Kinetics and Mass Transfer: Mixing, Temperature Profiles, and Residence Time
Soap and detergent reactions rarely behave like a single, neat equation. In practice, the observed rate is shaped by two linked realities: molecules must meet (mass transfer) and the reaction must proceed once they do (kinetics). Mixing, temperature profiles, and residence time determine both.
Kinetics and What You Actually Measure
Reaction kinetics describe how fast the chemistry proceeds at a given local temperature and composition. For many soap-related steps, the rate increases with temperature because molecular motion and collision frequency rise. But the “rate you measure” in a reactor is often limited by how quickly reactants are distributed throughout the liquid. That means two batches with the same average temperature can behave differently if one has poor mixing or temperature gradients.
A practical way to think about it is to separate the overall process into three time scales:
- Chemical time scale: how quickly the reaction proceeds once reactants are in the same micro-region.
- Mixing time scale: how quickly the reactor eliminates concentration differences.
- Transport time scale: how quickly diffusion and interfacial transfer occur across boundary layers. If mixing is slow compared with chemistry, you get “local overreaction” near feed points and underreaction elsewhere. If chemistry is slow, mixing matters less, but temperature uniformity still matters because kinetics depend strongly on temperature.
Mass Transfer and Mixing Mechanisms
In a stirred tank, mass transfer is influenced by how turbulence breaks up concentration gradients. Three mechanisms matter most:
- Bulk mixing: circulation that moves fluid from one region to another.
- Turbulent mixing: eddies that reduce concentration differences.
- Molecular diffusion: slow smoothing at the smallest scales.
For liquid soap and detergent systems, the biggest practical lever is agitation that creates sufficient turbulence without creating excessive foam or heat loss. If you add a fatty feed or surfactant concentrate into a reactor that is not well mixed, you can create local zones with high reactant concentration. Those zones can drive faster reaction and side reactions, while the rest of the batch lags behind.
Example: Suppose you charge oil into a reactor and then add alkali. If the alkali addition is too fast relative to mixing, you can see a temporary rise in pH at the addition point. That can increase the formation of undesired byproducts and later show up as darker color or off-odor, even if the final average pH looks correct.
Temperature Profiles and Their Consequences
Temperature affects kinetics and also changes physical properties like viscosity and solubility. A reactor with a uniform setpoint can still have temperature gradients if heat transfer is uneven or if the feed has a very different temperature.
A useful rule: treat temperature as a field, not a number. The “average temperature” is only meaningful if the reactor is close to thermal uniformity.
Common sources of gradients include:
- Cold feed streams entering near the bottom or side.
- Heat transfer limitations when viscosity rises during reaction.
- Insufficient circulation that leaves dead zones.
Example: In a neutralization step for a detergent concentrate, if the neutralizing agent is added slowly into a well-mixed reactor, the temperature rise is distributed and viscosity develops smoothly. If added into a poorly mixed zone, you can get localized overheating that accelerates decomposition of sensitive components, while other regions remain cooler and react more slowly.
Residence Time and End-Point Control
Residence time is the duration that material spends under specific conditions. In batch operations, it’s tied to how long the batch is held at reaction temperature and how quickly you reach and maintain that temperature.
Residence time interacts with kinetics in two ways:
- Completion: too short can leave unreacted species, lowering performance.
- Degradation: too long can increase side reactions, affecting color, odor, and stability.
Because kinetics depend on temperature, residence time at the “right” temperature matters more than the total time in the reactor. A batch that reaches temperature quickly and holds it briefly can outperform a batch that ramps slowly and holds longer at suboptimal conditions.
Example: If a saponification step is held too long at a high temperature, you may increase hydrolysis and oxidation products. Those can show up as higher free fatty acid or poorer clarity later, even if titration suggests the main reaction is “done.”
Mind Map: Reaction Kinetics and Mass Transfer
Practical Control Logic for Batch Operations
A reliable approach is to control the three time scales together. Start with a mixing plan that ensures fast homogenization during feed addition, then use a temperature ramp that reaches the target quickly without overshooting. Finally, hold for a residence time that matches the expected kinetic completion while limiting exposure that drives degradation.
Example workflow:
- During charging, run agitation to establish circulation before adding reactive feeds.
- Add reactive components at a rate that avoids local spikes, using the same addition profile each batch.
- Ramp temperature to the target while monitoring viscosity or other indicators that signal property changes affecting heat transfer.
- Hold at target temperature long enough to meet end-point criteria, then cool promptly to reduce further side reactions.
Diagram: Linking Mixing, Temperature, and Residence Time
    flowchart TD
  A[Feed Addition] --> B[Local Concentration Spikes]
  B --> C[Mixing Eliminates Gradients]
  C --> D[Local Kinetics Proceed]
  A --> E[Local Temperature Differences]
  E --> F[Heat Transfer and Uniformity]
  F --> D
  D --> G[Reaction Completion]
  D --> H[Side Reactions]
  G --> I[End-Point Check]
  H --> J[Degradation Risk]
  I --> K[Hold Time Ends]
  J --> K
When mixing, temperature uniformity, and residence time are treated as a coupled system, the chemistry becomes predictable. The goal is not just to hit a setpoint, but to ensure the entire batch experiences conditions that make the intended reaction dominate.
3.5 Side Reactions and Degradation Pathways: Hydrolysis, Oxidation, and Color Formation
Side reactions are the quiet saboteurs of soap and detergent quality. They don’t always ruin a batch outright, but they shift key properties: free fatty acid rises, odor changes, color drifts, and performance tests slowly wander off target. The goal is to recognize the chemistry, then control the conditions that make the unwanted pathways easier than the desired ones.
Hydrolysis: When Water Turns Against You
Hydrolysis is the cleavage of esters or other susceptible bonds by water. In soap systems, the most common practical issue is the increase of free fatty acid (or free fatty acid equivalents) over time, especially when storage is warm or when water activity is higher than expected.
Start with the basics: triglycerides and related esters can hydrolyze; once free fatty acids are present, they can also participate in further reactions. In a batch, hydrolysis competes with saponification and can also continue after neutralization if conditions allow.
Key drivers are water availability, temperature, and the presence of catalysts. Even if the bulk formulation is “mostly water,” local pockets matter: poor mixing can create micro-zones with higher water activity. In bars, moisture ingress from humid storage can accelerate hydrolysis at the surface.
Example: A liquid detergent that meets pH and viscosity specs on day one shows a gradual rise in titratable free acid after several weeks at elevated warehouse temperatures. The likely pattern is ongoing hydrolysis, aided by higher water activity and warmer conditions.
Best-practice controls:
- Keep temperature controlled during reaction and neutralization, then avoid unnecessary heat soak during holding.
- Ensure thorough mixing before and after neutralization so water activity is uniform.
- Use incoming fatty feedstock with low moisture and low pre-existing free acid; document trends from supplier COAs and your own incoming tests.
Oxidation: Oxygen’s Slow Chemistry
Oxidation is the reaction of unsaturated components with oxygen, forming peroxides and secondary products that can affect odor and color. In soap and detergent manufacturing, oxidation is most relevant when fatty materials contain unsaturation and when oxygen exposure is high.
The pathway often starts with formation of radicals or peroxides, then progresses to aldehydes, ketones, and acids. These products can be detected indirectly through odor changes and color shift, and directly through peroxide-related assays where used.
Oxidation accelerates with heat, light, and oxygen availability. Agitation and pumping can increase oxygen dissolution in liquids. In bars, oxygen access is influenced by surface area and packaging permeability.
Example: Two batches use the same formulation, but one is processed with longer hold times at higher temperature. After storage, the “hot-hold” batch shows darker color and a sharper, stale odor. The chemistry is consistent with oxidation being favored by time and temperature.
Best-practice controls:
- Minimize residence time at elevated temperature.
- Reduce unnecessary aeration during transfers and mixing.
- Manage headspace and packaging permeability for finished goods, especially for products stored in warm or bright areas.
Color Formation: From Trace Chemistry to Visible Drift
Color formation is rarely a single reaction. It is usually the combined outcome of oxidation products, minor impurities, and reaction byproducts that absorb visible light. In soap systems, color can come from oxidized fatty components, colored contaminants in feedstocks, and reactions involving trace metals.
Trace metals such as iron and copper can catalyze oxidation, which then feeds color formation. Heat and pH can influence both the rate of oxidation and the solubility of colored species. In addition, some side products can undergo further reactions that increase chromophores.
A practical way to think about color is to separate it into two layers: formation and stabilization. Formation is how quickly colored species appear; stabilization is how well the formulation prevents them from growing or precipitating.
Example: A batch made with slightly higher metal content in the water shows faster darkening even though pH and viscosity match. The difference points to catalytic oxidation contributing to color development.
Best-practice controls:
- Control water quality and consider metal-relevant specifications where applicable.
- Monitor color as a quality attribute with consistent sampling and measurement timing.
- Track feedstock lot history; if color correlates with a supplier lot, investigate that lot’s impurity profile.
Integrated Control Logic for Side Reactions
The three pathways interact. Hydrolysis can increase free fatty acid, which can change micro-environments and affect how oxidation proceeds. Oxidation products can further influence color formation. That means control must be systematic: chemistry first, then process conditions, then verification.
Mind Map: Side Reaction Drivers and Outcomes
Practical Batch Verification Without Guesswork
Use a small set of measurements that map to each pathway. For hydrolysis, track titratable free acid or free fatty acid equivalents over time. For oxidation, pair odor observations with color trend data and, where available, peroxide-related indicators. For color formation, measure color consistently and correlate it with feedstock lots, water quality, and thermal history.
Example: If free acid rises while color stays stable, hydrolysis is likely dominant. If color darkens while free acid remains steady, oxidation and metal-catalyzed pathways are more likely. If both rise together, focus on temperature exposure, oxygen management, and mixing uniformity first.
The chemistry is manageable when you treat side reactions as measurable processes rather than mysterious “batch personality.” Keep conditions tight, verify with targeted tests, and the unwanted pathways become predictable enough to control.
4. Process Control Fundamentals for Chemical Manufacturing
4.1 Control Objectives: Product Quality, Throughput, and Consistent Batch-to-Batch Results
Control objectives in soap and detergent manufacturing are not separate goals you chase one by one. They are a single system: chemistry sets what “good” looks like, equipment sets what you can reliably do, and control makes the two meet every batch.
Product Quality as a Measurable Outcome
Product quality is the set of attributes that determine whether the cleaning product performs and behaves as intended. In practice, you translate “quality” into a small list of measurable targets and tolerances.
Start with chemical quality: free fatty acid or free alkali, active matter (surfactant content), and pH. Then add physical quality: viscosity for liquids, clarity or haze for transparent systems, and stability against separation or precipitation. Finally include performance indicators that connect to customer use: foam behavior, wetting, and rinsability.
A simple example: if a liquid detergent’s viscosity is low, it may still have correct pH and active content, but it can fail on shelf stability or dosing. That means viscosity is not “cosmetic”; it’s a control objective because it affects both usability and long-term behavior.
Throughput as a Constraint You Control, Not a Wish
Throughput is how much finished product you can make per unit time without breaking quality. In batch processes, throughput is driven by cycle time: heat-up, reaction time, mixing and hold time, and finishing steps. In continuous or semi-continuous operations, throughput is driven by residence time and stable feed rates.
Throughput control is often about avoiding idle time. For instance, if sampling and titration take too long, you may extend holds “just in case.” That protects quality but quietly reduces throughput. A better approach is to shorten decision time by defining sampling frequency, using validated endpoints, and ensuring instruments are calibrated so results are trustworthy.
Consistent Batch-to-Batch Results as Process Capability
Consistency means the same formulation and the same operating plan produce results within spec every time. Consistency is not guaranteed by good intentions; it comes from controlling the variables that actually move the quality attributes.
In soap and detergent systems, the usual suspects are water quality, temperature profile, mixing intensity, addition order, and neutralization endpoint control. Even when the recipe is identical, small deviations can shift phase behavior, reaction completion, and viscosity development.
Example: two batches use the same surfactant and builder, but one batch uses harder water. Calcium can interact with anionic systems and builders, changing solubilization and increasing haze risk. If your control objective includes clarity and stability, then water hardness becomes a controlled input, not an afterthought.
How Quality, Throughput, and Consistency Fit Together
A practical way to manage tradeoffs is to define control objectives in layers:
- Hard quality limits: attributes that must be within spec for release (for example, pH and free alkali/FFA).
- Soft quality targets: attributes that strongly influence performance or stability (for example, viscosity window and clarity).
- Efficiency objectives: cycle time targets that are allowed only when hard limits are met.
Then you choose control actions that reduce variability without unnecessary delays. If you can tighten temperature control, you may reduce the time needed to reach a reliable reaction endpoint, improving throughput while also improving consistency.
Mind Map: Control Objectives and Their Drivers
Example: Turning Objectives Into Control Decisions
Suppose your release spec requires pH 9.0–9.5 and viscosity 800–1200 mPa·s for a liquid detergent.
- Quality objective: keep pH within limits by controlling neutralization using a calibrated pH probe and a defined endpoint rule.
- Consistency objective: reduce batch-to-batch drift by standardizing addition order and mixing speed during neutralization, because incomplete mixing can create local pH pockets.
- Throughput objective: avoid long holds by using validated sampling intervals and an endpoint confirmation step that is fast enough to prevent unnecessary waiting.
If a batch lands at pH 9.48 but viscosity is low, you do not “fix pH harder.” You investigate the viscosity drivers: water content accuracy, temperature uniformity during viscosity build, and whether any ingredient addition was delayed or under-dispersed.
Practical Acceptance Criteria and Limits
Control objectives become real when they are tied to acceptance criteria. Define:
- Release checks: what must pass before packaging.
- In-process checkpoints: what must pass to continue the batch.
- Action limits: what triggers investigation or corrective action.
A good rule is to set action limits tighter than release limits. That gives you room to correct without producing off-spec product. It also keeps throughput from collapsing into “always rework” mode.
When these objectives are defined clearly, operators know what to control, analysts know what to measure, and engineers know what to improve. The plant runs less like a guessing game and more like a controlled chemistry experiment with a stopwatch.
4.2 Instrumentation Basics: Sensors, Transmitters, Controllers, and Final Control Elements
A control loop is only as good as the weakest link in its chain: the sensor that measures the process, the transmitter that converts the signal into something usable, the controller that decides what to do next, and the final control element that actually changes the process. In soap and detergent manufacturing, this chain is constantly dealing with messy realities: viscous fluids, foaming, temperature gradients, and chemical reactions that change properties as you watch them.
Sensors: Measuring the Process Without Lying
Sensors translate a physical or chemical condition into an electrical or other measurable signal. Common targets include temperature, pH, conductivity, level, flow, and pressure.
Temperature sensors are often the first choice because reaction rates are strongly temperature-dependent. A properly installed thermocouple or RTD should be immersed where the fluid is well mixed, not near a wall where heat transfer can bias readings. If you measure in a dead zone, the controller will “correct” based on a temperature that doesn’t represent the bulk.
pH sensors work well in aqueous systems but require stable reference conditions and routine calibration. In detergent formulations, high ionic strength and surfactant films can slow response or drift readings. A practical best practice is to verify pH probe slope and offset during scheduled calibration and to clean the bulb when you see sluggish response.
For conductivity and water hardness proxies, remember that conductivity reflects ionic content, not hardness directly. Still, it’s useful for monitoring trends and for detecting incoming water changes that would otherwise surprise your neutralization and viscosity.
Level measurement must handle foaming and splashing. Guided-wave radar or differential pressure can be more reliable than simple float switches when the tank surface behaves like a small weather system.
Transmitters: Converting Signals Into Control-Ready Data
A transmitter takes the raw sensor output and scales it into a standardized signal, typically 4–20 mA for analog loops or digital protocols for modern systems. This standardization matters because it reduces wiring sensitivity and makes troubleshooting more consistent.
A temperature transmitter might convert RTD resistance into a 4–20 mA signal representing °C. A pH transmitter might convert electrode potential into pH units and also provide diagnostics like electrode health or signal stability.
In practice, transmitters also help with noise. For example, a well-designed transmitter can filter short spikes caused by foam or pump pulsation, preventing the controller from chasing every wiggle.
Controllers: Turning Measurements Into Actions
Controllers compare the measured value to a setpoint and compute an output to drive the final control element. The most common control law is PID, which combines proportional, integral, and derivative actions.
Proportional control reacts to the current error. If your reactor temperature is 2 °C low, proportional action increases heating power immediately.
Integral control accumulates past error. This is what eliminates steady-state offset, such as when heat losses increase as the batch thickens.
Derivative control anticipates the trend by reacting to how fast the measurement is changing. It can reduce overshoot during heat-up, but it must be used carefully when signals are noisy.
A key best practice is to tune PID parameters for the actual process dynamics. In detergent mixing, viscosity can change during neutralization, shifting heat transfer and mixing efficiency. If you tune once and never revisit, the controller may become too aggressive or too sluggish.
Controllers also include safety logic: limits, interlocks, and permissives. For instance, heating should be inhibited if agitation fails, because localized hot spots can accelerate side reactions and degrade color.
Final Control Elements: Changing the Process
Final control elements convert the controller output into physical action. Typical examples include control valves for steam or cooling water, variable frequency drives for pumps and agitators, and dosing pumps for neutralizing agents.
A control valve’s behavior is not perfectly linear. Valve characteristics (like equal percentage) affect how the controller output maps to flow. If you ignore valve behavior, the loop may oscillate or respond unevenly.
Dosing pumps require attention to calibration and backflow. A common example is neutralization in a detergent batch: if the pump’s stroke volume drifts or if there’s residual pressure in the line, the delivered neutralizer can overshoot, pushing pH past the target and forcing corrective additions.
For steam heating, consider the valve position and steam pressure stability. A controller that assumes “more valve opening equals more heat” can be surprised when steam pressure fluctuates.
Mind Map: Instrumentation Chain for Soap and Detergent Control
Example: Temperature Control During Neutralization
Suppose you’re neutralizing an aqueous detergent concentrate and targeting 55 °C. The RTD measures temperature in the well-mixed region, the transmitter outputs 4–20 mA to the controller, and the controller drives a steam control valve.
If the RTD is placed near the wall, the reading may run hotter than the bulk. The controller then reduces steam, and the bulk temperature lags behind, slowing reaction completion. The batch ends up with inconsistent viscosity because the chemistry finished at a different effective temperature than intended.
With correct sensor placement and tuned PID parameters, the controller maintains temperature while respecting safety interlocks such as “steam allowed only when agitation is running.” The result is a stable loop that doesn’t treat foam-induced noise as a reason to keep changing steam flow.
4.3 Control Strategies: Feedback, Feedforward, Cascade, and Interlocks
Soap and detergent plants live in a world where chemistry and equipment both have opinions. Control strategies help you keep those opinions from turning into off-spec product. The core idea is simple: measure what matters, compare it to what you want, and act in a way that reduces the gap—while also preventing unsafe or obviously wrong actions.
Feedback Control
Feedback control uses the current measurement to correct the process. It’s the workhorse because it compensates for disturbances you didn’t model well.
A typical loop looks like this: measure pH, compare to setpoint, compute an error, and adjust a valve or dosing pump. In a detergent neutralization step, the measurement might be pH after mixing. If pH drifts low, the controller increases base dosing; if it drifts high, it reduces dosing.
Best practice: tune for stability, not speed. If you push too hard, you get oscillations—pH bouncing around the setpoint as the controller overcorrects. A practical approach is to start with conservative gains, then increase until the response is fast enough to reject disturbances without overshoot.
Easy example: During a batch, the incoming water temperature varies. Temperature affects reaction rate and pH drift. A feedback pH loop corrects the final pH by adjusting base addition even when the temperature changed.
Feedforward Control
Feedforward control acts before the error shows up, using a measurable cause. It’s useful when you can observe a disturbance early.
In detergent mixing, water hardness is a common disturbance. Hard water can consume builders and change effective alkalinity. If you measure hardness (or estimate it from incoming water analysis), you can adjust builder dosing ahead of time. That reduces the burden on the pH feedback loop.
Easy example: If hardness increases, increase chelant or builder dosage proportionally so the pH and cleaning performance land closer to target without waiting for the pH probe to react.
Best practice: feedforward should be paired with feedback. Feedforward reduces the size of the correction; feedback still handles unmodeled effects like measurement noise, mixing delays, or ingredient variability.
Cascade Control
Cascade control splits the job into two loops: a primary loop sets a target for a secondary loop. This improves response when the secondary variable reacts faster than the primary.
In a reactor, you might control product temperature (primary) by manipulating steam valve position (secondary). The primary loop computes the desired heat duty or steam flow based on reactor temperature error. The secondary loop then drives steam flow to its setpoint.
Why it works: steam flow responds quickly, while reactor temperature changes more slowly due to heat transfer and mixing. Cascade prevents the primary loop from “waiting” for a sluggish actuator.
Easy example: Suppose you want to hold reactor temperature at 80°C during saponification. If you only use feedback on temperature, the controller may react late and overshoot. With cascade, the steam flow loop corrects immediately when temperature begins to drift.
Best practice: ensure the secondary loop is tuned and stable on its own. If the inner loop oscillates, the outer loop will chase it and make things worse.
Interlocks
Interlocks are not about optimization; they are about preventing bad outcomes. They override normal control when certain conditions are unsafe or physically impossible.
In chemical mixing, interlocks commonly include:
- Preventing heating when agitation is off, to avoid hot spots and localized degradation.
- Stopping dosing when the reactor level is below a safe minimum.
- Blocking base addition when pH probe diagnostics indicate invalid readings.
Easy example: If the pH probe signal is flagged as unreliable, the pH controller might otherwise dose aggressively based on noise. An interlock can switch the system to a safe mode, such as pausing dosing and requiring operator verification.
Interlocks should be designed with clear states: normal control, alarm, safe shutdown, and manual override rules. The goal is predictable behavior under abnormal conditions.
Mind Map: Control Strategies in Cleaning Product Manufacturing
Integrated Example: Neutralization with All Four Strategies
Imagine a batch neutralization step for a liquid detergent. You want final pH at 8.0.
- Feedback: A pH controller adjusts base dosing based on the pH measurement after mixing.
- Feedforward: You measure incoming water hardness and adjust initial builder or chelant dosage so the pH trend starts closer to target.
- Cascade: If base addition affects temperature, you can cascade temperature control by using a temperature loop that sets a steam or cooling duty target while the pH loop continues dosing.
- Interlocks: If agitation fails, heating and dosing pause. If the pH probe is invalid, dosing pauses and the system enters a safe hold.
The result is not just “more control,” but better division of labor: feedback corrects what you can’t fully predict, feedforward reduces the correction needed, cascade improves actuator responsiveness, and interlocks prevent the controller from doing the wrong thing when the measurements or conditions are unreliable.
4.4 Defining Control Parameters: Setpoints, Limits, Alarms, and Control Narratives
Control parameters turn “we want good soap/detergent” into numbers the plant can act on. The trick is to define them in a chain: first the quality target, then the process variable that best represents progress, then the allowable range, and finally the alarm logic that tells operators what to do next.
Setpoints
A setpoint is the value the controller tries to hold. It should come from a quality requirement, not from habit. For example, if a liquid detergent must stay clear and stable, you may target a specific viscosity window at filling temperature. That viscosity is influenced by temperature, concentration, and neutralization progress, so you pick the most controllable proxy variable.
Example: During neutralization, you can set a pH setpoint for the end-point. If the formulation requires pH 7.5–8.0 at 25°C, you choose a setpoint of 7.7 at the measurement temperature. If your pH probe reads differently at other temperatures, you compensate in the measurement method so the setpoint stays meaningful.
Setpoints also need a strategy for transitions. A common approach is staged setpoints: one during heat-up, another during reaction, and a final one during hold. This prevents the controller from chasing noise while the system is still changing quickly.
Limits
Limits define what is acceptable. Use at least two layers: operational limits (what you can run within routinely) and safety or regulatory limits (what you must not exceed). Operational limits are tied to product quality and equipment protection; safety limits are tied to hazards.
Example: For a reactor with an exothermic neutralization, you might set:
- Operational temperature limit: 85°C (above this, viscosity and color drift)
- Safety temperature limit: 95°C (above this, you trigger emergency cooling and stop addition)
Operational limits should be wide enough to avoid constant nuisance trips, but narrow enough to catch real drift early. If you find yourself resetting limits frequently, it usually means the underlying model or measurement is wrong.
Alarms
Alarms are not just warnings; they are decision points. A good alarm tells you which action is expected and how urgent it is.
A practical alarm ladder:
- Advisory alarm: indicates trend movement toward a limit; operators can investigate without stopping.
- Action alarm: indicates the process is likely to violate limits soon; operators must adjust or escalate.
- Trip alarm: indicates a hard boundary; the system takes protective action.
Example: Suppose neutralization pH is drifting upward due to under-dosing. You can set:
- Advisory: pH deviates by 0.2 units for 5 minutes
- Action: pH deviates by 0.4 units for 2 minutes
- Trip: pH exceeds 9.0 or addition valve fails closed/open depending on the hazard assessment
To keep alarms useful, define alarm conditions using time and rate, not just instantaneous values. A pH probe can momentarily spike during mixing changes; alarms should reflect sustained deviation.
Control Narratives
A control narrative is a plain-language description of how the loop behaves and what humans should do when it doesn’t. It connects setpoints, limits, alarms, and the operator’s next step.
A strong narrative includes:
- Normal objective: what the loop controls and why.
- Measurement basis: which sensor and how it is validated.
- Manipulated variable: what the controller changes (valve, pump speed, steam, cooling water).
- Expected dynamics: how quickly the variable should respond.
- Alarm response: what to check first, what to adjust, and when to stop.
Example narrative for neutralization pH control:
- Objective: hold pH at 7.7 during final neutralization to meet stability specs.
- Measurement: pH probe with temperature compensation; probe cleaning verified each batch.
- Manipulated variable: caustic dosing pump rate.
- Expected dynamics: pH should move at least 0.1 units within 3 minutes after a dosing change.
- Advisory alarm response: verify mixing speed and probe stability; confirm dosing tank level and calibration.
- Action alarm response: switch to slower dosing mode, re-check titration sample, and pause addition if sample confirms mismatch.
- Trip response: stop dosing and initiate cooling if pH exceeds 9.0 or temperature exceeds safety limit.
Mind Map: Control Parameters and Their Relationships
Worked Example: Defining Parameters for a Liquid Detergent Neutralization Step
Start with the quality target: final pH at filling temperature must be 7.7 ± 0.3. Choose the control variable: reactor pH at 25°C equivalent. Set the setpoint to 7.7.
Next define operational limits: if pH goes above 8.3, you expect haze risk and viscosity drift, so operational high limit is 8.3; operational low limit is 7.4. Then define safety limits: if pH exceeds 9.0, the formulation and equipment materials are at risk, so safety high limit is 9.0.
Finally define alarms:
- Advisory high: pH > 8.1 for 5 minutes
- Action high: pH > 8.3 for 2 minutes
- Trip high: pH > 9.0 immediately triggers stop dosing and cooling
Write the narrative so an operator knows what to do at each rung: check mixing, confirm probe health, verify dosing rate, then decide whether to correct with slower dosing or pause for sampling.
When setpoints, limits, alarms, and narratives are consistent, the control system becomes predictable. Predictability is what lets you run repeatable chemistry without turning every batch into a detective story.
4.5 Data Integrity and Traceability: Batch Records, Calibration, and Audit Readiness
Data integrity is what turns “we made it” into “we can prove we made it the way we said we did.” In soap and detergent manufacturing, the proof lives in batch records, calibration status, and the ability to reconstruct what happened when something goes off-spec.
Foundational Principles of Data Integrity
Start with the idea that data must be complete, accurate, and attributable. “Complete” means every required measurement and decision point is captured, not just the ones that look good. “Accurate” means the numbers reflect the actual readings, not manual guesses. “Attributable” means you can identify who recorded or changed a value and when.
A practical example: during neutralization, operators record pH and temperature every defined interval. If the batch record shows pH values but the temperature field is blank for two intervals, you cannot confidently interpret whether the pH drift came from chemistry or from poor heat control.
Batch Records That Actually Work
A batch record should be a guided path, not a paperwork afterthought. Use a structure that mirrors the process: raw material receipt, charging order, reaction conditions, sampling, in-process checks, and final release steps.
Best practice: define “critical to quality” steps and make them explicit in the record. For instance, free alkali or free fatty acid targets are critical for performance and stability. The record should include the sampling method, titration setup, acceptance criteria, and the calculated result.
Example workflow for a liquid detergent batch:
- Record lot numbers for each surfactant and builder.
- Record addition order and timestamps.
- Record mixing speed and temperature setpoints and actual values.
- Record titration results for neutralization endpoint.
- Record any deviations and the disposition decision.
If a deviation occurs, the record should capture the facts first: what changed, when it was noticed, what was measured, and what action was taken. Then it captures the decision: accept, rework, or reject, with the rationale tied to specifications.
Calibration as a Traceability Backbone
Calibration links instruments to trustworthy numbers. Without it, batch records become stories with no measurement foundation.
Treat calibration as a system, not a sticker. Each instrument used in critical measurements should have:
- A defined calibration frequency based on risk and history.
- A calibration method and acceptance criteria.
- A clear status indicator that prevents use of out-of-tolerance devices.
- Traceability to reference standards.
Example: if a pH probe is out of calibration and still used, the batch record may show “correct” pH values while the true pH is off. That can cascade into wrong neutralization, poor viscosity development, and later stability issues.
A simple control: before starting a batch, verify instrument status for pH, temperature, and any flow or scale measurements used for critical additions.
Audit Readiness Through Reconstruction
Audit readiness means you can reconstruct the batch quickly and consistently. Auditors typically ask three questions: What did you do? How do you know it happened? What did you do when it didn’t go as planned?
To answer these, ensure batch records are:
- Legible and complete.
- Signed or electronically authorized at required steps.
- Backed by raw data where applicable (instrument printouts, titration worksheets, and calculation sheets).
- Consistent with deviations, CAPA actions, and release decisions.
Use a “traceability chain” mindset: ingredient lot → batch record entry → in-process measurement → calculation → final specification result.
Example: if a powder batch fails dissolution, you should be able to trace which zeolite lot was used, what water content and mixing conditions were recorded, and whether any instrument readings were later found to be questionable.
Handling Changes, Corrections, and Deviations
Corrections should preserve the original entry and show what changed and why. If a value is corrected, the record should include the reason and the supporting evidence.
Example correction: an operator enters the wrong titration factor. The correction should reference the verified factor from the calibration record or approved method worksheet, not a vague note like “fixed.”
For deviations, keep the timeline tight: detection time, immediate containment, root cause investigation steps, and final disposition. Even when the root cause is still under review, the disposition must be based on measured impact to quality.
Mind Map of Batch Integrity Controls
Mind Map: Data Integrity and Traceability
A Compact Example of Traceability in Practice
Imagine a detergent batch where viscosity is low at release. The investigation starts with the traceability chain:
- Ingredient lots: check surfactant and polymer lots used.
- Neutralization: review pH and temperature records at endpoint.
- Calibration: confirm pH probe calibration was valid during the batch.
- Calculations: verify titration results and neutralization math.
- Deviations: check whether any mixing or temperature control deviation occurred.
If the pH probe was calibrated on 2026-04-12 and the calibration status remained valid through the batch date, the team can focus on formulation and process conditions rather than questioning the measurement system.
When batch records, calibration, and deviation handling work together, traceability becomes routine. It stops being a scramble during audits and becomes a normal way to keep product quality consistent.
5. Soap Manufacturing: Saponification, Neutralization, and Finishing
5.1 Batch vs. Continuous Soap Processes: Practical Selection Considerations
Soap plants usually start with a simple question: do we want predictable, flexible batches, or steady, high-throughput continuous operation? The chemistry is similar either way—fat hydrolysis or saponification, neutralization, and finishing—but the process control, equipment choices, and troubleshooting paths differ.
Foundational Differences That Drive Selection
Batch processing loads a reactor, runs the reaction to an endpoint, then discharges and cleans for the next run. This structure makes it easier to change formulations, adjust for variable feedstock, and investigate a single lot when quality drifts.
Continuous processing feeds reactants and removes product continuously, aiming for steady-state operation. This structure can reduce downtime losses and improve consistency when raw materials are stable and the control system is well tuned.
A practical way to decide is to match the process style to the variability you expect. If fatty feedstock composition and moisture swing significantly, batch operation gives you more chances to correct within a run. If inputs are tightly controlled and demand is steady, continuous operation can keep production smoother.
Mind Map: Batch vs Continuous Selection
Practical Selection Criteria with Concrete Examples
1) Formulation change frequency
If you make multiple soap grades—say a high-hardness bar and a softer syndet-like bar—batch is often simpler. Example: you can run the high-hardness recipe today, then switch to a different fatty blend tomorrow by adjusting charge composition and neutralization targets without re-commissioning a continuous line.
Continuous can still work, but you typically need either frequent product changeovers with careful flushing or a parallel strategy. That adds operational overhead and increases the chance of cross-contamination between recipes.
2) Feedstock variability
Imagine two deliveries of tallow: one has higher free fatty acid (FFA) and moisture. In batch, you can compensate by adjusting neutralization based on titration results and by extending reaction time if needed. In continuous, the same variability can shift the effective stoichiometry and alter soap yield and color, especially if the control system relies on stable input assumptions.
3) Throughput and downtime tolerance
If your downstream finishing and packaging lines can only accept product at a steady rate, continuous operation can reduce bottlenecks. Example: a continuous soap line feeding a continuous milling and drying step can keep the downstream equipment from idling.
If your packaging is flexible and you can buffer with holding tanks, batch downtime becomes less painful. You can also schedule cleaning and maintenance during planned production windows.
4) Quality acceptance criteria and how fast you can measure
Batch systems shine when key quality attributes are confirmed by offline tests that take time. Example: you might titrate free alkali and free fatty acid after neutralization to verify the endpoint. If results are slightly off, you can adjust the next batch.
Continuous systems benefit when you can measure and control in real time. Example: online conductivity and pH can help stabilize neutralization so the product exits closer to spec without waiting for lab results.
Control and Troubleshooting Differences
Batch troubleshooting often starts with “where did the batch drift?” If a bar is hazy, you check mixing adequacy, temperature history, and neutralization stoichiometry for that specific run. Because the batch is a contained experiment, you can correlate deviations to a particular charge.
Continuous troubleshooting starts with “what changed in the system?” If haze increases across multiple hours, you look for flow-rate drift, sensor fouling, or changes in feed composition. The same defect can be caused by a small control bias that persists, so you investigate trends rather than single-point events.
A Practical Decision Shortcut
Choose batch when you need flexibility, expect variable feedstock, or rely on offline verification for critical endpoints.
Choose continuous when you have stable inputs, steady demand, and the ability to control residence time and neutralization with reliable instrumentation.
In both cases, the best selection is the one that makes your control strategy match your measurement reality. Chemistry sets the rules; process design decides how well you can enforce them.
5.2 Saponification Setup: Reactor Loading, Heat-Up, and Agitation Requirements
Saponification is a controlled conversion of triglycerides (or fatty acid derivatives) into soap (fatty acid salts) plus glycerol. The setup phase determines whether the reaction proceeds evenly, finishes on time, and produces soap with predictable yield and quality. Think of it as three linked chores: loading the right materials in the right order, bringing the mixture to the right temperature profile, and keeping the phases from separating while the chemistry catches up.
Reactor Loading Foundations
Start with a clean, dry reactor and verified utilities. Residual water can dilute alkali, shift stoichiometry, and create unexpected viscosity during heat-up. Confirm that seals, agitator seals, and any steam or heating coils are leak-free, then verify that temperature and level instruments are calibrated.
Next, plan the loading sequence. For batch soap, a common approach is to charge the fatty feedstock first (or a controlled portion), then add aqueous alkali gradually. Gradual addition reduces local excess alkali, which otherwise drives faster side reactions and can increase color. If you use a pre-melt or pre-heated fat, keep it below the point where you risk excessive oxidation or darkening.
Stoichiometry is not just a spreadsheet number. The alkali solution concentration affects boiling behavior and mixing load. If your alkali is more concentrated, it will raise the reaction mixture temperature faster during addition, but it also increases the chance of localized overheating. A practical check is to calculate expected heat of reaction and boiling risk, then set an addition rate that keeps the temperature rise within your control band.
Heat-Up Requirements and Temperature Profiles
Heat-up has two goals: reach reaction temperature and avoid temperature gradients. Soap systems often show strong viscosity changes as temperature rises, so the same agitation setting that works at 60°C may be inadequate at 80°C.
Use a staged profile. First, warm the fat to a workable temperature for pumping and mixing. Then begin alkali addition while maintaining a controlled ramp. During addition, monitor temperature continuously and watch for signs of boiling or foaming. If foaming appears, reduce addition rate and check whether the alkali concentration or dissolved gases are contributing.
A useful operational rule is to treat temperature as a proxy for mixing quality. If temperature climbs faster than expected, it may indicate poor heat transfer or uneven distribution of alkali. If temperature stalls, it can mean the mixture is absorbing heat through evaporation or that agitation is insufficient to bring reaction zones into contact with the bulk.
Agitation Requirements for Uniform Reaction
Agitation prevents three common problems: incomplete mixing, phase separation, and localized overreaction. In saponification, you’re managing a moving target: as alkali dissolves and soap forms, viscosity and interfacial behavior change.
Select agitation based on the reactor geometry and the expected viscosity range. Start with a moderate speed during fat melt to ensure uniform temperature, then increase as viscosity rises to maintain suspension and reduce dead zones. Avoid running at maximum speed immediately; high shear early can increase emulsification and make endpoint sampling harder.
Baffles and impeller type matter. Baffles reduce vortexing and improve radial mixing, which is important when alkali is being added. If your system has a top-mounted agitator, confirm that the impeller clearance and submergence are appropriate at the lowest batch level.
A practical way to verify mixing adequacy is to observe temperature uniformity. If thermocouples at different heights show persistent offsets during alkali addition, you likely have insufficient circulation. Adjust agitation or addition rate, then re-check.
Example: Controlled Alkali Addition in a 2,000-L Batch
Suppose you charge melted fat and begin heating to a target reaction temperature. You then prepare an aqueous alkali solution at a known concentration. During addition, you keep agitation running and add alkali over a fixed time window rather than all at once.
- If the temperature rises too quickly, slow the addition and confirm that steam flow or heating power is not overshooting.
- If the mixture becomes too thick before the alkali is fully dispersed, increase agitation and extend the addition time so the reaction stays uniform.
- If you see persistent haze or delayed clarity, it often points to mixing issues during the early stage rather than a later chemistry problem.
Mind Map: Saponification Setup Controls
Practical Checklist for the Setup Phase
Before starting alkali addition, confirm that you have: a defined addition rate, a temperature ramp plan, an agitation setting that covers the expected viscosity rise, and a monitoring method that can detect uneven mixing early. During addition, treat deviations as signals. Temperature spikes usually mean local alkali concentration or heat overshoot; temperature lag usually means heat loss through boiling or insufficient circulation. When the setup is stable, the chemistry behaves predictably, and the rest of the batch becomes a matter of disciplined endpoint control.
5.3 Neutralization and Salt Management: Free Fatty Acid Control and Yield Optimization
Neutralization turns fatty acids into salts (soap) and sets the product’s pH, texture, and stability. Salt management is the practical art of making that conversion complete enough to meet specs, while avoiding excess neutralizing agent that wastes cost and can harm performance.
Foundational Concepts: What Neutralization Actually Changes
Fatty acids exist as a mixture of chain lengths and degrees of saturation. During neutralization, the acid’s carboxyl group reacts with an alkali (commonly NaOH or KOH) to form a carboxylate salt. This salt is the “soap” that drives cleaning and controls how the batch behaves during cooling and finishing.
Two measurements guide the process. Free fatty acid (FFA) indicates how much acid remains unconverted. Free alkali indicates how much alkali remains after conversion. In well-controlled batches, FFA is low and free alkali is near zero, but the exact targets depend on formulation and downstream steps.
Stoichiometry and Practical Targets
Start with stoichiometry: calculate the theoretical alkali needed to neutralize the acid value of the fatty feed. Then account for losses and measurement uncertainty. A common best practice is to run a small “neutralization check” early in the batch: sample, titrate for FFA, and adjust the remaining alkali addition rather than guessing the full amount.
Example: If titration shows higher FFA than expected, you add alkali in small increments, mixing thoroughly between additions. If FFA is already low, you stop adding alkali even if the initial calculation suggested more. This prevents free alkali from creeping upward.
Neutralization Control Loop: Temperature, Mixing, and Addition Order
Neutralization is not just chemistry; it’s also heat and mass transfer. Alkali addition can locally spike pH and temperature, which may change reaction rate and soap structure. Use controlled addition (slow feed) and ensure agitation keeps the reactor uniform.
A practical sequence:
- Heat fatty phase to a stable reaction temperature.
- Start mixing at a level that prevents stratification.
- Add alkali gradually while monitoring pH and temperature.
- Take an intermediate sample for FFA titration.
- Complete neutralization based on the sample result, not only on time.
If pH rises quickly early, it can indicate either low FFA or poor mixing. Confirm with titration before concluding the batch is “done.”
Salt Management: Why Yield Depends on More Than Conversion
Yield optimization is often framed as “maximize conversion,” but salt management adds nuance. Excess alkali can increase free alkali, which may require additional finishing steps or can cause softer bars and haze. Too little neutralization leaves FFA, which can reduce cleaning performance and create graininess.
Salt type matters too. Sodium salts tend to behave differently from potassium salts in solubility and hardness. Even within sodium systems, the distribution of fatty chain lengths affects how the salt crystallizes during cooling.
A useful operational approach is to manage three balances:
- Chemical balance: FFA to alkali conversion.
- Physical balance: soap salt crystallization and phase behavior.
- Process balance: how much material you can keep in the desired phase without excessive losses during salting-out, milling, or drying.
Managing Free Fatty Acid: Sampling and Acceptance Criteria
FFA control is best handled with a sampling plan that matches your batch size and mixing performance. Sample after the bulk of alkali is added, then again near the end. Titrate promptly and record the method details so results are comparable across shifts.
Example acceptance logic:
- If FFA is above target, continue neutralization in small increments.
- If FFA is within target but free alkali is trending high, stop additions and hold mixing briefly to homogenize.
- If both are off, investigate feedstock acid value accuracy and mixing effectiveness before making large corrections.
Avoiding Free Alkali: The “Stop Adding” Discipline
Free alkali is the classic way to lose money quietly. It can also push the batch toward unwanted texture and can complicate finishing. The best practice is to treat the final neutralization as a controlled adjustment, not a full “top-up.”
Example: Suppose you planned to add 100% of calculated alkali. After the intermediate titration, you find FFA already low. You reduce the remaining addition to 20–30% of the planned remainder, then confirm with a final titration. This keeps the batch near the sweet spot without overshooting.
Yield Optimization Through Finishing Compatibility
Neutralization affects how soap behaves in later steps. If neutralization is incomplete, the batch may separate differently during salting-out or may not mill cleanly. If neutralization is excessive, you may see increased softness or haze that forces rework.
A practical integration step is to link neutralization targets to downstream observations. For instance, if your milling torque is consistently higher than normal, it can correlate with higher FFA or altered crystallization. Use that as a signal to review neutralization data, not as a reason to “turn up” mechanical settings.
Mind Map: Neutralization and Salt Management
Quick Example Workflow: From Calculation to Final Adjustment
- Calculate theoretical alkali from measured acid value.
- Heat and mix to ensure uniform conditions.
- Add alkali gradually until pH approaches the expected neutralization region.
- Sample and titrate for FFA.
- If FFA is high, add alkali in small increments and mix between additions.
- If FFA is low, stop additions early and confirm with a final titration.
- Proceed to finishing with targets met for both FFA and free alkali.
This workflow keeps the batch on-spec while protecting yield, because the final decision is based on measured conversion rather than optimistic calculations.
5.4 Soap Finishing Operations: Salting-Out, Milling, Plodding, and Drying (Where Applicable)
Soap finishing turns a reactive, still-wet mass into a stable, uniform bar or flake. The key idea is simple: you control water, structure, and particle size so the final product holds together, releases cleanly, and rinses predictably.
Salting-Out
Salting-out is the step where you reduce soap solubility so the soap separates from the aqueous phase. In practice, you add a salt (often sodium chloride) to a soap “kettle” mixture containing soap and water. As salt concentration rises, the soap phase becomes less soluble and forms a curd.
A practical control point is the salt addition rate. If you dump salt in too fast, you can get uneven curd formation and later streaks or soft spots. If you add too slowly, you waste time and risk more hydrolysis or color drift. Operators often watch the mixture’s clarity and curd texture, then confirm with a quick sample check.
Water management matters here. The curd’s water content sets up everything downstream: too wet leads to weak bars and long drying times; too dry makes milling harder and can trap uneven structure. A useful rule of thumb is to aim for a curd that can be handled and processed without smearing, while still feeling “plastic” rather than brittle.
Milling
Milling breaks the soap curd into a consistent, workable mass. The goal is uniform particle size and a smooth texture, which improves bar hardness and reduces surface defects.
During milling, temperature control is critical. Soap is sensitive to heat: excessive temperature can soften the mass and increase the risk of uneven mixing, while too low a temperature can make the curd resist deformation and cause poor dispersion. Agitation and pressure settings should be tuned so the mass becomes homogeneous without introducing excessive air.
A concrete example: if a batch shows gritty feel after cutting, it often traces back to insufficient milling intensity or inconsistent curd water. Increasing milling time can help, but only if water content is also corrected; otherwise you may just grind wet lumps into smaller lumps.
Plodding
Plodding extrudes the milled soap into strands or ribbons, then shapes it for cutting. This step is where consistent rheology pays off. If the soap mass is too stiff, extrusion can tear or create voids. If it is too soft, strands can slump and lose dimensional stability.
Operators typically manage plodder temperature and feed consistency. A steady feed prevents pressure fluctuations that show up as surface waves or thickness variation. If you see repeating ridges along bars, check for intermittent feed or inconsistent milling moisture rather than blaming the cutter.
Plodding also sets up the next stage: the strand’s surface quality affects drying uniformity. Smooth strands dry more evenly, which reduces warping and cracking.
Drying (Where Applicable)
Not every soap format needs the same drying intensity, but most solid soaps benefit from controlled moisture removal. Drying reduces water to a target level that supports hardness and shelf stability.
Drying is a mass-transfer problem: water must leave the soap without creating internal stress. If drying is too aggressive early on, the outer layer can harden while the interior remains wet, leading to cracks or uneven shrinkage. If drying is too gentle, you extend cycle time and may allow quality drift from prolonged exposure.
A systematic approach is to control airflow and temperature while monitoring moisture. For example, start with moderate conditions to let moisture migrate outward, then finish with slightly stronger drying once the surface is stable. The endpoint is not “time served,” but reaching a moisture target that matches your bar design.
Integrated Mind Map
Soap Finishing Operations Mind Map
Example Workflow with Reasoned Checks
- Salting-out: Add salt at a controlled rate until curd forms evenly. If curd appears patchy, pause and correct addition behavior before proceeding.
- Milling: Adjust temperature and milling intensity to achieve a smooth, consistent mass. If the milled soap feels gritty, verify curd moisture and milling settings together.
- Plodding: Ensure steady feed and appropriate softness so strands extrude cleanly. If you see thickness variation, check feed consistency first.
- Drying: Use a moisture-driven endpoint. If cracking occurs, reduce early drying intensity and improve airflow uniformity.
This sequence keeps cause-and-effect tight: water control at salting-out supports milling, milling supports extrusion, and extrusion supports drying uniformity. When each step is tuned to the next, the final bar tends to be consistent without heroic rework.
5.5 Troubleshooting Soap Batches: Soft Bars, Haze, Excess Free Alkali, and Odor Issues
Soap bars are simple in concept and picky in practice. Most defects trace back to a few controllable variables: reaction completion, neutralization balance, cooling and crystallization, and contamination. Use a structured approach so you fix the cause, not just the symptom.
Start with a Fast Diagnostic Checklist
Before changing anything, record what you can measure and what you can see.
- Batch history: temperatures reached, hold times, order of addition, and any deviations.
- Titration results: free fatty acid (FFA) and free alkali (if you track both).
- Appearance: haze level, clarity, color shift, and surface texture.
- Bar feel: softness at room temperature, tackiness, and brittleness.
- Odor: timing (during cook vs after curing) and whether it resembles rancid oil, solvent-like notes, or sulfurous notes.
A useful rule: softness and odor often point to chemistry or incomplete processing, while haze often points to crystallization, water balance, or impurities.
Mind Map of Common Defects and Root Causes
Soft Bars: What to Check and How to Fix
Soft bars usually mean the bar matrix lacks the right balance of soap crystals and solid fatty components.
Likely causes
- Incomplete saponification leaves unsaponified triglycerides or fatty fractions that behave like plasticizers.
- Neutralization imbalance can leave excess FFA, which can reduce firmness.
- Too much retained water keeps the bar from setting into a stable crystalline structure.
Practical checks
- Compare FFA and free alkali to your acceptance targets. If FFA is high, prioritize reaction completion and neutralization.
- Inspect the cook: if the mixture never reached a consistent, workable clarity before finishing, you may have incomplete reaction.
Fixes
- If FFA is high, verify heat-up profile and residence time and ensure mixing was sufficient to prevent cold zones.
- If water retention is high, review salting-out and draining steps and confirm the drying stage is reaching the expected moisture reduction.
Haze: From Crystallization to Impurities
Haze is often a crystallization and composition story. Soap can be clear when crystals form in a controlled way; it turns cloudy when crystals are too small, too numerous, or mixed with undissolved material.
Likely causes
- Cooling too quickly can trap microcrystals and create persistent cloudiness.
- Incomplete dissolution before cooling leaves fatty fractions that scatter light.
- Hard water salts can contribute to clouding, especially if electrolyte levels shift.
Practical checks
- Note whether haze appears immediately after molding or after curing. Immediate haze points to dissolution or cooling; delayed haze points to crystallization behavior.
- If you have water quality data, compare the batch’s water hardness and any changes in supplier.
Fixes
- Standardize mixing and temperature before cooling so the soap phase is uniform.
- Control cooling rate and avoid temperature gradients across the kettle or mold.
Excess Free Alkali: The “Harshness” Problem
Excess free alkali is both a performance and safety concern. It can cause skin irritation and can also destabilize the bar’s surface.
Likely causes
- Under-neutralization from incorrect stoichiometry or missed endpoint.
- Sampling or titration errors, including poor mixing before sampling.
- Temperature effects that shift pH readings if you titrate at inconsistent temperatures.
Practical checks
- Confirm titration method consistency: same sample handling, same endpoint logic, and calibrated reagents.
- Review the order of addition. Adding neutralizing agent into a locally high-pH zone can create uneven neutralization.
Fixes
- Recheck neutralization calculations and ensure the batch is mixed thoroughly before and during neutralization.
- If free alkali is confirmed high, adjust the neutralization step in the next batch using the measured deviation, not guesswork.
Odor Issues: Rancidity, Residues, and Moisture
Odor is the defect that gets noticed first, and it often points to raw material quality or processing temperature history.
Likely causes
- Rancid fats or oxidized fatty acids introduce fatty, stale notes.
- Overheating or long holds promote oxidation during cook.
- Residual cleaners or detergents in tanks can leave odd, lingering smells.
- Poor drying traps moisture and can intensify odors.
Practical checks
- Smell samples at multiple points: after cook, after salting/finishing, and after curing. If odor increases after curing, moisture or trapped volatiles are likely.
- Compare odor intensity to batch temperature history and any deviations in heat-up or hold time.
Fixes
- Tighten incoming raw material checks for freshness and storage conditions.
- Reduce unnecessary high-temperature time and ensure the reactor is clean before charging.
- Confirm drying targets and verify that bars are not packaged before moisture drops.
A Simple Decision Path You Can Use on the Floor
- If softness + high FFA: focus on saponification completion and neutralization balance.
- If haze appears early: focus on dissolution uniformity and cooling rate.
- If free alkali is high: focus on titration accuracy and neutralization mixing.
- If odor is strong and grows after curing: focus on drying and residual contamination.
When you correct a batch, document the exact change and the measured outcome. Soap defects are rarely random; they are usually consistent with a specific process or chemistry mismatch.
6. Detergent Manufacturing: Formulation Design and Reaction Integration
6.1 Formulation Building Blocks: Surfactants, Builders, and Performance Additives
A detergent or soap formula is a system, not a list of ingredients. Surfactants do the heavy lifting for soil removal, builders manage water and improve surfactant performance, and performance additives fix the details: stability, appearance, odor control, and compatibility with fabrics and surfaces. The practical goal is to choose each building block so it helps the others instead of fighting them.
Surfactants: The Cleaning Engine
Surfactants contain a water-loving part and an oil/soil-loving part. In water, they assemble into structures that can wet surfaces, emulsify grease, and keep dirt suspended so it rinses away.
Start with surfactant type because it drives behavior:
- Anionic surfactants (often used for strong grease removal) tend to perform well in many formulations but can be sensitive to water hardness and certain additives.
- Nonionic surfactants (often used for solubilization and mildness) can improve clarity and reduce sensitivity to hardness, though they may be less aggressive on their own.
- Cationic surfactants are usually limited by compatibility because they can interact with anionic surfactants.
- Amphoteric surfactants often help with mildness and foam control, and they can improve formulation flexibility.
A simple example: if you are making a liquid cleaner for kitchen grease, you typically need a surfactant package that can emulsify oils and remain stable at the target viscosity. If you choose only a single surfactant, you may get either poor grease removal or poor stability. Combining an anionic base with a nonionic co-surfactant often improves both wetting and solubilization.
Key formulation checks for surfactants include:
- Critical micelle concentration behavior: you want enough active to form micelles at use concentration.
- Foam profile: too much foam can be a nuisance in some applications, while too little can reduce perceived cleaning.
- Compatibility: surfactants must work with builders, polymers, enzymes, and preservatives without causing phase separation.
Builders: Water Management and Performance Boost
Builders reduce the negative impact of hard water and help surfactants work more effectively. Hard water contains calcium and magnesium ions that can reduce surfactant performance and promote scum or haze.
Common builder roles:
- Chelation: binds metal ions so they cannot interfere with surfactant action.
- Precipitation control: converts hardness ions into less problematic forms.
- pH control: many cleaning systems rely on alkaline conditions to improve soil removal, especially for fatty soils and protein soils.
A practical example: suppose your target is a laundry detergent liquid. If your water source is hard, a formula that works in soft water can show reduced cleaning and increased residue. Adding a builder system that chelates calcium and magnesium can restore performance without changing the surfactant level.
Builders also affect viscosity and clarity. Some builder salts can increase ionic strength and change how polymers thicken. That means builder selection is not just chemistry; it is also process and physical behavior.
Performance Additives: The Details That Make It Usable
Performance additives tune the formula for real-world use. They are chosen based on the product type and the failure modes you want to prevent.
Common additive categories include:
- Thickeners and rheology modifiers: help liquids stay uniform and reduce separation. A typical approach is to pick a polymer that hydrates at the right temperature and does not destabilize surfactant micelles.
- Solubilizers and hydrotropes: support dissolution of fragrance, dyes, and certain actives, especially in concentrated liquids.
- Anti-redeposition agents: keep loosened soil from reattaching to fabrics or surfaces.
- Enzyme stabilizers: protect enzymes from pH extremes and shear during manufacturing and storage.
- Chelants and corrosion inhibitors: protect metal parts in equipment and reduce unwanted reactions.
- Preservatives: control microbial growth in aqueous products.
A concrete example for additive timing: enzymes are often sensitive to pH and temperature. If you add them too early, they may lose activity during heat-up or neutralization. If you add them too late, you may trap them in a partially mixed region. A controlled order of addition plus a defined hold time helps keep enzyme activity consistent.
Integrated Selection Logic
A systematic way to build a formula is to start with the job, then map requirements to building blocks.
- Define the soil and surface: grease, particulate dirt, proteins, or mineral scale.
- Choose surfactant type and blend: match wetting and emulsification needs, then check compatibility.
- Select builder strategy: address water hardness and pH targets.
- Add performance details: viscosity, clarity, foam control, enzyme stability, and preservation.
- Validate with simple bench checks: clarity/phase behavior, viscosity trend, and basic cleaning performance at use dilution.
If you see haze or separation, do not immediately blame the surfactant. Builders, salts, and polymers can shift solubility and micelle structure. The fastest route to correction is to change one variable at a time and re-check the physical appearance and stability.
Mind Map: Surfactants, Builders, and Additives
Example: Liquid Degreaser Building Block Plan
Imagine a liquid degreaser intended for greasy kitchen surfaces.
- Surfactant package: choose a primary anionic for grease emulsification and a nonionic co-surfactant to improve wetting and solubilize oily components.
- Builder strategy: include a hardness-control system so calcium and magnesium do not reduce cleaning or cause residue.
- Performance additives: add a rheology modifier for stable viscosity, plus a solubilizer to keep fragrance and any hydrophobic components dissolved.
During bench trials, you would first confirm that the formula stays clear or consistently uniform at room temperature. Then you would check viscosity stability over time and confirm that the cleaning performance improves when you switch from soft to hard water. If haze appears in hard water, the builder strategy is the likely culprit, not the surfactant blend.
6.2 Liquid Detergent Chemistry: Neutralization, Solubilization, and Viscosity Development
Liquid detergents are usually built from three linked chemical jobs: neutralize an acid or fatty component to create the right ionic form, solubilize surfactants and builders into a stable single-phase system, and then develop viscosity so the product pours and suspends without turning into a gelled mess.
Neutralization as the Chemistry Switch
Neutralization converts an acid form into a salt form that behaves differently in water. In many liquid systems, you start with an acid precursor (for example, fatty acids or sulfonic acid surfactants) and add a base to reach the target pH.
A practical way to think about it: pH is not just a number for the label; it controls solubility, surfactant ionization, and how much free acid remains. If neutralization is incomplete, you often see poor cleaning performance and instability because some surfactant stays in a less soluble form. If you overshoot, you can increase irritation risk and sometimes trigger haze or viscosity drift.
Example: Suppose a fatty-acid-based liquid targets pH 8.5. During the run, you add base in small increments while monitoring pH and temperature. When pH reaches the setpoint, you stop adding base and hold briefly to allow mixing to homogenize the bulk. A batch that hits pH quickly but shows later pH drop often indicates mixing lag or localized over-neutralization.
Solubilization as the Phase Management Problem
Solubilization is the step where surfactants and builders become uniformly dispersed and remain so under storage. Surfactants form micelles, and builders can either support that structure or interfere with it.
Key control variables include:
- Order of addition: Adding surfactant before builder can reduce localized precipitation.
- Water quality: Hard water can form insoluble salts with anionic systems and some builders.
- Temperature: Solubility improves with temperature, but cooling can reveal hidden incompatibilities.
Example: A formulation with anionic surfactant plus a carbonate builder may look clear at 60°C but turn cloudy after cooling to 25°C. That often points to incomplete dissolution of builder, salt formation, or micelle structure shifting as temperature drops. The fix is usually not “more mixing forever,” but adjusting addition order, ensuring builder is fully dissolved before surfactant addition, and confirming water hardness is within spec.
Viscosity Development as the Network Formation
Viscosity in liquids typically comes from a combination of surfactant structure and polymer or thickener systems. As you neutralize, you can change the surfactant’s ability to form entangled structures or wormlike micelles, which increases viscosity. Separately, polymers thicken by hydrating and forming a network.
You can manage viscosity development by controlling:
- Neutralization level: It affects ionic strength and micelle shape.
- Salt level: Too much salt can collapse micelles and thin the product.
- Polymer hydration: Polymers need time and correct shear conditions to hydrate without forming lumps.
Example: A polymer-thickened liquid that turns out too thin may have been neutralized to a higher pH than intended, increasing ionic strength and reducing polymer effectiveness. A batch that is too thick or stringy may have polymer added too quickly into cold water, causing incomplete hydration and uneven distribution.
Integrated Workflow for a Stable Liquid
A systematic approach prevents “chemistry surprises” later in the process.
- Charge water and begin mixing at a controlled temperature.
- Dissolve builders fully before introducing surfactants when the formulation is sensitive to precipitation.
- Add surfactants in the planned order, ensuring each addition is dispersed before the next.
- Neutralize gradually while monitoring pH and temperature, aiming for the final pH after mixing homogenizes.
- Develop viscosity by hydrating polymers or allowing micelle structure to form, then verify viscosity after the product reaches the standard hold temperature.
- Check clarity and stability using simple in-process observations (appearance, settling, and viscosity trend) before packaging.
Mind Map: Neutralization, Solubilization, Viscosity
Case Study: One Change, Three Outcomes
A plant trial changed the neutralization strategy from “add base to target pH quickly” to “add base in smaller increments with a short hold after reaching pH.” The result was not just better pH accuracy. The batch also stayed clearer after cooling and reached the expected viscosity within the acceptance window.
The reasoning is straightforward: smaller increments reduced local salt spikes that can disrupt micelle structure, and the hold time allowed the bulk to equilibrate before viscosity and clarity checks. In other words, neutralization controlled both solubilization behavior and viscosity development, because all three are tied to ionic strength and dispersion quality.
6.3 Powder and Granular Detergents: Spray Drying/Granulation Concepts and Control Points
Powder and granular detergents start with a liquid or slurry base that contains surfactants, builders, and performance additives. The goal is to remove water (or reduce it) while keeping the product pourable, dissolvable, and stable in storage. The two common routes are spray drying and granulation, and many plants use a hybrid approach: spray drying to create dry particles, then granulation to improve flow and dissolution.
The Core Idea of Spray Drying
Spray drying atomizes the detergent slurry into fine droplets, then rapidly removes water with hot gas. Each droplet becomes a particle as water evaporates. Smaller droplets generally produce smaller particles, which can dissolve quickly but may be more prone to dusting. Larger droplets can improve bulk density and reduce dust, but may slow dissolution.
A practical way to think about spray drying is as a three-step loop: atomize, evaporate, and collect. Control points map directly to those steps.
Control Points for Spray Drying
Atomization quality. Nozzle type, pressure, and slurry viscosity determine droplet size. Example: if viscosity rises because of incomplete dissolution of builders, droplets get larger, and the powder can become coarser and less uniform.
Inlet and outlet temperatures. Inlet temperature drives evaporation; outlet temperature reflects how much water remains when droplets reach the drying chamber exit. Example: if outlet temperature is too low, particles may be under-dried, leading to caking during storage.
Feed rate and solids content. Higher feed rate can overload the chamber, increasing moisture in the product. Example: a batch with 2% higher solids can require a different feed rate to maintain the same outlet temperature.
Airflow and residence time. Gas flow affects both drying speed and particle trajectory. Example: reduced airflow can increase residence time, causing over-drying and higher energy use.
Cyclone and filtration. Collection efficiency affects yield and particle size distribution. Example: if fines escape collection, the product can shift toward larger particles and change dissolution behavior.
The Core Idea of Granulation
Granulation builds larger agglomerates from smaller dry or semi-dry materials. The binder can be water, a surfactant solution, or a molten component such as fatty acid derivatives. The binder creates contact points between particles; drying then locks the structure.
Granulation is often used to improve flow and reduce dust compared with straight spray-dried powder. It also helps incorporate ingredients that are difficult to spray dry directly, such as enzymes that need gentler handling.
Control Points for Granulation
Binder selection and addition rate. The binder must wet particles without dissolving everything into a sticky mess. Example: adding too much binder can create oversized granules that break during handling.
Moisture level during growth. Granules need enough moisture to form bridges, but not so much that they collapse. Example: if moisture is slightly high, you may see a “wet sand” feel and poor flow after drying.
Mixing intensity. Too little mixing yields uneven granule sizes; too much can fracture developing granules. Example: if the mixer speed increases after maintenance, you may observe a higher fraction of fines.
Drying conditions. Drying removes moisture and stabilizes the granule structure. Example: overly aggressive drying can create hard granules that take longer to dissolve.
Screening and recycle. Oversize and undersize fractions are separated. Recycle streams must be tracked because they change the effective composition and moisture history. Example: recycling too much fines can shift the product toward smaller granules and increase dust.
Mind Map: Powder and Granular Detergent Production
Integrated Example Workflow
Suppose a plant wants a granular detergent with good flow and fast dissolution. Start by preparing a fully dissolved slurry at a controlled viscosity. Run spray drying to create a consistent base powder, then granulate using a binder solution added at a controlled rate while monitoring moisture. Keep outlet temperature and granulation moisture within a defined window so the product exits drying with stable low moisture. Finally, screen and recycle with limits so the particle size distribution stays within spec.
Practical Acceptance Checks
After drying and post-processing, verify moisture content, bulk density, and particle size distribution. Also check dissolution behavior using a standardized agitation and water temperature. Example: if moisture is within spec but dissolution is slow, the granules may be too hard from excessive drying or binder overuse, even though the numbers look fine.
In both spray drying and granulation, the best control strategy is to link each setpoint to a physical outcome: droplet size to particle size, outlet temperature to residual moisture, binder addition to granule strength, and drying conditions to dissolution time. When those links are clear, troubleshooting becomes less guesswork and more cause-and-effect.
6.4 Incorporating Enzymes and Fragile Ingredients: Timing, Protection, and Handling Practices
Enzymes and fragile ingredients (such as certain polymers, fragrances, and solvents) behave like picky guests: they work well when conditions are right, and they sulk when they are not. The practical goal is to add them at the right time, keep them in the right chemical environment, and prevent mechanical or thermal damage.
Foundational Constraints That Drive Timing
Enzymes are proteins, so they are sensitive to temperature, pH, and water activity. Many detergent systems also contain surfactants, builders, and chelants that can either support enzyme performance or interfere with it. A simple way to plan timing is to separate the process into three phases: (1) build the bulk formulation, (2) bring the system into the enzyme-friendly window, and (3) add enzymes last and finish gently.
For fragile ingredients, the constraints are often different but the logic is the same. Fragrance components may volatilize under heat or shear; some polymers can clump if dispersed too aggressively; certain solvents can change viscosity and solubilization behavior if added too early.
Timing Strategy for Enzyme Addition
Start by identifying the enzyme’s target pH and temperature operating window from your internal specification. Then design the process so the bulk mixture reaches that window before enzyme contact.
A common integrated workflow for liquids looks like this:
- Heat and dissolve water-soluble components to achieve full clarity and stable viscosity.
- Cool or adjust pH to the enzyme-compatible range.
- Add chelants or stabilizers that support the enzyme’s active form.
- Add enzyme as the final functional ingredient.
- Mix at low-to-moderate shear long enough to distribute, then stop.
Example: If your formulation is built hot for solubilization, do not “hold hot and hope.” Cool to the enzyme window first, then add the enzyme. Even a short period above the enzyme’s tolerance can reduce activity enough to miss cleaning performance targets.
Protection Mechanisms That Prevent Loss of Activity
Enzyme protection is usually a combination of chemical and physical controls.
pH and ionic environment. Many enzymes require a specific pH range and can be affected by high ionic strength. If your builder system shifts pH during neutralization, treat pH adjustment as a control step, not a background effect.
Chelation and metal control. Some enzymes need metal ions for stability, while others are harmed by trace metals that catalyze degradation. Chelants can reduce harmful metal-catalyzed reactions, but they can also bind required cofactors. Use the formulation’s intended chelant level and verify it with your internal enzyme performance data.
Water activity and dilution effects. Enzymes in concentrated liquids may behave differently than in diluted systems. If you are adding enzyme premix, match the premix concentration and solvent system to the final product environment.
Thermal and shear protection. Enzymes can denature with heat and can be damaged by excessive shear, especially during high-speed homogenization. Use gentle mixing for the final addition phase.
Handling Practices That Reduce Mechanical and Contamination Risks
Enzyme handling is as much about logistics as chemistry.
- Use closed transfer where possible. Open scooping increases contamination risk and can expose enzyme to humidity and temperature swings.
- Minimize residence time after addition. Once enzyme is in, avoid long delays before filling or packaging.
- Avoid foam-heavy mixing. Foam can trap air and create local concentration gradients; it also increases variability in sampling.
- Control order of addition for dispersibility. For fragile polymers or particulates, pre-disperse in a compatible carrier or add slowly under controlled agitation.
Example: A polymer that forms gels when added too quickly can create “fish-eye” defects or viscosity spikes. Adding it gradually into a vortex-free region of the tank, with adequate but not excessive agitation, often prevents clumping.
Mind Map: Enzyme and Fragile Ingredient Incorporation
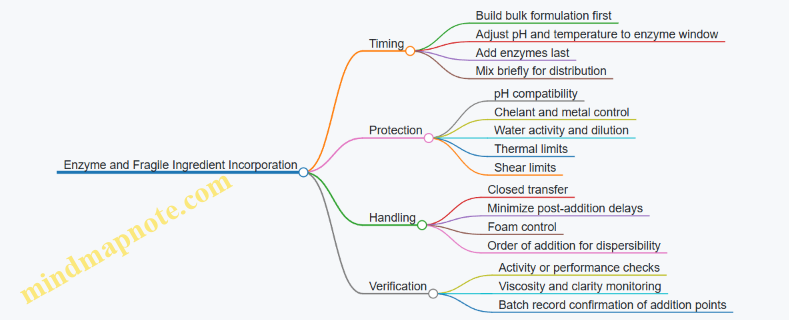
Example: Integrated Liquid Process Sequence
Assume a liquid detergent where the bulk needs heat for dissolution and the enzyme must be protected.
- Charge water and heat to dissolve surfactants and builders.
- Add remaining soluble components and mix until uniform.
- Cool to the enzyme-compatible temperature.
- Adjust pH to the specified enzyme range.
- Add chelant/stabilizer if required by the enzyme system.
- Start low-speed mixing.
- Add enzyme slowly, ensuring it disperses without localized clumps.
- Mix until uniform, then proceed to filtration (if used) and filling.
The key integrated point is that the enzyme addition is not a “final ingredient moment.” It is a controlled phase with defined temperature, pH, mixing intensity, and time.
Example: Fragile Ingredient Addition Without Enzyme
If a fragrance or polymer is the fragile component, the same three-phase logic applies.
- Phase 1: Dissolve and stabilize the bulk.
- Phase 2: Bring the system to the ingredient’s compatible conditions.
- Phase 3: Add gently and finish quickly.
Example: A fragrance added during the hot dissolution step may show lower odor intensity and can also affect viscosity indirectly by changing solubilization. Adding it after cooling and after viscosity has stabilized reduces both losses and variability.
6.5 Example Formulation Workflows: From Target Properties to Ingredient Selection and Order of Addition
A practical workflow starts with what the product must do, then translates those requirements into measurable targets, then maps targets to ingredients and process steps. The goal is not to “pick chemicals,” but to build a formulation that behaves predictably in a real tank.
Step 1: Translate Target Properties Into Measurable Specs
Write targets as numbers and define how you will measure them.
- Liquid detergent example targets: viscosity at 25 °C (e.g., 800–1200 mPa·s), clarity (pass/fail visual), active matter (e.g., 12–16% by assay), pH (e.g., 7.5–9.0), and stability after thermal cycling (pass/fail).
- Powder detergent example targets: bulk density, dissolution time, foam profile, and acceptable caking limits under defined humidity.
A useful trick: include one “process-sensitive” spec (like viscosity or clarity) and one “chemistry-sensitive” spec (like active content or free alkali). If both pass, you usually did more than just hit a number.
Step 2: Choose the Base System That Can Meet the Specs
Select a base architecture before fine-tuning.
- For liquids, you typically need a surfactant system plus a solubilization strategy. If you want high clarity, you must avoid ingredient combinations that push the mixture into phase separation.
- For powders, you need a builder and surfactant package that survives drying and mixes into water without leaving gritty residue.
At this stage, decide whether you are building around anionic surfactants, nonionic surfactants, or a blend. The blend choice affects both solubilization and how easily the product tolerates hard water.
Step 3: Build a Constraint Map from Chemistry and Compatibility
Compatibility is where many formulations fail quietly.
- Water hardness: builders and chelants determine whether surfactants stay effective and whether precipitation occurs.
- pH window: enzymes and some polymers have narrow operating ranges.
- Electrolyte level: salts can change viscosity and clarity, especially in systems containing nonionic surfactants.
Mind Map: From Targets to Formulation Decisions
Step 4: Select Ingredients Using “Role-Based” Reasoning
Instead of listing ingredients, assign each one a job.
- Surfactants: provide detergency and foam. Choose a primary surfactant for cleaning and a secondary surfactant for solubilization or mildness.
- Builders: improve cleaning in hard water by sequestering ions or controlling alkalinity.
- Viscosity modifiers: help the product stay uniform and pourable.
- Chelants: protect performance when builders are limited.
- Enzymes and fragile additives: require timing and pH/temperature control.
Example: If your liquid must be clear and viscous, you often need a surfactant blend that stays in a single phase plus a polymer or structuring agent added under controlled conditions.
Step 5: Plan Order of Addition as a Control Strategy
Order of addition is not a ritual; it prevents unwanted reactions, precipitation, and viscosity surprises.
Liquid detergent example workflow (bench scale)
- Charge water to a working temperature (commonly warm enough to dissolve solids, but not so hot that you stress sensitive components).
- Dissolve builders and chelants first if they are solids. Confirm they are fully dispersed before surfactant addition.
- Add the primary surfactant(s) gradually with agitation to avoid local high concentrations.
- Introduce viscosity modifiers next. Many polymers hydrate better when added after the bulk surfactant environment is established.
- Adjust pH using the appropriate neutralizing agent once most surfactants are in solution. This reduces the risk of pH-dependent precipitation.
- Add enzymes and fragrance last at the lowest practical temperature and after pH is within the enzyme’s operating range.
- Make final volume and mix to a defined time, then hold briefly for deaeration if needed.
Why this order works: early builder dissolution prevents undissolved particles from acting as nucleation sites for haze; adding polymers after surfactant formation improves hydration; adding enzymes last reduces exposure to unfavorable pH or temperature.
Step 6: Define End-Point Checks and Acceptance Criteria
Before you call the batch “done,” verify the properties that reflect the chemistry and the process.
- Chemistry checks: pH, active content, and free alkali/free fatty acid where relevant.
- Physical checks: viscosity at the specified temperature, clarity, and stability after a short hold.
Example acceptance logic: if pH is in range but viscosity is low, suspect polymer hydration or insufficient mixing time; if viscosity is correct but clarity fails, suspect phase behavior from electrolyte level or incomplete dissolution of builders.
Step 7: Document the Batch Record Like a Map, Not a Diary
A good record includes exact order, temperatures, mixing speeds, and times. When a later batch deviates, you can trace whether the change was chemical (ingredient) or procedural (addition timing, temperature, or mixing).
7. Water, pH, and Temperature Management in Cleaning Product Systems
7.1 Water Hardness and Its Effects: Calcium/Magnesium Interactions and Control Methods
Hard water contains dissolved calcium (Ca²⁺) and magnesium (Mg²⁺) ions. In cleaning systems, those ions don’t just “exist”; they actively change how surfactants and builders behave, which is why the same formula can perform differently across regions.
What Hardness Really Means
Hardness is commonly reported as mg/L (ppm) as CaCO₃. Total hardness includes both Ca²⁺ and Mg²⁺, while temporary hardness is often associated with bicarbonates. For manufacturing and formulation control, the practical takeaway is simple: higher Ca²⁺/Mg²⁺ means more ions available to interact with anionic surfactants and builders.
How Calcium and Magnesium Affect Cleaning
First, Ca²⁺ and Mg²⁺ can reduce foam and change foam stability. Many anionic surfactants form tighter ion pairs with Ca²⁺ than with sodium, which can lower the amount of free surfactant available to form micelles. Less micelle activity often shows up as reduced wetting and slower soil removal.
Second, hardness ions can consume builders. Carbonate and silicate builders are designed to tie up ions or prevent scale formation, but they have finite capacity. Once builder capacity is used up, the formula behaves like it has “less help,” and performance drops.
Third, hardness can cause precipitation and haze. If the system contains fatty acids, soaps, or certain polymers, Ca²⁺ can form insoluble salts. In liquids, that can appear as cloudiness or sediment; in powders, it can show up as poor dissolution or gritty feel.
Where the Interactions Show Up in Real Products
In a liquid detergent, hardness can shift viscosity and clarity because precipitation changes the effective particle size distribution. In a bar soap, Ca²⁺ can react with soap to form scum-like calcium soaps, which can make lather feel thin and leave residue. In powders, hardness can reduce dissolution speed by promoting localized agglomeration around partially dissolved particles.
Measuring Hardness for Process Control
Manufacturing needs consistent inputs, so hardness measurement should be part of incoming water qualification. Common approaches include titration methods that quantify Ca²⁺ and Mg²⁺ (often reported as CaCO₃ equivalents). The key is to measure both total hardness and, when possible, the Ca:Mg split, because magnesium can be more stubborn in some systems.
A practical control habit: record hardness alongside batch records and correlate it with key quality attributes like viscosity, clarity, and active content performance tests. If you see a pattern, you can adjust either water treatment or formulation strategy.
Control Methods That Actually Work
1) Ion Exchange (Softening) Ion exchange removes Ca²⁺ and Mg²⁺ by replacing them with sodium or hydrogen ions. This is effective when you need predictable water chemistry for consistent viscosity and clarity. A straightforward example: if your liquid detergent spec requires “clear to slightly hazy,” softening water reduces the chance of Ca²⁺-driven precipitation.
2) Reverse Osmosis or Membrane Filtration
Membranes reduce dissolved ions substantially. This is useful when incoming water varies widely. Example: a plant drawing from multiple sources can use membrane-treated water to keep hardness stable, reducing batch-to-batch variability.
3) Blending Treated and Untreated Water
Blending can hit a target hardness without fully treating all water. Example: if one source is 300 ppm as CaCO₃ and another is 80 ppm, blending can land near 150 ppm for a formula that performs best at that level.
4) Chemical Conditioning in the Process
Some formulations and processes tolerate hardness if you add chelants or rely on builders. Example: a detergent concentrate might include a chelant that binds Ca²⁺ early, protecting surfactant performance during mixing. The control point is dosing accuracy and mixing time so the chelant has contact with ions before precipitation-prone components meet.
Mind Map: Calcium and Magnesium Effects and Control
Example: Diagnosing a Batch That Turned Hazy
Suppose a liquid detergent batch becomes hazy after cooling. The first check is water hardness used for dilution. If the incoming water hardness rose from 120 ppm to 240 ppm as CaCO₃, Ca²⁺ may have promoted precipitation with soap-like components or certain polymers. Next, verify whether the process used softened water consistently and whether any ion-exchange resin was near exhaustion. Finally, review mixing order: if precipitation-prone ingredients were added before chelation or before the system reached the intended pH, you may need to adjust addition timing or dosing.
Control Limits and Practical Targets
Set operational targets based on your formula’s sensitivity. Some systems are tolerant up to moderate hardness; others require softened water to protect clarity and foam. The best target is the one that keeps your critical quality attributes within spec across the range of measured incoming water, not the one that looks good on paper.
7.2 pH Measurement and Control: Probes, Calibration, and Buffering Considerations
pH control in soap and detergent systems is less about chasing a single number and more about keeping the chemistry on the rails. A pH reading is only meaningful if the probe is measuring the same “pH reality” that your product chemistry creates—at the same temperature, with the same ionic conditions, and with a calibration that matches the measurement conditions.
Foundations of pH Measurement in Cleaning Formulations
A pH probe measures hydrogen ion activity, not just concentration. In real formulations, activity is influenced by ionic strength, dissolved salts, and surfactants. That’s why two samples with the same nominal pH can behave differently in titration or in performance tests.
Temperature affects both electrode response and the chemistry. Most pH meters apply automatic temperature compensation, but the probe still needs to be stable at the measurement temperature. If you measure a warm batch with a probe that has been sitting cold, the reading can lag and drift.
Probe Types and Where They Fit
Glass electrodes are common for aqueous systems and are sensitive to ionic environment. For detergent liquids with high surfactant content, the junction can foul or become sluggish. A junction designed for low-to-moderate fouling helps, but you still need cleaning and maintenance routines.
For systems with high solids or heavy surfactant loads, consider probes with robust junction designs and a measurement strategy that includes agitation and consistent sampling. If the probe is installed in-line, ensure flow is steady enough to prevent boundary-layer effects.
Calibration That Actually Matches the Batch
Calibration is not a ritual; it’s a mapping from electrode potential to pH. Use at least two buffers that bracket your expected operating range. For many detergent and soap processes, that means one buffer near neutral and one in the acidic or alkaline region you target.
Key practices:
- Use fresh buffers or properly stored buffers. Evaporation and contamination shift buffer pH.
- Rinse with deionized water, then gently blot. Wiping can generate static or scratch the glass surface.
- Allow the probe to equilibrate in each buffer until the reading stabilizes.
- Record slope and offset. A “looks fine” calibration can still hide a slow junction or a partially damaged electrode.
Example: Neutralization Endpoint Control
Suppose you neutralize a fatty acid blend to reach a target pH of 8.5 in a detergent base. If you calibrate using buffers at 25°C but measure at 60°C without correct temperature compensation, the meter may report a pH that seems close while the chemistry is off. The fix is straightforward: calibrate at the same temperature as measurement when feasible, or at least verify that temperature compensation is functioning and stable.
Buffering Considerations in Real Formulations
Buffers resist pH change, which is helpful for stability but tricky for control. Builders, salts, and dissolved species can create buffering capacity that changes as the batch heats, dissolves, or reacts.
A practical way to think about it: the same acid addition can cause a smaller pH shift when buffering capacity is high. That means your control loop may “feel slow” even when dosing is correct.
Example: Hard Water and Builder Effects
If your formulation uses carbonate or silicate builders, the pH response to acid can be muted at first and then change as precipitation or dissolution progresses. In a batch with variable water hardness, calcium can consume certain species and alter buffering behavior. The result is pH readings that appear inconsistent batch-to-batch unless water quality is controlled or accounted for.
Control Strategy Tied to Measurement Quality
pH control works best when the measurement is representative. Ensure mixing is adequate so the probe sees the bulk composition, not a local pocket near the dosing stream.
Use interlocks and limits:
- Set dosing limits to prevent overshoot during probe stabilization.
- Pause control actions during sampling events or after major ingredient additions until the system re-homogenizes.
- Use alarms for calibration failures, unstable readings, or abnormal slope.
Example: Preventing Overshoot During Addition
During neutralization, adding acid too quickly can create a transient low-pH zone near the probe. If the controller reacts to that transient, it can overshoot once the batch mixes. A simple mitigation is to slow dosing rate during the final approach to the setpoint and to confirm that the probe reading is stable for a defined time window.
Mind Map: pH Probes, Calibration, and Buffering
Practical Checklist for Consistent pH Control
Before you trust a pH number, confirm the probe is clean, the calibration is valid, the temperature is aligned, and mixing is sufficient. Then treat buffering as part of the control model: if the formulation resists pH change, your dosing and control tuning must reflect that reality.
7.3 Temperature Control for Viscosity and Reaction Completion
Temperature control is the quiet workhorse behind both reaction completion and stable viscosity. In soap and detergent systems, the same temperature that speeds up reaction also changes solubility, phase behavior, and the way surfactants and salts pack together. The goal is not just “hit a number,” but maintain a uniform thermal state so the chemistry finishes evenly and the viscosity develops predictably.
Foundations: Why Temperature Changes Viscosity and Completion
Reaction completion depends on kinetics, which typically increase with temperature. If one part of the batch runs hotter, it can reach completion early while cooler zones lag behind, creating uneven free fatty acid or free alkali levels. Viscosity then reflects both composition and structure: as reactions proceed, the mixture’s polarity and ionic strength shift, and surfactant systems reorganize. Even if the final average temperature is correct, local temperature gradients can produce local viscosity differences that persist as the batch cools.
A practical way to think about it: temperature affects (1) how fast chemistry proceeds, (2) how fast heat moves through the vessel, and (3) how the mixture’s microstructure forms. Control must address all three.
Heat Transfer Basics: Getting Heat Into the Batch
Most plants rely on jacketed or coil heat exchangers. Heat transfer rate depends on surface area, temperature driving force, and the overall heat transfer coefficient, which is influenced by agitation and mixture properties. Agitation is not just for mixing; it strongly affects the boundary layer near the heat transfer surface.
Uniformity is achieved when the mixing time is shorter than the time it takes for meaningful temperature gradients to form. If the batch is viscous, mixing time increases, and gradients become more likely. That’s why temperature control and agitation settings should be treated as a pair.
Uniformity Strategy: Avoiding Hot Spots and Cold Corners
Uniformity problems show up as “mystery” viscosity swings or inconsistent titration results. Common causes include poor impeller coverage, dead zones behind baffles, insufficient flow during heat-up, or adding concentrated ingredients too quickly.
A systematic approach:
- Heat-up in stages rather than one aggressive ramp.
- Use agitation settings that ensure the reactor contents are well mixed before and during heating.
- Confirm sensor placement and verify that the temperature probe measures representative bulk temperature.
- Add heat gradually when viscosity is rising, because heat transfer slows as the mixture thickens.
Control Loops: From Setpoint to Stable Temperature
A single feedback loop can hold average temperature, but it cannot guarantee uniformity. Cascade control is often used where the temperature controller manipulates a secondary variable such as jacket steam valve position or hot water flow. Feedforward can help when you know the temperature of incoming ingredients.
Operationally, the best control behavior comes from matching the control action to the process stage. During early reaction, you can tolerate faster changes because viscosity is low and mixing is effective. Near the end-point, you should slow down the temperature ramp to prevent overshoot that can push the system past the desired reaction state.
Advanced Details: Linking Temperature Profiles to End-Point
Reaction completion is typically confirmed by analytical checks such as titration for free fatty acid or free alkali, but those results lag behind the process. Temperature profiling bridges that gap.
Use a profile that includes:
- A heat-up segment to reach the target reaction temperature.
- A hold segment where the reaction proceeds under controlled conditions.
- A controlled cool-down segment to lock in viscosity development without triggering precipitation or phase separation.
The hold temperature should be selected based on both kinetics and viscosity behavior. If viscosity rises too quickly, mixing becomes less effective, and the remaining reaction may proceed unevenly. In that case, you can reduce the hold temperature slightly and extend the hold time, which often improves uniformity.
Example: Liquid Detergent Neutralization and Viscosity Build
Suppose a neutralization step is performed at a target of 45°C. If the jacket control overshoots to 50°C for several minutes, the reaction may complete faster in the hotter zone near the jacket, while cooler zones remain under-neutralized. Later, when viscosity rises, the batch can show streaks of different thickness and titration results that don’t match the expected conversion.
A better approach is:
- Preheat water to near the target.
- Start agitation at a level that maintains uniformity.
- Ramp to 45°C gradually.
- Hold at 45°C while monitoring temperature stability (small fluctuations) and sampling near the end of the hold.
If titration shows residual free alkali, you can extend the hold at the same temperature rather than increasing temperature immediately, because increasing temperature can further change viscosity structure.
Mind Map: Temperature Control for Viscosity and Reaction Completion
7.4 Mixing and Shear: Preventing Stratification, Foam, and Incomplete Dissolution
Mixing is where chemistry meets physics. In cleaning products, the goal is not just “stirring,” but creating a uniform composition fast enough that reactions, dissolution, and neutralization proceed consistently. Three common failure modes—stratification, foam, and incomplete dissolution—usually share a root cause: the product experiences the wrong balance of flow patterns, shear, and gas handling.
Foundational Concepts: What Mixing Must Achieve
Start with two practical targets. First, the bulk liquid must become compositionally uniform, meaning surfactants, builders, and solvents distribute without persistent layers. Second, any solids or viscous components must be wetted and dispersed so they dissolve or suspend as intended.
Uniformity depends on mixing time relative to the time scale of separation. Stratification happens when density differences (from temperature, dissolved salts, or undissolved solids) persist longer than mixing can erase them. Incomplete dissolution happens when particles are not wetted quickly enough, so they remain as clumps that later “look fine” in a sample but fail in performance tests.
Shear and Flow Patterns: Choosing the Right Kind of Motion
Shear is not automatically good or bad. High shear can break up agglomerates and speed wetting, but it can also generate foam and increase air entrainment. Low shear may preserve clarity and reduce foam, but it can leave dead zones where solids settle.
A useful way to think about mixing is to separate circulation from dispersion. Circulation moves material around the tank; dispersion breaks up particles and promotes dissolution. Many problems come from trying to do both with the same impeller setting.
Practical rule: when you add a powder or viscous concentrate, prioritize wetting and dispersion early. Once the system is uniform, you can reduce shear to limit foam and avoid unnecessary viscosity changes.
Preventing Stratification: Density, Temperature, and Addition Order
Stratification often starts at the moment of addition. If you pour a dense builder slurry into a tank that is not yet circulating, it can form a local layer that takes a long time to break apart.
Best practice examples:
- Add concentrated liquids slowly into a running vortex rather than into a still surface. This reduces local density gradients.
- If you must add a solid, pre-wet it in a portion of water to form a slurry, then feed the slurry into the main batch. This prevents “dry pockets” that later dissolve unevenly.
- Control temperature during mixing. A cold addition can create a temporary density jump that encourages layering even when the final temperature is correct.
Operational check: after mixing, take samples from top, middle, and bottom. If active content or pH differs meaningfully, you have a mixing uniformity issue rather than a formulation issue.
Preventing Foam: Air Entrainment and Gas Handling
Foam is not just a nuisance; it changes effective volume, can trap air in the product, and may interfere with accurate level control during filling. Foam typically forms when gas is entrained and stabilized by surfactants.
Best practice examples:
- Avoid creating a strong vortex. A vortex pulls air down into the liquid. Keep the impeller submerged and adjust speed to maintain circulation without a deep drawdown.
- Introduce surfactants after the bulk water is circulating and at a controlled temperature. Adding them too early can stabilize foam before the system is ready to disperse.
- If foam appears, reduce shear temporarily and allow gas to disengage while maintaining circulation. Then resume dispersion at a lower intensity.
A simple diagnostic: if foam collapses quickly after you reduce speed, the issue is air entrainment. If foam persists, you may be over-stabilizing the system due to surfactant concentration gradients or insufficient dissolution.
Preventing Incomplete Dissolution: Wetting, Residence, and End-Point Checks
Incomplete dissolution is usually a wetting problem. Particles need contact with water and enough agitation to break surface barriers. If you mix too gently, particles remain coated and dissolve slowly; if you mix too aggressively, you can create foam that reduces effective liquid contact.
Best practice examples:
- Use a staged addition for powders: add gradually so the slurry viscosity does not spike instantly and trap undissolved material.
- Maintain adequate residence time after the last addition. Dissolution continues even after the batch looks uniform.
- Use end-point checks that match the failure mode. For builders, confirm clarity or perform a targeted assay for dissolved fraction rather than relying only on appearance.
Advanced Details: Linking Mixing to Control and Acceptance
Mixing parameters should be treated as controllable process variables, not “set and forget.” Record impeller speed, addition rate, temperature, and mixing time. When quality results drift, you can distinguish whether the root cause is chemistry (wrong stoichiometry) or mixing (wrong distribution).
A practical acceptance approach:
- Define a sampling plan that reflects tank geometry.
- Set acceptance criteria for uniformity indicators such as pH, conductivity, and active content.
- Require a post-mix hold long enough for dissolution to complete and for entrained air to dissipate.
Mind Map: Mixing and Shear Failure Modes
Example: Liquid Detergent Batch with Powder Builder
A common workflow: start water circulation, set temperature, then pre-wet the builder in a side tank to form a slurry. Feed the slurry into the main tank at a controlled rate while maintaining circulation. After the last addition, mix for a defined hold time, then sample top/middle/bottom for pH and conductivity. If foam rises, reduce speed to stop air entrainment, wait for collapse, and then continue mixing at a lower intensity until the end-point checks confirm dissolution.
This approach prevents three problems at once: it avoids layering during addition, limits foam stabilization by controlling when surfactants and builders meet, and ensures dissolution completes before you declare the batch ready for downstream steps.
7.5 Managing Phase Behavior: Clarity, Cloudiness, and Precipitation Avoidance
Phase behavior is what you see when chemistry meets reality: liquids can look clear, turn cloudy, or form solids. In soap and detergent systems, those outcomes usually come from water hardness, pH shifts, surfactant packing, and solubility limits of builders, salts, and additives. The goal is not “perfect transparency,” but stable performance with no unexpected solids or separation during storage and use.
Foundational Concepts That Predict What You’ll See
Start with three ideas.
First, solubility is conditional. A salt that dissolves at one pH or temperature can precipitate at another, especially when calcium and magnesium are present. For example, a formulation that is clear in deionized water may haze in hard water because calcium can bind to anionic surfactants or react with builders.
Second, surfactants self-assemble. As concentration changes, surfactants form micelles and, in some systems, liquid-crystal structures. Cloudiness can indicate that the system is moving toward a less soluble or less uniform structure, or that the micelles are no longer stable.
Third, mixing and order of addition matter. If you add a builder or neutralizing agent too quickly, local pH and local concentration spikes can create temporary precipitation that later “clears” or, worse, becomes stable solids.
Practical Diagnostic Workflow
When clarity problems appear, treat it like a small investigation.
-
Confirm the symptom type. Cloudiness that appears immediately after mixing often points to incompatibility or rapid phase change. Cloudiness that develops over days suggests slow precipitation, salt crystallization, or gradual surfactant restructuring.
-
Check water and temperature history. Run the same batch using the plant’s standard water and a controlled lab water. If the issue only appears with hard water, calcium/magnesium interactions are likely.
-
Measure pH at multiple times. pH can drift as neutralization completes or as CO₂ dissolves. A pH swing can push salts across solubility boundaries.
-
Inspect for solids. Let a sample sit undisturbed. If you see settling, you likely have true precipitation. If the sample stays uniformly hazy, you may have colloidal instability.
Mind Map: Phase Behavior Drivers and Controls
Control Strategies That Actually Work
1) Use water strategy, not wishful thinking. If your formulation is sensitive to hardness, decide early whether you will soften water, use chelants, or adjust builder selection. A simple example: a liquid detergent that stays clear in soft water but hazes in tap water can often be stabilized by increasing chelant level slightly or by switching from a builder that forms calcium salts to one that tolerates hardness better.
2) Control neutralization kinetics. Neutralization is a chemistry event and a mixing event. Add neutralizing agent gradually with adequate agitation so pH rises smoothly throughout the vessel. A practical rule: if you see haze during neutralization, slow the addition and confirm that the pH probe is reading the bulk, not a local pocket.
3) Manage temperature during dissolution and reaction completion. Many salts dissolve better at higher temperature, but viscosity and mixing efficiency also change. Keep a consistent heat-up profile and avoid cooling too quickly before salts have fully dissolved. For instance, if you cool a batch right after neutralization, you may cross a solubility boundary and trigger precipitation during the cool-down.
4) Choose an order of addition that prevents local supersaturation. Builders and salts can exceed solubility locally even if the final mixture is fine. Dissolve difficult components in a portion of water first, then combine with the main batch. Example: pre-dissolve a carbonate or silicate fraction in warm water before adding it to the surfactant phase, rather than dumping it into a concentrated surfactant blend.
5) Confirm compatibility with a hard-water challenge. Before releasing a formulation, run a small-scale test using representative hard water and your target temperature range. If cloudiness appears only in the challenge, you can focus troubleshooting on hardness interactions rather than blaming general mixing.
Examples of What to Do When You See Cloudiness
Example A: Immediate haze after mixing. This often points to incompatibility or poor dissolution. Check whether a builder was added too fast, whether a component was fully dissolved, and whether the pH was already in the expected range before adding sensitive ingredients.
Example B: Haze after a few days. This suggests slow crystallization or gradual phase separation. Review storage temperature, verify pH stability over time, and check whether calcium pickup from equipment or make-up water could be increasing ionic strength.
Example C: Clear product that turns cloudy only after dilution. Some systems are stable at concentrate but become less stable when diluted in use water. Run a dilution test using the same water quality customers use, and adjust surfactant ratios or builder/chelant balance accordingly.
Verification Checklist for Stable Clarity
- Visual inspection at mixing end, after cooling, and after a defined hold period.
- pH measurement at the same time points.
- Hard-water challenge test matching plant water conditions.
- Settling or centrifuge check to distinguish colloidal haze from true precipitation.
When these checks agree—stable pH, no settling, and consistent appearance across water types—you can be confident that phase behavior is under control rather than merely tolerated.
8. Mixing, Homogenization, and Reactor Operations
8.1 Reactor Design and Operation Basics: Agitation, Baffles, and Headspace Management
A reactor for soap or detergent work is less about “having a tank” and more about controlling how energy and mass move through the liquid. Agitation determines whether heat and chemistry distribute evenly; baffles prevent the liquid from behaving like a lazy whirlpool; headspace management keeps volatile components and foam under control.
Agitation Fundamentals That Actually Matter
Start with the mixing goal. In many batches, you need three things at once: fast temperature equalization, uniform reactant distribution, and stable suspension of any dispersed solids or droplets. If you only mix for speed, you may create excessive foam or shear-sensitive issues (for example, some enzyme systems or fragile dispersions).
Impeller choice sets the mixing pattern. Common styles include:
- Radial flow impellers for bulk circulation and fast homogenization.
- Axial flow impellers for top-to-bottom movement and reducing dead zones.
- Combination sets when you need both circulation and localized dispersion.
A practical rule: match impeller type to viscosity and phase behavior. If the mixture is thin and flows easily, axial or mixed-flow impellers often reduce time-to-uniformity. If viscosity rises during neutralization or salt formation, radial impellers help maintain circulation as the batch thickens.
Baffles That Stop the Vortex
Without baffles, many liquids form a central vortex that reduces effective mixing and can trap unmixed zones near the walls. Baffles break the swirl and increase turbulence, improving heat transfer and reaction uniformity.
Baffle geometry affects performance. Typical design choices include baffle width and number of baffles. More baffles generally increase mixing intensity but also increase power draw and can worsen foaming if the batch is already prone to it.
A simple operational check is to watch the surface and the wall region. If you see a persistent depression at the center or streaks near the wall during addition, you likely have insufficient baffle effectiveness or impeller placement.
Headspace Management for Volatiles and Foam
Headspace is the gas space above the liquid. Its size and condition influence evaporation, pressure behavior, and foam stability. In detergent and soap systems, headspace matters because:
- Some formulations can release small amounts of volatiles during heating.
- Foam can form during addition or when surfactants reach critical concentrations.
- Pressure changes can occur if the reactor is sealed or partially vented.
Manage headspace by controlling venting and by limiting air entrainment. If you’re adding surfactants or hydrotropes, introduce them in a way that avoids dumping a concentrated stream into the vortex. A vortex can pull air down into the liquid, turning manageable foam into a persistent problem.
Systematic Design Logic for Agitation and Baffles
Use a stepwise approach so you don’t “guess and hope.”
- Define the batch phases: single-phase liquid, two-phase emulsion, or solid suspension.
- Estimate viscosity range: low at start, higher after neutralization or salt formation.
- Select impeller type and placement: ensure the impeller is high enough to avoid wall dead zones and low enough to maintain circulation.
- Choose baffles: enough to prevent vortexing, not so aggressive that power draw and foam worsen.
- Set operating conditions: agitation speed, addition rate, and temperature ramp.
- Verify with sampling: confirm uniformity by checking key parameters at multiple locations.
Mind Map: Reactor Mixing Components and Their Effects
Example: Neutralization Addition Without Creating a Foam Festival
Suppose you’re neutralizing an acid-containing detergent base. Early in the batch, viscosity is low and foam risk is moderate. If you add neutralizing agent too fast while the impeller forms a vortex, air can be pulled into the liquid and foam can expand quickly.
A workable fix is to slow the addition rate and reduce vortex formation by adjusting agitation speed and ensuring the feed enters below the liquid surface but away from the vortex center. If you have baffles, confirm they are sized to prevent a strong central swirl. Then sample at the top, middle, and near-wall region after the addition completes and the temperature stabilizes.
Example: When Viscosity Rises Mid-Batch
During soap or detergent processing, viscosity can increase as salts form or as the system transitions toward a more structured phase. If you keep the same agitation speed, circulation can weaken and you may see incomplete dissolution or localized pH drift.
Operationally, you can compensate by increasing agitation speed within safe limits, or by using a staged impeller strategy if your reactor has multiple impellers. The key is to confirm uniformity with measurements rather than relying on appearance alone.
Operational Checks That Prevent “Good Theory, Bad Batch”
- Surface observation: a stable, non-vortexing surface suggests headspace and agitation are aligned.
- Wall behavior: streaking or persistent unmixed zones indicate insufficient baffle effectiveness or impeller placement.
- Sampling map: take samples from multiple locations and compare pH, active content proxy, or conductivity to confirm distribution.
- Power and temperature trends: sudden changes can indicate phase transitions or loss of circulation.
When agitation, baffles, and headspace are treated as one system, you get predictable mixing, fewer surprises during addition, and more consistent reaction completion.
8.2 Mixing Rules of Thumb: Impeller Selection, Tip Speed, and Power Considerations
Mixing is where chemistry meets physics. If you pick the wrong impeller, run it too slowly, or overload the motor, you can get incomplete dissolution, uneven reaction, or excessive shear that breaks fragile ingredients. The goal is simple: create the right flow pattern at the right energy level, then verify it with sampling.
Impeller Selection Rules of Thumb
Start with what you’re mixing: a clear liquid, a viscous solution, or a slurry with solids. Then match the impeller to the dominant transport need.
- Axial-flow impellers (pumping style) move liquid along the shaft. Use them when you need bulk circulation and the vessel is tall relative to its diameter. A common example is an axial propeller in a liquid detergent base where you want fast homogenization without heavy vortexing.
- Radial-flow impellers (turbine style) push liquid outward and create strong shear near the impeller. Use them for suspending solids, dispersing powders, or breaking up droplets. For instance, when adding a builder powder into water, a radial impeller helps wet particles quickly and reduces clumping.
- Hybrid impellers combine both behaviors. They’re useful when you need both circulation and dispersion, such as when mixing a viscous liquid with suspended pigments or polymer thickeners.
A practical selection workflow: choose the impeller type from the material behavior, then adjust size and placement to avoid dead zones. If you see unmixed corners during sampling, the issue is often impeller height or insufficient circulation, not the chemistry.
Tip Speed: The “How Hard Are We Throwing the Liquid?” Check
Tip speed is the linear speed at the impeller edge. Higher tip speed increases turbulence and shear, which can improve dispersion but also raises heat and can stress sensitive ingredients.
A useful rule of thumb is to treat tip speed as a controlled variable rather than a fixed constant. For many soap and detergent systems, you typically start in a moderate range and increase only if dissolution or dispersion is incomplete.
- Low tip speed: good for gentle mixing of already-dissolved components and viscosity development.
- Moderate tip speed: often sufficient for dissolving salts and blending surfactant solutions.
- High tip speed: helps break up agglomerates and improve wetting, but watch for foam and temperature rise.
Temperature matters because viscosity and reaction rates change with it. If you increase tip speed and your batch temperature climbs, you may “fix” dispersion while accidentally changing the neutralization endpoint.
Power Considerations: The “How Much Energy Are We Putting In?” Check
Power draw reflects how much mechanical energy the impeller transfers to the fluid. Two systems can have the same tip speed but different power needs because viscosity and density differ.
Use these practical checks:
- Viscosity rise during mixing: As polymers or salts dissolve, viscosity can increase. If you keep the same motor speed, power may rise or the flow pattern may shift, leading to poorer suspension later in the batch.
- Solids loading: Higher solids increase resistance to flow. A mixer that worked during a low-solids trial may underperform at full load.
- Motor limits: Running near motor capacity can cause overheating and inconsistent mixing. If you see frequent overload trips, reduce impeller size, lower speed, or change the addition strategy.
A simple operational example: when dispersing a polymer thickener into water, add slowly under moderate speed to prevent fish-eye lumps. If you jump to high speed immediately, you may create foam and still fail to hydrate the polymer uniformly.
Placement and Geometry Rules of Thumb
Even the best impeller can underperform if it’s placed poorly.
- Impeller clearance: Keep a reasonable distance from the bottom to avoid dead zones while preventing excessive recirculation that traps solids.
- Number of impellers: Tall vessels often need multiple stages to maintain circulation throughout the height.
- Baffles: Without baffles, swirling dominates and mixing efficiency drops. For detergent systems where uniformity matters, baffles are usually part of the baseline design.
Quick Mind Map
Mind Map: Mixing Rules of Thumb
Example: Choosing Speed and Impeller for a Powder Addition
Suppose you’re adding a dry builder into water to form a uniform base. If you observe floating clumps after mixing, the issue is usually wetting and dispersion, not “not enough time.”
- Use a radial or hybrid impeller to create outward flow that contacts particles quickly.
- Start at a moderate speed to avoid foam, then increase stepwise while monitoring temperature and batch clarity.
- Sample at multiple heights. If the top is clear and the bottom is cloudy, you likely need better circulation (impeller height or additional stage) rather than more shear.
Example: Preventing Over-Shear with Fragile Additives
If you add an enzyme or a fragile polymer later in the batch, you want uniform distribution without unnecessary stress.
- Keep tip speed moderate and rely on good circulation.
- Add slowly to reduce local concentration spikes.
- Confirm mixing by sampling after a defined mixing window and checking the relevant quality attribute (such as viscosity or activity proxy).
The practical takeaway is that impeller type, tip speed, and power are linked. Change one, then verify the outcome with sampling and temperature trends, so you’re not just “mixing longer,” you’re mixing correctly.
8.3 Residence Time and Hold Tanks: Avoiding Overreaction and Degradation
Residence time is the time your reaction mixture spends in equipment before it reaches the next step. In soap and detergent manufacturing, that time is not just a scheduling detail—it directly controls how far chemistry proceeds and how much unwanted change happens while the mixture is “waiting.” Hold tanks are the usual place where residence time quietly grows, especially during batching, sampling, and transfer delays.
Start with the foundational idea: reaction progress depends on both time and conditions. If temperature is higher, reaction rates rise; if mixing is poor, local hot spots or concentration gradients can accelerate side reactions. Even if the main reaction is “done,” degradation can continue—oxidation of unsaturated components, hydrolysis of esters, and color formation from impurities. So the goal is not only to hit the intended endpoint, but to minimize the time spent in conditions that keep side reactions moving.
A practical way to manage this is to treat hold tanks as part of the process reaction system. That means you track three things: (1) the tank’s effective volume and working level, (2) the flow path and mixing pattern, and (3) the thermal state of the contents. A tank that is “large enough” on paper can still create long effective residence time if transfers are intermittent or if the tank has poor circulation.
Residence Time Basics That Actually Matter
For batch systems, residence time is the interval from “end of reaction” to “start of the next controlled step.” For continuous or semi-continuous systems, it’s the average time material spends in the hold volume. In both cases, the key is that tanks behave closer to a mix of “well-mixed” and “plug-flow” than a perfect single model.
Well-mixed behavior means the tank contents are uniform, so residence time distribution is narrow. Plug-flow behavior means material moves through with minimal back-mixing, so residence time distribution is broader but predictable. Many hold tanks land in between, which is why sampling at one point can mislead you if the tank has dead zones.
Hold Tank Design and Operating Practices
-
Minimize dead volume and dead zones. Dead zones trap material that can keep reacting longer than the bulk. A common symptom is that samples taken near the outlet look fine, while material near the top or corners shows higher color or altered titration results.
-
Control temperature during holding. If your main reaction step requires heating, then holding at that same temperature can extend degradation. A simple practice is to cool to a target hold temperature immediately after endpoint confirmation, then maintain it with jacket control.
-
Maintain mixing appropriate to the chemistry. Gentle agitation prevents stratification and concentration gradients. Over-aggressive mixing can increase heat transfer and shear-sensitive issues in some formulations, while under-mixing invites local chemistry.
-
Use level-based transfer rules. Transfers that wait for “convenient” levels can create variable residence time. Tie transfer start to a defined working level and a defined endpoint confirmation.
-
Define maximum hold time limits. Set limits based on measured quality drift, not on gut feeling. For example, if free fatty acid rises measurably after a certain time at a given temperature, that time becomes your operational ceiling.
Mind Map: Residence Time Control Logic
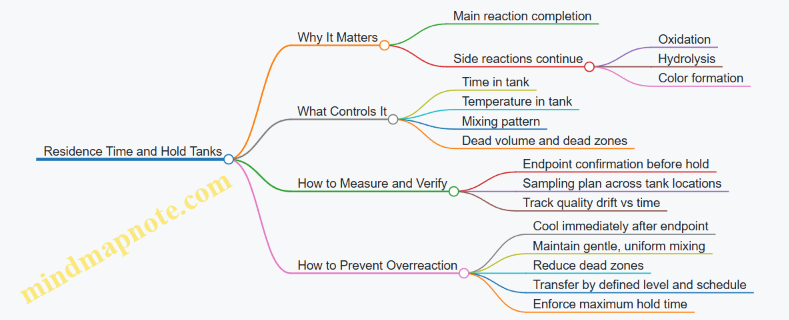
Example: Soap Batch Hold After Neutralization
Imagine a soap batch where neutralization reaches the target pH and free fatty acid is within spec. If the batch is held hot for 2 hours while waiting for milling, oxidation and hydrolysis can still shift color and titration results. A straightforward fix is to confirm endpoint, then cool to a hold temperature that slows side reactions, and start milling within a defined maximum hold window. If you also sample from the top and bottom of the hold tank, you can verify that mixing prevents stratification; otherwise, you may see different titration values even when the bulk looks uniform.
Example: Liquid Detergent Hold Before Filling
Liquid detergent systems often include viscosity development and solubilization steps. If a hold tank is used after partial neutralization, long residence time can cause gradual changes in clarity and viscosity. The integrated control approach is to (1) set a hold temperature that matches the viscosity target window, (2) keep agitation steady enough to prevent settling of any undissolved components, and (3) align transfer timing with endpoint confirmation rather than with operator availability. When quality drift is observed, the first investigation is usually not “the formula,” but the time-temperature-mixing history.
Advanced Details Without the Math Party
When you suspect residence time distribution issues, treat the tank like a system with zones. Use a sampling map: top, middle, bottom, and near inlet/outlet. If those samples show systematic differences, you have mixing limitations or dead zones. Then adjust agitation, baffles, inlet location, and operating level.
Also watch for “hidden time” between steps: waiting for lab results, delays in pumping, and slow valve sequencing. Those delays effectively add residence time even if the hold tank itself is not large. The fix is to define a decision rule: what you do while waiting, and what conditions you maintain during that waiting period.
Finally, connect hold time limits to acceptance criteria. If your acceptance test is free fatty acid or active content, then your hold-time rule should be tied to how those values drift under your actual hold conditions. That turns residence time from a vague concept into a controllable process parameter.
8.4 Homogenization for Suspensions and Particulates: Wetting and Dispersion Control
Suspensions and particulate additives behave badly when they are treated like simple liquids. The goal of homogenization is not just “mixing harder,” but creating a stable distribution where particles are wetted, separated, and kept from re-agglomerating. Think of it as three linked jobs: wetting the particle surfaces, dispersing agglomerates into smaller units, and maintaining that dispersion long enough to fill and package.
Foundational Concepts: Wetting, Dispersion, and Stability
Wetting starts with surface interactions. A powder that floats or clumps usually has poor wetting with the continuous phase, often because the liquid has higher surface tension than the particle surface energy. A practical sign is slow sink rate or persistent floating during the first minutes of mixing.
Dispersion is the mechanical and chemical process that breaks agglomerates and distributes particles. Agglomerates are not just “more particles stuck together”; they are often held by moisture bridges, salt crystals, or surfactant-poor zones. Dispersion reduces agglomerate size and increases the number of particle-liquid contact points.
Stability is what prevents re-formation of agglomerates. For many cleaning formulations, stability is achieved by a combination of electrostatic effects (zeta potential), steric effects (polymers), and controlled viscosity that slows particle settling. If viscosity is too low, even a good dispersion can separate before filling.
Wetting Control: Getting Liquid to the Particle Surface
Start with order of addition and pre-wetting. Add powders gradually into a vortex-free region of the tank, or use a pre-slurry step in a portion of the liquid phase. Pre-slurrying reduces local concentration spikes that cause “instant clumps,” especially with builders and insoluble fillers.
Use a controlled wetting sequence:
- Wetting liquid first, then powder.
- Maintain agitation during addition to prevent dry pockets.
- Allow a short hold time after addition so liquid can penetrate agglomerates.
A simple example: a formulation with a silica thickener. If you dump the powder into the full batch, you often see fish-eye particles—dry cores surrounded by wetted shells. Pre-slurrying silica in 10–20% of the final water phase, then transferring, typically eliminates fish-eyes because the liquid reaches the particle surfaces before the rest of the batch dilutes the slurry.
Dispersion Mechanics: Choosing Energy and Shear Intelligently
Dispersion depends on energy input and how that energy is delivered. High shear can break agglomerates, but it can also create heat and foam, and it may not help if wetting is poor. A common failure mode is “we applied shear, but the particles still clump,” which usually means the liquid never reached the agglomerate interior.
Control points for dispersion:
- Agitation pattern: avoid dead zones and excessive vortexing.
- Shear distribution: ensure the impeller and homogenizer cover the addition region.
- Temperature rise: monitor because viscosity and solubility change with temperature.
A practical approach is staged homogenization. First, mix at moderate speed to wet and suspend. Then apply higher shear for a defined time to break agglomerates. Finally, reduce shear to limit foam and heat while maintaining uniformity.
Process Parameters That Actually Matter
Key parameters are measurable and actionable:
- Particle loading: higher solids require longer wetting and more energy.
- Addition rate: faster addition increases local concentration and agglomeration.
- Continuous phase viscosity: higher viscosity improves suspension but can slow wetting.
- pH and ionic strength: salts and pH can change surface charge and polymer performance.
Example: a clay-containing suspension. If you add clay into hard water without adjusting pH or builder system, you may see rapid thickening in localized areas and poor dispersion. Adjusting the water chemistry and using a pre-slurry step often restores uniformity.
Advanced Control: Preventing Re-Agglomeration
Even after dispersion, particles can re-agglomerate due to flocculation or depletion effects. To reduce re-agglomeration:
- Maintain mixing until viscosity and structure are uniform.
- Avoid long hold times at temperatures that promote salt crystallization.
- Ensure polymers and dispersants are fully hydrated before final viscosity development.
A useful operational check is a settling test. After homogenization, take a sample in a clear cylinder and observe sediment height over a fixed time. If sediment forms quickly, you likely have either incomplete dispersion or insufficient stabilization.
Mind Map: Wetting and Dispersion Control
Example Workflow: From Powder to Uniform Suspension
- Charge 15% of the final liquid phase to the reactor.
- Start agitation to create a stable, non-vortex flow.
- Add powder slowly while maintaining wetting conditions; keep agitation on during addition.
- Hold briefly to allow penetration and hydration.
- Transfer the pre-slurry into the main batch.
- Apply a defined high-shear dispersion step until uniformity is achieved.
- Reduce shear and complete viscosity development under controlled temperature.
- Perform a settling check on a retained sample before release.
This workflow keeps wetting from being the bottleneck and ensures the dispersion step has something to work with. When the tank looks uniform but the cylinder settles quickly, the issue is usually stability chemistry or insufficient dispersion energy—not just “more mixing.”
8.5 Batch End-Point Determination: Sampling, Titration, and Acceptance Criteria
End-point determination is where chemistry meets paperwork. The goal is simple: prove the reaction has reached the target state, using measurements that are repeatable, traceable, and tied to product specs.
Foundational Idea: Define the End-Point as a Measurable Chemical State
For soap and detergent reactions, the end-point usually means one of these is within limits:
- Free fatty acid (FFA) or free alkali (for saponification/neutralization balance)
- Active surfactant content (for detergent systems)
- Neutralization completion (for pH and salt formation)
A practical approach is to set two acceptance checks: a primary chemical titration and a secondary process indicator (often pH, conductivity, or appearance). The secondary check catches sampling or handling mistakes without replacing the titration.
Sampling Strategy: Take Samples That Represent the Whole Batch
Sampling errors are the most common reason “the titration says we’re done” while the product later disagrees.
- Mix before sampling. Stop agitation only long enough to withdraw the sample. If you sample from a stratified reactor, you measure the wrong chemistry.
- Use consistent sampling points. Prefer a bottom or mid-level port that reflects bulk composition. If you must use a thief sampler, use the same depth each time.
- Time your samples to the reaction plan. Take early samples to learn the trend, then tighten the sampling interval near the expected end-point.
- Treat samples consistently. Temperature affects solubility and titration behavior. Cool or equilibrate samples using the same procedure each time.
Example: In a saponification batch, you might sample at 60, 75, 90 minutes. If FFA drops quickly early and then slows, you reduce the interval to 10 minutes once the trend approaches the target range.
Titration Workflow: Measure the Chemical State with Controlled Technique
A titration is only as good as its preparation and endpoint detection.
- Choose the correct titration method. For FFA, a typical approach uses a standardized base with an indicator or potentiometric endpoint. For free alkali, you reverse the logic with an acid titrant.
- Standardize reagents. Record titrant concentration, last standardization date, and calibration status. A titrant that drifted by 2% can shift acceptance outcomes.
- Prepare the sample for titration. If the sample is viscous or contains suspended solids, ensure a consistent dissolution/clarification step so the titration sees the same chemical species each time.
- Run a blank and a control. A blank corrects for background. A control solution verifies the method is behaving.
- Use endpoint detection consistently. If you use an indicator, keep the same endpoint criterion (color stability time). If you use a pH electrode, use the same electrode condition and endpoint pH.
Example: When titrating a detergent liquid, you may need to dilute to keep the electrode stable and avoid sluggish response. If you dilute differently between samples, you create artificial variability.
Acceptance Criteria: Translate Titration Results Into Go/No-Go Decisions
Acceptance criteria should be written as numbers with clear tolerance and decision rules.
A typical structure includes:
- Target range for the primary titration (e.g., FFA within a specified band)
- Maximum allowable deviation between replicate titrations (method repeatability)
- Secondary limits (e.g., pH range or clarity threshold)
- Decision rule for borderline results (e.g., retest requirement)
Example acceptance rule for FFA:
- Accept if FFA is within the target band.
- If one replicate is within band but the other is outside, repeat titration once using a fresh aliquot.
- Reject if both replicates fall outside band or if repeatability exceeds the allowed deviation.
This rule prevents a single bad endpoint reading from driving the batch decision.
Mind Map: End-Point Determination Logic
Calculations and Documentation: Make the Result Auditable
Your batch record should capture enough detail to reproduce the calculation:
- Sample mass or volume used
- Dilution factors
- Titrant concentration
- Endpoint volume(s)
- Replicate results and average
- Final computed value with units
Example: If you diluted a detergent sample 1:10 before titration, the final FFA/alkali calculation must multiply by the dilution factor. Forgetting that factor is a classic “everything looked fine” failure.
Advanced Detail: Handling Real-World Complications
- Near the endpoint, titration curves flatten. Small endpoint shifts can cause larger percent errors. Increase replicate count or tighten endpoint detection settings.
- Foam and emulsions can interfere. If the sample forms stable foam, allow it to settle using the same time window each time, or use a consistent clarification step.
- Temperature drift changes behavior. Keep sample temperature within a defined window before titration.
Case Study: Deciding with a Borderline Result
A saponification batch targets FFA of 0.20–0.30%. Two titrations on the same sample give 0.29% and 0.33%.
- Replicate agreement exceeds the allowed deviation.
- The batch is not immediately accepted.
- The operator repeats titration using a fresh aliquot.
- Fresh aliquot results are 0.28% and 0.30%, both within range.
The batch is accepted because the decision rule required a retest when repeatability failed, not because one number happened to look close.
When sampling, titration, and acceptance criteria are aligned, end-point determination becomes a controlled measurement rather than a guess with paperwork attached.
9. Quality Assurance and Analytical Testing for Soap and Detergents
9.1 Key Quality Attributes: Active Content, pH, Viscosity, Color, and Odor
Quality control for soap and detergent products starts with a simple rule: measure what matters, then tie each measurement to a cause you can control. The five attributes below cover the chemical “strength,” the system “condition,” the physical “behavior,” and the sensory “signals” that often reveal process problems.
Active Content
Active content is the amount of cleaning chemistry doing the work, typically surfactant for detergents and free fatty acid or soap content for soaps. Because formulations vary, define the method and target in the spec sheet, then keep the method stable.
Example: A liquid detergent targets 12.0% active surfactant. If titration shows 11.2%, the batch may have under-dosed surfactant, lost material during transfer, or diluted with extra water. If active content is high, it can also raise viscosity and change pH, so you should check those attributes together.
Practical best practice: Use a sampling plan that represents the whole batch. For viscous liquids, mix the tank long enough before sampling so the sample matches the bulk.
pH
pH affects surfactant performance, soap solubility, enzyme stability (when present), and corrosion risk. It also changes how builders behave, especially in hard-water conditions.
Example: A mild hand soap targets pH 9.0–9.5. If pH drifts to 10.2, you may have excess free alkali from neutralization, which can increase irritation risk and cause haze. If pH drops to 8.2, soap may be less stable and can separate more easily.
Best practice: Calibrate pH probes with fresh buffers and measure at the same temperature each time. pH readings shift with temperature, and soap systems can be slow to equilibrate.
Viscosity
Viscosity controls pourability, stability, and filling accuracy. It is also a proxy for whether the system is fully dissolved and properly structured.
Example: A detergent gel targets 1500–2000 mPa·s at 25°C. If viscosity is low, you might have insufficient thickener, incomplete dissolution, or too much dilution. If viscosity is high, you may have over-thickener addition, inadequate mixing, or temperature differences during measurement.
Best practice: Measure viscosity at a controlled temperature and use the same spindle or geometry. Viscosity instruments are consistent only when the setup is consistent.
Color
Color is a quality attribute because it reflects raw material variability, reaction completion, and contamination. It can also indicate oxidation or overheating.
Example: A clear liquid detergent should be “light amber.” If color darkens after a change in heating profile, the likely causes include excessive temperature, longer hold time, or impurities in a feedstock. If color changes without active content changes, suspect reaction conditions or filtration.
Best practice: Use a defined color method (for example, visual standard or instrument reading) and record it with the same sample preparation steps each time.
Odor
Odor is not just a sensory preference; it can indicate incomplete reactions, residual solvents, or degraded ingredients. Odor complaints often correlate with batch handling issues.
Example: A neutralized detergent develops a “sour” odor after a delay between reaction completion and finishing. That pattern can point to delayed neutralization, poor temperature control, or contamination during transfer.
Best practice: Train tasters on what “off” means for your product line and document odor descriptors consistently. Always pair odor checks with chemical and physical measurements so you can act, not just react.
How These Attributes Connect
These attributes are linked through chemistry and process conditions. Neutralization affects pH and can change viscosity through salt formation. Dissolution and mixing affect viscosity and can indirectly influence odor by trapping reactive components. Reaction completion affects active content and can shift color.
Example Integrated Acceptance Check
A batch arrives at release testing with: active content 12.0% (pass), pH 10.1 (fail), viscosity 1700 mPa·s (pass), color slightly darker (borderline), odor “sharp” (borderline). The pattern points to excess alkali from neutralization rather than a major dosing error. The next actions are to review neutralization logs, confirm titration method performance, check mixing time near end-point, and verify that finishing steps did not introduce contamination.
The key is not to treat each attribute as a standalone score. When you interpret them together, you can usually find the process lever that caused the deviation and correct it before the next batch.
9.2 Chemical Assays: Titration for Free Alkali/Free Fatty Acid and Surfactant Quantification
Titration is the workhorse assay for soap and detergent chemistry because it ties a measurable volume to a chemical amount. The basic idea is simple: you add a reagent of known concentration until a reaction endpoint is reached, then convert that volume into grams or percent in the sample. The trick is choosing the right titration chemistry and endpoint so the result reflects the property you actually care about.
Free Alkali and Free Fatty Acid Titration
Free alkali in soap is typically measured by titrating an aqueous sample with a standardized acid. Free fatty acid is measured by titrating with a standardized base. In both cases, the endpoint is usually detected by pH change using an indicator or a pH meter.
A practical workflow starts with sample preparation. For free alkali, dissolve the soap in warm water and ensure complete mixing; undissolved solids can hide alkali and bias results low. For free fatty acid, the sample is often acidified or otherwise prepared so that the titratable fatty acids are in the correct form. If you skip this step, you may titrate salts instead of acids and get a “confident” number that is confidently wrong.
Endpoint selection matters. A pH meter is more forgiving when the sample matrix is colored or opaque. Indicators can work, but they require careful selection and consistent technique. For example, if the sample contains buffering species, the pH jump may be muted, so you must use the correct endpoint range and record the actual pH at the endpoint.
Stoichiometry converts titrant volume to analyte amount. If the titration reaction is 1:1 (common for strong acid/base neutralization), then moles of titrant equal moles of analyte. If the chemistry is not 1:1, you must apply the correct factor. Always compute using the standardized concentration and the exact volume delivered at the endpoint.
Surfactant Quantification by Titration
Surfactants come in different charge types, so the titration method depends on what you are measuring. A common approach for anionic surfactants uses a cationic titrant that forms an insoluble ion pair with the anionic surfactant. The endpoint is detected by a dye that changes color when the anionic surfactant is fully complexed.
Before titration, you need to control the sample environment. Surfactant ion-pair formation is sensitive to pH and ionic strength. If the sample is too acidic or too alkaline, the surfactant’s ionization state changes and the titration response shifts. If the ionic strength is off, the ion-pair formation can be incomplete or too strong, again moving the endpoint.
A typical method uses a standardized cationic titrant and a dye indicator. You add titrant slowly near the endpoint, because the last portion of surfactant is where the color change is most informative. Record the endpoint volume precisely and run a blank or reagent control so the dye and background ionic effects don’t masquerade as surfactant.
Mind Map: Titration Logic for Soap and Detergent Assays
Example: Free Alkali Calculation
Suppose you titrate a prepared soap solution with 0.1000 mol/L hydrochloric acid. You record an endpoint volume of 18.60 mL. For 1:1 neutralization, moles of free alkali equal moles of HCl.
Moles = 0.1000 mol/L × 0.01860 L = 0.001860 mol.
If the free alkali is expressed as NaOH equivalents, mass = 0.001860 mol × 40.00 g/mol = 0.0744 g NaOH. If your sample mass was 5.00 g, then percent free alkali = 0.0744/5.00 × 100 = 1.49%.
This example highlights a key habit: always state the reporting basis (actual alkali identity or equivalent). Soap formulations may use different alkali sources, so “percent free alkali” must be tied to a defined equivalent.
Example: Surfactant Ion-Pair Titration Logic
For an anionic surfactant, you use a standardized cationic titrant and a dye indicator. If the titrant volume to endpoint is 12.40 mL and the titrant concentration is 0.02000 mol/L, then moles of titrant = 0.02000 × 0.01240 = 0.0002480 mol.
If the ion-pair stoichiometry is 1:1 for the method, moles of anionic surfactant in the aliquot equal moles of titrant. Convert moles to mass using the molecular weight of the surfactant basis used by the method (often expressed as a specific standard, not “whatever surfactant is in the bottle”).
Quality Practices That Prevent Bad Numbers
Replicate titrations catch technique issues like overshooting the endpoint or incomplete dissolution. Blanks catch dye and reagent contributions, especially in surfactant assays. Finally, verify your measurement tools: a pH meter that drifts or a burette that isn’t read consistently can turn a careful chemistry into a consistent error. Titration rewards boring discipline.
9.3 Physical and Performance Tests: Foam, Wetting, Rinsability, and Stability Checks
Soap and detergent performance is mostly about what happens at the surface: how fast the product spreads, how it forms foam, how it leaves the surface after rinsing, and whether the system stays uniform over time. This section turns those ideas into practical tests you can run consistently.
Foam Testing
Foam is not just “more is better.” In cleaning, foam can help indicate surfactant activity, but excessive foam can interfere with rinsing and equipment operation. Start with a defined test method so results are comparable.
Core concept: foam height and foam decay reflect surfactant type, concentration, and the presence of stabilizers or salts.
Example approach:
- Prepare a fixed dilution (for example, 0.5% w/w active in water of a specified hardness).
- Use a standardized agitation method (same container, same fill volume, same mixing time).
- Measure foam height at fixed times, such as immediately after agitation and after 1, 3, and 5 minutes.
What to record: initial foam height, half-life of foam (time to reach 50% of initial height), and any visible changes like collapse, ring formation, or persistent microfoam.
Common interpretation:
- Fast collapse can indicate insufficient surfactant concentration, poor solubilization, or high electrolyte levels.
- Very persistent foam can suggest strong foam stabilization, often from certain surfactant blends or polymers.
Wetting Testing
Wetting describes how quickly a liquid spreads on a surface. A detergent that wets well can displace soil and water more effectively, even if foam is modest.
Core concept: wetting rate depends on surface tension reduction and viscosity, plus the interaction with the substrate.
Example approach:
- Use a controlled substrate such as a standardized fabric swatch or a flat nonporous surface.
- Apply a fixed droplet volume at a fixed height.
- Measure time to spread to a defined diameter, or record whether the droplet beads.
What to record: wetting time, final spread area, and whether wetting is uniform or shows edge beading.
Practical note: if your product contains insoluble particles, wetting tests can be distorted by particle settling. Mix immediately before testing and keep the dilution preparation consistent.
Rinsability Testing
Rinsability is the ability to remove surfactant and soil residues during rinsing. It connects directly to consumer experience and to residue-related issues like haze or tackiness.
Core concept: rinsability is influenced by micelle structure, builder type, electrolyte level, and the strength of adsorption to the substrate.
Example approach:
- Apply a standardized amount of diluted product to a test surface.
- Rinse using a controlled water flow rate and rinse time.
- Quantify residue using a simple mass-based method (dry and weigh) or by measuring surface reflectance or conductivity of rinse water.
What to record: residue mass per area, rinse-water surfactant proxy (such as conductivity change), and visual scoring for streaks.
How to keep it fair: use the same water hardness and temperature for every run. If you change water conditions, you change the chemistry, not just the product.
Stability Checks
Stability is about whether the formulation remains usable without separation, unacceptable viscosity change, or loss of performance.
Core concept: stability failures often show up as phase separation, precipitation, viscosity drift, or changes in foam and wetting behavior.
Example stability program:
- Store samples at defined conditions (for example, room temperature and a warmer condition) for a set period such as 8 weeks.
- At each time point, check appearance, measure pH, measure viscosity, and perform a quick foam and wetting screen.
What to record:
- Visual: clarity, haze, sediment, oiling-out, or gel formation.
- Physical: viscosity at a fixed shear rate, pH, and density if relevant.
- Performance: foam height trend and wetting time trend.
Acceptance logic: define pass/fail criteria before you start. For instance, you might require no visible phase separation and no more than a specified viscosity shift.
Mind Map: Physical and Performance Tests
Integrated Example Workflow
Run tests in a sequence that reduces confusion. First, confirm the formulation is homogeneous (stability-style appearance check). Next, evaluate foam and wetting on fresh dilutions to capture surface behavior. Finally, test rinsability on the same dilution and water conditions so the “surface story” matches the “after-rinse story.” If foam looks strong but rinsability shows high residue, you likely have a system that stabilizes foam yet holds onto the surface too well.
Example: Interpreting a Mismatch
Suppose foam height is high and foam decay is slow, but rinsability residue is also high. That combination often points to stronger adsorption or more persistent interfacial structures. A practical response is to verify dilution accuracy, water hardness, and mixing time first, then check whether the formulation contains components that increase residue retention, such as certain polymers or high electrolyte levels that alter micelle behavior.
9.4 Microbiological and Contamination Controls: Sampling, Limits, and Corrective Actions
Microbial contamination in soap and detergent products is usually not about “growth everywhere,” but about survival plus occasional opportunities: water activity, nutrients from impurities, and time spent in tanks or during filling. Controls therefore focus on preventing introduction, detecting trends early, and correcting the process without guessing.
Foundational Concepts That Drive Control Design
Start by separating two ideas: contamination and microbial growth. A product can be contaminated with low levels of organisms and still remain stable if conditions are unfavorable. Your sampling plan should still detect contamination because it predicts future risk when conditions change (for example, a shift in water quality or a cleaning failure).
Next, define where microbes can enter. Common routes include raw material handling, water systems, transfer lines, tank residues, and poorly controlled air exposure during open operations. Even when the formulation is hostile to microbes, residues in equipment can provide pockets where organisms persist.
Sampling Strategy That Matches the Risk
Sampling must be representative. For liquids, sample from locations that reflect the bulk, not from the top layer after settling. For tanks, use a consistent sampling point and method each time. For powders, sample from multiple increments across the lot because microbes and dust are not evenly distributed.
Use a tiered approach:
- Routine monitoring: scheduled checks on finished product and key in-process points.
- Event-based sampling: after sanitation deviations, unusual odors, filter bypass, or extended downtime.
- Root-cause sampling: targeted swabs of equipment surfaces and difficult-to-clean zones when results exceed limits.
A practical example: if finished liquid results show a slow upward trend, sample the water used for dilution, then the transfer line flush, then the final mixing tank. This sequence narrows the search without turning the plant into a science fair.
Limits That Are Meaningful, Not Just Numbers
Microbial limits should be tied to your product type and intended use, and they must be consistent with your quality system. Treat limits as decision thresholds, not as “pass/fail vibes.”
When results are reported, interpret them with context:
- Single high result: check sampling technique, lab method, and immediate process conditions.
- Repeated borderline results: investigate sanitation effectiveness and water system control.
- Sudden jump: prioritize equipment and handling events that occurred between the last passing sample and the current one.
Document the acceptance criteria for each test method, including detection limits and how you handle inconclusive counts.
Corrective Actions That Stop the Problem and Prevent Repeats
Corrective actions should follow a structured workflow.
- Quarantine and hold: stop distribution of affected lots while you investigate. If the product is already in the field, follow your internal recall decision process.
- Confirm the result: repeat testing on the same lot if there is a plausible sampling or analytical error.
- Identify the source: use a short list of likely routes—water, raw materials, and equipment residues—then expand based on evidence.
- Containment: sanitize or replace the implicated equipment sections, and verify that the process can return to control.
- Verification: test after sanitation and after re-start, using the same sampling locations and methods.
- Prevent recurrence: update SOPs, training, cleaning schedules, or control parameters, and verify effectiveness.
Example: A detergent batch shows elevated microbial counts. Swabbing reveals biofilm-like residue in a low-flow section of the transfer line. After line cleaning and a verified sanitation cycle, the next two finished-product samples return to within limits, and the corrective action is closed only after post-cleaning swabs also pass.
Mind Map: Sampling, Limits, and Corrective Actions
Practical Limits-to-Action Example
If a finished liquid sample exceeds the limit, do not immediately assume the formulation is “wrong.” First confirm the analytical result, then check the last sanitation record for the mixing tank and transfer line. If those records show correct chemical concentration and contact time, shift attention to water quality and dilution steps, because water is the easiest place for contamination to hitch a ride.
When corrective actions are effective, you should see a clear pattern: post-sanitation swabs improve first, followed by finished-product results returning to normal. That sequence is your evidence that the control system is working, not just that luck improved.
9.5 Statistical Process Control for Manufacturing: Charts, Trends, and Investigation Triggers
Statistical Process Control (SPC) is how you keep soap and detergent production from drifting quietly out of spec. The idea is simple: measure key variables, plot them over time, and decide—based on evidence—when the process needs attention.
Foundations of Charts and Variation
Start by separating two kinds of variation. Common-cause variation is the normal wiggle you expect when the process is stable: small shifts in raw material properties, minor temperature fluctuations, and measurement noise. Special-cause variation is a signal that something changed: a pump replaced with a slightly different calibration, a batch kettle with a fouled heat exchanger, or a new surfactant drum with different active content.
A control chart is built around a baseline. You collect data from a period where the process is behaving well, then compute a center line and control limits. The center line is your target behavior; the limits define the range where you expect most points to fall if only common causes are present. If points break the rules, you investigate.
Choosing the Right Chart
Use the chart type that matches your data.
- For measurements on a continuous scale like viscosity, pH, or active content, common choices include
- X̄-R charts for subgroup averages and ranges when you can form small groups.
- Individuals and Moving Range charts when you measure one value at a time.
- For counts or defect rates like “number of off-spec pH batches per week,” use charts for attributes.
A practical example: if you measure free alkali by titration for every batch, you likely have one result per batch. An Individuals chart fits naturally. If you also take three viscosity readings per batch, you can use subgroup logic for better sensitivity.
Interpreting Trends Without Overreacting
Control charts are not a “panic button.” They are a decision tool.
- A single point beyond a control limit is a strong special-cause signal.
- A run of points steadily trending upward or downward suggests a shift even if limits are not crossed.
- Too many points near one side of the center line can indicate a change in process behavior.
To keep investigations efficient, define rules up front. For example, “investigate if any point exceeds the upper or lower limit, or if there are 8 consecutive points on one side of the center line.” Consistency matters because teams learn the same language.
Building a Practical SPC Plan
An SPC plan should specify what you chart, how often you chart it, and what actions follow.
- Select variables tied to product performance and chemistry. Examples: pH after neutralization, free fatty acid after saponification, viscosity at a defined temperature, and active surfactant content.
- Define sampling and measurement discipline. If titration endpoints vary because of operator technique, your chart will blame the process for what is really a measurement issue.
- Set subgrouping logic. If you can group readings within a batch, do it. If not, use individuals.
- Establish investigation triggers. Triggers should be tied to chart rules and to operational impact.
Mind Map: SPC Workflow
Example: SPC for Free Alkali in Liquid Detergent
Suppose you chart free alkali (mg KOH/g) for every batch. After a stable period, your center line is 1.20 and control limits are 0.95 to 1.45.
On day 14, you see two consecutive batches at 1.48 and 1.52. The first point is near the upper limit; the second exceeds it. Your trigger rules call for investigation.
A good investigation starts with the measurement system. Check titration calibration, endpoint consistency, and reagent lot changes. If the lab is clean, move to process steps: neutralization temperature, mixing time, and the order of addition. A common practical finding is that neutralization was completed at a slightly lower temperature due to a heat exchanger issue, slowing reaction completion and leaving more free alkali.
Containment is straightforward: hold batches produced during the suspect window, then release only after confirmatory testing. After corrective action, you keep monitoring; you do not “reset” the chart just because the next batch looks fine.
Example: Trend Detection for Viscosity
Viscosity is sensitive to temperature and shear history. If your chart shows 9 consecutive points increasing, even without limit violations, you investigate before you get off-spec.
First, verify temperature control at the measurement step. Then check mixing parameters: impeller speed, hold time, and any change in addition order for polymers. If the trend aligns with a procedural change, document it and adjust the process to return to the desired behavior.
Diagram: Decision Logic for Investigation
    flowchart TD
A[Review SPC chart] --> B{Chart rule triggered?}
B -- No --> C[Continue monitoring]
B -- Yes --> D[Check measurement system]
D --> E{Lab method valid?}
E -- No --> F[Correct calibration or sampling]
E -- Yes --> G[Check process conditions]
G --> H{Change identified?}
H -- No --> I[Perform structured root cause]
H -- Yes --> J[Contain and correct]
J --> K[Verify with next batches]
K --> L[Update documentation and disposition]
Investigation Triggers That Work in Real Plants
Use triggers that are specific enough to act on but not so sensitive that you investigate every minor fluctuation.
- Immediate trigger: any point beyond control limits.
- Early trigger: sustained runs or clear trends.
- Operational trigger: chart signals combined with a known change, like a new raw material lot or a maintenance event.
Finally, keep the chart honest. If you change measurement methods or sampling procedures, update the baseline and document the reason. SPC is about consistent evidence, not consistent optimism.
10. Packaging, Labeling, and Handling of Finished Cleaning Products
10.1 Packaging Compatibility Materials Selection for Corrosive and Surfactant Systems
Packaging compatibility is mostly chemistry plus mechanics. Surfactants can change wetting and adhesion, while corrosives change the packaging material itself. Your goal is simple: keep the product where it belongs, keep the container intact, and keep the label readable for the whole shelf life.
1) Start with Product Chemistry and Packaging Roles
Treat the container as a system with three interfaces: product-to-cap, product-to-liner, and product-to-wall. For corrosive and surfactant systems, the critical variables are pH, ionic strength, solvent content, and the presence of oxidizers or chelants.
A practical way to begin is to list what the product does to surfaces:
- Wets and penetrates (common with many surfactants)
- Swells or softens polymers (common with certain solvents and low-molecular additives)
- Attacks metals (common with acids, bases, and salts)
- Extracts plasticizers (can show up as haze, odor changes, or viscosity drift)
Then map packaging roles:
- Container body: holds bulk product
- Closure and liner: prevents leakage and chemical contact at the seal
- Label and inks: must resist migration and moisture
- Gaskets and threads: control sealing under temperature and pressure changes
2) Choose Materials by Compatibility, Not Habit
Common container families include HDPE, PP, PET, glass, and metal. For corrosive systems, glass is chemically strong but can fail mechanically during filling and drops. Metals can work for some formulations, but corrosion depends on pH and dissolved ions.
For closures, the liner and gasket usually matter more than the shell material. A container may be fine, while a cap liner slowly degrades and creates slow leaks.
Use a compatibility checklist:
- Chemical resistance to the product’s pH and any reactive ingredients
- Permeation resistance for volatile components
- Stress crack resistance under cap torque and temperature cycling
- Seal integrity under compression set and long storage
- Adhesion stability for label films and overwraps
3) Mind the Closure Details That Cause Real Failures
Most packaging problems show up at closures, not the main container.
Key failure modes and what to watch:
- Swelling of liners leading to loss of compression and seepage
- Thread corrosion on metal caps or inserts
- Gasket hardening causing microleaks
- Cap liner delamination from poor adhesion or incompatible elastomers
- Label lifting due to surfactant migration and moisture exposure
Example: A liquid detergent with high alkalinity may be stored in HDPE, but if the cap liner is an elastomer that is not rated for caustic exposure, you can see slow leakage after several weeks. The container looks fine; the cap area tells the story.
4) Use Simple Tests Before You Commit
You do not need a lab fantasy to get useful answers. Use targeted, product-relevant checks.
- Visual and odor change after controlled storage
- Mass change of container and closure (indicates permeation or leakage)
- Seal inspection after opening (wetness, residue, liner deformation)
- Label adhesion check after humidity exposure
- Mechanical checks for brittle materials like glass under handling
A good internal practice is to run a small qualification set with the exact closure and liner combination, not just the container resin.
5) Mind Map of Compatibility Decisions
Mind Map: Packaging Compatibility for Corrosive and Surfactant Systems
6) Worked Example for a Selection Path
Suppose you are packaging a concentrated liquid cleaner with high pH and moderate surfactant load.
- Container body: choose a resin with strong caustic resistance and low permeation risk, such as HDPE.
- Closure: select a cap liner and gasket rated for caustic exposure and compatible with surfactant wetting.
- Label: use a label film and adhesive system that resists moisture and surfactant contact.
- Qualification: store filled samples with the exact cap torque, then check for seepage at the liner edge and label lifting.
If you see residue around the cap after opening, treat it as a seal chemistry issue first, not a container resin issue.
7) Operational Practices That Protect Compatibility
Even the right materials can fail if handling is careless.
- Control cap torque to avoid over-compression or under-sealing
- Avoid temperature shocks during filling and storage
- Keep threads clean so gaskets seat properly
- Use compatible lubricants only if specified for the closure system
- Verify lot-to-lot consistency for liners and gaskets, since elastomers vary
Packaging compatibility is not a one-time checkbox. It is a chain: product chemistry, material selection, closure design, and controlled handling all have to agree, or the weakest link will show up at the cap.
10.2 Filling Operations: Metering, Viscosity Compensation, and Headspace Control
Filling turns a prepared batch into a stable, saleable product, but it also introduces new variables: flow rate, temperature, foam, and the amount of air trapped above the liquid. Good filling operations treat these variables as controllable inputs rather than “whatever happens on the day.”
Metering Methods and What They Actually Control
Metering is the mechanism that determines how much product ends up in each container. The main choices are volumetric and gravimetric.
- Volumetric filling uses timed flow or piston/gear displacement. It is fast and consistent when viscosity and temperature stay steady. If viscosity drifts, the same valve opening can deliver different volumes.
- Gravimetric filling uses a scale to stop at a target mass. It tolerates viscosity changes better because the controller measures what was delivered, not how long it took.
A practical rule: if your product viscosity can vary meaningfully during the shift, gravimetric filling reduces surprises. If viscosity is tightly controlled and the line is stable, volumetric filling can be perfectly adequate.
Example: A liquid detergent at 25 °C fills well with volumetric timing. If the tank warms to 30 °C, viscosity drops, flow accelerates, and underfills can appear unless the system compensates.
Viscosity Compensation That Doesn’t Rely on Hope
Viscosity compensation is about keeping delivered quantity consistent when viscosity changes. There are three common approaches.
- Temperature control upstream: keep bulk product temperature within a narrow band before filling. This is the simplest and usually the most effective.
- Dynamic correction using viscosity or flow feedback: some systems estimate viscosity from temperature and/or measure flow rate and adjust valve timing.
- Use gravimetric targets: mass-based filling inherently compensates for viscosity effects on flow.
Even with compensation, you still need a calibration routine. Calibrate the metering element using the actual product and container size, not a “similar” batch. Then verify during production with periodic checks.
Example: For a 1 L bottle, you set a volumetric target of 1000 mL. During a run, you sample every 30 minutes and weigh filled bottles. If average mass trends low while temperature rises, you adjust timing or switch to gravimetric verification until the temperature returns to spec.
Headspace Control and Why Air Matters
Headspace is the air volume above the product. It affects oxidation, odor stability, foaming behavior during use, and sometimes label appearance (especially for products that can form micro-bubbles).
Headspace is influenced by:
- Fill level setpoint (the most direct lever)
- Product temperature (thermal expansion changes volume)
- Foam and entrained air (mixing and pumping can carry bubbles into the fill)
- Container geometry (neck shape changes how the same fill volume looks)
Control strategy should be systematic: define a fill level target in measurable terms (for example, “fill to 3 mm below the shoulder” or “fill to 980 g for a 1 L bottle”), then confirm that the target remains stable across temperature and viscosity ranges.
Example: A foaming-prone liquid detergent shows higher variability in fill level when the pump runs at higher speed. Slowing the pump reduces entrained air, and headspace becomes more consistent without changing the fill setpoint.
Operational Checks That Keep the Line Honest
A filling line needs routine verification that connects process conditions to outcomes.
- In-process mass/volume checks: sample at defined intervals and after any changeover.
- Temperature logging: record bulk tank temperature and, if possible, product temperature at the filling head.
- Foam observation criteria: define acceptable foam height or bubble presence before starting a run.
- Nozzle and hose condition: residue buildup can change flow resistance and affect metering.
If you see a drift, investigate in the order that reduces wasted time: temperature first, then metering calibration, then pump settings and foam.
Mind Map: Filling Operations Controls
Example: Integrated Filling Workflow for a Liquid Detergent
- Confirm bulk temperature is within the defined band before starting.
- Run a short calibration batch for the specific bottle size and target fill.
- Set the fill level setpoint to achieve the required headspace, then verify by measuring filled bottle appearance and mass.
- Start production and sample filled units at the defined interval, recording mass and temperature.
- If mass drifts, adjust temperature or metering correction before changing headspace setpoints.
- If headspace variability increases, check pump speed, mixing conditions, and foam at the nozzle.
This workflow keeps metering, viscosity, and headspace aligned so the filling line produces consistent containers, not just consistent noise.
10.3 Labeling Requirements and Batch Coding: Traceability and Reconciliation
Labeling is where chemistry meets paperwork. A good label lets you answer, quickly and confidently, three questions: What is it? Who made it? What went into it and when?
Foundational Concepts for Traceability
A batch code is an identifier tied to a specific production run. It should be unique enough that two different runs never share the same code, even across shifts and months. Traceability means you can connect that batch code to:
- The approved formula or recipe version used
- The raw material lot numbers and key certificates
- The process record (temperatures, pH targets, mixing times, reaction endpoints)
- The test results that determined release
- The packaging and filling records that produced the final units
Reconciliation is the final step: confirming that what you shipped matches what you recorded. If the label says Batch 24-0517-AX, the warehouse should not be holding units from a different fill run.
Label Elements That Must Work Together
A practical label layout uses a “minimum viable set” that supports both compliance and operations:
- Product identity: name and form (liquid, powder, bar)
- Net content: quantity and units
- Batch code: the primary traceability key
- Manufacturing site or facility identifier
- Lot/batch date information: production date or best-before date as required
- Storage guidance: conditions that protect performance and safety
Even when regulations vary by region, the internal logic stays the same: the batch code must be the bridge between the physical container and the electronic batch record.
Designing a Batch Coding Scheme
A batch code should be structured so humans can read it and systems can sort it. One common pattern is:
- Facility code (two to four characters)
- Year and month (or Julian date)
- Run sequence (to distinguish multiple runs in the same period)
- Optional line or shift indicator
Example batch code: PL-2404-017-B
- PL = facility
- 2404 = April of the year
- 017 = run sequence
- B = packaging line or shift
Keep the scheme stable. Changing it frequently creates reconciliation errors that look like “mysterious” quality issues but are really paperwork issues.
Mind Map: Traceability and Reconciliation Flow
Reconciliation Checks That Prevent Real Mistakes
Reconciliation is not one check; it is a chain of confirmations.
-
Batch record to label: Before printing, the system should pull the batch code from the approved batch record, not from a manual entry field.
-
Label to packaging run: Packaging often happens after production. The fill order should reference the batch code and the correct packaging configuration (cap type, liner, viscosity range).
-
Packaging run to shipment: The pick list should include batch code and packaging line. If a pallet contains mixed batch codes, it should be split or clearly segregated.
-
Returns handling: When a customer return arrives, the batch code guides the investigation. You can compare the returned units to the release tests and the raw material lots used.
Example: A Clean Reconciliation for a Liquid Detergent
Suppose a liquid detergent batch is produced on 2026-04-12 and assigned batch code PL-2404-017-B. The batch record shows:
- Recipe version: R3.2
- Neutralization endpoint: pH target achieved within tolerance
- Viscosity: in-spec at release temperature
- Raw material lots: surfactant lot S-8841, builder lot B-2207
During filling, the packaging order references the same batch code. The label printer is configured to print PL-2404-017-B on every unit. At palletization, the operator scans the batch code and confirms it matches the pallet label. When the pallet is shipped, the shipping document lists the batch code, and the warehouse system records it against the same batch code.
If a mismatch occurs—say the pallet label shows PL-2404-016-B—the shipment is blocked before it leaves the dock. That single prevention step saves time later, because you avoid investigating a “quality defect” that is actually a labeling mismatch.
Advanced Details Without Making It Complicated
For high-volume operations, add two safeguards:
- Changeover verification: At the moment you switch from one batch to the next, require a scan-and-compare of the batch code on the first printed labels and the first filled containers.
- Sampling for label correctness: Even with automation, sample a defined number of units per pallet to confirm batch code legibility, placement, and print quality.
These controls keep traceability reliable and make reconciliation a routine check rather than a stressful hunt for the “right” paperwork.
10.4 Storage Conditions: Temperature, Segregation Prevention, And Shelf-Life Testing Practices
Storage is where good manufacturing intentions either survive contact with reality or quietly fall apart. For soap and detergent products, the main enemies are temperature swings, slow chemical changes, and physical separation that turns a uniform batch into a “top layer and bottom layer” situation.
Foundational Storage Principles
Start with the product’s physical state and formulation design. Liquids often rely on dissolved surfactants, solubilizers, and viscosity builders that can change with temperature. Powders and granules rely on moisture control and stable particle packing. Bars rely on stable soap crystal structure and controlled residual alkali.
A practical storage plan begins with three questions: What temperature range keeps the product in its intended phase? What conditions could cause separation or precipitation? What analytical checks prove the product still meets specifications after storage?
Temperature Control That Actually Matters
Temperature affects both chemistry and physics. Higher temperatures can accelerate hydrolysis, oxidation, and fragrance loss. Lower temperatures can trigger clouding, viscosity changes, or crystallization in systems that are stable only within a window.
Use a defined storage temperature band rather than a single number. For example, if your liquid detergent is formulated to stay clear between 20–30°C, then storing at 5°C for weeks may cause haze or partial phase separation even if the product is “fine” at room temperature. The best practice is to set: (1) a target range, (2) an alarm range, and (3) an action range.
Example practice: Place temperature loggers in representative locations—near doors, in the center of the warehouse, and above pallet height where heat stratifies. If door-side logs show frequent excursions, adjust receiving schedules or add insulation rather than blaming the formulation.
Segregation Prevention Through Handling and Packaging
Segregation is physical separation driven by density differences, incomplete dissolution, or particle settling. In liquids, it can show up as phase layering, viscosity gradients, or uneven dispersion of insoluble components. In powders, it can show up as caking, moisture-driven clumping, or ingredient stratification before packaging.
Preventing segregation starts before storage. Ensure the product is fully homogenized at batch end-point and that filling equipment does not introduce air or shear that destabilizes the system. During storage, keep containers upright, minimize headspace agitation, and avoid repeated temperature cycling.
Packaging choices support stability. Use closures that prevent moisture ingress for powders and granules. For liquids, select container materials compatible with surfactants and any dissolved salts, and ensure seals prevent slow leakage that can change concentration.
Example practice: If a liquid product contains suspended or partially soluble components, require a “post-storage check” before release. For instance, inspect a sample for clarity and perform a simple mixing test: invert the container 10 times, then observe whether the product returns to uniform appearance within a set time.
Shelf-Life Testing Practices That Tie to Real Use
Shelf-life testing should connect storage conditions to measurable quality attributes. Build a stability program with timepoints that reflect your storage band and worst-case handling. Include at least one accelerated condition and one condition that matches normal storage.
A systematic testing set typically includes:
- Chemical indicators: pH, active content, free alkali or free fatty acid (as applicable), and any key degradation markers.
- Physical indicators: clarity, viscosity, density, and sedimentation or separation rating.
- Performance indicators: foam behavior, wetting, rinsability, or dissolution time—chosen to match the product’s claims and customer expectations.
Example schedule: Test at 0, 1, 3, and 6 months under normal storage conditions, and at an elevated temperature for shorter intervals. If the product is packaged in multiple formats, test the most challenging one first (often the one with the highest moisture exposure risk or the largest headspace).
Acceptance Criteria and Decision Rules
Define acceptance criteria before testing begins. Criteria should be tied to specifications, not just “looks okay.” For physical attributes, use a consistent method such as a visual rating scale under standardized lighting, plus instrument readings where possible.
Decision rules prevent confusion. If a batch fails one attribute but passes others, specify whether it can be reworked, relabeled, or must be rejected. For example, a slight viscosity drift might be acceptable if performance tests still meet requirements, while a separation that does not remix fails immediately.
Mind Map: Storage Conditions and Shelf-Life Controls
Example: Turning Storage Data Into Release Confidence
Suppose a liquid detergent shows minor haze after 3 months in one warehouse zone but not in the center zone. The temperature logs reveal that door-side pallets repeatedly drop below the target band during receiving. The corrective action is to adjust receiving staging and add insulation for door-side storage, then retest samples from the corrected setup. This approach keeps the focus on controllable variables rather than guessing whether the formulation is “mysteriously changing.”
A good storage program ends with consistent release decisions: containers stored within the defined band, segregation checks performed when needed, and shelf-life testing that uses the same quality attributes you monitor at release. That’s how storage becomes a controlled step, not a waiting game.
10.5 Returns, Rework, and Disposal: Documented Procedures and Quality Impact Assessment
Returns are not “mystery boxes.” They are data with a shipping history. A documented system turns that history into a quality decision: return to stock, rework, downgrade, or dispose.
Foundational Concepts for Quality Impact
Start with three questions for every returned unit or batch lot: What changed since packaging? What quality attributes could that change affect? What evidence do we have to prove the outcome?
For cleaning products, the most sensitive attributes are usually appearance (clarity, haze, color), chemical strength (active content, free alkali or free fatty acid), physical behavior (viscosity, separation, foam), and safety-relevant properties (pH, corrosivity, microbial contamination risk for water-based systems). Temperature swings during storage and transport can shift viscosity and phase behavior, while long dwell times can increase degradation or promote settling.
Returns Intake and Segregation
Upon receipt, label the item or lot as “Quarantine” and physically separate it from release stock. Record the return reason, packaging type, lot/batch code, quantity, and any visible damage. If the container is leaking, bulging, or missing a label, treat it as higher risk and route it to disposition faster.
A simple rule helps: if you cannot trace the lot code to the manufacturing record, you cannot confidently assess chemical strength. In that case, rework becomes “reformulation,” not “repair,” and disposal is often the cleanest option.
Evidence Collection and Testing Strategy
Use a tiered approach so you do not test everything at maximum intensity.
- Low-risk returns: unopened, intact seals, normal storage conditions, short time out of control. Verify key attributes with targeted tests.
- Medium-risk returns: opened, damaged label, uncertain storage temperature, or minor container defects. Add tests that detect phase instability and chemical drift.
- High-risk returns: leaking containers, severe temperature exposure indicators, missing traceability, or evidence of contamination. Test more attributes or skip straight to disposal depending on risk tolerance and regulatory requirements.
Example: A liquid detergent returned with slight cloudiness and a lot code intact. You would check pH, viscosity, and active content. If viscosity is within spec and pH is stable, you can consider rework such as controlled mixing and filtration only if the product is known to tolerate those steps.
Rework Decision Rules
Rework is an intentional process change applied to a returned unit or lot to bring it back to specification. It must not be a way to “hope” the product will behave.
Document each rework method with: purpose, step-by-step procedure, equipment used, critical control points, and acceptance criteria. Common rework actions include:
- Re-homogenization: for minor separation in liquids, using controlled mixing to restore uniformity.
- Rework by adjustment: for measurable deviations such as pH or viscosity, using validated dosing and mixing times.
- Reprocessing: for powders or granules, where feasible, such as re-milling and re-blending under strict mass balance controls.
Example: Powder detergent with caking. If bulk density and dissolution performance are slightly off, rework may include controlled de-caking and re-blending with verified retention of active content. If the active content is low or moisture uptake is high, rework becomes unreliable and disposal is safer.
Quality Impact Assessment and Acceptance Criteria
Quality impact assessment links the return history to measurable outcomes. Use the manufacturing record to identify what “normal” looks like: target ranges for pH, active content, viscosity, and stability indicators.
Acceptance criteria should include both pass/fail tests and limits for rework process parameters. For instance, if rework requires heating to reduce viscosity, you must control temperature and time to avoid accelerating degradation.
A practical checklist for every disposition decision:
- Lot traceability confirmed
- Container integrity assessed
- Quarantine duration recorded
- Testing tier selected and completed
- Results compared to spec and rework acceptance limits
- Rework steps executed exactly as written
- Final release testing completed
- Batch record updated with return and disposition notes
Disposal Procedures and Documentation
Disposal is not a paperwork afterthought. It must prevent accidental release and ensure environmental compliance.
Document the disposal method, responsible personnel, waste stream classification, and the quantity disposed. Record whether disposal was due to chemical failure (out-of-spec active content), physical failure (unacceptable separation or instability), safety concerns (pH extremes, contamination indicators), or traceability gaps.
Example: A returned liquid with leaking packaging and unknown storage conditions. If the container integrity is compromised, you cannot reliably confirm concentration or contamination status. Disposal is documented with the test results (or the reason tests were not performed) and the lot traceability.
Mind Map: Returns, Rework, and Disposal Workflow
Case Study: One Lot, Four Outcomes
A single batch of liquid detergent is returned in four shipments.
- Shipment A: intact seals, short transit time. Tests pass; returned to stock.
- Shipment B: label damaged but unopened. Tests show pH slightly low; rework by controlled pH adjustment and mixing; tests pass; released.
- Shipment C: opened container with visible separation. Re-homogenization attempted; viscosity remains out of spec; downgraded to a lower-performance category if allowed, otherwise disposed.
- Shipment D: leaking container and missing lot code. Traceability fails; disposal documented without attempting to “fix” unknown concentration.
Each outcome is consistent with evidence collected and the documented acceptance criteria, so the process stays repeatable rather than personal.
11. Safety, Environmental Compliance, and Plant Readiness
11.1 Hazard Identification for Soap and Detergent Inputs: Corrosives, Flammables, and Irritants
Hazard identification starts with a simple question: what can go wrong during receiving, storage, transfer, reaction, and packaging? For soap and detergent manufacturing, the answer often clusters into three input types—corrosives, flammables, and irritants—each with distinct failure modes. The goal is not to memorize lists, but to connect the chemical’s properties to the plant’s real tasks.
Foundational Approach to Hazard Identification
Begin by building an input inventory that includes the chemical name, concentration or grade, physical form (liquid, solid, powder), and the exact handling steps. Then map each step to potential exposure routes: skin contact, eye contact, inhalation of vapors or dust, ingestion, and contact with hot or reactive mixtures. A powder that seems “dry and harmless” can still create an inhalation hazard during weighing, while a liquid that looks manageable can become a corrosive splash risk when pumped or heated.
A practical way to keep this systematic is to use a task-by-chemical matrix. For each input, record: (1) hazard class, (2) likely release scenario, (3) immediate control, and (4) what to do if the scenario occurs. This prevents the common mistake of treating “the chemical” as the hazard rather than treating “the chemical in the process” as the hazard.
Corrosives in Soap and Detergent Inputs
Corrosives typically include strong acids, strong alkalis, and some salts that can be strongly caustic or reactive in solution. In detergent and soap work, corrosive exposure often happens during dilution, neutralization, and cleaning of equipment.
Key release scenarios include:
- Splash during transfer: Pumping concentrated alkali into water can generate heat and splatter if the addition order is wrong.
- Heat-driven escalation: Neutralization reactions can raise temperature quickly, increasing the chance of burns and vapor release.
- Residual contact: Hoses, pumps, and transfer lines can retain corrosive liquid after a batch, creating unexpected exposure during changeover.
Controls that match the scenario matter more than generic PPE. For example, if splashes are the main risk, focus on closed transfer, splash guards, and correct addition order. If residual contact is the main risk, focus on line draining, labeled isolation, and verified decontamination before maintenance.
Example: An operator prepares a caustic solution for a neutralization step. The hazard is not just “caustic is corrosive,” but “caustic added too fast to water can boil locally and splash.” A simple procedural control—adding concentrate slowly with agitation and using a sight glass or temperature interlock—reduces both burn risk and uncontrolled reaction.
Flammables in Soap and Detergent Inputs
Flammables show up as solvents, hydrotropes, or processing aids. Even when used in small amounts, they can create ignition risk if vapors accumulate near ignition sources.
Key release scenarios include:
- Vapor release during open handling: Pouring or venting can generate flammable atmospheres.
- Static discharge during transfer: Fine powders or fast liquid transfers can build charge.
- Hot surfaces and sparks: Heaters, pumps, and electrical equipment can ignite vapors.
Hazard identification should therefore include not only the chemical’s flash point, but also the plant’s ignition sources and ventilation conditions. A chemical with a higher flash point can still be risky if it is heated or if the process creates mist.
Example: A solvent used to aid dissolution is transferred to a mixing tank. The hazard is “flammable vapors near an ignition source,” not “the solvent is flammable.” A closed transfer method, bonding and grounding, and ensuring the tank area is ventilated during transfer are directly tied to that release scenario.
Irritants in Soap and Detergent Inputs
Irritants include many surfactants, fragrances, and powders that may not be corrosive but can cause skin, eye, or respiratory irritation. Irritation hazards are often underestimated because they do not always produce immediate severe injury.
Key release scenarios include:
- Dust generation during weighing: Powders can aerosolize and irritate eyes and airways.
- Aerosols during mixing: High-shear mixing can create droplets that increase inhalation exposure.
- Repeated low-level exposure: Chronic irritation can occur even when each exposure seems minor.
Controls should focus on minimizing airborne material and preventing eye exposure. Local exhaust ventilation at weighing stations, sealed containers, and careful addition practices reduce the chance of inhalation and eye contact.
Example: A fragrance concentrate is added to a batch. The hazard is eye irritation from splashes and vapor/aerosol exposure during addition. Using a closed addition point or a controlled pour with splash protection reduces both immediate and repeated irritation.
Mind Map: Of Hazard Identification Logic
Integrated Example Workflow
When a new input is introduced, start with its hazard type and then walk through the plant tasks: receiving, storage, transfer, dosing, and cleaning. If it is corrosive, confirm addition order and line draining. If it is flammable, confirm closed transfer, bonding/grounding, and ventilation. If it is an irritant, confirm dust control or aerosol minimization during weighing and mixing. This task-linked method keeps hazard identification grounded in what people actually do, which is where safety wins its points.
11.2 Process Safety Controls: Pressure/Temperature Limits, Relief Devices, and Emergency Shutdowns
Chemical reactions in soap and detergent plants are usually well-behaved—until they aren’t. Process safety controls exist to keep “until they aren’t” from becoming a headline. This section focuses on three layers that work together: defined pressure and temperature limits, properly sized relief devices, and emergency shutdown actions that bring the process to a safe state.
Foundational Limits and Why They Matter
Start with the safety limits, not the normal operating targets. Normal targets are where you want the process to run; safety limits are where you must stop or protect equipment. Pressure limits are typically tied to vessel design pressure and allowable stress. Temperature limits are tied to reaction kinetics, decomposition risk, and material compatibility.
A practical example: if a reactor is normally held at 85°C to complete neutralization, you might set a safety temperature limit at 95°C based on reaction behavior and jacket capability. The control system should intervene before reaching the safety limit, using alarms and interlocks that trigger at lower “action” thresholds.
Alarm, Interlock, and Shutdown Logic
Safety systems are not just “more alarms.” They are structured decisions. A common hierarchy looks like this:
- Operator alarm: alerts the team to investigate.
- Automatic control action: corrects the deviation when possible.
- Interlock: forces a protective action when a safety threshold is crossed.
- Emergency shutdown: places the process in a safe configuration.
For pressure, the interlock might stop feed and reduce heat input. For temperature, it might stop heating, increase cooling flow, and prevent additional reactant addition. The emergency shutdown should be designed so it does not depend on the operator noticing the problem in time.
Relief Devices: What They Do and What They Must Be
Relief devices protect equipment when pressure rises faster than controls can respond. They are sized for credible worst-case scenarios defined during hazard review. Relief devices include pressure relief valves, rupture disks, and sometimes vent systems that route to a safe disposal or containment.
Key best practices:
- Size for the scenario, not for the “usual” upset. If a feed pump fails closed, pressure might not rise much. If a cooling failure occurs while heat generation continues, pressure rise can be significant.
- Verify discharge routing. A relief valve that vents into a blocked line is just a fancy way to move the problem.
- Set pressure setpoints correctly. Setpoints must align with vessel design and the required protection philosophy.
- Maintain and test. Sticking, corrosion, or misalignment can defeat the device when you need it.
Concrete example: a reactor with a jacket that can fail to cool might have a relief valve that vents to a scrubber or containment tank. The vent system must handle foaming potential from surfactant solutions and must not create backpressure that prevents the valve from lifting.
Emergency Shutdown: Bringing the Process to a Safe State
An emergency shutdown (ESD) is a deliberate sequence that reduces hazard. It should not be a random “stop everything” button. Instead, it should move the process toward a condition where heat generation and reactive inputs are minimized.
A typical ESD action set for a soap or detergent reactor includes:
- Stop reactant feeds that contribute to heat generation or pressure rise.
- Stop or limit heating sources.
- Maximize cooling if cooling is safe and available.
- Isolate energy sources such as steam valves or electrical heaters.
- Keep safe agitation if needed to prevent localized overheating.
If the process uses flammable solvents or volatile components, ESD logic must also consider ignition sources and ventilation status. The goal is to prevent both overpressure and hazardous release.
Designing the Control Setpoints and Actions
Setpoints should be consistent across instruments and documents. A common failure mode is when the alarm limit, interlock limit, and relief valve set pressure are treated as separate worlds. To avoid that, define a safety instrumented function narrative: what sensor is used, what threshold triggers, what final elements move, and what state the process ends in.
Example logic for temperature:
- Temperature rises above Alarm: operator notified.
- Temperature rises above Interlock: stop feed and increase cooling.
- Temperature rises above Safety Limit: initiate ESD sequence that isolates heating and prevents additional reactant addition.
Mind Map: Process Safety Controls
Example: Cooling Failure Scenario
Assume a reactor is exothermic during neutralization. Cooling failure is detected when jacket outlet temperature rises. The control system should first attempt correction by switching to backup cooling or maximizing cooling valves. If temperature continues to rise and reaches the interlock threshold, the system stops feed and isolates heating. If temperature reaches the safety limit, ESD triggers: heating is cut, feeds are isolated, and the reactor is maintained in a safe configuration while pressure protection remains available through the relief system.
The important nuance is that relief devices and ESD do different jobs. ESD prevents the condition from getting worse; relief devices protect the equipment if prevention is not fast enough.
Example: Pressure Rise from Blocked Vent
Consider a vent line that becomes partially blocked by condensed vapors. Pressure rises despite normal control. An alarm triggers, but if pressure approaches the safety threshold, the interlock stops feed and heating. The relief device lifts to protect the vessel, but only if the discharge routing can accept the flow without creating excessive backpressure. This is why vent system integrity is part of the safety control set, not an afterthought.
Verification and Operational Discipline
Safety controls must be tested and documented so they behave as designed. That includes calibration of pressure and temperature sensors, proof testing of interlocks, and inspection of relief devices and discharge paths. During startups and changeovers, confirm that setpoints and logic match the current process configuration, because the plant is not a museum—people change things, and safety systems must keep up.
11.3 Chemical Handling And PPE: Transfer Practices, Spill Response, and Decontamination
Safe handling in soap and detergent plants is mostly about predictable movement of chemicals, clear boundaries, and fast containment. PPE matters, but it works only when transfer practices prevent splashes, leaks, and wrong-chemical mixing.
Transfer Practices
Start with a simple rule: the container you pour from is the container you intended to pour from. Labeling is not decoration; it is the last line of defense against “similar-looking” inputs like different surfactant grades or builder solutions.
Before any transfer, verify three items: the chemical identity, the concentration, and the receiving vessel condition. A receiving tank that still holds rinse water can dilute a caustic solution and change neutralization behavior. A vessel with residue from a previous batch can add unexpected ions that later show up as haze or poor dissolution.
Use closed or semi-closed transfer methods whenever possible. For liquids, pumps with properly rated hoses reduce drips compared with manual pouring. For powders, use sealed transfer systems or controlled scooping with local dust capture. If you must open a bag, open it over a tray or containment pan so the floor stays boring.
Control the flow rate. Fast transfers increase turbulence and splash risk, especially when adding viscous surfactant concentrates. A practical approach is to start at a low rate, confirm stable flow, then increase once the stream is fully established.
Keep transfer points organized. Hoses should be routed to avoid trip hazards and to prevent kinks that cause sudden surges. Store spare caps, bungs, and funnels at the transfer station so people do not improvise mid-transfer.
PPE Selection and Use
PPE selection should match the chemical hazard and the task. For corrosive solutions, gloves must be compatible with the specific chemical and concentration, not just “chemical resistant.” Eye protection should be sealed or splash-rated when transferring liquids.
A common failure mode is wearing gloves that are fine for contact but not for splash. If you are pouring, you need splash protection for forearms and clothing. Respiratory protection is task-dependent; dust from powders is different from mist from sprays or leaks.
Fit and donning matter. Gloves that are too large reduce grip and increase the chance of spills. Eye protection that fogs leads to removal, so anti-fog measures and proper ventilation are part of PPE effectiveness.
Change PPE when it is contaminated. A glove that has caustic on the outside is not “still okay” because it did not touch skin.
Spill Response
Spill response should be rehearsed like a checklist, not improvised like a story. The first step is to stop the source if it can be done safely. If you cannot stop it quickly, focus on containment and preventing spread.
Assess the spill size and hazard. A small splash on a bench is different from a leak that is actively feeding the floor. Identify the chemical and whether it is corrosive, flammable, or reactive with water. When in doubt, treat it as hazardous and isolate the area.
Containment comes next. Use absorbents or neutralizing materials only if they are compatible with the chemical. For example, neutralizers are not universal; using the wrong one can generate heat or fumes.
Prevent spread with dikes, socks, or barriers. Keep drains covered if the chemical could reach wastewater. Mark the area so others do not step into it while looking for the “spill kit.”
Ventilation is important for any spill that could release vapors or aerosols. If there is mist or strong odor, increase ventilation and limit time in the area.
After containment, clean up using a method that matches the spill type. Liquids typically require absorb, collect, and verify removal. Powders require dry collection first to avoid turning them into a slurry that spreads.
Decontamination
Decontamination is the step that makes the cleanup complete, not just “visually better.” Start with removing bulk residue using absorbents or wipes. Then wash the surface with an appropriate cleaning step to remove remaining chemical films.
Rinse water handling must be planned. If you rinse a corrosive spill into a drain, you may create a new hazard downstream. Collect rinse water when required by your site procedures.
Verify cleanliness. Visual inspection helps, but residue can remain on porous surfaces like concrete seams or scratched stainless. A practical verification method is to check pH on rinse water or swab samples when your site procedure specifies it.
Dispose of cleanup materials as contaminated waste. Absorbents, wipes, and gloves used in a spill are not general trash.
Document the event. Record the chemical, approximate quantity, location, cause, PPE used, response actions, and final verification. This record supports corrective actions like improving transfer fittings or adjusting training.
Mind Map: Chemical Handling and PPE
Example: Caustic Solution Transfer Spill
A worker notices a slow leak at a hose connection during transfer of a caustic solution. They stop the pump if safe, keep others away, and place absorbent socks around the base of the connection to prevent spread. After the leak stops, they absorb the liquid, collect contaminated materials, and wipe the area with a compatible cleaning step. They then collect rinse water from the cleanup area and verify removal by checking pH on the final rinse. The event record notes that the hose clamp was worn and replaced before the next transfer.
Example: Powder Bag Opening Dust Control
During powder addition, a bag tears at the seam. The worker avoids sweeping immediately, which would aerosolize dust. They contain the powder using a tray and dry collection method, then clean the surrounding area with a controlled wipe-down. PPE is updated if gloves or eye protection become contaminated, and cleanup waste is bagged as contaminated material. The batch record notes the addition interruption and confirms that the final target mass was achieved after cleanup.
11.4 Effluent and Waste Management: Neutralization, Separation, and Treatment Documentation
Effluent and waste management starts with a simple question: what leaves the process, in what form, and how variable is it. Soap and detergent plants typically generate wastewater streams from equipment washdowns, floor cleaning, off-spec batches, filter rinses, and container/line purges. These streams can carry surfactants, salts, residual alkali or acid, suspended solids, and sometimes fats or oils. The goal is to control chemistry first, then remove solids, then treat the remaining dissolved load—while documenting everything so the plant can prove it stayed within limits.
Foundational Stream Mapping and Segregation
Begin by separating streams at the source. High-strength alkaline or acidic wastes should not mix with relatively clean rinse water. Likewise, oily or fatty residues should be kept apart from general washdown water to avoid turning a manageable separation step into a grease festival.
A practical approach is to label each stream with three attributes: dominant chemistry (alkaline/acidic/neutral), dominant solids (none/low/high), and dominant organics (fats/oils/surfactant-rich). Even a basic spreadsheet helps operators decide which neutralization tank, separator, or treatment line to route to.
Neutralization Design and Control
Neutralization is the chemistry gatekeeper. It reduces corrosivity, stabilizes downstream biological treatment, and prevents pH shocks that can upset clarifiers and filters.
Key control variables are pH setpoint, mixing intensity, and dosing rate. Use a pH probe with routine calibration and a temperature-compensated reading, because pH behavior shifts with temperature. Mixing matters: without adequate agitation, dosing creates local high-pH zones that can cause precipitation, foaming, or incomplete neutralization.
Example: An off-spec batch wash contains high free alkali. Route it to a dedicated neutralization tank, dose acid slowly while monitoring pH, and hold until pH is stable for a defined time window. Then sample for pH and conductivity before transferring to separation. If pH overshoots, correct it in the same tank rather than “hoping” the next unit will fix it.
Separation for Solids and Oils
After neutralization, separation removes what can be physically separated: fats, oils, suspended solids, and precipitates formed during pH adjustment.
Common separation steps include:
- Gravity skimming or dissolved air flotation for oils and grease.
- Coarse screening for rags, flakes, and large solids.
- Clarification for suspended solids after flocculation.
- Filtration for polishing when effluent turbidity must be low.
Example: If neutralization causes fatty acids to precipitate, a clarifier or flotation step should be upstream of biological treatment. Sending precipitated fats downstream can increase sludge volume and reduce treatment efficiency.
Treatment Line Selection and Operational Logic
Treatment often follows a staged logic: remove solids, then reduce dissolved organics and surfactant load. Many plants use a combination of equalization, biological treatment, and final polishing.
Equalization tanks buffer flow and concentration swings. They also prevent “batch-to-batch” chemistry from directly hitting sensitive units. Biological systems typically require stable pH and adequate nutrients; neutralization and separation therefore protect the biology.
Example: A filter rinse stream is high in surfactants but low in solids. Route it to equalization rather than a grease separator, because the separator’s performance depends on oil/grease presence.
Documentation That Holds Up Under Questions
Documentation is not paperwork for its own sake; it is the evidence trail that links process actions to environmental compliance.
Maintain records for:
- Stream routing decisions and any changes.
- Neutralization logs including influent pH, acid/base dosing rates, mixing conditions, pH hold time, and final pH.
- Separator performance such as skimmer skim volume, clarifier sludge volumes, and filter differential pressure.
- Sampling and test results for pH, conductivity, turbidity, oil/grease, and any site-specific parameters.
- Waste handling records for sludge, spent filters, and any off-site disposal.
Use batch-style traceability for unusual events. If an operator reroutes a stream due to a maintenance outage, record the reason, the duration, the affected units, and the compensating controls.
Mind Map: Effluent Management Flow
Case-Style Example: Neutralize, Separate, Then Treat
On a Tuesday, a line purge generates a small but strong alkaline stream. The plant routes it to the neutralization tank, doses acid while monitoring pH, and holds until pH is stable. After neutralization, the stream shows increased turbidity due to precipitated fatty residues, so it is sent to clarification and then filtration. Only after solids are reduced does it enter equalization for biological treatment. Operators record the routing, dosing profile, pH stability window, clarifier sludge volume, and the final sampling results.
This sequence prevents two common headaches: downstream units receiving corrosive or unstable chemistry, and biological treatment being burdened with fats and precipitates that should have been removed earlier. The documentation ties each decision to measurements, so compliance checks can be answered quickly and accurately.
11.5 Training, SOPs, and Management of Change Ensuring Consistent Operations
Consistent soap and detergent production depends on two things working together: people who know what “right” looks like, and written procedures that keep “right” from drifting. Training provides the muscle memory; SOPs provide the map; Management of Change (MOC) prevents small edits from turning into big quality surprises.
Training That Matches Real Tasks
Start with role-based training, not generic classroom sessions. A reactor operator needs different competence than a lab analyst, even if both touch the same batch record.
A practical training structure:
- Foundations: hazards, basic chemistry intent, and how quality attributes connect to process steps.
- Hands-on: performing key actions under supervision, such as calibrating pH probes, verifying dosing pumps, and taking samples without contaminating them.
- Verification: demonstrating understanding through short, scenario-based checks.
Example: If a trainee is asked to explain why neutralization is controlled by pH and not by “time,” they should be able to describe how alkalinity demand varies with raw material composition and how overshooting pH can increase haze or destabilize a liquid system.
Training should also include “stop rules.” For instance, if temperature control fails during saponification, the operator must know when to pause, notify, and document rather than continuing and hoping the batch recovers.
SOPs That Are Specific Enough to Be Used
An SOP is not a policy poster. It must be usable at 2 a.m. by someone who is tired but competent.
Good SOPs include:
- Purpose and scope: what product types and equipment the SOP covers.
- Responsibilities: who performs each step and who reviews.
- Materials and equipment: exact instruments, ranges, and required checks.
- Step-by-step procedure: order of addition, mixing speeds, sampling points, and acceptance criteria.
- Deviations and documentation: what to record when reality differs from the plan.
Example SOP micro-structure for neutralization:
- Verify calibrated pH meter and temperature compensation.
- Confirm target pH band and allowable overshoot limit.
- Add neutralizing agent at a defined rate until pH approaches the band.
- Hold and mix for a defined mixing time, then re-check pH.
- Record final pH, temperature, and any corrective actions.
This prevents the common failure mode where the “procedure” is really a list of ingredients and the operator improvises the control logic.
Management of Change That Prevents Quiet Drift
MOC is the system for deciding whether a change is safe, controlled, and documented before it touches production. It applies to equipment, software, raw materials, formulations, utilities, and even staffing changes that alter how work is performed.
A solid MOC process has clear triggers:
- New supplier or lot for a key surfactant or fatty feedstock.
- Change in dosing pump calibration method.
- Adjustment to mixing speed, heating rate, or addition order.
- Modification to control logic or alarm limits.
MOC steps that keep decisions traceable:
- Request: describe what changes, why, and what might be affected.
- Impact assessment: chemistry, process control, safety, and quality attributes.
- Risk controls: what tests, hold points, or additional sampling will confirm the change.
- Approval: defined roles sign off before implementation.
- Implementation: execute with the updated SOP or work instruction.
- Verification: confirm performance on the first batches and compare to acceptance criteria.
- Closure: document results and update training if needed.
Example: A new zeolite supplier has slightly different particle size distribution. MOC requires an assessment of dissolution behavior and viscosity impact, then verification tests such as clarity, viscosity, and foam performance on representative batches.
Mind Map: Training, SOPs, and MOC
Integrated Example Workflow from Request to Consistent Output
On 2026-04-15, a plant receives a new batch of fatty feedstock with a different free fatty acid profile. The operator notices the titration result differs from the typical range.
- Training guides the operator to treat this as a potential neutralization and saponification impact, not as a “minor variation.”
- SOPs specify the sampling frequency, titration method, and how to adjust the process within defined limits.
- MOC is triggered because the raw material change can affect reaction completion and final soap bar firmness. The impact assessment defines additional checks such as free alkali/FFA confirmation and bar hardness targets.
The batch proceeds only after approvals and defined verification steps. After results are within acceptance criteria, the change is closed with documentation and any necessary training updates for future operators.
When training, SOPs, and MOC are aligned, the plant doesn’t rely on individual memory. It relies on a system that keeps chemical reactions and process control behaving the same way batch after batch.
12. Practical Troubleshooting and Case-Based Process Improvement
12.1 Defects in Liquid Products: Separation, Gelation, Low Viscosity, and Cloudiness
Liquid detergents are chemical systems that must stay uniform from kettle to bottle. When they don’t, the symptoms usually point to one of four failure modes: separation, gelation, low viscosity, or cloudiness. The fastest way to fix them is to connect each symptom to the underlying mechanism, then verify with a small set of targeted checks.
Foundations: What “Stable Liquid” Means
A stable liquid detergent typically has three coordinated behaviors:
- Surfactant phase behavior stays in the intended region so micelles remain dispersed.
- Water and electrolytes stay balanced so salts do not force precipitation.
- Thickening and structuring systems (polymers, clays, or associative thickeners) maintain their network without collapsing.
A practical rule: if the defect changes with time, temperature, or mixing history, suspect phase behavior or structuring breakdown rather than a simple dosing error.
Mind Map: Defect to Cause to Checks
Separation: When Layers Form
Separation shows up as a clear layer, a cloudy layer, or a distinct phase boundary. The most common drivers are electrolyte imbalance and incomplete dissolution.
Easy example: A liquid detergent formulated with a builder salt is produced, but the builder is added late and not fully dissolved before surfactant addition. The result can be localized high ionic strength. Micelles reorganize, and a denser phase forms at the bottom.
Systematic checks:
- Time and temperature observation: note whether separation accelerates at warm storage.
- Conductivity and pH: compare to target ranges; a drift often indicates dosing or water-quality mismatch.
- Centrifuge test: if the defect concentrates quickly, precipitation or phase separation is likely.
- Order-of-addition review: verify that solids were dissolved before the surfactant system was fully developed.
Best-practice fix: dissolve builders and any salt-forming components completely in water before adding surfactants, and maintain controlled temperature during the transition from dissolution to final mixing.
Gelation: When the Liquid Becomes a Soft Trap
Gelation is the formation of a network that traps liquid, often appearing as strings, lumps, or a sudden viscosity jump.
Easy example: A polymer thickener is sprinkled into the tank while the mixture is still cold. The polymer hydrates at the surface, forming gel clumps that never fully disperse. The batch may still look acceptable at first, then thicken unevenly.
Systematic checks:
- Gel formation time: does it happen within minutes or after hours?
- Filterability: if it clogs a filter quickly, the defect is structural, not just optical.
- Addition temperature and shear: compare to the validated process window.
- Hard-water ion sensitivity: if gelation correlates with higher calcium or magnesium, salt incompatibility is likely.
Best-practice fix: pre-disperse or hydrate polymers under controlled temperature and shear, and avoid local concentration spikes by using a controlled addition rate.
Low Viscosity: When the Product Feels “Too Thin”
Low viscosity can come from under-dosing, wrong pH, insufficient mixing, or polymer performance loss.
Easy example: A batch is produced with correct ingredient weights, but the pH is slightly low because neutralization was stopped early. Many polymer thickeners require a specific ionization state to expand and build viscosity.
Systematic checks:
- Viscosity measurement at a fixed temperature: viscosity is temperature-dependent, so compare apples to apples.
- pH and alkalinity: confirm the neutralization endpoint with the same method used in validation.
- Mixing log: check whether shear was reduced during a changeover or pump issue.
- Polymer integrity: if viscosity drops across multiple batches from the same lot, suspect raw material variability.
Best-practice fix: control neutralization tightly, and verify thickener performance by sampling during the final hold, not only at packaging.
Cloudiness: When Clarity Turns Into Turbidity
Cloudiness can be optical (tiny particles) or chemical (precipitation). The key is to determine whether solids are present.
Easy example: A formulation includes a fatty component or salt that is marginally soluble. If water quality changes or temperature drops during hold, the component precipitates into fine particles, creating persistent haze.
Systematic checks:
- Filter test: if the product clears after filtration, particles are the likely cause.
- Turbidity vs. temperature: if cloudiness increases as temperature decreases, solubility or phase behavior is involved.
- Raw material inspection: check for insoluble matter or unexpected color changes.
- Micelle disruption indicators: compare conductivity and surfactant system ratios to targets.
Best-practice fix: manage water quality, keep the system within the validated temperature range during hold, and ensure complete dissolution before final blending.
Integrated Troubleshooting Workflow
Start with the symptom, then narrow by mechanism:
- Separation points to phase behavior or incomplete dissolution.
- Gelation points to structuring systems and hydration conditions.
- Low viscosity points to polymer performance, pH, or mixing history.
- Cloudiness points to precipitation, particles, or optical effects.
Use the same discipline each time: record addition order, temperatures, pH, and conductivity; then run one targeted verification test per suspected mechanism. That approach turns “the batch looks wrong” into a short list of causes you can actually test.
12.2 Defects in Powders/Granules: Caking, Poor Dissolution, and Inconsistent Bulk Density
Powder and granule defects usually trace back to how particles were formed, dried, and handled, then how they behave when they meet water or air. Caking, poor dissolution, and bulk density swings often show up together because the same root causes—moisture, particle size distribution, and surface chemistry—affect all three.
Foundations: What These Defects Mean
Caking is unwanted agglomeration into hard lumps. It can be reversible (soft lumps that break with pressure) or irreversible (baked-on solids).
Poor dissolution means the product wets slowly, forms floating clumps, or leaves undissolved residue. Dissolution is not only chemistry; it is also wetting, dispersion, and how fast water can penetrate pores.
Inconsistent bulk density is a packaging and process headache. It changes fill weights, affects flow through hoppers, and can correlate with segregation of particle sizes.
A useful mental model is: moisture and surface stickiness control caking; particle size and porosity control dissolution; particle size distribution and shape control bulk density.
Mind Map: Defect Drivers and Links
Caking: Systematic Diagnosis
Start with the simplest measurements. If caking worsens after storage in humid conditions, moisture uptake is the prime suspect. Check incoming and in-process moisture targets, then verify packaging barrier performance. A practical example: a detergent powder that meets spec at 2.0% moisture may still cake if the headspace humidity is high and the product contains a hygroscopic builder salt.
Next, look at particle fines. Fines fill voids and increase contact points, which raises the chance of capillary bridges forming when moisture is present. If your granulation step produces a higher fines fraction than usual, caking can increase even when average moisture stays within limits.
Finally, consider binder or tackifier levels and drying intensity. Overly aggressive drying can create brittle particles that fracture into fines during handling, while under-drying can leave surface tack that promotes agglomeration. The “fun” part is that both routes can increase caking.
Example: Fixing a Caking Complaint
A plant receives customer complaints after two weeks. Lab results show moisture is slightly higher than normal (2.3% vs 1.9%), and fines are elevated. The corrective action is twofold: tighten drying endpoint control and adjust granulator feed so the fines fraction returns to the historical window. Afterward, caking severity drops without changing the formulation.
Poor Dissolution: From Wetting to Dispersion
Poor dissolution often begins with wetting. If the powder floats or forms a crust, water cannot spread across particle surfaces. This can happen when actives are not evenly distributed, or when coatings are too thick. A concrete example: if a fragrance or polymer coating is applied late and unevenly, some particles become more hydrophobic, slowing wetting.
Dispersion failure follows. Hard agglomerates resist breakup, so even if water wets the outside, the interior remains trapped. This links directly to granule strength and agglomeration conditions during production.
Water penetration is the third lever. Granules with low porosity can trap water outside, delaying dissolution. If you see undissolved residue that looks like intact granules, suspect porosity and coating thickness rather than only chemistry.
Example: Improving Dissolution Without Reformulation
A powder shows slow dissolution in a standardized test. Particle analysis reveals a higher proportion of large, dense granules. The process change is to reduce granulator residence time and adjust binder spray rate to produce slightly more porous granules. Dissolution improves because water penetrates faster and granules break apart more readily.
Inconsistent Bulk Density: Controlling Flow and Fill
Bulk density swings usually come from particle size distribution and particle shape. If granulation produces a wider size spread, the product packs differently each run. Handling can also crush larger granules into fines, increasing cohesion and lowering flow.
Moisture adds another layer. Even small moisture changes can increase interparticle attraction, which raises apparent bulk density in some cases but worsens flow and can increase caking later.
Example: Stabilizing Bulk Density
During a shift change, bulk density drifts and filling becomes inconsistent. Investigation shows the screen used for sizing was replaced and its opening tolerance differed from the previous screen. Restoring the correct screen specification brings the particle size distribution back in line, and bulk density stabilizes.
Practical Checks and Acceptance Logic
Use a small set of measurements to avoid chasing ghosts: moisture, fines fraction, particle size distribution, and a dissolution test that includes observation of clumping. When caking and dissolution both worsen, prioritize moisture and granule strength. When bulk density changes without major dissolution issues, prioritize sizing and handling-induced breakage.
If you treat these defects as linked outcomes of particle formation and moisture behavior, the fixes become more direct: control drying endpoints, manage fines, tune granulation conditions, and verify packaging barrier and handling practices.
12.3 Defects in Bars: Softness, Excess Free Alkali, Haze, and Surface Cracking
Bar defects usually come from a small set of process and formulation causes: incomplete reaction, uneven neutralization, poor crystallization and drying, and contamination or water imbalance. The trick is to treat each defect as a symptom, then trace it back to the specific step where the chemistry or physical structure went off-script.
Foundational Checks Before Chasing Ghosts
Start with three baseline observations from the same batch: (1) bar hardness and feel after the standard cure time, (2) appearance under consistent lighting, and (3) a quick chemical screen for free alkali and free fatty acid. If you can’t measure free alkali/FFA, you’ll end up “fixing” by guesswork, which often trades one defect for another.
A bar is a structured solid made from soap crystals plus any remaining unsaponified material, salts, and additives. Reaction completion and neutralization determine how much soap is actually formed and how much reactive material remains. Drying and cooling determine how crystals pack and how much water stays trapped. Surface cracking is often a mechanical consequence of shrinkage during cooling and cure.
Softness
Soft bars typically mean the soap matrix holds too much water, has too much unsaponified or low-melting components, or never developed a stable crystal network.
Common causes and practical examples:
- Over-neutralization or under-neutralization leading to unstable salt composition. Example: If you target a neutralization endpoint using pH alone, but your batch water hardness varies, the same target pH can yield different salt forms. The result is a softer bar even when the pH “looks right.”
- Insufficient cooling and finishing control. Example: If milling or plodding is delayed, the mass can cool unevenly. Later, during cure, parts of the bar shrink more than others, leaving a softer, uneven feel.
- High free fatty acid or unsaponified oil. Example: A batch with slightly elevated FFA can feel greasy and soft because the matrix is disrupted.
Process controls that help:
- Use an endpoint method tied to chemistry (titration for FFA/free alkali) rather than only temperature or pH.
- Standardize cooling and finishing timing so the same thermal history produces the same crystal structure.
Excess Free Alkali
Free alkali is a direct sign that neutralization didn’t consume all reactive alkali. It can also accelerate skin irritation and can contribute to haze and surface issues.
Common causes and examples:
- Neutralization endpoint set too early. Example: Operators may stop neutralization when pH reaches a convenient value, but the soap mass can continue reacting as it cools. The bar later tests positive for free alkali.
- Poor mixing during neutralization. Example: If agitation is reduced near the end of neutralization, local pockets of alkali can remain. The bar may look normal at first but fails titration.
- Raw material variability. Example: A fatty feedstock with higher free fatty acid content changes the stoichiometry needed for complete neutralization.
Best-practice response:
- Confirm endpoint with titration and record the exact addition order and mixing intensity.
- When a batch fails, compare not only the final pH but also the neutralization curve and mixing conditions.
Haze
Haze is usually a physical appearance defect caused by incomplete dissolution, unstable crystal size distribution, or precipitation of salts and insolubles.
Common causes and examples:
- Water hardness and builder interactions. Example: A formula that clears in soft water can turn hazy in hard water because calcium salts form and scatter light.
- Temperature mismatch at finishing. Example: If the mass is too cool during finishing, soap crystals can form prematurely and unevenly, creating a cloudy look.
- Entrained insolubles or poor filtration. Example: Fine particulates that normally settle can remain suspended if mixing is too aggressive or if holding time is too short.
Controls that reduce haze:
- Control water quality and document it with each batch.
- Align finishing temperature and hold times so crystallization happens in the intended window.
Surface Cracking
Surface cracking is often mechanical: the bar shrinks during cooling and cure, but the surface layer loses water or cools faster than the interior.
Common causes and examples:
- Drying too fast or uneven. Example: If bars are exposed to strong airflow immediately after cutting, the surface dries and shrinks while the core still contains more moisture, leading to cracks.
- Cooling gradients in the mold or cutter. Example: A mold with uneven temperature can produce bars that crack only on one side.
- High free alkali or residual reactive components. Example: Excess free alkali can change how the matrix sets, increasing shrinkage stress.
Practical mitigation:
- Standardize airflow, humidity, and time-to-cure conditions.
- Ensure consistent cooling and verify mold temperatures across the line.
Mind Map: Defect to Cause to Check
Case Example: One Batch, Four Symptoms
A batch shows soft bars, slight haze, and occasional surface cracking. Titration reveals elevated free alkali. The immediate fix is not “more drying.” Instead, the team reviews the neutralization curve and finds the endpoint was reached based on pH before the reaction had fully consumed alkali. After adjusting the neutralization endpoint method and tightening mixing during the final additions, the next batch shows firmer hardness, reduced haze, and fewer cracks. The key lesson is that physical defects often follow chemical incompletion, and the fastest path is to verify chemistry first, then tune physical processing.
12.4 Root Cause Investigation Workflow: Data Review, Hypothesis Testing, and Verification
A good root cause investigation is less about finding a culprit and more about narrowing uncertainty. The workflow below moves from evidence to explanation to confirmation, using the same logic you’d apply to a chemistry problem: measure, propose, test, and verify.
Step 1: Data Review with Clear Boundaries
Start by defining what “wrong” means in measurable terms. For example, a liquid detergent batch might be “out of spec” for viscosity at 25°C, with pH within limits and active content within limits. That boundary matters because it prevents you from chasing every anomaly.
Next, collect data in three layers:
- Process timeline: reactor temperatures, addition timestamps, mixing speeds, neutralization endpoint readings, and hold times.
- Material trace: lot numbers for surfactants, builders, acids/alkali, enzymes (if used), and water source.
- Quality results: in-process checks (pH, clarity, foam height, sample appearance) and final tests (viscosity, active content, stability).
Then build a “difference map” between the suspect batch and a recent passing batch. If the passing batch used the same formulation but different water hardness, that’s a high-value lead. If the suspect batch added neutralizer 12 minutes later, that’s also high-value—especially if viscosity is sensitive to neutralization completion and salt formation.
A practical rule: prioritize variables that changed and variables that plausibly affect the failing attribute. If nothing changed in addition order, temperature profile, and water source, the investigation should shift toward measurement or sampling issues.
Step 2: Hypothesis Testing with Mechanistic Links
A hypothesis should connect a specific process change to a specific mechanism and then to the observed defect. For instance:
- Observation: viscosity is low and the product shows slight haze.
- Mechanism hypothesis: neutralization did not reach the intended salt balance, reducing viscosity development and allowing micro-heterogeneity.
- Process evidence to check: neutralizer addition rate, endpoint pH, probe calibration status, and mixing adequacy near the endpoint.
Test hypotheses in a structured way:
- Eliminate measurement problems first: verify pH probe calibration, titrant concentration, and sample handling. A miscalibrated pH probe can make a correct process look wrong.
- Check stoichiometry and endpoints: compare theoretical neutralizer demand to actual consumption. If actual consumption is consistently lower, you may have incomplete mixing, incorrect concentration, or an endpoint logic error.
- Assess mixing and mass transfer: if addition was performed too quickly or agitation was reduced, local pH gradients can persist long enough to affect phase behavior.
- Evaluate raw material variability: surfactant active content, builder purity, and enzyme activity (if present) can shift viscosity and clarity even when formulation weights are correct.
Keep tests proportional. If a single calibration check explains the defect, you don’t need a full re-formulation.
Step 3: Verification Through Targeted Experiments and Reconciliation
Verification means proving the hypothesis, not just supporting it. Use one of three approaches depending on what’s feasible.
- In-line or rework verification: repeat the critical step on the same batch with corrected settings. Example: if neutralizer endpoint drift is suspected, re-run neutralization using a verified probe and confirm viscosity and clarity.
- Small-scale simulation: run a bench or pilot batch using the suspect and passing lots, keeping everything else constant. Example: compare two builder lots at identical water hardness to see whether haze correlates with builder impurities.
- Data reconciliation: if you can’t run experiments, reconcile mass and energy balances. Example: compare recorded heating duty to expected heat-up time; if the reactor never reached target temperature, viscosity differences become mechanically consistent.
A verification record should include: the hypothesis statement, the specific test, the acceptance criteria, and the decision rule. If the test result matches the defect pattern, you can close the loop.
Mind Map: Root Cause Investigation Workflow
Example: Viscosity Low with Acceptable Active Content
A detergent batch fails viscosity at 25°C but active content and pH are within spec. Data review shows neutralization endpoint pH was reached, but the endpoint was recorded during a period of reduced agitation. The hypothesis is that local salt balance was not achieved uniformly, leading to incomplete viscosity development.
Hypothesis tests:
- Calibration check confirms pH probe is accurate.
- Neutralizer consumption matches theoretical demand.
- Mixing logs show agitation dropped during the last 10% of neutralizer addition.
Verification:
- Rework the batch by re-mixing under the correct agitation profile for the same hold time, without changing formulation weights.
- Acceptance criteria: viscosity returns to spec and clarity improves.
If viscosity recovers, the root cause is confirmed as a mixing/mass transfer issue near the endpoint, not a formulation or raw material problem.
Step 4: Closeout and Prevent Recurrence
After verification, update the batch record with the exact control expectation that prevented the defect: agitation minimum during endpoint approach, required probe calibration frequency, and a clear rule for endpoint acceptance. Then ensure the operator-facing instructions match the control logic so the next batch doesn’t “interpret” the process differently.
12.5 Documented Change Examples: Adjusting Neutralization, Mixing, or Addition Order to Meet Specs
A documented change is only useful if it connects three things: the spec that was missed, the process variable you changed, and the evidence that the change worked. In soap and detergent work, the most common misses come from neutralization balance, mixing uniformity, and ingredient order. Below are three integrated examples that show how to write the change record and how to reason from chemistry to control actions.
Mind Map: Change Control Logic for Neutralization and Mixing
Example: Neutralization Adjustment to Fix Free Alkali
Problem: Liquid detergent batches showed free alkali above the internal limit, while pH readings looked acceptable early in the run. That mismatch usually means the endpoint was reached locally, but the bulk mixture was not fully equilibrated.
Change record (what to document):
- Spec missed: Free alkali high by titration.
- Observed pattern: pH probe stabilized quickly; titration on final sample remained high.
- Root-cause hypothesis: Neutralizing agent addition created a temporary pH zone; sampling occurred before full mixing.
Process change:
- Keep the same target neutralization amount, but add neutralizing agent in smaller increments with a fixed mixing time between increments.
- Require sampling from a defined location (e.g., mid-depth, after a minimum mixing time) and specify the sampling delay after the last addition.
- Add a second in-process titration at the end of the mixing hold, not just at the endpoint moment.
Evidence of success: In the corrected batches, free alkali moved into range and the final pH matched the titration trend. The key proof is that the titration and pH now agree across time, which indicates the mixture is equilibrated.
Example: Mixing and Addition Order to Fix Haze and Cloudiness
Problem: Soap batches produced haze after cooling. The haze appeared even when titration results were within range, suggesting a physical issue rather than a purely chemical one.
Change record:
- Spec missed: Visual haze/clarity failure after cooling.
- Observed pattern: Haze increased when surfactant or builder was added late.
- Root-cause hypothesis: Incomplete dispersion or localized salt formation during cooling.
Process change:
- Adjust order of addition so that builders and any salts that can influence phase behavior are introduced before the system reaches the temperature where viscosity rises sharply.
- Increase mixing time during the critical window when the mixture transitions from low-viscosity to higher-viscosity behavior.
- Define a temperature band for addition and hold, because dispersion quality depends on viscosity and mass transfer.
Evidence of success: Haze dropped consistently, and the batches showed more stable clarity after the same cooling profile. The documentation should include the exact addition order and the mixing time window, because those are the variables that operators can reproduce.
Example: Addition Order to Stabilize Viscosity in Liquid Detergent
Problem: Viscosity was low and sometimes drifted upward during storage. This often happens when thickening components are not hydrated uniformly.
Change record:
- Spec missed: Viscosity below target and instability trend.
- Observed pattern: Lower viscosity when thickener was added early.
- Root-cause hypothesis: Thickener hydration was incomplete due to insufficient wetting and mixing before other components increased viscosity.
Process change:
- Add water and pre-dissolve key soluble components first.
- Introduce thickener after the system is at the specified temperature and after surfactants are dispersed.
- Use a defined mixing sequence: initial low shear to wet, then higher shear to complete dispersion.
Evidence of success: Viscosity met target at release and remained stable in the same storage window. The change record should reference the mixing sequence and temperature band, not just the ingredient list.
Mind Map: What Makes a Change Record Usable
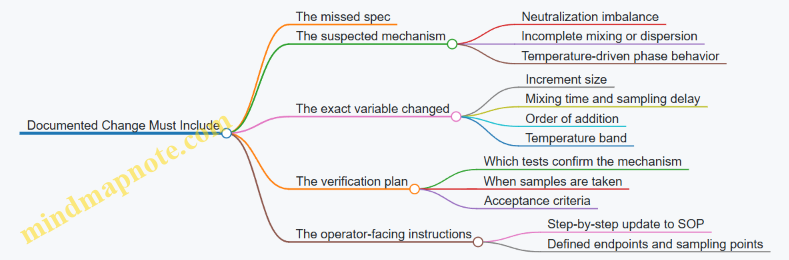
A good change record reads like a recipe with a reason. If someone else runs the batch tomorrow, they should be able to reproduce the variable change and understand why it affects the chemistry or the physical state.