Steam Power Systems and Industrial Boilers Essentials
1. Fundamentals of Steam and Thermal Energy Conversion
1.1 Steam Properties, Phase Behavior, and Thermodynamic State Variables
Steam is water in its gas phase, but “steam” in engineering usually means a specific thermodynamic condition: a pressure, a temperature, and a corresponding set of properties like specific volume, enthalpy, and entropy. Those properties determine how much energy the steam carries and how it behaves when it expands, condenses, or mixes with other streams.
Core Steam Phases and What They Mean
Water can exist as liquid, vapor, or a mixture of both. In a boiler, the key region is the two-phase mixture where liquid water and steam coexist. In that region, temperature is tied to pressure: if pressure stays constant, the boiling temperature stays constant too. This is why steam tables are organized around pressure and quality rather than temperature alone.
- Saturated liquid: the liquid at the boiling point, with no vapor present.
- Saturated vapor: the vapor at the boiling point, with no liquid present.
- Saturated mixture: both phases present; the fraction of mass that is vapor is the quality.
Quality, usually written as x, ranges from 0 (all liquid) to 1 (all vapor). If x = 0.2, then 20% of the mass is vapor and 80% is liquid, even though both phases share the same temperature at that pressure.
Thermodynamic State Variables That Actually Get Used
A thermodynamic state is fixed once you know two independent properties. For steam systems, common pairs are:
- Pressure and temperature (useful for superheated steam)
- Pressure and quality (useful for two-phase mixtures)
- Pressure and specific enthalpy (useful in energy balance problems)
From the state, you read or compute other properties. The most common ones are:
- Specific volume (v): affects piping sizing and flow velocities.
- Enthalpy (h): central to energy balances in boilers, turbines, and heat exchangers.
- Entropy (s): central to isentropic expansion and efficiency reasoning.
- Internal energy (u): sometimes used in control-volume derivations.
A practical note: steam tables report properties per unit mass, so keep units consistent. If your boiler load is in kg/h, convert to kg/s before using specific properties.
Phase Behavior and the Saturation Lines
On a pressure–temperature view, there is a boundary separating liquid-only from vapor-only. Inside the boundary is the two-phase region. Outside it, the steam is either:
- Subcooled (compressed) liquid: liquid exists at a temperature below the saturation temperature for that pressure.
- Superheated steam: vapor exists at a temperature above the saturation temperature for that pressure.
The saturation temperature is the temperature at which boiling occurs for a given pressure. That means if you know pressure, you know saturation temperature, and vice versa.
How Properties Change Across Regions
In the two-phase region, adding heat does not raise temperature; instead, it changes the phase composition. That’s why the latent heat matters: it is the energy required to convert liquid to vapor at constant pressure.
In superheated steam, adding heat increases temperature and typically increases enthalpy and specific volume. The vapor behaves more like a gas, so property changes with temperature are more direct.
Mind Map: Steam Properties and Phase Behavior
Example: Quality and Enthalpy in a Two-Phase Mixture
Suppose a boiler produces steam at 0.8 MPa and the outlet is a saturated mixture with quality x = 0.85. The temperature is the saturation temperature at 0.8 MPa. The mixture enthalpy is then a weighted average of saturated liquid enthalpy and saturated vapor enthalpy:
- If \(h_f\) is saturated liquid enthalpy and \(h_g\) is saturated vapor enthalpy at 0.8 MPa, then:
- \(h = h_f + x(h_g − h_f)\)
This single equation explains why small changes in quality can noticeably change energy content: the term \(h_g − h_f\) is tied to latent heat.
Example: Why Superheated Steam Uses Temperature
If instead the outlet is superheated at 0.8 MPa and, say, 20°C above the saturation temperature, then quality is no longer the right variable. The state is defined by pressure and temperature, and enthalpy increases with temperature beyond the saturated vapor value.
Example: A Quick Consistency Check for Engineers
If you are told “steam at 0.8 MPa and 200°C,” you should ask whether it is saturated, subcooled, or superheated by comparing 200°C to the saturation temperature at 0.8 MPa. That comparison determines whether you should use quality-based properties (two-phase) or temperature-based properties (superheated/compressed).
Summary of the Section
Steam properties are not just labels; they are functions of a thermodynamic state. Phase behavior determines which variables define that state, and those choices control how you compute enthalpy, entropy, and specific volume for energy balances and system design.
1.2 Energy Balances for Control Volumes in Steam Systems
Energy balances turn “what goes in and what comes out” into numbers you can actually use. In steam systems, the control volume might be a boiler drum, a feedwater heater, a steam line section, or even a single heat exchanger pass. The key is to write the balance in a way that respects where energy is stored, where it flows, and where it is transformed.
Core Idea of a Control Volume
A control volume is a chosen region in space. Everything crossing its boundary counts as a flow term. Energy can also accumulate inside the boundary if the system is not steady.
Start with the general form:
- Accumulation = In − Out + Generation − Consumption
For steam equipment, “generation/consumption” often means heat transfer and work interactions rather than chemical reactions. The most practical version is usually:
- Accumulation of energy = Net heat transfer + Net work + Net enthalpy flow
Choosing the Right Energy Form
In steam systems, enthalpy is the workhorse because it naturally pairs with flow. For a stream leaving or entering a control volume, the energy carried is commonly represented as mass flow rate × specific enthalpy.
A typical steady-flow energy balance (no accumulation) looks like:
0 = Q̇ − Ẇ + Σ(ṁ h)in − Σ(ṁ h)out
Where:
- Q̇ is heat transfer rate into the control volume
- Ẇ is shaft work rate done by the control volume (sign convention matters)
- h is specific enthalpy
In many boiler and heat exchanger problems, shaft work is negligible, so Ẇ ≈ 0.
Steady vs Unsteady Balances
Steady state means properties at each point don’t change with time, so accumulation is zero. This is common for normal operation.
Unsteady state matters during start-up, load changes, or trips. Then accumulation becomes important, and you must include energy stored in the drum, tubes, and contained water/steam. A simple way to see it: if the drum level rises, the stored mass and its energy change, so the balance must include that storage term.
What Counts as Energy Transfer
Energy can cross the boundary as:
- Heat transfer (conduction, convection, radiation) through walls
- Work transfer (pumps, turbines, fans in some cases)
- Enthalpy carried by mass flow
In a boiler, the furnace gases transfer heat to water/steam through tube walls. In a steam line, heat transfer to the surroundings may be small but not always negligible, especially for long runs or poorly insulated piping.
Practical Mind Map for Writing Balances
Mind Map: Energy Balances in Steam Control Volumes
Example 1: Feedwater Heater as a Steady-Flow Control Volume
Consider a feedwater heater where steam condenses and heats feedwater. Choose the control volume around the heater.
Assume steady operation and negligible shaft work. Then:
Q̇ = (ṁ h)out,feed − (ṁ h)in,feed + (ṁ h)in,steam − (ṁ h)out,steam
A cleaner way is to write it with one side as “in” and the other as “out,” but the physics stays the same: the steam loses enthalpy as it condenses, and the feedwater gains enthalpy.
Concrete check: if the outlet feedwater enthalpy is higher than the inlet by, say, 200 kJ/kg, and the feedwater flow is 10,000 kg/h, the required heat transfer rate is roughly 2,000,000 kJ/h. Your steam-side enthalpy drop should match that within losses.
Example 2: Boiler Drum During a Load Change
Now take a boiler drum control volume during a short transient. The drum contains a mixture of water and steam, so its stored energy changes.
Write:
- Accumulation term = Net enthalpy inflow + Net heat transfer from furnace − Net enthalpy outflow
Even if the heat input from the furnace is roughly constant over the short interval, the drum energy can still change because the mass flows (steam generation rate, downcomer flow, blowdown, feedwater) shift. That’s why drum level and pressure can move together in a way that looks “mysterious” until you remember accumulation.
Common Modeling Shortcuts That Need Justification
- Neglect kinetic and potential energy when velocities are modest and elevation changes are small.
- Assume steady state only when the time scale of property changes is much longer than the interval you’re analyzing.
- Use enthalpy consistently: mixing saturated and superheated states without correct h values is a classic way to get answers that are numerically tidy but physically wrong.
A Quick Workflow That Doesn’t Fail You
- Draw the control volume and label all inlets/outlets.
- Decide steady or unsteady; set accumulation accordingly.
- Choose a sign convention and stick to it.
- Write the energy balance using ṁ h for flow terms.
- Substitute enthalpies from steam tables at the correct pressures and temperatures.
- Solve for the unknown and sanity-check units and magnitudes.
If you can do those steps without skipping, the energy balance stops being a formula and becomes a reliable reasoning tool—like a calculator that also cares about physics.
1.3 Heat Transfer Mechanisms in Boilers and Steam Equipment
Boilers turn fuel energy into steam by moving heat from hot gases to water and then into the steam space. The key idea is that heat transfer is not one mechanism; it is a chain. Hot combustion products release heat by convection and radiation, that heat crosses tube walls by conduction, and it is absorbed by water or steam through convection and boiling. If any link is weak—say, fouling blocks gas-side convection—the whole chain slows down.
The Heat Transfer Chain in One Pass
-
Gas-side convection moves heat from flue gas to the tube surface. The strength depends on gas velocity, turbulence, and temperature difference.
-
Gas-side radiation transfers energy directly between hot surfaces and tube surfaces. Radiation matters more at higher flame temperatures and when surfaces “see” each other.
-
Wall conduction carries heat through the tube metal. For typical boiler tubes, this is usually fast compared with the other steps, but it still matters for thick walls or poor materials.
-
Liquid-side convection and boiling transfer heat from the tube wall to water. In evaporative zones, boiling dominates because it creates vigorous mixing and latent heat uptake.
-
Steam-side effects include condensation on cooler surfaces and the influence of steam quality on heat transfer. Wet steam can reduce heat transfer effectiveness and increase the risk of carryover.
A practical way to remember this is: gases “deliver” heat, tubes “transport” it, and water/steam “accept” it. Each step has its own resistance.
Gas-Side Convection and Radiation
Convection on the gas side is driven by temperature difference and the ability of the flow to renew the boundary layer. If soot forms, it acts like an insulating blanket. Even if the burner is unchanged, the tube surface temperature rises because the same heat must cross a higher resistance.
Radiation is influenced by gas composition (especially CO₂ and H₂O), flame temperature, and geometry. In furnaces and fireboxes, radiation can be a large fraction of heat transfer because the gas is hot and the path between surfaces is short.
A simple example: imagine two boilers with identical burners. Boiler A has clean convection surfaces; Boiler B has a light soot layer. Boiler B will show higher stack temperature and lower overall efficiency because gas-side convection is reduced. Radiation may still contribute, but it cannot fully compensate for the lost convection.
Tube Wall Conduction
Tube conduction is the “middleman.” The wall thickness and thermal conductivity set how much temperature drop occurs across the metal. In most boiler designs, the wall drop is small compared with gas-side and boiling-side resistances. That’s why cleaning and water quality often yield bigger performance gains than swapping tube materials.
Still, conduction becomes more noticeable when heat flux is high or when corrosion reduces effective thickness. A thinner or rougher wall can change heat flux distribution and accelerate degradation.
Water-Side Convection and Boiling
On the water side, heat transfer depends on whether the surface is in single-phase liquid heating or boiling/evaporation.
-
In subcooled or saturated liquid regions, convection dominates. Flow patterns and turbulence control the heat transfer coefficient.
-
In boiling regions, the process includes nucleate boiling and evaporation at the tube surface. As bubbles form and detach, they enhance mixing and carry latent heat into the steam phase.
A concrete example: in a water-tube boiler evaporator, if circulation is poor, the tube may run hotter because less liquid reaches the surface. That can shift the boiling regime and increase the likelihood of dry-out.
Boiling Stability and Dry-Out
Boiling is helpful until it isn’t. When steam quality increases too much locally, the tube surface can become blanketed by steam, reducing liquid contact. This is dry-out, and it causes a sharp rise in tube metal temperature.
Dry-out risk is influenced by:
- Mass flux and circulation: higher, well-distributed flow helps keep the surface wetted.
- Heat flux: higher firing increases the demand for evaporation.
- Steam quality distribution: uneven quality across tubes can create hot spots.
- Fouling and deposits: deposits reduce heat transfer to water, pushing the surface toward higher temperatures.
A useful operational check is to correlate firing rate with tube metal temperature trends and steam quality indicators. If metal temperature climbs faster than expected for a given load, the limiting resistance may have shifted.
Condensation and Heat Transfer in Economizers and Superheaters
Not all boiler components boil water. Economizers typically heat feedwater by convection from flue gas. Superheaters raise steam temperature, often with a mix of convection and radiation contributions from the hot gas.
In these sections, the “acceptance” side is single-phase heating. That means fouling effects are often very direct: soot reduces gas-side convection, and the feedwater or steam temperature rise slows down.
Mind Map: Heat Transfer Mechanisms in Boilers
Integrated Example: Why Cleaning Changes Steam Production
Consider a water-tube boiler running at a fixed firing rate. If soot builds up on the gas-side surfaces, gas-side convection drops. The tube wall must then reach a higher temperature to drive the same heat flow into the water. Higher wall temperature can increase scaling and worsen water-side conditions, which further reduces boiling heat transfer. The combined effect is lower steam generation for the same fuel input.
In practice, operators often see this as rising stack temperature, reduced efficiency, and sometimes changes in steam quality behavior under load. The mechanism is straightforward: the heat transfer chain gained resistance at the gas side, and the system compensated by shifting temperatures, not by creating extra heat.
1.4 Steam Quality, Moisture Carryover, and Impacts on Turbines and Piping
Steam quality is the fraction of the steam that is vapor rather than liquid water. In a boiler, steam leaves the drum as a mix, and the job of the steam separator is to keep liquid droplets from traveling with the vapor. When that job is imperfect, moisture carryover shows up downstream as wet steam, and wet steam is where piping and turbines start collecting problems.
Steam Quality from Drum to Header
Inside a typical steam drum, separation is driven by gravity, momentum changes, and internal baffles. The drum level and circulation pattern matter because they influence how much water is available to be entrained. If the drum level is too high, the separator has more liquid to deal with; if it is too low, the system can become unstable and separation effectiveness drops.
A practical way to think about quality is to compare two states: dry steam that behaves like a compressible gas, and wet steam that contains droplets. Droplets don’t just “add water”; they change how energy is distributed and how surfaces experience impacts.
Moisture Carryover Mechanisms
Moisture carryover typically comes from three sources:
- Foaming and carryover: Surfactants and dissolved solids can form stable foam that rides the steam path.
- Mechanical entrainment: Water droplets can be physically carried by high vapor velocity.
- Separator flooding: When steam demand or drum conditions shift quickly, separators can temporarily lose effectiveness.
An easy example: imagine a kettle with a rolling boil. If you pour too fast, you don’t get “just steam”; you get water droplets in the stream. A boiler drum is the kettle, and the separator is the lid and strainer.
Why Wet Steam Harms Turbines
Turbines are designed for steam that expands mostly as a gas. Wet steam introduces liquid droplets into the flow path, and those droplets accelerate erosion.
Erosion and Blade Damage
When droplets strike rotating blades, they can remove metal over time. The damage is not uniform; it tends to concentrate where droplet velocity and blade geometry align. Even small changes in moisture content can matter because erosion is cumulative.
Loss of Efficiency and Control Challenges
Wet steam also reduces efficiency because droplets absorb energy during phase change and disrupt the intended expansion process. In control terms, the turbine may still “see” the same pressure, but the internal thermodynamic state differs from what the control strategy assumes.
A concrete example: if a turbine is operating under a load that expects near-dry steam, but moisture carryover increases due to poor drum control, the turbine may show higher vibration and reduced output for the same steam conditions. The pressure gauge can look fine while the internals are not.
Why Wet Steam Harms Piping and Valves
Piping issues often start with condensation and droplet impingement.
Water Hammer and Transient Stress
If wet steam enters a section where it cools or expands, droplets can coalesce into liquid pockets. When flow conditions change—such as a valve opening or a load rejection—those pockets can move and suddenly accelerate, creating pressure spikes known as water hammer.
Example: a steam line that normally carries dry steam may tolerate a certain valve stroke. If moisture carryover increases, the same stroke can push liquid into a low point, and the next pressure transient becomes much harsher.
Corrosion and Deposits
Liquid water promotes corrosion, especially when oxygen or contaminants are present. Droplets also carry dissolved solids that can deposit on pipe walls, forming scale that increases roughness and pressure drop.
Measuring and Interpreting Steam Quality
Steam quality is not measured by a single magic number; it is inferred from instrumentation and operating context.
Common approaches include:
- Moisture separators and drains performance: If drains are frequently active or carry significant water, quality is likely poor.
- Steam temperature and pressure trends: Deviations can indicate wetness or control issues.
- Sampling and lab checks: When available, sampling provides direct evidence of moisture content.
A systematic interpretation method is to connect symptoms to likely causes. For instance, if moisture carryover worsens while drum level control becomes more aggressive, entrainment is a prime suspect. If it worsens during load swings, separator flooding or transient entrainment is more likely.
Mind Map: Steam Quality and Downstream Impacts
Integrated Example: Diagnosing a Moisture Spike
Suppose a plant reports increasing turbine vibration and higher drain flow from steam traps on the main line. The pressure and steam temperature at the header remain within expected limits.
A logical diagnostic path is:
- Check drum level control stability during the period the symptoms began.
- Review blowdown and water chemistry for signs of foaming risk.
- Inspect separator performance for evidence of flooding or carryover.
- Look for transient load events that could have temporarily increased entrainment.
- Confirm with sampling or moisture measurement if available.
If the drum level was oscillating and blowdown was reduced, the most likely cause is increased entrainment from foaming and unstable separation. If the symptoms align with rapid load changes, separator flooding and transient entrainment become the leading explanation.
The key idea is that steam quality is a system property. It depends on drum behavior, separator operation, chemistry, and load dynamics, and it shows up as mechanical and thermal consequences where wet steam meets metal.
1.5 Practical Steam System Performance Metrics and Definitions
Steam systems behave like a set of coupled promises: the boiler promises steam quality and pressure, the piping promises delivery without excessive loss, and the condensate system promises to return water without leaving corrosion souvenirs behind. Performance metrics turn those promises into numbers you can trend, compare, and troubleshoot.
Core Metrics That Describe the Steam You Actually Get
Steam flow rate (mass or volumetric basis). This is the amount of steam delivered to the process per unit time. In practice, you’ll see it as a feedwater-to-steam relationship when calibrated meters are available. A simple example: if a plant reports 10,000 kg/h of steam demand but the boiler feedwater flow indicates only 9,200 kg/h, either the measurement is off or the system is throttling somewhere.
Steam pressure at the header. Pressure is the “driving force” for distribution and heat transfer. Measure it at the point of use or at a representative header location, not only at the boiler outlet. If header pressure drops during load swings, the cause might be undersized piping, excessive trap leakage, or control valve behavior.
Steam temperature and superheat. For superheated steam, temperature affects heat transfer and turbine/process performance. A practical check: if superheat is falling while firing rate stays constant, heat transfer surfaces may be fouled or combustion may be drifting, reducing effective heat transfer.
Steam quality and dryness fraction. Wet steam carries droplets that can erode turbines and cause uneven process heating. Quality is often inferred from separators, steam drum behavior, and measured moisture where available. Example: if a turbine shows rising vibration while steam flow is steady, moisture carryover is a suspect even when pressure looks normal.
Metrics That Describe Losses and Inefficiencies
Boiler efficiency. Efficiency is a boundary concept: it depends on what losses you include and how you define the reference. For operational use, focus on consistent measurement boundaries so trends mean something. Example: if efficiency drops 2–3 points after a period of heavy soot deposition, the stack loss and heat transfer degradation are usually aligned.
Blowdown rate and blowdown heat loss. Blowdown removes dissolved solids and keeps water chemistry stable, but it wastes energy. A practical approach is to track blowdown as a fraction of steam generation and relate it to conductivity or TDS control targets. If blowdown spikes after a chemistry upset, you’ll often see efficiency fall at the same time.
Condensate return fraction. This is one of the most actionable metrics because it ties directly to water treatment load and energy recovery. Define it as returned condensate mass divided by steam condensed in the system. Example: if a process uses 100 kg/h of steam and returns only 85 kg/h as condensate, the missing 15 kg/h is either vented, leaking, or lost to drains that don’t return.
Steam distribution pressure drop. Pressure drop across piping and valves indicates how much “headroom” you’re spending to move steam. Track it between two points under similar load. If the drop increases over time, fouling in strainers, partially closed valves, or condensate accumulation may be the cause.
Trap performance. Traps prevent steam loss while allowing condensate removal. Measure trap health by observing temperature difference across the trap, discharge behavior, and failure modes. Example: a failed open trap can look like a small leak, but over a month it becomes a major steam loss that also increases makeup water demand.
Metrics That Describe Control Stability and Operating Behavior
Feedwater control response. Good control keeps drum level stable and avoids oscillations. A practical metric is the magnitude and frequency of level excursions during load changes. If level swings widen, the issue might be valve sizing, sensor placement, or poor tuning.
Combustion stability. Track oxygen (or excess air) and CO trends during steady operation. If oxygen rises while steam output stays constant, you may be burning more fuel for the same steam due to air leaks or poor mixing.
Start-up and turndown performance. Measure time-to-steam, time-to-stable pressure, and how efficiency behaves at low loads. Example: if turndown increases but steam quality worsens, the boiler may be operating near a circulation or heat transfer limit.
Mind Map: Steam System Performance Metrics
A Simple Metric Set You Can Implement Without Drama
Use a “minimum viable dashboard” that covers energy, water, and stability:
- Steam flow (kg/h)
- Header pressure (bar/psig)
- Steam quality indicator or moisture risk proxy
- Boiler efficiency trend
- Blowdown rate (% of steam generation)
- Condensate return fraction (%)
- Trap health summary (pass/fail or severity score)
- Feedwater valve position and drum level excursion (for stability)
Example workflow: during a week where condensate return drops, check trap health first, then distribution pressure drop, then boiler blowdown. If blowdown rises while conductivity targets are met, the chemistry control may be overreacting or sampling may be biased.
Definitions You Should Write Down Once
To avoid confusion, define each metric with its measurement points and boundaries. For instance, “condensate return fraction” must state whether it includes flash steam recovery, whether it counts only metered return, and where the mass balance closes. When boundaries are consistent, the numbers stop being arguments and start being evidence.
2. Boiler Types, Configurations, and Application Fit
2.1 Fire-Tube, Water-Tube, and Package Boiler Fundamentals
Boilers convert fuel energy into usable steam by transferring heat from hot combustion gases to water. The core design question is where the water sits relative to the flame: inside tubes (fire-tube), outside tubes (water-tube), or in a factory-assembled package that combines major components into one unit. That choice drives pressure limits, heat-transfer behavior, maintenance access, and how the boiler responds to load changes.
What “Fire-Tube” Means
In a fire-tube boiler, combustion gases flow through tubes surrounded by water. Heat moves from gas to tube wall to surrounding water, producing steam in the shell. Because the water is on the outside, the pressure vessel is typically the shell, and the tube bundle is a heat-transfer surface rather than the primary pressure boundary.
Best-fit situations: smaller steam demands, simpler operating environments, and applications where frequent rapid load swings are not the main requirement.
Easy example: imagine a kettle where hot air passes through a bundle of small pipes. The pipes get hot first, then the surrounding water boils. If the burner output changes, the water temperature and steam generation respond, but the system has more thermal mass in the shell and fewer “fast” surfaces than a water-tube design.
What “Water-Tube” Means
In a water-tube boiler, water flows inside tubes while combustion gases flow outside. Heat transfers from gas to tube wall to water, and steam forms within the tube system. The pressure boundary is largely the tube walls and headers, which can allow higher pressures and better control of steam quality when circulation and separation are designed correctly.
Best-fit situations: higher pressure steam, larger capacities, and systems that benefit from more responsive heat-transfer surfaces.
Easy example: think of a bundle of straws carrying water. The outside air heats the straws, and boiling occurs inside. If you increase burner firing, the water-side flow and heat flux can be managed to keep steam generation stable.
What “Package Boiler” Means
A package boiler is a factory-assembled boiler system that typically includes the boiler pressure vessel plus key auxiliaries such as burners, controls, economizer sections (depending on design), and sometimes blowdown and feedwater components. The “package” idea is about integration and commissioning speed rather than a single heat-transfer geometry.
Best-fit situations: sites that need predictable installation, limited space, and standardized controls.
Easy example: it’s like buying a prebuilt HVAC unit instead of assembling a compressor, coil, and controls separately. You still need correct sizing and proper utilities, but the assembly is designed to work together.
How Heat Transfer Drives Design Differences
Heat transfer depends on gas-side temperature, gas-side film coefficients, tube surface area, and how easily deposits can be removed. Fire-tube designs often have large gas-side heat-transfer areas with accessible tube bundles, but they can be more sensitive to soot buildup because gas must pass through the tube passages. Water-tube designs can manage higher heat fluxes and may be better suited to high-pressure steam, yet they require careful attention to water chemistry and circulation stability.
Pressure, Steam Quality, and Circulation Basics
Steam quality is about how much moisture is carried with the steam. In both types, poor water quality or poor separation can lead to carryover, which can damage downstream equipment. Water-tube boilers often rely on controlled circulation patterns and steam-water separation equipment to maintain quality. Fire-tube boilers use the shell and internal separation arrangements to achieve similar goals, but the geometry and operating envelope differ.
Mind Map: Boiler Type Fundamentals
Quick Comparison Example
Suppose a plant needs 20,000 lb/hr of steam at moderate pressure with steady process demand. A fire-tube or a package configuration may be cost-effective and straightforward to maintain, provided the fuel and combustion tuning keep soot under control. If the same plant needs higher pressure steam for a turbine or for tighter process control, a water-tube design becomes more practical because its tube-based pressure boundary and circulation/separation approach better support that operating regime.
Practical Selection Checklist
- Steam pressure and quality requirements: higher pressure and strict quality needs push toward water-tube solutions.
- Load profile: steady loads favor fire-tube simplicity; variable loads require attention to control response and circulation behavior.
- Fuel and cleanliness: fuels that produce heavy soot demand designs that can tolerate or clean deposits effectively.
- Site constraints: space, installation schedule, and commissioning resources often determine whether a package boiler is the sensible choice.
- Water chemistry capability: both designs require good treatment, but water-tube systems are less forgiving of poor chemistry because tube surfaces and circulation are directly involved.
Summary
Fire-tube boilers place hot gases inside tubes and water around them, making them well-suited for simpler, moderate-duty steam generation. Water-tube boilers place water inside tubes and gases outside, enabling higher pressure operation and controlled steam production. Package boilers are integrated systems that standardize major components for faster installation, regardless of whether the underlying heat-transfer arrangement is fire-tube or water-tube.
2.2 Economizers, Superheaters, and Reheaters: Roles and Placement
What Each Surface Does in the Steam Cycle
An economizer is a heat exchanger that warms feedwater using hot flue gas before the water enters the boiler drum or generating tubes. Its job is to reduce the temperature difference between the gas leaving the furnace and the water entering the steam-raising section, which lowers stack losses without changing the steam pressure level.
A superheater increases steam temperature above saturation at the boiler outlet pressure. This matters because turbines and many process users prefer dry, high-temperature steam: it reduces condensation risk in the turbine and improves heat transfer consistency in downstream equipment.
A reheater takes steam leaving a high-pressure turbine and reheats it before it enters a lower-pressure stage. The purpose is to improve cycle efficiency and keep steam quality higher through the expansion process, where moisture would otherwise become more likely.
Economizer Placement and Practical Reasoning
Economizers are placed in the path of flue gas after the furnace and before the air preheater or stack. In most designs, flue gas flows through finned or bare tubes while feedwater flows inside tubes. The key placement rule is temperature management: the economizer must avoid excessive metal temperatures that accelerate corrosion and must avoid flue gas temperatures that would cause condensation of acidic species on cold surfaces.
A simple way to think about it is “feedwater temperature follows flue gas temperature.” If feedwater is too cold, the economizer tubes run colder than the dew point region, increasing the risk of condensation and corrosion. If feedwater is too hot, the economizer becomes less effective and you waste potential heat recovery.
Easy example: Suppose a boiler sends flue gas out at 300°C and feedwater enters at 90°C. An economizer might raise feedwater to 170°C. That 80°C gain reduces the heat you would otherwise need to supply in the steam-raising section, so the boiler burns less fuel for the same steam output.
Superheater Placement and Steam Quality Control
Superheaters are typically installed in the furnace or in the convection pass where flue gas temperatures are still high. Placement depends on boiler type and firing arrangement. Furnace superheaters see higher gas temperatures but also face higher thermal stress and soot deposition risk. Convection superheaters see lower temperatures and often have easier maintenance access.
The superheater outlet temperature must be controlled because it affects both turbine performance and material limits. Common control approaches include adjusting fuel/air ratio, manipulating steam flow through the superheater, and using spray or desuperheating arrangements where applicable.
Easy example: If steam leaves the superheater at 520°C but the turbine design expects 500°C, you may exceed allowable metal temperatures in turbine components. Conversely, if it drops to 470°C, moisture formation during expansion increases, which can raise erosion risk and reduce efficiency.
Reheater Placement and Integration with Turbine Stages
Reheaters are located between turbine stages, with steam routed from the high-pressure turbine outlet back to the boiler reheater section. Flue gas passes over reheater tubes, and the reheated steam returns to the intermediate or low-pressure turbine.
Placement is constrained by routing and by the need to match reheater heat duty with the turbine’s operating point. Reheaters must also manage thermal expansion and stress cycling because they experience frequent load changes.
Easy example: In a two-stage expansion, high-pressure steam might expand and cool significantly before the reheater. Reheating restores temperature so the next expansion stage starts with drier steam, reducing the chance that moisture reaches damaging levels.
Mind Map: Roles and Placement
Integrated Best Practices for Placement Decisions
- Match heat recovery to flue gas temperature profile. Economizers work best when flue gas cool-down is gradual and feedwater temperature rise stays safely above condensation risk.
- Control superheater outlet temperature as a first-class requirement. Treat temperature control as part of the placement strategy, not an afterthought, because placement determines how quickly the surface responds to load changes.
- Design reheater duty around turbine stage needs. Reheater placement must align with steam routing and the turbine’s moisture tolerance, so reheating is sufficient without overheating.
- Plan for fouling where placement increases soot exposure. Furnace-located superheaters and reheaters often need cleaning access and sootblowing strategy built into the layout.
Quick Placement Checklist
- Economizer: flue gas path location, dew point risk, feedwater temperature rise.
- Superheater: gas temperature exposure, control method, fouling and stress considerations.
- Reheater: steam routing constraints, duty vs. load matching, expansion allowances.
2.3 Combustion Chamber and Furnace Arrangements
A combustion chamber is where fuel, air, and heat transfer surfaces meet in a controlled way. The furnace arrangement determines how quickly mixing happens, how long gases stay hot enough to burn cleanly, and how heat is distributed to the boiler tubes. If you treat it like “just a box with a flame,” you’ll eventually pay for it in soot, slagging, or unstable operation.
Core Functions of the Furnace
First, the furnace must create a stable flame zone. Stability comes from recirculation of hot products and the right flow pattern so fresh air and fuel don’t blow the flame off the burner. Second, it must provide sufficient residence time for complete combustion. Third, it must manage heat transfer so the furnace wall and tube surfaces see the right heat flux without excessive local overheating.
A practical way to think about this is to separate the furnace into three regions: ignition and early mixing near the burner, main combustion where most heat is released, and burnout where remaining CO and hydrocarbons finish oxidizing. Good arrangements keep these regions where the boiler can use the heat.
Furnace Geometry and Flow Patterns
Furnace geometry influences both mixing and radiation. A wider furnace can reduce gas velocities and help burnout, but it may lower heat flux to the walls. A narrower furnace increases velocities and can improve mixing, but it risks higher wall heat flux and more fouling if the air distribution is uneven.
Flow pattern matters as much as size. Tangential or swirl-assisted designs create a rotating flow that keeps hot gases near the burner zone and spreads air more evenly. Straight-through designs rely more on burner jets and staged air to shape the flame. In either case, the goal is to avoid dead zones where unburned fuel accumulates and to avoid short-circuiting where hot gases escape before completing combustion.
Burner Placement and Flame Shape
Burner placement sets the initial flame trajectory. If the flame impinges directly on furnace walls, you may get intense localized heating, leading to tube overheating and accelerated deposit formation. If the flame is too far from the heat transfer surfaces, you may lose radiation effectiveness and increase stack losses.
A common best practice is to match burner projection and firing rate to the furnace cross-section so the flame occupies the intended region. For example, in a water-tube boiler firing natural gas, a burner that produces a compact flame can work well with a moderate furnace volume, while heavy fuel oil often needs more careful air staging and a larger effective combustion zone because atomization and vaporization take longer.
Heat Transfer Surface Arrangement
Furnace walls and convection surfaces share the job of extracting heat. Radiation dominates in the furnace because hot gases and flame emit strongly. Convection dominates downstream where gas temperatures remain high enough and where tube banks provide surface area.
To keep the furnace from becoming a “heat sink,” designers balance furnace wall exposure with downstream convection. If you push too much heat into the furnace walls, you increase the risk of slagging or corrosion depending on fuel and operating conditions. If you push too little, you may overload convection surfaces with soot, especially when excess air is high or mixing is poor.
Air Staging and Combustion Control
Air staging is a deliberate way to control oxygen availability across the furnace. Primary air supports ignition and early combustion. Secondary air completes combustion and reduces CO. Tertiary or overfire air may be used to improve burnout and reduce emissions.
A simple example: suppose a boiler shows elevated CO during steady load. One likely cause is insufficient secondary air penetration into the main combustion zone. Adjusting secondary air distribution or damper settings can improve mixing and oxidation without changing total firing rate.
Mind Map: Furnace Arrangement Logic
Example: Adjusting an Underperforming Furnace
Consider a boiler that produces visible soot at the economizer inlet. The furnace likely has incomplete burnout or poor mixing, so unburned hydrocarbons and soot precursors survive into the convection section. Start with observations: check excess air trends, verify burner air distribution, and confirm that secondary air is actually reaching the main combustion zone rather than bypassing it.
Then apply a controlled adjustment. Increase secondary air slightly while monitoring CO in flue gas. If CO drops and soot reduces, the furnace arrangement is doing its job and the issue was oxygen availability and mixing. If CO drops but soot persists, the problem may be flame impingement causing local overheating and deposit formation, or it may be atomization quality for liquid fuel.
Case Study: Avoiding Wall Overheating
A common operational symptom is frequent tube fouling near the furnace wall region. One root cause is flame impingement due to excessive burner projection or incorrect firing rate relative to furnace volume. Another is air staging that creates a locally fuel-rich zone close to the wall.
A systematic response is to verify burner settings, confirm air damper positions, and compare measured flue gas temperature patterns across load. If wall-region fouling correlates with higher firing rates, the furnace may be receiving too much heat flux too quickly. Correcting the air staging balance or burner alignment typically reduces both deposit rate and combustion instability.
Practical Checklist for Furnace Arrangement Best Practices
- Ensure the flame occupies the intended combustion region without persistent wall impingement.
- Verify air staging provides oxygen where CO and hydrocarbons are still present.
- Keep flow patterns consistent with the burner design so recirculation supports stability.
- Balance furnace radiation and downstream convection to reduce soot formation.
- Use CO and soot observations together, since either alone can mislead you.
2.4 Steam Drum, Circulation Concepts, and Natural vs. Forced Circulation
A steam drum is the boiler’s “sorting station” for water and steam. It separates the two phases so the steam leaving the drum is drier, while the water returns to the heating surfaces to keep evaporation going. Think of it as a controlled mixing-and-separation volume: feedwater enters, boiling occurs in generating tubes, and the drum uses gravity plus internal internals to separate phases.
Steam Drum Functions and Internals
A typical drum performs four jobs.
First, it provides a large, calm volume so bubbles can rise and disengage from the water. Second, it maintains a stable water level that determines how much of the generating surface is covered with liquid. Third, it collects steam and routes it to the outlet while minimizing moisture carryover. Fourth, it supports circulation by connecting downcomers and risers to form a closed flow loop.
Internals reduce entrainment. A common set includes:
- Baffle plates and cyclonic separators to change steam direction and knock droplets back into the water.
- Demister pads to capture fine droplets that survive earlier separation.
- Steam space and downcomer connections sized so level control remains responsive.
A practical best practice is to treat drum level as a safety-critical variable. If the level drops too far, tubes can uncover and overheat. If it rises too high, wet steam can reach the superheater and turbine, increasing erosion and reducing efficiency.
Circulation Concepts in Drum Boilers
In a drum boiler, evaporation happens in tubes that are connected to the drum. The key question is: how does water move through those tubes continuously? The answer is circulation, driven by density differences and assisted by geometry.
A simple way to reason about circulation is to compare densities.
- In downcomers, water is cooler and denser.
- In riser/generating tubes, water heats up, and as steam forms, the mixture density drops.
That density difference creates a pressure head that pushes the two-phase mixture upward and returns denser liquid downward. This is why circulation can persist even when the steam generation rate changes—within limits.
Two practical constraints govern stable circulation.
- Two-phase friction and flow regime. As vapor fraction increases, friction rises and can reduce circulation if not balanced.
- Tube heat flux distribution. Uneven heating can cause local boiling differences, which can destabilize flow or increase carryover.
Natural Circulation Mechanism
Natural circulation relies on the buoyancy created by phase change. The driving force is the difference between the hydrostatic pressure of the liquid column in downcomers and the two-phase column in risers.
When firing increases, more heat is added to generating tubes. Vapor fraction rises, mixture density falls, and the buoyancy head increases. That tends to raise circulation flow, which helps remove heat and maintain boiling. When firing decreases, the opposite happens.
This self-adjusting behavior is useful, but it is not magic. Natural circulation can become weak when:
- The boiler has high pressure where density differences shrink.
- The system has long risers or large pressure losses.
- The load is low enough that boiling is insufficient to sustain strong buoyancy.
A good operational practice is to avoid abrupt load changes without confirming that circulation remains within the stable operating envelope. Operators typically monitor drum level stability, steam quality indicators, and differential pressures across key sections.
Forced Circulation Mechanism
Forced circulation uses a pump to provide the main driving head. The pump overcomes friction losses and ensures flow through generating tubes even when buoyancy is small.
In forced circulation, the boiler can be more tolerant of low load operation because the pump maintains circulation flow. However, the pump introduces new considerations:
- Power consumption and pump selection for two-phase tolerance.
- Control strategy so the pump speed matches heat input without causing excessive velocities or poor separation.
- Protection against cavitation and overheating in abnormal conditions.
Forced circulation is often used where rapid response or compact designs are needed, but the core physics still matters: two-phase flow can still lead to uneven distribution if tube banks and headers are not designed and controlled carefully.
Comparing Natural and Forced Circulation
Natural circulation is driven by buoyancy and tends to be simpler mechanically, with fewer rotating components. Forced circulation is driven by pump head and can maintain flow more directly, especially at low heat input.
The trade-off shows up in control and design.
- With natural circulation, stability depends heavily on drum level, heat flux distribution, and pressure losses.
- With forced circulation, stability depends on pump control, flow distribution, and avoiding conditions that cause poor separation or excessive entrainment.
Mind Map: Steam Drum and Circulation
Example: Drum Level and Circulation Stability
Suppose a boiler is operating at a steady moderate load. The drum level is maintained near setpoint, and steam quality is acceptable. If the feedwater control valve opens slightly more than needed, drum level rises. A higher level can reduce steam space volume and increase the chance of moisture carryover. That moisture can reach downstream equipment, but it also changes the effective separation conditions in the drum.
Now consider the circulation side. If the level rises, the liquid head feeding generating tubes increases, which can alter boiling distribution and two-phase friction. The result can be a subtle shift in circulation flow and steam quality even if total firing remains unchanged. The integrated lesson is that drum level is not just a “water quantity” variable; it influences separation and circulation hydraulics together.
Example: Natural vs. Forced at Low Load
At low load, natural circulation may weaken because vapor generation is limited, reducing buoyancy head. If circulation flow drops too far, tube heat removal can deteriorate, and local boiling can become uneven. In contrast, a forced-circulation boiler can keep flow through generating tubes by maintaining pump speed, preserving heat transfer conditions.
The practical point is not that one method is always better. It’s that each method has a characteristic failure mode: natural circulation struggles when buoyancy is insufficient, while forced circulation struggles when pump control or flow distribution is mismatched to heat input.
2.5 Selecting Boiler Configuration for Manufacturing, Utility, and Marine Use Cases
Choosing a boiler configuration is mostly a matching exercise: the boiler must fit the fuel, the required steam conditions, the operating pattern, and the constraints of the plant or vessel. The “right” choice is the one that keeps steam quality stable, controls corrosion and deposits, and can be maintained without turning downtime into a lifestyle.
Step 1: Start with Service Requirements
Manufacturing sites often need steady process steam, but load can swing with production schedules. Utility plants typically run at high availability with large, continuous loads. Marine systems face tight space, weight limits, and frequent cycling.
Write down these requirements before comparing boiler types:
- Steam pressure and temperature range, including whether superheat is required.
- Steam purity expectations, especially if steam contacts sensitive equipment.
- Load profile: base load, frequent starts, or long idle periods.
- Space and weight limits, plus allowable footprint for auxiliaries.
Example: A food processing line may require stable, clean steam at moderate pressure. A marine boiler may need compact steam generation with quick response and robust water management.
Step 2: Match Fuel and Combustion Behavior
Fuel choice affects furnace design, heat transfer, and maintenance. Heavy fuels and high-ash fuels increase fouling risk and can demand more robust cleaning access. Gas firing generally offers cleaner combustion and easier tuning, but still requires careful control of excess air to avoid efficiency loss.
Best-practice practice: plan for sootblowing or tube cleaning from day one. If the design makes cleaning awkward, performance will drift as deposits build.
Step 3: Choose the Boiler Type by Heat Transfer and Water Handling
Three common families cover most needs: fire-tube, water-tube, and packaged or modular designs.
- Fire-tube boilers are compact and can be efficient for moderate capacities. They are often used where simplicity and smaller steam demands dominate.
- Water-tube boilers handle higher pressures and temperatures more naturally and tolerate demanding operating conditions. They also support better circulation control when properly designed.
- Packaged boilers can be a practical middle ground for manufacturing, where installation speed and standardized components matter.
Example: A utility unit aiming for high-pressure steam typically favors water-tube arrangements because they better support large-scale heat transfer surfaces and high steam conditions.
Step 4: Decide on Circulation and Steam Quality Strategy
Steam quality depends on how water and steam separate in the boiler and how stable circulation remains under load changes.
- Natural circulation designs rely on density differences and can be stable for many steady operations.
- Forced circulation designs can improve control under variable loads, but require reliable pumps and careful maintenance.
Best-practice practice: treat steam drum internals and separation devices as part of the “steam quality system,” not as passive hardware. Poor separation leads to carryover, which then damages turbines and plugs piping.
Step 5: Configure Economizers, Superheaters, and Feedwater Trains
Heat recovery components determine how efficiently the boiler converts fuel energy into useful steam.
- Economizers recover heat from flue gas to preheat feedwater, reducing fuel use.
- Superheaters raise steam temperature for process or turbine efficiency.
- In marine use, the layout must consider space and maintenance access while still protecting surfaces from fouling.
Example: A manufacturing plant with frequent load changes benefits from control strategies that keep superheat stable. A utility plant benefits from well-instrumented feedwater trains that prevent temperature swings and reduce thermal stress.
Step 6: Apply Use-Case Selection Logic
Manufacturing Use Cases
Manufacturing selection usually prioritizes stable steam quality, maintainability, and compatibility with process steam headers.
- Choose a configuration that supports the expected pressure range and allows practical cleaning.
- Ensure the feedwater treatment system can meet the chemistry targets required for the chosen heat transfer surfaces.
Utility Use Cases
Utility selection prioritizes availability, large capacity, and integration with turbine or steam network requirements.
- Water-tube designs are common for high-pressure/high-temperature steam.
- Redundancy in critical controls and robust safety systems matter because the boiler must stay online.
Marine Use Cases
Marine selection prioritizes compactness, fast response, and water management under motion and variable duty.
- Favor designs that tolerate cycling and provide reliable separation and blowdown control.
- Plan for maintenance access that can be performed during scheduled dock time.
Mind Map: Boiler Configuration Selection
Example: A Practical Selection Walkthrough
A manufacturing plant needs moderate-pressure steam with frequent production shifts. The team compares a compact fire-tube option against a packaged water-tube option.
They choose the packaged water-tube configuration because it better supports stable steam temperature and easier access for cleaning, while the feedwater treatment system can meet the chemistry needs for the selected surfaces. The control strategy is then tuned to prevent superheat swings during load changes, and the steam quality targets are verified during commissioning.
Example: Utility Versus Marine Trade-Off
A utility plant selects a water-tube boiler with economizer and superheater trains because it must deliver high-pressure steam reliably and integrate with turbine requirements. A marine operator selects a more compact, cycling-tolerant configuration and emphasizes separation performance and blowdown control to manage water quality despite variable operating conditions.
In both cases, the selection is justified by the same logic: match the configuration to the steam conditions, protect steam quality, and ensure maintenance can keep performance from drifting.
3. Fuel Systems, Combustion, and Burner Operation
3.1 Fuel Characteristics and Their Effects on Combustion and Heat Transfer
Fuel is not just “something that burns.” Its physical form, chemical makeup, and impurities determine how quickly it releases energy, how completely it burns, and how much heat ends up on the boiler’s heat-transfer surfaces instead of in the stack. The practical goal is to match fuel behavior to burner design, furnace geometry, and operating targets like excess air and steam temperature.
Fuel Physical Form and Handling
Solid fuels (coal, biomass) require drying, devolatilization, and particle transport before they can burn. If moisture is high, more energy goes into evaporation, reducing effective heat input and increasing flue gas volume. For example, if a biomass feed has 30% moisture instead of 15%, the burner must supply extra latent heat just to drive off water, and the same firing rate produces less steam.
Liquid fuels (oil) atomize into droplets. Poor atomization creates larger droplets that burn slowly and may impinge on surfaces. A simple check is droplet size sensitivity: when atomizing steam or air pressure drops, you often see higher unburned hydrocarbons and soot, which later shows up as increased sootblowing frequency.
Gaseous fuels burn quickly once mixed with air. Their main “handling” issue is consistent pressure and composition so the burner’s air-fuel ratio stays correct.
Chemical Composition and Energy Release
The core chemical metric is heating value, typically reported as higher heating value (includes water vapor condensation) or lower heating value (excludes it). In boiler calculations, the lower heating value is usually the relevant one because most systems do not recover condensation heat from flue gas.
Carbon and hydrogen content largely determine how much heat is released and what products form. A fuel richer in hydrogen tends to produce more water vapor in flue gas, which can affect stack losses and condensation risk in economizers or ducts.
Sulfur content matters because it forms sulfur oxides. In the presence of moisture and certain operating conditions, those can contribute to corrosion and deposits. For instance, if a boiler runs cooler than expected, acid condensation risk rises, and you may see accelerated corrosion on lower-temperature surfaces.
Nitrogen in the fuel and air contributes to nitrogen oxides. While the exact chemistry is complex, the practical takeaway is that combustion temperature and oxygen availability influence NOx formation.
Volatile Matter, Ignition, and Flame Stability
For solid fuels, volatile matter controls how readily the fuel ignites. High-volatility fuels ignite faster, making flame stability easier at lower loads. Low-volatility fuels may require higher furnace temperatures or more aggressive mixing to avoid incomplete combustion.
A useful operational example: if a coal unit starts showing increased carbon-in-ash during stable firing, the cause is often not “mystery soot,” but a shift in ignition quality—such as changes in coal grind size, moisture, or air distribution.
Impurities and Their Heat Transfer Consequences
Ash and ash-forming elements affect both combustion and heat transfer. Ash can deposit on tubes, reducing heat transfer by adding thermal resistance. It can also form slagging layers in the furnace if melting behavior is favorable.
Two practical indicators:
- Soot and unburned carbon: usually linked to incomplete combustion and poor mixing. This increases flue gas-side resistance and can raise stack temperature.
- Mineral deposits: linked to ash chemistry and furnace temperature distribution. These can be harder to remove and may require targeted cleaning.
If you switch from one fuel blend to another, the same firing rate can produce different deposit patterns even when heating value is similar, because ash composition and melting characteristics change.
Combustion Stoichiometry and Excess Air
Fuel composition sets the theoretical air requirement. If you underfeed air, you get incomplete combustion: more CO, more unburned hydrocarbons, and higher soot. If you overfeed air, you dilute the flame and increase flue gas mass flow, which increases sensible heat carried away.
Example: Suppose a burner is tuned for a fuel with a certain carbon-to-hydrogen ratio. If the next batch has higher carbon, the same air setting may become slightly air-deficient, increasing CO and soot. The fix is not “more air forever,” but restoring the air-fuel balance using oxygen and CO trends.
Heat Transfer Pathways and Where Fuel Effects Show Up
Fuel characteristics influence heat transfer through three main pathways:
- Flame location and radiation: Faster ignition and better mixing can shift where heat is released in the furnace.
- Flue gas composition: Incomplete combustion increases soot, which blocks radiation and convection.
- Deposit formation: Ash chemistry and moisture drive fouling rates.
A systematic way to connect fuel to performance is to track stack oxygen, CO (or combustibles), stack temperature, and inspection results. When fuel moisture rises, you often see higher stack temperature and more carryover of unburned material if mixing is unchanged.
Integrated Example: Switching Fuel Blend Without Changing Hardware
A plant blends two fuels with similar heating value but different ash and volatile content. After the switch, operators notice oxygen stays near the setpoint but CO rises slightly and sootblower cycles become more frequent. The most likely chain is: the new blend has higher volatile content that changes flame structure, and its ash forms deposits more readily on convection surfaces. The response is to re-check air distribution and burner settings using CO and oxygen trends, then confirm deposit patterns during inspection. This keeps the fix tied to observed combustion behavior rather than guessing at “mystery efficiency loss.”
3.2 Burner Types, Air/Fuel Mixing, and Ignition Systems
Burners are the part of a boiler system that turns “fuel and air” into a controlled flame that releases heat where the furnace can handle it. The burner’s job is threefold: deliver the right fuel flow, provide air in the right amount and pattern, and ignite reliably without creating unsafe conditions.
Burner Types
Burners are commonly grouped by fuel delivery and flame shape.
Gas burners use pressure regulators and valves to meter fuel, then mix it with air either before the burner (premix) or inside the burner (diffusion). Premix designs can produce low soot because there’s less local fuel-rich chemistry, but they require careful control to avoid flashback. Diffusion designs tolerate wider operating ranges and are often easier to retrofit, though they may need more attention to soot formation during low-load operation.
Oil burners atomize fuel using steam, air, or mechanical pressure. Atomization matters because droplet size controls evaporation rate; larger droplets can reach cooler furnace zones before fully vaporizing, which increases smoke and unburned carbon. Oil burners also include a flame scanner and a purge sequence because ignition must be controlled and repeatable.
Dual-fuel burners combine two fuel paths with interlocks so only one fuel is active at a time. This is useful when one fuel is cheaper or more available, but the control logic must ensure that switching doesn’t leave a partially ignited mixture behind.
Staged combustion burners split air and fuel into zones so the burner can run leaner overall while keeping enough heat release near the flame to stabilize combustion. Staging reduces peak temperatures and can improve emissions, but it also increases the need for good mixing and stable ignition.
Air and Fuel Mixing
Mixing is the difference between a flame that burns cleanly and one that leaves soot, CO, or unstable combustion.
Premixed mixing aims to combine fuel and air before ignition. The advantage is more uniform combustion, which can reduce soot and improve controllability. The risk is that if the mixture is too hot or the flow pattern allows reverse flow, ignition can propagate back toward the fuel supply. Practical best practice is to use burner designs with flame arresting features and to keep purge and ignition sequences strict.
Diffusion mixing relies on turbulent mixing in the furnace. Fuel jets enter air and burn as they mix. This approach is robust for variable loads, but it can create fuel-rich pockets that produce soot if air distribution is poor or if atomization is weak.
Swirl-assisted mixing uses a rotating flow to create a central recirculation zone. That recirculation holds hot gases near the burner face, helping ignition and flame stability. Swirl also increases mixing intensity, but excessive swirl can increase pressure drop and can shift the flame too far downstream.
A simple way to think about mixing is to match three time scales: fuel delivery time, droplet or gas mixing time, and chemical reaction time. If mixing is slow compared to reaction, you get local rich zones and soot. If reaction is slow compared to mixing, you can get long ignition delays and unstable flame.
Example
A natural gas burner running at low load may show rising CO because the air pattern changes and the flame becomes less stable. The fix is not “more fuel,” but restoring the intended air distribution—often by adjusting air damper position, verifying actuator calibration, and confirming that the burner fan speed and damper feedback are consistent with the control signal.
Ignition Systems
Ignition systems must create a reliable spark or pilot flame and then prove flame establishment before allowing full fuel flow.
Spark ignition uses an igniter electrode and a high-voltage transformer. It’s common for gas and some oil systems. The spark energy must be sufficient under the expected furnace conditions, and the control must ensure the spark is present during the ignition window.
Hot surface ignition heats a ceramic element until it can ignite the mixture. This is efficient for some gas applications, but it requires correct element temperature and careful start-up timing.
Pilot ignition uses a small flame that remains lit during operation. Pilots improve reliability, especially for difficult fuels or large furnaces, but they add a continuous fuel consumption and require flame monitoring.
Flame detection typically uses UV or flame rod sensors. UV detectors respond quickly to flame radiation but can be sensitive to certain light backgrounds. Flame rods require electrical conductivity in the flame and can be affected by deposits.
A key operational best practice is to treat ignition as a safety sequence, not a convenience. Purge cycles remove residual combustible gases, ignition trials are limited, and the system must lock out if flame is not proven within the allowed time.
Example
During start-up, an oil burner may fail to ignite because atomization pressure is low, producing larger droplets that don’t vaporize quickly. The flame scanner never sees a stable flame, so the controller repeats purge and then locks out. The correct troubleshooting path is to verify atomization pressure, nozzle condition, and fuel pressure stability before changing ignition settings.
Mind Map: Burner Types, Mixing, and Ignition
Case-Style Integration
When a burner misbehaves, the cause usually sits at the boundary between mixing and ignition. If ignition fails, check purge and ignition energy first, then verify that the mixture quality matches the burner design. If ignition succeeds but combustion is dirty, focus on air distribution, swirl settings, and atomization quality rather than simply increasing fuel. This keeps the system consistent: ignition proves the flame can form, and mixing determines whether it stays clean and stable.
3.3 Combustion Stoichiometry, Excess Air, and Flue Gas Composition
Combustion stoichiometry starts with a simple idea: for complete combustion, every carbon atom needs oxygen to become CO₂, every hydrogen atom needs oxygen to become H₂O, and any oxygen not used shows up in the flue gas. Real burners rarely hit the exact stoichiometric point, so we use excess air and then interpret the flue gas to confirm what actually happened.
Stoichiometric Balance for Common Fuels
Start by writing the balanced reaction for a fuel and oxygen. For a hydrocarbon fuel written as CₓHᵧ, the stoichiometric oxygen requirement is:
- CO₂ produced: x mol CO₂ per mol fuel
- H₂O produced: y/2 mol H₂O per mol fuel
- O₂ required: x + y/4 mol O₂ per mol fuel
Then convert oxygen to air using air composition. Dry air is about 21% O₂ and 79% N₂ by volume, so the stoichiometric air is:
- Air moles = O₂ moles / 0.21
- N₂ moles = O₂ moles × (0.79/0.21)
Example: For methane, CH₄.
- Stoichiometric O₂ = 1 + 4/4 = 2 mol O₂ per mol CH₄
- Stoichiometric air = 2/0.21 ≈ 9.52 mol air per mol CH₄
- N₂ in air = 2 × 0.79/0.21 ≈ 7.52 mol N₂
If you run exactly stoichiometric conditions, there is no leftover O₂, but in practice mixing and flame stability issues usually require some excess air.
Excess Air and Why It Matters
Excess air is defined as:
- Excess air ratio λ = (actual air)/(stoichiometric air)
- Excess air percent = (λ − 1) × 100%
When λ > 1, oxygen remains in the flue gas. That leftover oxygen is useful for diagnosing combustion quality, but it also increases flue gas flow and heat losses because more nitrogen and oxygen must be heated and exhausted.
A practical way to connect excess air to flue gas is through O₂ in the stack. If you measure dry stack O₂, you can estimate λ and then infer whether combustion is likely complete.
Flue Gas Composition: Dry vs Wet
Flue gas measurements are commonly reported on a dry basis, meaning water vapor is removed from the sample. This matters because water content changes with fuel hydrogen and combustion conditions.
For reasoning and calculations, keep two tracks:
- Wet flue gas: includes H₂O; useful for stack temperature and condensation risk.
- Dry flue gas: excludes H₂O; useful for comparing O₂, CO, and CO₂ across operating points.
In boiler tuning, dry O₂ and CO are the usual “truth serum.” Low CO with stable O₂ suggests complete combustion and good mixing.
Linking Stoichiometry to Measured CO₂, O₂, and CO
For hydrocarbon fuels with complete combustion, the carbon ends up as CO₂ (not CO). If CO is present, it indicates incomplete combustion, often from poor mixing, low residence time, flame quenching, or burner/air distribution problems.
A simple diagnostic logic:
- Higher O₂ than expected for the load often means too much excess air, which can reduce efficiency.
- Lower O₂ than expected can mean insufficient air, increasing CO risk.
- CO rising while O₂ is low is a strong sign of incomplete combustion.
Example: Suppose a boiler at a given load shows dry O₂ of 6% and CO of 50 ppm. If you reduce excess air and O₂ drops to 4% while CO rises to 200 ppm, you have moved toward incomplete combustion. Returning toward the earlier O₂ level restores completeness.
Mind Map: Stoichiometry, Excess Air, and Flue Gas
Worked Example: Estimating Excess Air from Dry O₂
Assume complete combustion of a hydrocarbon fuel with no CO. For a given fuel, the relationship between λ and dry O₂ can be derived from the oxygen left over after forming CO₂ and H₂O. In practice, you use a combustion calculator or burner manual curve, but the reasoning is consistent: as λ increases, leftover O₂ increases, and CO₂ decreases slightly on a dry basis because more air dilutes the products.
Example approach (conceptual):
- Measure dry stack O₂.
- Compare it to the target range for the burner and load.
- If O₂ is above target, reduce excess air gradually while monitoring CO.
- If O₂ is below target, increase excess air to prevent CO rise.
This is why tuning is not just about “getting O₂ to a number.” The CO measurement tells you whether the combustion chemistry is staying complete while you adjust air.
Common Pitfalls That Break the Logic
First, mixing problems can produce local rich zones even when average O₂ looks acceptable, so CO is the safety check. Second, measurement basis confusion (wet vs dry) can lead to incorrect comparisons across operating points. Third, air leaks upstream of the sampling point can artificially raise measured O₂, making the system look leaner than it is. Keeping these in mind makes the stoichiometry-to-flue-gas chain reliable enough for day-to-day operation.
3.4 Draft Systems Induced Draft Forced Draft And Balanced Draft
Draft is the pressure difference that moves flue gas through the boiler and stack. Think of it as the “push” that keeps combustion products flowing at the right rate, while also protecting the furnace from unwanted backflow. In practice, draft is managed by fans, stack height, and control dampers, and it must be coordinated with burner firing rate and combustion air.
Core Draft Concepts
Draft is usually expressed as pressure (often inches of water column). A negative pressure in the furnace relative to the boiler room helps prevent flue gas leakage. However, too much negative pressure can pull excess air through unintended paths, raising excess oxygen and lowering efficiency. Too little draft can cause poor mixing, unstable flame, and higher carbon monoxide.
Natural draft comes from stack buoyancy, but most industrial boilers rely on mechanical draft because it is controllable across load changes. Mechanical draft systems also make it easier to keep furnace pressure within limits.
Induced Draft Systems
An induced draft (ID) fan pulls flue gas from the boiler outlet and discharges it to the stack. Because the fan is downstream, the furnace and boiler are typically under negative pressure relative to the room. This is a practical advantage for safety and cleanliness: leaks tend to pull air in rather than push flue gas out.
ID systems are common when the boiler needs stable flow under varying firing rates. The fan speed or inlet damper is controlled to maintain furnace pressure and flue gas oxygen targets.
Easy example: imagine a small boiler room with a slightly leaky furnace door. With ID draft, the pressure inside the furnace is lower than the room, so air leaks inward. With forced draft, the same leak would push flue gas outward.
Operational details that matter:
- ID fans see hot, dirty gas, so materials and maintenance intervals must match soot and corrosion risk.
- Because the fan is downstream, the system is sensitive to downstream restrictions like plugged economizer sections or dirty air heaters.
- Control typically uses furnace pressure and sometimes stack opacity or oxygen as supporting signals.
Forced Draft Systems
A forced draft (FD) fan supplies combustion air to the burner and furnace. The fan is upstream, so the furnace is typically under positive pressure relative to the room. This can improve combustion air delivery, especially for burners that need a consistent air mass flow.
Easy example: a burner that requires tight air-fuel control benefits from FD because the air supply is actively metered. If the air delivery is consistent, the burner tuning stays more repeatable.
Operational details that matter:
- Positive furnace pressure increases the chance of flue gas escaping through gaskets and openings. Sealing and inspection become more important.
- FD systems must avoid over-pressurizing the furnace, which can disturb flame shape and increase carryover.
- When load drops quickly, the FD fan may keep pushing air unless controls coordinate with burner turndown and damper positions.
Balanced Draft Systems
Balanced draft uses both forced draft and induced draft fans, coordinated so the furnace pressure stays near a target value. The goal is to combine the safety tendency of ID (negative furnace) with the stable air supply of FD.
Balanced draft is especially useful when you need tight furnace pressure control across wide load ranges, or when the boiler has complex gas paths that make single-fan control harder.
Easy example: a plant with frequent production swings might see oxygen and CO drift if only one fan is used. With balanced draft, the control system can adjust both air and gas removal so furnace pressure and combustion conditions remain stable.
Operational details that matter:
- Coordination is essential: if FD increases without a matching ID response, furnace pressure rises and leaks become more likely.
- Control loops often include furnace pressure as the primary variable, with burner firing rate as a feedforward input.
- Dampers and fan curves must be selected so the system can respond without hunting, especially during rapid load changes.
Draft Systems Mind Map
Mind Map: Draft System Selection and Control
Practical Control Logic Without the Mystery
A good draft control strategy keeps furnace pressure within a narrow band while allowing the burner to change firing rate. In ID systems, the ID fan typically tracks firing rate and furnace pressure. In FD systems, the FD fan tracks air demand and furnace pressure, while ID may be passive or limited. In balanced draft, both fans respond so the furnace pressure stays controlled.
Easy example: if furnace pressure drifts upward (less negative or more positive), the control should either reduce FD air, increase ID suction, or both. If furnace pressure drifts downward, the opposite actions apply. The key is that the direction of correction must match the pressure sign convention used in the instrumentation.
Common Symptoms and What They Usually Mean
- Low draft or unstable draft: flame instability, higher CO, and sootier combustion can appear because flue gas removal is insufficient.
- Excessive draft: higher excess oxygen and heat loss through stack can occur because air infiltration increases.
- Pressure mismatch in balanced systems: furnace pressure swings can cause inconsistent combustion and leakage concerns.
The best systems treat draft as a coordinated part of combustion, not a standalone fan setting. When draft control is aligned with burner operation and boiler cleanliness, the boiler behaves like it has fewer surprises and more predictable performance.
3.5 Combustion Tuning, Instrumentation, and Troubleshooting Procedures
Combustion tuning is the habit of making the boiler burn the fuel the way the design intended, under the actual conditions you run every day. The goal is stable flame, complete combustion, controlled steam generation, and predictable emissions—without chasing numbers that don’t connect to physics.
Foundational Signals and What They Mean
Start with the three signals that most directly describe the combustion process: oxygen (O₂) or excess air, carbon monoxide (CO), and stack temperature. O₂ tells you how much air is available; CO tells you whether combustion is incomplete; stack temperature hints at how much heat is carried away with flue gas.
A practical rule: if O₂ is high and CO is low, you’re usually burning clean but may be wasting heat. If O₂ is low and CO is rising, you’re likely starving the flame. If CO is low but stack temperature is high, heat transfer may be reduced by fouling or poor heat recovery.
Instrumentation Setup That Prevents Misleading Results
Good tuning depends on trustworthy measurements. Verify that sensors are installed correctly and reading what you think they’re reading.
- Flue gas analyzer location: sample where mixing is representative, not where stratification is strongest.
- Probe condition: soot, condensate, or deposits can bias readings. Clean and inspect on the same schedule you use for tuning.
- Calibration discipline: calibrate analyzers and confirm zero/span before major adjustments.
- Pressure and draft measurement: draft affects air distribution to the burner. A “perfect” burner setting can still fail if draft is off.
A simple example: if O₂ reads 3% but the draft gauge shows a sudden drop, the burner may be pulling less air than expected. The analyzer is fine; the system is not.
Tuning Workflow from Stable Combustion to Efficiency
Use a repeatable sequence so each adjustment has a clear cause.
- Stabilize firing rate: tune at a steady load. Changing load while tuning is like adjusting a thermostat while someone opens the door.
- Set draft and air distribution: confirm fan speed, damper position, and linkages. Then verify that burner air registers move as commanded.
- Tune fuel flow and atomization: for oil, check atomizing steam or air pressure and spray pattern. For gas, verify manifold pressure and regulator response.
- Adjust excess air using O₂: move toward the lowest O₂ that still keeps CO near zero and flame stable.
- Confirm combustion completeness with CO: if CO rises during O₂ reduction, back off slightly and check for air distribution problems.
- Check stack temperature and heat transfer: if O₂ and CO look good but stack temperature is high, investigate sootblowing schedule, tube fouling, and economizer performance.
A concrete example at mid-load: you reduce O₂ from 5% to 3.5%. CO stays low, flame remains steady, and steam output holds. You stop there because further reduction risks CO spikes during minor load swings.
Mind Map: Combustion Tuning Logic
Troubleshooting Procedures That Use Evidence
When combustion problems appear, resist the urge to change everything at once. Use symptom-to-cause mapping.
Symptom: CO is high
- Check O₂ trend: if O₂ is low, you likely have insufficient air. Verify draft, damper position, and fan performance.
- Check fuel delivery: for oil, confirm atomization pressure and nozzle condition. For gas, verify manifold pressure stability.
- Check mixing: burner air registers stuck or misaligned can create local fuel-rich zones.
Symptom: O₂ is high while CO is low
- Confirm draft is not excessive. A strong draft can pull more air than the burner control expects.
- Check dampers and linkages for correct movement.
- Review whether load is stable; tuning at the wrong firing rate can leave you with unnecessary excess air.
Symptom: Stack temperature is high with good O₂ and low CO
- Treat it as a heat transfer problem first. Inspect sootblowing effectiveness and look for fouling patterns.
- Verify economizer performance and ensure flow paths are not restricted.
Symptom: Flame instability or burner trips
- Confirm ignition system operation and flame detection signal quality.
- Look for control loop hunting: rapid oscillations in air or fuel can destabilize the flame.
- Verify mechanical basics: burner alignment, refractory condition, and proper purge timing.
Example: A Structured Response to a CO Spike
Suppose CO jumps from near zero to a noticeable level during a load increase.
- Confirm analyzer validity by checking recent calibration status and probe condition.
- Compare O₂ during the spike: if O₂ drops, focus on air delivery and draft response.
- Check fuel pressure and atomization parameters at the same moment.
- Inspect burner air register movement for correct response to the control signal.
- After correcting the air/fuel imbalance, retune excess air to the lowest stable value that keeps CO near zero.
The key is that each step narrows the problem using measurements taken at the moment the symptom appears, not after the system has already recovered.
Practical Tuning Checkpoints
Before calling a tuning “done,” verify it across the operating range you actually use: at least one point near minimum stable firing, one at typical load, and one near the upper end. If the flame stays stable and CO remains controlled at each point, you’ve tuned the system, not just the moment.
4. Feedwater Conditioning and Water Chemistry
4.1 Water Sources, Contaminants, and Chemistry Control Objectives
Industrial boilers are picky about what they drink. The goal of water chemistry is simple: keep dissolved and suspended impurities from turning into corrosion, scale, sludge, or carryover. The path to that goal starts with understanding where the water comes from and what it typically contains.
Water Sources and What They Usually Bring
Most boiler feedwater begins as one of these sources:
- Raw surface water (rivers, lakes): often contains natural organic matter, fine suspended solids, and variable dissolved salts. Seasonal changes can shift both turbidity and organic load.
- Groundwater (wells): commonly has higher dissolved minerals and sometimes dissolved gases. It may be low in suspended solids but high in hardness.
- Municipal supply: usually has been treated, but the quality can still vary. It may contain residual disinfectants and corrosion byproducts from the distribution system.
- Condensate return: typically cleaner than make-up water, but it can pick up contamination from leaks, steam heating coils, and non-condensable gases.
- Blowdown recovery and reuse: can reduce water demand, but it concentrates dissolved species and requires careful control to avoid pushing chemistry out of bounds.
A practical habit is to treat each source as a separate “ingredient.” Mixing them without knowing their chemistry is like combining unknown spices and then wondering why the sauce tastes inconsistent.
Contaminants and Their Boiler Consequences
Contaminants fall into a few functional groups, each with a predictable failure mode.
- Hardness ions (calcium, magnesium): form scale on heat transfer surfaces. Scale acts like insulation, raising metal temperatures and accelerating tube damage.
- Chlorides and sulfates: promote corrosion and can increase the risk of brittle deposits. Chlorides are especially notorious for under-deposit corrosion.
- Dissolved oxygen: drives corrosion in economizers, feedwater lines, and steam drum internals. Oxygen control is often more important than many people expect.
- Carbon dioxide: dissolves into carbonic acid, lowering pH and supporting corrosion.
- Silica: can concentrate during evaporation and form deposits that are hard to remove. Silica control is often tied to how much water is evaporated and how much blowdown is used.
- Total dissolved solids: increase conductivity and can contribute to foaming and carryover if not managed.
- Suspended solids and particulates: settle or plug passages, especially where flow velocities are low.
- Organic matter: can contribute to sludge formation and interfere with treatment chemistry.
- Oil and grease: reduce heat transfer and can foul surfaces; they also complicate filtration and cleaning.
Chemistry Control Objectives That Match the Failure Modes
A good chemistry program translates contaminants into measurable objectives. Typical control objectives include:
-
Minimize corrosion risk
- Control dissolved oxygen and maintain appropriate pH in feedwater.
- Keep carbon dioxide under control through deaeration and proper pH management.
-
Prevent scale and deposit formation
- Reduce hardness and silica entering the boiler.
- Use blowdown strategy to manage concentration of non-volatile species.
-
Reduce carryover of impurities into steam
- Maintain drum water conditions that limit foaming and entrainment.
- Ensure good separation and trap performance so condensate return stays clean.
-
Keep the system clean enough to stay predictable
- Control suspended solids through filtration and proper blowdown.
- Manage organics to avoid sludge that can hide under deposits.
Mind Map: Water Sources to Chemistry Objectives
Integrated Example: Choosing Objectives Based on Source Mix
Assume a plant uses 70% condensate return and 30% make-up water. The make-up is surface water with high seasonal turbidity, while condensate is generally clean but shows occasional oxygen ingress when a steam coil develops a leak.
- From the make-up source, the chemistry objectives emphasize suspended solids and organics removal and hardness/silica reduction so deposits don’t form during evaporation.
- From the condensate source, the objectives emphasize oxygen control and leak detection because even small oxygen ingress can drive corrosion in feedwater piping.
- From the combined system, the program uses blowdown concentration control to manage TDS and silica buildup, while maintaining drum conditions that limit foaming and carryover.
The key is that the objectives are not generic. They are derived from the actual water sources and the contaminants those sources tend to carry.
Practical Control Mindset for Operators
Operators don’t need to memorize every chemical interaction. They do need a consistent logic chain:
- Identify the sources feeding the boiler.
- Identify the contaminants those sources typically contribute.
- Set measurable objectives that prevent the known failure modes.
- Verify performance through routine sampling and trend review.
When that chain is intact, chemistry becomes a controlled process rather than a reactive guessing game.
4.2 Softening, Deaeration, and Filtration Practices
Softening, deaeration, and filtration are the three workhorses of feedwater preparation. Softening reduces scale-forming hardness, deaeration removes dissolved oxygen that drives corrosion, and filtration captures suspended solids that would otherwise become grit in the boiler and deposits on heat transfer surfaces.
Softening Practices
Hardness in feedwater is mainly calcium and magnesium. When boiler water heats up, bicarbonates and carbonates can convert into insoluble scale, especially where heat flux is high. The goal of softening is not to make water “perfect,” but to keep hardness low enough that the boiler’s chemistry control can do its job without constant blowdown.
Common softening approaches include:
- Lime-soda softening: Calcium hardness is precipitated as calcium carbonate or hydroxide using lime, while soda ash helps remove temporary hardness. A practical way to think about it is “turn dissolved ions into solids, then remove the solids.”
- Ion exchange (sodium zeolite or resin): Calcium and magnesium ions swap onto the resin, replaced by sodium. This is often favored for consistent performance and compact systems.
- Reverse osmosis (RO) pretreatment: RO can remove a large fraction of dissolved salts before polishing steps. It is especially useful when raw water quality is variable.
Operational best practices
- Match the method to the water source: If hardness swings daily, ion exchange and RO systems need tighter monitoring than a stable municipal supply.
- Control residuals, not just “treated hardness”: Track silica, alkalinity, and conductivity because they influence scaling risk and boiler chemistry balance.
- Manage regeneration and waste streams: Ion exchange regeneration produces brine; lime-soda produces sludge. Both require proper handling so the “solution” doesn’t become a disposal problem.
Example:
A plant using ion exchange notices higher blowdown after a week of heavy rain upstream. The treated hardness reading looks acceptable, but conductivity rises and alkalinity shifts. The likely cause is resin exhaustion or incomplete regeneration. The fix is to verify regeneration chemical concentration, check resin bed performance, and confirm that post-treatment sampling points are correct.
Deaeration Practices
Dissolved oxygen is the corrosion troublemaker. Even small oxygen levels can accelerate pitting and under-deposit corrosion, particularly in economizers, feedwater lines, and boiler headers.
Deaeration removes oxygen by combining chemical oxygen scavenging and physical stripping.
- Thermal deaeration: Feedwater is heated close to saturation so dissolved gases come out of solution and are vented. The key is temperature and residence time. If the deaerator is under-heated, oxygen removal drops sharply.
- Chemical scavenging: Oxygen scavengers such as sulfite-based treatments convert oxygen into harmless compounds. This provides a safety net when physical removal is imperfect.
Operational best practices
- Keep deaerator outlet temperature stable: A small temperature drop can mean a large oxygen increase.
- Vent properly: Vents must remove released gases. If vent lines are restricted, oxygen can re-dissolve downstream.
- Avoid recontamination: After deaeration, minimize air ingress through leaks, open vents, or poorly sealed sample coolers.
- Verify with oxygen measurement: Use dissolved oxygen monitoring to confirm performance rather than relying only on chemical dosing.
Example:
A boiler experiences recurring feedwater corrosion at a pump discharge elbow. The deaerator temperature is within range, but dissolved oxygen readings show intermittent spikes after maintenance. The likely issue is a temporary leak on a suction line or a valve left slightly open to atmosphere. Repairing the leak and tightening post-maintenance checks restores stable oxygen levels.
Filtration Practices
Filtration captures suspended solids such as sand, rust, and scale particles that slip through upstream treatment. These solids can cause erosion, foul heat transfer surfaces, and accelerate corrosion by creating under-deposit oxygen concentration cells.
Filtration can be:
- Cartridge or bag filters for smaller systems or polishing.
- Sand or multimedia filters for bulk removal.
- Strainers and duplex basket filters for protecting pumps and instrumentation.
Operational best practices
- Choose the right micron rating: Too coarse allows solids through; too fine increases pressure drop and bypass risk.
- Control differential pressure: A rising pressure drop indicates loading. If you ignore it, you eventually get either bypass or filter failure.
- Use proper backwash or cleaning cycles: Cleaning that is too infrequent increases fouling; cleaning that is too aggressive can damage media or disturb settled solids.
- Prevent bypass during maintenance: Many “temporary” bypasses become permanent habits.
Example:
A plant installs a 50-micron strainer upstream of a deaerator feed pump. After a month, differential pressure rises and pump vibration increases. Inspection reveals a partially blocked basket and debris bypassing through a worn gasket. Replacing the gasket and tightening the cleaning schedule prevents both pressure loss and mechanical wear.
Mind Map: Softening, Deaeration, and Filtration Flow
Integrated Operating Logic
Treat the system as a chain: softening reduces scale-formers, filtration removes particles that seed deposits, and deaeration controls oxygen-driven corrosion. If one link weakens, the others can’t fully compensate. For example, good deaeration cannot prevent under-deposit corrosion if filtration lets solids accumulate, and strong filtration cannot stop scale if hardness is high. The practical approach is to monitor the outputs that matter: hardness trends, dissolved oxygen readings, and filter differential pressure, then adjust the upstream steps accordingly.
4.3 Boiler Water Treatment: Phosphate, Alkalinity, and Oxygen Control
Boiler water treatment aims to keep scale, corrosion, and carryover from turning your boiler into a slow-motion science project. Phosphate, alkalinity, and oxygen control work together: alkalinity sets the chemical “rules” for pH and carbonate behavior, phosphate manages hardness and metal ions by forming controlled deposits, and oxygen control prevents corrosion that pH alone cannot fix.
Foundational Concepts That Drive the Chemistry
Phosphate treatment is mainly about controlling calcium and magnesium. When hardness ions enter the boiler, they can form hard, insulating scale that reduces heat transfer. Proper phosphate dosing encourages the formation of softer, filterable deposits (often called “sludge”), which are easier to remove during blowdown and cleaning.
Alkalinity is the measure of buffering capacity, typically expressed as carbonate and bicarbonate alkalinity in feedwater and as hydroxide/carbonate species in boiler water. Higher alkalinity can reduce corrosion risk by keeping pH in a protective range, but excessive alkalinity can increase caustic stress and promote foaming and carryover.
Oxygen control targets dissolved oxygen in feedwater and condensate. Oxygen reacts with iron surfaces to form corrosion products even when pH is well controlled. That’s why oxygen control is not optional in systems with condensate return.
Phosphate Control: What You Want and What You Don’t
Phosphate dosing is usually tracked through tests for phosphate concentration and sometimes phosphate-to-alkalinity ratios. The goal is to keep phosphate high enough to bind hardness, but not so high that it drives excessive sludge or increases the risk of carryover.
A practical way to think about it: if hardness enters faster than phosphate can bind it, you’ll see scale tendencies. If phosphate is far ahead of hardness, you may create more sludge than the blowdown strategy can handle.
Example: A plant adds phosphate to a boiler fed by softened water, but the softener occasionally regenerates late. During those weeks, hardness spikes. Operators notice rising conductivity and a gradual increase in boiler pressure drop across the steam generating surfaces. After tightening softener timing and adjusting phosphate dosing based on actual feedwater hardness, the pressure drop stabilizes.
Alkalinity Control: Buffering Without Overdoing It
Alkalinity is managed to maintain a protective pH and to support phosphate precipitation behavior. In many boiler programs, alkalinity is controlled alongside phosphate so that the chemical environment stays consistent.
If alkalinity is too low, corrosion risk rises and phosphate may not precipitate effectively. If alkalinity is too high, you can increase caustic concentration at metal surfaces and encourage foaming, which can carry water into steam lines.
Example: A boiler shows frequent priming events after operators increase alkalinity to “fix” corrosion complaints. The corrosion slows, but steam quality worsens. The root cause is not just pH; it’s that higher alkalinity increases the likelihood of foaming and carryover. Returning alkalinity to target and improving oxygen removal reduces both corrosion and priming.
Oxygen Control: The Fastest Path to Less Corrosion
Oxygen removal is typically achieved through deaeration and chemical oxygen scavenging. Mechanical deaeration reduces dissolved oxygen by heating and venting, while scavengers react with remaining oxygen.
The key operational idea is that oxygen control must be consistent across the whole feedwater train. A small leak in a condensate return line can reintroduce oxygen, and the boiler will pay for it.
Example: A condensate pump seal begins leaking slightly. Oxygen scavenger consumption rises, and corrosion coupons show increased metal loss. After repairing the seal and verifying deaerator performance, scavenger dosing returns to normal and corrosion rates decline.
Integrated Control Strategy: How the Pieces Fit
A stable program treats phosphate, alkalinity, and oxygen as linked variables. Oxygen control reduces corrosion products that can consume alkalinity and interfere with deposit formation. Phosphate and alkalinity then manage hardness and keep deposits controllable.
A simple operational workflow is to test feedwater and boiler water, compare results to targets, and adjust dosing while watching steam quality indicators.
Example: Weekly testing shows phosphate drifting low while oxygen scavenger demand is stable. Hardness in feedwater is unchanged, but boiler conductivity rises. Operators increase phosphate slightly and confirm that steam quality remains steady. After the next blowdown cycle, conductivity returns toward target and deposit-related performance issues stop.
Mind Map: Phosphate, Alkalinity, and Oxygen Control
Practical Checks That Keep Chemistry Honest
Track trends rather than single readings. A one-day phosphate spike may be less important than a week-long drift that changes deposit behavior. Also verify that sampling points are correct and that test methods are consistent; chemistry control fails quietly when the measurement system is off.
Finally, connect water chemistry to operating observations: if steam quality worsens, revisit alkalinity and phosphate balance and confirm oxygen control is not masking corrosion-related issues. Chemistry is not just numbers; it’s how the boiler responds.
4.4 Condensate Polishing, Return Condensate, and Corrosion Prevention
Condensate is usually the “cleanest” water in a steam system, but it is rarely chemically perfect. As steam condenses, dissolved oxygen, carbon dioxide, and trace carryover from boiler water can follow the condensate downstream. Condensate polishing and careful return practices reduce corrosion risk and protect heat exchangers, pumps, and boiler feedwater trains.
Condensate Return Basics and Why Polishing Matters
Return condensate typically passes through a condensate receiver and then to the deaerator or directly to feedwater treatment depending on system design. Even when the condensate looks clear, chemistry can be off. Two common issues are oxygen ingress through leaks and noncondensable gases that increase corrosion rates. Another issue is hardness or silica that can concentrate in the boiler if condensate is not properly conditioned.
A practical rule: treat condensate as “water with a history.” If it came from a process with leaks, poor steam quality, or frequent trap failures, assume it needs more attention.
Condensate Polishing Methods and Selection Logic
Polishing is the final cleanup step before feedwater enters the boiler train. The most common approaches are ion exchange (mixed bed or cation/anion stages) and, in some systems, filtration to remove suspended solids.
Ion exchange removes ionic contaminants by exchanging them for hydrogen and hydroxide ions (mixed bed) or by staged removal (cation then anion). The goal is to reduce conductivity and specific ions that drive corrosion or boiler scaling.
Selection logic is straightforward:
- If conductivity is high or specific ions are elevated, use ion exchange.
- If turbidity or particulate matter is present, add filtration before polishing.
- If oxygen control is weak, polishing alone won’t fix corrosion; oxygen must be managed upstream.
Mind Map: Condensate Polishing and Corrosion Control
Return Condensate Practices That Prevent Corrosion
Corrosion prevention starts with keeping oxygen and aggressive ions out of the return line.
Trap Integrity and Leak Control
Failed steam traps allow steam and dissolved oxygen to enter condensate lines. A simple operational check is to compare condensate line temperature and flow against expected values during steady operation. If a line runs unusually warm or shows intermittent flow surges, investigate traps and valve packing.
Venting and Noncondensable Gas Handling
Noncondensable gases reduce heat transfer and can increase corrosion risk by affecting pH and oxygen availability. Proper venting at condensate receivers and deaerators helps keep the system stable. If vents are plugged or undersized, condensate polishing will work harder than necessary.
Minimizing Air Ingress
Air ingress can occur at flanges, pump seals, sample coolers, and open vents. Use tight sampling practices: take samples from closed systems when possible and avoid leaving sample lines open. Even small leaks can overwhelm polishing capacity because oxygen is not removed by ion exchange.
Corrosion Mechanisms and How Polishing Helps
Different corrosion modes respond to different controls.
- General corrosion from oxygen and CO₂: Oxygen accelerates metal oxidation. CO₂ forms carbonic acid in the presence of water, lowering pH. Polishing can reduce ionic species, but oxygen and CO₂ must be controlled by deaeration and venting.
- Under-deposit and pitting corrosion from chlorides: Chlorides concentrate in deposits and can attack stainless and carbon steel surfaces. Polishing reduces chloride carryover, but only if the condensate is not continually contaminated by leaks.
- Flow-accelerated corrosion: High-velocity water in piping can remove protective films. Keeping condensate chemistry stable and avoiding excessive velocities reduces risk.
Example: Diagnosing a Chloride Spike
A plant notices higher conductivity after a maintenance outage. The condensate polisher bed shows earlier breakthrough than usual. The likely cause is a trap failure that allowed boiler water carryover into the condensate receiver. The fix is twofold: repair the trap and confirm chloride reduction by sampling before and after the polisher. If chloride drops after repairs but breakthrough still occurs early, check for bypass valves stuck open or resin fouling.
Monitoring and Operating Targets
Monitoring should connect chemistry results to system actions.
Key measurements include:
- Conductivity of condensate and polished water to track overall ionic removal.
- Specific ions such as chlorides and sulfates when corrosion issues appear.
- Oxygen indicators upstream of polishing, since polishing won’t remove oxygen.
- Resin condition via pressure drop and breakthrough behavior.
A useful practice is to trend conductivity and compare it with trap maintenance logs. When chemistry changes align with specific equipment events, troubleshooting becomes faster and less guessy.
Integrated Example: From Condensate Receiver to Boiler Feed
Imagine a system where condensate returns from multiple process heat exchangers. First, operators verify trap performance and check for air ingress at pump seals. Next, they ensure the receiver venting path is clear and noncondensables are removed. Then, condensate polishing is used to bring conductivity down and remove residual ions. Finally, feedwater chemistry is confirmed to match boiler requirements, reducing both corrosion risk in the feedwater train and scaling risk inside the boiler.
When each step is handled, polishing becomes a finishing process rather than a bandage. That’s the practical difference between “we have a polisher” and “we run a system that stays within chemistry limits.”
4.5 Sampling, Testing, and Interpreting Common Water Quality Parameters
Good water quality control starts with a simple truth: you can’t manage what you don’t measure correctly. Sampling is the bridge between the boiler’s reality and your lab results, and that bridge can be shaky if you ignore location, timing, and handling.
Sampling Foundations
Choose the right sampling point. For boiler water, use a designated sampling connection that represents bulk water, not stagnant pockets. For condensate/return lines, sample where mixing is complete and temperature is stable enough to avoid misleading readings.
Control sampling timing. Take samples during steady operation when possible. If you must sample during load changes, record the operating state (steam demand, blowdown activity, burner mode) because chemistry can shift with concentration and carryover.
Prevent sample contamination. Use clean containers, avoid rinsing with the sample itself unless the procedure specifies it, and keep the sample sealed. For parameters sensitive to air contact, minimize exposure time.
Testing Workflow and What Each Parameter Means
A practical approach is to test in a logical order so one result helps interpret the next.
1) Conductivity and Total Dissolved Solids (TDS). These indicate overall ionic strength. If conductivity rises quickly after a blowdown reduction, you likely have concentration effects rather than a sudden contamination event.
2) pH and Alkalinity. pH tells you acidity/caustic balance, while alkalinity (often measured as carbonate/bicarbonate and related species) indicates buffering capacity. If pH drifts upward while alkalinity stays stable, the cause may be measurement conditions or chemical dosing changes.
3) Hardness and Calcium/Magnesium. Hardness points to incomplete softening or carryover of hardness-forming ions. When hardness appears in boiler water, scale risk increases because heat concentrates ions and accelerates deposition.
4) Chlorides and Sulfates. These are aggressive toward metals and can concentrate in the boiler. Rising chlorides with stable conductivity can still be meaningful because chlorides can drive localized corrosion even when total ions look similar.
5) Dissolved Oxygen and Reducing Conditions. Oxygen is a corrosion driver. If oxygen is high in feedwater or condensate, check deaeration performance and chemical oxygen scavenger dosing. Low oxygen in boiler water is a sign that oxygen control is working, not that other issues are solved.
6) Silica. Silica forms deposits that are hard to remove and can interfere with heat transfer. Silica often comes from the feedwater side, so interpret it alongside source water quality and any polishing steps.
7) Phosphate and Other Treatment Indicators. In phosphate-based programs, phosphate levels help confirm dosing and can indicate whether the treatment is staying in the intended chemistry window.
Interpreting Results Systematically
Use a “pattern first” mindset: look for relationships, not isolated numbers.
- High conductivity + high TDS + low hardness: likely concentration and general dissolved load, not hardness breakthrough.
- High hardness + rising silica: suggests incomplete softening and potential scaling risk on multiple fronts.
- Low pH + low alkalinity: indicates poor buffering or dosing imbalance; verify chemical feed rates and mixing.
- High chlorides with stable conductivity: suspect specific contamination or concentration of chloride-rich streams.
- High dissolved oxygen in feedwater: focus on deaerator operation, venting, and scavenger effectiveness.
Also check measurement sanity. If a sample shows impossible combinations (for example, very high hardness with near-zero conductivity), suspect sampling contamination, dilution errors, or instrument calibration drift.
Mind Map: Sampling and Interpretation
Example: Turning Numbers Into Actions
Assume a boiler sample shows: conductivity higher than usual, pH slightly down, alkalinity down, and hardness up. The pattern suggests buffering loss plus hardness breakthrough, not just concentration from reduced blowdown. The immediate actions are to verify softener performance (resin condition, regeneration effectiveness), confirm chemical feed rates for alkalinity control, and review blowdown strategy to ensure concentration is not creeping upward.
Now consider a different case: conductivity is stable, but chlorides are elevated and sulfates are moderately elevated. That points to a specific ionic contamination or a change in makeup/return composition rather than general concentration. The next step is to check makeup water usage changes, any process leaks into condensate, and whether return condensate is being routed correctly.
Practical Sampling Checklist
- Sample location matches the parameter’s intent.
- Sample is taken during a defined operating condition.
- Container is clean, labeled, and sealed promptly.
- Results are interpreted as patterns with sanity checks.
- Actions target the most likely side: feedwater treatment, dosing, or concentration control.
When sampling and interpretation are consistent, water quality stops being a mystery and becomes a set of measurable cause-and-effect relationships. That’s the whole job: reliable inputs, reliable tests, and decisions that follow the evidence.
5. Boiler Hydraulics, Heat Transfer Surfaces, and Design Considerations
5.1 Heat Transfer Surface Types and Typical Layouts
Heat transfer surfaces are the “where the work happens” parts of a boiler. They are arranged to maximize heat flow from hot gases to water/steam while keeping pressure losses, fouling, and maintenance effort within reason. The layout choices you see in practice are usually trade-offs among heat transfer rate, material limits, accessibility, and how easily the surface can be cleaned.
Core Surface Roles and How Heat Moves
In a typical boiler, hot combustion gases release energy as they cool. That energy crosses three barriers: convection from gas to metal, conduction through the tube wall, and convection/boiling from metal to the working fluid. The surface layout affects each barrier. For example, higher gas-side turbulence can raise the convection coefficient, but it may also increase erosion risk and soot deposition patterns.
A useful mental model is to separate surfaces by what they primarily do:
- Economizer surfaces warm feedwater using still-hot flue gas.
- Evaporator surfaces convert water to steam (or generate steam in forced-circulation designs).
- Superheater surfaces raise steam temperature above saturation.
- Reheater surfaces (in some systems) raise steam temperature after expansion.
Common Heat Transfer Surface Types
Tube Banks and Convective Passes
Tube banks are the most common convective surfaces. Gas flows across tubes in a series of passes. Designers choose tube pitch, finning (if used), and pass arrangement to manage gas velocity and pressure drop. In practice, you’ll often see:
- Straight or slightly inclined tube rows for predictable flow.
- Staggered tube layouts to improve mixing and heat transfer.
- Finned tubes where gas-side heat transfer is limited by low turbulence.
Easy example: If a boiler has a long economizer section, operators may notice that soot accumulates more in lower-velocity regions. That’s not just “dirty air”; it’s a flow-structure outcome from the tube bank layout.
Radiant Walls and Furnace Surfaces
Radiant surfaces absorb energy directly from flame and hot gas radiation. They are typically located in the furnace where gas temperatures are highest. Radiant walls are often made from membrane walls or closely spaced tubes that form a near-continuous boundary.
Easy example: In a water-tube boiler, radiant heat flux is highest near the burner zone. That means tube wall temperatures and slag/ash behavior are most sensitive there, so the furnace layout strongly influences both performance and maintenance.
Membrane Walls and Panelized Furnace Construction
Membrane walls use closely spaced tubes welded together so the furnace behaves like a single heat-absorbing surface. This reduces air leakage and can improve combustion stability. Panelized construction helps with fabrication and replacement.
Easy example: If a membrane wall panel is replaced, the new panel’s tube spacing and weld quality can change local flow resistance and heat flux distribution, which is why commissioning checks matter.
Spiral Coils and Compact Heat Exchangers
Some boiler components use spiral or compact coil arrangements to fit within tight spaces and to increase surface area per volume. These are common where space is constrained or where a particular heat duty must be met with limited length.
Easy example: A compact superheater may achieve the required steam temperature rise in fewer meters of length, but it can be more sensitive to fouling because gas passages are narrower.
Typical Boiler Layouts and Why They Look That Way
Fire-Tube Layouts
In fire-tube boilers, hot gases pass through tubes surrounded by water. The heat transfer surface is the tube wall area, and the layout is usually a bundle with a combustion chamber at one end. Because the gas path is inside tubes, soot management and tube cleaning are central.
Easy example: If you see reduced steam output without a major fuel change, one common cause is tube fouling that reduces gas-side convection. The layout makes cleaning straightforward but not effortless.
Water-Tube Layouts
Water-tube boilers place water/steam inside tubes and hot gases outside. A typical arrangement includes:
- Radiant furnace walls for the bulk of heat input.
- Evaporator convection banks in the gas path.
- Economizer and superheater sections downstream.
A systematic way to picture the flow: gases enter the furnace hot, transfer energy to radiant walls, then move through convective passes where they cool further while heating feedwater and steam.
Package and Vertical Designs
Package boilers often compress the same functional surfaces into a compact footprint. Vertical gas paths can reduce floor space but require careful attention to soot deposition patterns and access for maintenance.
Easy example: In a vertical gas path, gravity helps ash fall, but it can also concentrate deposits at bends and lower turns, so the layout determines where cleaning tools must reach.
Mind Map: Heat Transfer Surface Types and Layout Logic
Design Checks Operators and Engineers Actually Use
Even without doing full calculations, you can reason about layout effectiveness:
- Temperature approach: If the economizer outlet temperature is too close to flue gas temperature, there’s little margin against fouling.
- Steam temperature control: Superheater surface area and placement determine how quickly steam temperature responds to firing changes.
- Cleaning strategy fit: If soot tends to collect in hard-to-reach regions, the layout will quietly reduce long-term efficiency.
Easy example: Suppose a plant adds a sootblower but the boiler still loses efficiency between outages. The likely issue is not “more soot” but “soot moved to a different location,” which points back to the surface layout and gas flow pattern.
Summary of the Systematic Picture
Heat transfer surface types map directly to where energy is transferred: radiant surfaces handle the hottest zone, convective surfaces handle the cooling gas path, and specialized arrangements handle space or duty constraints. Typical layouts follow the same logic: move gases from hot to cooler while stepping the working fluid from feedwater to steam to the desired temperature, all while keeping fouling and maintenance manageable.
5.2 Tube Banks, Pass Arrangements, and Flow Distribution
Tube banks are the “work grid” inside many boiler heat-transfer sections. They turn a messy reality—hot gas moving through a furnace or flue—into a predictable pattern of heat transfer across many tubes. Pass arrangements then decide how many times the working fluid crosses that grid, while flow distribution decides whether each tube gets a fair share or a few tubes do all the work.
Tube Bank Foundations
A tube bank is typically a set of parallel tubes arranged in rows and columns. The gas side sees the tubes as obstacles, so the key geometric choices are tube pitch (spacing), row spacing, and tube layout (commonly inline or staggered). Inline banks align tube centers row-to-row, while staggered banks offset rows so the gas repeatedly changes direction. That repeated redirection increases mixing and heat transfer, but it also increases pressure drop.
On the tube side, the fluid path is shaped by headers, manifolds, and baffles. Even if the tube bank geometry is perfect, poor distribution at the inlet can cause maldistribution: some tubes run hotter, foul faster, or experience different pressure drops than their neighbors.
Pass Arrangements and Why They Matter
A pass arrangement describes how the fluid moves through the heat exchanger. For boiler water/steam circuits, common patterns include single-pass, multi-pass, and split-flow with returns. Each pass adds a reversal or a routing change, which affects:
- Velocity and heat transfer coefficient: Higher velocity generally improves convection but raises pressure drop.
- Temperature profile: More passes can reduce the maximum temperature difference driving forces, which can matter for materials and fouling.
- Hydraulic balance: Every pass adds another opportunity for uneven pressure distribution if headers and orifices are not designed carefully.
A practical way to think about passes is to track the fluid’s journey from the inlet header to the outlet header. If the fluid crosses the tube bank multiple times, the outlet temperature becomes more uniform across the bank, but the system becomes more sensitive to small header geometry differences.
Flow Distribution Mechanics
Flow distribution is governed by pressure losses. The fluid tends to follow the path with the least resistance, so the design goal is to make the resistance of each parallel route as equal as practical.
Key contributors to resistance include:
- Header and manifold losses: Sudden expansions, contractions, and elbows can dominate.
- Tube-to-tube pressure drop differences: Small variations in length, roughness, or blockage can matter.
- Distribution devices: Orifices, flow restrictors, and baffles can equalize pressure.
A simple diagnostic uses temperature and pressure measurements. If two outlet headers show noticeably different temperatures under the same firing rate, the distribution is uneven. If pressure drop across the bank changes disproportionately with load, fouling or partial blockage may be shifting the resistance landscape.
Design Practices That Keep Things Balanced
- Size headers to avoid “short-circuit” flow: If the header velocity is too high, local pressure gradients can steer flow into a subset of tubes.
- Use equal-length or equal-loss routing: When possible, arrange tubes so each parallel path has similar hydraulic resistance.
- Control entry effects: The first few tubes after the inlet are often the most sensitive to inlet jetting. A diffuser or properly designed inlet section reduces that effect.
- Plan for maintenance-induced changes: Tube plugging changes the effective flow paths. Designing with some tolerance helps prevent severe maldistribution after cleaning.
Mind Map: Tube Banks, Passes, and Distribution
Example: Comparing Two Pass Options
Assume a boiler section where the tube-side fluid must absorb a fixed heat duty. Option A uses a single pass across the tube bank. Option B uses two passes with a return, splitting the flow so each pass sees roughly half the total cross-flow area.
- In Option A, the fluid velocity in each tube is often higher because all flow goes through one routing, which can improve convection. However, header maldistribution can be more visible because there is only one opportunity for balancing.
- In Option B, the routing changes twice, so the designer can use the return and header geometry to equalize pressure. The velocity per pass may be lower, which can reduce convection, but the temperature profile can become more uniform across the bank.
If you observe that Option A shows a wider spread in outlet temperatures across parallel tube groups, while Option B shows tighter uniformity, that’s consistent with improved hydraulic balancing from the additional routing structure.
Example: Spotting Maldistribution During Operation
Suppose a boiler runs at steady firing rate. You measure outlet temperatures from two tube groups fed by different header branches. If one branch is consistently hotter by several degrees while the overall pressure drop across the bank remains similar, the likely cause is distribution imbalance rather than global fouling. The next checks are inlet header geometry, any partially blocked restrictors, and whether the inlet flow is jetting into one side.
If the hotter branch also shows a higher local pressure drop, that points to increased resistance in that branch, such as partial plugging or scaling. If the hotter branch shows lower pressure drop, it suggests the flow is being preferentially routed there, often due to header losses that are not equalized.
Summary of the Logic Chain
Tube bank geometry sets the heat transfer and gas-side pressure drop. Pass arrangements shape how the tube-side fluid experiences that geometry and how sensitive the system is to hydraulic imbalance. Flow distribution then decides whether the intended design assumptions—equal resistance and predictable temperature rise—actually show up in the operating data.
5.3 Fouling, Scaling, and Deposits: Causes and Mitigation
Fouling, scaling, and deposits are the “uninvited guests” that reduce heat transfer and increase pressure drop in boiler heat-transfer paths. They share a common effect—less efficient steam generation—but they differ in what they’re made of and how they form. Fouling is often loosely attached and can be soot-like or sludge-like. Scaling is usually hard and mineral-based, forming when dissolved species precipitate. Deposits is a broad term for material that accumulates on surfaces, including corrosion products and carryover.
Core Mechanisms and Where They Show Up
Heat-transfer surfaces experience three main pathways for unwanted buildup:
- Precipitation and crystallization: When water chemistry changes due to heating, dissolved salts can exceed solubility limits and form scale. This is common on economizer tubes, boiler waterwalls, and steam drum internals.
- Transport and impaction: Particles in the water or flue gas can carry and stick to surfaces. Water-side carryover can deposit salts and corrosion products. Fire-side soot forms when combustion produces incomplete burnout products.
- Chemical reaction and corrosion product deposition: Corrosion can generate iron oxides and other products that later deposit, especially where flow is slow or where chemistry is unstable.
A practical way to remember it: if the problem follows temperature rise, think scaling; if it follows particle transport, think fouling; if it follows chemistry instability, think deposits from corrosion and carryover.
Common Causes Linked to Operating Conditions
Water-side scaling is driven by concentration effects. As water boils, salts concentrate in the remaining liquid film near the surface. If alkalinity, hardness, or silica are not controlled, scale can form even when bulk water looks acceptable. A classic example is calcium carbonate scale: it tends to form where heat flux is high and where local pH and concentration rise.
Silica deposition behaves differently. Silica is more soluble than many salts, so it can travel with steam and then deposit as it concentrates and polymerizes. You’ll often see it where steam quality is poor or where carryover bypasses drum separation.
Soot and combustion-related fouling come from the fire side. Poor air-fuel mixing, low excess air, or unstable combustion can increase soot loading. Even when combustion is “good enough,” soot can still accumulate if sootblowing intervals and effectiveness are mismatched to fuel type.
Corrosion product deposition is tied to oxygen control, pH management, and flow conditions. If deaeration is weak or oxygen ingress occurs, corrosion accelerates and produces more material that can later settle.
Mitigation Strategy That Actually Fits the Problem
Mitigation works best when you match the method to the mechanism.
1. Control water chemistry to prevent precipitation
- Maintain alkalinity and phosphate programs appropriate to the boiler design and operating pressure.
- Use softening and deaeration to reduce hardness and oxygen before water enters the boiler.
- Monitor silica and hardness trends, not just single readings. A stable program prevents “surprise” scale.
Example: If a plant sees rising conductivity in boiler water samples after load increases, the likely cause is concentration drift. Tightening blowdown control and verifying sampling technique can reduce the local concentration that drives scale formation.
2. Prevent carryover and improve steam quality
- Ensure drum internals are intact and blowdown is correctly configured.
- Keep steam traps and condensate return systems functioning so condensate quality stays consistent.
Example: If drum level control is sluggish, water can surge, increasing carryover. Correcting level control tuning and checking separator performance often reduces deposit formation on downstream piping.
3. Manage blowdown to remove concentrated impurities
Blowdown is not just “waste water”; it’s a controlled tool. Too little blowdown allows concentration to rise. Too much can waste treated water and destabilize drum operation.
Example: A boiler that cycles frequently may need a blowdown strategy that accounts for transient concentration. Operators can compare blowdown frequency against load profile and adjust to keep chemistry within targets.
4. Keep the fire side clean to protect heat transfer
- Use sootblowing based on measured performance indicators such as stack temperature trends and draft stability.
- Verify burner tuning so combustion produces less soot.
Example: After switching from one fuel grade to another, stack temperature may rise and efficiency may drop. Increasing sootblowing frequency temporarily while re-tuning combustion can restore heat transfer without over-cleaning.
5. Use cleaning methods when prevention isn’t enough
When deposits are already present, mitigation becomes removal:
- Water-side cleaning may involve chemical cleaning under controlled procedures.
- Mechanical cleaning and tube brushing are used selectively.
- Fire-side cleaning relies on sootblowing and, when needed, outage cleaning.
The key is to avoid “cleaning blindly.” If you don’t know whether the deposit is calcium carbonate, silica, iron oxide, or soot, you risk choosing an ineffective or damaging method.
Mind Map: Fouling, Scaling, and Deposits Mitigation
Quick Diagnostic Example for Operators
If a boiler’s efficiency drops while stack temperature rises, start with fire-side fouling. If efficiency drops with signs of higher drum blowdown demand and chemistry drift, suspect water-side scaling or carryover. If deposits appear in downstream steam lines, focus on steam quality and separator performance. This “symptom-to-location” approach keeps mitigation systematic instead of reactive.
5.4 Pressure Drop, Circulation Stability, and Steam Drum Performance
A steam drum is not just a container; it’s a control element that separates steam from water and helps the boiler stay stable when loads change. Stability depends on how pressure drops are distributed through the water/steam path and how circulation responds to those drops.
Pressure Drop Basics That Actually Matter
In a natural or forced circulation boiler, the fluid moves because of a pressure difference created by density changes and friction losses. Two contributors dominate:
- Static head from density differences: In risers, the mixture tends to be less dense as vapor forms, reducing the effective driving head. In downcomers, the fluid stays denser, preserving the driving head.
- Frictional losses: These scale with velocity squared and with how fouled or restricted the flow passages are.
A practical way to think about it: if friction losses rise faster than the driving head can compensate, circulation weakens. If circulation weakens, vapor formation can concentrate where it shouldn’t, which then changes local density and can further reduce driving head. That feedback loop is why pressure drop is treated as a stability variable, not just a design calculation.
Circulation Stability in Natural Circulation Boilers
Natural circulation relies on a balance between driving head and resisting pressure drops. The driving head comes from the difference in density between the downcomer and riser circuits. The resisting side includes friction in tubes, headers, and the steam-water path.
Stability improves when:
- Downcomers remain liquid-filled so their density stays high.
- Risers have predictable two-phase behavior so vapor distribution doesn’t swing wildly.
- Pressure drops are proportioned so small changes in vapor fraction don’t cause large changes in flow.
A simple example: imagine two riser banks feeding the same drum. If one bank has slightly higher resistance due to partial blockage, it will carry less flow. Less flow means higher local vapor fraction for the same heat input, which increases slip and can worsen separation quality. The drum then sees more wet steam from that bank, and the boiler’s control margins shrink.
Circulation Stability in Forced Circulation Boilers
Forced circulation uses pumps to provide flow, so the system is less sensitive to density-driven driving head. However, stability still depends on pressure drop because pumps operate against a system curve.
If heat input increases, vapor formation raises two-phase friction and can change effective flow resistance. The pump may deliver less flow than expected if the system curve steepens. That can lead to higher tube metal temperatures because heat transfer degrades when flow drops.
A concrete example: a boiler at constant firing rate increases load by raising burner output. If the economizer and headers are scaling, the added resistance reduces circulation. The steam drum may still show normal pressure, but the tube-side margin is reduced because the limiting condition is often local heat flux versus heat transfer capability.
Steam Drum Performance and Separation Quality
The drum’s job is to separate steam from water and to provide a stable water level for the downcomers. Three performance aspects connect directly to pressure drop and circulation.
- Steam-water separation efficiency: Internals like cyclones and separators reduce entrainment. If circulation changes vapor carryover, separation must handle the new entrainment load.
- Water level stability: Level fluctuations can expose downcomers to two-phase flow, which changes density and can destabilize circulation.
- Blowdown and concentration control: Blowdown removes dissolved solids. If blowdown is too low, foaming and carryover increase. If too high, water level and energy balance shift.
A useful mental model: the drum is a “buffer.” When circulation and vapor generation shift, the drum absorbs short-term imbalance by storing water and by throttling separation through its internal flow paths. If the drum is undersized or internals are degraded, the buffer capacity shrinks and instability shows up sooner.
Mind Map: Pressure Drop, Circulation, and Drum Behavior
Example: Diagnosing a Stability Problem Without Guesswork
Suppose a boiler shows increasing drum level oscillation during load increases. The firing rate rises, drum pressure stays steady, and steam quality reports worsen.
A systematic check sequence:
- Assess circulation resistance: Look for evidence of increased friction in headers or tube banks, such as rising differential pressure across sections or recent maintenance gaps that could allow partial blockage.
- Check separation load: If entrainment increases, separation internals may be overwhelmed by altered vapor distribution, often caused by uneven flow.
- Verify downcomer conditions: If level oscillation exposes downcomers to two-phase flow, the density in the circulation loop changes, which can amplify the oscillation.
- Review blowdown behavior: Excess dissolved solids can increase foaming, which makes level control harder and increases carryover.
The key is that each symptom maps to a mechanism: pressure drop changes flow and vapor distribution; vapor distribution changes entrainment; entrainment and level disturbances feed back into circulation.
Practical Design and Operating Practices
- Keep flow paths balanced by controlling tube cleanliness and ensuring header geometry doesn’t create hidden resistance differences.
- Protect downcomers from two-phase exposure by maintaining stable drum level and ensuring controls respond within the drum’s buffering capability.
- Treat blowdown as a stability tool by preventing foaming and carryover that degrade separation and distort level behavior.
- Use differential pressure trends across major sections to catch restriction before it becomes a circulation problem.
When pressure drop, circulation, and drum separation are treated as one coupled system, stability becomes measurable and controllable rather than mysterious.
5.5 Practical Example: Estimating Heat Duty and Surface Requirements
A practical heat-duty estimate starts with a clear boundary: what enters the boiler, what leaves, and what you want to produce. In this example, the goal is to size the heating surface for a natural-circulation water-tube boiler producing saturated steam.
Step 1: Define the Heat Duty from First Principles
Assume the boiler must generate 20,000 kg/h of saturated steam at 10 bar(g). Feedwater enters at 90°C and is pumped to the boiler. For a first-pass estimate, treat pump work as small compared with boiler heat transfer.
Key property inputs (use your steam tables):
- Saturated steam enthalpy at 10 bar(g), \(h_g\) ≈ 2778 kJ/kg
- Saturated liquid enthalpy at 10 bar(g), \(h_f\) ≈ 1008 kJ/kg
- Feedwater enthalpy at 90°C, \(h_{fw}\) ≈ 376 kJ/kg
Heat duty is the enthalpy rise times mass flow:
- ṁ = 20,000 kg/h = 5.556 kg/s
- Q̇ = ṁ \((h_g − h_{fw})\)
- Q̇ ≈ 5.556 × (2778 − 376) kJ/s
- Q̇ ≈ 5.556 × 2402 kJ/s ≈ 13,350 kW
So the boiler must transfer about 13.35 MW of net heat to the water/steam side.
Step 2: Split the Duty Into Economizer, Evaporator, and Superheater Sections
Even if you only need saturated steam, many boilers still have an economizer section that warms feedwater to near saturation. A simple split helps you avoid mixing temperature-driving forces.
Assume:
- Economizer raises feedwater from 90°C to 180°C (near the saturation temperature at the economizer outlet)
- Evaporator converts liquid to saturated vapor at 10 bar(g)
Approximate duty split:
- Economizer duty: Q̇_ec ≈ ṁ \((h_{180C} − h_{90C})\)
- Evaporator duty: Q̇_ev ≈ ṁ \((h_g − h_f)\)
Using typical liquid enthalpies (from water tables), \(h_{180C}\) ≈ 763 kJ/kg and \(h_{90C}\) ≈ 376 kJ/kg:
- Q̇_ec ≈ 5.556 × (763 − 376) ≈ 2,150 kW
- Q̇_ev ≈ 5.556 × (2778 − 1008) ≈ 10,000 kW
Check: 2,150 + 10,000 ≈ 12,150 kW. The remaining difference to 13,350 kW is accounted for by more accurate property values, heat losses, and the fact that the economizer outlet may not be exactly at the assumed temperature. For sizing, you can include a margin factor, such as 1.05, to cover unmodeled losses.
Step 3: Choose a Temperature Driving Force Model
Heat transfer in boilers is not one uniform temperature difference. A common engineering approach is to use an overall heat transfer coefficient U and a log-mean temperature difference (LMTD) for each section.
For a section:
- Q̇ = U A ΔT_lm
- ΔT_lm = (ΔT1 − ΔT2) / ln(ΔT1/ΔT2)
For evaporating sections, the steam-side temperature is nearly constant at saturation, so the driving force is mainly the difference between flue gas temperature and saturation temperature.
Step 4: Estimate Flue Gas Temperatures at Section Boundaries
You need an assumed flue gas temperature profile. Start with a reasonable stack temperature target and work backward.
Example assumptions:
- Flue gas enters economizer at 320°C
- Flue gas leaves economizer at 210°C
- Flue gas leaves evaporator at 140°C
- Saturation temperature at 10 bar(g) is about 179°C
Compute driving forces for each section:
- Economizer: ΔT1 = 320 − 90 = 230°C, ΔT2 = 210 − 180 = 30°C (feedwater rises, so the second difference is smaller)
- Evaporator: ΔT1 = 210 − 179 = 31°C, ΔT2 = 140 − 179 = −39°C is not physically acceptable, meaning the assumed boundary temperatures are inconsistent for a single-pass evaporator model. In practice, the flue gas cannot cool below the saturation temperature in that section without additional heat transfer arrangements or different boundaries.
Fix by adjusting the evaporator outlet temperature assumption to stay above saturation, for example:
- Let evaporator outlet flue gas temperature be 185°C
- Then evaporator driving forces: ΔT1 = 210 − 179 = 31°C, ΔT2 = 185 − 179 = 6°C
Now the evaporator has a positive driving force across the section.
Step 5: Compute Required Area Using Overall U Values
Overall U depends on heat transfer coefficients, fouling, and geometry. For a first-pass sizing, use conservative typical values and refine later with vendor data or detailed calculations.
Assume:
- Economizer overall U ≈ 600 W/m²·K
- Evaporator overall U ≈ 900 W/m²·K
Convert kW to W and compute LMTD (in K, numerically same as °C differences):
- Economizer ΔT_lm ≈ (230 − 30)/ln(230/30) ≈ 200/ln(7.67) ≈ 200/2.04 ≈ 98 K
- Evaporator ΔT_lm ≈ (31 − 6)/ln(31/6) ≈ 25/ln(5.17) ≈ 25/1.64 ≈ 15.2 K
Areas:
- A_ec = Q̇_ec / (U ΔT_lm) ≈ 2,150,000 / (600 × 98) ≈ 36.6 m²
- A_ev = Q̇_ev / (U ΔT_lm) ≈ 10,000,000 / (900 × 15.2) ≈ 73.1 m²
Total required heating surface in this simplified split is about 110 m², before applying any fouling allowance or design margin.
Mind Map: Heat Duty to Surface Requirements Workflow
Step 6: Consistency Checks That Prevent Common Mistakes
-
Driving force sign errors: If your assumed flue gas outlet temperature drops below saturation in the evaporator, your LMTD becomes negative or undefined. That’s a boundary-condition problem, not a math problem.
-
Duty split mismatch: If economizer duty plus evaporator duty is far from the total enthalpy rise, revisit property values and section outlet temperatures.
-
U values and fouling: If you ignore fouling, you may get a surface area that works only on a clean day. A fouling factor effectively reduces U, increasing required A.
Final Result for This Example
With the stated assumptions, the boiler needs roughly 110 m² of combined heating surface (economizer plus evaporator) for about 20,000 kg/h of saturated steam at 10 bar(g). A real design would refine U, boundary temperatures, and include fouling and losses, but the workflow above keeps the estimate grounded in measurable quantities and physically consistent temperature differences.
6. Steam Distribution, Pressure Control, and Condensate Return
6.1 Steam Piping Design Basics: Sizing, Velocity, and Pressure Loss
Steam piping design is mostly about three things: getting the right mass flow to the right place, keeping velocities in a range that avoids water damage and excessive noise, and predicting pressure losses so controls can do their job. If you size by guesswork, you’ll usually see it later as wet steam, unstable pressure, or valves that never quite behave.
Foundational Inputs for Sizing
Start with the steam duty at each takeoff: required mass flow rate, steam condition (saturated or superheated), allowable pressure at the equipment inlet, and the minimum and maximum operating loads. Then decide whether the line is a main header, branch, or short equipment connection. Main headers tolerate more variation; short branches must be stable because traps and control valves are unforgiving.
A practical rule: size for the worst-case flow condition that drives velocity and pressure drop, while checking that at low load you still avoid condensation accumulation.
Velocity Targets and Why They Matter
Velocity affects both erosion risk and how much condensate the steam can carry. Too low, and condensate tends to settle and pool; too high, and droplets can accelerate tube and valve wear.
Use these design intents as starting points:
- Dry steam mains and branches: aim for moderate velocities that limit erosion and noise.
- Lines near pressure reducing valves or control valves: treat them as “condensation-sensitive” because pressure changes can trigger flashing.
- Condensate-carrying steam: if the system is known to be wet, you must be more conservative and ensure proper drainage and trap placement.
Concrete example: Suppose a plant has a 10 bar(g) steam header feeding multiple users. During a partial load, the steam demand drops, but the header still carries steam through long runs. If the header velocity becomes very low, condensate formed by heat loss can collect in low points. When demand rises again, that condensate can surge into equipment, causing wet steam and trap flooding.
Sizing by Mass Flow and Cross-Section
For a given steam condition, mass flow relates to pipe internal area and velocity. The core workflow is:
- Determine design mass flow rate for the segment.
- Choose a target velocity band based on service and steam quality risk.
- Compute required internal diameter.
- Select a standard pipe size and verify actual velocity.
Pressure loss then becomes a check, not an afterthought.
Pressure Loss Fundamentals
Pressure losses in steam piping come from:
- Frictional loss along straight runs (depends on velocity, roughness, and hydraulic diameter).
- Local losses at fittings, valves, bends, reducers, and expansions.
- Elevation effects (usually small for steam mains but important where condensate drainage and flashing occur).
A useful mental model: friction loss scales strongly with velocity, while local losses scale with the number and severity of flow disturbances. That’s why two lines with the same length can behave differently if one has more elbows, strainers, or control hardware.
Stepwise Pressure Loss Calculation Workflow
A systematic approach prevents “mystery pressure drop”:
- Segment the line into straight runs and fitting groups.
- Assign steam properties for the operating condition used for sizing.
- Calculate friction loss for each straight segment.
- Calculate local loss using equivalent length or loss coefficients.
- Sum losses and compare to the allowable pressure budget between source and equipment inlet.
- Check control valve authority so the valve can overcome piping losses at the operating points.
Worked Example for Pressure Loss Budgeting
Assume a branch line from a header to a process skid must deliver steam at a minimum pressure. You allocate a pressure budget of 0.6 bar for piping losses, leaving the rest for equipment inlet requirements and control margins.
- If your calculated friction loss at design flow is 0.35 bar and local losses (valves, elbows, reducer) add 0.20 bar, the total is 0.55 bar, leaving 0.05 bar margin.
- If you later discover the line has an extra set of fittings or a partially blocked strainer, that margin can disappear quickly, and the control valve may run near its limit.
This is why pressure budgets should be treated like engineering constraints, not suggestions.
Drainage, Traps, and the Velocity-Pressure Link
Velocity and pressure loss are connected through how condensate behaves. Heat loss creates condensate; pressure drop and flashing can change how much condensate forms and where it accumulates. Proper drainage and trap sizing reduce the risk that condensate rides along and causes erosion.
A simple best practice: ensure steam lines slope toward drain points, and place traps where condensate will collect rather than where it happens to be convenient.
Mind Map: Steam Piping Design Basics
Common Design Pitfalls to Avoid
- Sizing only for full load: low-load operation can create condensation accumulation.
- Ignoring local losses: a few valves and elbows can consume the pressure budget.
- No margin for real-world conditions: strainers clog, traps age, and fittings get replaced with slightly different internal geometry.
- Assuming “it will drain itself”: steam lines need intentional drainage paths.
Quick Design Checklist
- Confirm mass flow and steam condition for the segment.
- Select velocity targets appropriate to steam quality risk.
- Size pipe using internal diameter and verify velocity.
- Build a pressure loss budget including local losses.
- Ensure drainage slope and trap placement match condensate formation.
- Leave a small margin so maintenance realities do not break control performance.
6.2 Steam Traps, Condensate Handling, and Flash Steam Management
Steam traps are the quiet workhorses of a steam system: they let condensate out, keep steam where it belongs, and do it reliably across changing loads. Good condensate handling also reduces corrosion risk, improves boiler efficiency, and prevents “mystery losses” that show up as missing water and rising fuel use.
Core Job of a Steam Trap
A steam trap must separate phases without wasting steam. In practice, it faces three realities: condensate temperature varies with load, non-condensable gases accumulate, and system pressure changes as valves cycle. The trap’s job is therefore not just “drain water,” but “drain the right fluid at the right time.”
Condensate Behavior and Why It Matters
When steam transfers heat, it condenses into water. That condensate collects in low points, heat exchanger bottoms, and steam mains near drops. If it stays, it blocks heat transfer surfaces, causes water hammer, and can push steam traps to fail early. If it is removed promptly, the heat exchanger stays dry on the steam side and the trap can operate within its designed temperature and pressure range.
Trap Types and When Each Fits
Different trap mechanisms handle different operating conditions.
- Thermostatic traps respond to temperature difference between steam and condensate. They work well when condensate subcooling is predictable.
- Thermodynamic traps use pressure and flashing behavior to cycle quickly, often suiting high-load, intermittent conditions.
- Mechanical traps use float or bimetal action to open and close based on condensate level or temperature.
A practical rule: choose the trap based on the expected condensate temperature, modulating load pattern, and the presence of air or other non-condensables.
Mind Map: Steam Traps and Condensate Flow
Installation Practices That Prevent Most Problems
Even a good trap can underperform if installed poorly.
- Use a strainer upstream to protect the trap from scale and debris. A clogged strainer can mimic “trap failure” by starving flow.
- Maintain correct orientation so the sensing element sees the intended fluid. A trap installed upside down can behave like it’s always “full.”
- Slope the condensate line so condensate flows to the trap and does not pool upstream. Pooling increases water hammer risk and can cause erratic cycling.
- Provide a vent at start-up when air is present. Non-condensables can delay condensation and keep thermostatic traps from reaching their intended operating point.
Flash Steam Management: The Condensate Isn’t Done Yet
When condensate is discharged from a higher-pressure system to a lower-pressure return line, part of it can flash into steam. This flash steam carries energy and can also create problems if it enters equipment that expects liquid.
Key idea: flash steam formation depends on the pressure drop and condensate temperature. If the condensate is near saturation at the discharge pressure, flashing is more likely.
Practical Example: Traps on a Process Heater
Imagine a process heater supplied at 6 bar(g). Condensate leaves the heater at a temperature close to saturation for that pressure. If the trap discharges directly into a return header at 1 bar(g), the pressure drop can cause flashing.
What you’ll see if flash steam is not managed:
- The return header pressure rises.
- Condensate lines “gurgle,” and traps downstream may cycle more than expected.
- Some traps may appear to leak steam because flash steam reaches them.
What to do:
- Route trap discharge to a flash tank or separator sized for the expected condensate flow and pressure conditions.
- Return separated condensate to the main return line, while venting or routing flash steam appropriately so it does not interfere with liquid-only sections.
Mind Map: Flash Steam Handling
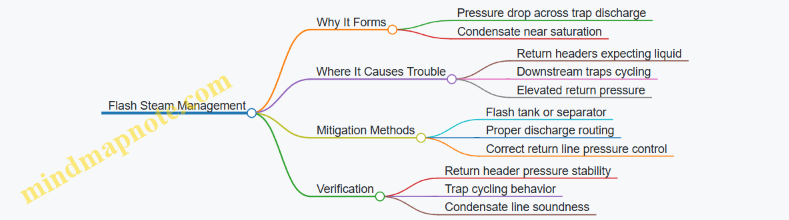
Advanced Details Without the Headaches
- Non-condensables: Air and other gases reduce heat transfer and can cause traps to open longer than expected. A venting strategy during start-up and correct vent placement help traps operate on condensate, not trapped gases.
- Thermal shock and cycling: Rapid load swings can cause condensate temperature to lag behind steam temperature. Selecting a trap that tolerates cycling and ensuring adequate steam line drainage reduces hammer and premature wear.
- Discharge pressure compatibility: A trap can be “working” while still wasting energy if its discharge routing forces excessive flashing. Matching discharge conditions to return system pressure is part of trap success.
Quick Checklist for Operators
- Trap has a strainer upstream and correct orientation.
- Condensate lines are pitched and drain to the trap.
- Start-up includes venting where non-condensables are expected.
- Trap discharge is routed to manage flash steam, not just to “get rid of water.”
- Return header pressure is stable and trap cycling is consistent with load.
6.3 Pressure Reducing Stations and Control Valve Selection
A pressure reducing station (PRS) takes steam at a higher pressure and delivers it at a lower, steadier pressure to a process header. The core idea is simple: the station converts pressure energy into throttling losses while maintaining downstream pressure despite changing demand. In practice, the details matter because steam is compressible, valves can chatter, and condensate can turn a “control problem” into a “water hammer problem.”
Foundational Concepts for PRS Design
Start with the station’s job statement: maintain downstream setpoint pressure at the PRS outlet. That means you need (1) a control valve sized for the expected flow range, (2) a control strategy that reacts quickly but not violently, and (3) steam quality management so the valve sees mostly dry steam.
A PRS typically includes a pressure control valve, a pressure transmitter, strainer(s), isolation valves, and often a bypass or relief arrangement. The control valve throttles steam; the pressure transmitter measures outlet pressure; the controller adjusts valve position. If the station also includes a desuperheating or steam quality conditioning step, it’s usually because the valve and downstream equipment are sensitive to wet steam.
Control Valve Selection Logic
Valve selection begins with the required flow capacity at the lowest expected upstream pressure and the highest expected downstream demand. Use the valve’s flow coefficient (Cv) or the manufacturer’s sizing method, but always sanity-check the result against actual steam conditions: pressure, temperature, and whether the steam is saturated or superheated.
Next, choose valve type. Globe valves are common for throttling because they offer good controllability and predictable trim behavior. Balanced trims can reduce the effect of pressure forces on the actuator, improving stability. For very wide turndown ratios, consider trims designed for part-load control rather than relying on “bigger is better.”
Then address the control range. A valve that is too large for normal operation will sit near closed for most of the time, which increases deadband and hunting. A valve that is too small will run near wide open, leaving no authority to correct disturbances. A practical target is to have the valve operate in a mid-stroke region during typical load, not only at extremes.
Finally, consider steam quality and noise. Wet steam can erode trims and cause erratic control. A strainer upstream helps with particulate damage, but it does not fix moisture. If condensate is present, install proper steam line drainage and ensure the PRS inlet piping avoids collecting water.
Pressure Control Stability and Sizing Details
The pressure control loop must overcome two “stiffness” effects: the downstream header’s ability to absorb flow changes and the valve’s flow characteristic. If the header volume is small and demand changes quickly, the loop needs a valve with suitable rangeability and a controller that avoids aggressive moves. If the valve has poor rangeability, you’ll see oscillations even with a well-tuned controller.
A useful mental model is to compare pressure drop across the valve to pressure drop in the rest of the system. If the rest of the system dominates the pressure drop, the valve has less authority and control becomes sluggish. If the valve dominates, control authority improves, but throttling losses rise. Balanced design aims for stable control without excessive energy waste.
Example: Selecting a PRS Control Valve for a Process Header
A plant supplies steam to a process header at 4.0 bar(g) from a main at 10 bar(g). The maximum required flow is 2,000 kg/h, typical flow is 1,200 kg/h, and minimum upstream pressure during peak demand is 9 bar(g). The steam is saturated at the main pressure and will be saturated at the outlet after throttling.
- Determine sizing conditions: use the minimum upstream pressure (9 bar(g)) and the target outlet pressure (4.0 bar(g)) to compute the available pressure ratio for flow.
- Size the valve for maximum flow: calculate required Cv (or use manufacturer sizing) for 2,000 kg/h at the throttling conditions.
- Check turndown: verify that at 1,200 kg/h the valve will land around mid-stroke with the chosen trim and actuator range.
- Confirm steam quality handling: ensure upstream drainage and a strainer are included so the valve trim is not exposed to condensate slugs.
If the valve lands below 10% open at typical load, you likely oversize the valve. In that case, select a smaller valve, a different trim with better rangeability, or a staged arrangement.
Mind Map: Pressure Reducing Stations and Control Valve Selection
Practical Checklist for Commissioning
During commissioning, verify that the PRS outlet pressure tracks setpoint across load changes without oscillation. Confirm that the valve position changes smoothly and that the controller output does not saturate at typical demand. Inspect the strainer differential pressure and confirm that upstream drainage prevents condensate from reaching the valve. If control is unstable, first check steam quality and piping drainage, then revisit valve sizing and trim rangeability before spending time on controller tuning.
6.4 Steam Quality Management in Distribution Networks
Steam quality is what you get after the boiler has done its job and the piping network has done its best to undo it. In distribution systems, the main enemy is moisture: liquid water carried with steam. Moisture reduces heat transfer effectiveness, accelerates corrosion, and can damage turbine blades and control valves. The goal of steam quality management is simple: keep steam dry enough at the point of use, and keep water where it belongs.
Foundational Concepts of Steam Quality
Steam quality is commonly expressed as dryness fraction, x, where x = 1 means fully dry steam and x < 1 indicates some liquid water is present. In practice, you manage quality indirectly by controlling conditions that create or transport droplets.
Two mechanisms dominate in distribution networks:
- Condensation during pressure and temperature changes. As steam expands through pressure reducing valves or throttling, its saturation temperature drops. If the steam temperature falls below saturation locally, condensation forms.
- Water entrainment from low points and condensate pockets. Condensate collects where gravity and geometry allow it. If steam velocity is high enough, it can pick up droplets and carry them downstream.
A useful operating mindset is to treat the network as a set of “water management zones.” Each zone has a likely source of moisture and a likely place where water should be removed.
Where Moisture Forms and How It Moves
Moisture formation is most likely at:
- Pressure reducing stations where throttling or imperfect control causes local flashing and condensation.
- Long runs with temperature losses to ambient air, insulation gaps, or uninsulated supports.
- Vertical drops and low points where condensate accumulates.
Moisture transport depends on steam velocity and piping layout. Higher velocity increases entrainment risk, while poor drainage increases the amount of available liquid to be picked up.
Core Practices for Dry Steam Delivery
1. Maintain proper insulation and support integrity. Insulation reduces heat loss so steam stays closer to saturation conditions. Even small insulation defects can create localized condensation, especially in cold seasons.
2. Design for drainage and steam velocity control. Piping should slope to drain condensate toward traps or low-point drains. Where velocity is too high, droplets are more easily entrained; where it is too low, condensate may stagnate.
3. Use steam separators and dryers where appropriate. In many networks, a separator at the boiler outlet or at a major distribution node reduces droplet carryover before the steam enters long piping runs.
4. Install and size steam traps correctly. Traps remove condensate without letting steam escape. Undersized or failed traps lead to condensate accumulation, which then becomes entrainment fuel.
5. Manage pressure control sequences. Pressure reducing valves should be selected and tuned to avoid hunting and excessive throttling. Stable pressure reduces repeated condensation cycles.
6. Prevent water hammer and thermal shock. Sudden condensate slug movement can create transient wet steam and mechanical stress. Proper start-up warm-up and controlled venting reduce these events.
Monitoring and Verification
Quality management is not just design; it is verification.
Common indicators include:
- Trap performance trends such as continuous discharge, intermittent behavior, or temperature differences across trap bodies.
- Condensate return stability including unexpected condensate volume spikes after load changes.
- At-point-of-use symptoms like wet steam at control valves, unstable valve position, or abnormal noise.
When direct measurement is available, dryness fraction or moisture content can be assessed using appropriate steam quality instruments. If instrumentation is not installed, you can still build a quality picture from trap behavior, insulation condition, and operating transients.
Mind Map: Steam Quality Management in Distribution Networks
Example: Pressure Reducing Station Wetness
A plant reduces boiler pressure to a process header using a pressure reducing valve (PRV). After a production shift change, operators notice unstable control valve behavior and higher condensate return flow.
A systematic check finds three contributing factors:
- The PRV control loop hunts during load transitions, causing repeated throttling and local condensation.
- A nearby low point lacks adequate drainage, so condensate accumulates and becomes entrainment material.
- One section of insulation is missing on a vertical drop, increasing heat loss and lowering steam temperature toward saturation.
Corrective actions are coordinated rather than isolated:
- Retune the PRV control loop to reduce hunting.
- Add or repair drainage and confirm trap operation at the low point.
- Restore insulation and verify support condition.
After changes, trap discharge becomes intermittent rather than continuous, condensate return stabilizes, and the process control valve operates smoothly.
Example: Trap Failure and Downstream Symptoms
In another network, a failed steam trap at a branch line causes condensate to collect. Downstream, a control valve begins to chatter and the line shows intermittent wetness.
The reasoning is straightforward: condensate accumulation increases the probability of entrainment when steam velocity rises. Fixing the trap restores drainage, which reduces liquid availability and improves steam dryness without changing boiler output.
Practical Checklist for Dry Steam at the Point of Use
- Confirm insulation coverage on all steam-carrying segments.
- Verify piping slope and that low points drain to traps.
- Check trap health using discharge and temperature behavior.
- Ensure PRV stations maintain stable pressure during load changes.
- Use separators/dryers at nodes where droplet carryover is likely.
- Observe at-point-of-use control valve behavior and condensate return trends.
Steam quality management is therefore a chain: design choices create the conditions, traps and controls remove water, and monitoring confirms the chain is intact. When one link fails, the symptoms usually show up somewhere you can measure or observe—often before equipment damage becomes expensive.
6.5 Practical Example: Balancing Loads and Sizing Condensate Return Lines
A condensate return system has two jobs: (1) move condensate back to the boiler feedwater train and (2) keep steam losses and water hammer under control. The tricky part is that condensate flow is rarely steady; it follows equipment load, trap performance, and flash steam formation. This example walks through a practical sizing workflow that starts with load balancing and ends with line sizing.
Step 1: Define the Steam Loads and Condensate Sources
Assume a plant has three steam users connected to a common return header:
- Process A: 10,000 kg/h steam at peak, 60% condensate return (rest is vented to atmosphere or used in a way that doesn’t return).
- Process B: 6,000 kg/h steam at peak, 90% condensate return.
- Space heating coils: 2,000 kg/h steam at peak, 70% condensate return.
For a first-pass design, compute peak condensate mass flow:
- A: 10,000 × 0.60 = 6,000 kg/h
- B: 6,000 × 0.90 = 5,400 kg/h
- Coils: 2,000 × 0.70 = 1,400 kg/h
Total condensate to return at peak: 6,000 + 5,400 + 1,400 = 12,800 kg/h.
Now account for flash steam. If condensate drops in pressure across traps or control valves, some fraction flashes and must be handled by the return piping. A simple design assumption is to add 5–10% to the condensate flow rate for flash allowance; use 8% here.
Design flow for piping: 12,800 × 1.08 = 13,824 kg/h.
Step 2: Convert Mass Flow to Volumetric Flow
For sizing, you need volumetric flow. Use an approximate condensate density near return temperature. Suppose return temperature is 90°C (typical after deaerator/heat recovery mixing), density ≈ 965 kg/m³.
Volumetric flow: 13,824 kg/h ÷ 965 kg/m³ = 14.33 m³/h.
Convert to m³/s: 14.33 ÷ 3600 = 0.00398 m³/s.
Step 3: Choose a Velocity Target to Avoid Problems
Condensate lines should be fast enough to prevent liquid accumulation and slow enough to avoid excessive pressure drop and trap backpressure. A common practical target for gravity-assisted or pumped condensate is around 1–2 m/s in the liquid phase. If you expect intermittent flow, lean toward the upper end.
Pick 1.6 m/s as a balanced design velocity.
Required internal area: A = Q / v = 0.00398 / 1.6 = 0.00249 m².
Equivalent internal diameter: D = √(4A/π) = √(4×0.00249/π) ≈ 0.056 m.
So the line needs about 56 mm internal diameter. Select the nearest standard pipe size with appropriate schedule; for example, a 2-inch nominal line often provides enough internal diameter depending on schedule. The exact choice depends on pressure class and allowable pressure drop.
Step 4: Balance Loads Using a Header Strategy
If all traps discharge into one header, the header must handle the worst-case combination. A more stable approach is to group by pressure level and by equipment type:
- Group 1: high-pressure process condensate to a high-pressure return header.
- Group 2: low-pressure condensate to a low-pressure return header.
- Combine only after pressure equalization and flash handling.
This reduces the chance that a low-pressure discharge will backflow into a higher-pressure branch.
Step 5: Check Pressure Drop and Trap Backpressure
Sizing by velocity alone can still fail if pressure drop is too high. High pressure drop increases trap discharge pressure, which can reduce trap capacity and cause condensate backup.
Use a quick check:
- Estimate friction loss using the selected pipe diameter and expected flow.
- Add minor losses from fittings and bends.
- Ensure the resulting backpressure at the trap outlet is below the trap’s allowable differential.
If you don’t have trap curves, use a conservative operational rule: keep header pressure rise modest relative to the trap’s design differential. In practice, that often means verifying with the actual trap model and the steam pressure at each user.
Step 6: Mind the Flash Steam Venting and Segregation
When condensate flashes, the vapor must be vented or carried without flooding. A common best practice is to provide a vent path or a properly designed flash tank arrangement so the return line remains mostly liquid.
Mind Map: Condensate Return Line Sizing Logic
Worked Summary
- Peak condensate to return: 12,800 kg/h
- Add flash allowance (8%): 13,824 kg/h
- Volumetric flow at 90°C: 14.33 m³/h
- Target velocity: 1.6 m/s
- Required internal diameter: ~56 mm
- Select nearest standard pipe size and confirm pressure drop against trap backpressure limits.
This method keeps the system coherent: you start with where condensate comes from, include the reality of flashing, size for stable liquid flow, and then verify that the header won’t choke the traps.
7. Instrumentation, Controls, and Boiler Safety Systems
7.1 Boiler Control Loops: Feedwater, Steam Pressure, and Combustion Control
A boiler is a balancing act between three moving parts: how much heat you add (combustion), how much steam you make (boiler heat transfer), and how much water you supply (feedwater). Control loops keep those parts from drifting into the usual trouble zones: low water, wet steam, unstable firing, or inefficient combustion.
Core Control Objectives
Steam pressure control keeps the steam header near its setpoint. In practice, the controller adjusts fuel and air to change heat input, because steam generation responds to firing rate.
Feedwater control prevents level problems by matching water inflow to steam outflow and blowdown. It typically uses a level controller plus a feedforward signal from steam flow.
Combustion control stabilizes flame and optimizes oxygen/CO behavior. It uses burner management logic (safety) and a combustion trim loop (performance).
Signal Flow from Sensors to Actuators
Start with measurements:
- Steam pressure transmitter at the header or drum outlet.
- Drum level transmitter (often differential pressure) and sometimes steam flow measurement.
- Oxygen or flue gas analyzer and flame signal from the burner.
Then move to actuators:
- Feedwater control valve (and sometimes a control valve on condensate return).
- Fuel valve and air damper or fan speed.
- Burner management system actions for ignition, purge, and trip conditions.
A useful mental model is: pressure loop decides “how much heat we need,” feedwater loop decides “how much water we must supply,” and combustion loop decides “how to burn that heat cleanly.”
Mind Map: Boiler Control Loops
Steam Pressure Loop: What It Controls and Why It Works
The pressure controller compares measured pressure to a setpoint. Its output becomes a firing rate demand. Because steam generation lags fuel changes (heat transfer and water circulation take time), the controller must be tuned to avoid hunting.
Practical example: Suppose the steam header setpoint is 10.0 bar(g) and a process valve opens, increasing steam demand. Pressure drops slightly. The pressure controller increases firing demand, which raises heat input. As steam production catches up, pressure returns toward setpoint.
Best practice: Use a feedforward from steam demand when available. If you know steam flow is rising, you can increase firing before pressure falls. That reduces overshoot and keeps the control loop from reacting late.
Feedwater Loop: Level Control Without Water Drama
Drum level is sensitive because water and steam share the drum volume. A level controller adjusts the feedwater valve to keep level within limits.
Feedforward example: If steam flow increases by 20,000 kg/h, feedforward can immediately increase feedwater flow by roughly the same amount (minus expected blowdown and any condensate return differences). The level controller then trims for measurement error and transient effects.
Why blowdown matters: Blowdown removes water to control dissolved solids. If blowdown increases but feedwater stays the same, level will trend down. A well-integrated loop includes blowdown in the water balance so level doesn’t become a “surprise casualty.”
Combustion Control: Air-Fuel Coordination and Stability
Combustion control typically has two layers:
- Safety layer in the burner management system handles purge, ignition, flame proving, and trips.
- Performance layer trims air-fuel ratio using flue gas signals.
Oxygen trim example: If oxygen in the flue gas rises above target, combustion is likely too lean. The controller can reduce excess air by adjusting air damper or fan speed relative to fuel. If oxygen drops too low, CO risk increases, and the controller moves back toward safer excess air.
Coordination example: When firing rate increases, air must increase promptly to support stable combustion. If fuel rises faster than air, flame quality suffers. If air rises too fast, efficiency drops and flame can become unstable. Coordinated control keeps both in step.
Integrated Operation: How the Loops Interact
The loops must not fight each other. A common integration strategy is:
- Pressure loop sets a firing rate setpoint.
- Combustion loop tracks that setpoint while maintaining air-fuel ratio.
- Feedwater loop maintains drum level using level control plus feedforward from steam flow.
Simple scenario: Load increases.
- Steam demand rises → pressure tends to fall.
- Pressure loop increases firing demand.
- Combustion loop adjusts air and fuel for stable flame and target excess oxygen.
- Steam flow rises → feedforward increases feedwater.
- Level controller trims to keep drum level steady.
Practical Tuning and Commissioning Checks
During commissioning, verify that:
- Pressure controller output changes firing rate smoothly without oscillation.
- Feedwater valve response matches expected steam flow changes.
- Combustion trim does not override safety logic or cause rapid swings in air-fuel ratio.
A good rule of thumb is to tune one loop at a time with the others in stable modes, then confirm behavior under a controlled load step.
Safety Interlocks That Must Stay in Charge
Even the best control loops cannot replace safety functions. Low water cutoff, overpressure protection, and flame failure logic must act independently and quickly. Treat them as the “last word,” not as part of normal regulation.
When the system is integrated correctly, the loops behave like a coordinated team: pressure asks for heat, feedwater keeps the water where it belongs, and combustion ensures the heat is produced cleanly and reliably.
7.2 Instrumentation for Pressure, Temperature, Flow, and Level
A boiler’s instrumentation is the translation layer between physics and decisions. Pressure, temperature, flow, and level sensors do not just “measure”; they define what the control system believes is happening, which determines burner firing, feedwater delivery, blowdown timing, and safety trips.
Foundational Signals and What They Represent
Pressure sensors report the force per area at a point, but in steam systems that point matters. A pressure transmitter on the steam drum reflects drum pressure; a transmitter on a header reflects distribution-side pressure losses. Temperature sensors report local thermal state, which can lag during transients and can be biased by sensor placement and thermal contact.
Flow measurement is often the most misunderstood. A flow transmitter measures a variable that correlates with flow—differential pressure across an orifice, velocity in a turbine meter, or mass flow inferred from thermal effects. Level measurement is about where the liquid-vapor interface sits, but in boilers the interface moves and foaming can distort it.
Pressure Instrumentation
Common pressure instruments include gauge pressure transmitters, differential pressure transmitters, and pressure switches for safety. For boiler control, drum pressure and header pressure are typical inputs.
Best practice is to choose measurement locations that match the control objective. If the goal is stable steam pressure to a process, measure at the distribution point or use a control scheme that accounts for header losses. If the goal is drum control and safety, measure at the drum with appropriate impulse lines.
Impulse lines need slope and drainage so condensate does not collect and skew readings. A practical example: if a differential pressure transmitter measures steam flow and the impulse lines trap condensate, the transmitter can report a lower pressure difference, causing the controller to under-fire and gradually reduce steam output.
Temperature Instrumentation
Temperature transmitters are used for feedwater, economizer outlet, steam superheat, and flue gas where applicable. In steam systems, temperature is often used to infer heat transfer performance and steam quality indirectly.
Sensor placement is critical. A thermowell that is too short can be influenced by wall temperature rather than fluid temperature. A sensor installed in a stagnant pocket can read “steady” while the process is actually changing.
Example: during start-up, superheater outlet temperature may rise slower than expected if the sensor is located where steam is still mixing with moisture. The control system may then hold firing longer than necessary because it trusts a delayed temperature signal.
Flow Instrumentation
Flow measurement supports feedwater control, blowdown monitoring, and combustion tuning. Differential pressure (DP) meters are common for water and steam, but they require correct line sizing, straight-run piping, and proper pressure/temperature compensation.
For feedwater, a DP flow meter can be paired with a control valve to regulate mass flow. The controller assumes the meter’s calibration matches the fluid conditions. If the feedwater temperature changes significantly, density changes can shift the indicated mass flow unless the transmitter is configured for the correct fluid properties.
Example: if a feedwater DP meter is calibrated for 100°C water but operated at 140°C, the controller may command a valve position that appears correct by volumetric terms but results in insufficient mass flow, leading to rising drum level and potential carryover risk.
Level Instrumentation
Level is the heart of boiler safety and stability. Typical methods include differential pressure level transmitters, conductivity probes, and sight glass for local verification.
Differential pressure level measurement works by relating pressure difference between taps in the drum to the height of liquid. This method is sensitive to density assumptions and to how the taps are connected to the steam and liquid spaces.
Conductivity probes help detect low water conditions because they respond to the presence of water. They are not a substitute for accurate level control, but they are valuable for safety logic.
Example: if a differential pressure level transmitter’s impulse lines are not maintained and become partially blocked, the measured level can lag the true drum condition. The controller may then chase the error, overshoot, and increase cycling.
Signal Conditioning, Calibration, and Diagnostics
Instrumentation rarely fails “suddenly.” More often, it drifts, gets fouled, or loses calibration. Signal conditioning includes filtering, scaling, and linearization. Filtering should reduce noise without hiding real process changes.
Calibration discipline matters. Pressure transmitters should be checked against a known standard, and temperature sensors should be verified in a controlled manner. Flow meters require periodic verification because fouling and wear change the relationship between DP or velocity and actual flow.
Diagnostics prevent silent bad data. A good system flags out-of-range values, stuck signals, and implausible combinations. For instance, if feedwater flow is steady but drum level steadily rises, the system should suspect a mismatch such as a valve sticking, a meter issue, or a chemistry-related change in density.
Mind Map: Instrumentation for Pressure, Temperature, Flow, and Level
Integrated Example: From Sensors to Safe Control
Imagine a boiler running at steady load. Drum pressure is stable, but feedwater flow is slightly low due to a flow meter calibration offset. The drum level begins to rise slowly because the steam generation rate exceeds the delivered feedwater mass. The level controller increases valve opening, but if the level measurement is also biased by a partially blocked impulse line, the controller may not correct in time.
A robust instrumentation strategy prevents this from becoming a safety event. Cross-check logic compares trends: if feedwater flow appears low while level appears normal, the system flags a likely level measurement issue. If low-water safety thresholds are approached, conductivity probes and safety interlocks act regardless of the control loop’s interpretation.
The key idea is simple: each sensor type has strengths and failure modes, so the control system should use them in a way that makes common measurement errors visible rather than quietly effective.
7.3 Safety Interlocks: Low Water Cutoff, Overpressure, and Flame Failure
Steam boilers are pressure vessels with a heat source, so “safe” means two things: preventing unsafe conditions from forming, and stopping the heat source quickly when they do. Interlocks are the bridge between what operators can measure and what the boiler must never be allowed to do.
Low Water Cutoff
A low water cutoff (LWCO) protects the boiler from running with insufficient water to absorb heat. Without enough water, furnace heat can overheat tubes and drum internals, accelerating tube thinning and failure. LWCOs typically use float-based sensing, conductivity probes, or other level-detection methods, but the safety logic is the same: if water level drops below a defined safe point, the burner must be tripped.
A good mental model is “heat follows water.” The burner management system should not keep firing while the boiler is dry or near-dry. In practice, LWCO trips are paired with a lockout that requires manual reset after the level is restored and verified.
Example: A packaged boiler serving a small food plant loses condensate return due to a failed pump. Feedwater flow drops, level falls, and the LWCO trips. The burner shuts off, preventing tube overheating. Operators then restore condensate return or start the feedwater pump, verify level at the sight glass and level transmitter, and only then reset the LWCO.
Key best practices include testing LWCO operation on a schedule, verifying blowdown and probe maintenance where applicable, and ensuring the LWCO setpoint corresponds to the boiler’s waterline design and operating pressure.
Overpressure Protection
Overpressure protection prevents the boiler from exceeding its design limits due to control failures, blocked steam outlets, or regulator malfunction. Interlocks here focus on the burner and, depending on design, the steam pressure control valves and safety valves.
Safety valves are mechanical relief devices sized to discharge steam safely, but interlocks add an electrical and control-layer response. A typical approach is: if pressure rises beyond a high limit, the burner is shut down and the system is brought to a safe state. This reduces the load on the relief system and limits how long the boiler spends above normal operating pressure.
Example: A steam header pressure controller sticks closed, so the boiler keeps producing steam while the header can’t take it. Pressure climbs. The high-pressure interlock trips the burner, stopping heat input. Safety valves may lift if pressure continues to rise, but the interlock reduces the chance of prolonged relief operation.
Best practices include verifying setpoints against the boiler’s nameplate and code requirements, ensuring safety valves are tested and not obstructed, and confirming that pressure sensors used for interlocks are calibrated and mounted correctly.
Flame Failure Protection
Flame failure interlocks protect against unburned fuel accumulation and overheating of the furnace. Burner management systems monitor flame presence using a flame detector such as UV, IR, or flame rod. If the detector does not confirm flame during the trial-for-ignition window, or if flame is lost during operation, the system shuts off fuel and enters a lockout state.
The logic is intentionally strict: a boiler should not “guess” that combustion is happening. If the flame signal disappears, the burner is stopped and the system requires a reset after the cause is corrected.
Example: A gas burner starts, ignition occurs, but the flame detector wiring is loose. The burner management system does not see a valid flame signal, so it aborts ignition and shuts the gas valve. After tightening the connection and confirming detector operation, the operator restarts the burner.
Best practices include keeping detector lenses clean, checking sighting angles and mounting, verifying purge timing, and ensuring fuel valves are proven closed during shutdown.
How Interlocks Work Together
Interlocks should be layered so that a single fault doesn’t create a second hazard. LWCO addresses heat transfer to water, overpressure addresses pressure limits, and flame failure addresses combustion safety. The control system should also avoid nuisance trips by using correct sensor ranges, proper wiring practices, and periodic functional testing.
Practical Troubleshooting Logic
When a trip occurs, the first question is “which interlock reason fired?” That determines the safe next step. If LWCO trips, verify level and feedwater path before reset. If overpressure trips, check steam demand, control valves, and pressure sensor plausibility before reset. If flame failure trips, confirm fuel supply, ignition sequence, purge timing, and flame detector signal integrity.
A simple cause-and-effect mindset keeps troubleshooting grounded: each interlock corresponds to a specific unsafe condition, and the corrective action should restore the condition to normal before the burner is allowed to run again.
7.4 Burner Management Systems and Proof of Safety Sequences
A Burner Management System (BMS) is the control layer that decides whether a burner is allowed to fire, and it does so using a strict sequence of permissive checks, actuator commands, and safety proofs. Think of it as a traffic controller: it doesn’t just start the burner; it proves that the path to safe ignition is clear.
Core Concepts of Burner Safety Logic
A typical BMS cycle has three phases: pre-purge, ignition, and run supervision. During pre-purge, the system verifies airflow and clears residual combustible gases. During ignition, it energizes the igniter and fuel valves in the correct order and timing. During run, it continuously monitors flame presence and key interlocks.
Safety functions are usually implemented as hardwired or safety-rated inputs that force a lockout when violated. Common examples include low water level permissives (for steam boilers), flame failure, failed air proving, and overpressure trips. The BMS also uses “proofs” to confirm that actuators actually moved as commanded, not just that the controller sent a signal.
Mind Map: Burner Management System Responsibilities
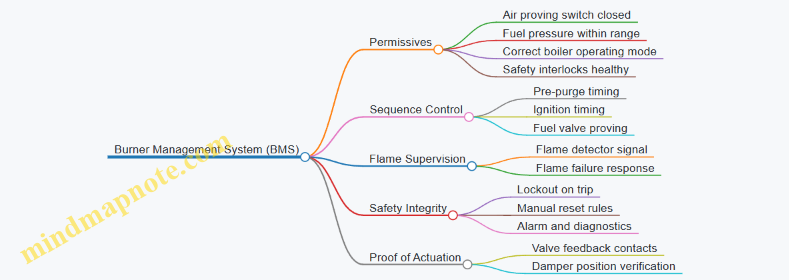
Proof of Safety Sequences from Start to Lockout
A proof of safety sequence is the set of checks that must be true before ignition and must remain true while firing. The sequence is designed so that a single fault tends to cause a safe shutdown rather than an unsafe start.
-
Pre-start permissive checks: The BMS verifies that the boiler is in a firing-allowed state and that safety inputs are healthy. For example, if a low-water cutoff input is open, the BMS should refuse to start even if other signals look correct.
-
Air proving and purge: The BMS requires evidence of airflow before it allows fuel. In practice, an air proving switch or differential pressure switch confirms that the forced draft fan is moving air. If the switch does not close within a set time, the BMS aborts and locks out.
-
Fuel valve command and feedback: Fuel valves are typically interlocked in pairs or stages. The BMS commands the first valve, then expects a feedback contact indicating the valve is actually open. If feedback is missing, it does not proceed to ignition.
-
Ignition and flame establishment: The igniter is energized, and fuel is introduced in a controlled manner. The BMS then waits for flame detection within a defined ignition trial window. If flame is not detected in time, it closes fuel valves and enters lockout.
-
Run supervision: Once flame is proven, the BMS monitors flame signal continuously. If flame is lost, it initiates a flame-failure response, commonly including immediate fuel valve closure and a restart attempt only if the safety logic permits it.
Practical Example: Gas Burner Start Sequence
Consider a gas-fired boiler with a forced draft fan, a damper, two fuel valves, and a flame scanner. A sensible sequence might look like this:
- The operator calls for heat.
- The BMS checks permissives: low-water cutoff healthy, pressure switches normal, and no active lockout.
- The BMS starts the fan and opens the damper.
- It waits for the air proving switch to close and runs a pre-purge timer.
- It commands fuel valve 1 open and waits for its feedback.
- It commands fuel valve 2 open and waits for its feedback.
- It energizes the igniter and introduces ignition fuel timing.
- It waits for flame detection; if flame is not detected within the trial window, it closes both fuel valves and locks out.
- If flame is detected, it transitions to run and continues flame supervision.
This example highlights why feedback matters. If valve 1 is commanded open but its feedback contact never changes, the BMS treats it as a fault and refuses to proceed.
Mind Map: Proof Points and Failure Responses
Advanced Details That Prevent “It Works Until It Doesn’t”
A BMS must handle nuisance signals and sensor drift without masking real faults. For flame detection, the system typically uses a defined threshold and timing so that brief noise does not count as flame. For air proving, the system uses both a switch state and a timing window, because a switch can chatter while the purge is still insufficient.
Finally, lockout behavior should be consistent with the risk. If a safety input fails, the BMS should not silently restart. Manual reset forces a deliberate check, such as confirming that a tripped air proving switch is actually restored rather than bypassed.
Example: Cause-and-Effect for a Flame Failure
If flame is lost during run, the BMS closes fuel valves and alarms. A common follow-up check is to verify whether the flame detector signal dropped due to real flame loss (for example, fuel pressure fluctuation) or due to a wiring or scanner fault. The proof logic ensures that the burner cannot re-enter ignition without passing the permissives and purge requirements again.
7.5 Practical Example: Building a Cause-and-Effect Matrix for Boiler Trips
A cause-and-effect matrix helps you turn “the boiler tripped” into a structured set of checks that match how the safety system decides to shut down. The goal is not to guess faster; it’s to avoid missing the one condition that actually triggered the trip.
Step 1: Start with the Trip Event Record
Collect the trip timestamp, boiler operating mode (startup, load-following, steady run), and the alarm/trip codes from the burner management system and boiler controller. If you have trend data, capture at least 10 minutes before the trip and the first few seconds after. A useful baseline is: feedwater flow, steam pressure, drum level, oxygen or CO signals, draft, and burner flame status.
Example: A boiler trips on “Low Water Cutoff” during a moderate load increase. The event record shows drum level dropping quickly, feedwater valve opening, and flame remaining stable until the trip.
Step 2: Define the Effect Categories
For boiler trips, effects usually fall into four buckets that map cleanly to instrumentation and safety logic:
- Water Level and Flow Effects: low level, high level, level oscillation, feedwater control mismatch.
- Pressure and Steam Quality Effects: overpressure, low pressure, carryover symptoms.
- Combustion and Draft Effects: flame failure, failed ignition, unstable combustion, draft excursions.
- Interlock and Trip Logic Effects: sensor disagreement, permissive failures, proof-of-safety sequence faults.
Write each bucket as a row group in your matrix.
Step 3: Build the Matrix with “Cause → Evidence → Checks”
Use a table where each row is a plausible cause, and each column forces you to attach evidence and a verification action.
| Effect Category | Cause Candidate | Evidence To Look For | Verification Check |
|---|---|---|---|
| Water Level | Feedwater control valve stuck or slow | Valve command changes but flow lags | Compare valve position vs. feedwater flow trend |
| Water Level | Pump cavitation or low suction pressure | Feedwater flow noisy or reduced | Check pump suction pressure, vibration, strainer ΔP |
| Water Level | Steam demand spike without control response | Load change precedes level drop | Compare steam header flow or process demand signal |
| Water Level | Level sensor fouling or calibration drift | Level reading inconsistent with drum conditions | Cross-check with alternate level instrument if available |
| Combustion | Burner air/fuel imbalance | O2/CO deviates before trip | Review O2/CO and air damper position trends |
| Combustion | Draft instability | Draft swings correlate with flame events | Check ID fan speed, damper position, pressure switch states |
| Interlock Logic | Sensor disagreement triggers safety | Two sensors disagree at trip time | Review “channel A vs B” alarm history |
| Interlock Logic | Blowdown or venting abnormal | Level behavior abnormal during blowdown | Inspect blowdown valve timing and blowdown rate |
This structure keeps the investigation grounded: every cause must point to something measurable.
Step 4: Add a Decision Path So You Don’t Chase Everything
A matrix is broad; a decision path is narrow. Use a simple rule: start with the effect category that matches the trip code, then expand only to causes that can plausibly produce that effect.
Example decision path for a “Low Water Cutoff” trip:
- Confirm trip code and which level channel caused it.
- Verify whether feedwater flow increased as commanded.
- If flow increased, check whether steam demand rose faster than control could respond.
- If flow did not increase, check valve response and pump health.
- If flow and demand look normal, suspect level measurement integrity.
Mind Map: Cause-and-Effect Matrix for Boiler Trips
Step 5: Apply It to the Example Trip
For the low water cutoff example, the matrix narrows quickly:
- The valve command increased, but feedwater flow lagged. That points to valve response or pump suction issues.
- Pump suction pressure shows a brief dip at the same time as the level drop. That supports cavitation or suction restriction.
- A strainer ΔP alarm appears earlier in the same shift, aligning with the mechanical cause.
Result: the most likely cause is suction restriction leading to reduced feedwater flow, which outpaced the boiler’s ability to maintain drum level.
Step 6: Close the Loop with Corrective Actions That Match the Cause
When you document the outcome, link each corrective action to the matrix row it addresses. Examples:
- Clean or replace the suction strainer elements and add a tighter inspection interval.
- Verify pump NPSH margin and ensure suction line conditions match design.
- Confirm feedwater valve stroke time and calibration after maintenance.
A good matrix ends with fewer, better actions, not a longer list of “maybes.”
8. Start-Up, Shutdown, and Operating Procedures
8.1 Pre-Start Checks: Inspections, Permits, and Readiness Verification
A boiler start is a chain of small confirmations. If you verify the right things in the right order, you reduce the chance of nuisance trips and the more serious “why is it doing that?” moments. Pre-start checks also protect people: pressure parts, hot surfaces, and combustion hazards do not care about good intentions.
Foundational Readiness: Roles, Scope, and Operating Mode
Start by confirming who is responsible for each action. Assign one person as the coordinator for the start sequence, and ensure the burner operator and control-room operator know the planned operating mode (e.g., normal firing, low-fire warm-up, or standby). Then confirm the target conditions: steam pressure setpoint, feedwater source, blowdown mode, and any constraints such as “no chemical dosing during start” or “limited load until temperature stabilizes.”
A practical habit is to write down the intended start path in plain language: “Ignition after purge, feedwater valve open to minimum flow, steam pressure ramp to X, then transition to load control.” This prevents the classic mismatch where the field is ready but the control logic is waiting for a different permissive.
Permits and Authorization: Making Compliance Concrete
Permits are not paperwork for its own sake; they encode safety boundaries. Verify that required permits are active and match the work scope. Common examples include:
- Hot work authorization for maintenance near furnace areas.
- Confined space entry permits if inspections require entry into drums, headers, or flue gas passages.
- Lockout and tagout status for any equipment that must remain isolated until the start.
- Line breaking permits if feedwater, fuel, or steam lines were opened.
A simple readiness check is to compare the permit scope to the start checklist. If the permit says “work complete and equipment returned to service,” confirm that the exact equipment is returned, not just “the area is clean.”
Inspection Priorities: What Must Be Verified Before Firing
Inspections should be ordered from “can we safely energize?” to “can we safely burn?” to “can we safely control?”
Mechanical and pressure boundary checks
- Confirm boiler is properly assembled: manways closed, inspection covers seated, gaskets intact, and fasteners tightened.
- Verify blowdown valves and drains are in the correct positions for start.
- Check that safety valves are not obstructed and that discharge piping is clear.
Combustion and fuel system checks
- Confirm burner components are installed and aligned: igniter, flame scanner, fuel nozzles, and air registers.
- Verify fuel supply conditions: correct fuel type, pressure within range, and no leaks at joints.
- Ensure combustion air paths are clear and dampers move freely.
Water-side checks
- Verify feedwater system is ready: pumps primed, strainers clear, and control valves free to stroke.
- Confirm water level instrumentation is functional and calibrated enough for start permissives.
Control and electrical checks
- Confirm interlocks and trips are reset only after the cause is cleared.
- Verify sensors used for permissives (low water cutoff, flame failure, overpressure protection) are reading plausibly.
Readiness Verification: Permissives, Evidence, and a Clean Start Window
Readiness is not “everything looks fine.” It is “the system meets the permissive conditions and the evidence is recorded.” Use a start window approach: once the boiler is ready, avoid long delays that allow conditions to drift.
Record the following before ignition:
- Boiler drum level indication and feedwater flow path status.
- Burner air and fuel valve positions at the start state.
- Proof of purge sequence readiness (where applicable).
- Status of safety interlocks and alarm setpoints.
If any permissive is not met, stop and correct it. A common mistake is to “work around” a permissive by forcing a sequence while the underlying sensor or valve condition remains questionable.
Mind Map: Pre-Start Checks Flow
Example: A Typical Industrial Boiler Start Readiness
Assume the boiler is scheduled to start on a Monday morning. Before any firing, the coordinator confirms the planned mode is “warm-up to minimum steam pressure” and that the feedwater source is the condensate return plus makeup. The permits are checked: hot work is complete in the economizer area, and the confined space permit is closed with all personnel accounted for. The operator then verifies manways are closed, blowdown valves are set to the start position, and the burner air damper moves freely. In the control room, the low water cutoff permissive is confirmed healthy, flame scanner status is normal, and fuel pressure is within the burner’s allowed range. Only after these confirmations are recorded does the team proceed to purge and ignition.
Example: When Readiness Looks Fine but Isn’t
A boiler team reports “level is normal,” yet the start permissive for feedwater flow is not satisfied. The inspection reveals the feedwater control valve stem position indicator is out of sync with the actual valve position due to a stuck linkage after maintenance. The fix is mechanical alignment and valve stroking verification, not a sequence override. The start then proceeds with consistent evidence: level indication, flow permissive, and valve position all agree.
Readiness Checklist Outcome
A good pre-start outcome is simple: the boiler is assembled correctly, permits match the work scope, safety interlocks are in the expected state, and the system meets the permissives for ignition and control. When those conditions are met, the start sequence becomes a controlled process rather than a test of luck.
8.2 Cold Start, Warm Start, and Hot Standby Operating Steps
A boiler start is mostly a controlled sequence of “get the furnace ready, get the water stable, then bring heat and steam up together.” The main differences between cold start, warm start, and hot standby are how much thermal inertia you already have and how quickly you can safely ramp combustion and steam flow.
Mind Map: Start Modes and Step Logic
Cold Start Operating Steps
-
Pre-start verification: Confirm the boiler is mechanically ready, the burner is free to rotate and move to position, and the fuel train valves are in the correct states. Verify level transmitters and low-water protection logic are healthy by checking their status and recent calibration checks.
-
Furnace purge: Run the required air purge to clear combustible mixtures from the furnace and gas paths. A practical rule is to treat purge as “time plus air movement,” not just a timer. If airflow is measured, confirm it reaches the expected range.
-
Establish circulation path: For water-tube boilers, ensure pumps (if used) are available and that flow paths are not blocked. For drum boilers, confirm the drum level is within the operating band before firing.
-
Light-off and initial combustion: Start the burner at the lowest stable firing rate. Keep the first minutes conservative so furnace metal temperatures rise without large gradients. Watch oxygen and CO trends if available; a stable low-fire pattern is better than chasing maximum heat immediately.
-
Bring steam pressure up together with water level: Increase firing in small increments while monitoring drum level, steam pressure, and steam temperature. If level starts to drift, pause the ramp and correct feedwater or control valve behavior before continuing.
-
Steam quality management: As pressure rises, ensure drum separation is functioning and that blowdown and feedwater control are consistent with the chemistry plan. If moisture carryover is suspected (for example, erratic superheater temperature or downstream wet steam indicators), reduce firing rate and stabilize.
-
Transition to load: Once steam conditions are within control limits and quality is stable, follow the site’s load ramp. A useful operating example is “step, settle, then step again”: hold each firing step long enough for pressure and level to stop oscillating.
Warm Start Operating Steps
Warm starts assume the boiler has residual heat, so the goal is to avoid thermal shock and avoid overshooting control targets.
-
Assess residual conditions: Check temperatures on key surfaces if instrumentation exists, and confirm the boiler is not in a state where components are too hot for safe handling. Confirm condensate return is available so feedwater control can respond quickly.
-
Purge and light-off: Perform a purge appropriate to the time since shutdown, then light at low fire. Even with residual heat, the first combustion should be stable and repeatable.
-
Shorter stabilization, tighter monitoring: Because the system is already warm, pressure can rise faster. Keep the ramp smaller than you think you need, and watch for level control lag. If the feedwater control valve response is slow, you will see level swings before you see pressure issues.
-
Quality and temperature alignment: Bring steam temperature and pressure to their targets in a coordinated way. If superheater temperature lags, reduce firing rate rather than forcing it; forcing often increases tube metal stress and can worsen steam quality.
Hot Standby Operating Steps
Hot standby means the boiler is already at operating temperature range, so the start sequence is more about control transitions than heating.
-
Maintain minimum stable conditions: Keep minimum firing or equivalent heat input running so furnace and steam-side surfaces remain within acceptable temperature bands. Confirm water chemistry remains within limits because “hot” does not mean “safe.”
-
Verify control readiness: Ensure steam pressure control is in automatic (or the intended mode) and that burner management is ready for load change. Confirm safety interlocks are not bypassed.
-
Transition from standby to service: Increase firing gradually while monitoring steam pressure, steam temperature, and drum level. A concrete example is moving from minimum firing to a first service step, then waiting for pressure to settle before adding more fuel.
-
Manage steam quality during load change: Load increases can temporarily worsen steam quality if separation and blowdown response do not keep up. If downstream steam quality indicators show wetness, reduce the ramp rate and stabilize before continuing.
Practical Example: Choosing the Right Ramp Behavior
Suppose a plant needs steam in three hours. If the boiler was shut down recently and metal temperatures are still high, a warm start is usually appropriate. If it was kept in hot standby, the operator should focus on control transitions and steam quality during the first load steps. In all cases, the consistent best practice is to ramp in increments, allow settling, and correct level and combustion stability before pushing for higher pressure or temperature.
8.3 Warm-Up of Steam Lines, Traps, and Control Valves
A warm-up is the part of the start-up where you trade time for stability. The goal is simple: get steam where it must go, keep water where it belongs, and prevent thermal shock from turning metal into a stress test.
Foundational Principles for Safe Warm-Up
Steam lines rarely start at the same temperature. If you send hot steam into a cold line, the inner wall heats first, expands first, and then gets restrained by the cooler outer wall. That mismatch can crack tubes, warp valve bodies, or loosen joints. A good warm-up therefore uses controlled heat-up rates and staged flow paths.
Two practical rules guide the procedure:
- Remove trapped condensate before full steam flow. Condensate is incompressible, so it can cause water hammer when steam arrives.
- Match valve and line temperatures. Control valves and steam traps have moving parts and tight clearances; they need gradual temperature rise to avoid sticking or leakage.
Stepwise Warm-Up Logic
Start by confirming that the system is configured for warm-up. Isolation valves should be positioned so you can vent and drain the intended sections without bypassing safety devices. Then proceed in stages.
Stage 1: Pre-Check and Venting
Verify that steam traps are installed correctly and that their discharge paths are open to a safe condensate return or vent header. If a trap discharge is blocked, the trap can’t do its job and the line will fill with condensate.
Open vents at high points and at any known air pockets. Air and noncondensable gases slow heat transfer and can keep traps from seeing real condensate. A vent should discharge steam or hot condensate steadily; once it does, you can close it gradually.
Stage 2: Controlled Steam Introduction to Lines
Introduce steam at low demand first. Use a bypass or a reduced opening strategy so the line warms without flooding. Watch for three signals:
- Temperature rise at drains and vents indicates the line is heating rather than just passing steam through.
- Drain behavior changes from cold water to warm condensate to minimal discharge.
- Pressure stability improves as the line stops acting like a heat sink.
If you see persistent heavy discharge, slow down. Heavy discharge usually means condensate is still being formed faster than it can be removed.
Stage 3: Trap Warm-Up and Verification
Traps often fail “quietly” during start-up because they are cold and their internal elements may not respond correctly. Warm-up should therefore include a brief observation window.
A practical approach is to warm the upstream line first, then allow time for condensate to reach the trap. For thermostatic traps, the element needs temperature to reach its operating range. For mechanical traps, the float or bucket needs stable steam quality and condensate flow.
Verification is based on what you can measure safely:
- Discharge temperature and rate at the trap outlet (or at a sight glass if provided).
- Outlet pressure if instrumented, to confirm the discharge path is not backing up.
- Absence of continuous steam blow-through during steady warm conditions.
If a trap outlet stays cold while the upstream line is hot, suspect blockage, incorrect installation orientation, or a failed trap element.
Stage 4: Control Valve Temperature Matching
Control valves should not jump from cold to full duty. Warm them by gradually increasing steam flow through the valve while keeping downstream demand controlled.
Watch for two common issues:
- Hunting or unstable control caused by delayed thermal response in the valve body and downstream piping.
- Seat leakage that appears during warm-up because the seat and plug are at different temperatures.
If the system includes a bypass around the control valve, use it to establish a gentle temperature rise downstream before moving to normal control positions.
Mind Map: Warm-Up of Steam Lines, Traps, and Control Valves
Example: Warm-Up of a Process Steam Branch
A plant has a 6-inch steam branch feeding a heat exchanger. The branch includes two steam traps at high points and a modulating control valve near the exchanger.
- Vents open at the branch high points. Operators wait until vents discharge steady hot condensate rather than sputtering cold water.
- Steam introduced at reduced opening. The control valve is held in a low position while a bypass maintains gentle flow.
- Trap observation window. The first trap outlet transitions from cold discharge to intermittent condensate discharge. The second trap follows after a short delay.
- Control valve moved to normal control. Once trap discharge is consistent and downstream pressure stops fluctuating, the valve is allowed to take over normal modulation.
The key detail is the delay between line heating and trap response. If you expect traps to behave immediately, you’ll misdiagnose normal warm-up lag as a failure.
Practical Acceptance Criteria
Warm-up is complete when the system shows stable pressure, reduced drain discharge consistent with condensate removal, trap outlets that indicate condensate handling without continuous steam blow-through, and control valve response that is smooth rather than oscillatory. If any criterion fails, the fix is usually procedural: slow the heat-up, re-check venting, confirm discharge paths, and ensure the valve and downstream piping reach compatible temperatures.
8.4 Normal Shutdown, Blowdown Strategy, and Preservation Considerations
A normal boiler shutdown is mostly about controlling three things: water chemistry, heat removal, and system integrity. If you manage those in the right order, you reduce the odds of corrosion, scale, and “mystery” restarts.
Shutdown Goals and Operating Sequence
Start by defining the shutdown type: short stop (hours), planned outage (days), or preservation (weeks). The sequence below assumes a normal planned stop where you can keep monitoring.
- Reduce load smoothly. Bring the burner down to minimum stable firing, then step down steam demand. Sudden load drops can leave heat transfer surfaces under- or over-served, depending on circulation and control response.
- Maintain safe water level. Keep level control stable while steam generation falls. If level drifts, address it before you touch blowdown settings.
- Stabilize pressure and temperature. Let pressure fall gradually to the target for blowdown. Rapid depressurization can increase thermal stress and encourage carryover of dissolved solids.
- Perform blowdown at the right time. Blowdown is most effective when it removes the concentrated water that forms as evaporation proceeds.
- Cool down with controlled conditions. After firing stops, manage cooling so the boiler doesn’t sit hot with reactive water chemistry.
Blowdown Strategy That Matches Chemistry
Blowdown removes dissolved solids and concentrates impurities in the boiler water. The strategy is not “more is better”; it’s “enough to keep limits, with minimal loss of treated water.”
Continuous blowdown is used when you need steady impurity control. Intermittent blowdown is used to reduce concentration spikes, often after load changes.
A practical approach:
- Before shutdown: confirm blowdown valves are functional and instrumentation is reading correctly.
- During load reduction: watch conductivity, TDS proxy, or conductivity-based control if installed. If conductivity rises faster than expected, increase blowdown duration in small steps rather than one long burst.
- At the end of firing: perform a final blowdown when pressure is at the planned shutdown level. This reduces the amount of concentrated water left behind.
Easy example: If your boiler normally runs with conductivity control and you see it trending high during the last hour of operation, you can extend continuous blowdown by a short, measured increment (for example, a few minutes) while keeping level stable. Then, once firing stops and pressure reaches the shutdown setpoint, you do a final intermittent blowdown to remove the remaining concentrated water.
Normal Shutdown Blowdown Steps
Use a consistent checklist so operators don’t improvise under time pressure.
- Confirm blowdown target conditions. Set the shutdown pressure level and verify the blowdown discharge system is ready.
- Reduce firing to minimum stable. Keep level control active.
- Apply controlled blowdown. Use continuous blowdown as needed, then schedule intermittent blowdown near the end.
- Verify level recovery. After blowdown, ensure feedwater returns the level to the safe range.
- Record settings and results. Log blowdown duration, valve positions, and final boiler water readings.
Cooling and Preservation Considerations
Preservation is about preventing corrosion while the boiler is out of service. The “right” method depends on how long the boiler will sit and whether you can keep it dry or filled.
Short stop (hours):
- Keep the boiler warm enough to avoid condensation on internal surfaces.
- Maintain normal water chemistry control if the system design supports it.
Planned outage (days):
- Consider a controlled layup with chemistry maintained or with partial draining if your procedure calls for it.
- Ensure vents and drains are managed so trapped pockets don’t collect condensate.
Long layup (weeks):
- Use a formal preservation method: either wet preservation (water-filled with appropriate chemistry) or dry preservation (air-drying with desiccants or inerting, depending on plant practice).
- After draining, remove residual deposits where feasible, because leftover scale can become a corrosion starter kit.
Easy example: A boiler that will be idle for several weeks should not be left full of untreated water after a casual drain. If you choose wet preservation, you treat the water to reduce corrosion risk. If you choose dry preservation, you ensure the interior is dry and sealed so moisture doesn’t return.
Mind Map: Shutdown, Blowdown, Preservation
Quick Operator Checklist
- Level stable before any major blowdown.
- Blowdown discharge system ready and safe.
- Final blowdown performed at the planned shutdown pressure.
- Cooling avoids long periods of hot, reactive water.
- Preservation method matches outage duration and includes moisture control.
When shutdown is treated as a controlled process rather than a “stop button,” the boiler usually rewards you with fewer surprises at the next start.
8.5 Practical Example: Step-by-Step Start-Up for a Typical Industrial Boiler
This example assumes a natural-draft or forced-draft fired water-tube boiler with a steam drum, economizer, superheater, and a burner management system. The goal is to reach stable steam conditions while protecting tubes, avoiding water carryover, and proving safety interlocks.
Mind Map: Start-Up Flow and Guardrails
Step 1: Pre-Start Checks That Prevent Most Problems
Start by confirming the boiler is mechanically ready: burner components are seated, igniters are functional, and access doors are closed. Verify that the feedwater system can deliver the required pressure and that the deaerator or condensate return path is producing water within your chemistry limits. Check that steam traps in the start-up header are installed and not blocked, because trapped condensate can cause water hammer when pressure rises.
Next, validate instrumentation. Compare local gauges to transmitters for pressure and drum level, and confirm level switches used for low-water cutoff are calibrated. Finally, confirm the safety logic is armed: flame failure detection, overpressure protection, and low-water cutoff must be in service before any purge begins.
Step 2: Establish Water Level and Safe Venting
Bring the drum to a controlled starting level using the feedwater control valve in manual or startup mode, depending on your design. Open the appropriate vents to remove air from the steam space and to prevent trapped pockets from delaying heat-up. If your boiler uses a steam drum vent condenser or vent line, ensure it is connected and not restricted.
Set blowdown valves to the startup position. The point is not to “run it hard,” but to keep dissolved solids and concentration from spiking while the boiler warms and water circulation changes.
Step 3: Purge and Prove Combustion Air
Before ignition, the burner management system should perform a purge. Prove that combustion air fans are running and dampers are in the commanded position. Verify that fuel valves are closed during purge, and that the purge time meets the burner manufacturer’s safety requirements.
A practical check: watch the oxygen trend in the stack during purge. If oxygen drops unexpectedly, it can indicate poor air flow or a leak path that will complicate ignition.
Step 4: Ignition and Initial Firing
Initiate ignition only after purge completion and flame detection readiness. The burner management system will open the ignition source and then admit fuel in a controlled ramp. Keep the firing rate low at first so the furnace walls and superheater tubes heat evenly.
During the first minutes, monitor drum level closely. A common mistake is assuming level will “settle.” In reality, heat input changes steam generation rate quickly, and level control can lag if valve response is slow or if feedwater temperature is off.
Step 5: Heat-Up and Steam Line Warming
As pressure rises, warm the superheater and steam lines gradually. If your system includes a bypass or desuperheating arrangement, use it to manage steam temperature while the metal is still catching up. This reduces thermal stress and helps avoid localized overheating.
Maintain a steady drum level and avoid aggressive load jumps. A simple rule of thumb is to increase firing in small steps, allowing pressure and level to stabilize between steps. If you see rising steam temperature faster than pressure, it often means steam quality is changing or circulation is not behaving as expected.
Step 6: Transition to Normal Control Loops
Once you reach the target operating pressure range and stable steam temperature, switch from startup control to normal loops. Typically this means moving from manual or startup feedwater control to automatic pressure control, and from low-fire combustion settings to closed-loop combustion tuning.
Tune combustion using measured flue gas parameters. Aim for stable oxygen and avoid conditions that produce excessive CO. If you observe oscillations in stack oxygen, check air damper control response and ensure the draft system is not hunting.
Step 7: Post Start-Up Verification and Baseline Logging
After stabilization, verify that safety trips are still within expected setpoints and that alarms are not bypassed. Confirm blowdown rate is at the planned operating value and that condensate return is functioning without excessive flash steam losses.
Record a baseline: firing rate, drum level, feedwater flow, steam pressure, steam temperature, stack oxygen, and any notable valve positions. This baseline becomes your reference for later troubleshooting, because “normal” is a moving target tied to fuel quality and ambient conditions.
Example: A Typical Timeline with Decision Points
- 0–30 minutes: mechanical checks, instrument validation, drum level setup, venting
- 30–60 minutes: purge, ignition, low-fire warm-up
- 60–120 minutes: gradual pressure rise, superheater warming, stable level control
- 120–180 minutes: transition to normal control, combustion tuning, baseline logging
Decision points: if drum level trends downward despite feedwater valve opening, stop increasing firing and investigate circulation, feedwater pressure, or level sensor behavior. If stack oxygen swings widely, pause load increases and stabilize draft and air control before proceeding.
9. Efficiency, Performance Testing, and Heat Rate Determination
9.1 Boiler Efficiency Definitions and Measurement Boundaries
Boiler efficiency is a ratio: how much useful energy the boiler delivers as steam compared with how much chemical energy enters with the fuel. The tricky part is that “useful” and “entered” depend on what you include, what you measure, and where you draw the boundary. Two plants can report the same boiler with different efficiencies simply because their measurement boundaries differ.
What Efficiency Means in Practice
Start with the energy you want to account for: steam energy leaving the boiler. For a typical drum boiler, that means the enthalpy of saturated or superheated steam at the outlet conditions, plus any energy carried by blowdown if you treat it as part of the steam output. Then account for the energy you put in: the fuel’s net heat of combustion (usually the lower heating value, LHV, because water formed in combustion is not counted as recoverable heat).
A simple definition is:
- Boiler efficiency = (Useful steam energy rate) / (Fuel heat input rate)
In real measurements, “useful steam energy” is not always the same as “steam produced.” If you have significant steam leaks, unmeasured condensate losses, or blowdown handling that returns heat elsewhere, the boundary matters.
Measurement Boundaries You Must Declare
Think of the boiler as a box with pipes and ducts crossing its walls. Efficiency changes when you move the box.
- Fuel boundary: Are you using LHV or HHV? Most boiler efficiency reporting uses LHV. If someone uses HHV, their efficiency will look lower by a predictable amount.
- Stack boundary: Do you include losses in the economizer and air preheater, or only what remains in the stack? A “combustion efficiency” calculation focuses on stack oxygen and carbon monoxide, while a “boiler efficiency” calculation uses a full energy balance.
- Water boundary: Is feedwater enthalpy measured at the boiler inlet, or at the plant header? If the feedwater warms in piping or a deaerator, you must decide whether that heat belongs to the boiler or to upstream equipment.
- Blowdown boundary: Blowdown removes water and dissolved solids. If blowdown heat is recovered in a flash tank or heat exchanger, you can treat recovered energy as reducing net losses.
- Condensate and radiation boundary: Heat lost by radiation and convection from the boiler casing can be treated as a loss (common) or estimated and included in a broader system balance.
Two Common Efficiency Definitions
Combustion efficiency estimates how completely fuel burns, often using flue gas analysis. It answers: “How much chemical energy escaped as CO, unburned hydrocarbons, or soot?” It does not fully account for heat transfer effectiveness.
Boiler efficiency is broader. It accounts for how effectively the boiler transfers heat from flue gas to water/steam, including stack losses, blowdown losses, and casing losses.
A useful mental model is that combustion efficiency is about the fuel side, while boiler efficiency is about the heat transfer and accounting side.
Core Loss Terms and Their Measurement Limits
A full energy balance typically groups losses into:
- Stack loss: Sensible heat in flue gas leaving the boiler, plus latent effects if moisture is considered.
- Incomplete combustion loss: Chemical energy in CO, unburned carbon, or hydrocarbons.
- Blowdown loss: Enthalpy carried out with blowdown water.
- Radiation and convection loss: Heat leaving the boiler casing to the surroundings.
- Unaccounted losses: Any energy not captured by the measured terms, often due to boundary choices or measurement uncertainty.
Measurement boundaries set what you can capture. For example, if you do not measure feedwater temperature at the boiler inlet, you cannot accurately compute the enthalpy rise across the boiler.
Mind Map: Efficiency Definitions and Boundaries
Example: Same Boiler, Different Reported Efficiency
Assume a boiler produces 20,000 kg/h of steam at 10 bar saturated conditions. Feedwater enters at 105°C. Fuel flow is measured, and the fuel’s LHV is used.
- If you compute efficiency using feedwater enthalpy at the boiler inlet and include blowdown enthalpy as a loss, you get one value.
- If instead you use feedwater temperature measured at a plant header that is 5°C warmer due to upstream piping heat, your calculated enthalpy rise across the boiler shrinks, and the efficiency appears lower.
The steam rate and fuel rate are identical, but the boundary moved.
Example: Combustion Efficiency vs Boiler Efficiency
Suppose flue gas analysis shows low oxygen and negligible CO, indicating good combustion. Combustion efficiency will look high. Yet boiler efficiency can still be modest if stack temperature is high because heat transfer surfaces are fouled or air leakage increases flue gas flow. In other words, “burning well” does not guarantee “transferring well.”
Practical Measurement Boundary Checklist
Before calculating efficiency, confirm these items are consistent across runs:
- Fuel basis uses LHV.
- Feedwater temperature and pressure represent boiler inlet conditions.
- Steam outlet conditions represent actual delivered steam.
- Blowdown rate and temperature/pressure are either included as losses or treated with a defined recovery method.
- Flue gas sampling location and correction basis are consistent.
- Casing losses are either measured/estimated consistently or explicitly treated as part of unaccounted losses.
When these boundaries are declared and held steady, efficiency becomes a meaningful diagnostic rather than a moving target.
9.2 Stack Losses, Radiation Losses, and Unaccounted Energy
Boiler efficiency accounting is easiest when you separate “what leaves the boiler with the flue gas” from “what leaves as heat to the surroundings.” Stack losses cover the first category; radiation losses cover the second. Anything left after those two buckets lands in unaccounted energy, which is usually a measurement or boundary issue rather than a mysterious third law of thermodynamics.
Stack Losses
Stack losses represent the enthalpy carried away by hot flue gas leaving the stack. The core idea is simple: if the flue gas exits hotter than the reference environment, it has stored energy that did not transfer to the steam.
Start with flue gas temperature and composition. Higher excess air generally raises stack temperature because more nitrogen and excess oxygen must be heated and then carried out. Incomplete combustion can also raise stack temperature, but it does so while simultaneously reducing heat release in the furnace, so the efficiency impact is usually worse than “just hotter gas.”
A practical way to think about stack loss is to compare the measured stack temperature to a baseline and then account for how much flue gas is passing. If the boiler is firing harder, flue gas flow increases, so even a modest temperature change can matter.
Example: A boiler runs at the same firing rate, but stack temperature drops from 220°C to 190°C after combustion tuning. If flue gas flow is roughly unchanged, the enthalpy of the exiting gas decreases, so stack loss decreases. If oxygen in the stack also drops toward the target excess air range, the reduction is typically larger because less inert gas is being heated.
Stack losses are also affected by moisture in the flue gas. Water vapor carries latent heat, so if you have significant hydrogen in the fuel, the stack loss includes the energy associated with forming and carrying that vapor.
Radiation Losses
Radiation losses are heat emitted from the boiler casing, furnace walls, and external surfaces to the surrounding air. They depend on surface temperature, emissivity, insulation condition, and airflow around the casing.
Radiation is often underestimated because it is not directly measured. Instead, it is inferred from heat balance or estimated using surface temperatures and insulation thickness. The “gotcha” is that insulation degradation changes surface temperatures without necessarily changing stack temperature, so a boiler can look fine on combustion yet lose more heat to the room.
Example: Two operating days have identical stack temperature and oxygen. On one day, an access door gasket is leaking and insulation is damp. The casing surface near the furnace shows higher temperature, and the room heat load increases. Stack loss may be unchanged, but radiation loss rises, lowering overall efficiency.
Radiation losses are usually larger at higher firing rates because surface temperatures rise. They also increase when the boiler room ventilation removes heat from the casing faster, effectively increasing the driving temperature difference.
Unaccounted Energy
Unaccounted energy is the remainder after you compute all major gains and losses using your chosen boundaries. In a well-instrumented system, it should be small and consistent. When it is large, the usual causes are:
- Boundary mismatch: You measured feedwater enthalpy at one point but computed it for another. For instance, sampling condensate return temperature incorrectly can shift the energy balance.
- Blowdown handling errors: Blowdown carries energy out of the boiler. If blowdown rate or blowdown temperature is assumed rather than measured, the “missing” energy often shows up here.
- Fuel analysis gaps: If the fuel’s higher heating value (or composition used to compute it) is off, the entire efficiency calculation shifts.
- Measurement uncertainty stacking: Small errors in stack temperature, flue gas flow, and oxygen can combine into a noticeable remainder.
- Neglected heat sinks: Items like soot deposits, incomplete condensate return, or heat stored in refractory during transients can distort results if the test is not at steady state.
Example: During a performance test, the operator records stack temperature carefully but estimates flue gas flow from a generic model. If the actual excess air differs from the assumed value, the computed stack enthalpy will be wrong, and the efficiency error will appear as unaccounted energy.
Mind Map: Stack Losses, Radiation Losses, and Unaccounted Energy
Integrated Example: Closing the Heat Balance
Suppose you run a steady-state test and compute stack loss and radiation loss. If unaccounted energy is negative, you may have overestimated losses or underestimated gains. If it is positive, you may have missed a loss path such as blowdown energy or heat carried away by leaks.
A disciplined approach is to reconcile the biggest terms first. Stack loss usually dominates because it scales with flue gas enthalpy. Radiation loss is next, especially for poorly insulated units. Only after those are consistent should you spend time chasing smaller contributors like minor temperature reference errors.
When the remainder shrinks to a reasonable level and stays consistent across repeated runs, you can trust the efficiency number. When it does not, the heat balance is telling you where the accounting boundaries or measurements need tightening—no mystery required.
9.3 Blowdown Losses and Their Influence on Overall Efficiency
Blowdown is the controlled removal of boiler water to prevent the buildup of dissolved solids and contaminants. It is also a direct energy loss, because the discharged water carries sensible heat and often flashes some of that heat into steam. The efficiency impact is therefore not just “how much water you dump,” but also “how hot and how much steam you throw away.”
What Blowdown Is Doing Thermodynamically
Boiler feedwater enters at a lower temperature than the boiler water. As it heats, it picks up enthalpy. When you blow down, you remove a portion of that higher-enthalpy water. If the blowdown is flashed through a pressure reduction, some fraction becomes steam, which leaves the system unless recovered.
A useful mental model is an energy balance around the blowdown valve and discharge line:
- Mass loss: blowdown rate reduces the water available to generate steam.
- Sensible heat loss: discharged water leaves at near boiler conditions.
- Flash steam loss: pressure drop causes part of the discharge to vaporize.
- Makeup penalty: the system must replace the removed water with feedwater, which requires additional heating.
Where Blowdown Losses Show Up in Boiler Efficiency
In practical efficiency testing, blowdown losses appear as part of the “unaccounted” or “measured losses” depending on the test method. Even when you compute boiler efficiency from stack and feedwater data, blowdown can quietly skew results because it changes the relationship between:
- feedwater flow and steam generation,
- measured blowdown rate and actual discharge enthalpy,
- and the effectiveness of blowdown heat recovery.
If blowdown is frequent or poorly controlled, you may see efficiency drop without any obvious change in firing rate. The boiler is still burning fuel, but more of the energy is leaving with the discharge.
Types of Blowdown and Their Efficiency Implications
Continuous blowdown removes a steady fraction to control total dissolved solids. It tends to be predictable, so its energy penalty can be estimated and optimized.
Intermittent blowdown targets bottom sludge and deposits. It can be efficient when timed correctly, but it often causes larger short-duration losses because the discharge conditions can be harsher.
A common best practice is to keep continuous blowdown as low as chemistry allows, then use intermittent blowdown strategically to manage sludge. That approach reduces the “always-on” energy loss while still preventing carryover and fouling.
Practical Example with Numbers
Assume a boiler operating at 10 bar(g) with a blowdown temperature near saturation. Let continuous blowdown be 2% of steam generation by mass. If the boiler produces 10,000 kg/h of steam, blowdown mass is 200 kg/h.
If the blowdown is discharged with no recovery and flashes significantly, the energy leaving can be approximated as:
- Sensible enthalpy of blowdown water (relative to feedwater), plus
- latent heat associated with flashed fraction.
Even without exact steam table values, the direction is clear: doubling blowdown from 2% to 4% roughly doubles the mass-based energy loss from blowdown, and the flash component makes the penalty more than linear in some systems. This is why operators often treat blowdown as a “chemistry-controlled lever” rather than a fixed operating habit.
Mind Map: Blowdown Loss Pathways
Advanced Details That Matter in Real Plants
- Blowdown rate measurement quality: A small instrumentation error on blowdown flow can create a large efficiency error because blowdown is a mass flow that directly changes energy accounting.
- Discharge pressure and piping layout: Two systems with the same blowdown mass can have different losses if one discharges to a flash tank and the other vents directly.
- Chemistry control stability: If conductivity control oscillates, blowdown may surge, increasing both sensible and flash losses.
- Interaction with feedwater temperature: Higher feedwater temperature reduces the enthalpy difference between boiler water and makeup, lowering the incremental penalty of each kilogram blown down.
A Simple Optimization Loop
Start with chemistry targets that limit dissolved solids and prevent carryover. Then adjust continuous blowdown to the lowest rate that maintains those targets, and use intermittent blowdown only as needed for sludge control. Finally, verify the discharge path: if flash steam is recovered and returned, the blowdown “cost” drops because part of the energy is reused rather than vented.
In short, blowdown efficiency is a three-part equation: how much you remove, how much energy each kilogram contains, and whether that energy gets recovered or escapes with the discharge.
9.4 Combustion Analysis, Oxygen/CO Monitoring, and Tuning for Efficiency
Efficient boiler operation starts with knowing what the burner is actually doing, not what the nameplate says it should do. Combustion analysis connects three things: fuel-to-air mixing, flame stability, and how much heat escapes up the stack. The core measurements are flue gas oxygen (O₂) and carbon monoxide (CO), usually paired with stack temperature and sometimes carbon dioxide (CO₂) or excess air estimates.
Foundations: What O₂ and CO Mean
O₂ in the flue gas is a practical indicator of excess air. If O₂ is high, the burner likely has more air than needed, which can increase stack losses because extra air carries heat away. If O₂ is very low, combustion may be incomplete, and CO can rise.
CO is the “incomplete combustion” signal. CO forms when carbon doesn’t fully oxidize to CO₂. In a well-tuned system, CO should remain low during steady operation. Spikes often point to transient conditions such as poor atomization, unstable draft, or burner staging changes.
A useful mental model is that O₂ controls the availability of oxygen, while CO reflects whether oxidation is actually happening fast enough in the furnace. That’s why tuning is not just “set O₂ to a number.” It’s “achieve low CO at the lowest practical excess air without destabilizing the flame.”
Mind Map: Combustion Analysis Workflow
Stepwise Tuning Logic That Doesn’t Skip Steps
-
Establish a baseline at a stable firing rate. Record O₂, CO, stack temperature, and burner settings. If the boiler is cycling or the draft is wandering, tuning will chase moving targets.
-
Confirm sampling quality. Sensors drift and sampling lines can lag. Ensure the probe is positioned consistently and readings are taken after conditions stabilize. A slow response can make CO look like it’s spiking when it’s actually catching up.
-
Tune air first, then fuel. For most burners, adjusting air changes O₂ quickly. Reduce excess air gradually while watching CO. The goal is to find the “knee” where CO begins to rise, then back off slightly to stay on the safe side.
-
Use CO as the guardrail. If CO rises as O₂ drops, the furnace is running short on effective oxygen mixing or residence time. In that case, return to the last stable point and investigate mixing quality before pushing further.
-
Check stability across load. A setting that looks perfect at one firing rate can fail at another. Repeat the same measurement routine at low, medium, and near-maximum firing rates.
Practical Example: Finding the Excess Air Knee
Suppose a boiler is operating at a steady load with O₂ at 5.5% and CO at 20 ppm. Stack temperature is 320°C. The operator reduces air slightly and observes O₂ drop to 4.8% while CO stays at 20 ppm. A further reduction brings O₂ to 4.2% and CO rises to 60 ppm. The “knee” is between 4.2% and 4.8% O₂. The tuned target becomes about 4.6% O₂ with CO back near 20 ppm. This reduces stack loss without sacrificing combustion completeness.
Example: When CO Rises Without O₂ Changes
Sometimes CO increases while O₂ remains nearly constant. That points away from “too much air” and toward mixing or flame behavior. Common causes include poor atomization (fuel pressure too low or nozzle wear), unstable draft (fan or damper control issues), or burner hardware fouling. The tuning response should be diagnostic: inspect the burner, verify fuel pressure and spray pattern, and check draft stability before making large air changes.
Mind Map: Interpreting O₂ and CO Together
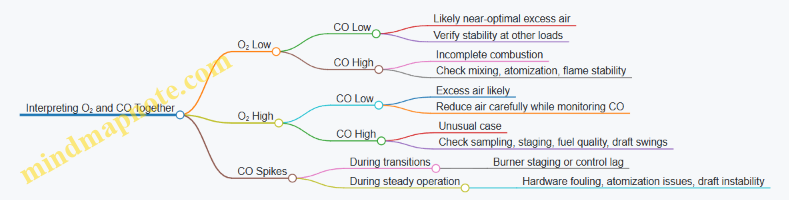
Turning Measurements Into Efficient Operation
Efficiency improves when you reduce unnecessary excess air and minimize incomplete combustion. O₂ helps you avoid carrying extra heat up the stack, while CO prevents you from trading “less air” for incomplete oxidation. The best tuning results come from controlled changes, consistent sampling, and verification at multiple firing rates. Keep a change log so the next adjustment starts from evidence, not memory.
9.5 Practical Example: Conducting a Boiler Performance Test and Interpreting Results
A performance test is basically a disciplined accounting exercise: measure what goes in (fuel and air), measure what comes out (steam, condensate, flue gas), and reconcile the energy balance with realistic losses. The goal is not to “get a perfect number,” but to get a defensible efficiency and a clear list of what is driving it.
Step 1: Define the Test Boundary and Operating Point
Start by writing down the test boundary: does the efficiency include economizer and superheater heat absorption, and does it treat blowdown as part of the useful output? Then lock the operating point. Pick a steady load where steam pressure, feedwater temperature, and burner firing rate are stable for at least 15–30 minutes.
Example operating snapshot
- Boiler load: 60,000 lb/h (27,216 kg/h)
- Steam pressure: 600 psig (4.14 MPa)
- Steam temperature: 750°F (399°C)
- Feedwater temperature: 350°F (177°C)
- Blowdown rate: 1.5% of steam flow
- Excess air target: around 3–5% (confirmed by O₂/CO analysis)
Step 2: Measure Fuel Input and Combustion Air
Measure fuel flow with a calibrated meter (or weigh tanks for a timed period). Record fuel higher heating value (HHV) from the latest fuel certificate.
For combustion, sample flue gas at a consistent location in the stack or duct. Measure:
- O₂ (or CO₂)
- CO
- Flue gas temperature
- Draft (optional but helpful for interpreting combustion stability)
Easy-to-understand check
If O₂ is high and CO is near zero, you likely have excess air. If O₂ is low but CO is elevated, you may have incomplete combustion even if the stack temperature looks “fine.”
Step 3: Measure Steam Output and Feedwater Conditions
Measure steam flow using a calibrated flowmeter or validated mass balance. Confirm feedwater flow and temperature. If condensate return is involved, ensure the measured feedwater temperature reflects what actually enters the boiler.
Useful nuance: If blowdown is significant, treat it consistently. Blowdown carries enthalpy out of the boiler and reduces net useful output.
Step 4: Compute Useful Heat and Losses
A common approach is to compute boiler efficiency from the energy in the fuel versus the energy gained by the water/steam.
Useful heat (conceptual)
- Useful output = enthalpy rise from feedwater to steam, times steam flow
- Adjust for blowdown enthalpy leaving the system
Loss categories (conceptual)
- Stack loss: hot flue gas leaving with sensible heat
- Combustion loss: incomplete combustion (often indicated by CO)
- Radiation loss: heat lost from the boiler casing
- Blowdown loss: enthalpy carried out
- Unaccounted loss: small items that don’t fit neatly
Step 5: Interpret Results with Evidence
Suppose your test yields:
- Gross boiler efficiency (based on HHV): 82.0%
- Stack loss: 12.0%
- Blowdown loss: 2.0%
- Radiation and other losses: 4.0%
Now interpret. If stack loss is the largest contributor, look first at flue gas temperature and excess air. If blowdown loss is high, check blowdown control strategy and water quality stability.
Example reasoning
- Measured flue gas temperature is higher than expected at the same load.
- O₂ is higher than target.
- CO is low.
That combination points toward excess air and/or reduced heat transfer (for example, fouling). You would then verify heat transfer health by comparing measured stack temperature trends against historical clean-tube baselines.
Step 6: Mind Map for Test Logic
Boiler Performance Test Interpretation Mind Map
Step 7: Practical “What to Do Next” Checklist
Use the test results to guide targeted actions, not random adjustments.
- If O₂ is high and CO is low: verify air damper position, burner tuning, and air leaks.
- If stack temperature is high with normal O₂: investigate heat transfer surfaces and soot/scale indicators.
- If CO is present: inspect ignition stability, fuel atomization, and burner alignment.
- If blowdown loss is high: confirm water quality control and blowdown setpoints.
Step 8: Document the Test So It Stands Up to Scrutiny
Record the measurement locations, instrument calibration status, sampling duration, and the exact operating window used for averaging. Efficiency without context is just a number; efficiency with a clear boundary and evidence is a tool.
10. Maintenance, Inspection, and Reliability Practices
10.1 Inspection Planning: Internal and External Boiler Surveys
Inspection planning is the part of boiler operation that quietly prevents the loud problems. A good plan links three things: what you must verify, how you will verify it, and when you will do it so the results are still useful.
Foundations of Inspection Planning
Start by defining the boiler’s “inspection envelope.” That includes the boiler type, design pressure and temperature, fuel and firing method, operating hours, typical load swings, and known risk drivers such as soot buildup, water chemistry sensitivity, or cycling frequency. Then map the inspection goals to failure mechanisms: corrosion, erosion, cracking, overheating, leakage, and fouling. Each goal should point to a measurable evidence type, such as thickness readings, visual condition, NDT results, or instrument calibration records.
A practical rule: if an inspection result cannot change a decision, it is probably not worth the outage time. For example, a quick external walkdown that only confirms “no obvious leaks” is useful for safety, but it does not replace internal thickness measurements where corrosion is the main concern.
External Surveys and What They Should Catch
External inspection focuses on the boiler’s boundaries and support systems. Walk the unit and verify:
- Furnace and casing condition: look for insulation wetting, missing lagging, corrosion at seams, and signs of hot spots from uneven draft.
- Burner and combustion hardware: check alignment, refractory condition, and soot patterns that hint at poor air-fuel mixing.
- Piping and valves: confirm insulation integrity, valve leakage, and abnormal vibration indicators.
- Safety devices and controls: verify blowdown discharge routing, gauge glass condition, and that safety valves are accessible and not obstructed.
Use a consistent checklist so findings are comparable across outages. Record location, severity, and likely cause. If you find a recurring soot pattern at the same pass, treat it as a combustion tuning issue first, not a “mystery dirt” issue.
Internal Surveys and How to Plan the Access
Internal inspection verifies the heat transfer and pressure boundary surfaces. Plan access so the inspection is thorough without turning the outage into a scavenger hunt.
- Schedule around chemistry and cleaning: if you expect deposits, plan cleaning so you can see base metal condition. Inspecting through heavy scale is like reading a report with the ink smeared.
- Define inspection zones: typically include furnace walls, generating bank tubes, superheater/reheater sections, economizer tubes, steam drum internals, and manway areas.
- Select evidence methods: thickness measurements, visual examination, and NDT where warranted. Use NDT to confirm suspected cracking or to extend coverage when visual access is limited.
A systematic approach is to start with visual evidence to identify hotspots, then apply targeted thickness and NDT to confirm severity. This reduces unnecessary measurements while still covering the risk.
Mind Map: Inspection Planning Workflow
Decision Thresholds and Documentation
Inspection planning should include decision thresholds before the outage. Define what triggers repair, rerating, or additional testing. For instance, thickness readings should be interpreted against minimum allowable thickness and corrosion allowance, not just compared to the last outage. If you lack a clear threshold, you risk “collecting data” without making a decision.
Documentation must be traceable: each finding should link to a location reference, measurement method, instrument calibration status, and photo or sketch evidence. If multiple teams inspect the same zone, standardize how they label locations so results can be merged without guesswork.
Example: A Two-Stage Outage Plan
Consider a water-tube boiler that runs daily with frequent load changes. The plan can be staged:
- Stage 1: External survey during operation: verify insulation condition, burner flame pattern indicators, and check for visible leaks. If soot patterns suggest poor combustion, schedule cleaning before internal access.
- Stage 2: Internal survey at outage: inspect furnace walls and generating bank first visually, then perform thickness measurements on identified hotspots. Apply NDT only where visual or thickness results indicate cracking risk.
This approach prevents the common failure mode of spending time measuring everywhere equally, even where the evidence says the risk is concentrated.
Case Study: Using Prior Findings to Focus Coverage
A boiler previously showed localized tube thinning near a specific pass. The next inspection plan should not treat that area as “just another tube.” Instead, predefine a focused measurement grid for that zone, confirm whether the operating conditions that caused the thinning still exist, and check whether repairs changed the flow path. If the thinning pattern shifts after a burner adjustment, the inspection plan should shift too, because the boiler is telling you where the problem moved.
10.2 Tube and Component Integrity: Thickness, Corrosion, and Wear Mechanisms
Tube integrity is where “theory meets metal.” Thickness loss, corrosion, and wear all reduce the margin between safe operation and a failure mode. The goal of inspection is not just to find damage, but to interpret what mechanism caused it so the next inspection targets the right locations.
Core Integrity Concepts
Start with three measurable realities: wall thickness, material condition, and operating environment. Wall thickness sets the remaining load-bearing capacity. Material condition captures changes like loss of protective oxide, microstructural degradation, or cracking. Operating environment includes chemistry, temperature, flow velocity, and how often the system cycles between hot and cold.
A practical way to think about integrity is “damage rate × exposure.” Corrosion rate depends on water chemistry and temperature; wear rate depends on flow regime and particle content. If you change feedwater treatment or operating load profile, you change the exposure.
Thickness Loss Mechanisms
Thickness loss usually comes from corrosion, but it can also come from mechanical removal. The most common corrosion-driven patterns in boiler tubes include general thinning, localized pitting, and under-deposit attack. General thinning is often slow and widespread, while pitting and under-deposit corrosion are faster locally and can create sharp stress concentrators.
Localized thinning often correlates with flow distribution. Tubes that see lower circulation or poor mixing can develop stagnant chemistry layers. Those layers can become more aggressive, especially when deposits trap heat and reduce oxygen transport.
Corrosion Mechanisms and Their Signatures
Corrosion is rarely random. It leaves signatures you can match to conditions.
- Oxygen corrosion tends to be associated with poor deaeration and high dissolved oxygen. It often shows up as general corrosion and early roughness.
- Under-deposit corrosion occurs when scale or sludge forms and traps corrosive species. The deposit acts like a blanket that changes local chemistry and heat transfer.
- Caustic corrosion is linked to high alkalinity and poor control of boiler water chemistry. It can be associated with high pH near the metal surface.
- Acid attack is more typical when condensate return is contaminated or when there is carryover of acidic species.
- Sulfidation and high-temperature corrosion can occur on fireside surfaces where sulfur compounds react with hot metal.
A useful inspection mindset is to connect “where you see it” with “what the environment is doing there.” If damage is concentrated near bends, headers, or areas with known flow maldistribution, wear and flow-assisted corrosion become more likely.
Wear Mechanisms and Their Drivers
Wear is about relative motion and particle energy. In boiler systems, wear commonly involves:
- Erosion by entrained solids in high-velocity steam or water regions. You often see thinning on the direction-of-flow side.
- Fretting where components experience small oscillatory motion, such as tube supports or contact points.
- Flow-accelerated corrosion in areas where water chemistry and velocity combine to remove protective films.
Wear tends to create smoother, directional damage compared to corrosion, which often produces rough, irregular surfaces. That distinction is not absolute, but it helps you choose the right follow-up checks.
Thickness Measurement and Interpretation
Thickness measurement is only half the job; interpretation is the other half. Use measurement grids that reflect heat flux and flow paths, not just a convenient sampling pattern. Compare measured thickness to the design minimum and to baseline readings from prior outages.
When you calculate remaining life, avoid treating all thinning as uniform. If you see a localized hotspot, report it as a localized risk area with a mechanism hypothesis. For example, a small region of rapid thinning near a deposit-heavy zone points toward under-deposit corrosion rather than general corrosion.
Mind Map: Integrity Workflow
Example: Interpreting a Localized Thinning Spot
Suppose thickness measurements show a 20% reduction in a narrow band on several tubes near a header, while neighboring tubes remain near baseline. If the band aligns with a known flow impingement region and the surface looks smoother with a directional pattern, wear-assisted thinning is a strong candidate. If the same band also has visible deposits, under-deposit corrosion becomes more likely, because deposits can both trap corrosive species and change local heat transfer.
A good next step is to verify the mechanism with two checks: (1) confirm whether deposit thickness or sludge accumulation is higher at the same locations, and (2) compare thinning rate against chemistry and operating conditions during the period the damage likely developed. Then the corrective action should match the mechanism: cleaning and chemistry control for under-deposit corrosion, and flow distribution or support alignment for wear.
Example: Distinguishing General Thinning from Pitting
If you observe widespread mild thinning across many tubes with no strong localization, general corrosion or flow-accelerated corrosion may be responsible. If instead you see small pits with relatively small average thickness loss but deep local metal loss, pitting corrosion is likely. Pitting can be more dangerous than average thinning because a few pits can create high local stress and crack initiation sites.
In both cases, the inspection report should include not only average thickness but also the worst-case locations and the pattern description. That turns the inspection from a number into a mechanism-based decision.
10.3 Cleaning Methods: Sootblowing, Water Washing, and Tube Cleaning
Boiler heat-transfer surfaces lose performance when deposits form. Sootblowing targets loose, dry deposits on fire-side surfaces; water washing targets soluble or water-washable residues; tube cleaning addresses stubborn fouling on waterside or fireside tubes when routine measures are not enough. The key is to match the cleaning method to the deposit type and to avoid trading one problem for another, like eroding tubes or driving contaminants deeper into crevices.
Deposit Types and What They Call For
Start with a simple classification based on where the deposit sits and how it behaves.
- Fire-side soot and ash: typically dry, low-density, and removable by impact and airflow.
- Water-side scale and sludge: typically mineral or corrosion products that require chemical or mechanical removal.
- Mixed deposits: soot plus ash can become cemented by moisture and combustion byproducts, making sootblowing less effective.
A practical rule: if the deposit is dry and loosely attached, sootblowing is usually the first tool. If it is soluble or can be flushed away, water washing helps. If it is hard, adherent, or unevenly distributed, tube cleaning (often mechanical) becomes necessary.
Sootblowing: How to Remove Fire-Side Deposits Without Making New Ones
Sootblowers use steam or air jets to dislodge deposits from furnace walls, superheater panels, and economizer surfaces. The goal is to remove deposits into the ash-handling path, not to redistribute them into cooler areas.
Core practices
- Clean in the right sequence: start where deposits tend to build first, then move to downstream surfaces. This reduces the chance that dislodged material lands on already-cleaned areas.
- Use controlled blow intervals: frequent short blows often work better than rare long ones because they prevent deposits from becoming firmly baked.
- Coordinate with combustion: if sootblowing is compensating for poor combustion, you will spend time cleaning while the root cause keeps generating new deposits.
Easy example: If a boiler’s stack oxygen is stable but efficiency is drifting down, inspect sootblower effectiveness. If sootblower cycles are too infrequent, deposits can bridge between tubes and become harder to remove. Increasing blow frequency while keeping combustion tuned often restores heat transfer without aggressive mechanical cleaning.
Water Washing: Flushing Away Water-Washable Residues
Water washing is most effective when deposits are water-soluble or loosely bound. It is commonly used after sootblowing to remove fine ash that remains after impact cleaning.
Core practices
- Plan the wash so runoff has a path: washing without a controlled drainage route can spread residue to areas that were previously cleaner.
- Use appropriate water quality: washing water should not introduce new hardness or oxygen-driven corrosion risks. Even a good wash can cause trouble if the water chemistry is poor.
- Verify results with performance checks: after washing, compare steam temperature, pressure stability, and draft behavior to confirm that heat transfer improved.
Easy example: After a sootblower overhaul, a plant sees improved furnace appearance but still measures higher flue gas temperature. A targeted water wash on the affected pass can remove remaining fine ash, lowering flue gas temperature without changing tube geometry.
Tube Cleaning: When Routine Methods Are Not Enough
Tube cleaning is used when deposits are hard to remove by sootblowing or washing. It can be mechanical (scraping, brushing), hydraulic (high-pressure flushing), or chemical on waterside systems, depending on boiler design and safety constraints.
Core practices
- Inspect before you clean: measure deposit thickness or inspect representative tube sections to avoid unnecessary aggressive cleaning.
- Protect tube integrity: mechanical methods must match tube material and wall thickness. Over-aggressive brushing can thin tubes and create leak paths.
- Control access and containment: cleaning can release debris. Use proper isolation so ash and sludge do not contaminate other equipment.
Easy example: If economizer outlet temperatures remain high after sootblowing and water washing, inspect a small set of tubes. If deposits are thick and uneven, high-pressure hydraulic cleaning on the affected pass can remove the stubborn layer while limiting work to the problem area.
Mind Map: Cleaning Methods and Decision Logic
Integrated Workflow: From Diagnosis to Verification
A systematic approach keeps cleaning from becoming a guessing game. First, identify where performance loss is coming from by checking flue gas temperature trends, draft behavior, and steam temperature/pressure stability. Next, choose the least aggressive method that matches the deposit type: sootblowing for dry fire-side deposits, water washing for water-washable residues, and tube cleaning for hard adherent fouling. Finally, verify with measurable indicators such as reduced flue gas temperature, improved heat transfer consistency, and stable operation during load changes. This closes the loop: cleaning improves performance, and the results help confirm whether combustion and water chemistry controls are doing their job.
10.4 Maintenance of Valves, Traps, Pumps, and Actuators
Maintenance works best when you treat each device as part of a system: valves control flow and pressure, traps remove condensate, pumps move water and feedwater, and actuators translate control signals into motion. The goal is consistent performance with predictable failure modes, not heroic repairs.
Core Maintenance Principles
Start with three basics: correct identification, clean access, and documented baselines. Identify the valve or trap type, pressure/temperature rating, and connection standard before touching anything. Clean the exterior so you can see leaks, corrosion, and misalignment. Then record baseline behavior: valve stroke time, trap discharge pattern, pump vibration level, and actuator travel limits.
A practical rule: if you cannot explain how the device is supposed to behave during normal operation, you cannot maintain it. For example, a steam trap that “mostly stays closed” may be failing closed, but it could also be undersized for the condensate load.
Valves Maintenance
Valves fail in repeatable ways: leakage past seats, sticking due to deposits, erosion from high-velocity flow, and actuator-related issues like slow stroking.
Begin with external checks: packing leaks, flange gasket seepage, and signs of thermal cycling such as paint cracking near joints. Next, verify actuator alignment and linkage freedom. For control valves, confirm that the positioner feedback matches the command; a mismatch often shows up as hunting or oscillation.
Seat leakage is commonly caused by debris or wear. A simple example is a globe valve on a steam line that starts weeping after maintenance on upstream strainers. The likely cause is a loosened piece of scale or gasket material. Maintenance should include strainer inspection and flushing procedures before returning the valve to service.
For safety relief valves, maintenance focuses on set pressure verification, lift inspection, and ensuring discharge paths are unobstructed. Even a “small” obstruction can change backpressure and cause nuisance lifting.
Steam Traps Maintenance
Traps fail either by passing steam (failed open) or failing to discharge condensate (failed closed). The maintenance approach depends on trap type, but the logic is the same: observe, test, and correct.
Start with visual and auditory checks where safe: a failed-open trap often sounds like continuous venting. Then use appropriate testing methods such as temperature checks across the trap body or timed discharge observation. Record results in a consistent format so you can compare trends.
Example: a thermostatic trap on a process header shows intermittent discharge. If the inlet temperature is high but the outlet remains cold, the trap may be stuck closed or the condensate is bypassing due to a leaking upstream valve. Maintenance should include checking isolation valves and verifying that the trap is installed with correct orientation.
Pumps Maintenance
Pumps fail through seal leakage, bearing wear, cavitation, misalignment, and poor suction conditions. Maintenance should start at the suction side because many “mysterious” failures are really inlet problems.
Check suction pressure margin, strainers for blockage, and suction line insulation integrity. Cavitation signs include noise, vibration spikes, and fluctuating discharge pressure. A common example is a condensate return pump that begins to cavitate after a strainer basket is cleaned but reinstalled with a partially blocked mesh.
Seal maintenance should be systematic: verify seal flush flow or barrier fluid (as applicable), inspect for dry running, and confirm correct lubrication where relevant. For mechanical seals, small leaks can become large quickly if the seal faces overheat.
Alignment is a frequent root cause. If you see increased vibration after a coupling or base adjustment, re-check alignment and confirm that the pump is not being forced by piping.
Actuators Maintenance
Actuators include electric, pneumatic, hydraulic, and spring-return devices. They fail through air supply issues, electrical faults, linkage wear, and limit switch misadjustment.
For pneumatic actuators, inspect air quality and dryness. Water in the air line can cause corrosion and sluggish movement. A simple example: a control valve that takes longer to close than to open may have a restricted exhaust port or a sticky spool in the positioner.
For electric actuators, verify power supply stability, check motor current draw during travel, and confirm that limit switches or position feedback are calibrated. If the valve reaches the limit but the controller still commands motion, the feedback signal may be drifting.
Mind Map: Maintenance Workflow
Integrated Example: Restoring a Condensate Return Loop
A condensate return system shows rising condensate level in a tank and frequent pump starts. Maintenance begins by checking the steam trap on the steam tracing line: the trap outlet is cold while inlet is hot, suggesting failed-closed behavior. After replacing the trap, the pump starts become less frequent, but vibration remains elevated.
Next, the team inspects the pump suction strainer and finds debris from recent work on upstream piping. After cleaning the strainer and verifying suction pressure margin, vibration drops to baseline. Finally, the actuator on the discharge check valve is checked for correct travel and limit feedback, preventing partial closure that can cause pressure pulsations.
Practical Checklists That Prevent Rework
Use short, repeatable checklists:
- Valves: seat condition indicators, actuator stroking time, packing leak status, strainer condition upstream.
- Traps: inlet/outlet temperature or discharge observation, correct orientation, upstream isolation valve integrity.
- Pumps: suction strainer cleanliness, vibration trend, seal flush/flush flow, alignment after any mechanical work.
- Actuators: air supply dryness, electrical current draw, limit calibration, linkage freedom.
A good maintenance record includes what was observed, what was changed, and what was verified. That turns maintenance from a series of tasks into a controlled process—less guesswork, fewer repeat failures, and a system that behaves the same way the next time you need it.
10.5 Practical Example: Developing a Preventive Maintenance Checklist for Boiler Systems
A preventive maintenance checklist works best when it is tied to how the boiler actually fails: heat transfer gets worse, water chemistry drifts, controls misread, and components wear out where flow and temperature are harshest. The goal is not to “do everything,” but to do the right checks at the right frequency, with clear acceptance criteria.
Step 1: Define the Maintenance Scope
Start by listing the boiler’s major subsystems and what “healthy” looks like for each.
- Combustion train: burner, igniter, flame scanner, air and fuel valves, draft control.
- Heat transfer surfaces: furnace walls, tube banks, economizer, superheater.
- Water side: feedwater, deaerator, pumps, steam drum internals, blowdown valves.
- Steam side: separators, steam traps, main stop and control valves.
- Controls and safety: sensors, interlocks, burner management system, relief devices.
- Auxiliaries: sootblower, insulation, fans, dampers, lube systems.
A practical rule: every checklist item should map to a failure symptom you’ve seen before, such as low efficiency, carryover, frequent trips, or abnormal pressure/temperature behavior.
Step 2: Choose Frequencies That Match Wear Mechanisms
Use a tiered cadence.
- Daily/shift: observations that catch drift early (flame stability, unusual sounds, abnormal readings).
- Weekly/monthly: checks that verify trends (draft stability, trap performance, blowdown operation).
- Quarterly/annual: deeper inspections and measurements (tube condition, calibration verification, combustion tuning).
- Per outage: work that requires access and safe isolation (tube cleaning, repairs, internal inspections).
Step 3: Write Each Checklist Item with Evidence
Each line should include three parts: what to check, how to check, and what result is acceptable.
Mind Map: Preventive Maintenance Checklist Structure
Step 4: Build the Checklist with Concrete Examples
Below is a usable starter checklist. Adjust thresholds to your boiler design, operating pressure, and water chemistry program.
Daily or Each Shift
- Flame stability: confirm steady flame signal and no nuisance burner resets. Acceptable: no trip events; flame signal within normal band.
- Steam pressure and drum level behavior: watch for oscillation. Acceptable: stable control response without hunting.
- Blowdown indication: verify blowdown valve position and that blowdown is not stuck. Acceptable: valve returns to commanded position after cycle.
- Condensate return health: check for cold spots or abnormal condensate temperatures at key headers. Acceptable: no persistent temperature drop suggesting failed traps.
- Visible leaks and insulation condition: look for water/steam leaks around valves, flanges, and drains. Acceptable: no active leakage; insulation intact where accessible.
Weekly or Monthly
- Sootblower operation: run through a cycle and verify airflow/steam supply to the sootblower. Acceptable: cycle completes; no abnormal pressure drop.
- Draft and excess air trend: compare O2/CO readings to recent baseline. Acceptable: O2 not drifting upward without reason; CO remains low and stable.
- Steam trap inspection: test representative traps using temperature or sound checks. Acceptable: traps show correct discharge behavior; no group of failed traps.
- Feedwater strainers and filters: inspect differential pressure or clean if required. Acceptable: DP within target; no bypassing.
- Gauge and transmitter sanity: compare local gauge to control room reading. Acceptable: within calibration tolerance.
Quarterly or Annual
- Combustion tuning: verify burner settings, linkage, and air register positions. Acceptable: stable combustion with acceptable stack losses and no recurring flame faults.
- Safety interlock proof testing: confirm trip setpoints and logic sequence per procedure. Acceptable: interlocks actuate correctly; no unexpected bypasses.
- Water treatment verification: review test results for oxygen control, alkalinity/phosphate targets, and conductivity trends. Acceptable: chemistry within program limits; no persistent excursions.
- Internal inspection planning: schedule drum internals and separator checks based on run hours and prior findings. Acceptable: inspection intervals align with observed carryover risk.
Per Outage
- Tube inspection and cleaning: inspect for scaling, pitting, and tube wall thinning where accessible. Acceptable: defects within allowable limits; cleaning removes deposits without damaging surfaces.
- Valve and actuator overhaul: inspect seats, stems, and packing on critical control and blowdown valves. Acceptable: smooth stroke, no seat leakage beyond limits.
- Relief devices and pressure parts: verify condition and documentation completeness. Acceptable: devices meet inspection requirements and records are current.
Step 5: Add a Simple Documentation and Review Loop
Record readings in a consistent format, then review patterns. If you see the same issue twice—like repeated high O2 or recurring trap failures—update the checklist: increase frequency, tighten acceptance criteria, or add a targeted inspection step.
Mind Map: A Checklist Item from Symptom to Action
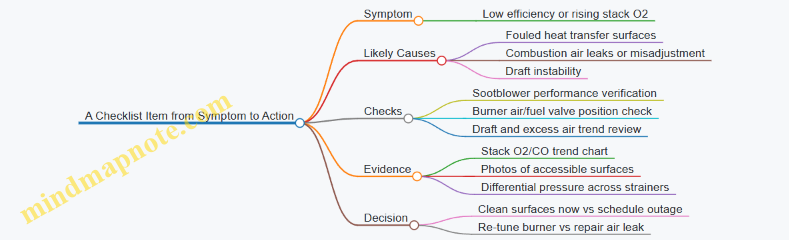
A good checklist feels boring in use: it tells you what to look at, how to confirm it, and what result means “keep running” versus “stop and fix.” That’s the point—boring reliability beats heroic troubleshooting.
11. Failure Modes, Troubleshooting, and Root Cause Analysis
11.1 Common Operational Problems: Low Steam Quality, Poor Combustion, and Instability
Low steam quality, poor combustion, and unstable operation often show up as “symptoms” on gauges and alarms, but they usually share a root: the boiler is not delivering the right energy to the right place at the right time. The goal of troubleshooting is to separate what the boiler is doing from what the system is demanding.
Mind Map: Operational Problem Map
Low Steam Quality
Low steam quality means the steam leaving the boiler contains too much liquid water. In practice, you’ll see wet steam at the outlet, higher-than-expected steam consumption in downstream equipment, and sometimes water hammer in condensate lines.
Start with the simplest check: confirm whether the boiler is actually producing wet steam or whether the distribution system is causing the appearance. If steam traps are failing or condensate is backing up, downstream equipment can look “wet” even when the boiler is fine.
If the issue is truly inside the boiler, the usual culprits are water carryover and poor separation. Foaming is a common driver; it often follows chemistry drift, such as high dissolved solids or incorrect alkalinity control. A practical example: a plant switches to a different makeup water source, and within a day the boiler’s blowdown rate is reduced to “save water.” The drum level may still look normal, but the steam quality drops because the foam layer thickens and droplets escape with the steam.
Next, verify drum level control behavior. If the level controller is oscillating, the steam-water interface moves, and separation becomes inconsistent. A good operational practice is to compare level trends with steam demand. When load ramps quickly, the feedwater valve can lag, and the drum can briefly run too high.
Poor Combustion
Poor combustion shows up as high stack losses, unstable flame signals, soot deposits, and sometimes corrosion from incomplete combustion products. The fastest path to clarity is to treat combustion as an air-fuel matching problem.
For oil-fired burners, atomization quality matters. A simple example: a burner that was tuned for a specific fuel viscosity starts using a slightly colder supply, increasing viscosity and reducing droplet breakup. The result is incomplete combustion, higher smoke, and faster fireside fouling, which then reduces heat transfer and worsens efficiency.
For gas-fired burners, pressure and flow stability are key. If gas pressure fluctuates, the burner may alternate between too rich and too lean operation. Too rich operation increases carbon monoxide and soot; too lean operation can raise excess air and cool the flame, also reducing heat transfer.
Draft and pressure control tie the room together. If there is a duct leak or a damper that sticks, the burner may receive the wrong air flow even when the control system “thinks” it is correct. A practical check is to observe trends: when oxygen or CO changes while fuel flow stays steady, the air path is likely the problem.
Instability
Instability is when the boiler cannot hold steady conditions, causing hunting in pressure, level, or burner firing rate. It is often a control interaction rather than a single component failure.
A common pattern is feedwater pressure and steam pressure loops fighting each other. Example: the feedwater control valve is tuned aggressively, so it responds quickly to steam pressure changes. But steam pressure changes are also caused by combustion variations. The result is oscillation: combustion shifts, steam pressure moves, feedwater valve overcorrects, and the cycle repeats.
Measurement errors can mimic instability. A level transmitter that is slow or intermittently noisy can cause the controller to “chase” a moving signal. Similarly, an oxygen sensor with drift can mislead combustion control, leading to repeated modulation swings.
Finally, mechanical constraints can force instability. If the feedwater pump is cavitating or a strainer is partially plugged, the valve may open but flow does not increase as expected. The controller then keeps demanding more, which can destabilize drum level and steam pressure.
Integrated Troubleshooting Sequence
- Confirm the symptom category: wet steam indicators for quality, stack and flame indicators for combustion, and oscillation patterns for instability.
- Separate boiler-side from system-side effects by checking steam traps, condensate return behavior, and downstream water hammer reports.
- For low steam quality, verify drum level stability and chemistry indicators, then inspect separation internals if carryover persists.
- For poor combustion, correlate fuel flow stability with oxygen/CO trends and check draft/air path integrity.
- For instability, review control loop interactions and measurement signal quality before adjusting setpoints.
When you follow this sequence, you avoid the common trap of “fixing” combustion when the real issue is feedwater flow, or adjusting feedwater when the real issue is a draft leak. The boiler is a system; your troubleshooting should be one too.
11.2 Water Chemistry Failures: Carryover, Foaming, and Scaling Symptoms
Boiler water chemistry failures usually show up first as “steam-side” symptoms: wet steam, unstable drum level, rising blowdown, or a sudden change in combustion efficiency. The trick is to connect those symptoms back to what’s happening in the water and steam space, then confirm with sampling and inspection.
Foundational Concepts That Explain the Symptoms
Boiler water is not just water; it’s a controlled mixture of dissolved salts, alkalinity species, and suspended solids. When the concentration of dissolved and suspended material rises too far, the boiler can no longer keep the steam dry. Two mechanisms dominate:
- Carryover happens when water droplets or fine liquid mist leave the drum with the steam. Even a small amount can coat superheater tubes and turbine blades, increasing erosion and corrosion risk.
- Foaming is a stable froth on the water surface that traps liquid and sends it upward. Foaming is often driven by specific contaminants and high surface activity.
- Scaling is deposition on heat transfer surfaces, typically from hardness salts and silica. Scaling reduces heat transfer, raising fuel use and tube metal temperatures.
Mind Map: Water Chemistry Failure Pathways
Carryover Symptoms and How to Confirm Them
Typical symptoms include wet steam indicators, increased steam line erosion, and superheater outlet temperature drifting upward under the same firing rate. Operators may also notice drum level behaving oddly during load swings.
Easy checks:
- Compare blowdown rate changes to drum level stability. If blowdown was reduced to “save water,” carryover risk often increases.
- Inspect steam separators and demisters during outages. If internals are fouled or damaged, separation efficiency drops.
- Look for evidence of deposits on superheater inlet regions. Carryover deposits often appear as wet, sticky films rather than hard scale.
Example: A plant reduces blowdown to meet a water-use target. Within a week, the turbine inlet steam quality worsens and superheater tube deposits increase. Drum level control still “looks normal,” but the steam quality measurement shows a consistent wetness shift. The water analysis reveals total dissolved solids trending upward faster than expected, consistent with carryover.
Foaming Symptoms and How to Confirm Them
Foaming tends to show up as persistent drum level fluctuations and a “spongy” water surface that doesn’t clear after load stabilization. Steam may remain visually clear at first, but quality still degrades because the foam carries liquid droplets.
Common causes include:
- Oil and grease from condensate return leaks or poor housekeeping.
- Organics that survive filtration and pass into the boiler.
- High alkalinity that encourages stable foam formation.
- Silica and certain anions that increase surface activity.
Easy checks:
- Perform a quick visual inspection of water samples in a clean container. Persistent foam after gentle agitation is a strong clue.
- Review condensate return history. A small leak from a lubricated system can introduce oil without obvious flow alarms.
- Correlate foaming episodes with chemical additions. If a treatment change increased alkalinity or introduced a new polymer, foaming may follow.
Example: During a production shift, a condensate pump seal begins to leak. The boiler continues to receive “clean-looking” condensate, but foaming starts within days. Drum level becomes harder to control, and blowdown increases temporarily. Water tests show elevated organics and a higher alkalinity trend, aligning with foam formation.
Scaling Symptoms and How to Confirm Them
Scaling is the slow, stubborn one. It often presents as efficiency loss: higher stack temperature for the same steam output, increased fuel consumption, and sometimes higher economizer or superheater approach temperatures. Tube metal temperatures can rise even when steam pressure is controlled.
Where it shows up:
- Economizer and evaporator areas for hardness-related scale.
- Superheater and high-heat-flux regions for silica and mixed deposits.
Easy checks:
- Track heat transfer performance indicators: if steam generation rate stays constant but firing rate rises, fouling is likely.
- Compare blowdown and feedwater softening performance. Scaling often follows inadequate hardness removal.
- During inspection, distinguish hard, adherent scale from carryover films. Scale is typically brittle and tightly bonded.
Example: A boiler experiences gradual efficiency decline over several weeks. Blowdown had been held steady, but feedwater hardness spikes after a softener regeneration issue. Inspection later shows hard deposits concentrated on heat transfer surfaces, and the deposit chemistry matches calcium carbonate and related compounds.
Integrated Response: From Symptom to Root Cause
When carryover, foaming, or scaling appears, treat it like a chain, not a guessing game:
- Confirm the symptom with steam quality, drum level behavior, and performance trends.
- Check the water side using targeted sampling for dissolved solids, alkalinity, hardness, silica, and organics.
- Verify operational contributors such as load surging, blowdown strategy, and drum level setpoints.
- Inspect internals and surfaces to separate droplet carryover films from hard scale.
A good outcome is not “the boiler runs again,” but “the mechanism is identified and controlled.” That’s how you stop the same failure from returning with a different label.
11.3 Mechanical and Hydraulic Issues: Circulation Problems and Plugging
Steam boilers depend on a reliable path for water and steam to move through the heating surfaces. When that path degrades, you get symptoms that look like “combustion problems” or “water chemistry problems,” even though the root cause is mechanical or hydraulic. The goal is to connect observable behavior—pressure swings, uneven heating, abnormal drum levels—to the physical flow paths that create them.
Foundational Concepts of Circulation
In drum boilers, circulation is driven by density differences: hotter, less-dense water rises; cooler, denser water returns. This natural circulation can be supported by forced circulation pumps in some designs. Either way, the system needs three things to work well: a stable driving head, adequate flow area, and minimal flow resistance variation.
A practical way to picture it is to imagine a loop of garden hose with a kink. The pump (or density difference) may still move water, but the kink forces higher velocity through the remaining area, increasing pressure drop and encouraging local boiling. Local boiling increases vapor fraction, which further reduces density and can destabilize the loop.
How Plugging Forms and Why It Matters
Plugging is a reduction of effective flow area inside tubes, headers, economizers, or circulation passages. It often starts as a deposit that grows where velocity is lower or where heat flux is higher. Common contributors include:
- Scale and corrosion products that build up on internal surfaces.
- Sludge and carryover that settle in low-velocity regions.
- Soot and ash on the outside surfaces that raise tube metal temperatures, indirectly worsening internal deposition.
- Mechanical restrictions such as damaged tube ends, partially blocked strainers, or misaligned baffles.
Plugging matters because it changes the hydraulic balance. Flow that used to distribute across multiple parallel tubes now concentrates in fewer tubes, which increases local heat flux and can lead to overheating, tube distress, and unstable steam generation.
Symptoms That Point Toward Circulation Problems
Circulation issues rarely announce themselves as “circulation.” Instead, they show up through patterns:
- Uneven steam generation: one bank or pass produces steam earlier, causing drum level oscillations.
- Abnormal pressure drop across economizers or headers.
- Frequent trips related to low water level, high steam pressure, or flame instability that coincides with load changes.
- Slow recovery after load increases: the boiler struggles to supply steam because flow distribution cannot keep up.
A useful operating check is to compare behavior during steady firing versus rapid load changes. If the problem appears mainly during transients, flow distribution and circulation stability are prime suspects.
Diagnostic Mind Map
Mechanical and Hydraulic Issues Mind Map
Systematic Troubleshooting Approach
Start with the simplest measurements that reflect hydraulic behavior. Differential pressure across key components is often more informative than absolute pressure.
- Confirm the operating state: verify firing rate, feedwater flow, and control valve positions. A “mechanical” suspicion can be caused by a control valve that is not fully opening.
- Check differential pressure trends: compare current readings to baseline values from similar operating conditions. A gradual rise in economizer or header ΔP suggests progressive restriction.
- Look for distribution imbalance: if the boiler has multiple tube banks or passes, compare steam temperature/pressure behavior across load. Uneven response suggests plugging in a subset of parallel paths.
- Inspect for external fouling: soot and ash raise tube metal temperatures, which can accelerate internal deposition. If ΔP is stable but performance is degrading, external fouling may be the driver.
- Plan internal inspection strategically: when opening the boiler, target areas known for low velocity or high heat flux. Random inspection wastes time and misses the likely restriction zone.
Concrete Examples of Plugging and Circulation Instability
Example 1: Economizer restriction during steady operation
A plant sees rising economizer differential pressure over several weeks while feedwater temperature and firing rate remain consistent. Steam pressure control becomes sluggish, and drum level shows small oscillations. The likely mechanism is internal deposition reducing economizer flow area. The fix is to clean the economizer and verify water treatment effectiveness, then re-establish a baseline ΔP after return to stable operation.
Example 2: Tube bank plugging triggered by load increases
During load ramps, the boiler trips on low water level even though the feedwater control loop appears normal. After inspection, one tube bank shows heavier deposits and discoloration. The restriction reduces flow distribution capacity, so that bank reaches higher vapor fraction earlier, destabilizing circulation. Cleaning restores flow area, and the operator also adjusts blowdown and sampling practices to reduce deposit formation.
Example 3: Mechanical obstruction in a strainer
A strainer upstream of a circulation-related feed line partially blocks with debris. The boiler runs at reduced load but becomes unstable at higher firing rates. Differential pressure across the strainer increases, and the circulation loop cannot maintain the required flow distribution. Cleaning the strainer resolves the instability, and the maintenance plan adds inspection intervals aligned with observed debris generation.
Practical Takeaways for Operators and Maintenance
Treat circulation stability as a system property, not a single-component problem. When you see abnormal differential pressures, uneven response across load, or level oscillations tied to transients, prioritize hydraulic evidence first. Plugging is often localized, so inspection strategy should follow the flow path logic rather than the calendar.
11.4 Control and Instrumentation Faults Miscalibration and Sensor Drift
Control systems for boilers are only as good as the measurements feeding them. Miscalibration and sensor drift create believable lies: the controller thinks everything is fine while the process quietly moves away from target. The result is usually not a single dramatic failure, but a pattern of small deviations that grow into trips, poor efficiency, or damaged equipment.
Foundational Concepts of Measurement Error
A sensor measures a physical variable, then converts it into a signal the controller can use. Two error sources matter most here. Miscalibration is a wrong mapping between the real variable and the sensor output, often introduced during installation, replacement, or maintenance. Sensor drift is a gradual change in that mapping over time due to aging, contamination, mechanical stress, or thermal cycling.
A useful mental model is to separate three layers: the process variable (like steam pressure), the sensor output (like a 4–20 mA signal), and the control action (like opening a feedwater valve). If the sensor output is biased, the controller applies the wrong action with confidence.
How Miscalibration Shows Up in Boiler Control Loops
Pressure and level loops are especially sensitive because they directly affect safety and water balance.
- Steam pressure miscalibration: If the pressure transmitter reads 0.5 bar low, the controller will keep demanding more fuel or more steam generation. Operators may notice frequent valve hunting or higher-than-expected firing rates.
- Drum level miscalibration: If level reads low, the feedwater valve opens more than needed. That can increase carryover risk because the drum water level is effectively higher than the controller believes.
- Temperature sensor miscalibration: Superheater or economizer temperature errors can mislead combustion tuning and feedforward logic, causing inefficient operation even when pressure control looks stable.
A practical best practice is to compare instrument readings against independent checks during commissioning and after major work. For example, a handheld pressure gauge at the same tap point can quickly reveal a transmitter offset.
How Sensor Drift Develops over Time
Drift is rarely random. It often follows a mechanism.
- Thermal drift: Temperature elements can shift characteristics after repeated heating and cooling.
- Fouling and deposits: Pressure taps, impulse lines, and level sight paths can accumulate deposits, changing the effective measurement.
- Mechanical wear: Vibration can loosen fittings or damage diaphragms.
- Electrical drift: Cable aging and connector oxidation can alter signal integrity.
A concrete example: a differential pressure level transmitter connected through impulse lines can drift after scale forms in the lines. The controller then “sees” a different differential pressure than the drum actually produces, leading to persistent level control bias.
Signal Integrity and Root Cause Clues
Before blaming the sensor itself, verify the signal path.
- Check the loop power and wiring: A loose terminal can mimic drift by adding intermittent bias.
- Validate scaling and configuration: A transmitter can be healthy while the controller scaling is wrong after a parameter change.
- Inspect impulse lines and process connections: Blockage or partial plugging can create slow, believable errors.
- Confirm calibration dates and last maintenance actions: A pattern after replacement is a strong miscalibration clue.
When troubleshooting, look for correlation. If steam pressure bias appears alongside a change in feedwater valve position, suspect the pressure measurement or its signal path. If the bias grows gradually over weeks, drift is more likely.
Mind Map: Fault Pathways and Checks
Example: Differential Pressure Level Drift
A drum level transmitter uses differential pressure between two taps. Operators notice that the feedwater valve stays slightly more open than usual, and the drum level trend shows a slow upward bias relative to historical behavior.
A systematic check sequence works well:
- Confirm the transmitter output matches the controller’s scaling by reading the raw signal.
- Inspect impulse lines for blockage or partial fouling.
- Perform a controlled verification using a known reference pressure at the transmitter connection.
If the raw signal is correct but the process connection is contaminated, cleaning the impulse lines restores the correct differential pressure response. If the raw signal is biased, recalibration is needed.
Example: Steam Pressure Miscalibration After Replacement
After replacing a steam pressure transmitter, the boiler maintains setpoint but consumes more fuel. A quick comparison shows the transmitter reads 0.3 bar low compared to a calibrated handheld gauge at the same tap. The controller therefore increases firing to “reach” the setpoint it believes is correct.
The fix is straightforward: correct the transmitter calibration and verify the controller scaling matches the transmitter range. Then confirm the loop response by observing that valve position and firing rate return to expected patterns.
Practical Guardrails for Ongoing Reliability
- Use trend logs to spot bias and growth patterns rather than reacting to single alarms.
- Treat impulse line inspection as part of instrumentation health, not just plumbing.
- After any instrument work, verify both the sensor output and the controller scaling.
- Keep troubleshooting evidence tied to correlations between variables, because control systems rarely fail in isolation.
11.5 Practical Example: Troubleshooting a Boiler Trip Using Data Logging and Evidence
A boiler trip is a system telling you, “Something crossed a limit, and I stopped to protect people and equipment.” The goal is to prove what crossed the limit, why it happened, and what evidence supports that conclusion. This example uses a disciplined workflow: collect time-aligned data, classify the trip type, test the most likely causes first, and confirm with physical checks.
Step 1: Capture the Trip Timeline with Evidence
Start with the event log from the burner management system and the boiler control system. Record the trip time, the exact safety that latched, and any preceding alarms. Then pull a short window of trend data (for example, 10 minutes before and 2 minutes after the trip) for:
- Steam pressure and steam flow
- Feedwater flow and feedwater valve position
- Drum level (or water level proxy)
- Burner firing rate, air flow, fuel flow, and draft
- Flue gas oxygen (or CO) and stack temperature
- Blowdown valve position and blowdown flow (if available)
- Water treatment alarms (conductivity, pH, oxygen scavenger dosing) if your system logs them
A useful habit: write a one-sentence “what happened” statement before you interpret anything. Example: “At 14:10:32, low water cutoff latched; drum level fell rapidly while feedwater flow stayed near setpoint.” That sentence becomes your anchor.
Step 2: Identify the Trip Category
Most trips fall into a few categories. Use the safety that latched as the primary classifier:
- Low Water / Level Loss: low water cutoff, drum level low, or level transmitter fault.
- Overpressure: steam pressure high, safety valve lift indication.
- Flame Failure: flame signal lost, proof of ignition failure.
- Combustion Air / Draft Fault: air proving switch, draft interlock.
- Fuel Supply Fault: fuel pressure low, fuel valve feedback mismatch.
If you have multiple latches, treat the first one in time as the likely initiating event. Later latches often describe consequences rather than causes.
Step 3: Use Data Patterns to Narrow Causes
Consider three common evidence patterns.
Pattern A: Level Drops While Feedwater Looks Normal
If drum level trends down and feedwater flow does not increase, suspect:
- Feedwater control valve stuck or failing to respond
- Pump trip or suction issue
- Level transmitter drift or wiring fault
- Excess steam demand causing faster level depletion than control can correct
Evidence checks:
- Compare feedwater valve position vs. flow. If valve position changes but flow does not, the issue is hydraulic.
- Check pump status and motor current. A pump that “runs” but draws low current often indicates cavitation or a blocked suction.
- Validate level transmitter by comparing with sight glass (if present) or by checking plausibility against feedwater and steam flow changes.
Pattern B: Level Drops and Feedwater Flow Also Drops
If both level and feedwater flow fall together, suspect:
- Feedwater pump trip
- Control loop saturation due to actuator failure
- Blowdown or makeup valve behavior
Evidence checks:
- Look for blowdown valve opening before the drop.
- Check makeup water valve status and interlocks.
Pattern C: Flame Failure with Stable Water Levels
If the trip is flame-related and level remains stable, focus on combustion evidence:
- Burner air and fuel synchronization
- Ignition sequence timing
- Flame detector signal quality
Evidence checks:
- Review oxygen and stack temperature trends. A sudden oxygen rise with falling fuel flow can indicate fuel valve closure.
- Check flame signal strength and flicker frequency if your system records it.
Mind Map: Evidence-Driven Trip Troubleshooting
Step 4: Apply the Method to a Concrete Example
Assume the trip latched Low Water Cutoff at 14:10:32. Trends show:
- Drum level fell from normal to cutoff in 45 seconds.
- Feedwater valve position increased slightly, but feedwater flow stayed flat.
- Steam flow increased by 20% in the same minute.
- Feedwater pump motor current dropped at 14:09:58.
Interpretation: the initiating event is likely feedwater pump performance loss, not a control tuning issue. The level fell because steam demand rose and feedwater delivery failed.
Physical checks (in a safe, controlled order):
- Confirm pump trip history and check for suction strainer blockage or air ingress.
- Inspect pump suction pressure (if available) and verify strainers are clear.
- Check motor overload and phase imbalance indicators.
- Verify the feedwater control valve can move freely, but treat it as secondary since flow did not follow valve position.
Evidence confirmation: if the suction strainer is partially blocked and the pump current drop matches the blockage timing, you can connect the dots without guessing.
Step 5: Close the Loop with Documentation
Write a short “evidence chain”:
- Initiating safety: low water cutoff at 14:10:32.
- Observed data: drum level drop, feedwater flow flat, pump current drop, steam flow increase.
- Most likely cause: feedwater pump suction restriction causing reduced delivery.
- Corrective action: clear strainer, inspect suction line for air leaks, verify pump performance.
- Prevention: ensure strainer inspection frequency matches operating conditions and confirm alarms for pump current deviations are enabled.
This approach keeps troubleshooting grounded: data tells you what changed, evidence tells you why it changed, and the final record tells the next operator what to look for first.
12. System Integration Across Manufacturing, Transportation, and Utility Applications
12.1 Industrial Steam Systems: Process Steam Requirements and Load Profiles
Industrial steam systems exist to deliver a specific amount of heat at a specific pressure and quality, at the right time, to the right equipment. The “right time” part is where many designs stumble: a boiler can be sized for peak demand and still fail if the load swings faster than the system can respond.
Process Steam Requirements
Start by listing each steam user and translating its needs into steam-side requirements. For each user, capture:
- Pressure requirement: the minimum pressure at the equipment inlet to meet heat transfer performance.
- Steam quality requirement: whether dry steam is needed (turbine drives, steam jets) or wet steam is acceptable (some direct-contact heating).
- Condensate handling: whether condensate must be returned promptly and cleanly, or can be vented and replaced.
- Control method: on/off valves, modulating valves, or fixed steam throttling.
- Heat duty variability: how the process changes across shifts.
A practical example: a jacketed reactor may require 6 barg steam during batch heating, then switch to a lower duty during hold. If the steam valve is modulating, the system must support stable pressure while flow changes continuously. If the valve is on/off, the system sees step changes that can cause pressure oscillations unless the control strategy accounts for them.
Load Profile Fundamentals
A load profile is the time history of steam demand, usually expressed as mass flow rate and sometimes as steam enthalpy demand. Build it from production schedules and equipment operating logic. Then separate demand into:
- Base load: steady demand during most operating hours.
- Intermediate load: demand that changes with production rate.
- Peak load: short-duration spikes, often tied to start-up, cleaning, or batch transitions.
Consider a food processing plant. During continuous production, steam demand tracks throughput, forming a base load. During sanitation cycles, demand spikes for a limited window. If the boiler and header are sized only for average load, the spike may force excessive blowdown or cause pressure dips that disrupt heat transfer.
Pressure Levels and Distribution Strategy
Industrial systems often use multiple pressure levels to avoid wasting energy. High-pressure steam can feed pressure-reducing stations for lower-pressure users. The key is to ensure the header pressure control loop can handle the fastest credible change in demand.
A simple rule of thumb for reasoning: if a user’s control valve can open quickly, the header sees a rapid flow increase. The boiler must respond by increasing steam generation, or the system must buffer demand using stored energy in the steam drum, header volume, and condensate return dynamics.
Condensate Return and Effective Steam Demand
Not all “steam sent” becomes “steam used.” Flashing, venting, leaks, and delayed return reduce effective heat delivery. Effective steam demand should be calculated using condensate recovery assumptions.
Example: a process line with poor trap performance may send condensate to drain. The boiler then must supply extra steam to replace lost condensate, raising fuel use while also increasing the likelihood of water carryover. Good condensate return practices reduce both operating cost and control instability because the system’s mass balance stays tighter.
Mind Map: Process Steam Requirements and Load Profiles
Example: Translating a Batch Schedule Into Steam Demand
Suppose a batch line runs 8 batches per shift. Each batch requires 2 hours of heating, 0.5 hours of hold, and 0.25 hours of cleaning. Heating uses 1.2 kg/s at 6 barg, hold uses 0.4 kg/s at the same pressure, and cleaning uses 0.8 kg/s at 3 barg through a reducing station.
To build the load profile, convert each phase into a time-weighted demand curve. Then map cleaning to the lower-pressure header and ensure the reducing station capacity matches the peak cleaning flow. Finally, check whether the boiler can cover the combined peak from multiple lines when their cleaning windows overlap. If overlap is common, the peak is not the maximum of one line; it is the sum of simultaneous events.
Practical Takeaways for Design and Operation
A good load profile is not a spreadsheet exercise; it is a control design input. When you can explain which equipment drives base load, which drives peaks, and how quickly valves change flow, you can size boiler capacity, header volume, and control logic with fewer surprises. The system then behaves like a set of coordinated parts rather than a collection of components hoping for the best.
12.2 Cogeneration and Combined Heat and Power Integration (Boiler and Steam Side)
Cogeneration (often called CHP) uses one fuel input to produce both electricity and useful heat. On the boiler and steam side, the key integration idea is simple: the steam system must supply the right steam conditions to the turbine or generator while also delivering process heat or district heat without breaking steam quality, pressure control, or water chemistry.
Core Integration Logic
Start with the steam demand split. In a typical CHP plant, steam goes to a turbine for power, and the remaining thermal energy is recovered either as:
- Condensing with heat recovery: the turbine exhaust is condensed in a heat exchanger to produce hot water or process steam.
- Backpressure: the turbine exhaust is at a pressure suitable for process heat, so there is less condensation duty.
From there, the boiler side must support three constraints at once:
- Steam quality: turbine blades dislike wet steam, so moisture carryover must be controlled.
- Pressure and temperature stability: control valves and turbine inlet conditions must respond to load changes.
- Water chemistry continuity: any change in blowdown, condensate return, or heat exchanger operation affects scaling and corrosion risk.
Steam Conditions and Control Targets
A practical way to set targets is to define the turbine inlet and the heat recovery interface separately.
- Turbine inlet: pressure, temperature, and dryness fraction (or moisture limits) are set by design and operating envelope.
- Heat recovery interface: either a hot-water outlet temperature or a process steam pressure level is set by the receiving system.
Then choose control strategies that avoid fighting each other. For example, if the boiler pressure controller and the turbine inlet control valves both try to correct the same disturbance, you can get oscillations. A clean approach is to let the turbine inlet control handle fast steam demand changes, while the boiler maintains steam generation within its stable operating range.
Boiler and Steam Side Equipment Roles
On the boiler side, integration usually involves these elements:
- Steam drum and separators: maintain dryness by controlling water level and separation efficiency.
- Superheater and reheater (if used): provide the turbine with the required temperature margin.
- Economizer: improves overall heat utilization by preheating feedwater, which also reduces thermal stress.
- Feedwater train: deaeration and filtration protect the boiler and downstream heat exchangers.
On the steam side, integration adds:
- Turbine bypass or desuperheating: protects equipment during trips or rapid load changes.
- Exhaust heat exchanger or condenser: converts turbine exhaust energy into usable heat.
- Condensate return and flash management: ensures returned water is clean enough for the boiler and stable enough for pumps.
Mind Map: Boiler and Steam Side CHP Integration
Integrated Example: Backpressure CHP with Process Steam
Assume a plant needs process steam at 3 bar(g) and also generates power. The turbine is configured as backpressure, so the turbine exhaust pressure is held near the process requirement.
A workable operating sequence looks like this:
- Boiler maintains turbine inlet conditions: the boiler controls steam pressure and temperature to keep turbine inlet stable.
- Turbine inlet valve follows power demand: when electricity demand rises, steam flow increases through the turbine.
- Process pressure controller stabilizes delivery: if process steam demand drops, the turbine still maintains exhaust pressure, and the boiler does not chase the process directly.
- Condensate return supports boiler feedwater: condensate from process users is routed through deaeration and filtration; flash steam from pressure letdowns is captured and reused where possible.
The best-practice detail is water chemistry consistency. If process condensate return quality changes (for example, more noncondensables or contamination), the boiler may need adjusted blowdown or additional polishing. The CHP integration point is that heat recovery changes condensate flows, so chemistry control must be treated as part of the integration, not an afterthought.
Integrated Example: Condensing CHP with Exhaust Heat Recovery
Now assume the turbine exhaust is condensed to produce hot water for a district or process heating loop. Here, the heat exchanger becomes the “heat demand anchor.”
A typical control structure is:
- The boiler maintains turbine inlet steam conditions.
- The turbine handles electrical load changes.
- The condenser/heat exchanger controls hot-water outlet temperature by adjusting cooling or steam-side flow paths.
A common integration pitfall is mismatched temperature approaches. If the hot-water loop temperature rises too close to the exhaust saturation temperature, condensation performance drops, which can increase exhaust pressure and upset turbine backpressure. The fix is to size the heat exchanger for the expected operating range and ensure the hot-water control valves do not starve flow.
Practical Integration Checklist
- Confirm steam quality targets at the turbine inlet and verify separation performance under load changes.
- Define who controls what: boiler stability for generation, turbine valves for power-following, and heat exchanger or process pressure controls for heat delivery.
- Treat condensate routing and blowdown as integrated variables, since CHP changes flow patterns.
- Verify that safety functions (bypass, trip protection, and low-water protection) preserve steam quality and prevent uncontrolled heat exchanger behavior.
When these pieces are aligned, the boiler and steam side stop being “just steam production” and become a coordinated system that delivers electricity and heat with predictable control behavior and manageable water chemistry.
12.3 Marine and Locomotive Steam Systems: Operational Constraints and Maintenance Considerations
Marine and locomotive steam systems share a core idea: convert fuel energy into steam that can do useful work. The difference is how unforgiving the environment is. Ships and locomotives face rapid load changes, limited space, vibration, and strict reliability expectations. That means the “best” design is the one that keeps steam quality stable and avoids water and combustion problems under real operating constraints.
Operational Constraints That Shape Design Choices
Marine boilers often run with variable fuel quality and frequent duty-cycle changes between maneuvering and steady cruising. Locomotive boilers see frequent throttle changes, frequent starts, and short operating windows. In both cases, steam demand can swing faster than water chemistry can correct itself.
A practical constraint is water carryover. If the boiler produces wet steam, turbines and cylinders suffer erosion and loss of efficiency. The system must therefore manage drum separation, steam dryness, and blowdown strategy while maintaining acceptable boiler water chemistry.
Another constraint is draft and combustion stability. On a ship, wind, hull effects, and changing operating conditions alter air flow. On a locomotive, the exhaust and airflow path change with operating state. Stable combustion depends on consistent air supply, correct burner settings, and instrumentation that can survive vibration and soot.
Water Management and Steam Quality Control
Steam quality is not just a “boiler problem”; it is a system outcome. Drum internals, separator performance, and blowdown control work together. A common best practice is to treat blowdown as a controlled tool, not a reflex. For example, if the boiler water conductivity rises after heavy load, a short, targeted blowdown can reduce dissolved solids without stripping too much heat.
Easy example: imagine a locomotive climbing a grade. Feedwater flow increases, but the boiler drum level control may lag slightly. If the operator responds by over-blowing down, the drum water level drops, separators get less liquid to work with, and steam can become wetter. The fix is to tune level control and blowdown timing so the drum stays in the separation-friendly operating band.
Combustion, Draft, and Instrumentation Under Vibration
Maintenance starts with recognizing what fails first. In marine and locomotive service, soot deposition and sensor drift are frequent. A soot layer reduces heat transfer and can push the boiler toward higher stack losses. A drifted oxygen or draft-related measurement can cause excess air to creep upward, wasting fuel.
Easy example: if a locomotive’s stack temperature rises while steam pressure response becomes sluggish, check for fouling before chasing control settings. Cleaning the heating surfaces often restores heat transfer and returns pressure control to normal behavior.
Instrumentation must be protected from vibration and thermal cycling. That means robust mounting, correct cable routing, and periodic calibration checks aligned with operating hours rather than calendar time.
Maintenance Considerations That Prevent Recurring Failures
Maintenance planning should follow a simple logic: protect heat transfer, protect water quality, and protect control reliability.
- Protect heat transfer: schedule sootblowing or cleaning based on observed performance trends. If stack temperature climbs at constant firing rate, plan cleaning.
- Protect water quality: verify feedwater treatment and sampling routines. Skipping sampling is like skipping the inspection of a pressure vessel—eventually it shows up.
- Protect control reliability: inspect linkages, valve seats, and burner components for wear patterns caused by vibration.
Easy example: a ship’s boiler may show repeated low-level trips during heavy maneuvering. Often the root cause is not the boiler itself but a condensate return line that intermittently traps air or steam, disturbing level measurement. Fixing the return line configuration and venting can stop the nuisance trips.
Mind Map: Marine and Locomotive Steam Constraints and Maintenance
Example: A Systematic Troubleshooting Walkthrough
Suppose a marine boiler shows rising stack temperature and unstable steam pressure during maneuvering. Start with the simplest system-level checks: verify burner operation and air supply, then inspect for soot accumulation on heating surfaces. If combustion looks stable, check feedwater treatment records and sampling results to rule out chemistry drift. Finally, verify level measurement and condensate return behavior during maneuvering, because level disturbances can trigger control actions that worsen steam quality.
This sequence matters because it prevents “control chasing.” If the heating surfaces are fouled, adjusting feedwater valves can only compensate temporarily. If the level measurement is disturbed, tuning blowdown or firing rate can mask the real cause.
Maintenance Checklist Focus Areas
A compact checklist that works in both marine and locomotive contexts includes: heating surface cleanliness indicators, drum level control response verification, blowdown valve inspection and actuation performance, feedwater sampling completion, and calibration status of pressure, draft, and combustion-related sensors. Keep the checklist short enough to use during busy shifts, but specific enough that each item has a clear pass/fail criterion.
12.4 Utility Boiler Steam Systems: Feedwater Trains, Economizers, and Turbine Interface
A utility boiler is a big heat exchanger with a disciplined plumbing plan. The feedwater train’s job is to deliver water at the right temperature, pressure, and chemistry to the boiler, while the economizer’s job is to recover heat from flue gas to reduce fuel use and thermal stress. The turbine interface then turns steam conditions into usable power without upsetting the boiler or the steam cycle.
Feedwater Train Foundations
A typical feedwater train starts with condensate from the condenser hotwell, then moves through pumps and heaters to reach boiler feedwater conditions. The sequence matters because each stage changes temperature and pressure, and those changes affect cavitation risk, pump efficiency, and boiler heat transfer.
-
Condensate polishing and deaeration: Dissolved oxygen is a corrosion accelerant. Deaerators remove oxygen using steam stripping, and they also help stabilize feedwater temperature so downstream heaters work predictably.
-
Low-pressure feedwater heaters: These use extraction steam from the turbine to raise feedwater temperature. Higher feedwater temperature reduces the heat duty inside the boiler and lowers thermal shock potential during load changes.
-
Boiler feed pumps: Pumps raise pressure to overcome boiler pressure and piping losses. Good practice is to maintain adequate net positive suction head margin, especially during startup when temperatures and flows are changing.
-
High-pressure feedwater heaters: These finish the temperature lift using higher-pressure turbine extraction. The goal is to deliver feedwater close to the economizer inlet target so the boiler’s heat absorption is distributed where it was designed.
Economizer Role and Operation
The economizer is a heat recovery surface placed before the steam-generating sections. Flue gas cools as it passes through the economizer, transferring heat to feedwater. This does two things: it improves overall efficiency and it reduces the temperature difference between hot gas and metal surfaces.
Key operational points:
- Approach temperature control: Operators watch the economizer outlet temperature and flue gas temperature to ensure the heat transfer remains stable.
- Fouling management: Deposits on economizer tubes reduce heat transfer and can push the boiler toward higher stack losses. Water-side and gas-side cleanliness both matter.
- Thermal stress awareness: Rapid feedwater temperature changes can create metal expansion gradients. Coordinated control with heaters and pumps helps keep ramp rates reasonable.
Example: Coordinating Heater Outlet Temperature
If a high-pressure feedwater heater outlet temperature drops due to reduced extraction steam, the economizer inlet temperature falls. The boiler then must absorb more heat in the generating sections to reach steam conditions, which can increase tube metal temperatures and shift steam quality behavior. A practical response is to verify heater drain handling, check extraction valve position feedback, and confirm feedwater flow is stable before adjusting boiler firing.
Turbine Interface and Steam Quality Control
The turbine interface is where steam conditions become power and where boiler stability is protected. The boiler must supply steam at the required pressure, temperature, and quality, while the turbine must avoid demanding conditions that force the boiler into uncomfortable operating corners.
Common interface elements include:
- Main steam stop and control valves: These regulate steam flow into the turbine. Valve position changes affect boiler load and steam drum level dynamics.
- Reheat steam system: For reheat cycles, the boiler’s reheat section must deliver the correct reheat temperature so turbine blade metal temperatures stay within limits.
- Steam temperature control: Spray attemperators or desuperheaters manage temperature by mixing water with steam. The control system must prevent excessive water carryover that can damage turbine components.
Example: Preventing Excess Attemperator Water
Suppose attemperator spray flow increases because temperature feedback is lagging. Excess spray can lead to higher moisture content entering the turbine, which increases erosion risk and can cause control instability. A disciplined approach is to check sensor calibration, confirm spray valve response time, and verify that feedwater temperature and pressure are within expected ranges so the spray mixing behaves as modeled.
Mind Map: Utility Boiler Feedwater and Turbine Interface
System Integration Example: Load Change Without Surprises
During a load increase, turbine valves open and extraction steam patterns shift. The feedwater train must respond by maintaining heater outlet temperatures and feedwater flow, while the economizer absorbs the expected fraction of heat. If the feedwater temperature lags, the boiler compensates by shifting heat absorption to generating surfaces, which can raise metal temperatures and affect steam quality. A well-run control strategy sequences changes so that steam demand, feedwater temperature, and economizer heat absorption move together rather than in a tug-of-war.
12.5 Practical Example: Integrating Boiler Output With a Turbine or Process Steam Network
A practical integration starts with a simple question: what steam conditions does the downstream equipment actually need, and how do you keep those conditions stable while the boiler and network fluctuate? In this example, a boiler supplies steam to two consumers: a small backpressure turbine and a process header with pressure-reducing valves (PRVs). The goal is to maintain turbine inlet pressure and process header pressure without excessive throttling losses or water carryover.
Step 1: Define Steam Targets and Boundaries
First, write down the required steam states as operating targets. For the turbine, you typically care about inlet pressure and dryness fraction; for the process header, you care about header pressure and stable flow. Then define what the boiler can reliably produce: maximum steam pressure, typical steam drum pressure control range, and the quality margin you can maintain under load swings.
A simple way to keep this from becoming vague is to set three numbers per consumer:
- Pressure setpoint and allowable band
- Minimum acceptable steam quality (or a proxy such as maximum allowable carryover risk)
- Maximum allowable temperature deviation if superheat is used
Step 2: Choose the Integration Topology
Two common layouts work well here:
- Turbine-first with extraction or backpressure: boiler steam goes to the turbine, then exhaust feeds the process header.
- Parallel distribution with PRVs: boiler steam splits to turbine and process header separately, with PRVs managing pressure.
For this example, use turbine-first because it reduces throttling and uses the turbine as a pressure “smoother.” The turbine exhaust pressure becomes the process header pressure baseline, and PRVs only handle short-term deviations.
Step 3: Build the Control Strategy Around Energy and Water
Integration fails most often when controls fight each other. A workable hierarchy is:
- Boiler steam pressure control maintains drum pressure and steam flow capability.
- Turbine governor controls steam admission to keep turbine operating point stable.
- Process PRVs trim pressure only when the process demand changes faster than the turbine can respond.
To prevent water carryover from upsetting the turbine, ensure the boiler’s steam quality management is part of the integration logic. That means the boiler’s drum level control and steam separator performance must be trusted before you assume the turbine will tolerate quality variations.
Step 4: Map the Mass and Pressure Flows
At steady state, the boiler produces steam mass flow \(\dot m_b\). The turbine consumes \(\dot m_t\), and the remainder \(\dot m_p\) goes to the process header (either directly or via turbine exhaust). Pressure losses in piping and valves reduce effective pressure at each interface, so you should treat each segment as a “pressure budget” rather than an afterthought.
A quick sanity check: if the process PRVs open frequently during normal operation, you are likely wasting energy by throttling that could have been handled by turbine admission or by adjusting the boiler pressure setpoint within its stable range.
Mind Map: Integration Logic and Practical Checks
Step 5: Run a Load-Step Example with Concrete Numbers
Assume the boiler can hold drum pressure at 10.0 bar(g) under normal control action, producing steam at a stable quality margin. The turbine is backpressure with exhaust at 4.0 bar(g). The process header is designed for 4.0 bar(g) nominal.
Now consider a process demand increase that raises required process flow by 20%. If the turbine governor admission is set to maintain turbine exhaust pressure near 4.0 bar(g), the turbine will automatically take more steam, and the process header pressure stays near target with minimal PRV action.
If, instead, the turbine admission is fixed or slow to respond, the process header pressure will dip, PRVs will open, and throttling losses rise. You’ll also see higher sensitivity to steam quality because the boiler may need to chase demand with faster firing changes.
Step 6: Validate with Instrumentation and Evidence
Integration is only “real” when you can observe it. Use these checks during commissioning and routine operation:
- Boiler steam pressure trend vs turbine exhaust pressure trend
- PRV position or flow vs process demand
- Steam quality indicators during load ramps
- Evidence of stable control without hunting (oscillation)
A practical acceptance test is to perform a controlled load step and confirm that:
- Turbine exhaust pressure returns to the process header band quickly
- PRVs do not remain open beyond the expected transient window
- No sustained increase in carryover risk indicators occurs
Example Outcome: What “Good” Looks Like
In a well-integrated system, the turbine does most of the pressure work, PRVs handle only the edges, and the boiler controls focus on producing steam conditions rather than compensating for downstream instability. The result is stable process pressure, predictable turbine operation, and fewer surprises when demand changes.