Family Office Direct Investing
1. The Family Office Direct Investing Mandate
1.1 Defining Direct Investing Versus Fund Investing
Direct investing means the family office buys, owns, and manages specific assets or operating businesses itself. Fund investing means the family office provides capital to a manager, and the manager selects deals, structures ownership, and handles day-to-day investment administration under the fund’s terms. The difference is not just legal form; it changes how decisions are made, how information flows, and how outcomes are measured.
What You Actually Own
In direct investing, ownership is usually straightforward to describe: “We own 40% of Company X” or “We hold a senior secured note issued by Company Y.” You can often point to the exact instrument, the exact cap table, and the exact covenants.
In fund investing, ownership is indirect: “We own units in Fund Z.” The family office’s direct exposure is to the fund’s portfolio and the manager’s process, not to each underlying asset.
Example: If a private company misses a milestone, a direct investor can review the specific contract terms and negotiate amendments with the company. A fund investor typically receives the manager’s analysis and votes only if the fund agreement grants that right.
Decision Rights and Control
Direct investing concentrates decision rights with the family office. That includes approving entry price, agreeing to governance protections, and deciding whether to support management during operational stress.
Fund investing distributes decision rights. The manager controls deal selection and execution, while the family office influences outcomes through limited mechanisms such as advisory committees, consent rights, or replacement provisions.
Easy test: Ask, “Who can say yes to a specific change in ownership terms next week?” If the answer is “the family office,” you’re in direct investing. If the answer is “the manager, subject to fund rules,” you’re in fund investing.
Information Flow and Reporting Granularity
Direct investing tends to produce more granular information because the family office can request documents tied to its exact holdings: board materials, monthly operating reports, covenant compliance packages, and draft amendments.
Fund investing often provides standardized reporting: quarterly portfolio updates, valuation summaries, and periodic capital account statements. That can be efficient, but it may not match the family office’s specific questions.
Example: Suppose you want to understand customer concentration risk. A direct investor can ask for the customer ledger and churn by segment. A fund investor may receive a summarized discussion, which might be enough—or might be too coarse for a concentrated portfolio.
Fees, Costs, and the Meaning of “Net”
Fund investing usually includes management fees and performance fees, plus transaction costs embedded in the fund’s economics. Direct investing has fewer “layered” fees, but it introduces your own internal costs: legal review, diligence labor, monitoring time, and sometimes external advisors.
The practical difference is who bears the cost of expertise. Funds spread costs across investors and deals; direct investing concentrates costs inside the family office.
Example: If the family office lacks in-house legal capacity, direct investing may require hiring counsel per deal. A fund may already have that infrastructure, but the family office pays through the fund’s fee structure.
Risk Ownership and How Losses Show Up
Direct investing makes risk feel personal because the family office sees the exact failure mode: covenant breach, liquidity shortfall, or operational underperformance in a specific company.
Fund investing spreads risk across the fund’s portfolio, but it also adds “process risk.” Even if a single deal is good, the manager’s overall execution—timing, follow-on decisions, and valuation discipline—affects the fund’s results.
Example: In direct investing, you can decide whether to fund a rescue financing or restructure governance. In fund investing, you rely on the manager’s recommendation and the fund agreement’s rules for follow-ons.
A Practical Distinction for Allocation Decisions
Use this framework when deciding whether to allocate to direct deals or funds:
- Complexity tolerance: Direct investing requires operational and legal attention; funds reduce that burden.
- Information needs: If you need detailed, holding-specific answers, direct investing fits better.
- Decision speed: Direct investing can move faster when you control approvals.
- Diversification style: Funds diversify across many deals; direct investing diversifies by building a portfolio deliberately.
Mind Map: Direct Versus Fund Investing
Mini Case Study: Two Ways to Buy the Same Deal
Assume a family office wants exposure to a mid-market software company.
- Direct route: The family office negotiates a preferred equity stake with information rights and a board seat, then sets a quarterly monitoring cadence and defines triggers for follow-on funding.
- Fund route: The family office invests in a technology fund that targets similar companies. The manager negotiates the terms, and the family office receives standardized updates and votes only on matters required by the fund agreement.
Both routes can be sensible. The key is that direct investing trades off convenience for specificity, while fund investing trades specificity for delegation.
1.2 Translating Family Objectives into an Investment Mandate
A family office mandate is the bridge between what the family wants and what the portfolio must do. Objectives are often emotional or personal; mandates must be operational. The trick is to translate values into constraints, and constraints into repeatable decisions.
Start with Objectives That Can Be Measured
Begin by listing family objectives in plain language, then attach a measurable interpretation. “Preserve wealth” becomes a target for real purchasing power and a tolerance for drawdowns. “Support the next generation” becomes a spending policy and a liquidity plan. “Avoid controversy” becomes a screening rule for industries, jurisdictions, and governance practices.
A useful test: if two family members disagree, can the mandate still tell you what to do? If not, the objective is still too vague.
Example: The family says, “We want steady income.” The mandate translation might specify: “Target a cash yield of X% on the liquid sleeve and ensure at least Y months of spending coverage from cash and near-cash.”
Convert Values into Decision Rules
Objectives should become decision rules that an investment committee can apply without re-litigating the family’s intent each time.
Common rule types include:
- Eligibility rules: what can be owned (asset types, geographies, ownership structures).
- Risk rules: maximum concentration, leverage limits, and liquidity requirements.
- Return rules: minimum acceptable expected return or hurdle rates by strategy.
- Process rules: required diligence steps, approval thresholds, and documentation standards.
Example: If “family control matters,” the mandate might require governance rights for direct deals above a certain size, such as board seats, vetoes on major actions, and information rights.
Define Capital Buckets and Time Horizons
Mandates work best when capital is separated by purpose. A single pool with mixed needs forces compromises that satisfy nobody.
A practical approach is to create buckets aligned to time horizons:
- Spending and liquidity bucket: cash, T-bills, and short-duration instruments.
- Stability bucket: intermediate risk assets that can be sold with limited friction.
- Growth and direct investing bucket: illiquid positions where the family accepts longer holding periods.
Example: A family with planned tuition payments over the next 24 months keeps that amount in the liquidity bucket. Direct investing commitments are sized so that capital calls do not collide with known spending.
Set Liquidity Expectations for Illiquid Decisions
Illiquidity is not just a property of the asset; it’s a property of the plan. The mandate should state how the family handles capital calls, refinancing risk, and the timing of exits.
Translate liquidity expectations into rules like:
- maximum percentage of total investable assets committed to illiquid deals
- required cash buffer to fund capital calls
- conditions under which the office will accept longer lockups
Example: If the family limits illiquid exposure to 35% of investable assets, then a new private equity-style commitment must be evaluated against remaining capacity, not just against the deal’s attractiveness.
Specify Risk in Plain Language
Risk is often discussed as a feeling. Mandates require risk as a set of measurable exposures.
At minimum, define:
- Concentration risk: limits by issuer, sector, geography, and strategy.
- Liquidity risk: time-to-cash assumptions and funding capacity.
- Operational risk: reliance on third parties, reporting quality, and governance strength.
- Legal and compliance risk: jurisdiction constraints and ownership structure requirements.
Example: If operational risk is a concern, the mandate might require audited financials, standardized reporting, and a minimum governance package for direct deals.
Build a Mandate Statement That Can Be Used Tomorrow
A strong mandate is short enough to read and specific enough to apply. It should include:
- objectives and their measurable translations
- eligible universe and exclusions
- allocation targets by bucket
- risk limits and approval thresholds
- reporting cadence and documentation requirements
Example: “We invest directly in profitable businesses where we can obtain information rights and governance protections. We limit any single position to 8% of the direct investing bucket and require quarterly reporting. We do not invest in jurisdictions where beneficial ownership cannot be verified.”
Mind Map: From Objectives to Mandate
Example: Turning a Family Meeting into a Mandate Draft
A family meeting produces four statements: “We need spending certainty,” “We want long-term compounding,” “We prefer direct ownership,” and “We avoid reputational risk.” The mandate draft translates them into: a liquidity bucket sized for 18 months of spending, an allocation target that caps illiquid commitments at 35% of investable assets, a direct investing eligibility rule requiring governance and information rights, and an exclusion list for high-risk jurisdictions and opaque ownership.
The result is not a document that sounds good; it’s one that prevents avoidable mistakes. When a new deal arrives, the office can check eligibility, test liquidity capacity, confirm governance terms, and decide using the same rules every time.
1.3 Establishing Decision Rights, Governance, and Accountability
Direct investing works only when decisions are made by people who can act, and when acting has consequences. Governance is the system that turns “we should be careful” into repeatable choices, with clear ownership of outcomes.
Decision Rights That Match Real Work
Start by separating three things: who proposes, who approves, and who executes. In a family office, the temptation is to let the loudest voice approve. The better approach is to map decision rights to the work required.
A practical baseline is a three-layer model:
- Investment Committee (IC) approves: entering deals, changing strategy constraints, and exceptions to the investment policy.
- Deal Team executes: sourcing, diligence coordination, modeling, and drafting memos.
- Portfolio Owner monitors: post-close reporting, covenant tracking, and escalation when triggers occur.
Decision rights should also specify what cannot be delegated. For example, approving a new concentration above the policy limit should require IC approval, even if the deal team recommends it. Conversely, routine actions like requesting updated financial statements can be delegated to the portfolio owner.
Governance Cadence and Meeting Mechanics
Governance fails when it is either too frequent or too rare. The goal is a cadence that matches deal timelines and portfolio realities.
Use a predictable rhythm:
- Weekly deal pipeline review (deal team and portfolio owner): funnel status, diligence blockers, and next-step owners.
- Biweekly or monthly IC meeting: approvals, exceptions, and policy changes.
- Quarterly portfolio review: performance, valuation updates, covenant compliance, and escalation summaries.
Meeting mechanics matter. Each approval should have a single decision document, a single set of assumptions, and a single owner for follow-through. If multiple versions of a model circulate, the IC is voting on confusion.
Accountability Through Clear Ownership and Audit Trails
Accountability means someone can answer three questions after the fact: What was decided? Why was it decided? What happened next?
Implement this with:
- A decision log that records the proposal, the vote, the key risks discussed, and the conditions attached to approval.
- A diligence checklist with named owners for each workstream (financial, legal, operational, tax).
- A post-close responsibility map that assigns who monitors each covenant, reporting requirement, and operational milestone.
A simple rule prevents finger-pointing: every action item must have an owner and a due date. If the due date is “sometime this quarter,” it is not a due date.
Guardrails for Exceptions and Edge Cases
Policies are useful until reality shows up. The governance system should define how exceptions are handled.
Create an exception framework with thresholds. For example:
- If valuation assumptions deviate beyond a set range, the IC must approve the deviation.
- If legal terms change materially (e.g., information rights narrowed), approval must be re-confirmed.
- If a deal team cannot complete a workstream by a defined deadline, the IC decides whether to proceed with a reduced scope or pause.
This keeps exceptions from becoming the default operating mode.
Mind Map: Decision Rights, Governance, and Accountability
Example: Approving a Deal with a Concentration Constraint
Assume the policy limits any single position to 12% of investable assets. A direct acquisition opportunity would bring the position to 15% if completed as proposed.
- The deal team drafts a memo with two structures: the standard structure at 15% and an alternative structure at 11.5% with different governance terms.
- The IC reviews the memo and asks for a specific comparison: downside coverage under both structures, not just upside.
- The IC approves only the alternative structure at 11.5%, and records the reason: the family’s liquidity ladder requires staying under 12%.
- The portfolio owner receives the approval conditions and owns the follow-through: confirm the final legal language preserves the agreed information rights.
If the alternative structure later changes and pushes the position back above 12%, the exception framework requires IC re-confirmation. That is governance doing its job: preventing “we meant to stay within limits” from becoming a story.
Example: Monitoring Triggers After Closing
After closing, the portfolio owner tracks a covenant that requires minimum cash on hand. The decision rights should specify what happens when the covenant is at risk.
A workable escalation path is:
- Trigger detected: portfolio owner notifies the deal team and IC liaison within two business days.
- Assessment: deal team provides a short memo on causes and options within one week.
- Action decision: IC approves any material remedy, such as renegotiating terms or funding a short-term bridge.
This avoids the common failure mode where monitoring becomes passive observation. The system turns monitoring into decisions with owners.
Practical Checklist for Implementation
Before the first direct deal is approved, confirm these items are in place:
- A written decision-rights map for propose, approve, and execute.
- A meeting cadence with defined agendas and required documents.
- A decision log template and a workstream ownership checklist.
- An exception framework with thresholds that trigger IC re-approval.
- A post-close responsibility map tied to covenants and reporting.
Governance is not a ceremony. It is the set of rules that makes good judgment repeatable, and makes mistakes easier to learn from without turning every outcome into a debate.
1.4 Setting Time Horizons, Liquidity Expectations, and Capital Buckets
A family office’s direct investing works best when time horizon, liquidity needs, and capital buckets are designed together. If you pick a long horizon but still require frequent cash, you’ll either sell at the wrong time or quietly break your own plan. The goal is simple: match each pool of capital to a realistic set of holding periods and liquidity behaviors.
Start with What Must Be True
Time horizon is not a preference; it’s a constraint. Begin by listing three categories of obligations:
- Known near-term cash needs: taxes, planned distributions, debt service, and major household or operating expenses.
- Known medium-term commitments: capital calls from existing deals, renovation or expansion budgets, and multi-year pledges.
- Optional or opportunistic spending: discretionary giving, lifestyle upgrades, and “we might do this” projects.
Then define the “must not fail” rule: the office should never be forced to fund obligations by selling illiquid positions at unfavorable moments. This rule drives the liquidity ladder.
Build Liquidity Buckets That Behave Differently
Use capital buckets to separate liquidity profiles. A practical structure looks like this:
-
Bucket A: Operating Liquidity
- Purpose: cover near-term obligations without selling.
- Typical instruments: cash, short-duration instruments, and money-market-like holdings.
- Example: If the office expects $2.0M of annual taxes and distributions, Bucket A might target 12–18 months of that amount.
-
Bucket B: Commitment Liquidity
- Purpose: fund upcoming capital calls and bridge needs.
- Typical instruments: short-to-intermediate duration holdings.
- Example: If three existing deals can call $1.5M over the next 18 months, Bucket B targets that amount with a buffer.
-
Bucket C: Direct Investing Liquidity
- Purpose: deploy into private deals with planned holding periods.
- Typical instruments: equity and structured positions with limited liquidity.
- Example: A buyout investment may be underwritten for 5–7 years, with the understanding that distributions can be irregular.
-
Bucket D: Strategic Optionality
- Purpose: reserve capacity for special situations that fit the mandate.
- Typical instruments: a mix of direct deals and selectively liquid exposures.
- Example: If the office wants the ability to act quickly on a rare control opportunity, Bucket D holds deployable capital that is not earmarked for near-term commitments.
The key best practice is to label each bucket with a “what happens if we need cash” rule. Bucket A is designed to be spent; Bucket B is designed to be drawn down; Bucket C is designed to be held; Bucket D is designed to be deployed or partially liquidated only if the plan still holds.
Define Holding Periods with Realistic Ranges
Time horizon should be expressed as a range, not a single number. For each strategy, specify:
- Underwriting horizon: the period used in the base-case model.
- Liquidity expectation: the most common path to partial or full realization.
- Exit tolerance: what you do if the preferred exit timing slips.
Example: For a minority growth investment, the underwriting horizon might be 4–6 years, while the liquidity expectation could be “secondary sale or recap when governance milestones are met.” Exit tolerance might be “if no recap occurs by year 6, we reassess and decide whether to hold for a longer period or pursue a structured liquidity event.”
Translate Liquidity into Decision Rules
Once buckets and horizons exist, convert them into operational rules for the investment committee.
-
Rule 1: No new Bucket C commitments without Bucket A and B coverage
- Example: If Bucket A and B together cover the next 24 months of obligations, new direct deals can proceed. If coverage drops below that threshold, new deals pause until liquidity is restored.
-
Rule 2: Capital call planning is mandatory
- Example: Before approving a new deal, require a simple schedule of expected capital calls and confirm Bucket B can fund them without selling Bucket C.
-
Rule 3: Re-underwrite when reality changes
- Example: If a deal’s operational milestones slip and the model’s base-case horizon no longer matches, update the underwriting horizon and reassess whether the position still fits the bucket.
Mind Map: Time Horizons, Liquidity Expectations, and Capital Buckets
A Simple Worked Example
Assume the office has $3.0M of annual obligations and $2.0M of expected capital calls over the next 18 months.
- Bucket A targets 15 months of obligations: $3.0M × 15/12 = $3.75M.
- Bucket B targets capital calls plus a buffer, say $2.0M × 1.1 = $2.2M.
- Bucket C holds the remainder earmarked for direct deals, with underwriting horizons of 5–7 years.
- Bucket D reserves a smaller amount for special opportunities, with the explicit rule that it cannot be used to cover Bucket A or B shortfalls.
This structure turns “we invest long-term” into a measurable system: liquidity is planned, decisions are constrained, and the office can stay consistent even when deals take longer than the calendar would prefer.
1.5 Building an Investment Policy Statement for Private Deals
A Family Office Investment Policy Statement (IPS) for private deals is the document that turns “we like long-term ownership” into specific, repeatable decisions. It reduces improvisation, clarifies trade-offs, and gives the Investment Committee a shared language for risk, liquidity, and governance.
Start with Purpose and Scope
Begin with a short purpose section: what the IPS is for, who uses it, and what it covers. Then define scope boundaries so people don’t treat the IPS as a general philosophy memo. For example, specify that it applies to direct equity, direct credit, and structured minority investments, but excludes publicly traded securities managed under a separate policy.
Include a “decision types” list:
- New investment approval
- Follow-on investments
- Amendments to existing terms
- Waivers of policy constraints
- Exit decisions and sale processes
This matters because the IPS can be strict for new deals but more flexible for follow-ons if the original thesis is intact.
Define the Capital Framework
Private deals require explicit capital rules. State your liquidity ladder in plain terms: how much capital is reserved for near-term obligations, how much can be tied up for years, and how much is available for new commitments.
A practical example: if the family office targets 12 months of operating liquidity plus planned tax payments, then only the remaining “patient capital” bucket is eligible for new private equity or private credit commitments. The IPS should also define what counts as “committed” versus “invested,” because capital calls can arrive faster than expected.
Add concentration guardrails. For instance:
- Maximum exposure per issuer
- Maximum exposure per strategy
- Maximum exposure per sector or geography
Then specify how exposure is measured: cost basis, fair value, or committed amount. Pick one and stick to it.
Specify Strategy Fit and Deal Eligibility
The IPS should list what the office will do and what it will not do. Eligibility criteria prevent the common failure mode where every interesting opportunity becomes “close enough.”
Example eligibility rules:
- Minimum expected holding period (e.g., 5+ years for equity)
- Minimum governance or information rights for minority positions
- Prohibited deal types such as highly dilutive structures without protective provisions
- Minimum financial quality thresholds, such as positive gross margin or verified cash conversion for operating businesses
Also define the “strategy map” in terms of business model and value creation levers. If you invest in operational turnarounds, require a plan with measurable milestones and a monitoring cadence.
Establish Governance and Decision Rights
Write down who decides what. A clean structure often looks like:
- Investment team screens and drafts memos
- Investment Committee approves new deals and policy waivers
- Legal and finance sign off on documentation and covenant compliance
Include quorum rules and voting thresholds. For example, require unanimous approval for any deal that breaches a hard constraint (like concentration limits), but allow majority approval for deals within policy.
Add a conflict-of-interest procedure. Define related-party transactions, disclosure timing, and whether the conflicted person can participate in discussion or voting.
Create the Underwriting and Approval Process
The IPS should describe the workflow from first contact to closing. Make it systematic:
- Initial screen against eligibility criteria
- First-pass memo with key risks and valuation approach
- Full diligence plan with workstreams
- Investment memo with underwriting outputs and decision recommendation
- Committee review and approval with documented conditions
For each stage, specify minimum content. Example: the first-pass memo must include a one-paragraph thesis, a preliminary valuation range, and the top three risks with mitigation ideas.
Define Risk Management and Monitoring Triggers
Risk management is not a separate document; it’s embedded in the IPS. Include a risk register template and require that each approved deal has:
- A primary risk owner
- A mitigation plan
- Monitoring metrics
- Trigger events that prompt action
Example triggers:
- Revenue decline beyond a threshold for two consecutive quarters
- Breach of a financial covenant
- Loss of a key customer above a defined percentage
- Material changes in accounting policies
Also define what “action” means. The IPS can specify escalation steps such as requesting additional reporting, renegotiating terms, or voting against certain actions.
Set Valuation, Reporting, and Documentation Standards
Private deals need consistent valuation policy. State how fair value updates are handled and who approves them. For example, require quarterly valuation updates using a defined method hierarchy: recent transactions, comparable multiples, discounted cash flow, or asset-based approaches depending on the asset type.
Reporting standards should be concrete:
- Frequency of management updates
- Minimum reporting package contents
- Format expectations for investment committee reporting
Documentation standards should cover audit trails: approvals, memo versions, term sheet versions, and signed documents.
Include Examples of Policy Application
Add short “how we apply the IPS” examples. These reduce interpretation drift.
Example 1: Minority equity with limited information rights
- Policy rule: minority positions must include information rights and at least one protective governance item.
- Outcome: if the term sheet lacks reporting covenants, the deal is rejected or restructured before full diligence.
Example 2: Follow-on investment
- Policy rule: follow-ons require thesis confirmation and updated underwriting.
- Outcome: if the business hits the milestone plan and valuation remains within the approved range, follow-on can be approved by a smaller committee; otherwise it returns to full committee review.
Mind Map: Investment Policy Statement Components
A Compact IPS Template You Can Fill In
Use a consistent order so the committee can scan it quickly.
1. Purpose and scope
2. Capital framework and liquidity ladder
3. Strategy fit and eligibility rules
4. Governance and decision rights
5. Underwriting process and stage gates
6. Risk management and monitoring triggers
7. Valuation, reporting, and documentation standards
8. Concentration and waiver rules
9. Conflict-of-interest procedure
10. Worked examples
A good IPS reads like a set of guardrails, not a set of vibes. When a deal arrives, the team should be able to point to the relevant rule, explain the interpretation, and record the decision without rewriting the policy each time.
2. Capital Architecture and Allocation Mechanics
2.1 Mapping Net Worth, Cash Flow, and Capital Needs
A family office that invests directly needs a map of money that is both honest and usable. “Net worth” tells you what you own; “cash flow” tells you what you can spend or fund without stress; “capital needs” tells you what must be reserved for life, taxes, and opportunities. The goal is not precision to the penny. The goal is to avoid funding a private deal with money that is actually earmarked for something else.
Start with Net Worth, Then Separate It into Buckets
Begin with a balance sheet snapshot. Group assets into three buckets:
- Operating liquidity: cash, money market, short-term treasuries used for day-to-day needs.
- Stability assets: holdings that can be sold with limited friction, such as diversified public equities or liquid credit.
- Illiquid assets: private businesses, real estate, private credit, and other positions that take time to exit.
Example: If the family office shows $40M net worth, but $18M sits in a private real estate partnership with a multi-year exit window, that $18M is not “available” for a new $5M equity check next month. It can still be part of the long-term plan, just not the near-term funding plan.
Build a Cash Flow Statement That Matches Reality
Next, create a cash flow view that covers at least 12–24 months, then extend with a simpler annual view. Use actuals where possible.
- Inflows: salary or business distributions, dividends, interest, rental income, and any expected distributions from existing private holdings.
- Outflows: family living expenses, taxes, insurance, school costs, legal/accounting, and any planned capital expenditures.
- Timing: record when cash arrives and when bills land. Timing matters more than totals.
Example: A family may have $3M of annual income, but if $1.5M of taxes are due in Q3 and the distributions from a private company arrive in Q4, you still need Q3 liquidity. Cash flow mapping prevents “paper wealth” from turning into forced sales.
Translate Cash Flow into Capital Needs
Capital needs are the amounts you must reserve to keep the household and the office running, plus the amounts you can allocate to deals without breaking the liquidity plan.
Create three capital need lines:
- Committed obligations: known payments such as taxes, debt service, and contractual expenses.
- Contingency reserve: a buffer for surprises like medical costs or unexpected repairs.
- Investment capacity: the portion of liquidity that can be committed to new deals while still meeting obligations.
A practical method is to compute a minimum liquidity floor: operating liquidity plus a portion of stability assets that you do not plan to sell within the next 12 months. Everything above that floor is eligible for new commitments, subject to deal timing.
Add Deal Timing to Avoid Funding Mismatch
Private deals rarely behave like public markets. Money is typically deployed in stages: deposits, closing funds, and later capital calls. Map your expected deployment schedule against your cash inflows.
Example: Suppose you plan to invest $6M in a private company with a $1M deposit at signing, $4M at closing in 90 days, and $1M as a capital call in 12 months. If your cash flow shows a Q3 tax spike, you may still proceed, but you might negotiate the deposit size or use a bridge facility to protect the liquidity floor.
Mind Map: Net Worth, Cash Flow, and Capital Needs
A Simple Worked Example with Numbers
Assume the office holds $8M operating liquidity and $12M stability assets. The minimum liquidity floor is set at $10M to cover the next 12 months of obligations and contingency. That means only $10M is “available” for new commitments ($8M + $12M − $10M).
If a proposed deal requires $7M over the next 9 months, you can fund it without dipping below the floor, provided inflows do not fall short. If the deal requires $7M in the same period but inflows are seasonal and taxes peak in month 6, you may need to reduce the commitment size, stage the investment, or adjust the schedule.
Document the Logic, Not Just the Numbers
Finally, record the assumptions behind the map: tax timing assumptions, expected distribution timing, and the method used to set the liquidity floor. When the office later reviews a deal, the question becomes straightforward: does the deal fit the documented funding logic, or does it require a change to obligations, reserves, or liquidity assumptions?
2.2 Designing Liquidity Ladders and Funding Commitments
A liquidity ladder is a planned sequence of “when money is available” versus “when money is needed.” In direct investing, the ladder is not just about cash; it’s about decision timing, contract terms, and the family’s tolerance for being temporarily stuck in illiquid positions.
Foundational Concepts That Make the Ladder Work
Start with three inputs: (1) expected cash inflows, (2) required outflows, and (3) capital commitments you might be asked to fund. Cash inflows include salaries, dividends, and business distributions. Required outflows include taxes, living expenses, and known capital expenditures. Capital commitments include equity purchases, bridge loans, and follow-on funding.
Next, separate liquidity into buckets with different rules. A common structure uses:
- Immediate liquidity for near-term obligations.
- Near-term liquidity for planned opportunities and short-notice expenses.
- Opportunistic liquidity for deals that may close after diligence.
- Illiquidity capacity for capital that can remain locked for years.
The ladder becomes a schedule: each bucket has a time window and a maximum amount that can be committed during that window.
Designing the Ladder Step by Step
-
Build a 24–36 month cash map. Use monthly granularity for the first 12 months, then quarterly for the next period. Include tax timing and any irregular outflows.
-
Define “commitment triggers.” A commitment is not the same as a spend. You might sign an agreement today but fund later. Triggers include closing dates, funding conditions, and milestone-based payments.
-
Set funding rules by bucket. For example, immediate liquidity funds only obligations and expenses. Near-term liquidity can fund deposits or small equity tranches. Opportunistic liquidity can fund larger closings if the deal’s funding schedule fits the ladder.
-
Reserve illiquidity capacity for deals that truly require it. If a deal has uncertain timing, it should consume the bucket with the longest tolerance, not the bucket with the shortest.
-
Add a “buffer” line. A buffer prevents the ladder from collapsing when a closing slips by 60 days or a tax payment lands earlier than expected.
A practical rule: if a deal’s funding schedule is uncertain, assume the worst reasonable timing for cash needs and size the bucket accordingly.
Funding Commitments That Match Contract Reality
Funding commitments should be tracked as a calendar of cash events, not as a single number. Many families get surprised by “small” obligations that stack up: deposits, legal fees, working capital adjustments, and follow-on rounds.
Create a commitment register with these fields:
- Instrument type (equity, preferred, convertible, secured loan)
- Funding event (deposit, closing, tranche, milestone)
- Expected date range (not just a point estimate)
- Maximum cash required
- Condition dependencies (what must happen to trigger funding)
- Exit or relief provisions (what happens if conditions fail)
Then link each funding event to a ladder bucket. If an event can land in multiple months, allocate it to the earliest month that is still realistic, and keep the buffer for the rest.
Mind Map: Liquidity Ladder and Funding Commitments
Example: A Simple Ladder with Realistic Funding Events
Assume a family office has these monthly cash realities for the next year: living and tax outflows of $120,000 per month, plus a $300,000 annual tax payment that lands in October. The office also expects $160,000 per month in dividends and business distributions.
That leaves a baseline surplus of $40,000 per month, before any investing activity. Now add an illiquidity plan: two direct deals.
- Deal A requires a $150,000 deposit at signing, then $850,000 at closing 90–120 days later.
- Deal B is a secured loan with a $500,000 closing, plus a $100,000 working-capital top-up if certain covenants are met within 6 months.
A ladder might allocate:
- Immediate liquidity: $250,000 to cover the October tax payment and any shortfalls.
- Near-term liquidity: $200,000 for deposits and legal costs.
- Opportunistic liquidity: $600,000 for Deal A closing if timing matches.
- Illiquidity capacity: $1,000,000 for Deal B and any follow-on needs.
If Deal A closing slips by two months, the near-term bucket still covers the deposit and ongoing expenses, while the opportunistic bucket absorbs the delayed closing. The working-capital top-up for Deal B consumes illiquidity capacity because it depends on performance and timing.
Example: Funding Commitments with a Date Range
Suppose a preferred equity investment says: “Fund within 15 business days after regulatory approval.” Regulatory approval is expected around May 15, but could reasonably arrive between May 1 and June 15. Use a date range of May 20–July 5 for cash planning.
Then map that range to the ladder. If the opportunistic bucket only covers May, the investment should not be funded from that bucket alone. Either increase the opportunistic bucket capacity, shift the funding source to illiquidity capacity, or renegotiate terms that reduce timing uncertainty.
Operationalizing the Ladder in the Investment Committee
The committee should approve not only the deal, but the funding event mapping. A clean approval question is: “Which bucket pays for each cash event, and what happens if the event slips by 60 days?” If the answer is “we’ll figure it out,” the ladder is not yet designed.
A well-run ladder is boring in the best way: it turns private deal timing into a cash plan the family can actually follow.
2.3 Creating Allocation Targets Across Direct Strategies
Allocation targets are the bridge between your mandate and your deal pipeline. They answer three practical questions: how much capital you want in each direct strategy, how you fund it over time, and what you do when reality differs from the model.
Start with Strategy Definitions That Can Be Measured
Before setting numbers, define each direct strategy in operational terms. A strategy should have a clear target asset type, typical deal size, expected holding period range, and the main risks you’re accepting. For example, “control buyouts in lower-middle-market industrials” is measurable; “good businesses” is not.
Then translate each strategy into a capital behavior profile:
- Cash intensity: how much cash is tied up per dollar invested (equity vs. debt, working capital needs).
- Liquidity cadence: how often you expect partial exits, refinancings, or distributions.
- Decision frequency: how many deals you can realistically underwrite and monitor.
This prevents a common mistake: setting targets for strategies that behave like different species, then wondering why the portfolio feels chaotic.
Build a Capital Bucket Map
Use capital buckets to separate “available now” from “committed but not deployed” and “invested and illiquid.” A simple structure works well:
- Operating buffer: cash for expenses and near-term obligations.
- Opportunistic deployment: capital reserved for new deals that pass your screen.
- Committed capital: amounts already committed under signed terms.
- Invested capital: positions currently held.
Allocation targets should primarily govern the opportunistic deployment bucket, while committed and invested buckets are tracked for capacity and risk.
Convert Mandate Constraints into Allocation Rules
Your mandate constraints become allocation rules. Common rules include:
- Max concentration per strategy (e.g., no more than 35% of invested capital in one strategy).
- Max concentration per issuer (e.g., no more than 8% of invested capital in one company).
- Liquidity floor (e.g., maintain enough cash equivalents to cover 18 months of expenses and planned commitments).
- Leverage limits (e.g., avoid strategies that require leverage above a specified range).
A rule is only useful if it is measurable at decision time. If you can’t check it in an investment committee meeting, it’s not a rule yet.
Set Targets Using a Two-Layer Approach
Use two layers: strategic targets and tactical bands.
- Strategic targets are long-run weights across direct strategies based on your mandate, risk tolerance, and monitoring capacity.
- Tactical bands define acceptable ranges that let you act when opportunities appear.
Example: Suppose you run three direct strategies—control equity, minority growth, and secured credit.
- Strategic targets: 50% control equity, 30% minority growth, 20% secured credit.
- Tactical bands: control equity 40–60%, minority growth 20–40%, secured credit 10–30%.
When a deal is underwritten, you check whether it moves the portfolio within the tactical band. If it pushes you outside, you either require a stronger risk justification or you pass.
Use Capacity Math, Not Vibes
Capacity math links targets to deal flow. Estimate how many deals you can realistically close per year and the typical capital per deal.
Example calculation:
- You can underwrite and monitor 2 control deals per year.
- Typical control deal equity need is $25M.
- That implies annual deployment capacity of about $50M in control equity.
If your strategic target for control equity is 50% and your total deployable capital over the planning horizon is $200M, then the target implies $100M in control equity. If you can only deploy $50M per year, you should expect the portfolio to reach the target over time, not immediately.
Mind Map: Allocation Targets Across Direct Strategies
Allocation Targets Mind Map
Example: Turning Targets into Committee Decisions
Assume deployable opportunistic capital is $120M, and you have tactical bands as above.
Current invested weights:
- Control equity: 42%
- Minority growth: 33%
- Secured credit: 25%
A new control equity deal requires $18M equity. If you add it, control equity rises to roughly 47% (within the 40–60% band). You still check issuer concentration and liquidity floor, but the strategy-level target supports proceeding.
Now consider a second control equity deal requiring $22M. That would push control equity to about 54% (still within band), but if it also breaches issuer concentration or forces you to draw down the opportunistic bucket below your planned next-12-month commitments, the committee may require a smaller allocation, a different structure, or a pass.
Document the Target Framework So It Survives Busy Weeks
Your allocation targets should live in a one-page framework used during underwriting. Include:
- Strategy definitions and what qualifies as belonging to each strategy.
- Strategic targets and tactical bands.
- Concentration and liquidity rules.
- Capacity assumptions used for pacing.
When the portfolio is under pressure, this document keeps decisions consistent. It also makes post-deal learning cleaner, because you can compare outcomes to the rules you actually used.
2.4 Managing Concentration Limits and Position Sizing
Concentration is simple in definition and tricky in practice: it’s how much of your portfolio’s outcomes depend on a small number of positions. Position sizing is the tool that turns that definition into rules you can actually follow when a deal looks attractive.
Foundational Concepts That Prevent Accidental Overexposure
Start with three ideas.
First, concentration is not only about “% of portfolio.” It’s also about how correlated the risks are. Two positions can each be 5% and still behave like one 10% bet if they share the same customer base, geography, or financing structure.
Second, position size should reflect the liquidity path. A 12% position in a monthly-tradable security is not the same as a 12% position in a private company with a multi-year exit window.
Third, concentration limits should be enforced at multiple levels: per position, per strategy, per sector, and per “risk factor.” A family office that only limits per position often ends up with hidden clustering.
A Practical Framework for Concentration Limits
Use a layered limit system.
-
Hard limits prevent obvious overreach. Example: no single position may exceed 8% of investable assets, and no single issuer may exceed 10% including affiliates.
-
Soft limits guide behavior when you’re near the edge. Example: between 6% and 8%, new capital requires additional approval and a documented risk rationale.
-
Risk-factor limits address correlation. Example: total exposure to a single operating region cannot exceed 25% across all direct and co-investments.
-
Liquidity-aware limits separate “core” and “opportunistic” capital. Example: core illiquid positions may total 40% of investable assets, while opportunistic illiquid positions may total 15%.
Position Sizing That Matches Risk, Not Just Conviction
Position sizing should be driven by a few measurable inputs.
- Downside severity: how much value could plausibly fall before the investment thesis breaks.
- Time to liquidity: how long you might be stuck if conditions worsen.
- Control and protection: governance rights, information rights, and contractual downside buffers.
- Financing structure: leverage increases sensitivity to cash flow stress.
A simple method is to size by “risk budget.” If your portfolio has a target maximum loss tolerance for a given scenario, each position consumes part of that budget.
Example: Same Deal, Different Sizes
Assume two private deals each priced at $10 million.
- Deal A is equity in a profitable business with strong covenants and monthly reporting. You estimate a downside of 25% over two years.
- Deal B is equity in a business with weaker reporting and higher leverage. You estimate a downside of 45% over two years.
If your risk budget is proportional to downside, Deal B should be smaller. If Deal A is sized at 6% of investable assets, Deal B might be sized at about 6% × (25/45) ≈ 3.3%, before considering liquidity and correlation.
Correlation-Aware Concentration Using “Shared Drivers”
To avoid hidden clustering, group positions by shared drivers. Shared drivers are not vague categories like “tech.” They are concrete: top customer concentration, commodity input exposure, debt maturity timing, or regulatory regime.
Mind Map: Concentration Limits and Position Sizing
The Exposure Math You Actually Need
You need a repeatable way to compute exposure totals.
- Direct exposure: market value or latest valuation for each position.
- Look-through exposure: for co-investments or funds, include your effective share of underlying risk drivers.
- Affiliate exposure: treat related entities as one issuer when governance or cash flows are linked.
Then apply limits.
- If a new position would push you above a hard limit, you either reduce the size, restructure the deal, or decline.
- If it would push you into a soft limit zone, you can proceed only with documented mitigation steps, such as adding contractual protections or requiring a smaller initial tranche.
Example: A Deal That Passes the Thesis but Fails the Limits
Suppose you want to invest $6 million in a private logistics platform. The thesis is solid: improving margins and stable demand.
However, you already hold two positions totaling $14 million that both depend on the same regional trucking labor market and have similar debt maturity dates. Your risk-factor exposure to that driver is already at 24% of investable assets.
Your risk-factor hard limit is 25%. The new deal would raise it to 28% even if the position size stays within the per-position cap. The correct action is not to “hope it works out.” You reduce the position size, negotiate for a structure that lowers shared-driver exposure, or pass.
Implementation Rules That Make the System Stick
Concentration limits only work if they’re operational.
- Pre-trade checks: every investment proposal includes a concentration impact summary.
- Post-trade monitoring: valuations and risk-driver mappings are updated on a fixed cadence.
- Exception discipline: exceptions require a clear reason tied to mitigation, not just enthusiasm.
A good rule of thumb: if you can’t explain why a position is sized the way it is using your limit framework, you don’t yet have a sizing decision—you have a wish.
2.5 Implementing Rebalancing Rules for Illiquid Portfolios
Illiquid portfolios don’t rebalance by “selling what’s up.” They rebalance by combining three levers: (1) new money allocation, (2) controlled trimming when exits are available, and (3) capital planning that prevents accidental overexposure. The goal is not perfect symmetry; it’s disciplined drift control.
Foundational Concepts for Rebalancing
Target weights and tolerance bands. Start with target allocations by strategy or risk bucket (for example, buyouts, growth equity, private credit, real assets). Then define tolerance bands around each target. A common setup is: rebalance when a position breaches its band for two consecutive valuation cycles, or when the breach exceeds a larger “hard limit.”
Valuation cadence and measurement. Rebalancing depends on valuation updates. For illiquid holdings, you’ll often use quarterly marks, but the rebalancing trigger should be tied to the same cadence you can trust. If a strategy is marked monthly by management but others are marked quarterly, you’ll need different trigger logic, or you’ll rebalance on noise.
Liquidity ladder alignment. Rebalancing must respect the liquidity ladder you built earlier. If your next 12 months of liquidity is earmarked for commitments, you cannot assume you can fund trims. Rebalancing rules should explicitly state which liquidity bucket can be used.
Designing Rebalancing Triggers That Don’t Overreact
Use a layered trigger system so you don’t churn the portfolio.
- Soft trigger. Breach of tolerance band by a smaller amount. Action: review and plan, not trade.
- Decision trigger. Breach persists for two cycles or breaches by a larger amount. Action: decide whether to rebalance using available levers.
- Hard limit. Breach beyond a maximum concentration threshold. Action: immediate constraint—stop new allocations to that bucket until exposure returns within limits.
Example. Suppose your target for private credit is 20% with a ±5% band. If it rises to 26% after the first quarter, that’s a soft trigger. If it remains above 25% at the next quarter’s mark, it becomes a decision trigger. If it reaches 30%, you hit a hard limit and stop new credit allocations even if you still like the deals.
Rebalancing Levers and How to Use Them
Lever A: Allocate new capital to underweight buckets. This is the cleanest lever for illiquid portfolios because it avoids forced selling. When a bucket is underweight, prioritize new deals that fit the mandate and constraints.
Lever B: Trim only when you have a realistic exit path. Trimming can mean selling a minority stake, participating in a secondary, or reducing exposure via a structured redemption if available. The key is to require an exit path that is operationally feasible, not just theoretically possible.
Lever C: Use commitments and pacing. If you have discretion over future commitments, pacing is a rebalancing tool. For example, delay a planned follow-on investment until exposure is back within tolerance.
Example. Your real assets bucket is underweight by 4% and you have a planned commitment in 60 days. Instead of funding a new buyout deal, you allocate that commitment to a real asset opportunity that meets your underwriting thresholds.
A Practical Rule Set You Can Actually Run
Below is a rule set that balances rigor with operational sanity.
- Revaluation cycle: quarterly.
- Measurement basis: last available valuation for each holding; for funds or co-investments, use the latest reported NAV or agreed mark.
- Trigger logic:
- Soft trigger at ±5% from target.
- Decision trigger at ±7% from target for two consecutive quarters.
- Hard limit at ±10% from target.
- Action hierarchy: allocate new capital first; then consider trims only if an exit path exists within the next liquidity window.
- Documentation requirement: every decision trigger produces a one-page memo with drivers, liquidity check, and expected impact.
Mind Map: Rebalancing Rules for Illiquid Portfolios
Governance and Execution Details
Make the rules measurable. If “concentration risk” is vague, it will be interpreted differently by different people. Convert it into thresholds: maximum single-deal exposure, maximum sector exposure, and maximum strategy exposure.
Separate review from action. A soft trigger should not automatically force trades. It should trigger a review of underwriting assumptions, valuation methodology, and whether new allocations are being misdirected.
Use a liquidity gate. Before any trim or new allocation, confirm the liquidity gate: available cash plus near-term realizations minus committed funding obligations. If the gate fails, the action must be “plan only,” not “trade anyway.”
Example. In a quarter where private credit is above its hard limit, you still might not be able to trim because the secondary market bid is unattractive and the liquidity gate is tight. The correct response is to stop new credit allocations and reallocate new capital to underweight buckets that can be funded without violating the liquidity ladder.
Worked Mini-Scenario
Assume targets: buyouts 35%, private credit 20%, real assets 15%, public liquidity 30%. Bands: ±5% soft, ±7% decision, ±10% hard. After the quarterly marks dated 2026-02-26, private credit is at 27% (soft trigger), buyouts at 38% (soft trigger), and real assets at 12% (underweight). You have new capital to deploy and no feasible trims within the next liquidity window. The action is straightforward: direct new allocations toward real assets until it returns toward target, while pausing new credit deals and keeping buyouts within tolerance.
This is rebalancing that respects how illiquid portfolios actually behave: you manage drift with rules, not with wishful selling.
3. Sourcing Private Opportunities with Institutional Discipline
3.1 Building a Deal Universe and Maintaining Coverage
A family office that invests directly needs a deal universe that is both wide enough to find good fits and narrow enough to avoid wasting time. “Universe” does not mean everything in the world; it means a curated set of opportunities you can repeatedly evaluate with consistent effort.
Start with a Coverage Map
Begin by listing the exact deal types you can underwrite well. Coverage is easiest when it is anchored to what you can actually diligence: industries you understand, deal sizes you can finance, and ownership levels you can manage.
A practical coverage map has four layers:
- Target segments: e.g., profitable services businesses, founder-led manufacturers, or niche software with recurring revenue.
- Deal mechanics: buyouts, minority stakes, structured equity, or debt with warrants.
- Geography and language: where you can access management and legal counsel efficiently.
- Time and capacity: how many active processes you can support without turning diligence into a stress hobby.
Example: If your team can model 3-statement businesses but struggles with complex project accounting, you may include construction-adjacent services only when revenue is recurring and contract terms are standard.
Define Inclusion Rules and Exclusion Rules
Coverage improves when you set rules that are boring but enforceable.
Inclusion rules answer “What qualifies to enter the funnel?” Examples:
- Minimum revenue or EBITDA threshold.
- Business model that supports durable cash flow.
- Ownership structure that allows meaningful governance or information rights.
Exclusion rules answer “What gets filtered out early?” Examples:
- Deals requiring heavy reliance on unverifiable projections.
- Industries where regulatory risk dominates the investment thesis.
- Situations where you cannot obtain basic financial statements.
Example: A deal may look attractive on valuation, but if the seller refuses to share customer concentration details, it fails the inclusion rule for your first-pass memo.
Build a Repeatable Intake Workflow
A deal universe is maintained through process, not memory. Create a single intake channel and a consistent first-pass review.
A simple workflow:
- Intake: log the opportunity with source, industry, size, and ownership level.
- First-pass screen: confirm mandate fit, basic financial availability, and decision timeline.
- Triage: decide whether to request materials, schedule a management call, or decline.
- Funnel tracking: record outcomes so your team learns where good deals actually come from.
Example: If you notice that certain intermediaries consistently provide incomplete data, you can adjust your triage rules rather than blaming “market conditions.”
Create a Source Portfolio
Relying on one source makes your universe fragile. Instead, build a source portfolio that balances direct outreach, intermediaries, and existing relationships.
A useful split is not a fixed percentage; it is a coverage strategy tied to deal mechanics. For example:
- Direct outreach works well for founder-led businesses where relationships matter.
- Intermediaries help when you need deal flow across multiple segments.
- Existing relationships often produce higher-quality information because trust reduces friction.
Example: If you want minority stakes in stable businesses, you may prioritize direct outreach to operators and use intermediaries mainly to validate pricing ranges.
Maintain Coverage with a Cadence
Coverage is not a one-time build. It needs a cadence that matches your underwriting cycle.
A workable cadence:
- Weekly: review new intakes, update funnel status, and decide next steps.
- Monthly: refresh the coverage map based on what you actually saw.
- Quarterly: audit outcomes by source and segment to refine inclusion/exclusion rules.
Example: After three months, you may find that one segment produces many “almost fits” that fail due to governance constraints. You can tighten the governance inclusion rule for that segment.
Mind Map: Coverage System
Example: From Universe to Funnel
Suppose your mandate targets profitable niche distributors in North America with the ability to influence operations. You receive 40 inbound leads in a quarter.
- First-pass screen filters 20 due to missing financials or wrong size.
- Management calls happen for 12 where you can verify customer concentration and margins.
- Requests for materials go to 6 that meet governance and reporting expectations.
- Full diligence starts for 2 that pass valuation reasonableness and risk register completeness.
The point is not the numbers; it is the discipline. Your universe stays healthy because you can explain why deals entered or exited, and you can improve the rules based on evidence.
Quality Checks That Keep Coverage Honest
To prevent “coverage theater,” add checks that protect time:
- Data availability check before deep diligence.
- Mandate fit check before scheduling multiple calls.
- Decision timeline check so you do not chase processes that cannot close.
Example: If a seller insists on exclusivity before sharing basic customer concentration, you decline early. That keeps your universe credible and your team calm.
3.2 Using Relationships, Brokers, and Direct Outreach
Direct investing lives or dies on deal flow quality. Relationships help you see opportunities early; brokers help you see more of them; direct outreach helps you create coverage where none exists. The trick is to treat all three as one pipeline with shared standards, not three separate hobbies.
Relationship Sourcing That Produces Actionable Leads
Start with a simple taxonomy of relationships: operators (people who run businesses), owners (people who sell or recapitalize), and intermediaries (lawyers, accountants, bankers, and niche consultants). Each group is useful for different moments.
- Operators are best for “what’s actually happening” context. Example: a CFO you trust mentions that a mid-market manufacturer is planning a carve-out of a division, but only if the buyer can keep key staff.
- Owners are best for “what they will do” context. Example: an owner says they prefer a buyer who can close quickly because their succession plan is already scheduled for 2025-06.
- Intermediaries are best for “who else is involved” context. Example: a deal lawyer quietly confirms that a seller’s consent rights will require a specific lender sign-off.
Operational best practice: keep a one-page relationship brief per contact. Include what they care about, what they know, and what you can credibly offer. If you can’t explain your mandate in five sentences, you’ll waste their time and yours.
Broker Engagement Without Losing Control
Brokers can widen your funnel, but they also introduce noise: deals that are “available” but not truly ready, or priced as if certainty were free. To stay in control, set broker rules up front.
- Mandate clarity: provide a short investment profile with boundaries (ticket size, geography, control vs minority, preferred industries, and deal-breakers like customer concentration).
- Process expectations: require a consistent first-touch package—teaser, basic financials, and a timeline for management access.
- Feedback loop: insist on a reason code when you pass. “Not a fit” is not a reason code; “too much customer concentration” is.
Example: you receive a broker teaser for a software services firm. The broker claims “strong recurring revenue,” but your first-pass memo finds that 40% of revenue comes from one client. You pass, and you tell the broker the exact constraint. Two weeks later, the broker sends a different firm with a similar model but a more diversified customer base.
Direct Outreach That Feels Like Work, Not Guesswork
Direct outreach works when it is targeted and structured. The goal is not to “pitch”; it is to earn a conversation that reveals whether a deal is real.
Use a three-step outreach sequence:
- Identify a specific trigger. Triggers include leadership changes, facility expansions, new financing, major customer churn, or a planned succession event.
- Send a short message tied to that trigger. Keep it factual and mandate-driven.
- Ask one precise question that helps you qualify. Example: “Are you exploring a recapitalization or sale of the division, or is this only internal planning?”
Example message (adapted for a family office tone):
We invest in profitable, cash-generative businesses where we can support long-term ownership. We noticed leadership changes at your operations team and wanted to ask whether you are considering a recapitalization or sale of a specific business line in the next 6–12 months. If not, no problem—could you point us to the right person for capital conversations?
Mind Map: Relationships, Brokers, and Direct Outreach
Integrated Pipeline: From First Contact to Qualified Deal
To keep the channels from colliding, use shared gates.
- Gate 1: Mandate fit. Confirm ticket size, control preference, and constraints.
- Gate 2: Readiness. Ask for timeline, data availability, and decision-maker identity.
- Gate 3: Initial risk scan. Check concentration, leverage, and operational red flags.
Example: a relationship lead suggests a potential acquisition. You still run the same Gate 1–3 process you would for a broker deal. The relationship provides early context, but your qualification work remains consistent. That consistency is what turns “good contacts” into repeatable deal flow.
Case Example: One Week, Three Channels
On Monday, an operator relationship shares that a regional logistics firm is considering a partial sale to fund a warehouse upgrade. On Wednesday, a broker sends a teaser for a similar firm, but your Gate 2 readiness check shows the seller is not decision-ready for 90 days. On Friday, your direct outreach to a finance director—triggered by a recent refinancing—results in a conversation with the person who controls the process. By the end of the week, you have one qualified path and two informative dead ends, each with a documented reason code. That’s the quiet logic: you learn from every channel, but you only spend deep time where the gates say “yes.”
3.3 Screening for Fit Using Mandate and Constraints
Screening for fit is where you stop being impressed by a good story and start being confident the deal can live inside your family office’s rules. The goal is not to predict the future; it’s to filter out deals that violate your mandate, ignore your constraints, or require you to pretend away key risks.
Start with Mandate Boundaries, Not Deal Details
A mandate is a set of allowed behaviors. Constraints are the “nope” list that prevents one attractive opportunity from breaking the portfolio. Begin with a one-page checklist that mirrors your Investment Policy Statement.
Use three layers:
- Eligibility: Does the opportunity match your target asset types, geographies, and ownership style?
- Capacity: Can you fund it without harming liquidity needs or other commitments?
- Compatibility: Does it fit your governance preferences, reporting expectations, and risk tolerance?
Example: Your mandate targets profitable businesses with recurring revenue. A deal offers a fast-growing platform but has volatile customer churn and revenue recognized under aggressive assumptions. Even if the valuation looks cheap, the eligibility fails because the revenue profile conflicts with your underwriting comfort.
Translate Constraints into Measurable Filters
Constraints should be testable. Convert vague preferences into thresholds you can check quickly.
Common constraint categories:
- Liquidity: maximum illiquid exposure, minimum cash buffer, and acceptable time-to-exit.
- Concentration: limits by issuer, sector, and single-manager or sponsor.
- Leverage: maximum debt-to-EBITDA or minimum interest coverage.
- Control and Governance: minimum information rights, board seat expectations, and consent matters.
- Operational Risk: customer concentration limits, regulatory exposure, and key-person dependency.
Example: You cap single-position exposure at 8% of investable assets. A proposed equity check is 10%. The screening outcome is “not fit as proposed,” even if the business is excellent. You can still proceed if the sponsor offers a smaller tranche, you co-invest with a structure that reduces your exposure, or you negotiate a different allocation.
Run a Two-Stage Screen to Avoid False Negatives
Stage 1 is fast and conservative. Stage 2 is a deeper review only for deals that pass the first gate.
Stage 1: Mandate Fit (1–3 hours)
- Asset type and geography match
- Ownership style and governance rights are compatible
- Basic financial profile fits underwriting assumptions
- Deal size fits capacity and concentration rules
Stage 2: Constraint Fit (half day to two days)
- Confirm leverage and downside resilience
- Validate customer/supplier concentration
- Check reporting cadence and information rights
- Review legal structure for enforceability of protections
Example: A minority stake in a regulated business might pass Stage 1 if you accept minority positions. It fails Stage 2 if the agreement limits information rights to annual summaries and requires consent for basic operational changes you would need during a turnaround.
Use a Fit Scorecard with Clear Pass/Fail Rules
A scorecard prevents “gut feel” from dominating. Keep it simple: each criterion is either pass, conditional, or fail.
- Pass: meets the rule as written.
- Conditional: meets the spirit but needs negotiation or additional documentation.
- Fail: violates a hard constraint.
Example: Your constraint says you require quarterly reporting. If the sponsor offers quarterly financials but delays them by 120 days, mark it conditional. If the offer is annual only, mark it fail.
Mind Map: Screening for Fit
Convert Outcomes into Actionable Next Steps
Every screening result should produce a next action, not just a verdict.
- Pass: request full diligence materials and start the investment memo.
- Conditional: list negotiation points and required documents (for example, revised reporting terms, revised cap table, or updated leverage covenants).
- Fail: record the reason code so you don’t re-litigate the same mismatch later.
Example: You fail a deal because it exceeds your leverage constraint. Later, the sponsor offers to refinance before closing. That changes the constraint inputs, so the deal can re-enter Stage 2 with updated terms. The key is that the screening system tracks what changed, not just that you feel more comfortable.
Keep the Screen Honest with Evidence Standards
Require evidence for each pass or conditional. If you cannot verify a constraint with documents, treat it as conditional at best.
Example: A sponsor claims “low customer concentration,” but the customer list is missing. Mark it conditional and request the schedule. If they refuse, the deal cannot pass constraint fit because the risk is unmeasured.
Screening for fit is the quiet work that protects your time, your capital, and your decision quality. When the rules are explicit and the checks are evidence-based, the investment committee spends less time arguing about taste and more time evaluating facts.
3.4 Running a Standardized First Pass Investment Memo
A first pass investment memo is the fastest way to turn a messy deal conversation into a decision-ready question. It should be short enough to write in one sitting, but structured enough that another person could review it and understand what you think, why you think it, and what would change your mind.
Start by capturing the deal in plain language. Use one paragraph for what is being bought, by whom, and for what purpose. Then add a second paragraph for the seller’s story and the buyer’s story, even if they overlap. Differences matter: if the seller emphasizes growth while you emphasize cash flow stability, you will model different risks.
Next, translate the family office mandate into deal filters. If your policy says you prefer downside protection, you should explicitly state which parts of the deal are expected to provide it, such as contract terms, asset backing, or customer diversification. If your policy says you avoid illiquidity beyond a certain bucket, you should state which bucket this deal would occupy and what liquidity events you can realistically rely on.
Memo Template That Forces Clarity
Use the same headings every time. The goal is not bureaucracy; it is comparability.
- Deal Snapshot: asset/company, geography, stage, ownership sought, price basis, and expected closing timeline.
- Why This Deal Fits: mandate alignment in two to four bullets.
- Key Facts and Assumptions: the five numbers you will build the model on.
- Preliminary Valuation View: method you intend to use and the reason.
- Top Risks: three risks with a one-line “how it shows up” description.
- Initial Mitigations: what contract terms, covenants, or diligence steps address each risk.
- Decision Recommendation: proceed to full diligence, request more information, or pass.
- Information Needed Next: a short checklist that maps directly to the risks.
A good memo ends with a decision, not a mood. If you cannot recommend proceed/request/pass, you probably have not identified the decision-critical uncertainties.
Mind Map: First Pass Memo Flow
Example: A First Pass Memo for a Small Industrial Acquisition
Deal Snapshot: Acquire a privately held machine parts business for $18M enterprise value. Buyer seeks 100% equity. Closing targeted for 30–45 days after diligence.
Why This Deal Fits:
- Mandate prefers cash-generating businesses with tangible assets.
- Target customer concentration is manageable based on preliminary revenue splits.
- Deal size fits the family office’s direct investing bucket with multi-year holding capacity.
Key Facts and Assumptions:
- Trailing twelve-month revenue of $12M.
- Normalized EBITDA margin of 18% after removing one-time expenses.
- Working capital needs average 8% of revenue.
- Capex requirement is roughly 3% of revenue.
- Customer churn is low based on stated contract terms.
Preliminary Valuation View: Use an EBITDA multiple range as a cross-check, then anchor to a conservative cash flow build. The reason is that the business has stable production economics but limited public comps.
Top Risks:
- Customer concentration risk shows up as revenue drop if one large account renegotiates.
- Quality-of-earnings risk shows up as margin compression after normalizing expenses.
- Operational execution risk shows up as delayed capex or supplier disruptions.
Initial Mitigations:
- Request customer contract terms and any renewal history.
- Ask for last three years of expense detail and payroll breakdown.
- Include a capex schedule covenant or a post-closing working capital true-up.
Decision Recommendation: Proceed to full diligence if the seller can provide customer contract documentation and expense normalization support.
Information Needed Next:
- Customer list with revenue percentages and renewal dates.
- Detailed general ledger and expense schedules.
- Supplier concentration and lead-time data.
- Draft purchase agreement terms for working capital and indemnities.
Common Failure Modes and Fixes
A frequent mistake is writing a memo that lists risks but not the evidence you need to confirm or dismiss them. If you cannot name the document, report, or data point you will request next, the risk section is probably decorative.
Another mistake is letting the valuation section become a guess. Even in a first pass, you should state the valuation method you will use and the reason you trust it for this specific deal.
Finally, keep the recommendation tied to the memo’s own uncertainties. If your recommendation is “proceed,” your next-information checklist should directly address the top risks you listed. Otherwise, you are not standardizing—you are hoping.
3.5 Documenting Deal Flow, Funnel Metrics, and Outcomes
A family office that invests directly needs a paper trail that is both lightweight and decision-useful. The goal is simple: every deal should have a clear story from first contact to final outcome, and the numbers should explain why decisions happened.
Deal Flow Records That Match How Decisions Are Made
Start by defining the minimum fields that let someone else reconstruct the logic. For each deal, capture:
- Deal identity: counterparty name, asset type, geography, and a short one-line description.
- Source and date: where it came from and the first date you logged it (use a consistent format like 2026-02-15).
- Stage: the current funnel stage (not a vague label like “in progress”).
- Owner: the person responsible for diligence and the investment memo.
- Decision history: dates and outcomes for each committee or approval step.
- Key constraints: which mandate rules it hits or violates (for example, leverage cap, concentration limit, or required governance rights).
- Next action: what must happen before the next stage move.
A practical best practice is to treat the deal record as a living document. When new information arrives, update the record immediately so the funnel metrics reflect reality, not yesterday’s optimism.
Funnel Stages with Clear Entry and Exit Criteria
Funnel stages should be defined by what you can verify, not by what you hope to learn. A common structure:
- Screening: basic fit check against mandate and constraints.
- Initial Diligence: confirm business basics and request core documents.
- Deep Diligence: financial normalization, operational review, legal review.
- IC Review: underwriting model and decision memo complete.
- Term Negotiation: structure and protections finalized.
- Closing: funds deployed.
- Post-Closing Monitoring: reporting cadence and value creation plan.
Each stage needs an exit rule. Example: a deal can move from Initial Diligence to Deep Diligence only after you have at least (a) two years of financials, (b) customer concentration data, and (c) a draft term sheet or governance proposal.
Funnel Metrics That Explain Behavior
Track metrics at the deal level and at the stage level. Stage-level metrics answer “where do deals stall?” Deal-level metrics answer “what happened and why?”
Key metrics:
- Conversion rate by stage: percentage of deals moving from one stage to the next.
- Time-in-stage: median days per stage, plus the 75th percentile to spot bottlenecks.
- Rejection reasons: a controlled list of reasons (for example, valuation too high, governance unacceptable, downside not covered, documentation incomplete).
- IC decision outcomes: approved, approved with conditions, deferred, rejected.
- Outcome type: closed, walked away, sold before closing, or re-entered later.
Example: If 40% of deals are rejected at IC Review due to “downside not covered,” you should inspect whether underwriting assumptions are too optimistic or whether your risk register is too generic.
Outcome Documentation That Makes Learning Concrete
Outcomes should be recorded in a consistent format so you can compare deals without mental gymnastics.
For each closed deal, capture:
- Entry thesis: three bullet points tied to underwriting drivers.
- Key risks identified: the top two risks and how you mitigated them.
- Actual results at milestones: revenue, margin, cash conversion, and any covenant events.
- Variance notes: what differed from the base case and why.
- Value creation actions: what you did as owners (for example, governance changes, hiring support, pricing discipline).
For deals that do not close, record:
- Decision trigger: the specific new fact that changed the decision.
- Counterfactual: what would have needed to change to proceed (for example, lower purchase price by a defined range, stronger information rights, or reduced customer concentration).
This is where the “quiet logic” shows up: you are not just tracking performance, you are tracking decision quality.
Mind Map: Deal Flow, Metrics, and Outcomes
Example: One Deal, End to End
A deal is logged on 2026-02-15 after a founder referral. It passes Screening because it fits the sector and stays within the leverage cap. During Initial Diligence, you request customer concentration and receive data showing the top customer is 55% of revenue, which violates your internal concentration threshold unless governance includes enhanced reporting and consent rights for major customer contracts. You proceed to Deep Diligence to verify whether the concentration is structural or temporary.
At IC Review, the memo shows downside cash flow coverage is acceptable only if the top customer renews within 90 days. The IC rejects the deal because the term sheet does not include the consent rights needed to manage renewal risk. The rejection reason is recorded as “governance insufficient for concentration risk,” and the record notes the counterfactual: proceed only with consent rights and quarterly reporting on renewal progress.
Later, the same seller returns with revised protections. The deal re-enters Term Negotiation, and the funnel metrics reflect a re-entry rather than a brand-new deal. That small bookkeeping choice keeps your conversion rates honest and your learning usable.
4. Due Diligence That Survives Real Ownership
4.1 Creating a Due Diligence Plan and Workstreams
A due diligence plan is a map of questions, owners, timelines, and evidence. For direct investing, it also prevents the classic problem: you approve a deal based on a good story, then discover the story was missing the boring parts—like how revenue is actually collected or why margins moved.
Step 1: Lock the Purpose and Decision
Start by writing a one-paragraph “decision statement” that answers: what decision are we making, by when, and what would make us say no. Example: “By May 15, we decide whether to invest $10M in a controlling stake. We will reject if customer concentration exceeds 25% of revenue for the last 12 months, or if working capital needs are structurally negative.” This statement becomes the filter for every workstream.
Step 2: Translate the Mandate into a Diligence Checklist
Turn the investment thesis into testable items. If the thesis is “durable demand,” diligence must include churn, contract terms, and renewal behavior. If the thesis is “operational improvement,” diligence must include baseline KPIs, cost drivers, and whether improvements are within management control.
A practical way to structure this is to group questions into five buckets:
- Business quality
- Financial truth
- Legal and compliance reality
- Operations and people
- Deal-specific risks
Step 3: Define Workstreams with Clear Outputs
Each workstream should produce a tangible output, not just notes. Typical outputs:
- A risk register entry with severity and mitigation owner
- A quantified adjustment to valuation or underwriting assumptions
- A list of open questions that block investment committee approval
Example workstreams and outputs:
- Commercial Workstream: customer concentration analysis, churn/renewal summary, sales pipeline quality, and a “top 10 customer” evidence pack.
- Financial Workstream: normalized P&L bridge, working capital analysis, revenue recognition review, and a reconciliation of management reporting to audited statements.
- Legal Workstream: material contracts review, litigation and claims summary, IP ownership confirmation, and a consent/approval checklist.
- Operational Workstream: process maps for key workflows, capacity and bottleneck assessment, and a staffing/retention risk summary.
- Integration or Governance Workstream: board mechanics, information rights, and a first-90-days operating plan outline.
Step 4: Set Evidence Standards and a “Red Flag” Threshold
Define what counts as evidence. “We were told” is not evidence; “we reviewed the contract and invoices” is. Create a red flag threshold that triggers escalation. Example thresholds:
- Any single customer > 25% of revenue without long-term contract protections
- Revenue recognition exceptions that materially change trailing twelve-month revenue
- Missing title or unclear IP ownership for core products
Step 5: Build a Timeline That Matches the Data Room
A data room rarely arrives in perfect order. Plan around dependencies.
- Week 1: request and review core documents (financials, cap table, material contracts, org chart)
- Week 2: run deep dives (customer interviews, revenue recognition, operational walkthroughs)
- Week 3: quantify adjustments and draft risk register and diligence summary
Use a single “question log” shared across workstreams so answers don’t get lost in separate spreadsheets.
Step 6: Assign Owners and Escalation Paths
Every workstream needs an owner and a backup. Add an escalation rule: if a red flag is found, the workstream owner must notify the diligence lead within one business day with the evidence and the decision impact.
Mind Map: Due Diligence Plan Workstreams
Example: A Two-Page Diligence Plan Template
Use a compact plan so the team can execute without rewriting it midstream.
- Decision statement: controlling stake, underwriting assumptions, rejection criteria
- Workstreams and owners: one owner per bucket, with backup
- Evidence list: documents and artifacts required per workstream
- Question log rules: how questions are logged, answered, and closed
- Red flags: thresholds and escalation steps
- Deliverables: risk register, valuation adjustments, and final diligence memo
Example: How a Workstream Produces a Valuation Adjustment
Suppose the financial workstream finds that revenue includes services billed upfront but delivered over time, and the company has been recognizing revenue at billing. The workstream:
- identifies the accounting policy and compares it to contract terms,
- estimates the portion that should be deferred,
- updates the normalized revenue and margin assumptions,
- records the adjustment in the risk register with a mitigation note (e.g., tighter recognition controls post-close).
That chain turns “we noticed something” into a decision-ready number and a concrete next step.
4.2 Financial, Operational, and Legal Review Coordination
A family office’s due diligence only works when the three review streams—financial, operational, and legal—share the same questions, the same timeline, and the same definitions of “what good looks like.” Coordination is not bureaucracy; it is how you avoid paying for the same mistake three times.
Start with a Shared Review Map
Before requesting documents, align on a single review map that lists: (1) the decision the investment committee will make, (2) the risks that could change that decision, and (3) the evidence each risk requires.
A practical approach is to run a 60-minute “evidence meeting” with the deal lead, finance reviewer, operator reviewer, and legal counsel. The output is a one-page checklist where each item has an owner and a due date. If the checklist is missing, you will see it later as duplicated requests, inconsistent findings, and last-minute legal surprises.
Define the Data Room Cadence and Ownership
Set a cadence that matches how evidence is produced.
- Day 0–3: Core documents and baseline facts (financial statements, cap table, material contracts, org chart).
- Day 4–10: Deep dives (customer concentration, revenue recognition support, operational KPIs, litigation and compliance).
- Day 11–15: Reconciliation and closure (open questions resolved, model assumptions confirmed, legal issues summarized).
Assign a single “document librarian” who tracks versions and answers “which file is current?” This role prevents the classic scenario where finance models last quarter’s numbers while legal reviews a revised agreement.
Financial Review Inputs That Legal and Ops Need
Financial review is not just about profitability; it is about what the business can prove.
Key coordination points:
- Revenue recognition and contract terms: Legal confirms the contractual triggers; finance tests whether reported revenue matches those triggers.
- Working capital and cash conversion: Ops provides operational drivers; finance translates them into cash flow assumptions.
- Debt and covenants: Legal identifies covenant definitions; finance checks whether historical compliance supports the ability to service debt.
Example: If a contract allows customers to defer payment until installation, finance should not assume “revenue equals cash.” Legal verifies the clause language, and ops confirms the installation timeline and typical delays.
Operational Review Inputs That Finance and Legal Need
Operations tells you whether the numbers are repeatable.
Key coordination points:
- Process reality versus reported metrics: Ops validates how KPIs are measured and whether they can be gamed.
- Cost structure drivers: Ops explains which costs are fixed, variable, or discretionary.
- Customer and supplier dependencies: Ops identifies concentration and switching friction; finance tests the financial impact.
Example: If the business reports stable gross margin, ops should explain whether margin stability comes from pricing power, product mix, procurement terms, or labor efficiency. Finance then models which driver is most sensitive to a downturn.
Legal Review Inputs That Finance and Ops Need
Legal review should be treated as a risk translation exercise, not a document scavenger hunt.
Key coordination points:
- Material contracts: Legal flags termination rights, change-of-control clauses, exclusivity, and audit rights.
- Litigation and compliance: Legal summarizes claims, regulatory exposure, and remediation obligations.
- Ownership and authority: Legal confirms who can sign, what approvals are required, and whether there are restrictions on transfers.
Example: A “minor” customer contract clause can matter if it grants the customer a right to renegotiate pricing upon a change in ownership. Legal flags it; finance adjusts margin assumptions; ops confirms whether renegotiation has occurred historically.
Use a Single Risk Register with Cross-Stream Evidence
Create one risk register with three columns: Risk, Evidence Needed, and Owner Stream. Each risk entry should specify what would change the investment view.
- Financial owner: provides model sensitivity and accounting support.
- Operational owner: provides process evidence and KPI validation.
- Legal owner: provides clause-level findings and enforceability notes.
Close the Loop with a Reconciliation Meeting
On the final day, hold a reconciliation meeting where each stream reports findings using the same structure: (1) what we found, (2) what it means for assumptions, (3) what documents support it, and (4) what remains unresolved.
If finance says “we assume revenue is sustainable,” legal should ask “sustainable under which contract terms?” If ops says “margin is driven by procurement,” finance should ask “what happens if suppliers change pricing?” This meeting prevents the three-stream version of telephone.
Mind Map: Coordinated Review Workstreams
Example: One Risk, Three Streams
Risk: Customer churn increases after ownership change.
- Legal: Identify change-of-control clauses and termination/renegotiation rights.
- Operational: Review historical churn patterns and onboarding/offboarding process.
- Financial: Model revenue impact using churn sensitivity and contract-level pricing terms.
When the three streams agree on the evidence, the investment committee gets a coherent story: not three separate reports, but one decision-ready view.
4.3 Quality of Earnings and Normalization of Results
Quality of earnings (QoE) answers a simple question: “How much of reported profit is actually repeatable, and what was borrowed from the future or created by accounting choices?” Normalization turns messy, deal-specific results into a consistent view that can be underwritten. In a family office context, this matters because private deals often lack the comforting uniformity of public reporting—so you build your own consistency.
The Starting Point: What “Quality” Means
QoE is not about finding fraud; it’s about separating three layers of profit:
- Core operating performance that should persist if the business continues.
- One-time or non-recurring items that should not be assumed in future underwriting.
- Accounting-driven distortions such as timing differences, classification choices, and management estimates.
A practical rule: if an adjustment is not supported by evidence (documents, contracts, bank statements, or clear accounting logic), it doesn’t earn a place in the normalized model.
Normalization Workflow That Stays Auditable
Use a repeatable sequence so different analysts don’t “discover” different realities.
- Recast the income statement into a standardized format: revenue, gross margin, operating expenses, and below-the-line items.
- Identify adjustment candidates by scanning for unusual movements, non-standard line items, and management explanations.
- Classify each item as one-time, timing, or accounting policy.
- Quantify the adjustment using the best available source, then document the method.
- Reconcile to cash where possible, especially for working-capital-heavy businesses.
A good QoE file includes a short “why” for each adjustment and a “how” that another person could replicate.
Common Adjustment Categories with Easy Examples
One-time events
- Example: A business incurred $120,000 of legal fees to resolve a dispute that ended in the prior year. If invoices and the settlement agreement show the matter is closed, you remove it from normalized operating expense.
- Example: A customer bankruptcy caused a $60,000 write-off. If the company has a policy for bad debt and this is outside normal experience, you adjust it separately rather than blending it into recurring credit loss.
Timing differences
- Example: Revenue includes $200,000 of year-end billings that were delivered after year-end. If shipping records show delivery dates, you shift revenue to the correct period.
- Example: Expenses include a prepayment for a multi-year insurance policy. You normalize by expensing only the portion that relates to the period.
Accounting policy and estimate effects
- Example: Management changed the method for capitalizing software development costs. You normalize by applying a consistent policy across periods, using internal project documentation.
- Example: Warranty reserves were increased aggressively to reduce current-year earnings. If warranty claims history supports a different reserve level, you adjust the reserve to a defensible baseline.
Non-operating items
- Example: Interest income on excess cash should not be treated as operating performance. You keep it separate so the underwriting focuses on business operations.
The Cash Reality Check
Accrual profits can look great while cash quietly disagrees. For QoE, compare earnings to cash conversion:
- Working capital movements: If accounts receivable rose sharply while revenue stayed flat, you may be seeing collection timing rather than true growth.
- Inventory: If inventory increased without a corresponding sales trend, gross margin may be inflated by under-provisioning or slow-moving stock.
- Payables: If payables are stretched to fund operations, normalized operating cash flow may be lower than reported earnings suggest.
A simple test: compute “normalized EBITDA to cash” by adjusting for working capital changes and non-cash items. You’re not trying to predict the future perfectly; you’re trying to avoid underwriting a profit that depends on temporary balance-sheet behavior.
Building a Normalized Earnings Bridge
A bridge makes adjustments transparent and prevents “black box” modeling.
- Start with reported EBITDA.
- Add or subtract one-time items.
- Adjust for timing and classification.
- Normalize recurring but mis-stated estimates (like reserves) to a defensible baseline.
- End with normalized EBITDA.
Keep the bridge tied to specific lines in the financial statements and the supporting evidence in your workpapers.
Mind Map: Quality of Earnings and Normalization
Example: A Small Bridge in Practice
Assume a seller reports $1,000,000 EBITDA.
- Legal fees: $120,000 one-time (removed).
- Year-end revenue: $80,000 billed before delivery (timing adjustment reduces revenue and EBITDA).
- Warranty reserve: reported reserve implies $40,000 higher expense than claims history supports (normalize by adding back $40,000).
Normalized EBITDA becomes:
$1,000,000 - 120,000 - 80,000 + 40,000 = $840,000.
Notice what this does: it doesn’t just “reduce profit.” It explains which parts were timing, which were non-recurring, and which were estimate-driven. That clarity is what makes the underwriting model usable in an investment committee discussion.
4.4 Customer, Supplier, and Revenue Concentration Checks
Concentration checks answer a simple question: if one relationship breaks, how much does the business wobble? In private deals, this matters because you often buy limited visibility into customer churn, supplier fragility, and revenue mix shifts. The goal is not to find “perfectly diversified” companies; it’s to measure dependency, understand why it exists, and confirm the company has a plan that doesn’t rely on wishful thinking.
Foundational Concepts and What to Measure
Start by separating three concentration types:
- Customer concentration: dependence on a small number of customers for revenue.
- Supplier concentration: dependence on a small number of suppliers for inputs, components, or logistics.
- Revenue concentration: dependence on a small number of products, services, channels, geographies, or contract types.
A practical approach uses both share and risk mechanics:
- Share: What percentage of revenue (or cost of goods sold) comes from the top customer(s) or supplier(s)?
- Mechanics: Why does the concentration exist, and what happens if it changes?
Example: A company may have 30% revenue from one customer. If that customer is a long-term contract with pricing protection and the company has a qualified second source, the risk is different than if the 30% is a short-term spot arrangement with no alternative buyers.
Customer Concentration Checks
Step 1: Build a Customer Dependency Table
Create a table for the last 12–24 months showing, for each major customer:
- Revenue amount and percentage of total
- Contract type (fixed price, time-and-materials, subscription, usage-based)
- Term and renewal dates
- Concentration trend (stable, increasing, declining)
- Any known churn signals (late payments, scope reductions, renegotiations)
Easy example: If the top customer is 25% of revenue and has been stable for two years, you still check whether the contract renews in the next quarter and whether pricing resets are unfavorable.
Step 2: Test “What If” Scenarios
Ask the company to quantify impacts under two simple cases:
- Customer loss: revenue drops by the customer’s share.
- Customer renegotiation: margins compress due to price pressure.
Then connect the scenario to operational reality. If the company can reallocate sales effort quickly and has a pipeline that converts, the downside is less severe. If sales capacity is already fully utilized and the product is customized, the downside is sharper.
Step 3: Verify the Quality of Revenue
Customer concentration risk increases when revenue is fragile. Confirm whether revenue is supported by:
- Backlog or contracted commitments
- Repeat purchase behavior
- Service delivery capacity
- Collection history
Example: A business with concentrated customers but strong backlog may be less exposed than a business with concentrated customers and high reliance on new orders each month.
Supplier Concentration Checks
Step 1: Map Inputs to Suppliers
Supplier concentration is often hidden inside cost lines. Build a mapping from major inputs to suppliers:
- Input category (e.g., resin, chips, freight)
- Annual spend and percentage of total input cost
- Supplier share for each input
- Lead times, minimum order quantities, and qualification requirements
Easy example: A company may not “feel” supplier concentration if it buys through a distributor. Still, the distributor may depend on one upstream manufacturer, so you ask who actually produces the critical input.
Step 2: Assess Substitutability
For each top supplier, evaluate:
- Technical interchangeability (drop-in replacement or engineering work)
- Qualification time and cost
- Contract terms (exclusivity, termination clauses)
- Risk of supply disruption (single plant, geopolitical exposure, capacity constraints)
A useful diligence question is: “How long would it take to qualify a second source for the top input?” If the answer is “we’ve never tried,” that’s a data point, not a conclusion.
Revenue Concentration Checks
Revenue concentration is about where money comes from, not just who pays. Break revenue into drivers:
- Product or service lines
- Contract types (one-time vs recurring)
- Customer segments
- Geography
- Channel (direct, reseller, platform)
Then check whether concentration is structural or temporary:
- Structural: the business model naturally depends on a few offerings or geographies.
- Temporary: a recent shift created a temporary skew.
Example: If 60% of revenue comes from one product line that represents the company’s only route to margin, you focus on product lifecycle risk and customer adoption. If the skew is due to a one-off project, you focus on normalization and whether the pipeline supports the next cycle.
Mind Map: Concentration Checks Workflow
Turning Findings into a Risk Register
For each concentration item, record:
- Exposure: the measured share (e.g., top customer = 25% of revenue)
- Failure mode: loss, margin compression, supply interruption, or demand shift
- Time to impact: immediate (contract termination) vs delayed (lead time)
- Mitigations: contractual protections, diversification plan, qualification of alternatives
- Monitoring triggers: renewal dates, payment behavior, supplier lead time changes
Example: If a supplier is 40% of a critical input cost and qualification of a second source takes 9 months, the monitoring trigger should include lead time drift and any supplier capacity warnings, not just annual spend.
Practical Example: One Company, Three Concentrations
Assume a manufacturer with:
- Top customer = 28% of revenue
- Top supplier = 35% of input cost
- Revenue concentration = 55% from one product line
A coherent conclusion might look like this:
- Customer risk is moderate if the contract renews annually with pricing floors and the company has a credible replacement pipeline.
- Supplier risk is higher if the input is specialized and second-source qualification takes 6–12 months.
- Revenue risk is meaningful if the product line is tied to a single customer segment and margins depend on that segment’s volume.
The checks work together: customer concentration can amplify revenue concentration, and supplier concentration can constrain the company’s ability to serve alternative customers. That interaction is often where diligence earns its keep.
4.5 Risk Register Construction and Mitigation Tracking
A risk register is not a spreadsheet museum. It is a working instrument that connects what could go wrong to what you will do about it, and who will do it. For private deals, the register should cover both deal-specific risks and ownership risks that emerge after closing.
Foundations for a Useful Register
Start with a consistent risk definition: a risk is an uncertain event that, if it occurs, changes outcomes (value, cash flow, timing, or control). Each entry must include four things: a clear description, a measurable impact, a likelihood estimate, and a mitigation plan that has an owner and a due date.
A practical impact scale keeps discussions grounded. For example, define impact as a range of potential value or cash-flow effect. Use categories like “Material” (could change entry decision), “Moderate” (may require structuring changes), and “Low” (manageable within normal operations). Likelihood can be “Unlikely,” “Possible,” or “Likely,” based on evidence from diligence.
Risk Identification That Doesn’t Miss the Obvious
Use workstreams from diligence to seed the register: financial quality, operations, customers and suppliers, legal and compliance, and governance. Then add cross-cutting risks: information gaps, key-person dependency, and execution risk in the first 90–180 days.
A simple rule: if diligence produced a question, it belongs in the register unless it was resolved with evidence. If diligence produced a “we’ll see,” it belongs in the register with a trigger for follow-up.
Risk Register Fields That Support Decisions
Use a template with these fields:
- Risk statement: what could happen, in plain language.
- Cause: what mechanism makes it plausible.
- Impact: what changes if it occurs.
- Likelihood: based on evidence.
- Risk rating: derived from impact and likelihood.
- Mitigation: what you will do before or after closing.
- Owner: the person accountable.
- Timing: when mitigation happens.
- Trigger and monitoring: what you will watch.
- Residual risk: what remains after mitigation.
- Evidence: where the assessment came from.
Mind Map: Risk Register Architecture
Mitigation Tracking That Stays Actionable
Mitigation plans should be written as tasks, not aspirations. If the mitigation is “improve reporting,” specify what reporting changes, by when, and how you will verify it. If the mitigation is “protect downside,” specify the contractual mechanism and the condition precedent.
A good tracking cadence is monthly for active diligence and first-quarter integration, then quarterly for stable ownership. Each cycle should update likelihood and residual risk based on new evidence, not on vibes.
Example: Operational Risk with Clear Triggers
Risk statement: Customer churn accelerates because service quality degrades during transition.
- Cause: key technicians are overloaded; onboarding documentation is incomplete.
- Impact: Moderate to Material reduction in recurring revenue and valuation.
- Likelihood: Possible based on current backlog and turnover.
- Mitigation: Pre-close contract requires transition plan approval and a service-level reporting covenant; post-close, implement technician capacity plan and weekly backlog review.
- Owner: Operating partner.
- Timing: Transition plan by 2026-02-26; weekly reviews start at day 7.
- Trigger and monitoring: churn rate above target for two consecutive months; backlog aging exceeds threshold; technician turnover spikes.
- Residual risk: Moderate if reporting covenant is enforced and capacity plan is executed.
- Evidence: diligence backlog metrics and management interviews.
Example: Legal Risk with Contractual and Monitoring Layers
Risk statement: A tax position is challenged due to unclear historical treatment of deductions.
- Cause: inconsistent documentation and prior advisor changes.
- Impact: Material cash outflow and potential covenant breach.
- Likelihood: Unlikely to Possible depending on documentation completeness.
- Mitigation: Pre-close tax indemnity with survival period aligned to the statute window; escrow sized to expected exposure; require delivery of historical workpapers.
- Owner: Legal counsel.
- Timing: Workpapers delivered before closing; escrow funded at closing.
- Trigger and monitoring: receipt of tax authority correspondence; variance between modeled and filed positions.
- Residual risk: Low to Moderate after indemnity and escrow.
- Evidence: diligence review of filings and advisor memos.
Escalation and Closure Rules
Define escalation thresholds so the register drives action. For instance, if residual risk remains “Material” after mitigation, the deal should require additional structuring, a smaller initial tranche, or a stop condition. Closure is also explicit: a risk can be marked “Closed” only when the trigger conditions are met and evidence is attached.
Mind Map: Mitigation Tracking Loop

A well-constructed risk register makes diligence outcomes usable after closing. It turns “we were concerned” into “we will watch X, do Y, and escalate if Z happens,” which is exactly the kind of clarity that keeps direct investing calm and coherent.
5. Valuation Methods for Private Assets
5.1 Selecting Valuation Approaches by Asset Type
Valuation in direct investing is less about finding the “right” formula and more about matching the method to how the asset actually produces cash, how its risks show up, and what information is available. A family office can keep decisions consistent by using a simple rule: start with the asset’s economic engine, then choose the valuation approach that measures that engine with the least hand-waving.
Start with the Asset’s Economic Engine
Most private assets fall into a few buckets:
- Operating businesses where value comes from ongoing operations.
- Real assets where value comes from rents, leases, and physical utility.
- Financial assets where value comes from contractual cash flows.
- Special situations where value comes from a change in terms, control, or structure.
Before choosing a method, write down three inputs in plain language: what cash flows exist, who controls them, and what can break them. If you can’t describe those three, the valuation approach will be forced rather than chosen.
Match Method to Data Quality and Control
A valuation method should fit the evidence you can obtain. If you can reliably forecast operating cash flows, income-based methods work well. If cash flows are uncertain but comparable transactions exist, market-based methods can be more grounded. If the asset’s value is mostly tied to balance-sheet items or replacement economics, asset-based methods can be the cleanest starting point.
Mind Map: Valuation Approach Selection
Operating Businesses: DCF First, Multiples Second
For a private company, the most defensible starting point is usually an income approach built from normalized free cash flow. The key is normalization: remove one-time items, adjust for owner compensation, and align working capital assumptions with how the business actually runs.
Example: A family office considers a direct investment in a manufacturing firm. The last three years show uneven profits due to one-off contract termination fees. After normalization, the business generates steady free cash flow of $6.0M, with expected growth of 3% for the next five years and 2% thereafter. A DCF using a discount rate that reflects business risk and illiquidity yields an enterprise value estimate. Then the team checks reasonableness using a free-cash-flow multiple derived from comparable transactions, adjusted for size and margins.
If the business is early-stage with limited cash flow history, a DCF can still be used, but the model must be driven by unit economics or milestone-based cash generation rather than pretending the past is predictive.
Real Assets: Cash Flows from Leases, Not Hope
Real estate and infrastructure-like assets often have cash flows tied to leases, occupancy, and maintenance. An income approach typically uses rent schedules, vacancy assumptions, operating expenses, and capital expenditures.
Example: A direct deal targets a small portfolio of leased commercial units. The office models rent collections by lease expiry dates and applies a vacancy scenario that matches historical turnover. It includes recurring capex for roof and HVAC replacements and uses a discount rate that reflects property-level risk. A cap-rate method can serve as a quick cross-check, but the detailed DCF is the primary tool because it captures timing of cash flows and capex.
For specialized properties where comparables are thin, asset-based logic can provide a floor using replacement cost or depreciated replacement cost, but it should not replace income modeling when leases are the main driver.
Financial Assets: Discount Cash Flows with Credit Reality
For notes, preferred equity, or structured exposures, the valuation should reflect contractual cash flows and credit risk. The income approach is usually a discounted cash flow of promised payments, adjusted for default probability and loss given default.
Example: The office buys a secured note with quarterly interest and a maturity payoff. The note includes covenants and collateral. The valuation discounts interest and principal using a discount rate that incorporates credit spread. It also models a downside recovery based on collateral liquidation assumptions, then compares the implied value to the purchase price. If the recovery assumptions are too optimistic, the valuation will look “cheap” for the wrong reason.
Special Situations: Use Boundaries, Not One Number
Special situations include recapitalizations, control changes, distressed restructurings, or deals with meaningful contingent outcomes. Here, a single valuation number can hide the real decision. Use scenario-based valuation with explicit boundaries.
Example: A minority investor considers a deal where a majority holder can force a sale after a milestone. The office values three cases: (1) milestone achieved and sale occurs, (2) milestone delayed and cash burn reduces value, (3) milestone fails and the investor relies on liquidation or alternative distributions. The final decision uses the weighted scenarios and checks whether the downside case still meets the family’s capital preservation constraints.
Practical Selection Checklist
- Choose income when cash flows can be normalized and forecasted.
- Choose market when comparable pricing is available and adjustments are measurable.
- Choose asset when cash flows are hard to forecast but balance-sheet or replacement economics are observable.
- Always cross-check with a second method or a boundary case so the valuation can’t be “right” for the wrong reason.
A good valuation approach is the one that matches the asset’s reality and the evidence you can defend in an investment committee meeting—preferably without needing a translator for the assumptions.
5.2 Discounted Cash Flow With Conservative Assumptions
A discounted cash flow (DCF) is a disciplined way to translate future cash into today’s value. The “conservative assumptions” part is not about being pessimistic for sport; it’s about reducing the number of heroic inputs and stress-testing the few that matter.
Core Idea from Cash Flows to Present Value
DCF starts with free cash flow to the firm (FCFF): cash generated by operations after taxes and after maintaining the business, minus capital expenditures. A simple structure is:
- Forecast FCFF for a finite period (often 5 years for direct investing)
- Estimate a terminal value for cash flows beyond the forecast horizon
- Discount both to present value using an appropriate discount rate
Conservatism enters in three places: the forecast period assumptions, the terminal value assumptions, and the discount rate.
Mind Map: Conservative DCF Inputs
Building the Forecast Period Without Hand-Waving
Start with a driver-based model rather than a spreadsheet full of arbitrary percentages. For a typical operating business, FCFF can be approximated as:
- Net operating profit after tax (NOPAT)
- Plus non-cash charges
- Minus changes in net working capital
- Minus capital expenditures
Conservative assumptions usually show up as “less favorable but plausible” versions of the same business reality.
Revenue Growth
Instead of extrapolating last year’s growth, anchor growth to capacity, customer retention, or contract terms. A conservative approach is to assume growth slows toward a steady run-rate. Example: if revenue grew 12% last year due to a one-time contract, model 6% in year 1, 4% in year 2, and 3% thereafter.
Margins
Margins are where optimism hides. Use historical ranges and normalize for unusual items. If gross margin improved because of temporary input pricing, revert toward a mid-cycle level. Example: if EBITDA margin averaged 18% over three years but spiked to 22% in the most recent year, use 19% in the base case and do not assume the spike repeats.
Taxes
Taxes should reflect the jurisdiction and any known incentives, but conservative DCF avoids assuming incentives persist indefinitely. Example: if a tax credit expires in 24 months, model the credit only through that period and then revert to the statutory rate.
Working Capital
Working capital assumptions can quietly swing value. Conservative modeling assumes working capital requirements are not magically efficient. Example: if the business historically ties up cash during growth, assume a modest increase in net working capital as revenue expands, rather than letting it stay flat.
Capital Expenditures
Capex should reflect maintenance plus any necessary growth capex. Conservative DCF typically uses maintenance capex at or slightly above historical averages, and it avoids assuming capex drops because “the company is maturing.” Example: if maintenance capex has been 3% of revenue, use 3.5% in the base case unless there is evidence of a durable change.
Terminal Value with Consistency, Not Guesswork
Terminal value often dominates DCF, so conservative discipline matters most here.
Two common approaches are:
- Exit multiple: apply a conservative multiple to a normalized earnings measure at the end of the forecast period.
- Perpetuity growth: assume cash flows grow at a long-run rate and reinvestment needs are consistent.
Conservative practice: keep terminal growth modest and ensure it does not imply reinvestment that the business cannot fund. Example: if you use a 2% terminal growth rate, you should not simultaneously assume margins expand indefinitely or that capex falls below maintenance.
Discount Rate Without Double-Counting Risk
The discount rate converts risk into a single number. Conservative DCF does not “punish” the cash flows and the discount rate for the same risk.
A practical method is to:
- Use a reasonable cost of equity based on comparable risk characteristics
- Use cost of debt net of tax where applicable
- Reflect the target capital structure
Then adjust only for risks not already embedded in cash flows. Example: if you already modeled higher churn in revenue, do not also add a large risk premium specifically for churn.
Example: A Conservative DCF Snapshot
Assume a business with FCFF of $10m in year 0. Model FCFF growing to $13m by year 5 using conservative drivers: revenue growth moderates, margins normalize, working capital absorbs some growth, and capex stays at 3.5% of revenue.
For terminal value, use an exit multiple approach with a lower-than-typical multiple applied to normalized year-5 EBITDA, or a perpetuity growth rate of 2% with capex and reinvestment consistent with that growth.
Finally, discount using a rate that reflects the deal’s risk profile. The conservative output check is to compare the implied value to what the underwriting narrative would support: if the DCF implies a value that requires margins to expand beyond what the model assumed, the assumptions are inconsistent.
Output Checks That Keep You Honest
After computing value, run two quick validations:
- Sensitivity: vary only the top 3 drivers (often terminal value, margin, and working capital) to see which assumption actually moves the needle.
- Implied multiples: translate the DCF value back into an implied entry multiple to confirm it aligns with the deal’s reality.
Conservative DCF is less about making one “safe” number and more about ensuring the few critical assumptions are defensible, internally consistent, and not secretly optimistic in disguise.
5.3 Comparable Transactions and Multiples with Adjustments
Comparable transactions are the fastest way to sanity-check a private-company valuation, but only if you treat “similar” as a hypothesis, not a fact. The goal is to convert observed deal multiples into a usable range for your target, after adjusting for differences that actually move value.
Start with the Multiple You Can Defend
Use the multiple that matches the cash flow you’re valuing.
- EV/EBITDA fits operating businesses with reasonably stable margins and capital intensity.
- EV/Revenue fits earlier-stage companies or those with noisy earnings.
- P/E fits mature businesses where earnings quality is high and capital structure is comparable.
Example: If your target has EBITDA of $12m and you’re valuing an operating company, EV/EBITDA is usually the cleanest starting point. If the target has negative EBITDA, EV/Revenue or an earnings-quality-adjusted approach is more defensible.
Build a Comparable Set That Matches the Deal Reality
A “comps list” should include deals with similar:
- Business model (recurring vs project-based revenue)
- Customer concentration (top customers as a risk factor)
- Geography and regulation (cost structure and growth constraints)
- Scale (small deals often trade at different risk and liquidity)
- Control level (majority stake vs minority stake)
Practical rule: if you can’t explain why a deal is comparable in one paragraph, it probably isn’t.
Adjust Multiples with a Small, Consistent Toolkit
Adjustments should be systematic and tied to measurable drivers. Common adjustment levers include:
- Growth rate differences: higher sustainable growth can justify a higher multiple.
- Margin differences: better gross margin or operating leverage can raise EBITDA multiples.
- Risk differences: customer concentration, churn, and contract duration affect the discount embedded in the multiple.
- Capital intensity: higher maintenance capex reduces the quality of EBITDA.
- Accounting differences: normalize EBITDA so the multiple compares like with like.
A useful mindset: adjustments are not “making the math work.” They are translating deal terms into the same economic language.
Use a Bridge from Observed Multiple to Target Multiple
A bridge keeps you honest by showing how you moved from the observed deal to the target.
Example: Suppose you observe a deal at 10.0x EV/EBITDA.
- Target growth is 2% lower than the deal’s implied growth.
- Target operating margin is 3 points lower.
- Target customer concentration is higher, implying higher risk.
You might apply a structured adjustment such as:
- Growth adjustment: -0.6x
- Margin adjustment: -0.4x
- Risk adjustment: -0.3x
Implied target multiple: 10.0x - 1.3x = 8.7x.
Then apply your normalized EBITDA to estimate value. If your adjustments feel arbitrary, that’s a sign your comparable set or normalization is weak.
Normalize EBITDA Before You Touch Multiples
Most “multiple mismatch” problems come from EBITDA that isn’t truly comparable.
Normalization checklist:
- Remove one-time expenses and gains.
- Add back recurring costs that were treated as non-recurring.
- Standardize stock-based compensation treatment if it’s material.
- Align restructuring and integration costs.
- Ensure capex assumptions are consistent if you later compare to free cash flow.
Example: If Deal A’s EBITDA includes $2m of recurring legal costs that Deal B excludes, the EV/EBITDA comparison is distorted. Normalize both to a consistent definition before adjusting.
Mind Map: Comparable Transactions Workflow
Example: Two Deals, One Target, Different Adjustments
Assume your target has normalized EBITDA of $12m.
-
Deal 1: EV/EBITDA = 11.5x
- Target growth is slightly lower: -0.5x
- Target margin is similar: 0.0x
- Target customer concentration is higher: -0.4x
- Implied multiple: 10.6x
- Value estimate: $127.2m
-
Deal 2: EV/EBITDA = 9.8x
- Target growth is higher: +0.4x
- Target margin is lower: -0.3x
- Target risk is similar: 0.0x
- Implied multiple: 9.9x
- Value estimate: $118.8m
Your valuation range is not a single number; it’s the spread created by real differences. The bridge shows why the spread exists.
Common Adjustment Mistakes to Avoid
- Adjusting for things you didn’t normalize: if EBITDA isn’t consistent, adjustments become guesswork.
- Using too many levers at once: five small adjustments can hide one big modeling error.
- Ignoring deal structure: earnouts, seller notes, and control premiums can change the effective economics behind the headline multiple.
Conclude with a Range and a Decision Threshold
After adjustments, translate the implied multiples into a range of enterprise values, then apply your target’s net debt or cash position to reach equity value. The final step is choosing a decision threshold: not “the most optimistic multiple,” but the multiple that best matches the target’s normalized economics and risk profile.
5.4 Asset Based Valuation and Replacement Cost Logic
Asset-based valuation estimates what the business is worth by looking at what it owns and what it would cost to recreate those assets. It is especially useful when earnings are volatile, accounting is conservative, or the company’s value is tied to tangible capacity, licenses, or a balance-sheet-heavy model. The goal is not to pretend the business is a pile of parts; it’s to anchor value to observable economic inputs.
Core Concepts and When They Fit
Start with two ideas: (1) net asset value and (2) replacement cost. Net asset value asks, “What is the business worth if we sell assets and settle liabilities?” Replacement cost asks, “What would it cost to rebuild the asset base needed to operate?” Both can be combined into a practical valuation range.
Use net asset value when asset values are measurable and liabilities are well understood, such as real estate holdings, equipment-heavy operations, or businesses with clear working-capital patterns. Use replacement cost when the asset base is the main driver of capacity, such as specialized machinery, distribution infrastructure, or regulated assets where earnings alone can mislead.
Step-by-Step Method
- Choose the asset universe. Include operating assets that support revenue generation, not every item on the balance sheet. For example, excess cash is usually valued separately, while “other assets” may require classification.
- Normalize asset values. Replace book values with fair or realizable values where possible. Accounts receivable should be adjusted for collectability; inventory should be adjusted for obsolescence.
- Value liabilities realistically. Include contingent liabilities if they are probable and estimable. For leases, use the present value of remaining payments if the structure is material.
- Compute net asset value. Net asset value equals adjusted assets minus adjusted liabilities.
- Add an operating premium or subtract an operating discount. If the business earns more than what the asset base would suggest, you may add a modest premium for assembled operations. If it underperforms, you may subtract for inefficiencies.
- Cross-check with replacement cost. Compare the net asset value result to what it would cost to recreate the asset base. Large gaps often signal missing adjustments.
Mind Map: Asset Based Valuation Inputs and Outputs
Replacement Cost Logic Without Hand Waving
Replacement cost is not “what someone might pay someday.” It is a structured estimate of current cost to rebuild capacity, then adjusted for depreciation in economic terms.
A practical approach:
- Identify the asset categories that enable operations.
- Estimate current replacement prices for each category.
- Apply functional and economic obsolescence. For instance, a machine may be new but the process may be less efficient than modern alternatives.
- Add installation and integration costs that are necessary for the assets to work together.
- Subtract the value of assets that are not required for the same output today.
Example: Equipment-Heavy Manufacturer
Assume a company has the following simplified balance sheet (values in millions):
- Property, plant, and equipment at book: 40
- Inventory at book: 12
- Accounts receivable at book: 10
- Other assets: 3
- Total liabilities: 35
Adjustments:
- PPE fair value: 45 (recent comparable sales for similar equipment)
- Inventory realizable value: 9 (10% obsolescence)
- Receivables collectability: 8 (some disputed invoices)
- Other assets: 2 (write down doubtful items)
Adjusted assets = 45 + 9 + 8 + 2 = 64. Adjusted net asset value = 64 − 35 = 29.
Now check replacement cost. If rebuilding the same production capacity would cost 55, and economic obsolescence suggests 40% reduction in effective value, replacement-based value is 55 × (1 − 0.40) = 33. The two methods produce a reasonable range: 29 to 33.
Finally, consider an operating premium. If the company’s gross margins are consistent with what the asset base should support, keep the premium near zero. If margins are materially higher due to know-how that is not captured on the balance sheet, you might add a small premium—but only after ensuring you are not double counting intangible value already embedded in adjusted assets.
Common Pitfalls and How to Avoid Them
- Double counting intangibles. If you value a license as an asset, don’t also add a large “brand premium” elsewhere.
- Ignoring working capital quality. Inventory and receivables often swing value more than fixed assets.
- Treating book depreciation as economic depreciation. Replacement cost requires economic obsolescence, not accounting schedules.
- Forgetting integration costs. Rebuilding assets without installation and process integration understates true replacement cost.
Practical Output for Investment Decisions
Conclude with a valuation range anchored by net asset value and replacement cost, then document the operating premium or discount as a separate line item. This keeps the logic auditable: the numbers explain themselves, and the committee can challenge assumptions without arguing about vibes.
5.5 Sensitivity Tables and Decision Thresholds
Sensitivity tables answer a simple question: “If a few key assumptions move, does the deal still clear our bar?” Decision thresholds answer the second question: “What level of uncertainty are we willing to tolerate before we say yes, no, or ask for changes?” Together, they turn underwriting from a single-point story into a structured decision.
Foundational Inputs That Actually Matter
Start by identifying the assumptions that drive value and risk. In private deals, these usually cluster into five buckets:
- Cash generation: revenue growth, gross margin, churn, utilization, or occupancy.
- Cost structure: operating margin, headcount ramp, maintenance, or cost inflation.
- Timing: ramp period, working-capital build, and exit timing.
- Capital stack: interest rate, amortization, fees, and equity contribution schedule.
- Exit value: terminal multiple, terminal margin, or replacement value.
A good rule: if changing an assumption by a reasonable amount barely moves the outcome, it does not deserve a full row in your table. Your goal is focus, not completeness.
Choosing Outcome Metrics
Pick one primary metric and one supporting metric. Common choices:
- Primary: IRR, equity multiple, or net present value (NPV) at a stated discount rate.
- Supporting: downside equity value, minimum cash-on-cash, or debt service coverage under stress.
Example: For a growth equity investment, you might use equity IRR as the primary metric and minimum equity value at year 3 as the supporting metric. That pairing prevents a situation where IRR looks fine but the equity value collapses early.
Building a Sensitivity Table Without Fooling Yourself
Use a two-way approach for clarity.
- One-way sensitivity: vary one assumption at a time to see which levers matter.
- Two-way sensitivity: combine the top two levers to understand interaction.
Keep the “reasonable range” anchored to diligence evidence. If management claims a 10% margin, your downside range should reflect what you saw in customer contracts, pricing history, and cost structure—not a random number chosen for drama.
Example One-Way Sensitivity
Assume an investment where equity value depends heavily on gross margin and exit multiple. You run a one-way sensitivity on gross margin while holding everything else constant.
| Gross Margin | Equity IRR | Equity Multiple |
|---|---|---|
| 45% | 18% | 1.9x |
| 47% | 21% | 2.1x |
| 49% | 24% | 2.4x |
| 51% | 27% | 2.7x |
| 53% | 30% | 3.0x |
Interpretation: a 4-point margin swing moves IRR by ~12 points. That’s a lever worth combining with exit assumptions.
Example Two-Way Sensitivity
Now vary gross margin and exit multiple together.
| Exit Multiple 8x | Exit Multiple 10x | Exit Multiple 12x | |
|---|---|---|---|
| Gross Margin 47% | 14% IRR | 18% IRR | 22% IRR |
| Gross Margin 49% | 18% IRR | 22% IRR | 26% IRR |
| Gross Margin 51% | 22% IRR | 26% IRR | 30% IRR |
Interpretation: the “bad” corner (47% margin and 8x exit) still produces a positive outcome, but it may fail your threshold. The table tells you where negotiation or additional protection matters.
Decision Thresholds That Convert Tables into Actions
A threshold is not just a number; it is a decision rule tied to conditions.
Common threshold formats:
- Metric threshold: “Proceed only if equity IRR ≥ 20% in the base case and ≥ 15% in the downside corner.”
- Protection threshold: “Proceed only if downside equity value remains above X or if covenants cover interest under stress.”
- Structure threshold: “Proceed only if we can adjust price, governance, or earnout terms when the downside corner falls short.”
Example Threshold Rule
For the same deal, suppose your policy is:
- Base case equity IRR must be ≥ 22%.
- Downside corner (47% margin, 8x exit) must be ≥ 15%.
- If downside IRR is between 12% and 15%, you require one of: price adjustment, stronger information rights plus operational milestones, or additional downside protection (for example, escrow or preferred return).
This avoids the “we like the story” problem. If the table lands in the gray zone, the rule tells you what to negotiate.
Mind Map: the Workflow
Practical Guardrails for Credible Tables
- Lock assumptions by workstream: revenue drivers come from commercial diligence; cost drivers come from operations; exit assumptions come from comparable transactions you reviewed.
- Use consistent ranges: if you widen ranges in one table, widen them everywhere you use the same levers.
- Separate model error from business risk: if a sensitivity changes results wildly due to a modeling bug, that’s not risk—it’s a spreadsheet problem.
Putting It Together in the Investment Memo
Conclude this section with a compact “decision grid” that links outcomes to actions. For example: base case clears, downside corner clears, proceed; base clears but downside fails, request structural changes; both fail, pass. The tables do the heavy lifting, and the thresholds tell you what to do next.
6. Deal Structuring and Contracting for Control and Protection
6.1 Choosing Equity Debt and Hybrid Structures
Direct deals rarely fail because the business is “bad.” More often, they fail because the contract doesn’t match how value is created, how risk shows up, and how decisions get made when things get messy. Choosing equity, debt, or a hybrid is the way you align those realities.
Foundational Concepts for Capital Choice
Equity is a claim on residual value. If the business performs, equity participates; if it struggles, equity absorbs losses last. Debt is a claim with scheduled payments and defined seniority. If the business can’t pay, debt holders can enforce remedies. Hybrids sit between: they may behave like equity for upside and like debt for downside, but only if the terms are written clearly.
A practical way to think about structure is to match it to three questions:
- Who should bear operating risk? If cash flow is uncertain, pure debt can be an expensive way to be wrong.
- Who should control decisions? Control rights determine whether the investor can correct problems early.
- How should upside be shared? The structure should reward the party that can actually influence outcomes.
Equity Structures and When They Fit
Equity is often the default for growth-oriented businesses where cash flow is not yet stable. The key is to separate “equity” from “equity terms.” Two deals can both be equity and still produce very different outcomes.
Common equity variants include:
- Common equity when the investor is comfortable with limited protections and expects governance through board or shareholder agreements.
- Preferred equity when the investor wants downside protection through liquidation preferences, conversion rights, and protective provisions.
Example: A family office invests in a software company with volatile revenue. They choose preferred equity with a 1x liquidation preference and standard conversion. The company later sells for a moderate price. Because the preference is defined, the investor’s downside is bounded, while conversion allows participation if the sale price is high enough.
Equity is also where you should be precise about voting and information rights. If you cannot see what’s happening, you cannot manage risk, even with “good” terms.
Debt Structures and When They Fit
Debt works best when the borrower has predictable cash flows or when the collateral and covenants meaningfully reduce the chance of payment failure.
Debt terms to focus on:
- Seniority and security: secured debt generally gets paid before unsecured.
- Interest rate and payment schedule: cash-pay versus PIK (payment-in-kind) changes real risk.
- Covenants: financial covenants can force early intervention.
- Maturity and amortization: longer maturities reduce near-term pressure but increase total exposure.
Example: A family office lends to a distribution business with steady purchase orders. They structure a secured term loan with quarterly reporting and a covenant tied to debt service coverage. When margins compress, the covenant triggers a discussion before missed payments become likely.
Debt is not “safer” by default. If covenants are weak or enforcement is unclear, debt can become a slow-motion equity position.
Hybrid Structures and How They Behave
Hybrids are useful when you want debt-like discipline but equity-like participation. The challenge is that hybrids can be misunderstood if the waterfall and triggers are not mapped.
Common hybrid patterns:
- Convertible debt: payments may be limited initially, with conversion into equity at defined terms.
- Preferred with debt-like features: for example, redemption rights or cumulative dividends.
- Mezzanine-style instruments: subordinated to senior debt but with stronger protections than common equity.
Example: A family office funds a manufacturing upgrade with convertible notes. The notes accrue interest, but the investor can convert if the company hits agreed milestones. If milestones are missed, the investor still has a defined path to repayment, but with less upside than a pure equity deal.
The “quiet logic” here is simple: hybrids should be written so that the investor knows what happens in each scenario, not just what happens in the best case.
Mind Map: Capital Structure Decision Logic
Advanced Details That Prevent Costly Surprises
1. Waterfall clarity. Before signing, map the payment order for at least three outcomes: sale, refinancing, and distress. If the waterfall is unclear, the structure will be negotiated later under stress.
2. Trigger definitions. Covenants, conversion triggers, and redemption rights need objective measurements. “Reasonable efforts” is not a measurement.
3. Interactions with other capital. If senior lenders exist, your effective seniority may be different from what the term sheet implies. Subordination language matters.
4. Governance match. A structure with strong downside protection but weak control rights can still underperform because problems are discovered too late.
Example: Three Structures Compared in One Deal
Assume the same target: a family-owned services business seeking $10 million for expansion.
- Equity-only: Investor funds growth and expects returns through a later sale or recap. Protections focus on board access and liquidation preference.
- Debt-only: Investor funds with a secured loan. Protections focus on covenants, reporting, and collateral.
- Hybrid: Investor funds with secured convertible notes. Protections include repayment path plus conversion if performance milestones are met.
The choice comes down to whether cash flows are predictable enough for debt discipline, whether the investor can influence outcomes through governance, and whether the upside sharing matches the effort and leverage the investor actually has.
Mind Map: Term Sheet Items to Verify
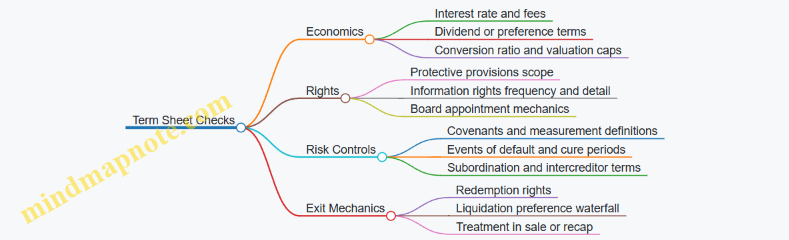
Practical Rule of Thumb
If you can’t clearly describe what happens to each party in a sale and in distress, the structure is not ready. Equity, debt, and hybrids are tools; the contract is the operating system. The best structure is the one whose behavior you can explain in plain language without reaching for fine print.
6.2 Negotiating Governance Rights and Board Mechanics
Governance rights are the “how” of ownership: who decides what, how decisions are documented, and how minority positions avoid being treated like decorative furniture. In direct deals, board mechanics matter because they determine whether information flows, whether vetoes are real, and whether deadlocks get resolved without turning every issue into a negotiation.
Core Governance Concepts That Drive Negotiation
Start with the decision map. A board exists to make or oversee decisions that affect risk, capital, and control. Negotiation should therefore separate matters into categories:
- Ordinary-course decisions the company can run without board friction.
- Reserved matters requiring board approval, often with supermajority or consent rights.
- Protective matters where investors need specific consent to prevent value leakage.
- Information matters that define what the investor receives, when, and in what format.
A useful rule of thumb: the more a decision can change the economics of your stake, the more governance specificity you want.
Board Composition and Appointment Mechanics
Board seats are not just headcount; they are leverage over agenda setting and committee work. Common structures include:
- Observer rights for minority investors who want visibility without voting.
- Board seats for investors with meaningful ownership or strategic involvement.
- Classified or staggered boards to slow sudden control shifts.
When negotiating appointment mechanics, specify:
- Who appoints and removes directors.
- Replacement timing after resignation or removal.
- Independence requirements and what happens if a candidate is rejected.
Example: If an investor has the right to appoint one director, the agreement can require the company to propose candidates within 30 days and allow the investor to designate a replacement if the company misses the timeline.
Voting Thresholds and Reserved Matters
Reserved matters are where governance becomes concrete. Typical reserved matters include:
- Issuing new equity or options
- Incurring debt above a threshold
- Approving budgets and material deviations
- Entering related-party transactions
- Selling substantially all assets
- Changing the business scope
Negotiation should define both the matter and the threshold. “Material” is a frequent source of arguments, so use measurable triggers such as dollar amounts, percentage of revenue, or EBITDA impact.
Example: Instead of “material contracts,” define it as “contracts exceeding $500,000 annually or representing more than 5% of trailing twelve-month revenue,” whichever is lower.
Protective Provisions and Minority Safeguards
Protective provisions prevent the company from taking actions that dilute or disadvantage the investor without consent. These often include:
- Anti-dilution protections tied to specific issuance types
- Consent rights for liquidation preferences, mergers, or asset sales
- Restrictions on dividends or distributions that could impair solvency
The key is to align protective provisions with the board’s reserved matters. If a protective provision requires investor consent but the board can approve the action anyway, you create procedural confusion. Drafting should ensure the consent requirement is a gating item.
Information Rights That Actually Work
Information rights are governance in spreadsheet form. Specify:
- Frequency (monthly reporting for cash, quarterly for performance)
- Content (budget vs. actual, cash runway, KPIs, cap table changes)
- Delivery method (data room access, secure portal, or email with attachments)
- Timing (e.g., within 10 business days after month-end)
Example: A governance package can require a monthly “cash and covenant” report including beginning cash, net burn, committed spend, and any covenant headroom. This reduces the chance that board meetings become the first time investors learn something changed.
Board Mechanics and Meeting Procedures
Board mechanics determine whether rights are usable under stress. Clarify:
- Notice periods for meetings
- Quorum requirements
- Written consent rules
- Agenda control and the right to include items
- Minutes standards and approval timing
Deadlocks happen. The agreement should specify a path such as escalation to executive leadership, mediation, or a defined voting mechanism for certain categories.
Negotiation Example with Practical Drafting Choices
Consider a minority investor with one board seat and observer rights for committee meetings. The investor negotiates:
- Reserved matters requiring board approval and investor consent for equity issuances that would materially dilute the investor.
- A budget approval process where the board must approve the annual budget by a fixed date, and any deviation beyond a defined threshold triggers board review.
- Monthly cash reporting within 10 business days, plus immediate notice if cash runway falls below a specified number of months.
This package avoids the common failure mode where governance exists on paper but the investor learns about dilution, budget drift, or liquidity stress only after the fact.
Practical Checklist for the Negotiation Session
Before marking up language, confirm you have answers to:
- Which decisions are reserved, and what thresholds apply?
- Who appoints directors, and what is the replacement timeline?
- What information is required, how often, and by when?
- What procedural rules govern meetings, quorum, and written consents?
- Where do investor consent rights override board approval?
- How are deadlocks handled for each category of decision?
If these items are crisp, board mechanics become a predictable operating system rather than a recurring negotiation tax.
6.3 Drafting Protective Provisions and Consent Matters
Protective provisions are the “no surprises” rules in a private deal. They define what the company can do without your approval, and they specify how approvals are obtained. Consent matters are the specific actions that trigger those approvals. A good set of provisions is narrow enough to avoid constant vetoes, but clear enough that everyone knows what requires consent.
Start with a simple principle: protective rights should map to the risks you actually underwrote. If your underwriting assumed stable governance, you draft governance protections. If you assumed leverage stays within a range, you draft debt and refinancing protections. If you assumed information access, you draft reporting protections. When the rights don’t connect to a risk, they become friction with no benefit.
Core Protective Rights to Consider
1. Changes to capital structure Draft consent requirements for actions that alter the economics of your stake: issuing senior securities, creating new classes with preferential rights, changing conversion terms, or amending the charter in ways that affect liquidation preferences. A practical drafting habit is to define “materially adverse” outcomes with objective triggers, such as a new security that ranks ahead of your class.
Example: If you invest as preferred equity with a liquidation preference, require consent before the company issues additional preferred that would be senior to your preference. Otherwise, the company can “stack” preferences and reduce your recovery without changing the headline valuation.
2. Mergers, asset sales, and fundamental transactions Consent should cover mergers, consolidations, and sales of all or substantially all assets. Also include changes of control, whether by stock sale, merger, or a sale of voting power. Define “substantially all” with a threshold (for example, a percentage of revenue, assets, or enterprise value) so the trigger is not argued later.
Example: A company sells a key operating subsidiary that holds most revenue. If your consent clause only covers “all assets,” the company may argue the sale is partial. A threshold-based definition prevents that.
3. Debt incurrence and refinancing If leverage affects your downside, require consent for new debt above a defined limit, liens on substantially all assets, and refinancing that increases interest rate, extends maturity in a way that harms equity, or adds covenants that restrict operations.
Example: The company wants a “small” working-capital facility secured by equipment. If the facility is secured by all material assets, it can function like a senior claim. Draft consent to capture liens on substantially all assets, not just the debt size.
4. Dividends, distributions, and related-party payments Protective provisions often include consent for dividends or distributions that reduce cash available for operations, and for payments to insiders that could siphon value. Define related parties broadly enough to include affiliates and entities controlled by management.
Example: Management proposes a consulting agreement with a related entity. Without a consent trigger, the company can route cash out under the label of “services.” A consent requirement for related-party transactions above a threshold addresses this.
5. Budget, business plan, and capex approvals Some deals include consent for annual budgets, material deviations, and large capital expenditures. This is especially useful when you expect disciplined spending to preserve runway.
Example: The company’s budget assumes $2 million capex for a production line. If it later requests $5 million without consent, you can stop the spending before it becomes a sunk-cost story.
Consent Mechanics That Prevent Procedural Games
Consent provisions fail when the process is vague. Specify notice, response timelines, quorum, and what happens if the company does not receive a response.
Use a clear structure:
- Who votes: the class or series holders, or a board committee.
- What vote threshold: majority of the protected class, supermajority, or unanimous consent.
- When consent is required: list actions explicitly.
- How consent is requested: written notice with supporting materials.
- Timing: a response period such as 10–30 business days.
- What counts as approval: written consent or board resolution.
Example: If the company sends a consent request with incomplete information, you want the clock to start only when the materials are “substantially complete.” Otherwise, the company can claim you missed a deadline.
Mind Map: Protective Provisions and Consent Matters
Drafting Checklist for Clause Clarity
- Define key terms like “substantially all,” “materially adverse,” and “related party.”
- Tie each trigger to an underwriting risk so the list is defensible.
- Avoid overlapping triggers that create ambiguity between board approval and class consent.
- Specify information requirements so consent requests are actionable.
- Include a clean process for timing and deemed responses.
A final drafting note: protective provisions should be readable by non-lawyers. If the clause requires a second meeting to interpret, it will require a third meeting during a disagreement. Clear consent matters reduce that need.
6.4 Securing Information Rights and Reporting Covenants
Information rights are the practical difference between “we own it” and “we can actually see what’s happening.” In private deals, the contract decides what data you receive, how often, in what format, and what happens when the other party is late, incomplete, or uncooperative.
Core Concepts That Drive Contract Language
Start with three foundational choices.
First, define the scope of information. “Financials” is not a scope; “monthly management accounts including P&L, balance sheet, cash flow, and variance commentary versus budget” is.
Second, define the audience. Information rights for a board seat can be broader than rights for a passive investor. If the family office expects to monitor risk, it needs enough detail to ask targeted questions without turning every month into a scavenger hunt.
Third, define the standard of delivery. Reporting covenants should specify timing, responsible party, and delivery method. Email is fine for routine packs; a secure portal can be required for sensitive materials.
Information Rights You Typically Negotiate
Information rights usually fall into five buckets.
1) Financial reporting. Require periodic financial statements with consistent accounting policies. Add a covenant that the issuer will not change accounting policies without prior notice and a reconciliation.
2) Operational reporting. For operating businesses, request KPIs tied to the business model: customer churn, backlog, utilization, pipeline, or unit economics. The goal is not to micromanage; it’s to detect drift early.
3) Governance and board materials. If you have board rights, require board packs in advance of meetings and include key agenda items, budgets, and major contracts.
4) Legal and compliance updates. Require notice of material litigation, regulatory inquiries, breaches of material contracts, and changes in key licenses.
5) Capital structure and financing. Require notice of new debt, guarantees, amendments to existing credit facilities, and any transactions with affiliates.
A helpful rule: if the information would be needed to answer a specific investment question, it belongs in the covenant.
Reporting Covenants That Prevent “Late and Vague”
Reporting covenants should include timing, completeness, and consequences.
Timing. Use concrete deadlines: monthly within 15 business days after month-end; quarterly within 45 days; annual within 90 days. If the business has seasonality, allow a longer timeline for annual audits but keep monthly cadence strict.
Completeness. Specify minimum contents. For example, monthly packs should include a trial balance summary, cash position, AR/AP aging, and a variance report versus budget.
Consequences. Add a cure period and escalation path. If reporting is late, require written notice, then a defined cure window. If the breach persists, allow remedies such as withholding consent for certain actions or triggering default provisions.
Example: Turning “We’ll Share Financials” Into a Covenant
Below is an example clause structure you can adapt.
Reporting Covenants
(a) Monthly Management Accounts: Issuer shall deliver to Investor within 15 business days after each month-end a package including P&L, balance sheet, cash flow summary, AR/AP aging, and variance commentary versus approved budget.
(b) Quarterly Reporting: Within 45 days after quarter-end, Issuer shall deliver unaudited financial statements and a KPI dashboard relevant to the business model.
(c) Annual Reporting: Within 90 days after fiscal year-end, Issuer shall deliver audited financial statements and management letter, if available.
(d) Accounting Consistency: Issuer shall maintain consistent accounting policies and provide a reconciliation if any policy changes.
(e) Material Events: Issuer shall notify Investor within 5 business days of any material litigation, regulatory notice, or breach of a material contract.
(f) Remedy for Late Reporting: If any delivery is more than 10 business days late, Investor may require a written remediation plan and may withhold consent for specified reserved matters until cured.
This structure reduces ambiguity. It also gives the investor a clear lever without requiring constant legal escalation.
Mind Map: Information Rights and Reporting Covenants
Example: Reserved Matters with Built-In Reporting
Reserved matters are decisions that require investor consent, such as taking on new debt, selling key assets, or approving related-party transactions. The contract should require the issuer to provide a decision pack in advance.
For instance, for any proposed debt issuance, require a covenant that the issuer delivers: term sheet, pro forma leverage, covenant headroom, and a cash flow impact summary. This prevents consent from being a rubber stamp and ensures the family office can evaluate the decision with the same facts every time.
Practical Checklist for Negotiation
Before signing, confirm five items in writing: (1) what data is included, (2) how often it arrives, (3) when it arrives, (4) what happens if it doesn’t, and (5) how the information supports consent and monitoring. If any of those five are missing, the rights may exist on paper but not in practice.
6.5 Handling Earnouts, Escrows, and Representations
Earnouts, escrows, and representations are the three knobs that turn “we think this will happen” into “we can enforce what we agreed.” They show up most often when the buyer and seller disagree on future performance, when cash needs to be held back for risk, or when the deal depends on facts that must be true today.
Earnouts: Pay for Performance Without Paying for Confusion
An earnout is a contractual promise to pay additional consideration if defined performance targets are met after closing. The best earnouts are specific enough to measure, but not so rigid that normal business variation becomes a loophole.
Start with three foundational choices:
- What is measured: revenue, EBITDA, gross margin, bookings, or a defined profit metric. Pick a metric that can be calculated consistently from the buyer’s reporting system.
- What time window applies: often 12–36 months. Short windows reduce uncertainty; longer windows better reflect the business cycle.
- How performance is affected by buyer actions: earnouts fail when the buyer can unintentionally (or intentionally) steer results away from the target.
A practical example: a seller agrees to an earnout tied to “Adjusted EBITDA for the acquired product line” for the next 24 months. The contract defines Adjusted EBITDA line-by-line, including how to treat one-time costs, internal allocations, and customer credits. Without that definition, the buyer can “adjust” the metric until it matches the buyer’s preferred story.
To prevent metric games, include:
- Operating covenants: the buyer must run the business in a manner consistent with past practices, or at least not take actions that materially reduce earnout results.
- Access and audit rights: the seller should receive the calculation package and have a reasonable audit window.
- Dispute mechanics: specify an independent accountant process, including who pays and how quickly the dispute is resolved.
A useful rule of thumb: if the earnout metric can be changed by a policy decision, the contract should either prohibit those changes or incorporate them into the metric definition.
Escrows: Hold Back Cash for Real Risk
An escrow is cash (or sometimes a security) held by a neutral party to satisfy claims under the agreement, such as indemnification for breaches. Escrows reduce the seller’s “credit risk” to the buyer and reduce the buyer’s “collection risk” from the seller.
Key design elements:
- Escrow amount: tied to the risk profile, not to negotiation theater. Higher risk areas justify more holdback.
- Escrow duration: aligned to the survival periods for representations and covenants. If claims can be brought for 18 months, an escrow that expires at 6 months is mostly symbolic.
- Release schedule: partial releases can reduce seller friction while still covering the highest-risk period.
Example: a buyer holds 10% of the purchase price in escrow for 18 months to cover tax and working capital adjustments. The agreement states that escrow releases in two tranches: 7% at 9 months if no claims are pending, and the remaining 3% at 18 months after the final claim window closes.
To keep escrow from becoming a claim magnet, define:
- Claim notice requirements: what must be provided, and by when.
- Claim substantiation: what evidence is required to trigger payment.
- Standard of proof: avoid vague “reasonable” standards that invite endless argument.
Representations: Facts Today That Control Money Tomorrow
Representations are statements of fact made by the seller (and sometimes the buyer) about the business and the deal. They matter because breaches can trigger indemnification, escrow draws, or purchase price adjustments.
A systematic approach helps:
- Group representations by risk: taxes, legal compliance, financial statements, contracts, employees, IP, and litigation.
- Match survival periods to risk: tax issues often need longer survival than, say, certain operational matters.
- Define materiality and knowledge qualifiers: “material” should be tied to a threshold or a consistent standard, and “knowledge” should specify whose knowledge counts.
Example: the seller represents that “no material litigation is pending.” If “material” is undefined, the buyer can argue that any lawsuit is material. If “material” is defined as exceeding a dollar threshold or likely to exceed a percentage of EBITDA, both sides know what the statement means.
Representations also interact with earnouts and escrows. If an earnout depends on revenue recognition policies, representations about accounting practices become more important. If escrow covers indemnification, representations about taxes and employee matters become the primary claim targets.
Mind Map: Earnouts, Escrows, and Representations
Integrated Checklist for Drafting and Negotiation
- Earnouts: define the metric, lock the calculation method, restrict buyer actions that distort results, and specify audit and dispute steps.
- Escrows: size the holdback to the claim risk, align duration to survival periods, and write a claim process that is specific enough to execute.
- Representations: categorize by risk, set survival periods accordingly, and define materiality and knowledge so “breach” has a measurable meaning.
When these three pieces fit together, the contract stops being a set of promises and becomes a set of procedures. That’s the quiet logic: fewer surprises, clearer enforcement, and less time spent arguing about what the parties meant.
7. Underwriting Returns and Building a Base Case
7.1 Building Underwriting Models With Clear Drivers
A good underwriting model is less about predicting the future and more about making the assumptions testable. The goal is to connect every input to a driver you can verify during diligence, then translate those drivers into cash flows, returns, and decision thresholds.
Start with the Decision, Not the Spreadsheet
Begin by writing the exact decision the model supports: approve, reject, or request better terms. Then list what must be true for approval. For instance, you might require that the base case produces a target IRR and that the downside case still preserves principal after fees and expected losses.
A practical way to keep the model honest is to define three outputs up front:
- Entry valuation and implied ownership economics
- Expected cash flows by year (or quarter)
- A downside outcome that is not just “lower revenue,” but a coherent chain of effects
Build a Driver Map from Business Mechanics
Underwriting drivers should mirror how the business actually makes money. If the business is subscription-based, the drivers are typically customer acquisition, retention, churn, and expansion. If it is project-based, the drivers are pipeline conversion, project margins, and working-capital timing.
Use this rule: every major line item in the model must trace back to a driver you can diligence. If you cannot name the driver, you probably have a placeholder.
Mind Map: Underwriting Model Drivers
Translate Drivers into a Coherent Cash Flow Engine
Once drivers are mapped, convert them into a cash flow engine with consistent timing.
- Revenue build: compute revenue from volume and price (or from retained customers and expansion). Keep the unit economics visible.
- Margin build: derive gross margin from direct cost drivers, then layer operating expenses from headcount and productivity assumptions.
- Working capital build: model cash timing using DSO/DPO/inventory days so that “profitable on paper” doesn’t become “cash-poor in reality.”
- Capital structure overlay: apply debt interest, principal schedules, and covenants if relevant.
- Fees and transaction costs: include them explicitly so returns reflect what you actually pay.
- Exit: use either an exit multiple or a sale price derived from normalized earnings, but keep the link to drivers.
Use Clear Base Case Logic with Named Assumptions
A base case should read like a chain of cause and effect. For example:
- If churn is 3% monthly, then net retention follows from retention and expansion assumptions.
- If net retention improves, then revenue growth accelerates without proportional headcount growth.
- If headcount grows slower than revenue, operating leverage expands and margins improve.
Avoid “magic growth.” If revenue growth is assumed to be 25% next year, specify whether it comes from more customers, higher pricing, better retention, or all three.
Add Downside Cases That Change More Than One Number
Downside scenarios should reflect how the business fails in practice. A common mistake is to reduce revenue while leaving costs and working capital unchanged.
Example downside logic for a services business:
- Revenue declines due to lower win rate.
- Utilization drops, so labor costs do not fall as fast as revenue.
- Working capital worsens because collections slow (higher DSO).
- The cash shortfall forces either a slower burn of expenses or a need for additional liquidity.
This produces a downside that is testable: you can check whether the company’s cost structure and collection history support the assumed behavior.
Sensitivities That Match Diligence Evidence
Sensitivities should be chosen based on what diligence can actually constrain. If you have strong evidence on pricing power but weak evidence on churn, then churn belongs in the sensitivity set.
A simple, effective sensitivity grid might include:
- Revenue growth (from volume and retention drivers)
- Gross margin (from direct cost per unit)
- Exit multiple (from comparable transactions)
Then set decision thresholds. For instance, require that the downside case still yields a minimum cash-on-cash return after fees.
Example: A Driver-First Underwriting Mini Model
Suppose you underwrite a recurring-revenue company.
- Starting customers: 10,000
- Monthly churn: 2%
- Monthly net expansion: 0.5%
- Average revenue per customer: $100
Revenue for month t is driven by customer count after churn and revenue per customer after expansion. Costs are driven by headcount and variable support costs per customer. Working capital is driven by payment terms; if customers pay in 30 days, cash timing follows that cycle.
In the model, you can change churn from 2% to 3% and observe the full chain: customer count falls faster, revenue per customer may still expand, but total revenue growth slows, margins compress due to fixed operating expenses, and cash flow deteriorates because collections lag.
Keep the Model Auditable with Driver Traceability
Finally, ensure every assumption has a label and a source category: contract terms, historical performance, management guidance, or diligence findings. When someone asks “why did IRR move,” the model should answer with a driver, not a shrug.
A model with clear drivers is easier to defend in an investment committee and easier to revise when diligence finds the one assumption that matters.
7.2 Estimating Entry Costs, Ongoing Expenses, and Fees
Entry costs are the “first bill” of direct investing: money and time spent before ownership starts. Ongoing expenses are the “staying bills” that keep the business running and your oversight credible. Fees are the explicit charges that sit on top of those costs—sometimes predictable, sometimes sneaky in the form of transaction or servicing costs.
Entry Costs You Should Budget Before Signing
Start with a simple rule: if it happens because you are buying, it belongs in entry costs. Typical categories include:
- Transaction diligence costs: accountants, legal counsel, industry experts, and travel. Example: a $20 million acquisition might require two legal workstreams (SPA and governance) plus a tax review; even if the deal fails, those costs are real.
- Financing and structuring costs: lender fees, legal work for security documents, and appraisal or collateral reviews. Example: if you use a secured note, you may pay for lien searches and documentation even before the first dollar is drawn.
- Deal execution costs: closing fees, escrow setup, and filing costs. Example: registering ownership changes or updating beneficial ownership records can add up across jurisdictions.
- Opportunity costs of internal time: not always booked as an expense, but it affects decision quality. Example: if your team spends six weeks on a deal that later gets repriced, the “cost” is slower work on other targets.
A practical best practice is to create a one-page “Entry Cost Sheet” with three columns: category, expected range, and who pays. That last column matters when co-investors split costs or when a seller reimburses certain expenses.
Ongoing Expenses That Keep Ownership Running
Ongoing expenses are not only operational costs of the company; they also include the costs of being a responsible owner.
- Company operating expenses: payroll, rent, software, insurance, and working capital needs. Example: a manufacturing firm may require periodic maintenance and inventory buffers that do not show up as “one-time” costs.
- Governance and reporting costs: board materials, management reporting, audit support, and compliance. Example: a quarterly reporting package might require finance staff time plus external review for controls.
- Monitoring and oversight: site visits, independent reviews, and legal updates. Example: if a company changes a key contract, you may need counsel to review amendments.
- Capital expenditures and maintenance: replacement of equipment, upgrades, and safety compliance. Example: a logistics business might need periodic fleet refreshes; treating capex as optional is how models quietly become optimistic.
To estimate ongoing expenses systematically, map them to the business model. A software company’s ongoing cost structure is different from a healthcare services firm’s. The goal is not precision to the dollar; it’s consistency with how the business actually spends money.
Fees That Sit on Top of Costs
Fees come in multiple forms, and you want to separate them so your return model stays honest.
- Professional fees: legal, accounting, tax, and advisory. Example: an annual tax provision review might be a recurring line item.
- Service fees: administration, fund/vehicle servicing (if any), and custody or reporting services. Example: if you use a holding company structure, there may be recurring corporate services.
- Transaction fees: success fees, break fees, or finder fees. Example: a broker might earn a fee only if the deal closes; you still need to model it because it affects net entry cost.
- Financing fees: interest, commitment fees, and amortization of issuance costs. Example: a revolving facility may charge a commitment fee even when you haven’t fully drawn.
A useful practice is to classify fees into one-time, recurring, and contingent. Contingent fees are the ones that surprise people during post-mortems.
A Mind Map for Estimation Inputs
Mind Map: Estimating Entry Costs, Ongoing Expenses, and Fees
Example: Turning a Deal Quote into Model Inputs
Assume you are considering a $10 million equity investment in a private company. You estimate entry costs as follows:
- Legal and diligence: $180,000
- Tax and accounting review: $60,000
- Financing structuring (bridge + security docs): $90,000
- Closing and filings: $25,000
- Internal time (tracked for learning): $40,000
Total estimated entry costs: $395,000.
For ongoing expenses, you estimate annual owner-related costs (not the company’s operating costs) at $120,000, including quarterly reporting support and periodic legal updates. You also include financing fees if the investment uses debt at the holding level, such as a 1.0% commitment fee on undrawn amounts.
In the model, you then apply a consistent rule: entry costs reduce initial net invested capital, while ongoing owner-related expenses reduce annual cash flows. Company operating costs remain in the operating forecast, not in the fee bucket.
A Simple Checklist to Avoid Common Estimation Errors
- No double counting: professional fees should not be included again inside operating expenses.
- Clear ownership of costs: specify whether costs are paid by the company, the holding entity, or the investors.
- Ranges tied to drivers: “legal costs $150k–$250k” is better than “legal costs $200k.”
- Actuals tracking: compare budget to spend for each closed deal so future estimates tighten.
When entry costs, ongoing expenses, and fees are estimated with clean categories and explicit drivers, your underwriting stops being a guess and starts being a disciplined accounting exercise. The business still has surprises; at least your model won’t add its own.
7.3 Modeling Downside Scenarios Without Hand Waving
Downside modeling is not about being pessimistic; it’s about being specific. A good downside scenario answers: “If things go wrong, which assumptions break first, by how much, and through what mechanism?” Hand waving happens when the model just applies an arbitrary haircut to revenue or EBITDA without explaining the operational path.
Start with a foundation: identify the few drivers that actually move cash. For most private deals, those drivers cluster into (1) demand and pricing, (2) cost structure and margin, (3) working capital intensity, (4) capex needs, and (5) financing constraints. Then define downside as a set of linked changes across those drivers, not a single percentage reduction.
Step 1: Build a Driver Map from Business Mechanics
Create a driver map that connects operational variables to financial outputs. Example: if a company sells subscription software, a downside might include churn rising, which reduces net revenue retention, which then lowers gross profit, which then affects cash conversion because collections slow.
Step 2: Define Triggers, Not Just Percentages
A scenario becomes credible when it has a trigger and a duration. Pick one or two triggers that plausibly cause the stress. For instance:
- Trigger: a key customer churns and replacement sales lag.
- Trigger: input costs rise and the company cannot pass through prices quickly.
- Trigger: collections slow due to customer disputes.
Then specify duration. A one-quarter shock is different from a two-year regime change. Duration matters because working capital and fixed-cost leverage behave differently over time.
Step 3: Link Assumptions Across the Income Statement and Cash Flow
Hand waving often appears as “EBITDA down 20%” with no cash consequence. Instead, connect the dots.
Example for a services business with billings and collections:
- Revenue downside: billable hours fall 10% and utilization drops.
- Margin downside: subcontractor rates rise 5% and gross margin compresses.
- Cash downside: DSO increases from 45 to 60 days because disputes rise.
In the model, revenue and margin changes flow into operating cash flow, while DSO changes flow into accounts receivable and therefore cash. The result is usually worse than applying a single haircut to EBITDA, because cash timing can break first.
Step 4: Use a “Stress Ladder” to Avoid Single-Point Fantasy
Create three tiers: mild, base-stress, and severe. Keep the structure identical; only the magnitudes change.
Example:
- Mild: churn +2 points for two quarters; DSO +5 days.
- Base-stress: churn +4 points for four quarters; DSO +12 days; capex delayed by one quarter but not eliminated.
- Severe: churn +7 points for four quarters; DSO +20 days; capex maintenance increases by 10% due to deferred repairs.
Notice the last line: severe doesn’t just “hurt more,” it changes the nature of the problem. Deferred maintenance can become more expensive later, and that’s a mechanism, not a mood.
Step 5: Add Feedback Loops and Constraint Checks
Downside should include at least one feedback loop. Common loops:
- Lower revenue reduces cash, which delays capex, which then worsens future revenue.
- Margin compression reduces retained cash, which limits hiring, which then reduces capacity.
- Covenant pressure forces cost cuts that harm customer retention.
Also run constraint checks. If the deal relies on a revolver, model minimum liquidity and interest coverage. If the company can’t meet covenants, the “downside” isn’t just financial; it changes available actions.
Step 6: Translate Scenarios into Decision-Useful Outputs
Finally, convert scenarios into outputs the investment committee can use without guessing.
- Minimum cash balance at each quarter.
- Equity IRR range and downside multiple on invested capital.
- Breakeven operating metrics (e.g., utilization, churn, gross margin).
- Required mitigation actions and their timing.
A practical rule: if the scenario doesn’t change at least one cash timing item (working capital, capex timing, or debt service), it’s probably not a real downside scenario—it’s a spreadsheet haircut.
Step 7: Sanity Check with Sensitivity, Then Reconcile
Do quick sensitivities on the top two drivers and confirm the severe scenario sits at the edge of those sensitivities, not outside them. Then reconcile: if the model says severe causes massive EBITDA loss but cash barely changes, you likely missed working capital or capex timing. Fix the linkage, not the narrative.
7.4 Incorporating Financing Terms and Capital Stack Effects
Direct investing models often assume “equity only,” then wonder why returns don’t match reality. Financing terms are not a footnote; they change the cash flows, the risk profile, and the order in which money gets paid back. This section shows how to incorporate capital stack effects systematically, so your base case and downside case stay consistent.
Start with the Capital Stack Waterfall
Think of the capital stack as a payment priority list. In a typical deal, equity sits at the bottom: it gets paid last, but it also captures upside. Debt gets paid first, usually with fixed interest and principal repayment rules.
A practical way to model this is to define three layers:
- Senior debt: paid before others; often has covenants.
- Mezzanine or preferred equity: sits between; may have higher yield and payment flexibility.
- Common equity: absorbs losses first and benefits last.
Example: A $50 million acquisition is funded with $30 million senior debt, $10 million mezzanine, and $10 million equity. If the business underperforms and sale proceeds are only $45 million, senior debt is satisfied first, mezzanine gets the next slice, and common equity may receive little or nothing.
Translate Financing Terms into Cash Flow Lines
Financing terms affect both timing and magnitude of cash flows. Your underwriting model should include explicit lines for:
- Interest expense (and whether it’s cash-pay or PIK)
- Amortization or scheduled principal
- Fees (origination, commitment, prepayment)
- Equity returns mechanics (dividends, preferred pay, conversion)
Example: If senior debt has 8% interest and $30 million principal, annual interest is $2.4 million. If the debt also amortizes $3 million per year, then principal repayment reduces cash available for equity even if EBITDA is stable.
Model Covenants as Decision Constraints
Covenants are not just compliance trivia; they can force actions that change the deal outcome. Common covenant types include:
- Leverage tests (debt/EBITDA)
- Coverage tests (EBITDA/interest)
- Minimum liquidity
Best practice: convert covenant triggers into model “switches.” When a test fails, you apply the contractual remedy in your downside scenario.
Example: A leverage covenant requires debt/EBITDA below 5.0x. If EBITDA drops, the model should show whether the sponsor must use excess cash to pay down debt, restrict dividends, or renegotiate. Even if you don’t know the exact remedy, you can model a conservative default such as mandatory cash sweep.
Incorporate Fees and Transaction Costs into Entry Returns
Financing changes entry economics through fees and structure costs. These costs can be modeled in two places:
- Upfront: reduce net proceeds available to the business or equity
- Ongoing: reduce cash flow via annual fees or higher effective interest
Example: A 2% origination fee on $30 million senior debt is $0.6 million. If you ignore it, equity IRR will be overstated because the deal starts with less usable capital.
Use Capital Stack Effects to Build Consistent Scenarios
Once terms are explicit, you can run scenarios that respect payment priority. The key is consistency: the same operating assumptions must flow through the same financing rules.
Example scenario set:
- Base case: EBITDA holds, interest is paid, principal amortizes.
- Downside case: EBITDA declines, interest coverage tightens, and cash sweeps reduce equity distributions.
- Severe downside: sale proceeds are insufficient; waterfall logic determines what equity actually receives.
Mind Map: Financing Terms and Stack Effects
A Compact Underwriting Template for This Section
Use a simple sequence in your model so nothing is “hand waved”:
- Set capital amounts by layer (debt, mezz, equity).
- Apply financing terms to compute interest, fees, and principal.
- Run covenant checks and apply remedies as constraints.
- Compute free cash flow available for distributions after required payments.
- Apply exit waterfall using sale proceeds and payoff rules.
Example: If exit proceeds are $60 million, your waterfall might pay senior debt principal first, then any accrued interest and fees, then mezzanine redemption, then preferred dividends, and finally distribute remaining cash to common equity.
Common Modeling Mistakes to Avoid
- Using equity-only IRR while the deal is debt-funded.
- Ignoring amortization and treating debt as interest-only.
- Modeling covenants as commentary rather than operational constraints.
- Applying exit proceeds to equity directly without a payoff waterfall.
When financing terms are modeled as first-class inputs, the capital stack stops being a diagram and becomes a set of rules. That’s what makes your base case believable and your downside case coherent.
7.5 Translating Model Outputs into Investment Committee Decisions
A model is only useful if the Investment Committee (IC) can translate its numbers into a decision that matches the family office’s mandate. The goal is not to “trust the spreadsheet,” but to make the model’s logic auditable, the assumptions contestable, and the decision criteria explicit.
Start with Decision Questions, Not Metrics
Before reviewing outputs, the IC should agree on the decision questions. For a direct deal, typical questions are: Is the business durable enough to justify the price? Are the risks priced in? Can we live with the downside without breaking our liquidity plan? A good practice is to map each decision question to a small set of model outputs.
Example: If the mandate emphasizes long-term capital preservation, the IC might prioritize (1) downside free cash flow coverage, (2) covenant or control protections, and (3) liquidity impact under delayed exits. The model outputs then become evidence for those three questions, not a list of charts.
Use a Three-Layer Output Stack
Present model outputs in layers so the IC can separate “what we think” from “how sure we are.”
- Base Case Outputs: entry valuation, expected IRR or equity multiple, and annual cash flow profile.
- Risk-Adjusted Outputs: downside scenarios, probability-weighted outcomes, and key sensitivities.
- Decision Constraints: liquidity usage, concentration limits, governance requirements, and any hard stop thresholds.
This structure prevents a common failure mode: the IC reacts to the headline return while ignoring the constraint that would make the deal unacceptable.
Translate Sensitivities into Decision Levers
Sensitivities should be framed as levers the IC can act on. Instead of “IRR is sensitive to margin,” say what margin change would do and what protection exists.
Example: Suppose a SaaS company’s base case assumes gross margin of 78%. A sensitivity shows that a drop to 72% reduces equity IRR from 18% to 10%. The IC should then ask: What is the operational plan to defend margin? Are there customer churn protections, pricing power evidence, or cost controls in the diligence findings? If none exist, the IC can respond by requiring a lower entry price, adding downside protection, or passing.
Convert Probability Weighting into Plain Language
Probability-weighted models can be misread as “confidence scores.” To keep them decision-ready, present them as scenario outcomes with a short rationale for each scenario.
Example: Three scenarios—Base, Downside, and Severe—each with a one-paragraph explanation tied to diligence facts. The IC then decides whether the weighted outcome clears the hurdle given the family’s tolerance for illiquidity and drawdown.
Tie Model Outputs to Governance and Contract Terms
Returns are not just math; they are the consequence of rights and obligations. The IC should connect each material model driver to a corresponding contract or governance lever.
Example: If the model depends on achieving a refinancing within 24 months, the IC should confirm whether the financing documents include refinancing conditions, consent rights, and information rights that allow early intervention. If the model assumes management will hit milestones, the IC should check whether there are board-level reporting cadences and milestone-linked protections such as earnout mechanics or step-up rights.
Use a Decision Table with Explicit Thresholds
A decision table helps the IC avoid vague approval language. Include thresholds for acceptance, rejection, and conditional approval.
| IC Question | Model Output | Acceptance Threshold | If Not Met |
|---|---|---|---|
| Is downside survivable? | Downside equity multiple and cash coverage | Downside multiple ≥ 1.0x | Require price adjustment or stronger protections |
| Are we paying for quality? | Valuation vs. normalized earnings/FCF | Entry ≤ target value | Negotiate valuation or structure |
| Can we fund without stress? | Liquidity impact under delayed exit | Max drawdown within liquidity ladder | Reduce size or change funding schedule |
| Do we have control to manage risk? | Governance protections mapped to drivers | Rights cover top 3 risks | Add consent/information/board mechanics |
Run a “Model Challenge” In Two Rounds
A structured challenge keeps debate productive.
- Round 1: Assumption Integrity. Focus on whether the assumptions are grounded in diligence. Ask: Which assumptions are directly supported by evidence, and which are placeholders?
- Round 2: Decision Fit. Focus on whether the assumptions and protections align with the family’s constraints. Ask: If the downside scenario occurs, do we still meet liquidity and governance requirements?
A practical tip: assign one IC member to “defend the base case” and another to “stress the constraints,” then reconcile differences into a single decision recommendation.
Mind Map: From Model Outputs to IC Decision
Example: Turning a Spreadsheet into a Recommendation
Assume the model shows an 16% base-case IRR, but the downside scenario yields 0.9x equity multiple. The IC’s liquidity ladder allows the investment only if the downside does not force additional capital calls.
The IC recommendation becomes conditional and specific: approve only if (1) entry price is reduced to raise downside equity multiple to at least 1.0x, and (2) the financing terms include information rights and consent triggers tied to covenant breaches. The final decision is therefore anchored to model outputs, but expressed as contractable actions.
When this translation is done well, the IC is not “reading numbers.” It is making a disciplined choice about what risks are acceptable, what protections are required, and what evidence must be true for the deal to earn approval.
8. Financing, Capital Calls, and Commitment Management
8.1 Planning Funding Schedules for Commitments
A funding schedule turns a commitment into a calendar of cash needs, so your family office can avoid two common problems: paying too early (missing interest and flexibility) or paying too late (missing the deal). The goal is simple: match expected draw dates to your liquidity ladder, while building in buffers for delays.
Foundations: What You Are Scheduling
Start by listing every cash movement tied to the commitment.
- Initial closing payment: often due at signing or closing.
- Subsequent capital calls: typically tied to milestones like construction, acquisitions, or development.
- Reimbursements and expenses: sometimes paid alongside calls.
- Reserves and follow-on rights: optional, but they can become required if you choose to maintain ownership.
Then map each payment to the contract language. If the agreement says “within X days of notice,” your schedule should use the latest plausible notice-to-payment timing, not the best-case scenario.
Liquidity Ladder Inputs
A funding schedule is only as good as the liquidity ladder it draws from.
- Bucket A: Near-term cash for payments expected within the next 30–60 days.
- Bucket B: Short-term liquidity for 3–12 month needs.
- Bucket C: Medium-term liquidity for longer windows.
- Bucket D: Illiquid capital that should not be tapped for routine calls.
A practical rule: if a capital call could land in the next quarter, it must be covered by Buckets A or B. Otherwise, you are relying on luck.
Building the Schedule Step by Step
- Create a commitment timeline with the deal’s key dates: signing, closing, and expected milestone dates.
- Translate milestones into call windows. For example, “construction start” becomes a call window of “notice received plus payment due.”
- Assign probability weights to each call window based on historical behavior of the sponsor or management team. Use conservative weights if you lack data.
- Add a delay buffer. Many private deals slip by weeks, not years. A buffer of one to two notice cycles is usually enough to prevent avoidable liquidity stress.
- Convert percentages into dollars using your commitment amount and any stated call caps.
- Stress test the schedule by shifting each call to the latest plausible date and checking whether your liquidity ladder still covers it.
Mind Map: Funding Schedule Logic
Funding Schedule Mind Map
Example: A Simple Direct Equity Commitment
Assume a $10,000,000 equity commitment with:
- $2,000,000 due at closing.
- Remaining $8,000,000 called in three tranches tied to milestones.
- Each call requires payment within 10 business days of notice.
Your schedule might look like this:
- Closing month: $2,000,000 from Bucket A.
- Milestone 1 window: notice in Month 2, payment by Month 2 end; allocate $2,500,000 from Bucket B.
- Milestone 2 window: notice in Month 4, payment by Month 4 end; allocate $2,500,000 from Bucket B.
- Milestone 3 window: notice in Month 6, payment by Month 6 end; allocate $3,000,000 from Bucket C.
Now add a delay buffer: if each milestone slips by one notice cycle, shift each window by one month. If Bucket C coverage breaks under that shift, you either move some liquidity earlier (still within the ladder rules) or negotiate for a different call cadence where possible.
Example: Debt with Drawdowns and Fees
For a construction or acquisition facility, drawdowns may be tied to invoices or inspection milestones. In that case, your schedule should include:
- Drawdown amounts per tranche.
- Timing of fee payments (some fees are due at draw, others at closing).
- Interest start date (interest may begin before full funding).
A clean approach is to forecast cash needs as drawdown plus fees for each window, not just principal. Otherwise, you can be “covered” on principal while still short on fees.
Advanced Details That Prevent Operational Mistakes
- Notice tracking: assign an internal owner to log notices and confirm payment deadlines. A schedule without ownership is just a spreadsheet with ambition.
- Cross-deal netting: if multiple deals call around the same time, netting can reduce unnecessary transfers between buckets.
- Rebalancing triggers: define thresholds such as “if Bucket B coverage falls below 1.2x next quarter calls, rebalance immediately.” This keeps decisions consistent.
- Audit trail: store the mapping from contract language to each forecast line item, so later questions have answers.
A good funding schedule is conservative where it should be and precise where it can be. It should tell you, month by month, what cash must be available, which bucket it comes from, and what internal action is required when a notice arrives.
8.2 Managing Capital Calls and Bridge Liquidity
Capital calls are the moment your portfolio stops being a spreadsheet and starts being a cash-flow problem. The goal is simple: fund commitments on time, avoid forced sales, and keep the family office’s liquidity boringly reliable.
Foundational Concepts That Prevent Cash-Call Surprises
Start by separating three buckets of money:
- Committed capital: the amount you promised to deploy under a contract.
- Available liquidity: cash and near-cash resources you can use immediately.
- Bridge liquidity: temporary funding used only to cover timing gaps between when capital is called and when other cash becomes available.
A common failure mode is treating “committed” as if it were “available.” Committed capital is a liability until funded, and bridge liquidity is the tool that converts timing into certainty.
Designing a Funding Calendar That Matches Reality
Build a capital-call calendar from the deal documents and your internal workflow:
- Collect call notices: track notice dates, payment deadlines, and any subscription mechanics.
- Map internal approval timing: decide who signs off and how quickly.
- Align with cash inflows: include expected distributions, interest receipts, and operating cash needs.
- Create a buffer rule: set a minimum liquidity floor that cannot be touched by capital calls.
Example: Suppose you expect a $2.5M call in 10 business days, but your quarterly distribution hits in 18 business days. If your liquidity floor is $1.0M and your available cash is $1.6M, you still need $0.9M bridge funding to avoid missing the deadline.
Bridge Liquidity Options and When Each Makes Sense
Bridge liquidity should be chosen based on cost, speed, and how predictable the calls are.
- Cash sweep from operating accounts: best when calls are small and frequent, and you can automate transfers.
- Short-term credit line: best when calls are lumpy and you want a known maximum exposure.
- Temporary sale of liquid holdings: best when the portfolio is already designed for liquidity, and the expected cost is acceptable.
A practical rule: prefer bridge tools that are reversible and measurable. If you can’t quantify the cost of being late versus the cost of bridging, you’re guessing.
Operational Workflow for Capital Calls
Treat each call like a mini project with a checklist.
- Day -5 to -10: confirm the notice is authentic, read the payment instructions, and verify the amount against your commitment.
- Day -3 to -5: run a liquidity check against the liquidity floor and any other scheduled obligations.
- Day -1: finalize funding method and ensure transfer instructions are correct.
- Day 0: execute payment and record confirmation.
- Day +2 to +5: reconcile the funded amount to the deal’s capital account statement.
Example: If a GP requests payment to a new bank account, require a verification step before sending funds. This is not bureaucracy; it’s how you avoid expensive mistakes.
Mind Map: Capital Calls and Bridge Liquidity
Advanced Details That Keep the System Stable
1) Set a bridge exposure limit. Decide the maximum bridge amount you will carry at any time. This prevents a cluster of calls from turning into a liquidity crisis.
2) Use a “waterfall” funding order. For example: available cash first, then credit line, then temporary sale only if the credit line is unavailable or too costly.
3) Track bridge utilization as a metric. If you frequently use bridge liquidity, your allocation timing assumptions are off, or your cash buffers are too thin.
4) Separate deal-level and office-level liquidity. Deal-level liquidity is about funding the commitment; office-level liquidity is about meeting operating needs and other obligations. Mixing them creates avoidable stress.
Mini Case Example: Two Calls, One Liquidity Floor
Assume:
- Liquidity floor: $1.2M
- Available cash: $2.0M
- Call A due in 7 days: $0.9M
- Call B due in 12 days: $1.1M
If you fund Call A from available cash, remaining cash is $1.1M, which is below the $1.2M floor. You bridge $0.1M for Call A, then use the remaining $0.9M cash plus bridge for Call B. The office avoids both late payment and floor breaches, with bridge usage kept minimal and auditable.
When capital calls are managed this way, the family office doesn’t just “pay on time.” It maintains control over liquidity, decision discipline, and record integrity—quietly, consistently, and without turning every call into a fire drill.
8.3 Evaluating Co Investment Terms and Allocation Waterfalls
Co-investing lets a family office participate alongside a lead investor, often with lower fees and more direct control over terms. The trade is that you must read the contract like it’s going to be used in court—because it might be.
Foundational Terms You Must Know First
Start with the three levers that determine economics: (1) what you pay, (2) how returns are split, and (3) when you get paid. “Allocation waterfall” is the order of payments and the rules for how profits and sometimes losses are distributed.
Key inputs to collect from the term sheet or LPA-style document:
- Capital contributions: your initial equity, any follow-on rights, and whether contributions are pro rata.
- Preferred return: whether the lead gets a return before you participate in profits.
- Carried interest: the percentage of profits allocated to the lead after hurdles.
- Catch-up: whether the lead accelerates its share after the preferred return is met.
- Return of capital: whether distributions first return your principal before profit splits.
- Fees and expenses: whether fees reduce distributable proceeds or are paid separately.
A simple mental model: the waterfall is a recipe that tells the money where to go, step by step, after the deal is realized.
Allocation Waterfall Mechanics with a Concrete Example
Assume a co-investment into a $20 million company.
- Family office invests $5 million.
- Lead fund invests $15 million.
- At exit, proceeds are $30 million.
- Terms: return of capital first, then 8% preferred return to all investors, then profits split with 20% carry to the lead and 80% to investors.
Step 1: Return of capital
- Total principal returned: $20 million.
- Family office receives $5 million.
Step 2: Preferred return
- Suppose the preferred return is calculated on the family’s $5 million at 8% for the holding period, and the total preferred amount for the whole deal is $2 million.
- Family office share of preferred: $2m × (5/20) = $0.5 million.
Step 3: Profit split after preferred
- Remaining proceeds: $30m − $20m − $2m = $8 million.
- Carry applies to the lead’s profit allocation. If the lead’s carry is 20% of the investors’ profit pool, then investors (including you) receive 80% of $8m = $6.4 million.
- Family office share of that investor pool: $6.4m × (5/20) = $1.6 million.
Total family distributions: $5.0m + $0.5m + $1.6m = $7.1 million.
This example is intentionally tidy. Real documents add wrinkles like deal-level vs fund-level waterfalls, multiple tranches, and whether carry is calculated on net proceeds after certain costs.
Evaluating Co Investment Terms Beyond the Headline
A co-investment can look attractive on carry but still be expensive if expenses are embedded in the waterfall.
Checklist for term-by-term evaluation:
- Is your investment “pari passu” with the lead on return of capital and preferred return, or do you sit behind certain tranches?
- Are there separate waterfalls for different classes of equity or for different investment rounds?
- How are fees treated: management fees, transaction fees, monitoring fees, and legal costs. Ask whether they reduce distributable proceeds or are paid from the fund’s own resources.
- What triggers carry: only on realized gains, or can it be accelerated on partial exits.
- What happens on write-downs: whether losses are allocated pro rata or whether certain parties have downside protection.
A practical best practice is to request a waterfall illustration using the exact assumptions in the term sheet. If the lead cannot produce it, you can still build your own model, but you should treat missing clarity as a risk factor.
Mind Map: Co Investment Terms and Waterfall Logic
Allocation Waterfall Red Flags and How to Test Them
Red flags are usually specific, not dramatic.
- Ambiguous expense netting: if the document says “expenses may be deducted,” you need to know which expenses and whether they are capped.
- Unclear preferred return basis: confirm whether preferred is calculated on invested capital, outstanding principal, or net of certain fees.
- Seniority by class: if you are in a different security class than the lead, your return path may be different even if the headline says “co-invest.”
A quick test: take two scenarios—one where proceeds barely cover principal plus preferred, and one where proceeds are much higher. If your share changes in a way that doesn’t match the stated priorities, the waterfall may be doing something you didn’t intend.
Decision Output You Should Produce Internally
Before signing, produce a one-page summary for the investment committee:
- Your expected distribution range under low, base, and high exit proceeds.
- Your effective return drivers: preferred, carry, and fee netting.
- A short list of assumptions that must be confirmed in final documents.
Co-investing is often about disciplined participation. The waterfall is where discipline becomes math, and math is where surprises stop being fun.
8.4 Tracking Commitments, Drawdowns, and Remaining Capacity
Direct investing is great at turning “we like this deal” into “we own this deal.” The less glamorous part is making sure the family office can fund it when the paperwork says it must be funded. This section turns commitment tracking into a repeatable system: clear definitions, a simple ledger, and a cadence that prevents surprises.
Foundational Definitions That Prevent Confusion
A commitment is the maximum amount the family office has agreed to fund under a deal or financing arrangement. A drawdown is the actual amount funded so far. Remaining capacity is the commitment minus cumulative drawdowns, adjusted for any cancellations, amendments, or partial releases.
Example: The office commits $10 million to a private equity co-invest. By month-end, $3.2 million has been funded. Remaining capacity is $6.8 million, unless the agreement allows reductions or the deal has been restructured.
Build a Single Source of Truth Ledger
Use one ledger for each capital bucket and each deal. The ledger should track at least: commitment amount, drawdown dates and amounts, current remaining capacity, and the funding trigger that caused each drawdown.
A practical approach is a table with these columns:
| Field | What To Record | Why It Matters |
|---|---|---|
| Deal or Facility | Co-invest, preferred equity, credit line | Prevents mixing instruments |
| Commitment | Max funding obligation | Sets the ceiling |
| Drawdown Amount | Actual funded amount | Measures usage |
| Drawdown Date | When funds left | Supports cash planning |
| Trigger Type | Closing, capital call, milestone | Explains timing |
| Remaining Capacity | Commitment minus drawdowns | Drives next decisions |
| Notes | Amendments, partial releases | Preserves auditability |
Example: A credit facility may have a commitment and then multiple borrowings. Each borrowing is a drawdown, but the remaining capacity is still the unused portion of the facility commitment.
Map Funding Triggers to Cash Planning
Not all drawdowns arrive the same way. Common triggers include:
- Closing funding: usually a one-time drawdown at transaction close.
- Capital calls: periodic or event-driven requests to fund commitments.
- Milestone funding: staged funding tied to operational or legal milestones.
- Revolving credit draw: borrowing when needed, with repayments potentially restoring capacity.
Example: In a staged preferred equity investment, the agreement might fund 40% at closing and 60% after regulatory approval. Your cash plan should treat the second drawdown as contingent, not automatic.
Create a Capacity View Across the Whole Portfolio
Remaining capacity is not only per deal; it’s also per capital bucket. If you have buckets like “direct equity,” “private credit,” and “special situations,” you need a roll-up view that sums commitments and drawdowns across all deals in each bucket.
Example: Suppose the office has $50 million in the direct equity bucket. It commits $20 million to Deal A, $15 million to Deal B, and $10 million to Deal C. If $12 million has been drawn across A and B, then remaining bucket capacity is $50 - (20+15+10) + 12 = $17 million.
This roll-up prevents a common failure mode: approving a new deal because one line item has capacity, while the bucket as a whole is already overcommitted.
Track Amendments and Partial Releases Like They Matter
Agreements change. Amendments can reduce commitments, extend timelines, or alter triggers. Partial releases can occur when a portion of the commitment is no longer required.
Example: A deal originally required $8 million total funding, but after a refinancing the sponsor reduces the requirement to $6 million. Your ledger should update the commitment and recalculate remaining capacity immediately, with a note referencing the amendment.
Use a Simple Cadence for Updates
A workable cadence is:
- Weekly: review upcoming drawdown notices and confirm cash availability.
- Monthly: reconcile ledger totals to bank activity and deal statements.
- Quarterly: review bucket-level capacity and confirm that governance approvals still align with current obligations.
Example: If a capital call notice arrives late, the weekly review catches it before it becomes a “why didn’t we plan for this” meeting.
Mind Map: Commitments, Drawdowns, and Remaining Capacity
Worked Example: From Approval to Funding
Assume the office approves a $12 million direct equity commitment on March 1. The agreement states: 50% at closing, 50% after a product launch milestone.
- March 1: commitment recorded as $12.0 million.
- March 15: closing drawdown of $6.0 million recorded.
- April 30: milestone drawdown notice received for $6.0 million.
- May 10: drawdown of $6.0 million funded.
Remaining capacity after May 10 is $0.0 million. If the sponsor later amends the milestone requirement to a smaller amount, the ledger updates the commitment and remaining capacity accordingly.
The point of the system is not to be perfect on day one; it’s to be consistent enough that every funding obligation is visible, explainable, and cash-backed when it arrives.
8.5 Documenting Funding Decisions and Audit Trails
Funding decisions in direct investing are easy to make and hard to defend later. The goal of this section is simple: when someone asks “Why did we fund, when did we fund, and what did we rely on?”, you can answer with documents that are complete, consistent, and traceable.
Define What Must Be Traceable
Start by listing the decision points that create audit risk. In most family offices, these are: (1) approval to commit capital, (2) approval to fund a specific draw or tranche, (3) approval of any waiver or amendment, and (4) approval of any deviation from the investment policy.
For each decision point, define three artifacts:
- Decision record: who approved, when, and under what authority.
- Decision basis: the memo, model outputs, and key assumptions used.
- Execution evidence: wire instructions, subscription documents, and confirmations.
A practical rule: if a document would change the outcome of the decision, it belongs in the audit trail.
Create a Funding Decision Packet
A funding packet is a standardized folder structure that prevents “missing the one email” syndrome. Use the same packet template for every deal.
Packet contents (minimum viable set):
- Funding request from the issuer or GP, including the capital call notice.
- Funding approval from the investment committee or delegated authority.
- Capital call calculation showing the amount due and the basis for it.
- Liquidity check referencing the liquidity ladder and available cash.
- Compliance check confirming eligibility under policy constraints.
- Wire instructions and payment confirmation.
- Post-funding update noting remaining commitment and next expected milestone.
If the capital call includes conditions (for example, a covenant or a closing deliverable), include the condition checklist and the sign-off.
Use a Consistent Naming and Versioning System
Audit trails fail when filenames are inconsistent and versions are unclear. Adopt a naming convention that encodes deal, document type, and date.
Example naming pattern:
DealName_Instrument_CapitalCall_2026-02-15_v1DealName_InvestmentCommittee_FundingApproval_2026-02-16_v2
Keep a single “current” version and archive older drafts. When you update a model or memo, record what changed and why, even if the change is minor.
Capture Delegation and Authority Boundaries
Many families delegate funding approvals up to a threshold. Document the delegation rules in the policy and mirror them in the approval workflow.
Include in the packet:
- the delegation matrix reference,
- the approval threshold that applies,
- and the reason the request qualifies for delegated approval.
If a request exceeds the threshold, route it through the full committee and record the exception rationale.
Build the Audit Trail Mind Map
Use the mind map below to ensure every funding decision has a complete chain from request to confirmation.
Mind Map: Funding Decision Audit Trail
Example Funding Packet in Practice
Assume a family office holds a minority equity position with a $10 million commitment. A capital call requests $1.2 million on 2026-02-15.
What goes into the packet:
- The GP’s capital call notice stating the amount, due date, and purpose.
- A one-page capital call calculation: $1.2 million due based on ownership percentage and remaining commitment.
- A liquidity check referencing the “next 60 days” cash bucket and confirming $1.2 million is available without breaching the liquidity ladder.
- An approval record showing delegated authority applies because the request is below the threshold and no policy constraints are triggered.
- Wire instructions and the bank confirmation after payment.
- A post-funding note updating remaining commitment to $8.8 million and listing the next expected reporting date.
If the liquidity check fails, the packet must include the alternative action taken (for example, timing adjustment, partial funding if permitted, or committee escalation) and the reason.
Keep Evidence Clean and Searchable
Finally, treat the audit trail as a system, not a pile of PDFs. Store packets in a structured repository, ensure each packet is complete before approval, and require that the execution evidence matches the approved amount.
A small but powerful habit: when you approve funding, verify that the wire amount, deal name, and instrument match the packet. It’s the least glamorous step, and it prevents the most expensive mistakes.
9. Portfolio Construction for Illiquid Direct Holdings
9.1 Diversification Across Sectors, Stages, and Geographies
Diversification in direct investing is not about owning “a little bit of everything.” It’s about reducing the chance that one kind of risk—customer concentration, regulatory change, refinancing stress, or operational failure—dominates your outcomes. For family offices, the practical goal is to keep the portfolio investable through time: you should be able to fund follow-ons, handle slower realizations, and still sleep at night.
Core Idea: Diversify Risk, Not Just Headlines
Start by separating three risk sources that diversification can address:
- Business risk: what the company does and how it earns.
- Capital risk: how the company is financed and what happens when liquidity tightens.
- Context risk: where the company operates and which rules apply.
Then map each deal to these buckets. A “sector spread” that all companies sell to the same customer type can still share business risk. A “geography spread” that all companies rely on the same currency and tax regime can still share context risk.
Mind Map: Diversification Framework
Sector Diversification with Concrete Filters
Choose sector exposure based on revenue driver differences, not just industry labels.
- Example 1: Two “software” deals, different risk. One sells to regulated healthcare providers with long sales cycles; the other sells to internal IT teams with faster procurement. They share a sector label, but their customer procurement and compliance cycles differ. Treat them as different business risk profiles.
- Example 2: One “consumer” deal, two demand engines. A direct-to-consumer brand depends on marketing efficiency; a consumer services operator depends on local foot traffic and staffing. Even if both are “consumer,” their margin drivers and cost structures differ.
A simple best practice is to define a small set of sector sub-drivers in your investment policy, then require each new deal to state which sub-driver it belongs to.
Stage Diversification That Respects Capital Risk
Stage diversification helps because early-stage deals often fail for different reasons than mature ones.
-
Early-stage: outcomes hinge on product-market fit and execution. Capital risk is high because financing may be needed before cash generation.
-
Growth-stage: outcomes hinge on scaling and maintaining unit economics. Capital risk is moderate but still sensitive to funding availability.
-
Mature: outcomes hinge on durability of cash flows and competitive position. Capital risk is lower, but governance and operational drift can still hurt.
-
Example 3: Build a “follow-on capable” mix. If you allocate most of your direct capital to early-stage equity, you may face repeated follow-on requests when valuations reset. A more resilient approach is to pair early-stage positions with some growth and mature holdings that generate cash distributions or have less urgent capital needs.
Geography Diversification Without Pretending Borders Don’t Matter
Geography affects outcomes through law, enforcement, and practical operations.
- Example 4: Same business model, different contract enforceability. A logistics platform may look identical across countries, but dispute resolution timelines and contract enforceability can change working capital needs. Treat geography as a context risk input to your underwriting.
- Example 5: Currency exposure as a deliberate choice. If your family office reports in one currency, a deal with revenues in another currency can help or hurt depending on cost structure. Diversification should include whether the company’s costs hedge the currency exposure.
A best practice is to record, for each deal, the primary revenue currency, primary cost currency, and key legal jurisdiction. Then you can see whether “diversified geographies” are actually concentrated in the same currency and legal regime.
Portfolio Construction: Turning Diversity into Limits
Diversification becomes real when you set constraints.
-
Concentration limits: cap exposure by sector sub-driver, stage, and geography.
-
Liquidity ladder alignment: ensure your near-term liquidity needs are covered by assets that can be funded or realized without stress.
-
Follow-on capacity: reserve a portion of capital for maintaining ownership when valuations move.
-
Example 6: A balanced direct allocation snapshot. Suppose you target 12 direct positions. You might aim for 3 early-stage, 5 growth-stage, and 4 mature positions, spread across 3–4 sector sub-drivers and 2–3 geographies. The exact numbers vary, but the logic is consistent: each bucket should be large enough to matter and small enough not to dominate.
Monitoring: Keep Diversification from Drifting
Diversification can erode after investment.
- A company can shift from growth to mature economics, changing its risk profile.
- A sector can become more correlated if customer behavior changes.
- A geography can become more concentrated if regulatory issues cluster.
Set monitoring triggers tied to your diversification assumptions, such as customer concentration changes, margin compression beyond a threshold, or material changes in legal or tax structure. When triggers fire, you update the risk map and decide whether to add, hold, or reduce.
9.2 Balancing Control Positions and Minority Stakes
Balancing control and minority exposure is less about ideology and more about matching governance power to the work you expect to do. Control positions can reduce decision friction, but they also concentrate responsibility, legal exposure, and operational involvement. Minority stakes can be efficient and diversified, yet they require careful protection of downside and clarity on what you can influence.
Foundational Concepts That Drive the Choice
Start with three questions. First, what decisions matter most to the value thesis? If the thesis depends on pricing, hiring, capex timing, or financing choices, you will want governance levers. Second, how much operational bandwidth does the family office have? Control is not just voting rights; it is monitoring, escalation, and sometimes direct support. Third, what is the downside you must prevent? Minority stakes can work when protections are contractual and information rights are strong.
A practical rule: the more the value thesis depends on management choices that can be delayed or reversed, the more you should bias toward control or toward minority terms that replicate control through consent rights.
Control Positions When You Need Decision Leverage
Control is most useful when you expect to change direction, not just observe it. Examples include:
- Turnaround with clear levers: A manufacturing business has margin pressure from process inefficiency. If the plan requires capex approval and management replacement, minority status may stall. A control position lets you set milestones and enforce them through board mechanics.
- Strategic reorientation: A services firm needs to shift from low-margin contracts to higher-margin work. If the pivot requires sales leadership changes and customer renegotiation, voting power and board control help.
Control also changes your monitoring style. Instead of waiting for quarterly updates, you define a cadence of operational KPIs and escalation triggers. For instance, you might require monthly reporting on gross margin, backlog quality, and cash conversion, with a defined process for approving material deviations.
Minority Stakes When You Need Diversification with Guardrails
Minority stakes can be the right tool when the value thesis is primarily execution by existing management and the family office’s role is selective support. Examples include:
- Growth with proven operators: A software company has repeatable sales motion and strong retention. You may not need control if you can negotiate information rights, board observer access, and protective provisions around dilution and major contracts.
- Real assets with stable cash flows: A logistics property may generate predictable income. Minority exposure can work if you secure covenants around maintenance capex, leasing strategy, and financing restrictions.
The key is to avoid “minority without teeth.” If you cannot block harmful actions or obtain timely information, minority status becomes passive by default.
Governance Mechanics That Convert Minority into Practical Influence
Minority stakes can approximate control through targeted rights. The most useful are:
- Protective provisions: Consent rights for actions like issuing new shares, taking on senior debt above a threshold, selling core assets, or changing business scope.
- Board structure: Observer rights or a seat on the board when decisions are frequent and technical.
- Information rights: Timely financials, budgets, and management reporting with agreed definitions.
A simple example: you invest as a minority in a consumer brand. The thesis assumes stable working capital and controlled marketing spend. You negotiate consent rights for (1) new debt, (2) material inventory write-down policies, and (3) budget changes beyond a set variance. Now you can prevent the most damaging deviations without running day-to-day operations.
Decision Framework for Choosing the Mix
Use a two-axis framework: governance intensity versus operational involvement.
- High governance intensity, low operational involvement: Prefer minority with strong consent and information rights.
- High governance intensity, high operational involvement: Prefer control with a defined monitoring plan.
- Low governance intensity, low operational involvement: Minority can be efficient with standard protections.
- Low governance intensity, high operational involvement: Control may be unnecessary; focus on advisory roles and reporting.
Mind Map: Control Versus Minority
Example: Two Deals, Two Governance Designs
Deal A: Control. A family office buys 60% of a regional logistics operator. The thesis depends on replacing underperforming routes and renegotiating fleet maintenance. The board seat allows approval of route changes and capex plans, while monthly reporting tracks utilization, maintenance cost per mile, and cash conversion. The family office does not micromanage dispatch; it enforces decisions that affect the thesis.
Deal B: Minority. The family office invests 25% in a niche medical device manufacturer. The thesis depends on regulatory progress and disciplined working capital. The family office negotiates consent rights for new debt, changes to quality systems, and material capex outside the approved budget. It also requires monthly reporting on regulatory milestones and inventory aging. The stake remains minority, but the protections cover the most thesis-threatening actions.
Practical Checklist for the Investment Committee
- What decisions must be controlled to protect the value thesis?
- What decisions can be protected contractually with consent rights?
- What information must arrive on a schedule you can actually use?
- How much operational involvement is realistic for the family office team?
- What are the top three actions that would break the thesis, and what right stops each one?
When these answers are explicit, the control-versus-minority choice stops being a preference and becomes a design.
9.3 Managing Correlation Through Business Model Differences
Correlation is what happens when two holdings “move together” more than you’d like. In direct investing, you can’t rely on market-style diversification alone because private businesses react to different drivers: customer behavior, pricing power, working capital needs, and operational leverage. The practical goal is to build a portfolio where the main risk drivers are not the same across companies, even if they share a sector label.
Start with a simple foundation: correlation is driven by shared sensitivities. If two businesses both depend on the same customer type, the same economic cycle, and the same cost structure, their returns will tend to rhyme. If they differ in business model mechanics—how revenue is earned, how costs scale, and how cash is generated—then their return paths can diverge.
Step 1: Identify the Portfolio’s Shared Risk Drivers
Write down the top 3–5 drivers that would cause each company’s earnings to change. For a subscription software firm, drivers might be churn, net revenue retention, and sales efficiency. For a distributor, drivers might be inventory turns, supplier terms, and demand volatility. For a manufacturer, drivers might be input costs, capacity utilization, and order lead times.
Then group holdings by driver overlap. Two companies can both be “tech,” yet one’s revenue is usage-based and the other’s is contract-based with multi-year renewals. Those differences often reduce correlation because the timing and magnitude of revenue changes differ.
Step 2: Use Business Model Mechanics as Your Correlation Map
Business model mechanics translate into measurable sensitivities:
- Revenue timing: upfront vs monthly vs usage-based vs milestone-based.
- Customer stickiness: switching costs, contract length, and renewal dynamics.
- Cost structure: fixed-heavy vs variable-heavy, and whether costs track revenue.
- Working capital intensity: inventory and receivables vs low-balance models.
- Pricing power: ability to pass through costs without losing volume.
When two holdings share these mechanics, correlation tends to rise. When they differ, correlation often falls.
Step 3: Stress Test with “Driver Mismatch” Scenarios
Instead of running generic market stress, run scenarios that target the drivers you identified. A good test asks: if this driver worsens, does the other company worsen too?
Example scenario set:
- Demand shock: fewer new customers.
- Cost shock: input prices rise.
- Credit tightening: customers delay payments.
- Retention shock: churn increases.
If Company A is subscription with strong retention but Company B is inventory-heavy distribution, a demand shock may hit B harder, while A may slow but not collapse. That mismatch is the diversification you’re looking for.
Mind Map: Correlation Through Business Model Differences
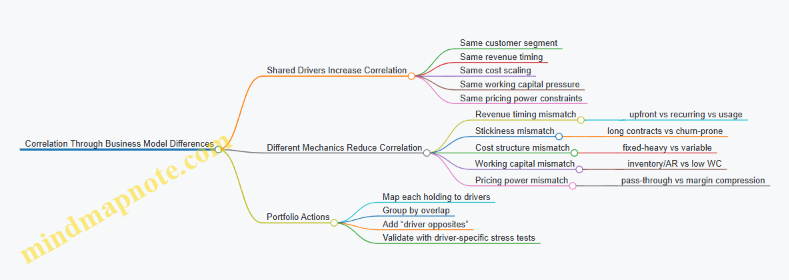
Example: Building a Low-Correlation Pair
Assume you’re considering adding a direct holding to an existing portfolio.
-
Holding 1: A B2B software company with annual contracts and moderate churn.
- Revenue driver: renewal rate and expansion.
- Cost driver: mostly fixed engineering and sales.
- Working capital: low receivables lag.
-
Holding 2: A regional industrial parts distributor.
- Revenue driver: order volume and inventory turns.
- Cost driver: variable purchasing and warehouse labor.
- Working capital: high inventory and receivables.
If the economy slows, both may see revenue pressure, but the timing and cash impact differ. The distributor’s working capital can strain quickly when inventory doesn’t move. The software firm’s cash collection may be steadier due to contract billing. Their earnings paths can diverge, lowering correlation relative to pairing two distributors or two high-churn consumer subscription businesses.
Example: Avoiding Hidden Correlation
Two holdings can look different on paper but still share drivers.
- Holding A: A marketplace that earns take-rate on transactions.
- Holding B: A logistics provider that earns per shipment.
If both depend on the same transaction volume cycle and both have similar cost pass-through, their returns may move together even though one is “marketplace” and the other is “logistics.” The fix is to compare mechanics: is one more sensitive to retention or pricing, while the other is sensitive to utilization and capacity? If both are utilization-driven, you’re not diversifying.
Step 4: Translate into Allocation Rules
Once you’ve mapped driver overlap, convert it into allocation constraints:
- Limit the number of holdings that share the same top 2 drivers.
- Prefer combinations where one holding’s key downside is another holding’s relative strength.
- Require each new deal to demonstrate a driver mismatch versus the current concentration group.
A simple internal checklist works well: “If demand drops, what happens to cash conversion? If costs rise, can margins hold? If customers delay payment, who suffers first?” When the answers differ meaningfully, you’ve likely reduced correlation through business model differences.
Step 5: Keep the Correlation Map Updated
Business models change through pricing updates, contract restructuring, and operational scaling. Revisit the driver map at each major milestone—after a financing, a new product line, or a shift in customer mix—so your correlation assumptions stay grounded in how the companies actually make money.
9.4 Setting Monitoring Cadence and Trigger Events
Direct holdings don’t get “marked to market” every day, so your monitoring system has to do two jobs: (1) detect changes early enough to act, and (2) avoid turning ownership into a full-time sport. The goal is a cadence that matches how fast facts change, plus trigger events that are specific enough to produce decisions, not just meetings.
Monitoring Cadence That Matches Reality
Start with a simple principle: monitor frequently where operational drift happens, and less frequently where outcomes move slowly.
- Monthly operational check for the items that management can influence quickly: revenue run-rate, gross margin, working capital movements, customer churn, backlog, and key expense lines.
- Quarterly investment review for the items that require more judgment: valuation updates, covenant compliance, capital expenditure progress, and whether the original thesis still fits the current business.
- Semiannual deep dive for concentrated risks: customer concentration, supplier dependency, regulatory exposure, and management turnover.
- Annual policy refresh to confirm your monitoring assumptions: valuation method inputs, base-case drivers, and the thresholds that define “material change.”
A practical example: if you own a small industrial services company, monthly review focuses on utilization and collections; quarterly review focuses on margin durability and whether new contracts are replacing churn; semiannual deep dive focuses on safety incidents and customer concentration.
Trigger Events That Convert Facts into Decisions
A trigger event is a condition that requires an action with a defined owner. Triggers should be measurable, time-bound, and mapped to a response.
Use three trigger categories:
- Financial triggers: covenant breaches, liquidity shortfalls, persistent margin compression, or working capital spikes.
- Operational triggers: loss of a major customer, repeated quality failures, key supplier disruption, or material staffing gaps.
- Governance and legal triggers: litigation filings, related-party transactions outside policy, changes in board composition, or adverse audit findings.
Example triggers for a private equity-style minority stake:
- If net revenue declines more than 10% year-over-year for two consecutive quarters, schedule a thesis review and request a corrective plan.
- If DSO increases by 15 days and collections aging worsens for one quarter, escalate to management and tighten credit terms.
- If a top-3 customer represents more than 25% of trailing revenue for two consecutive quarters, require a customer diversification plan and board-level discussion.
Mind Map: Monitoring Cadence and Trigger Events
Designing Triggers with Clear Response Paths
Triggers fail when they don’t specify what happens next. For each trigger, define:
- Measurement: the exact metric and data source.
- Threshold: the number or condition.
- Timing: how long it must persist or how quickly it must be reported.
- Owner: who initiates the response.
- Action: what you ask for or what you do.
A clean example set for a direct loan position:
- Liquidity trigger: if cash falls below 2.0x monthly interest expense for 30 days, the lender group meets within 10 business days to review refinancing options and require a cash plan.
- Covenant trigger: if leverage exceeds the covenant by any amount, require a remediation plan within 15 business days and increase reporting to weekly cash.
- Collateral trigger: if inventory aging worsens materially, request an appraisal update and tighten borrowing base controls.
Reporting Cadence That Keeps Everyone Sane
To prevent monitoring from becoming noise, standardize the “minimum viable packet”:
- Monthly: a one-page dashboard plus a short narrative explaining variances.
- Quarterly: a valuation input sheet, KPI table, and a thesis status note that answers one question: “What changed since we invested?”
- Semiannual: a risk register update with the top three risks and what changed.
A slightly playful rule that works: if a metric doesn’t change management behavior, it probably shouldn’t be in the monthly pack. The point is not to collect data; it’s to collect the right data.
Putting It Together with a Simple Workflow
Use a workflow that turns triggers into scheduled work.
    flowchart TD
A[Monthly KPI Review] --> B{Any Trigger Condition Met?}
B -- No --> C[Continue Standard Cadence]
B -- Yes --> D[Initiate Trigger Response]
D --> E[Define Action Owner]
E --> F[Request Plan or Escalate]
F --> G[Update Reporting Frequency]
G --> H[Next Review Date Set]
H --> A
This structure ensures monitoring is consistent, triggers are actionable, and the family office stays focused on decisions rather than dashboards.
9.5 Using Watchlists and Exit Readiness Plans
A watchlist is a living shortlist of holdings that deserve extra attention because they are either close to a decision point or likely to drift away from the family office’s underwriting assumptions. An exit readiness plan is the checklist of actions you can take before you need them, so a sale process does not turn into a scramble for documents, approvals, and consistent messaging.
Start with two foundational ideas: (1) watchlists are triggered by measurable conditions, not vibes; and (2) exit readiness is staged, so you can scale effort with urgency. For example, a direct minority investment in a software business may not require daily monitoring, but it should have a clear “what changes would make us sell?” threshold and a pre-built data room structure.
Building a Watchlist That Earns Its Keep
Create categories based on why a holding is on the list:
- Value drift: performance indicators move outside the underwriting range.
- Liquidity friction: exit channels become harder (buyers disappear, financing tightens, or governance blocks progress).
- Governance risk: board deadlocks, information delays, or covenant breaches.
- Capital pressure: the business needs funding sooner than expected, changing the risk/return profile.
Assign each category a small set of triggers. Keep triggers specific enough that two analysts would agree whether they are met.
Example: A watchlist trigger for a manufacturing company could be “gross margin falls more than 300 bps for two consecutive quarters” and “working capital turns worsen for three consecutive quarters.” Those are concrete, and they connect directly to valuation drivers.
Operationally, run the watchlist on a cadence:
- Monthly: review only trigger metrics and any covenant or reporting issues.
- Quarterly: update the base case and downside case assumptions.
- Event-based: immediately review when governance, financing, or customer concentration changes.
Designing Exit Readiness Plans with Stages
Treat readiness as a ladder. Stage 0 is “ready enough.” Stage 2 is “sale process can start this month.”
-
Stage 0: Baseline readiness
- Maintain a standardized investment file: term sheet, purchase agreement, side letters, board minutes, and reporting history.
- Track ownership details: cap table, voting rights, transfer restrictions, and any consent requirements.
- Define the current thesis in one page: what you bought, why it works, and what would break it.
-
Stage 1: Enhanced readiness
- Build a data room folder structure with placeholders so documents can be swapped in quickly.
- Pre-draft a short “seller narrative” that matches your underwriting language and avoids contradictions.
- Confirm internal approvals: who signs, who negotiates, and what authority thresholds apply.
-
Stage 2: Active exit readiness
- Prepare a valuation update package with sensitivity ranges and the key assumptions behind them.
- Identify likely buyer types and the specific diligence questions each will ask.
- Run a mock diligence review: test whether the company can produce the needed documents within a set timeline.
Example: If a portfolio company misses a reporting covenant, you might move from Stage 0 to Stage 1 even before you decide to sell. The readiness work prevents the next issue from becoming a process failure.
Mind Map: Watchlists and Exit Readiness
Turning Triggers into Decisions
A watchlist is only useful if it leads to consistent decision pathways. Define three decision outcomes for each trigger set:
- Monitor: thesis still intact; no action beyond scheduled review.
- Investigate: commission a targeted workstream (financial normalization, customer concentration review, governance remediation).
- Prepare to exit: activate Stage 1 or Stage 2 readiness and begin buyer outreach only when approvals and constraints are satisfied.
Example: If a consumer services company’s customer concentration rises, you might start an investigation to determine whether it is temporary churn or a structural shift. If the concentration persists and margin also compresses, you move to “prepare to exit,” because both valuation drivers are moving in the same direction.
Practical Exit Readiness Checklist
Keep the checklist short enough to use under time pressure:
- Ownership and consent map updated
- Latest cap table and option/convertible details
- Board minutes and material contracts index
- Reporting package for the last 8–12 quarters
- Valuation model inputs and assumptions log
- Draft Q&A for common diligence questions
When these items are already assembled, the family office can spend time on the real work: deciding what you believe, what you can prove, and what you are willing to negotiate.
10. Ownership Operations and Value Creation Without Noise
10.1 Defining the Family Office Role After Closing
After a direct deal closes, the family office shifts from “investor” to “owner.” That sounds obvious, but the practical difference is huge: ownership requires repeatable operating habits, not just good judgment at signing. The goal is to define what the family office will do, what it will not do, and how it will measure whether it is helping.
Ownership Scope and Boundaries
Start by writing a one-page ownership scope. It should answer three questions: (1) Which assets are we actively involved in versus passively monitored? (2) What decisions do we influence through governance rights? (3) What tasks do we delegate to management.
A useful rule is to separate “governance” from “operations.” Governance includes board-level decisions, approval of budgets, major hires, capital expenditures above a threshold, and related-party matters. Operations includes day-to-day sales execution, production scheduling, and routine hiring. The family office should own governance and delegate operations unless the deal contract explicitly requires involvement.
Example: A family office buys 40% of a regional logistics operator with board observer rights. The scope states that the office will approve annual capex, review quarterly customer concentration, and sign off on any debt above a set amount. It will not manage dispatch teams or negotiate carrier rates.
Governance Rhythm and Decision Hygiene
Ownership fails when decisions happen ad hoc. Define a governance rhythm: board meeting cadence, pre-read deadlines, and escalation paths. Also define decision hygiene: who drafts proposals, who challenges assumptions, and how conflicts are recorded.
A simple operating cadence works well:
- Monthly: management dashboard review (no board meeting required)
- Quarterly: board meeting with a standard agenda
- Annually: budget approval and strategy review
Example: For a manufacturing investment, management submits a one-page dashboard 10 business days before the quarterly board meeting. The family office uses the same template each quarter, so “surprises” are actually explained changes, not missing context.
Value Creation Through Practical Support
Value creation should be specific enough to execute and narrow enough to avoid micromanagement. Identify a small set of support themes tied to the business model: pricing discipline, working capital management, talent retention, procurement leverage, or customer churn reduction.
The family office should offer support in ways that management can accept without losing authority. That usually means providing analysis, introducing expertise, or helping design incentives—not taking over.
Example: In a software services business, the family office notices cash conversion is weak. Instead of directing sales calls, it helps management implement a collections playbook and revises the reporting to show days sales outstanding by customer cohort.
Mind Map: Ownership Role After Closing
Monitoring Without Turning into Accountants
Monitoring should focus on a small set of KPIs that connect to the investment thesis. The family office should require variance explanations: what changed, why it changed, and what management will do next. If the KPI list is too long, the office becomes a spreadsheet referee.
Choose KPIs that match the deal’s risk drivers. For example, a consumer brand might track gross margin and repeat purchase rate; a B2B distributor might track inventory turns and supplier terms.
Example: After closing on a specialty food distributor, the family office sets KPIs for gross margin, inventory days, and top-10 customer revenue share. In the first quarter report, management shows margin compression due to freight costs and proposes a supplier renegotiation plan with a timeline.
Documentation and Accountability Trail
Ownership requires an audit-friendly record of decisions. Keep board materials, approval memos, and conflict disclosures in a consistent structure. Also record what was decided versus what was merely discussed.
A practical approach is to maintain an “ownership decision log” with fields for date, topic, decision, rationale, and responsible party. Use a consistent date format; for example, entries can be labeled with 2026-02-26 when referencing a board decision.
Example: When approving a capex expansion, the decision log captures the capex amount, the expected payback range, the key assumptions, and the condition that management must provide monthly progress updates.
Putting It Together: A Simple Role Definition Template
Conclude by consolidating the above into a short internal document: ownership scope, governance rhythm, value creation support themes, KPI set, and documentation rules. When the family office can explain its role in five minutes, management can work with it in five days.
10.2 Establishing Operating Metrics and Management Reporting
Operating metrics turn ownership into something you can manage without guessing. The goal is not to track everything; it’s to track the few things that explain performance, reveal problems early, and show whether management is using resources well.
Start with What You Need to Decide
Before choosing metrics, list the decisions the family office will make monthly or quarterly. Typical decisions include whether to fund a growth initiative, whether to replace a key process, whether to tighten credit terms, and whether to approve a capex request. Each decision needs a metric set that answers: Are we on track? What changed? What should we do next?
Example: If the decision is “Should we expand production capacity?”, then metrics must cover throughput, utilization, unit economics, and quality costs. If you only track revenue, you’ll learn about the expansion after the bill arrives.
Build a Metric Hierarchy That Explains Cause and Effect
Use a simple hierarchy so reporting doesn’t become a pile of numbers.
- Outcome metrics: what you ultimately care about (cash flow, gross margin, retention).
- Driver metrics: the levers that move outcomes (conversion rate, churn, yield, pricing discipline).
- Control metrics: operational checks that prevent drift (on-time delivery, defect rate, AR aging).
Example: For a services business, outcome might be operating margin. Drivers could be billable utilization and average rate. Controls could be timesheet compliance and project profitability by client.
Choose Metrics That Are Measurable, Stable, and Actionable
A metric should be measurable with consistent definitions, stable enough to trend, and actionable by management.
- Measurable means you can define it precisely. “Customer satisfaction” is vague; “NPS by segment” is clearer.
- Stable means you don’t change definitions every month. If you must, report both old and new definitions for one cycle.
- Actionable means management can influence it. If a metric depends on factors outside their control, pair it with a metric they can act on.
Example: If currency swings distort revenue, report revenue in both reported currency and constant currency, but keep the driver metrics in local terms so management can respond.
Define Ownership-Friendly Reporting Cadence
A practical cadence prevents both information overload and stale decisions.
- Monthly: operational drivers, cash position, covenant or risk items, and top variances.
- Quarterly: deeper performance review, budget vs. actual, and a structured management narrative.
- Ad hoc: when a trigger event occurs, such as a major customer loss or a covenant breach risk.
Example: A family office may require a monthly “variance pack” that explains the top five drivers behind margin movement, plus a short cash forecast update.
Standardize the Management Narrative
Numbers need context. Require management to answer four questions for each major area:
- What changed since last period?
- Why it changed using operational drivers.
- What we did in response.
- What we will do next and when.
Example: If gross margin drops, management should not stop at “input costs increased.” They should specify which inputs, whether pricing was adjusted, and the timeline for mitigation.
Create a Reporting Pack Template That Scales
A consistent template reduces friction and makes comparisons easier across portfolio companies.
Minimum monthly pack
- Executive summary (one page)
- P&L highlights and margin bridge
- Cash and working capital summary
- KPI dashboard by function
- Top variances with driver explanations
- Risk and compliance checklist
- Action log with owners and due dates
Use Mind Maps to Keep Metrics Coherent
A mind map helps you see whether metrics connect to decisions or float independently.
Mind Map: Operating Metrics and Reporting
Example: KPI Set for a Direct-To-Consumer Business
A direct-to-consumer company might track:
- Outcome: contribution margin and cash conversion cycle.
- Drivers: average order value, repeat purchase rate, and marketing efficiency by channel.
- Controls: inventory sell-through by SKU, return rate, and fulfillment accuracy.
Reporting example: If contribution margin declines, the margin bridge should show whether the cause is lower AOV, higher returns, or higher fulfillment costs. Then management can point to specific operational actions, such as adjusting product mix or improving packaging.
Example: KPI Set for a Manufacturing Business
A manufacturing company might track:
- Outcome: gross margin and free cash flow.
- Drivers: throughput per line, yield, and pricing.
- Controls: defect rate, downtime hours, and maintenance backlog.
Reporting example: If downtime increases, the narrative should include whether it’s planned maintenance slipping, parts availability, or process issues. The action log should assign an owner and a due date for each corrective step.
Close the Loop with Action Logs and Definitions
Metrics without follow-through become decoration. Require an action log that links each material variance to an owner, a target date, and a measurable outcome. Also maintain a definitions sheet so “what we mean by revenue” or “what counts as churn” stays consistent across reporting cycles.
A good management reporting system feels boring in the best way: it makes performance understandable, decisions faster, and surprises rarer.
10.3 Supporting Management With Practical Governance
Practical governance is what turns “we trust you” into “we can verify what you’re doing.” For a family office, the goal is not to run the company; it’s to create enough structure that management can move fast while the owners stay informed and protected.
Foundational Principles That Keep Governance Useful
Start with three rules.
First, governance should be tied to decisions, not meetings. If a topic never changes a decision, it probably doesn’t deserve a recurring agenda item.
Second, information should be proportional to risk. A stable software business with diversified customers needs less operational detail than a single-customer manufacturer with tight working capital.
Third, governance must define who decides. If the board, the CEO, and the investment lead all “weigh in,” decisions slow down and accountability blurs.
A simple way to operationalize this is to map each major company decision to a governance mechanism: board approval, delegated management authority, or information-only reporting.
The Governance Stack from Board to Day-to-Day
Think of governance as a stack.
At the top sits the board charter: reserved matters, voting thresholds, and escalation paths. Reserved matters typically include issuing new equity, taking on material debt, entering major contracts, changing accounting policies, and approving budgets outside agreed ranges.
In the middle sits the operating cadence. This is where governance becomes practical: monthly KPI review, quarterly board pack, and an annual budget and plan cycle.
At the bottom sits delegated authority. Management should have clear limits on spending, hiring, and contracting so they don’t wait for owner approval on routine items.
A useful example: a portfolio company sets a delegated spending limit of $250,000 per project without board approval. If a project exceeds that amount, management prepares a one-page decision memo with cost, timeline, expected impact, and key risks. The board then decides quickly because the memo already answers the questions owners care about.
Practical Board Mechanics That Reduce Friction
Board mechanics should be boring in the best way.
Use a board pack template that management can reuse. A good pack includes: performance summary versus plan, cash position and runway, top risks with mitigation status, and a short list of decisions requested.
Keep board meetings short by separating discussion from decision. For example, the first 20 minutes can be a KPI walkthrough, followed by a decision block where each reserved matter has a clear recommendation and required vote.
Also define escalation triggers. If cash falls below a threshold, if gross margin drops more than a set amount for two consecutive months, or if a key customer contract is at risk, management escalates to the board lead within a defined timeframe.
Information Rights That Management Can Actually Provide
Information rights should be specific, not vague. “Quarterly reporting” is too broad; it invites inconsistent data.
Instead, specify the minimum dataset and the format. For instance:
- Monthly: revenue by segment, gross margin, operating expense totals, headcount, and cash balance.
- Quarterly: updated forecast, covenant compliance status, and a variance explanation for budget deviations.
- Ad hoc: material litigation, major customer loss, or financing needs.
A practical example: if the company uses accrual accounting, require a monthly reconciliation of cash movements to profit and loss. This helps owners understand whether “earnings” are being supported by real cash, without forcing management to produce a new reporting system.
Governance That Supports Value Creation Without Micromanagement
Owners often want to help, but help can become interference. The trick is to support management with decisions and constraints, not with constant direction.
One effective approach is to create a “management support menu” with pre-agreed categories:
- Hiring support for critical roles, where the board approves the search budget and selection process.
- Commercial support, where management leads but the board can approve pricing policy changes above a threshold.
- Operational support, where the board requests a root-cause review only when metrics breach agreed triggers.
Example: a portfolio company’s churn rises for two months. Governance doesn’t immediately demand a new strategy. Instead, management runs a structured root-cause review and returns with three hypotheses, evidence, and a 60-day experiment plan. The board then decides whether to fund the experiments and whether to adjust targets.
Mind Map: Practical Governance Support
A Concrete Governance Workflow Example
Assume the company plans to refinance debt. Management submits a decision memo two weeks before the board meeting: current debt terms, proposed terms, impact on interest expense, covenant effects, and a cash-flow stress case. The board reviews whether the refinancing preserves liquidity and avoids covenant traps. If approved, management executes and reports back with the final terms and any deviations from the memo.
This workflow keeps governance practical: management stays in control of execution, owners get decision clarity, and the company avoids “surprise approvals” that waste time.
Common Failure Modes to Avoid
Avoid governance that is either too thin or too heavy. Too thin means owners learn about problems late. Too heavy means management spends energy producing reports instead of running the business.
Also avoid unclear authority. If management can’t tell what requires board approval, they will either over-escalate or under-escalate—both are expensive.
Finally, avoid reporting without decisions. A board pack should end with either a decision requested, a decision already made, or a clear statement that no decision is needed because the situation is within agreed thresholds.
10.4 Implementing Improvement Plans With Measurable Milestones
A post-close improvement plan should start with what you can measure, not with what you hope will happen. The goal is to convert ownership into operational progress while keeping governance calm and decision-making crisp.
Step 1: Translate the Deal Thesis into Operational Levers
Begin by restating the thesis in plain operational terms. If the thesis is “margin expansion,” specify the lever: pricing discipline, procurement savings, mix shift, or cost-to-serve reduction. If the thesis is “growth,” specify the lever: sales coverage, conversion rate, onboarding speed, or retention.
Example: A family office invests in a B2B services firm. The thesis is improved profitability through better utilization. The operational levers become (a) weekly scheduling accuracy, (b) utilization targets by team, and (c) a standardized quoting process to reduce rework.
Step 2: Define Milestones That Are Small Enough to Win
Milestones should be achievable within the reporting cadence and measurable with existing data. A useful rule: each milestone must have an owner, a metric, a baseline, and a target.
Example milestones for the services firm:
- By week 2: publish a single utilization dashboard with definitions agreed by finance and delivery.
- By week 6: achieve 80% schedule adherence for two pilot teams.
- By week 10: reduce quoting rework by 20% using a checklist and approval workflow.
If a milestone takes longer than one quarter, split it. Long milestones hide problems until it is too late to fix them.
Step 3: Set Baselines and Measurement Rules
Measurement fails when definitions drift. Write down how the metric is calculated and who has authority to change it. Baselines should come from the most recent complete period.
Example: Utilization baseline is “billable hours / available hours,” where available hours exclude PTO and training. The owner confirms the definition with HR and finance. Any change requires a documented adjustment.
Step 4: Build a Milestone Map from Inputs to Outcomes
A milestone map connects actions to results. Outcomes are what you care about; inputs are what you can control.
Step 5: Assign Owners and Decision Rights
Every milestone needs an owner who can act, not just report. If the operating CEO cannot influence a lever, the plan will stall. Define what the family office can decide versus what management decides.
Example: Management owns quoting workflow adoption. The family office approves any change that affects compensation design or requires new vendor contracts. This prevents “helpful” interference that slows execution.
Step 6: Use a Simple Cadence That Creates Momentum
A workable cadence is weekly operational review for active milestones and monthly governance review for decisions and trade-offs. Keep the agenda consistent: progress versus baseline, blockers, and next actions.
Example agenda for the monthly review:
- Metrics: three key numbers versus baseline
- Milestones: on track, at risk, off track
- Decisions needed: list and owner
- Resource constraints: staffing, systems, or cash
Step 7: Plan for Exceptions Without Losing Control
Not every milestone will land on the target date. The plan should specify what “at risk” means and what happens next.
Example: If schedule adherence stays below 70% by week 6, the plan triggers a corrective action: revise scheduling rules, add a coordinator, and run an additional pilot team. The trigger is metric-based, not opinion-based.
Step 8: Document the Plan as a Living Operating Document
A good improvement plan is not a one-time memo. It is a controlled document with versioning. Each milestone update should include what changed, why it changed, and whether the metric definition stayed consistent.

Step 9: Tie Milestones to Reporting That Stakeholders Can Trust
Reporting should show both progress and measurement integrity. Include a short “data confidence” note when systems are new or definitions were recently standardized.
Example: For the first dashboard release, reporting includes a note: “Data confidence: medium due to manual reconciliation for two data sources.” That honesty reduces friction and prevents false certainty.
Step 10: Close the Loop with a Post-Milestone Review
When a milestone completes, do a brief review: what worked, what broke, and what to standardize. This prevents repeating the same lesson in the next quarter.
Example: The quoting checklist reduces rework, but only when sales managers enforce it during deal review. The standardized rule becomes “no quote submitted without checklist completion,” and the milestone becomes a process policy.
A measurable improvement plan turns ownership into a sequence of verifiable steps. When milestones are defined tightly, owned clearly, and reviewed consistently, the organization gets better without needing constant supervision. That is the quiet logic: progress you can see, decisions you can justify, and outcomes you can explain.
10.5 Handling Conflicts of Interest and Related Party Boundaries
Conflicts of interest in a family office direct investing setup usually show up in three places: who gets access to deals, who sets terms, and who benefits from side arrangements. The goal is not to eliminate every tension—impossible—but to make decisions traceable, fair, and boring in the best way.
Foundational Principles for Clean Decision-Making
Start with a simple rule: the investment decision must be made on the same basis whether or not a family member, affiliate, or existing portfolio company is involved. That means you separate (1) information access, (2) negotiation authority, and (3) final approval.
A practical baseline policy includes:
- Disclosure: any relationship that could reasonably influence judgment gets reported.
- Independence: the person with the conflict does not vote on the transaction.
- Comparable terms: pricing and contract terms are benchmarked to what an unrelated party would receive.
- Documentation: the file shows the disclosure, the recusal, the benchmark, and the approval trail.
Example: A family member’s spouse runs a small advisory firm that introduces a target company. The firm may still be hired, but only after disclosure, independent review of scope and fees, and confirmation that the fee is consistent with market ranges for similar work.
Defining Related Parties and “Could Influence” Scenarios
Related parties are broader than “family members.” Include entities where influence is plausible: controlled companies, common directors, key employees, and affiliates that share management or decision-making.
Use a “could influence” test rather than a “did influence” test. If the relationship could affect access, pricing, or reporting, treat it as a conflict.
Common scenarios to cover in writing:
- Deal sourcing: introductions from affiliates or portfolio CEOs.
- Service provision: legal, accounting, brokerage, or management services from related entities.
- Co-investment: allocations that benefit one side of a relationship.
- Information flow: non-public information shared with someone who can affect negotiations.
Governance Mechanics That Prevent Quiet Favoritism
Conflicts should trigger specific mechanics, not vague “we’ll be careful.”
- Disclosure intake: a standardized form submitted before term discussions.
- Recusal rules: conflicted individuals step out of investment committee deliberations.
- Independent review: a designated independent reviewer validates benchmarks and terms.
- Approval thresholds: higher-risk conflicts require additional committee members or a second approval.
- Ongoing monitoring: if the relationship changes mid-deal, update the disclosure.
Example: The office considers buying a minority stake in a company where a family trustee sits on the board. The trustee discloses the role, does not participate in valuation discussion, and the committee uses third-party valuation support plus comparable deal references from unrelated transactions.
Pricing, Fees, and Contract Terms with Comparable Logic
Related party arrangements often fail not because of intent, but because the office forgets to compare. Build a “comparable logic” checklist:
- Fees: compare to recent invoices for similar scope or to standard rate cards.
- Equity terms: compare to the same round’s terms for unrelated investors.
- Debt terms: compare to market spreads and covenants for similar credit quality.
- Reporting: ensure information rights are not weaker just because the counterparty is related.
Example: A related entity offers to manage a portfolio company’s operations. The office requires a scope statement, a deliverables list, and a fee benchmark to independent management contracts. If the related entity proposes a higher fee, the office must show why the premium is justified by measurable performance obligations.
Mind Map: Conflict Handling Workflow
Example: A Full Transaction File Trail
Consider a direct investment where a related entity proposes to provide interim CFO services during diligence.
- Disclosure: the office records the relationship and the proposed scope.
- Recusal: the conflicted individual does not attend the diligence budget discussion.
- Independent review: another committee member confirms the scope is necessary and not a disguised fee.
- Comparable terms: the office compares the proposed hourly rate to prior independent engagements.
- Contracting: the agreement includes clear deliverables, termination rights, and reporting obligations.
- Approval: the investment committee approves the service contract separately from the investment decision, using the same documentation standards.
Practical Boundaries for Information and Negotiation
Two boundaries keep things clean:
- Information boundary: confidential deal information should not be shared with conflicted parties beyond what is necessary to perform a disclosed role.
- Negotiation boundary: conflicted parties should not set pricing, approve themselves, or control the selection of benchmarks.
Example: If a related party is advising on diligence, they can provide analysis, but the office selects the valuation approach and the benchmark sources. The advisor can comment, but cannot decide.
Closing the Loop with Recurring Checks
Conflicts management is not a one-time form. Run a periodic review of related party registers, service provider lists, and portfolio governance roles. The office should be able to answer, quickly and consistently, who was conflicted, what was disclosed, what was compared, and who approved.
11. Monitoring, Valuation Updates, and Reporting to Stakeholders
11.1 Setting Valuation Policies for Private Positions
A private position’s valuation policy is the rulebook that turns “we think it’s worth about X” into a repeatable process. The goal is not to produce a single perfect number; it’s to produce a defensible number that stays consistent across time, deals, and people.
Start with the Purpose and Scope
Define what the policy is for: internal performance tracking, investment committee decisions, balance sheet reporting, or both. Then specify the scope: equity, preferred equity, private credit, warrants, and any structured instruments. A policy that mixes instruments without separating methods will eventually mix assumptions too.
Example: If the family office holds both common equity and a secured note, the valuation policy should treat them as different “asset classes” with different drivers, even if they sit in the same portfolio bucket.
Choose a Valuation Hierarchy
Set a hierarchy that determines how valuations are produced when information is abundant versus scarce. A practical hierarchy often looks like this:
- Observable inputs from recent transactions or market quotes.
- Comparable transactions adjusted for size, timing, and terms.
- Model-based valuation using cash flows, discount rates, and scenario ranges.
- Cost or liquidation value when cash flows are not reliable and the instrument is closer to a balance-sheet claim.
The policy should state when you can move down the hierarchy. For instance, if no comparable transactions exist for a quarter, you may shift from comparable multiples to model-based valuation, but only if the model inputs are documented and reviewed.
Define Measurement Dates and Update Cadence
Pick measurement dates that match your reporting rhythm. Many offices use quarter-end measurement dates, with interim updates only when a trigger occurs. Triggers should be explicit: a new financing round, a major customer loss, a covenant breach, a material contract change, or a board-approved budget that changes cash flow materially.
Example: If a portfolio company raises a priced round, you typically update valuation using that pricing as the primary reference, then reconcile differences between the round’s implied value and your prior model.
Establish the Inputs You Will Actually Use
Valuation policies fail when they list inputs but not how to obtain them or how to adjust them.
For model-based equity valuations, specify:
- Revenue and margin normalization rules.
- Treatment of one-time items.
- Capital expenditure assumptions.
- Working capital assumptions.
- Discount rate construction and what you will not do (for example, no “gut feel” risk premium changes).
For private credit valuations, specify:
- Interest accrual and payment status.
- Expected loss approach.
- Recovery assumptions tied to collateral or seniority.
- How you treat amendments and restructurings.
Example: If management reports EBITDA that includes unusual legal settlements, the policy should state whether those are added back, excluded, or normalized over a defined period.
Set Governance and Review Responsibilities
Assign roles: who prepares valuations, who reviews them, and who approves changes that materially affect reported value. Require a valuation memo for each material change, including the method used, key inputs, and reconciliation to prior valuation.
A useful rule: if the valuation changes by more than a defined threshold (for example, 10% of carrying value), it must include a “why it moved” section that ties the change to specific events or input updates.
Document Method Selection and Reconciliation
The policy should include a decision logic for choosing the method each period. Then require reconciliation between methods when multiple references exist.
Example: Suppose you have a recent comparable transaction and also a cash-flow model. The policy can require you to compute both, then explain whether the model is consistent with the transaction and, if not, which input is driving the difference.
Use Ranges Carefully and Convert Them to Numbers
Many models produce ranges. The policy should define how you convert a range to a single carrying value. One approach is to use the midpoint only when assumptions are stable; otherwise, use a weighted approach based on evidence quality.
Evidence quality can be operationalized: audited financials score higher than management-only projections; third-party confirmations score higher than internal estimates.
Mind Map: Valuation Policy Components
Example: A Quarterly Valuation Workflow
- Collect inputs: latest financials, cap table changes, debt status, and any priced financing.
- Select method: if a priced round occurred since last quarter, use it as primary; otherwise use comparable or model.
- Normalize: apply the policy’s normalization rules to earnings and cash flow.
- Reconcile: compare the new method output to the prior carrying value and identify drivers.
- Review and approve: require a memo if the change exceeds the threshold.
- Record audit trail: store model versions, assumptions, and source documents.
This workflow keeps the policy practical. It also makes valuations easier to explain to stakeholders who want clarity, not mystery.
11.2 Using Comparable Updates and Internal Performance Indicators
Comparable updates and internal performance indicators work best together: comparables tell you what the market is doing, while internal indicators tell you what your ownership is doing. The trick is to update both on a consistent cadence and to document why the numbers moved.
Comparable Updates: What You Measure and How You Update It
Comparable updates start with a defined peer set. A peer set is not “similar companies,” it is a list you can explain: same business model, similar customer profile, comparable geography, and a similar stage of maturity. For each peer, you track a small set of observable inputs that map to your valuation method.
A practical approach is to update comparables in three layers:
- Market multiples: EV/EBITDA, EV/Revenue, or price-to-book depending on the business type.
- Credit and liquidity inputs: spreads or discount-rate proxies when you use DCF or credit-sensitive models.
- Transaction evidence: recent deals in the same niche, used as a sanity check rather than a direct replacement for your model.
Example: Suppose your direct holding is a regional software business valued using EV/Revenue. In the last quarter, public comps show EV/Revenue compressing by 10%. You update your multiple, but you also check whether your company’s revenue quality improved (for example, higher retention or better gross margin). If your internal indicators show improvement, you may apply only part of the market compression to your valuation.
Internal Performance Indicators: Make Them Ownership-Relevant
Internal indicators should answer three questions: Are we still winning? Are we still spending wisely? Are we still on the same path? If an indicator cannot be tied to decisions you can influence, it is probably noise.
A clean indicator set usually includes:
- Operating drivers: revenue growth, gross margin, churn, utilization, or unit economics.
- Cash drivers: operating cash flow, working capital movements, and capex discipline.
- Execution drivers: pipeline conversion, backlog quality, on-time delivery, or service-level metrics.
- Governance drivers: covenant compliance, budget adherence, and management turnover or key-person risk.
Example: A manufacturing investment valued partly on normalized EBITDA shows stable revenue, but internal indicators reveal rising warranty costs and slower inventory turns. Even if comps look unchanged, your valuation update should reflect the margin pressure because it is already showing up in the operating system.
The Bridge: Mapping Indicators to Valuation
Comparable updates and internal indicators must connect to valuation mechanics. Create a simple mapping so that every valuation change has a reason.
Use a “driver table” with three columns:
- Valuation driver (for example, growth rate, margin, discount rate, reinvestment needs)
- Internal indicator(s) that support it
- Comparable input(s) that constrain it
Example: If your valuation driver is margin, internal indicators might be gross margin and cost-to-serve. Comparable inputs might be the current median gross margin for peers. If internal margins are improving faster than peers, you can justify a higher margin assumption than the market median, but you should still show how far you are willing to deviate.
Mind Map: Comparable Updates and Internal Indicators
A Systematic Update Workflow
- Lock the peer set for the quarter and record any changes in composition.
- Update comparables and compute the direction and magnitude of movement for each relevant multiple or input.
- Update internal indicators using the same definitions each period, with variance notes for anything outside normal ranges.
- Reconcile: attribute valuation movement to either market inputs, internal performance, or both.
- Write a change log that states the valuation driver affected, the evidence used, and the decision rule applied.
Example: If your valuation decreased, the change log should say whether it was because comps moved, because internal indicators deteriorated, or because both happened. If you cannot attribute the movement, the valuation update is not yet decision-ready.
Common Failure Modes and How to Avoid Them
- Peer set drift: if you keep swapping peers, you lose comparability. Fix the peer set and add new names only with a documented rationale.
- Indicator overload: too many metrics makes it hard to explain valuation changes. Keep a small set that maps to valuation drivers.
- Unmapped changes: if internal indicators change but your valuation model does not reflect them, you will end up with “explained later” updates that never get explained.
When comparable updates and internal indicators are connected through a driver table and a change log, valuation updates become less about opinion and more about traceable reasoning. That is the quiet logic: the numbers move for reasons you can point to, not because you felt like moving them.
11.3 Preparing Quarterly and Annual Investment Reports
A good investment report does three jobs at once: it tells the family what happened, it explains why it happened in plain language, and it leaves an audit trail for decisions made under uncertainty. The trick is to separate facts, interpretations, and actions so readers can move quickly without getting lost.
Quarterly Report Structure
Start with a one-page executive summary, then expand into holdings, risks, and governance. Keep the same order every quarter so the reader’s brain doesn’t have to relearn the layout.
1) Executive Summary
- Portfolio snapshot: total value, invested capital, and cash available for new deals.
- Performance summary: realized results, unrealized changes, and income received.
- Concentration highlights: top positions by value and any breaches of internal limits.
- Decisions made: approvals, amendments, waivers, and any exceptions granted.
Example: If a private company’s valuation drops this quarter, the summary should state whether the change is driven by updated financials, a revised multiple, or a new risk identified in diligence.
2) Holdings Section For each direct holding, use a consistent template:
- Ownership and capital: stake %, cost basis, remaining commitment, and any new funding.
- Operating update: 3–6 key metrics tied to the business model.
- Financial update: revenue, gross margin, EBITDA or equivalent, and cash burn or cash generation.
- Valuation update: method used, inputs changed, and the resulting valuation delta.
- Covenant and governance: compliance status, board actions, and information received.
- Action items: what the office is doing next and what management must deliver.
Example: If the company missed a milestone, the report should specify whether the miss affects valuation assumptions or only triggers a governance response.
3) Risk and Liquidity Section
- Risk register changes: new risks, mitigations completed, and risks that worsened.
- Liquidity ladder: cash on hand, expected near-term inflows, and funding obligations.
- Concentration and correlation notes: what changed in the portfolio’s risk profile.
Example: If two holdings rely on the same customer segment, the report should note whether customer concentration worsened in both, not just one.
4) Governance and Compliance Section
- Investment committee actions and voting outcomes.
- Legal and reporting items: consent requests, amendments, and any overdue deliverables.
- Conflicts of interest: related-party transactions reviewed and how they were handled.
Example: If a board seat required a vote on a related-party contract, the report should state the decision, the rationale, and the documentation retained.
Annual Report Structure
The annual report is where you consolidate learning and tighten the system. It should be longer than the quarterly report, but not a different document. Use the quarterly template for holdings, then add deeper sections.
1) Year Summary
- Total realized and unrealized outcomes.
- Income breakdown: dividends, interest, distributions, and fees received.
- Capital activity: new investments, follow-ons, exits, and write-downs.
2) Valuation Policy Confirmation
- Re-state the valuation approach by asset type.
- List valuation changes in methodology, not just valuation numbers.
- Document any external inputs used and how they were validated.
Example: If you moved from a single multiple to a range with scenario weighting, the annual report should explain the trigger and show the range used.
3) Portfolio Review and Monitoring Effectiveness
- Monitoring cadence: whether reporting from each company met the agreed schedule.
- Trigger events: what was triggered, what was done, and whether it worked.
- Management quality signals: not personality judgments, but measurable behaviors like reporting accuracy and responsiveness.
Example: If a company repeatedly delayed monthly reporting, the report should show the resulting governance steps and whether reporting improved.
4) Post-Mortem Summaries For any exit or major write-down, include a short “what we expected vs. what happened” section.
Example: For a write-down, separate the drivers: operational underperformance, market multiple compression, or deal-structure friction like delayed distributions.
Mind Map: Report Components and Flow
Example: One Holding Page Layout
Use a single page per holding for quarterly reporting, then expand in the annual report.
- Company: Northbridge Components (example)
- Ownership: 18% equity; cost basis $6.4M; remaining commitment $0.8M
- Quarter Highlights: revenue up 6%; gross margin stable; cash burn reduced
- Valuation Change: -3.2% to $7.1M
- Driver A: updated trailing twelve-month EBITDA
- Driver B: revised discount rate assumption due to customer concentration
- Governance: board met; information rights delivered on time
- Next Actions: office to review revised customer contract terms; management to deliver updated 12-month cash forecast by 2026-02-15
Practical Consistency Checks
Before sending, verify three things: every valuation number has a stated method and changed inputs; every risk statement links to a mitigation or monitoring action; and every committee decision is traceable to a document or memo stored in the deal file. If those checks pass, the report becomes both readable and defensible—an uncommon but useful combination.
11.4 Communicating Risk, Liquidity, and Concentration Clearly
Clear communication is not a “nice-to-have” for direct investing; it’s how the family office keeps decisions consistent when facts change. The goal is simple: stakeholders should understand (1) what could go wrong, (2) how quickly money could be needed, and (3) where the portfolio is quietly concentrated.
Start with a Shared Vocabulary
Before numbers, align on definitions. Use the same words across the investment committee, family office staff, and any external advisors.
- Risk: the chance that outcomes differ from the base case, plus the impact if they do.
- Liquidity: the time and certainty required to convert an investment into cash without unacceptable loss.
- Concentration: the portfolio’s exposure to a small set of counterparties, sectors, geographies, or business models.
A practical habit: include a one-paragraph “What This Report Means” section at the top of every quarterly update. Keep it short enough to read before coffee.
Build a Three-Layer Status View
Stakeholders need both a quick scan and a path to detail.
-
Layer One: One-Page Summary
- Overall risk posture (e.g., stable, watchlist, action required)
- Liquidity position (cash buffer vs. expected needs)
- Concentration highlights (top exposures by value and by risk driver)
-
Layer Two: Position-Level Dashboard For each direct holding, show:
- Current value and cost basis
- Key risk drivers (two to four bullets)
- Liquidity notes (exit path, time-to-cash range, gating constraints)
- Concentration tags (sector, geography, customer concentration, leverage level)
-
Layer Three: Evidence and Assumptions
- What changed since last report
- Which assumptions were updated and why
- Any covenant or governance milestones
Explain Liquidity with a Cash-Flow Timeline
Liquidity communication fails when it’s only about “marketability.” Instead, show how cash actually moves.
Create a simple timeline that covers the next 12–18 months:
- Known cash outflows: taxes, planned commitments, operating expenses
- Potential outflows: capital calls, legal settlements, working-capital needs
- Sources of cash: dividends, interest, distributions, revolver capacity, sale candidates
Example: If a portfolio includes a private credit position with quarterly interest but a long redemption notice, the report should say that “cash inflows are steady, but cash outflows for redemption are not immediate.” That distinction prevents misunderstandings during committee discussions.
Make Concentration Concrete with Drivers, Not Just Percentages
Percent of portfolio is useful, but it doesn’t explain why the risk is shared. Concentration should be mapped to drivers.
Use a two-axis approach:
- Exposure size: largest positions by value
- Exposure driver: what links them (customer type, commodity input, regulatory regime, leverage sensitivity)
Example: Two holdings may each be 8% of the portfolio, but if both rely on the same customer segment and both face similar refinancing risk, they behave like a single concentrated bet. Tagging the driver makes that visible.
Use a Risk Register That Updates with Events
A risk register is only helpful if it changes when reality changes. Track each material risk with:
- Trigger: what observation would indicate the risk is increasing
- Owner: who monitors it
- Mitigation: what actions are available
- Status: improving, stable, worsening
Example triggers:
- Revenue churn above a defined threshold
- A covenant headroom drop below a set buffer
- Loss of a key supplier or customer
Mind Map: What to Communicate and How
Example: A Quarterly Update Snippet
For a watchlist position, the report might read:
- Risk: “Operating margin pressure persists; the base case assumes partial cost recovery.”
- Trigger: “If gross margin remains below X for two consecutive quarters, we will request updated forecasts and consider governance actions.”
- Liquidity: “No near-term exit expected; time-to-cash depends on buyer interest and diligence readiness.”
- Concentration: “Exposure overlaps with the same customer segment as Holding B; both are tagged under customer concentration risk.”
This format communicates actionability, not just concern.
Keep the Tone Neutral and the Numbers Auditable
Use consistent units, avoid mixing “estimated” and “final” without labels, and show what changed. If a valuation method shifts, state the reason and the direction of impact. Stakeholders trust reports that make it easy to verify the logic, even when the outcome is uncomfortable.
11.5 Maintaining Compliance Documentation and Recordkeeping
Compliance documentation and recordkeeping are how a family office proves it did what it said it would do. For direct investing, the “proof” is not a single binder; it’s a chain of decisions, approvals, and evidence that can be traced from the investment policy to the executed contract.
Foundational Principles for Recordkeeping
Start with three rules.
-
Traceability: every material decision should link to a document trail. Example: an investment committee approves a $10 million equity purchase; the record should show the memo version, the meeting minutes, the approval vote, and the signed subscription or SPA.
-
Consistency: the documents should reflect the actual process. Example: if the policy requires independent legal review, the file should contain the legal memo or marked-up draft showing review occurred.
-
Proportionality: more complexity earns more documentation. Example: a small minority stake in a mature business might require fewer workstreams than a control deal with financing covenants and multiple side letters.
A practical way to operationalize this is to define a “minimum viable file” for each deal stage: screening, diligence, approval, closing, and post-closing monitoring.
The Minimum Viable Deal File
Use a standardized folder structure so records are predictable.
- Mandate and Constraints: the relevant policy excerpt, concentration limits, and any waivers.
- Deal Summary: teaser, management presentation, and the first-pass memo.
- Diligence Evidence: key reports, Q&A logs, and normalization notes.
- Valuation and Underwriting: model version, assumptions sheet, and sensitivity outputs.
- Approval Record: committee memo, agenda, attendance, vote, and conditions.
- Transaction Documents: executed agreements, side letters, subscription documents, and cap table evidence.
- Funding and Settlement: wire confirmations, capital call notices, and payment approvals.
- Ongoing Monitoring: quarterly updates, covenant trackers, and valuation policy outputs.
Example: if a deal required a consent right for additional debt, the file should include the consent clause and later evidence that consent was obtained before any debt issuance.
Version Control and Document Integrity
Most recordkeeping failures come from “which version is the real one?” Fix that with version control.
- Store the final approved memo and the working drafts separately.
- Record the date created and date approved for each key document.
- Maintain an assumption log for valuation models so changes are explainable.
A simple example: the underwriting model is updated after diligence reveals a customer concentration issue. The file should show the change request, the revised assumption, and the updated memo or addendum that the committee reviewed.
Governance Documentation That Actually Matches Decisions
Governance records should show not only that meetings happened, but that decisions were made with the right inputs.
- Investment Committee Minutes: include the decision, vote, and any conditions.
- Conflict Checks: document how conflicts were identified and how recusals were handled.
- Delegation Logs: if authority is delegated for certain approvals, record the delegation and the specific actions taken.
Example: if a family member is related to a seller, the file should show the conflict disclosure, the recusal, and the independent review steps used to reach a fair outcome.
Compliance Controls for Ongoing Monitoring
Recordkeeping doesn’t stop at closing. Monitoring evidence should support compliance with reporting and contractual obligations.
- Covenant and Consent Tracker: a dated log of covenant tests and consent events.
- Valuation Update Records: how valuations were updated and what inputs were used.
- Reporting to Stakeholders: copies of quarterly and annual reports, plus the approval or sign-off.
Example: if the office must report material changes to investors, keep the exact report version and the approval trail.
Mind Map: Recordkeeping Architecture
Example Workflow from Screening to Monitoring
On 2024-02-15, a deal enters screening. The office creates a deal folder, stores the mandate excerpt, and logs the first memo draft. On 2024-02-28, diligence begins; the office stores Q&A notes and legal review comments as they arrive. On 2024-03-05, the committee approves with conditions; minutes record the vote and conditions. At closing, executed documents and wire confirmations are added. After closing, quarterly updates and covenant tracker entries are appended, each with a date and the responsible reviewer.
This workflow is boring in the best way: it makes the file complete, consistent, and easy to audit without heroic searching.
12. Exits, Realizations, and Post Mortem Learning
12.1 Identifying Exit Paths and Timing Constraints
A family office exits direct deals for a simple reason: capital must be redeployed to meet the mandate, not because a spreadsheet says it is time. The hard part is that private ownership rarely offers a clean “sell on demand” button. Exit paths and timing constraints should be mapped early, then revisited as facts change.
Start with What You Can Control
Begin by listing the levers that shape exit feasibility:
- Ownership position: Majority control often enables a sale process; minority stakes may require consent or rely on the sponsor’s timeline.
- Contractual rights: Drag-along, tag-along, ROFR/ROFO, consent thresholds, and information covenants can either accelerate or block an exit.
- Capital structure: Debt covenants, intercreditor terms, and preferred liquidation preferences affect who gets paid first and whether a sale is even attractive.
- Operational readiness: Buyers pay for stability. If reporting is weak or key metrics are inconsistent, the “best” exit path becomes harder.
Example: A family office holds 30% of a software company with no tag-along rights. The majority owner wants to sell to a strategic buyer. Without tag rights, the family office may receive only what the majority decides, so the exit plan must include negotiation leverage before the sale process starts.
Inventory Exit Paths by Buyer Type
Private deals usually exit through a small set of buyer categories. Treat each as a different product with different requirements.
- Strategic sale: Another company buys for synergies. They care about customer retention, integration cost, and IP cleanliness.
- Financial sponsor sale: A buyer with its own underwriting focuses on cash flow durability and exitability.
- Secondary recapitalization: Existing owners sell part of their stake or refinance. This can create liquidity without a full change of control.
- Management-led buyout: The team buys, often using leverage. They care about financing availability and clear governance.
- IPO or public listing: Rare for many direct deals, but when it is possible, it requires governance, reporting, and scale.
A practical best practice is to score each path against your constraints: rights, likely buyer interest, and the time needed to reach buyer-ready conditions.
Timing Constraints That Actually Matter
Timing constraints fall into three buckets: legal, operational, and market.
- Legal constraints: Lockups, transfer restrictions, consent requirements, and regulatory approvals. These are often deterministic. If the contract says consent is needed from a class of preferred holders, assume you will need it.
- Operational constraints: The company may need a track record of normalized earnings, audited statements, or improved working capital discipline. Buyers often request a “clean story” that takes time to produce.
- Market constraints: Even when buyers exist, they may require a certain valuation band or financing terms. For direct investing, the key is not predicting markets; it is understanding how your deal’s economics respond to different buyer financing costs.
Example: A manufacturing business has seasonal cash swings. A sale process launched in the low-cash quarter triggers buyer concern about liquidity. The timing constraint is operational, not market sentiment, and the fix is to align the process with a period that reflects normalized working capital.
Build a Decision Map from Rights to Readiness
Use a mind map to connect exit paths to the prerequisites you must satisfy.
Mind Map: Exit Paths and Timing Constraints
Convert the Map into an Exit Readiness Checklist
Turn the mind map into a checklist that can be used in investment committee updates.
- Rights check: Confirm transfer restrictions, consent requirements, and any ROFR/ROFO triggers.
- Information check: Ensure you can produce audited or consistently prepared financials, cap table documentation, and a coherent KPI pack.
- Economic check: Validate that the company’s cash generation can support the expected buyer financing structure.
- Process check: Identify who runs the process—management, the sponsor, or the family office—and whether you have the authority to influence timing.
Example: In a recapitalization, the family office may not control the sale process, but it can require a standardized reporting package and a clear KPI definition before any buyer outreach. That reduces friction later and shortens the time between “interest” and “signed deal.”
Use a Simple Timing Framework
When you revisit the exit plan, avoid vague language like “soon.” Instead, define timing in ranges tied to constraints:
- Minimum time: The earliest date you can realistically satisfy legal and operational prerequisites.
- Target window: When readiness and buyer engagement are most likely to align.
- Maximum time: When the deal’s economics or governance situation becomes harder to sell.
If you need a concrete anchor for internal planning, use a reference date such as 2026-02-15 for the “minimum time” review, then document what must be true by then.
The goal is not to force a sale. It is to ensure that when an opportunity appears, you can move quickly without violating rights, misrepresenting facts, or scrambling for information.
12.2 Preparing for Sale Processes and Data Rooms
A sale process is mostly logistics plus proof. Your job is to make it easy for buyers to verify what you claim, and hard for them to invent questions you can’t answer. Start by deciding what “sale” means in your context: a full company sale, a partial recap, a sale of assets, or a secondary transfer. Each choice changes what goes into the data room and how you sequence the first buyer conversations.
Foundational Steps Before You Touch the Data Room
-
Lock the story you will defend. Write a one-page “business facts” sheet: revenue drivers, customer concentration, margin structure, key contracts, capex needs, and the top three risks you already know about. This prevents the common failure mode where the data room contains everything except the buyer’s first questions.
-
Choose a process shape. Buyers move at different speeds depending on whether you run a single-buyer diligence, a managed auction, or a staged process (first pass, then deep diligence). For a staged process, you can start with a lighter room and expand after you narrow the field.
-
Create a diligence owner map. Assign one internal owner per workstream: finance, legal, operations, tax, HR, and IT/security. Each owner knows what they can provide within a week and what requires more time. If you don’t do this, the data room becomes a scavenger hunt.
Data Room Design That Matches Buyer Questions
A good data room is organized by buyer workflow, not by your internal org chart. Use a consistent naming convention and include a short index at the top of each folder.
Core folders that almost always matter:
- Corporate and governance: charter documents, cap tables, shareholder agreements, board minutes.
- Financials: audited statements, management accounts, budgets, tax filings, debt schedules.
- Commercial: customer and supplier lists, top contracts, pricing terms, churn/retention summaries.
- Legal: material litigation, regulatory matters, IP assignments, leases.
- Operations: key processes, capex plans, vendor agreements, quality or compliance documentation.
- HR: org chart, compensation philosophy, employment agreements, benefits plans.
- Technology and security: system overview, data flows, security policies, incident history.
Practical example: If your revenue is concentrated in five customers, create a “Customer Deep Dives” folder with a one-page summary per customer plus the relevant contract and any amendments. Buyers hate hunting for the same information across ten spreadsheets.
Document Readiness and Quality Control
Before uploading, run a “buyer friction test.” Pick five likely diligence questions and verify you can answer each with a specific document link.
- Version control: Ensure the latest contract versions are clearly labeled. If there are side letters, include them next to the main agreement.
- Completeness: For financials, include the reconciliation between management accounts and any audited numbers.
- Consistency: Check that customer names match across commercial, finance, and legal folders. Small mismatches create big delays.
Witty but useful rule: If a document is important enough to be asked about, it’s important enough to be readable without detective work.
Managing the Q&A Loop Without Losing Control
Most diligence delays come from slow responses, not missing documents. Set a response cadence and a single intake channel for questions.
- Question intake: Use a shared tracker with fields for question, owner, due date, and status.
- Response format: Provide either (a) a document link, (b) a short written answer with supporting numbers, or (c) both.
- Escalation path: If an owner can’t respond within the agreed window, escalate with a partial answer and a timeline for completion.
Example: A buyer asks whether a contract has an auto-renewal clause. The finance owner can point to the contract section, while legal confirms the clause interpretation. The tracker records both the link and the interpretation, so the buyer doesn’t ask again.
Staged Data Rooms for Efficient Processes
For a staged process, use three layers:
- Light room for first pass: corporate basics, high-level financials, top contracts, and a short risk summary.
- Deep room for shortlisted buyers: full financial history, detailed customer and supplier documentation, HR details, and operational evidence.
- Final room for preferred bidder: items that require time to compile, such as full tax schedules, detailed capex justifications, and security documentation.
This approach reduces internal workload and keeps early diligence focused on fit.
Mind Map: Data Room and Sale Process Workflow
Closing the Loop Before Signing
When diligence is complete, reconcile what was asked with what was answered. If a question was answered verbally, document it in a short written memo and file it in the room. This prevents later confusion and keeps the final negotiation grounded in the same record everyone saw during diligence.
Finally, ensure the data room remains consistent with the transaction documents. If the sale agreement references a contract or schedule, the corresponding document should be present, correctly labeled, and aligned with the version used in the deal paperwork.
12.3 Negotiating Terms in Secondary Transactions and Recaps
Secondary transactions and recaps are where paperwork meets reality. You are not buying a clean story; you are buying a history of decisions, covenants, and operational outcomes. The goal is to negotiate terms that (1) reflect what is actually true today, (2) protect you from known failure modes, and (3) keep the path to liquidity and value creation coherent.
Foundational Concepts That Drive Term Negotiation
Start by separating three layers of “what you’re really buying.” First is the economic interest: equity, preferred, debt, or a mix. Second is the control and information layer: voting rights, board seats, consent thresholds, and reporting. Third is the risk allocation layer: reps and warranties, indemnities, escrow, and how losses are shared.
A practical way to keep negotiations grounded is to map every proposed term to one of these layers. If a term doesn’t clearly improve at least one layer, it’s usually just noise.
Secondary Purchase Terms That Matter Most
In a secondary, you often inherit the existing capital structure and the prior investor’s position. That means your leverage is mostly about price and protection, not about rewriting the company’s fundamentals.
Key items to negotiate include:
- Purchase price mechanics: Is it a straight cash price, or does it include adjustments for working capital, debt-like items, or tax attributes? If adjustments exist, define the calculation method and who prepares it.
- Transfer restrictions and consent: Confirm whether the seller can transfer without company consent, and if consent is required, ensure timing and conditions are explicit.
- Reps, warranties, and indemnities: Secondary deals frequently reduce the scope compared with primary rounds, but you still want clarity on what remains true. Focus on items that would change your ability to rely on the position.
- Escrow or holdback: Use escrow to cover specific claims, not vague “general issues.” Tie release dates to claim resolution milestones.
- Information rights: If the original investor had better reporting, negotiate to receive the same level. “We’ll share updates” is not a term; reporting cadence and format are.
Recap Transactions That Shift Economics and Control
A recap changes the capital structure, often to reduce leverage, reset incentives, or bring in new money. Negotiation is more complex because you are not only buying an interest; you are helping redesign the rules.
Focus on these recap term categories:
- Security design: If new preferred is issued, specify liquidation preference, participation rights, conversion triggers, and whether dividends accrue.
- Seniority and intercreditor alignment: If debt is refinanced, confirm priority and how claims interact across lenders.
- Governance and consent: Recaps can change board composition and voting thresholds. Ensure protective provisions cover the decisions that can impair your downside protection.
- Use of proceeds: Define what the company must do with new funds. If proceeds pay off debt, specify which debt and how payoff is verified.
- Treatment of existing holders: Clarify whether prior investors get pro rata participation, whether some are “wiped” or exchanged, and what happens to unpaid dividends or accrued interest.
Negotiation Playbook with Concrete Examples
Example: Secondary purchase with a price adjustment. You agree to buy preferred shares at a base price, but the agreement includes a working capital adjustment. To avoid surprises, define working capital as a specific line-item formula from the most recent audited or agreed financials, state the dispute process, and set a short timeline for calculation. This prevents the seller from using “reasonable estimates” as a moving target.
Example: Recap where conversion terms are quietly unfavorable. A recap offers new preferred with a conversion ratio that looks standard. During diligence, you notice that conversion is subject to a “floor” tied to a valuation that is calculated using a contested metric. Negotiate the metric definition and add a covenant that the company will not change accounting policies solely to affect conversion.
Example: Information rights mismatch. In a secondary, you receive quarterly updates but not monthly operating metrics. If your underwriting depends on operational KPIs, negotiate a reporting schedule that includes the same KPI set used in the original investment memo, with a clear delivery date and format.
Mind Map: Secondary Terms and Recap Levers
Closing the Gaps Between Documents
Secondary and recap deals often involve multiple agreements: purchase documents, amended charter or shareholder agreements, and side letters. A term that appears in one place can be contradicted in another. Before signing, reconcile the following:
- Definitions: Ensure the same terms mean the same thing across documents.
- Priority of provisions: Confirm which agreement controls in conflicts.
- Timing: Verify that notice periods, consent deadlines, and closing conditions align.
- Remedies: Check what happens if covenants are breached after closing, not just at closing.
A clean negotiation is less about winning arguments and more about removing ambiguity. When the deal is already in motion, clarity is the most valuable currency you can negotiate.
12.4 Calculating Realized Returns and Distributions
Realized returns answer a simple question: what did the family office actually receive, after the deal’s costs and timing effects? Distributions describe the cash movements, while realized returns translate those movements into performance measures that can be compared across deals.
Core Inputs for Realization
Start with three ledgers that should reconcile to each other.
- Cash In: total amounts funded (including follow-ons) and any fees paid at closing.
- Cash Out: distributions received (dividends, interest, sale proceeds, tax distributions) net of withholding.
- Cash Drag: costs that reduce net proceeds, such as transaction fees, legal costs, and servicing fees that are not already embedded in the distributions.
A practical rule: if a cost appears in the deal documents, it must show up either as a reduction to cash out or as part of cash in. Otherwise, your realized return will be “optimistically wrong.”
Distribution Waterfall Basics
Most private deals distribute cash using a waterfall. Even when the family office is not the lead investor, the distribution statement should show how proceeds were allocated.
Common components include:
- Return of Capital: investors get principal back before profits are split.
- Preferred Return: a hurdle rate applied to unreturned capital.
- Catch-Up: a mechanism that accelerates profit sharing after the preferred hurdle is met.
- Carried Interest: the manager’s share of profits, often calculated after return of capital and preferred return.
When you calculate realized returns, you don’t need to re-create the manager’s math from scratch. You do need to verify that the distribution statement’s totals reconcile to the cash you received and to the proceeds from the realization event.
Step-by-Step Realized Return Calculation
Use a consistent approach across deals.
-
Build the cash flow timeline
- Use the actual dates of funding and distribution receipts.
- If exact dates are unavailable, use the statement dates and document the assumption.
-
Compute net cash flows
- Cash out is positive; cash in is negative.
- Include any final true-up payments.
-
Calculate a realized performance metric
- Multiple on Invested Capital (MOIC):
- MOIC = Total Distributions ÷ Total Invested Capital
- Internal Rate of Return (IRR):
- IRR is the discount rate that sets the net present value of cash flows to zero.
- Multiple on Invested Capital (MOIC):
-
Separate partial and final realizations
- Partial distributions can be evaluated, but they are not the same as a full exit.
- Keep a “since inception” view and a “since last valuation” view to avoid mixing time periods.
Example: Partial Sale with Preferred Return
Assume an investment of $10,000,000 on 2024-02-15.
- Distribution 1 on 2024-06-30: $2,200,000
- Distribution 2 on 2024-11-15: $8,100,000
- Final closing costs paid by the investor: $150,000 (already netted in the distribution statement, so do not double-count)
Total invested capital = $10,000,000
Total distributions = $2,200,000 + $8,100,000 = $10,300,000
MOIC = $10,300,000 ÷ $10,000,000 = 1.03x
For IRR, you would use the dated cash flows:
- -$10,000,000 at 2024-02-15
- +$2,200,000 at 2024-06-30
- +$8,100,000 at 2024-11-15
The IRR will reflect the timing benefit of receiving part of the proceeds earlier. Two deals with the same MOIC can have different IRRs because cash arrived at different times.
Reconciliation Checks That Prevent Costly Mistakes
Before accepting the realized numbers, reconcile these items:
- Statement totals vs bank receipts: distributions should match net deposits after withholding.
- Capital account vs invested capital: ensure follow-ons and fees are classified consistently.
- Currency consistency: if the deal is in another currency, use the same FX basis for both invested capital and distributions.
- Tax distributions: treat them as distributions if they are cash received; track tax effects separately if you maintain a tax-aware model.
Mind Map: Realized Returns and Distributions
Common Pitfalls and How to Avoid Them
- Double-counting costs: if costs are already netted in distributions, do not subtract them again.
- Using valuation dates instead of receipt dates: realized returns should be driven by when cash actually moved.
- Mixing partial and final outcomes: report both “to date” and “at exit” so stakeholders don’t compare apples to slightly bruised oranges.
Realized returns are only as trustworthy as the cash-flow ledger behind them. When the ledger reconciles cleanly, performance metrics become a reliable basis for learning and decision-making.
12.5 Conducting Post Mortems and Updating Investment Playbooks
A post mortem is a structured review of what happened from first contact to final realization, with enough specificity to change future decisions. The goal is not to assign blame; it’s to tighten the family office’s decision system so the next deal is more likely to match the mandate, the underwriting, and the ownership plan.
Post Mortem Scope and Timing
Start with a fixed timeline so learning doesn’t get lost. For deals that fully exit, run the post mortem within 30–45 days after the final distribution. For partial exits or ongoing ownership, run a “stage post mortem” at the moment the key thesis milestone is either achieved or clearly missed.
Include four phases in the review:
- Deal intake and screening
- Underwriting and structuring
- Ownership execution
- Exit and realization
The Post Mortem Template That Actually Works
Use the same headings every time so comparisons are meaningful.
1. Deal Snapshot
- Asset type, entry date, entry price, capital invested
- Strategy label and whether it matched the mandate
- Ownership structure and governance rights
2. Thesis and Assumptions List the top 5 thesis drivers and the specific assumptions behind each. Example: “Revenue growth from customer expansion” with an assumption of “no churn above 3%.”
3. What Happened Versus Modeled Create a variance table with three columns: modeled, actual, and the reason for the gap. Example: modeled EBITDA margin 22%, actual 19%, reason “pricing pressure plus higher fulfillment costs.”
4. Decision Quality Score each major decision point on a simple 1–5 scale:
- Information quality at the time
- Correctness of the decision given that information
- Whether the decision was documented clearly
5. Process Friction Capture operational issues that affected outcomes: slow diligence, unclear reporting cadence, delayed consent approvals, or missing escalation paths.
6. Learning Statements Write learning as rules, not feelings. Example: “If customer concentration exceeds X, require a written retention plan and quarterly reporting on churn by cohort.”
7. Playbook Updates Map each learning statement to a concrete change in the playbook and who owns the update.
Mind Map: Post Mortem Workflow
Mind Map: Updating Investment Playbooks
Example: Turning a Miss into a Rule
A family office bought a minority stake in a services business. The underwriting assumed stable gross margin because “pricing resets occur annually.” After entry, margin fell for two quarters due to contract renegotiations.
Post mortem findings:
- Assumption was incomplete: pricing resets were annual, but renegotiations were triggered by a specific customer contract clause.
- Monitoring missed an early warning: no reporting on contract renewal status by cohort.
Playbook update:
- For services deals, require diligence on contract clauses that allow mid-cycle renegotiation.
- Add a monitoring requirement: quarterly reporting on renewal pipeline and renegotiation triggers.
Example: When the Model Was Fine but Execution Wasn’t
In another deal, the model predicted cash conversion accurately. The issue was governance execution: consent approvals for a capex plan took too long, delaying a cost-saving initiative.
Post mortem findings:
- Underwriting was reasonable.
- Decision rights were present but the internal escalation path was unclear.
Playbook update:
- Add an internal “consent calendar” process: pre-approve a range of capex categories and define who can escalate within 48 hours.
Consolidating Learning Across Deals
After several post mortems, aggregate them into a “learning register” with categories: diligence gaps, valuation assumptions, structuring protections, and ownership execution. This prevents one-off fixes from disappearing into folders.
Implementation and Closure
Each playbook change should have:
- A short description of the rule
- The section it updates
- The owner and approval path
- A date for rollout (for example, 2026-02-26)
Closure is complete when the next deal uses the updated template and the team can point to exactly what changed. That’s how quiet logic becomes repeatable logic.