Private Equity Deal Structuring and Value Creation Essentials
1. Private Equity Value Creation Framework and Deal Lifecycle
1.1 Defining Value Creation Objectives Across Investment Phases
Value creation objectives should be written so they can survive contact with reality: diligence findings, lender questions, and the first month of operating changes. The goal is not to list wishes; it is to define measurable outcomes, the levers that drive them, and the timing of when each lever must start working.
Phase 1: Pre-Close Objectives That Reduce Uncertainty
Before closing, objectives focus on proving the business can generate the cash flow the deal depends on. Start with three categories.
-
Cash flow credibility: confirm that reported earnings convert to cash. A practical objective is “validate working capital behavior so the first 90 days do not drain cash.” For example, if the target has seasonal receivables, set a diligence objective to quantify days sales outstanding by month and tie it to the purchase price working capital target.
-
Risk containment: define what must be true to avoid value leakage. Example: “identify revenue contracts with termination rights tied to customer credit events and quantify exposure.” This turns legal review into a value question.
-
Financing readiness: ensure the capital structure can be serviced under realistic conditions. Example: “stress test debt service coverage under a downside margin scenario and confirm covenant headroom.” If the model shows thin headroom, the objective becomes negotiating covenants or adjusting purchase price mechanics.
Phase 2: Day One to 100-Day Objectives That Stabilize Performance
Early objectives should prevent avoidable damage while you gather operational truth. Write them as “stabilize, measure, and fix the obvious.”
- Stabilize cash: implement a cash collection cadence and approval limits for spending. Example: require weekly accounts receivable aging review and set a threshold for write-offs.
- Stabilize pricing and service: freeze discount authority until margin baselines are revalidated. Example: if sales teams can discount without approval, set a temporary rule that discounts above a defined band require sign-off.
- Stabilize reporting: produce a baseline KPI pack that matches how lenders and the board will monitor performance. Example KPIs: gross margin by product line, backlog coverage, and inventory turns.
These objectives are not about “big transformations.” They are about stopping the business from drifting while you measure what actually drives results.
Phase 3: 6- to 18-Month Objectives That Create Sustainable Improvements
Now the objectives shift from stabilization to improvement programs. Each objective should specify the operational lever, the metric, and the owner.
- Margin expansion: choose one or two drivers you can influence. Example: reduce expedited freight by improving order planning. The objective becomes “cut expedited freight cost as a percent of revenue by X points by month Y,” supported by a planning process change.
- Revenue retention and growth: focus on measurable commercial outcomes. Example: “increase renewal rate for top 50 customers from A% to B% by month Y,” paired with a customer success playbook and contract review cadence.
- Cost structure: target controllable costs with clear baselines. Example: “reduce controllable overhead by X% through procurement renegotiation and staffing plan changes,” with a monthly variance review.
A useful rule: if an objective cannot be tied to a metric that changes within the investment horizon, it belongs in a later phase or should be rewritten.
Phase 4: 18-Month to Exit Objectives That Protect the Sale Story
Exit objectives should make the business easier to diligence and easier to value. They focus on consistency, documentation, and normalization.
- Financial quality: ensure reporting is consistent and adjustments are supportable. Example: maintain a documented policy for one-time costs so EBITDA normalization is not a debate.
- Operational repeatability: prove that improvements are process-based, not hero-based. Example: if margin improved due to a new pricing tool, ensure the tool’s governance and training are documented.
- Customer and contract durability: keep churn and contract terms stable. Example: track renewal pipeline and ensure key contracts are not expiring without a plan.
Mind Map: Value Creation Objectives by Phase
Example: Turning Objectives Into a One-Page Scorecard
For a target with volatile receivables, a coherent objective set might look like this: pre-close validate monthly DSO and set working capital targets; day one implement AR aging and collection cadence; 6- to 18-month reduce DSO by improving dispute resolution; exit maintain consistent cash conversion so buyers do not discount earnings.
The scorecard stays simple: each objective has a metric, a target, a start date, and an owner. If you cannot assign an owner, the objective is probably not ready.
1.2 Mapping the Deal Lifecycle from Sourcing Through Exit
A private equity deal is easiest to manage when you treat it like a pipeline with handoffs, not a single event. The goal of mapping is to make every decision point traceable to a value driver, a financing constraint, and an operational plan.
Lifecycle Stages and What “Done” Means
1) Sourcing and Screening
You start with a thesis and filter targets using a short list of measurable value drivers: cash conversion, pricing power, churn, and cost structure. “Done” here means the team can explain why the business can improve and what would break the case.
2) Initial Diligence and Deal Shaping
Early diligence turns assumptions into questions. You validate revenue quality (recurring vs. one-time), customer concentration, and working-capital behavior. “Done” means you can propose a preliminary purchase price range and a financing approach that fits the likely cash profile.
3) Financing and Structuring
Capital structure is not a math exercise; it’s a constraint system. You align debt sizing with expected free cash flow, covenant headroom, and refinancing risk. “Done” means the model shows debt service coverage under base and downside cases, and the term sheet reflects those outcomes.
4) Definitive Diligence and Documentation
This is where legal terms meet operational reality. You confirm adjustments like working capital targets, normalize earnings, and refine earnout metrics if used. “Done” means the purchase agreement and disclosure schedules match what diligence actually found.
5) Closing and Day One Execution
Closing is a switch from “analysis” to “operations.” You finalize reporting cadence, confirm authority levels, and ensure systems can produce the KPIs used for covenant and management reporting. “Done” means the first operating review can run on time with reliable numbers.
6) Value Creation Execution
Value creation runs on a baseline and a rhythm. You track initiatives by KPI, not by activity, and you link spending to measurable outcomes. “Done” means each initiative has an owner, a timeline, and a metric that moves.
7) Monitoring, Governance, and Risk Control
Governance prevents surprises. You monitor liquidity, covenant compliance, and working capital trends, and you escalate issues with defined thresholds. “Done” means decisions are documented and consistent with the investment plan.
8) Exit Planning and Transaction Readiness
Exit starts long before the sale process. You maintain reporting quality, stabilize customer and employee retention, and keep the business narrative consistent with audited or supportable numbers. “Done” means a buyer can understand performance without hunting for explanations.
Mind Map: the Lifecycle Handoff Logic
Example: One Deal, Many Handoffs
Consider a mid-market manufacturer with 60% of revenue from repeat orders. During screening, the team flags two value drivers: improved gross margin through procurement discipline and better cash conversion by reducing inventory days.
In initial diligence, they discover that inventory spikes before seasonal demand but is funded by customer deposits that are recorded inconsistently across regions. That finding changes the working-capital adjustment approach in the purchase agreement and affects the financing model because cash timing is less stable than it looked.
During definitive diligence, they normalize earnings by separating one-time freight reimbursements from recurring logistics costs. They also define earnout metrics tied to gross margin and customer retention, with dispute-avoidance controls: clear measurement periods, data sources, and audit rights.
At closing, Day One readiness focuses on reporting definitions. If gross margin is calculated differently by plant, the KPI dashboard becomes a guessing game, and covenant monitoring suffers. The team standardizes the calculation and confirms the data feed before the first operating review.
In value creation, procurement initiatives are tracked by realized savings per SKU and by inventory turns, not by the number of supplier meetings. Governance adds a monthly working-capital review with a threshold: if inventory days move beyond a set band, the operating team must present corrective actions.
For exit readiness, the buyer narrative stays consistent: the same KPI definitions used internally are used in buyer materials, and the normalization logic is documented so diligence questions don’t derail the timeline.
Practical Mapping Checklist for the Team
- Every stage has a “done” definition tied to a value driver.
- Every handoff includes: data definitions, decision rights, and escalation triggers.
- Financing assumptions are revisited when operational facts change, not when the calendar forces it.
- Exit readiness is treated as maintaining quality of performance reporting, not just preparing a sale deck.
1.3 Establishing Key Performance Indicators and Value Drivers Before Closing
Before closing, you want two things to be true: (1) the business can be measured consistently, and (2) the measurements connect to the value creation plan you already modeled. Key performance indicators (KPIs) are the scoreboard; value drivers are the levers that move the score. When those two are linked, you can manage execution without guessing.
Foundational Concepts That Prevent KPI Chaos
Start by separating KPIs into three layers.
- Value drivers describe what changes enterprise value: cash generation, growth, margin, and risk.
- Operational KPIs describe what the team can influence day to day: conversion rates, cycle times, defect rates, utilization.
- Financial KPIs translate operations into cash and profitability: gross margin, EBITDA, working capital, and debt service coverage.
A practical rule: every KPI should have an owner, a data source, a refresh frequency, and a clear “so what” statement. If you cannot explain why a KPI matters in one sentence, it probably belongs in a spreadsheet, not in the operating cadence.
Building the Value Driver Map
Use the value driver map to connect strategy to numbers. For a typical acquisition, the value drivers often cluster into four buckets.
- Revenue quality: retention, expansion, and contract terms that protect cash.
- Margin structure: gross margin and controllable cost lines.
- Working capital discipline: inventory turns, receivables aging, and payables timing.
- Risk and compliance: churn risk, warranty exposure, and customer concentration.
Then assign operational KPIs that explain each driver. For example, revenue quality is not just “sales growth.” It is retention rate, win rate, average contract duration, and billing accuracy.
KPI Selection with a Simple Test
Pick KPIs using a three-part test.
- Causality: does the KPI move before the financial outcome?
- Controllability: can management influence it within the planned holding period?
- Measurability: can you collect it reliably from existing systems without heroic effort?
Example: If your model assumes margin expansion, “gross margin” is a financial KPI. The operational KPIs might be product mix, scrap rate, and labor productivity. Those are measurable and actionable.
Data Readiness Before Closing
KPI integrity depends on data definitions. Before closing, confirm that the same metric means the same thing across teams and systems.
- Define terms: what counts as “active customer,” “on-time delivery,” or “recognized revenue.”
- Reconcile sources: compare ERP totals to accounting close numbers for at least two months.
- Document adjustments: if you use adjusted EBITDA, specify which lines are normalized and how often adjustments occur.
A small but effective practice is to run a “metric dry run” using last month’s data. If the KPI dashboard cannot be produced in a day, it will not survive month-end.
Mind Map: Value Drivers and KPI Linkages
Example KPI Set for a Typical Acquisition
Assume the investment thesis is to improve cash conversion and stabilize revenue. A coherent KPI set might look like this.
-
Revenue quality
- Retention rate by cohort (owner: commercial lead, monthly)
- Billing accuracy (owner: finance, monthly)
- Contract exception rate (owner: legal/ops, monthly)
-
Margin structure
- Pricing realization vs. list (owner: sales ops, weekly)
- Scrap and rework rate (owner: operations, weekly)
- Labor productivity (owner: plant/ops, weekly)
-
Working capital discipline
- Receivables aging by bucket (owner: finance, weekly)
- DSO trend (owner: finance, monthly)
- Inventory turns by SKU class (owner: supply chain, monthly)
Each KPI should connect to a value driver in your model. If the model assumes reduced DSO, then receivables aging and collection rate must be tracked with enough granularity to explain variances.
Targets and Thresholds That Match the Model
Targets should be consistent with the financial model, but not identical. Financial models often use annual averages; operational KPIs need interim thresholds.
Use three levels:
- Baseline: the last two months’ average.
- Target: the modeled improvement path.
- Threshold: a point where you trigger action, not a point where you panic.
Example: If receivables aging shows a growing 60–90 day bucket, set a threshold that forces a collection playbook review before the annual cash impact appears in the forecast.
Closing Checklist for KPI Readiness
Before closing, confirm the following are in place:
- KPI definitions are written and agreed.
- Data sources are accessible and reconciled.
- Owners are assigned with decision rights.
- A first-month dashboard can be produced without delays.
- KPI-to-value-driver mapping is documented so the operating team knows what they are moving.
When this is done, the post-close period starts with fewer surprises and more useful conversations. The scoreboard becomes a tool, not a mystery novel.
1.4 Building a Practical Workplan for Diligence Integration and Day One Readiness
A practical workplan turns diligence findings into actions that start on Day One, not “sometime after closing.” The goal is simple: ensure the team can run the business safely, accurately, and consistently from the first week, while the value plan begins immediately.
Foundational Inputs That Drive the Workplan
Start by consolidating four inputs into one operating view:
- Diligence outputs: risks, red flags, and quantified opportunities (for example, margin leakage, customer churn drivers, or working-capital traps).
- Deal terms and constraints: covenants, purchase price adjustments, earnout mechanics, and any closing conditions that affect operations.
- Value creation plan: the specific initiatives assumed in the model, with owners and target dates.
- Operating reality: current systems, reporting cadence, key roles, and where decisions actually get made.
A useful rule is to map every diligence finding to one of three buckets: fix before close, prepare for Day One, or manage after close. If a finding lands in “after close” but is critical to cash flow or compliance, it probably belongs in “prepare for Day One.”
Workplan Structure from Close to Day One
Build the workplan as a timeline with deliverables, not a list of tasks. A clean structure is:
- T-60 to T-30 days: finalize integration scope, confirm data access, and draft Day One operating procedures.
- T-30 to T-10 days: validate assumptions with management, run dry-runs for reporting and controls, and lock the KPI definitions.
- T-10 to Close: complete system access, confirm staffing coverage, and ensure legal and finance processes are ready.
- Day One to Day 30: execute the first operating cycle, track issues, and stabilize reporting.
Use a single “source of truth” tracker with columns for: initiative, diligence link, owner, dependencies, required artifacts, and acceptance criteria. Acceptance criteria prevent the classic problem where everyone agrees something is “in progress,” but nothing is actually usable.
Mind Map: Diligence Integration to Day One Readiness
Core Workstreams and What “Done” Looks Like
A workplan works best when it has a small set of workstreams with concrete deliverables.
-
Finance and Reporting Readiness
- Deliverables: KPI definitions, monthly close checklist, and a cash forecast template.
- Example: if diligence shows working capital volatility, define the exact inputs for the forecast (DSO, DPO, inventory turns) and set a weekly check-in during the first month.
-
Commercial and Customer Continuity
- Deliverables: pricing approval workflow, contract repository, and churn-risk customer list.
- Example: if contract terms vary by customer, Day One should include a rule for approvals so sales can quote without accidentally breaking discount or rebate constraints.
-
Operations and Controls
- Deliverables: standard operating procedures for purchasing, inventory counts, and quality checks.
- Example: if diligence flags inventory shrink, Day One should specify who signs off on cycle counts and how variances are investigated.
-
Legal, Compliance, and Contractual Mechanics
- Deliverables: covenant tracker, disclosure schedule owner list, and earnout metric governance.
- Example: for an earnout tied to revenue, define the revenue recognition basis and the dispute-resolution path before closing so the first measurement period is not a negotiation.
-
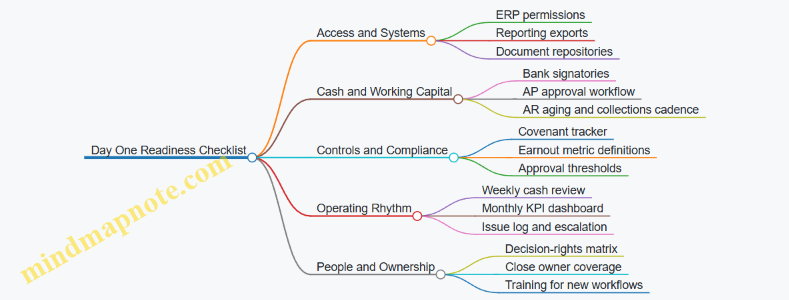
People and Decision Rights
- Deliverables: org chart, decision-rights matrix, and escalation rules.
- Example: if the CFO role is changing, assign a temporary “close owner” for the first month so the reporting cadence doesn’t slip.
Integrated Example: From Finding to Day One Action
Assume diligence identifies that month-end reporting is delayed by two weeks and that cash collections are tracked inconsistently.
- T-30 to T-10: finance creates a single collections tracker and defines aging buckets.
- T-10 to Close: IT grants access to the tracker and AP/AR exports; the close checklist is tested with last month’s data.
- Day One: the first weekly cash meeting uses the new tracker; exceptions are logged with owners.
- Day 30: the team compares actual collections to forecast and updates the working-capital assumptions used in the value model.
This is not “reporting for reporting’s sake.” It directly supports covenant monitoring and reduces the chance that value assumptions are based on stale information.
Mind Map: Day One Readiness Checklist
Practical Governance and Cadence
Set a meeting rhythm that matches the work:
- Twice weekly during T-30 to T-10: integration leads review blockers and confirm deliverables.
- Weekly during T-10 to Close: legal, finance, and commercial confirm readiness for the next milestone.
- First two weeks after close: daily standups for issues that affect cash, reporting, or customer continuity.
A simple acceptance test for each deliverable is: “Could a new person use this on Day One without asking the original author?” If the answer is no, the work is not ready.
Date Anchor for Planning
Use a planning anchor such as April 15 as the midpoint for T-30 activities, so teams can schedule dry-runs, access requests, and sign-offs without last-minute scrambling.
1.5 Aligning Stakeholders on Governance Reporting and Decision Rights
A deal’s early months can feel like a group project where everyone has a different definition of “done.” Governance reporting and decision rights fix that by making three things explicit: who decides, what they decide, and how information flows to support those decisions.
Foundational Concepts That Prevent Confusion
Start with decision rights. A simple rule works well: decisions that affect cash, risk, or performance get explicit owners. Everything else can be advisory.
Next comes governance reporting. Reporting is not “more dashboards.” It is a repeatable rhythm of facts that match the decisions being made. If the board reviews covenant risk monthly, the report must include covenant headroom and the actions underway to protect it.
Finally, define escalation. Escalation is the bridge between “we noticed” and “we acted.” Without it, issues become polite emails. With it, issues become tasks with owners and deadlines.
A Practical Governance Model for Private Equity
Use a three-layer structure.
- Board and investor governance: sets priorities, approves major actions, and monitors value creation progress.
- Management governance: runs the operating plan, manages tradeoffs, and proposes actions.
- Functional working groups: handle deep dives like pricing, procurement, or integration workstreams.
A useful starting point is a decision matrix. For each decision type, specify the approver, required inputs, and the threshold that triggers approval.
Decision Matrix Example
- Budget changes above 5%: Board approval; inputs include updated forecast, variance explanation, and cash impact.
- New debt draw or refinancing: Investor committee approval; inputs include lender term sheet, covenant impact, and liquidity forecast.
- Hiring replacement for a critical role: Management approval; inputs include role scope, cost, and timeline.
- Customer contract concessions beyond standard terms: Management approval with legal review; inputs include margin impact and churn risk assessment.
This keeps the board from micromanaging while ensuring material decisions do not slip through.
Reporting Rhythm That Matches Decision Needs
A clean reporting cadence reduces meeting time and increases action quality.
- Weekly: cash position, collections status, top operational blockers, and progress on critical workstreams.
- Monthly: KPI dashboard, variance analysis versus plan, covenant headroom, and a short “what we changed” section.
- Quarterly: re-forecast, integration or improvement progress review, and updated risk register.
The “what we changed” section matters because it turns reporting into decision support. If performance is off track, the report should state the specific corrective actions, not just the gap.
Mind Map: Governance Reporting and Decision Rights
Example: Turning a KPI Miss Into a Governed Decision
Assume gross margin is trending below plan for two consecutive months.
- Management identifies the driver: a pricing discount pattern and higher freight costs.
- Reporting flags the threshold: the margin shortfall exceeds the agreed variance band.
- Escalation triggers: the CFO requests approval for a pricing policy change and a procurement renegotiation.
- Decision rights determine the approver: pricing policy beyond standard terms requires legal review and management approval; a procurement commitment above the cap requires board approval.
- Documentation is consistent: the board packet includes the margin bridge, cash impact, and timeline to implement.
The result is not just “a decision.” It is a decision with traceable inputs, clear ownership, and a timeline that can be monitored.
Example: Avoiding Covenant Surprise
Covenant headroom is often treated as a finance-only topic. Governance makes it everyone’s problem.
- Weekly reporting includes a simple covenant tracker with the latest forecast.
- The working group responsible for collections owns the action plan when headroom tightens.
- Escalation occurs when the forecast indicates a breach risk within the next reporting period.
This prevents the classic scenario where the first warning arrives in the same month the covenant is tested.
Implementation Checklist for Day One Readiness
- Confirm decision rights for cash, financing, capex, pricing concessions, and integration scope.
- Publish a one-page reporting calendar with owners and required metrics.
- Define escalation triggers and the exact information needed for approval requests.
- Run a first governance cycle using real data from the first month post-close.
When governance is designed this way, stakeholders spend less time arguing about what happened and more time deciding what to do next.
2. Target Screening and Diligence Planning for Structuring Decisions
2.1 Translating Investment Thesis Into Diligence Workstreams
An investment thesis is a promise about how value will be created, not a list of hopes. Diligence workstreams translate that promise into specific questions, evidence requests, and decision checkpoints. If you do it well, the diligence plan becomes a map from “what we believe” to “what we can prove.”
Start with Thesis Claims You Can Test
Write the thesis as 3–6 testable claims. Each claim should point to a measurable driver and a mechanism.
-
Claim example: “Margin expands because pricing discipline improves and costs stabilize.”
- Mechanism: pricing governance + reduced discount leakage + procurement renegotiation.
- Evidence you need: historical discount rates, quote approval workflows, supplier spend breakdown, and cost variance drivers.
-
Claim example: “Cash conversion improves because working capital is managed tightly.”
- Mechanism: tighter credit terms for new customers, faster invoice resolution, inventory turns improvement.
- Evidence you need: DSO, aging buckets, dispute rates, inventory aging, and replenishment policies.
This step prevents a common failure mode: diligence that collects data but cannot confirm or refute the thesis.
Convert Claims Into Workstreams
Group thesis claims into workstreams that match how the business actually runs. A practical set usually includes Commercial, Operations, Finance, Legal/Tax, People, and Integration/Exit readiness. Each workstream should have a purpose, key questions, and deliverables.
Commercial workstream focuses on revenue quality and retention mechanics.
- Key questions: Which customers drive revenue and margin? How stable are contracts? Where does revenue leakage occur?
- Deliverables: customer cohort retention view, contract term summary, pricing/discount governance assessment.
Operations workstream focuses on cost structure and execution capability.
- Key questions: What drives unit costs? Are there bottlenecks or quality issues? How repeatable are processes?
- Deliverables: process map of the main value chain, cost driver model, capacity and throughput constraints.
Finance workstream focuses on cash flow reality and accounting normalization.
- Key questions: What is recurring versus one-time? How reliable are forecasts? How does working capital behave in stress?
- Deliverables: quality of earnings memo, cash conversion bridge, covenant-relevant cash flow forecast.
Legal/Tax workstream focuses on risk that can break the plan.
- Key questions: Are there contract clauses that limit operational changes? Are there disputes, liens, or tax exposures?
- Deliverables: risk register with severity and remediation paths.
People workstream focuses on whether the operating plan has operators.
- Key questions: Who owns the processes behind the thesis? What is turnover risk? Are incentives aligned?
- Deliverables: org capability assessment, retention risk map, incentive gap analysis.
Define Evidence Standards and Decision Gates
Each workstream needs an evidence standard: what “good enough” looks like. For example, if the thesis depends on pricing discipline, you should not accept “we try to be consistent” as evidence.
Use decision gates to avoid late-stage surprises. Typical gates:
- Thesis validation gate after initial data review.
- Model confirmation gate after normalization and driver mapping.
- Risk resolution gate before final financing and purchase terms.
At each gate, require a short output: “What we believe,” “What we found,” “What changed,” and “What we need next.” Keep it crisp so the team can act.
Mind Map: Thesis to Diligence Workstreams
Example: Pricing-Led Margin Expansion Thesis
Suppose the thesis claims margin improves through pricing discipline and reduced discount leakage.
Commercial diligence tasks
- Request quote logs for the last 12–24 months.
- Compare quoted price vs. realized price by customer segment.
- Identify discount approval thresholds and exceptions.
Operations diligence tasks
- Confirm whether cost-to-serve varies by customer segment.
- Map how changes in pricing affect production planning and service levels.
Finance diligence tasks
- Normalize revenue recognition if discounts are tied to rebates or credits.
- Build a bridge from realized margin to cash margin after working capital impacts.
Legal diligence tasks
- Review contract clauses that restrict price changes or require notice periods.
People diligence tasks
- Identify who currently approves discounts and whether that role is stable.
Decision gate output
- If quote logs show realized pricing drift and approval controls are weak, the thesis is supported and the operating plan can specify governance changes.
- If realized pricing is stable but margin still varies, the thesis mechanism is wrong; you pivot to cost drivers instead of forcing pricing as the explanation.
This is the core discipline: diligence workstreams should be traceable to thesis claims, and each claim should have a clear path from evidence to decision.
2.2 Designing a Data Room Plan for Commercial Financial and Operational Inputs
A data room plan is a checklist with a purpose: it helps you collect the right evidence, in the right format, at the right time—so diligence doesn’t turn into a scavenger hunt. The goal is not volume; it’s traceability from commercial reality to financial results to operational drivers.
Step 1: Define the Questions the Data Room Must Answer
Start by writing diligence questions in plain language, then map each question to documents and owners. For example:
- “What drives revenue each month?” maps to customer contracts, pricing schedules, and billing reports.
- “Why did margins move?” maps to cost rollups, labor hours, supplier terms, and variance explanations.
- “Can the business deliver the forecast?” maps to capacity plans, lead times, quality metrics, and backlog.
A practical rule: every diligence workstream should have 5–10 questions. If you have 40 questions, you’ll drown in files.
Step 2: Organize the Room by Workstreams and Evidence Type
Use a consistent folder structure so reviewers can find things without asking. A common structure is:
- Commercial
- Financial
- Operational
- Legal and Tax (only if needed for this section)
- Management and Reporting
Within each workstream, split by evidence type:
- Contracts and policies
- Reports and dashboards
- Source data exports
- Support for adjustments and reconciliations
This structure reduces the “which version is correct?” problem when multiple teams work in parallel.
Step 3: Build a Document Inventory with Ownership and Freshness
For each item, record:
- Document name and system of origin
- Owner (who can answer questions)
- Frequency (monthly, quarterly, ad hoc)
- Last updated date
- Coverage period (for example, 24 months)
If a document is updated irregularly, include the last update date and explain the gap in a short note. For example, “Pricing exceptions report last updated 2024-04-15; exceptions are tracked in CRM and exported quarterly.” Use a date like 2024-04-15 rather than today.
Step 4: Specify the Minimum Commercial Inputs
Commercial diligence should connect customer behavior to revenue recognition and cash collection.
Include:
- Customer list by segment with contract start/end dates
- Pricing terms and discounting policy
- Top customers’ contracts and amendments
- Billing history by customer and invoice aging
- Revenue bridge from bookings to recognized revenue
- Churn and retention metrics with definitions
Example: If revenue is recognized over time, provide a schedule showing contract value, performance milestones, and recognized revenue by month. Then provide the billing report so the team can compare “what was billed” versus “what was recognized.”
Step 5: Specify the Minimum Financial Inputs
Financial diligence should support the adjusted EBITDA story and cash flow mechanics.
Include:
- Trial balance and general ledger exports
- Monthly P&L by cost center
- Balance sheet detail for working capital accounts
- Bank statements and debt schedules (if relevant)
- Reconciliation of reported to adjusted EBITDA
- Revenue and cost allocation methodology
Example: For working capital, provide a reconciliation of AR aging to the GL balance and explain any recurring adjustments. If AR includes disputed invoices, include the dispute log and resolution status.
Step 6: Specify the Minimum Operational Inputs
Operational diligence should show how the business produces the output that commercial teams sell.
Include:
- Production or service delivery process maps
- Capacity and utilization reports
- Quality metrics and defect or rework logs
- Inventory policy and inventory movement reports
- Procurement terms and supplier performance
- Staffing model with headcount, hours, and productivity measures
Example: If labor is a major cost driver, include a monthly labor hours report by role and a productivity metric (for example, units per labor hour). Then include a variance explanation template used internally so you can see how management already thinks about drivers.
Step 7: Add a “How to Read This” Layer
A data room without context creates endless questions. Add short readme documents:
- Definitions of metrics (churn, retention, backlog, utilization)
- Chart of accounts mapping
- Revenue recognition summary and key assumptions
- Adjustment policy for one-time items
Keep these to a few pages each. If a readme is longer than the document it explains, it’s not helping.
Step 8: Plan Q&A and Version Control
Set rules:
- Questions must reference folder paths and document names
- Answers must cite the document version used
- Updated files must be labeled with version numbers
A simple approach is to maintain a “Diligence Questions Log” spreadsheet with columns for question, workstream, document reference, status, and owner.
Mind Map: Data Room Plan for Commercial Financial and Operational Inputs
Example: A Minimal Yet Complete Commercial Folder Set
If you need a starting point, include these folders for each of the last 24 months:
- Customer contracts and amendments
- Pricing and discount policy
- Billing by customer and invoice aging
- Revenue bridge and recognition schedule
- Churn and retention report with definitions
Then add one “supporting export” folder that contains the raw extracts behind each report. Reviewers can trust the report, and they can reproduce it when something doesn’t match.
Example: Reconciling Revenue to Cash Without Guesswork
When revenue is recognized differently than cash is collected, provide:
- Monthly recognized revenue by customer
- Monthly cash receipts by customer
- AR aging by month
- A reconciliation note explaining timing differences
If a timing difference is driven by contract terms, point to the relevant clause in the contract folder. That single link can save hours of back-and-forth.
2.3 Assessing Quality of Earnings and Adjusted EBITDA Methodology
Quality of Earnings (QoE) is the discipline of asking, “How much of reported earnings is real, repeatable, and cash-supported?” In private equity deal structuring, this matters because purchase price, leverage capacity, and covenant headroom often hinge on Adjusted EBITDA. If the adjustment story is sloppy, the financing story will be too.
Foundational Concepts That Drive QoE
Start with the bridge from reported earnings to Adjusted EBITDA. Reported EBITDA is not a single number in the real world; it’s a moving target shaped by accounting policies, one-time items, and management judgment. QoE therefore focuses on three questions:
-
Is the underlying operating performance sustainable? Example: A company reports strong EBITDA after reversing an accrual. The reversal boosts earnings, but the cash reality is unchanged. QoE flags the reversal as non-recurring and checks whether the accrual was properly supported.
-
Do adjustments reflect economic reality, not accounting convenience? Example: “One-time consulting” that repeats every quarter is not one-time. QoE tests whether the spend is tied to ongoing projects or recurring functions.
-
Does Adjusted EBITDA correlate with cash generation? Example: EBITDA rises while operating cash flow falls due to working capital build. QoE examines whether the working capital movement is structural (e.g., longer receivable terms) or temporary.
The QoE Workflow from Evidence to Adjustments
A systematic QoE process prevents the common failure mode: building a persuasive adjustment list before verifying the facts.
Step 1: Normalize the Income Statement
Reconcile reported results to management’s “adjusted” version using a documented bridge.
- Identify recurring line items that are often adjusted (e.g., management fees, rent, stock-based compensation).
- Confirm whether the company’s accounting policies are consistent across periods.
Easy example: If depreciation is adjusted upward because “maintenance capex is higher than reported,” QoE checks capex invoices and asset lives rather than accepting the narrative.
Step 2: Validate Each Adjustment Category
Treat adjustments like evidence-based claims.
- One-time items: Obtain support for the event (contract termination, severance plan, litigation settlement).
- Non-operating items: Separate financing effects, taxes, and unusual gains/losses from core operations.
- Non-cash items: Confirm stock-based compensation and non-cash charges are correctly classified.
- Run-rate adjustments: Only apply if you can show the change has already occurred and is measurable.
Easy example: A company adjusts for “customer churn impact” after a pricing change. QoE verifies churn data before and after the change and checks whether the adjustment period matches the actual timing.
Step 3: Test Cash Conversion and Working Capital
Adjusted EBITDA is an earnings metric; lenders and investors care about cash.
- Compare EBITDA to operating cash flow over multiple periods.
- Analyze working capital drivers: receivables aging, inventory turns, and payables terms.
Easy example: If Adjusted EBITDA is stable but cash drops, QoE checks whether revenue recognition is front-loaded (e.g., bill-and-hold) or whether collections are slipping.
Step 4: Assess Revenue Quality and Margin Integrity
QoE should include revenue and gross margin checks because EBITDA can look fine while revenue quality deteriorates.
- Review customer concentration and contract terms.
- Inspect returns, credits, and allowances.
- Validate whether gross margin changes are explained by product mix, pricing, or cost inflation.
Easy example: A company “adjusts out” higher freight costs as non-recurring. QoE checks freight invoices and whether the cost increase is tied to ongoing logistics changes.
Adjusted EBITDA Methodology That Holds Up Under Scrutiny
A robust Adjusted EBITDA methodology uses consistent definitions and clear rules.
Define the Baseline
- Start from reported EBITDA (or operating income plus D&A, depending on the company’s reporting).
- Ensure the starting point is consistent across periods.
Use a Controlled Adjustment Policy
Create categories with rules:
- Allowed adjustments: clearly evidenced, truly non-recurring, and supported by documentation.
- Conditioned adjustments: require a run-rate justification (e.g., a new pricing model already in effect).
- Disallowed adjustments: recurring costs disguised as one-time.
Easy example: “Restructuring” is allowed only if it is tied to a defined plan with end dates and measurable severance/contract costs.
Document the Bridge and Ownership
For each adjustment, capture:
- rationale,
- period(s) affected,
- documentation,
- whether it is recurring or non-recurring,
- impact on cash (if relevant).
Mind Map: QoE and Adjusted EBITDA Logic
Example: Building a Credible Adjustment Bridge
Assume reported EBITDA is $10.0m. Management proposes $1.2m of adjustments.
- $0.6m severance from a documented restructuring plan with end dates.
- $0.3m legal settlement tied to a specific dispute.
- $0.2m “consulting” that is actually recurring project support with invoices every quarter.
- $0.1m stock-based compensation.
A QoE-driven outcome:
- Keep severance and legal settlement as allowed.
- Reclassify the recurring consulting as disallowed (or treat as a reforecasted baseline cost rather than an adjustment).
- Keep stock-based compensation as non-cash if consistently treated.
Result: Adjusted EBITDA becomes $10.0m + $0.6m + $0.3m + $0.1m = $11.0m, not $11.2m. That difference is small in this example, but it’s exactly the kind of gap that can matter for leverage and covenant calculations.
Practical Output for Deal Structuring
The deliverable is not just a revised EBITDA number. It’s a defensible bridge with categories, evidence, and cash checks. When the financing model uses Adjusted EBITDA, it should reference the same definitions and adjustment policy so the lender and investment committee are evaluating the same story.
2.4 Evaluating Customer Revenue Mix and Contract Terms for Cash Flow Visibility
Cash flow visibility starts with two questions: who pays, and when they pay. Revenue mix answers “who,” while contract terms answer “when.” Together they determine how predictable collections are, how much cash is tied up in receivables, and how sensitive cash is to churn, disputes, and billing mechanics.
Revenue Mix Foundations That Affect Cash
Start by classifying revenue into buckets that behave differently in cash collection.
- Recurring vs. transactional: Subscription-like revenue usually bills on a schedule; transactional revenue often follows project milestones or usage.
- Contracted vs. uncommitted: Contracted revenue has defined pricing and billing rules; uncommitted revenue may be subject to renewals, rate changes, or customer behavior.
- Concentration by customer and segment: A small number of customers can dominate collections timing. If one customer pays late, the cash forecast moves.
- Revenue by payment pattern: Some customers pay net 30, others net 60 or require approvals. Even with the same revenue amount, cash timing differs.
A simple check: compute weighted average days sales outstanding (DSO) using each customer’s payment terms and actual historical payment behavior. If DSO is drifting upward, revenue recognition may look fine while cash quietly deteriorates.
Contract Terms That Drive Timing and Collectability
Contract terms determine whether revenue is “collectible” in practice, not just “recognized” in accounting.
- Payment terms: Net days, invoicing triggers, and whether invoices require acceptance. Example: a contract that invoices only after customer acceptance can create a two-step delay.
- Billing cadence: Monthly in advance, monthly in arrears, milestone-based, or usage-based. Example: usage-based billing can lag actual consumption, especially if metering or reporting is monthly.
- Price protection and indexation: Rate changes can cause disputes or delayed approvals. Example: if pricing updates require customer sign-off, collections may pause until paperwork is complete.
- Dispute and credit provisions: Look for clauses that allow deductions, credits, or withholding. Example: if customers can withhold 10% for “service quality” without a defined cure process, cash becomes less certain.
- Termination and renewal mechanics: Early termination rights, notice periods, and renewal timing affect churn risk. Example: a 90-day notice requirement can reduce sudden cash drops, but only if the company has strong renewal execution.
- Service level and remedies: Credits tied to performance can be predictable if measurement is clear; they are unpredictable if measurement is ambiguous.
Building a Cash Flow Visibility View from Contracts
Create a collections map that links each revenue bucket to cash timing.
- Inventory contract types: list the main contract templates and any major customer-specific deviations.
- Extract billing triggers: define what starts invoicing and what stops it.
- Assign expected collection lags: use historical payment data by customer and contract type.
- Model deductions and disputes: estimate expected net collections after typical credits or chargebacks.
- Stress the weak links: focus on customers with long payment terms, high dispute rates, or complex acceptance procedures.
A practical example: suppose 40% of revenue is milestone-based with invoices issued at delivery, but acceptance takes 45 days on average. Even if accounting recognizes revenue upon delivery, cash may arrive closer to 75–90 days after delivery depending on net terms. Your forecast should reflect that gap.
Mind Map: Revenue Mix to Cash Outcomes
Example: Two Contracts, Same Revenue, Different Cash
Consider a software services company with $10M annual revenue.
- Contract A: monthly in arrears, net 30, acceptance is automatic, credits limited to documented SLA misses.
- Contract B: quarterly milestones, net 60, customer acceptance required, credits can be applied for “ongoing issues” with broad discretion.
Even if both contracts recognize revenue similarly, Contract B will likely produce higher receivables balances and more variability in collections. In a forecast, you would reflect longer invoicing-to-cash timing for B and apply a higher expected deduction rate based on historical disputes.
Example: Turning Contract Language into Forecast Inputs
When reviewing a contract, convert clauses into measurable forecast assumptions.
- “Invoices are issued after customer acceptance” becomes acceptance lag days.
- “Customer may withhold amounts for disputes” becomes expected withholding percentage and dispute resolution timing.
- “Credits apply for service level failures” becomes credit frequency and credit magnitude.
If the contract does not define measurement or cure steps, treat the related cash impact as uncertain and rely on historical outcomes from similar customers. The goal is not perfection; it’s a forecast that reflects how cash actually moves.
2.5 Identifying Key Risks That Affect Purchase Price Allocation and Financing
Purchase price allocation (PPA) and financing are tightly connected: the way you assign value to assets and liabilities changes taxable income, future depreciation and amortization, and sometimes the cash flows that lenders rely on. The goal in diligence is not to list every possible risk, but to identify the few that can materially change (1) the PPA outcome, (2) the debt capacity, or (3) the post-close cash available for debt service.
Foundational Risk Categories That Drive PPA and Financing
Start with the risks that sit closest to the accounting mechanics.
-
Valuation input risk: If the purchase price is allocated using weak or inconsistent inputs, the resulting asset values can swing. Example: a customer list valued using outdated churn assumptions can lead to an overstatement of intangible assets, which then changes amortization expense and affects lender-focused cash flow metrics.
-
Classification risk: Some items are easy to misclassify between goodwill, identifiable intangibles, and assumed liabilities. Example: a long-term service contract that is actually transferable and separable may be treated as goodwill if diligence fails to document transferability and customer-specific economics.
-
Measurement risk: PPA requires estimates for useful lives, impairment indicators, and the timing of cash flows. Example: if you assume a 10-year useful life for a technology intangible but the underlying contracts and staffing model support only 5 years, amortization will be understated in the early years.
-
Liability completeness risk: Understated liabilities can inflate equity value and distort both PPA and financing. Example: an unrecorded warranty reserve can reduce future cash, lowering debt service coverage and increasing covenant pressure.
-
Working capital and cash conversion risk: Financing models often assume a working capital target. If the target is wrong because of hidden receivables quality issues, the first months after close can be cash-draining. Example: receivables include a large portion of disputed invoices; the seller may show “current” balances, but collections lag and the buyer funds the gap.
Risk Mapping to PPA Outcomes
Use a simple logic chain: risk → accounting estimate → PPA line item → cash flow impact → financing impact.
- Customer-related risk (churn, contract terms, transferability) can change the valuation of customer relationships and thus amortization.
- Technology-related risk (roadmap feasibility, IP ownership, staffing continuity) can change the valuation and useful life of developed technology.
- Brand-related risk (market evidence, trademark ownership, marketing spend sustainability) can shift value between goodwill and identifiable intangibles.
- Contingent liability risk (litigation, tax exposures, environmental matters) can change assumed liabilities and reduce purchase price allocation to assets.
A practical diligence habit: for each risk, document the specific evidence you will use to support the estimate. If the evidence is thin, treat the risk as material until you can strengthen it or adjust the financing assumptions.
Risk Mapping to Financing Constraints
Lenders care about cash generation and downside protection. Identify risks that can change cash flow timing or covenant headroom.
- Debt capacity risk: If EBITDA is adjusted for one-time items incorrectly, debt capacity can be overstated. Example: “one-time” legal costs recur annually due to a recurring compliance issue.
- Covenant risk: If amortization and interest are modeled inconsistently with the expected PPA, covenant calculations can be off. Example: a higher intangible valuation increases amortization, lowering EBITDA-based covenants depending on the covenant definition.
- Liquidity risk: If working capital is not truly normal, the buyer may need additional cash to fund operations. Example: inventory turns are slower than reported because of obsolete stock hidden in “finished goods.”
Mind Map: Of Key Risks and Their Effects
Concrete Examples of Risk Identification in Diligence
Example 1: Customer relationships misvaluation
- Observation: churn is reported as “industry average,” but the company’s top 20 customers are on different contract terms.
- Risk: classification and valuation input risk.
- Diligence action: reconcile churn by cohort and contract type; confirm whether contracts are transferable or dependent on the seller’s relationships.
- Financing effect: if customer intangibles are overstated, amortization may be higher than modeled, and covenant headroom can shrink.
Example 2: Warranty reserve understatement
- Observation: warranty expense is low relative to peers, but returns data shows a lag.
- Risk: liability completeness and working capital risk.
- Diligence action: test returns and warranty claims after period end; review historical claim development.
- Financing effect: cash shortfalls can force covenant waivers or additional equity funding.
Example 3: Working capital target mismatch
- Observation: the seller proposes a working capital target based on “average” balances.
- Risk: cash conversion risk.
- Diligence action: normalize receivables aging, identify disputed invoices, and separate seasonal inventory.
- Financing effect: the buyer’s first-quarter cash flow can miss lender thresholds even if long-run EBITDA looks fine.
A Systematic Diligence Workflow to Keep Risks Actionable
- List estimates that feed PPA: intangibles, useful lives, contingent liabilities, and working capital true-ups.
- Attach evidence to each estimate: contracts, IP registrations, claim development, aging reports, and board minutes.
- Quantify sensitivity where it matters: focus on risks that change amortization, assumed liabilities, or cash conversion.
- Translate to financing impacts: map each quantified risk to covenant definitions, debt capacity, and liquidity buffers.
- Decide how to manage: strengthen diligence evidence, adjust purchase price mechanics, or revise financing assumptions and protections.
When this workflow is followed, the risk list stops being a spreadsheet of worries and becomes a set of decisions that directly shape both PPA outcomes and the financing plan.
3. Acquisition Financing Fundamentals and Capital Structure Design
3.1 Choosing the Acquisition Capital Stack and Understanding Its Tradeoffs
A capital stack is the order of who gets paid first, second, and last when cash comes in or the business runs into trouble. In an acquisition, the stack typically combines equity, senior secured debt, and sometimes mezzanine or preferred equity. The choice is not just about “how much debt” but about how risk and control are allocated across parties.
Core Building Blocks
Equity is the residual claim. If the business performs, equity captures upside; if it underperforms, equity absorbs losses first. Equity is flexible on timing, but it is expensive in return terms because lenders will not take the same risk.
Senior secured debt is paid before other claims and is usually backed by collateral. It tends to have lower interest rates than riskier layers, but it comes with covenants and limits on actions like additional borrowing, dividend payments, and sometimes asset sales.
Mezzanine debt or preferred equity sits between senior debt and common equity. It often carries higher interest or preferred return and may include equity-like features such as warrants or conversion rights. It can reduce the amount of common equity needed, but it increases fixed obligations and can tighten operating flexibility.
Tradeoffs That Actually Matter
-
Cash flow sensitivity: Fixed payments (interest, preferred returns, amortization) reduce the room for operational swings. A stack with heavy fixed obligations can still work, but the model must show coverage under realistic downside assumptions.
-
Covenants and operational constraints: Senior debt covenants can force management to act early—sometimes before the business is ready. For example, a covenant tied to leverage may trigger if EBITDA dips due to one-time costs or customer churn.
-
Priority in distress: In a downside scenario, the stack determines who takes the hit. If lenders have strong security and enforcement rights, equity may be effectively “out of the game” even before a formal default.
-
Flexibility for value creation: Operational improvement often requires spending and timing. If the stack restricts capex, working capital movements, or acquisitions, the plan can stall.
-
Negotiation leverage: More senior debt can mean more lender involvement in reporting and approvals. That can be helpful for discipline, but it can also slow decisions.
A Systematic Selection Process
Start with the business’s cash generation profile. Then match it to the payment profile of each layer.
- If cash flows are stable and predictable, senior secured debt can be the workhorse layer.
- If cash flows are lumpy due to seasonality or project-based revenue, the stack should include more flexibility, such as interest-only periods, longer maturities, or a smaller fixed-payment burden.
- If the acquisition requires near-term investment to realize synergies, avoid a stack that forces immediate deleveraging at the expense of execution.
Next, test the stack against covenant mechanics. A common mistake is modeling only interest coverage while ignoring leverage covenants and liquidity requirements. For instance, a company might cover interest comfortably but still breach a leverage threshold after working capital absorbs cash.
Finally, align the stack with the value creation plan. If the plan depends on reducing working capital, the stack should not punish the period when cash is temporarily tied up. If the plan depends on margin expansion, the stack should tolerate the ramp period.
Mind Map: Capital Stack Components and Tradeoffs
Example: Choosing Between Two Stacks
Consider a target with EBITDA of $50 million and expected annual free cash flow conversion of 70% after normalization. Two financing options are on the table.
Stack A uses more senior secured debt and less equity. The interest rate is lower, but the leverage covenant is tight: it requires leverage below a set threshold each quarter. During the first year, the operating plan includes inventory reduction and pricing resets. Inventory reduction can temporarily increase cash needs, and pricing resets can delay margin improvement. The model shows interest coverage stays above 2.5x, but leverage breaches in Q3 due to EBITDA normalization timing.
Stack B uses less senior debt and more mezzanine or equity. The fixed return is higher, but the covenant headroom is wider and liquidity buffers are larger. The same operating plan now fits the covenant calendar because the business has time to complete the pricing and cost initiatives before leverage tightens.
The point is not that one stack is “better.” Stack A can be attractive when execution is fast and cash conversion is reliable. Stack B can be safer when timing matters more than headline cost of capital.
Practical Checklist for the Deal Team
- Confirm which covenants exist and when they are tested.
- Map each value creation initiative to the months it affects cash flow.
- Ensure the model includes working capital timing, not just EBITDA.
- Check whether the stack restricts actions needed for execution.
- Verify that the lender reporting package matches the operating cadence.
A well-chosen stack is the one that keeps the business running while the plan runs its course. If the stack forces management to manage the covenant instead of the business, it will eventually cost more than it saves.
3.2 Modeling Debt Capacity Using Cash Flow and Covenant Constraints
Debt capacity is the amount of borrowing a business can support while staying within lender rules and still paying for day-to-day operations. In practice, you model it by combining (1) cash flow available for debt service and (2) covenant headroom, then translating both into a maximum sustainable debt level.
Step 1: Start with Cash Flow That Actually Pays Debt
Use a cash flow view, not just earnings. A simple starting point is:
- EBITDA (or operating cash proxy)
- Less cash taxes (based on normalized earnings and tax structure)
- Less maintenance capital expenditures (the “keep the lights on” number)
- Less required working capital investment (inventory, receivables, payables)
- Equals cash available for debt service (before interest and principal)
Easy example: Suppose a target generates $20.0m EBITDA. Normalized cash taxes are $3.0m, maintenance capex is $2.0m, and working capital consumes $1.5m per year. Cash available for debt service is $20.0m − $3.0m − $2.0m − $1.5m = $13.5m.
This $13.5m is the pool you test against interest-only and amortization requirements. If your model assumes aggressive working capital releases or underestimates maintenance capex, you’ll overstate capacity. Lenders tend to notice when cash flow assumptions are “creative.”
Step 2: Translate Cash Flow Into Debt Service Coverage
Most deals use one or more coverage ratios. Common ones include:
- Interest Coverage: EBITDA or operating cash divided by interest expense
- Debt Service Coverage: cash available for debt service divided by total debt service (interest + scheduled principal)
A practical approach is to model debt service explicitly:
- Interest expense = opening debt × interest rate (with any hedges modeled)
- Scheduled principal = amortization schedule
- Total debt service = interest + principal
Then compute coverage:
- Debt Service Coverage = cash available for debt service ÷ total debt service
Easy example: If cash available for debt service is $13.5m and total debt service is $10.0m, coverage is 1.35x. If the covenant requires 1.25x, you have 0.10x headroom.
Step 3: Model Covenant Mechanics, Not Just Ratios
Covenants are rules with definitions. The same ratio can behave differently depending on how EBITDA is adjusted, how cash taxes are treated, and whether the lender uses trailing twelve months or a forward-looking test.
Key covenant modeling choices:
- Test period timing: monthly/quarterly, trailing twelve months, or annual
- EBITDA definition: add-backs, exclusions, and whether they are capped
- Leverage vs. coverage: leverage covenants often use net debt
- Net debt definition: includes cash netting rules and treatment of restricted cash
- Cure rights: whether you can fix a breach via equity injection or asset sales
A simple modeling habit: create a “covenant definition” tab that mirrors the credit agreement language in plain numbers. Then reference it in the main model so you don’t accidentally use the wrong EBITDA.
Step 4: Build a Debt Capacity Waterfall
Debt capacity is rarely a single number. Use a waterfall that shows how constraints reduce the maximum.
Waterfall example:
- Start with a “cash flow limit” based on coverage.
- Apply a “covenant limit” based on the strictest covenant test.
- Apply a “liquidity limit” if the credit agreement requires a minimum cash balance or limits restricted payments.
- The smallest result is your maximum sustainable debt.
Step 5: Identify the Binding Constraint with Period-by-Period Testing
Capacity can be highest in year 3 and lowest in year 1 because of ramp-up costs, one-time working capital needs, or covenant test timing. Model at least quarterly (or monthly if the credit agreement tests that way) for the first year.
Easy example: A company plans a $2.0m inventory build in the first quarter to support a new contract. Even if annual cash flow looks fine, the covenant test might fail in that quarter because working capital consumes cash and reduces coverage.
Step 6: Stress the Assumptions That Actually Move Covenants
Instead of random sensitivity noise, stress the drivers that change covenant math:
- Revenue and gross margin (affects EBITDA)
- Working capital days (affects cash available for debt service)
- Maintenance capex (affects cash available)
- Interest rate (affects debt service)
- Amortization schedule (affects principal)
Example: If interest rate increases by 100 bps on $60m debt, annual interest rises by about $0.6m. If coverage headroom is only $0.4m, the covenant becomes the binding constraint.
Step 7: Convert Maximum Debt Into a Structuring Output
Once you have maximum sustainable debt, translate it into structuring terms:
- Debt amount and tranche mix (term loan vs. revolver)
- Amortization level and expected paydown
- Interest rate assumptions and hedging treatment
- Equity contribution timing to preserve covenant headroom
A clean final check: ensure the model shows covenant compliance under the base case and that the “worst quarter” has measurable headroom. If headroom is negative, the structure is not merely “tight”—it’s structurally inconsistent with lender definitions.
3.3 Structuring Equity Contributions and Managing Return Profiles
Equity is the part of the capital stack that takes the first hit and gets the last payoff. That sounds dramatic, but it’s actually useful: it forces you to be explicit about what risks you’re paying for and what outcomes you’re targeting. Structuring equity contributions means deciding (1) how much equity goes in, (2) when it goes in, (3) what rights it carries, and (4) how returns are measured and distributed.
Foundational Concepts for Equity Design
Start with three building blocks: ownership, timing, and priority.
- Ownership determines who benefits from value creation. If you and a co-investor contribute different amounts, you need a mechanism that maps contributions to ownership or to economic entitlements.
- Timing matters because equity invested earlier compounds longer. A delayed equity tranche can be cheaper in nominal terms but expensive in return terms.
- Priority determines who gets paid first when cash is distributed. In many deals, equity is not one bucket; it’s split into classes or layers with different distribution rules.
A practical way to keep this grounded is to tie equity structure to the cash flow story you already built in the financing model: what cash is available for debt service, what remains for distributions, and what must be retained for working capital and capex.
Equity Contribution Mechanics
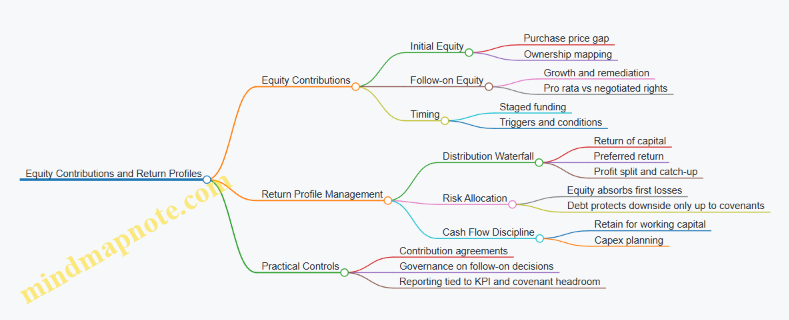
Equity contributions typically come in two forms: initial equity at closing and follow-on equity later.
- Initial equity covers the purchase price gap after debt and any seller financing. Example: A sponsor buys a company for $100 million. Debt provides $70 million. The remaining $30 million is equity. If the sponsor brings $25 million and a partner brings $5 million, the economic deal must reflect that split.
- Follow-on equity funds growth, repairs, or covenant headroom. Example: After closing, the business needs $6 million for a new ERP rollout and working capital build. If the original equity investors fund it pro rata, distributions later may be reduced until the new capital is repaid under the deal’s return rules.
To manage return profiles, you also decide whether equity is paid-in fully at closing or staged. Staging can reduce early cash outlay, but it increases the need for clear triggers: what conditions require the follow-on, and what happens if they are not met.
Return Profile Basics and Distribution Logic
Return profiles are governed by distribution waterfalls. Even without getting lost in legal drafting, you can think in terms of three steps: return of capital, preferred return, and catch-up or split.
- Return of capital: investors get their contributed equity back before profits are split.
- Preferred return: investors earn an agreed rate on unreturned capital.
- Profit split: after the above, remaining proceeds are shared between investors and the sponsor.
Example with simple numbers: Suppose investors contribute $30 million. Preferred return is 8% annually, and the deal exits in year 4 with $45 million of equity proceeds available for distribution after debt and transaction costs. If the preferred return and return of capital are satisfied, the remaining $15 million becomes the profit pool subject to the negotiated split. The exact split depends on the waterfall design, but the logic stays consistent.
Mind Map: Equity Contributions and Return Profiles
Advanced Details That Prevent Misalignment
-
Pro Rata vs Non-Pro Rata Follow-On: If follow-on is not pro rata, you need a clear economic adjustment. Example: Investor A funds an extra $3 million to keep the company compliant with a liquidity covenant. If Investor B doesn’t fund, Investor A may receive additional units or a higher share of future distributions. Without this, the non-funding investor can benefit from the funding without paying for it.
-
Equity Rights and Control: Equity structure can include voting rights tied to major decisions, such as approving budgets, incurring debt, or changing business plans. Example: If the company wants to increase capex beyond the approved plan, the sponsor may require investor consent. This protects equity from being diluted by operational decisions that shift risk.
-
Return Measurement Consistency: Use the same basis for return calculations across modeling and documentation. Example: If your model assumes transaction costs are deducted from exit proceeds, but the legal waterfall treats them differently, the realized return can diverge from what was underwritten.
-
Linking Equity to Operational Milestones: Follow-on funding can be tied to measurable conditions. Example: Release $2 million only after the business hits a working capital target for two consecutive quarters. This reduces the chance that equity becomes a blank check.
Worked Example: Two Investors, One Deal, Different Timing
Assume a $100 million purchase with $70 million debt and $30 million equity. Investor X contributes $20 million at closing; Investor Y contributes $10 million at closing. In year 1, a $5 million follow-on is required. Investor X funds the full $5 million; Investor Y funds $2 million and declines $3 million.
If the deal is pro rata, Investor Y would have funded $2.5 million, so declining $0.5 million creates a mismatch. A well-structured agreement resolves this by either (a) issuing additional equity to Investor X for the shortfall, or (b) adjusting the distribution waterfall so Investor X receives a larger share until the economics catch up. The key is that the return profile reflects both the timing and the risk each investor actually took.
The goal of equity structuring is not to make returns look pretty on paper. It’s to ensure that when cash moves—at closing, during follow-ons, and at exit—the economics match the contributions and the decisions that created or protected value.
3.4 Selecting Interest Rate and Amortization Structures for Predictable Cash Flows
Predictable cash flows start with two knobs: the interest rate path and the amortization schedule. Together they determine how much cash goes to debt service each period, how sensitive that cash is to rate changes, and how quickly principal is paid down. The goal is not “lowest cost,” but “manageable variability” that still supports the equity return target.
Foundational Concepts That Drive Cash Predictability
Interest rate type controls payment sensitivity.
- Fixed rate: the interest portion stays constant (ignoring fees and step-ups). This is easiest for budgeting.
- Floating rate: interest changes with a reference rate (often SOFR or similar). Predictability depends on how much the reference rate can move and how quickly the loan reprices.
Amortization structure controls principal paydown timing.
- Straight-line amortization: principal reduces evenly over time, producing a smoother decline in interest expense.
- Back-ended amortization: little principal early, larger payments later. This can preserve early cash but concentrates repayment risk.
- Bullet maturity: principal paid at the end. Interest-only periods can look great on a cash flow statement until the maturity wall arrives.
A practical rule: if your operating plan is sensitive to demand swings, prefer structures that keep debt service stable even when revenue is not.
Choosing Between Fixed and Floating Rates
Start with a simple question: “How much payment variability can the business absorb without breaking covenants or forcing equity injections?” Then map that to the loan’s rate mechanics.
Example: fixed vs floating on the same debt amount
- Debt: $50 million
- Margin over reference: 4.00%
- Reference rate today: 5.00%
- Term: 5 years
If fixed is set at 9.50% all-in, annual interest is about $4.75 million. With floating, if the reference rate rises to 6.50% while margin stays the same, the all-in rate becomes 10.50% and annual interest becomes about $5.25 million. That extra $0.50 million per year is not theoretical; it directly competes with operating cash for working capital and capex.
To keep the decision grounded, model at least two reference-rate scenarios and check covenant headroom under each.
Selecting Amortization That Matches Operating Reality
Amortization should mirror how quickly the business can reliably generate excess cash.
Example: straight-line amortization for stable cash generation
- Debt: $30 million
- Term: 6 years
- Straight-line principal: $5 million per year
Interest declines each year as principal reduces. Early years still have meaningful interest, but the principal schedule prevents a large maturity payment. This is often a good fit for businesses with steady recurring revenue.
Example: back-ended amortization for early cash preservation
- Debt: $30 million
- Term: 6 years
- Principal: $1 million per year for years 1–5, $25 million in year 6
Early debt service is lower, which can support an operational improvement plan. However, the year-6 payment must be funded through refinancing, sale proceeds, or a large cash build. If your exit plan relies on a sale, confirm that the sale proceeds timing aligns with the maturity date.
Example: bullet maturity when exit timing is certain
Bullet structures can be rational when the business has a clear path to refinance or exit at maturity. If that path depends on multiple moving parts, bullet risk becomes a cash-flow planning problem rather than a financing choice.
Coordinating Rate and Amortization in the Debt Service Profile
Interest rate and amortization interact. A floating-rate loan with back-ended amortization can create a “double squeeze”: higher interest during years when principal is still large. Conversely, a fixed-rate loan with straight-line amortization often produces the most stable debt service profile.
Use a debt service schedule to compare structures period by period.
Simple comparison framework
- Build a monthly or quarterly debt service schedule.
- Apply interest mechanics (fixed or floating with repricing dates).
- Apply principal schedule (straight-line, back-ended, bullet).
- Compute coverage ratios and covenant compliance for each scenario.
Practical Modeling Steps for Deal Teams
Step 1: Define the “cash available” metric consistently
Use the same cash measure that the covenants or internal targets reference (for example, cash flow available for debt service). Inconsistent definitions create false comfort.
Step 2: Model repricing timing for floating rates
If the loan reprices quarterly, don’t assume annual averages. Payment timing affects liquidity.
Step 3: Include fees and interest capitalization only when contractually allowed
Upfront fees reduce net proceeds; capitalization changes when cash leaves the business. Both matter for predictability.
Step 4: Stress the combination, not just each part
Run scenarios that change both reference rates and operating cash. A stable operating plan with a rising rate is one thing; a weaker operating plan with a rising rate is the real test.
Mind Map: Interest Rate and Amortization Choices
Example: Turning the Choice Into a Decision Rule
If the business can only tolerate limited variability in cash available for debt service, choose either (a) fixed rate with back-ended amortization capped by a realistic refinancing plan, or (b) floating rate only when amortization is front-to-mid loaded enough to reduce principal risk early. If the operating plan is volatile, avoid bullet structures unless the exit proceeds timing is contractually and operationally supported.
The “best” structure is the one that keeps the debt service profile within the business’s cash reality across the scenarios you actually care about.
3.5 Coordinating Financing Terms with Purchase Price and Closing Conditions
Financing terms and deal economics are not separate workstreams; they are one system. If you coordinate them early, you avoid the classic problem where the purchase price looks fine on paper, but the lender’s conditions force a lower cash contribution, a different timing of payments, or a working-capital target that quietly changes the effective price.
Start with the Cash Waterfall Logic
Begin by writing the cash waterfall for closing and the first 90 days. List, in order: seller proceeds, transaction fees, debt funding, equity funding, and any escrow or holdback. Then map each financing term to a line item.
Example: Suppose the purchase price is $50 million, funded by $35 million of first-lien term loan and $10 million of equity, with $5 million placed in an escrow for indemnities. If the lender requires a minimum cash balance of $3 million at closing, that cash must come from somewhere—often from reducing seller proceeds or increasing equity. Your “purchase price” stays $50 million, but the seller’s net proceeds and your liquidity profile change.
Align Purchase Price Adjustments with Lender Definitions
Purchase price adjustments usually include working capital, net debt, and sometimes transaction expenses. Lenders, however, define these terms for covenant and borrowing base purposes. Coordinate definitions so you don’t create a mismatch where the purchase price adjustment reduces cash, but the lender still measures leverage using a different baseline.
Practical approach:
- Use the same accounting policy hierarchy for working capital as the lender’s financial reporting requirements.
- Ensure “net debt” includes the same items the lender excludes or includes in its leverage calculation.
- Confirm whether transaction fees are treated as paid at closing or capitalized, because that affects both equity needs and covenant compliance.
Example: If the purchase agreement treats certain restructuring costs as an adjustment that reduces purchase price, but the credit agreement treats them as an add-back only after a specified date, you can end up with a temporary leverage spike that triggers a covenant default risk.
Tie Closing Conditions to Operational Reality
Closing conditions are where financing meets the real world: consents, payoff letters, lien releases, and deliverables. Coordinate them with the purchase agreement’s timing so you don’t accidentally create a situation where the lender is ready to fund, but the seller is not ready to deliver.
Common coordination points:
- Payoff mechanics: confirm the exact payoff letter timing and whether any interim interest accrues before funding.
- Lien releases: specify who pays for releases and the expected turnaround time.
- Material contracts: align “required consents” lists across diligence, purchase agreement schedules, and lender deliverables.
Example: If a key customer contract requires consent to assign, and the lender conditions funding on receipt of that consent, then the purchase agreement should reflect the same condition and the same target date. Otherwise, you may negotiate a long-stop date that is inconsistent with the lender’s funding timeline.
Coordinate Debt Terms with Earnouts and Contingent Consideration
Earnouts and contingent consideration can be cash-flow friendly or cash-flow hostile depending on how they interact with leverage covenants and restricted payments.
Key coordination questions:
- Are earnout payments treated as permitted payments under the credit agreement?
- Does the lender restrict payments when leverage exceeds a threshold?
- Are earnout metrics measured by GAAP, non-GAAP, or a contract-defined methodology?
Example: If the purchase agreement includes a $6 million earnout payable over two years, but the credit agreement restricts distributions and certain payments when leverage is above 3.5x, you may need to structure the earnout as a smaller upfront amount plus a larger later amount, or negotiate a carve-out for earnout payments.
Use Covenants to Shape the Economic Deal, Not Just Compliance
Covenants influence economics because they constrain what you can do with cash. Coordinate the covenant package with the purchase agreement’s cash demands: working capital true-ups, indemnity escrows, and any management rollover.
A simple method:
- Identify the tightest covenant test date in the first year.
- Build a “covenant cash bridge” that shows how closing cash, working capital, and interest expense flow into the covenant calculation.
- Stress the bridge for one downside you actually expect, like a slower collection cycle.
Example: If the lender’s leverage covenant is tested quarterly and requires a minimum EBITDA level, then a purchase price adjustment that reduces cash but doesn’t change EBITDA can still pressure liquidity. You may need to adjust the working capital target or negotiate a temporary covenant relief mechanism.
Mind Map: Financing Coordination with Deal Terms
Example: A Coordinated Closing Plan
Assume a $60 million purchase price with $42 million first-lien debt, $12 million equity, and $6 million escrow. The lender requires minimum cash of $2 million at closing and restricts certain payments when leverage exceeds 3.75x.
Integrated solution:
- Set the working capital target so that the purchase agreement’s true-up does not drain cash below the lender’s minimum.
- Draft the escrow release schedule to match the lender’s permitted payment rules.
- Include the same consent list in both the purchase agreement and lender closing conditions, with a single long-stop date that reflects consent turnaround.
Result: the “headline” purchase price remains $60 million, but the effective economics are protected because the cash waterfall, definitions, and conditions all point in the same direction.
Closing Checklist for This Coordination
- Definitions match across purchase agreement and credit agreement.
- Cash waterfall includes lender minimum cash and escrow mechanics.
- Earnout and contingent payments are permitted under the credit agreement.
- Closing conditions and long-stop dates are aligned to the same deliverables.
- Covenant cash bridge is built for the first test date, not just the model’s base case.
4. Purchase Price Mechanics and Contractual Deal Terms
4.1 Negotiating Purchase Price Adjustments and Working Capital Targets
Purchase price adjustments and working capital targets are the deal’s “plumbing.” They determine how much cash the buyer expects to receive on closing and how much the seller keeps if the business is short on cash-like working capital. Done well, they reduce surprises; done poorly, they create arguments that consume time and goodwill.
Core Concepts That Drive the Negotiation
Start with the target: working capital is usually defined as current assets minus current liabilities, measured on a consistent basis. The negotiation is less about the math and more about consistency—what counts as current, how items are valued, and how unusual items are treated.
Then define the adjustment mechanism. Common structures include:
- Locked-box: price is fixed; the seller is responsible for maintaining the business in a “normal” state until closing.
- Closing accounts: price is adjusted after closing based on actual working capital.
- Hybrid: a target with a limited true-up plus specific carve-outs.
For closing accounts, the buyer typically sets a target working capital amount and a measurement date. The seller negotiates the definition, valuation rules, and dispute process.
Setting a Working Capital Target Without Guesswork
A practical target comes from historical normalization, not wishful thinking. Use at least three periods (often the last 12–24 months) and adjust for:
- One-time items (settlements, litigation costs, unusual inventory write-downs)
- Seasonal effects (peak vs. off-peak inventory and receivables)
- Timing effects (customer billing cycles, supplier payment terms)
Example: A distributor’s working capital swings because it builds inventory before seasonal demand. If you set the target using only the peak month, the buyer overpays for inventory that will naturally decline. If you set it using only the trough month, the seller may be forced to fund working capital that will be replenished immediately after closing. The fix is to use a normalized average tied to the business cycle, then document the method.
Defining Working Capital Precisely
Negotiation usually turns on a handful of definitions. Agree on each item’s treatment:
- Cash and cash equivalents: typically excluded from working capital.
- Debt-like items: exclude short-term borrowings and interest payable.
- Accounts receivable: define whether disputed invoices are excluded, and how allowances are calculated.
- Inventory: specify valuation method (FIFO/LIFO/weighted average), and whether reserves for obsolescence are required.
- Accounts payable and accrued expenses: decide whether accruals must be “bona fide” and consistent with past practice.
A seller-friendly approach is to anchor valuation to historical accounting policies, then allow limited adjustments for clearly identified normalization items. A buyer-friendly approach is to require conservative valuation and explicit reserves for known risks (for example, slow-moving inventory categories).
Purchase Price Adjustment Mechanics That Reduce Disputes
The adjustment clause should specify:
- Measurement date: often the closing date or a short period after.
- Calculation statement: who prepares it (buyer or seller) and the timeline.
- Review and dispute process: how disagreements are resolved, including an independent accountant.
- Interest on the true-up: to avoid “free financing” during the dispute.
Example: If the buyer prepares the closing statement, the seller should negotiate access to the underlying schedules and a clear timeline for objections. If the seller prepares it, the buyer should negotiate audit rights and a requirement that the seller’s accountant uses the agreed definitions.
Working Capital Targets with Practical Tolerances
Targets often include a tolerance band (a “de minimis” range) so minor measurement differences don’t trigger disputes. The seller may accept a tighter tolerance if the definitions are clear; the buyer may accept a wider tolerance if the seller’s accounting discipline is strong.
Example: Suppose the target is $10.0 million and the tolerance is ±$0.25 million. If actual working capital lands at $10.18 million, no adjustment occurs. This prevents the parties from litigating whether a few invoices were classified as current or non-current.
Carve-Outs and Quality Controls
Carve-outs prevent the target from being distorted by items that are not part of the operating working capital. Common carve-outs include:
- Transaction expenses and fees
- Taxes payable that are not part of operating cycle
- Restructuring costs approved in the deal documents
Quality controls matter too. Require that the seller’s closing accounts follow the agreed accounting principles and that any deviations are explained with supporting schedules.
Mind Map: Purchase Price Adjustments and Working Capital Targets
Example: A Clean Negotiation Outcome
Assume a target working capital of $12.0 million. The buyer’s draft includes a strict inventory reserve policy that differs from the seller’s historical practice. The seller counters with a reserve approach that matches prior write-down rates, plus an additional reserve only for clearly identified obsolete SKUs listed in an agreed schedule. The parties also agree on a tolerance band of ±$0.3 million and a dispute process with a neutral accountant.
Result: the adjustment becomes a calculation exercise rather than a debate about accounting philosophy. The buyer still gets protection against genuine deterioration, and the seller avoids open-ended reclassification.
Practical Checklist for the Negotiation
- Confirm the working capital formula and every included/excluded line item.
- Document how receivables allowances and inventory reserves are determined.
- Use normalized historical periods and explain seasonality adjustments.
- Set timelines and a dispute mechanism that both sides can live with.
- Add a tolerance band and define when adjustments apply.
- Include carve-outs for transaction and non-operating items.
When these elements are explicit, the adjustment clause does what it should: it settles the price based on agreed definitions, not on who can argue longer.
4.2 Designing Earnouts and Contingent Consideration with Measurable Metrics
Earnouts are contractual promises that part of the purchase price depends on future performance. They work best when the metrics are (1) measurable, (2) controllable by the seller and buyer in a predictable way, and (3) insulated from accounting games. Think of an earnout as a scoreboard with rules, not a vague hope.
Foundational Principles for Metric-Driven Earnouts
Start with the business driver behind the earnout. If the goal is revenue retention, use a retention metric tied to customer cohorts. If the goal is margin improvement, use gross margin or contribution margin with clear definitions. Avoid metrics that can be moved by changing internal allocations without changing operations.
Next, define the measurement window and observation method. A one-year earnout measured annually is simple, but quarterly measurement can reduce disputes because performance is visible earlier. Measurement frequency should match how quickly the underlying driver changes.
Finally, decide who controls the levers. If the buyer controls pricing, staffing, and product roadmap, the earnout should reflect that reality. Otherwise, the seller may be asked to “win” on outcomes they can’t influence.
Choosing Metrics That Survive Real-World Accounting
Use metrics that map cleanly to the deal thesis and can be calculated from the company’s normal reporting. Common choices include:
- Revenue-based metrics: net revenue, recurring revenue, or revenue from defined customer cohorts.
- Profit-based metrics: gross profit, EBITDA, or contribution margin.
- Operational metrics: units shipped, on-time delivery, or defect rates, when they directly drive financial results.
To keep the metric from turning into a debate, define the calculation line-by-line. Specify revenue recognition approach, treatment of returns and credits, and whether intercompany sales are included. If you use EBITDA, define adjustments and require a reconciliation to the audited or reviewed financial statements.
Designing the Earnout Formula and Payment Mechanics
A measurable earnout usually has a threshold, a target, and a cap.
- Threshold: below this level, earnout is zero.
- Target: at this level, earnout equals a stated percentage of the contingent consideration.
- Cap: above this level, additional performance does not increase payment.
This structure prevents the contract from becoming an open-ended “everything above” calculation.
Then define the payment timing and settlement method. For example, the buyer can calculate the earnout within 30 days after period end, provide a statement with supporting schedules, and pay within 15 days after the seller’s review. Include a dispute window with a clear tie-breaker process.
Allocating Control and Guardrails
Earnouts fail when one party can change the rules mid-game. Add guardrails that restrict actions that would intentionally depress the earnout metric.
Examples of guardrails include:
- Operating covenant: buyer must operate the business in the ordinary course consistent with past practice.
- No intentional diversion: buyer cannot shift sales to affiliates to reduce the metric.
- Consistent accounting: definitions and calculation methods cannot be changed without mutual agreement.
Also include a “seller cooperation” clause. If the seller must provide transition support, define scope, duration, and service levels so the buyer cannot claim poor performance due to missing inputs.
Example: Revenue Retention Earnout with Cohort Definitions
Assume a seller exits a subscription business. The buyer wants to ensure customers stay.
- Metric: “Net revenue retained from NewCo customer cohort acquired during the 6 months before closing.”
- Cohort rule: customers billed at least once in the cohort window and still active at the start of the measurement period.
- Retention definition: retained revenue equals revenue from those customers during the earnout year, net of refunds and credits.
- Formula: earnout = 20% of retained revenue above a threshold of $10 million, capped at $3 million.
To avoid disputes, the contract specifies how “active” is determined (for example, billed within the last 30 days) and how credits are applied.
Example: Margin Earnout with Defined Adjustments
Assume the deal thesis is margin expansion through process improvements.
- Metric: “Gross margin dollars” for the product line sold at closing.
- Calculation: gross margin dollars = net revenue minus cost of goods sold, both defined per the company’s standard chart of accounts.
- Adjustments: exclude one-time inventory write-downs and restructuring costs using a schedule agreed at closing.
- Formula: earnout pays 10% of incremental gross margin dollars above a baseline gross margin of 35%, capped at $2 million.
This approach avoids EBITDA adjustment sprawl while still acknowledging that unusual items can distort the picture.
Mind Map: Earnout Design with Measurable Metrics
Advanced Details That Prevent Disputes
Disputes usually come from ambiguity, not bad faith. Three details reduce friction.
First, require a calculation package. The buyer should deliver a schedule that shows the metric inputs, the formula application, and the reconciliation to financial statements.
Second, define the baseline clearly. If the earnout compares performance to a baseline, specify whether the baseline is trailing twelve months, last fiscal year, or an agreed normalized figure.
Third, address changes in business scope. If the buyer sells a division or changes product mix, the contract should state whether the metric is adjusted, excluded, or recalculated using a defined allocation method.
A well-designed earnout reads like a set of instructions for computing a number. If both parties can reproduce the result from the same inputs, the contract does its job and everyone can move on.
4.3 Allocating Risk Through Representations Warranties and Indemnities
Representations and warranties (R&Ws) are the seller’s factual promises about the business at signing and closing. Indemnities are the contract’s “if it’s wrong, who pays” mechanism. Together, they allocate risk in a way that is specific enough to be enforceable and practical enough to be priced.
Foundations: What R&Ws Actually Do
Start with the basic division of labor. R&Ws describe facts—tax filings, ownership of assets, accuracy of financial statements, compliance with laws. Indemnities convert a breach into money, usually tied to a defined loss type (tax, third-party claims, direct damages).
A useful mental model is: R&Ws set the standard; indemnities set the consequence. If you only have R&Ws, the buyer may have to prove damages and causation under general law. If you only have indemnities, you may still need R&Ws to define what was promised.
Risk Allocation Principles That Keep Deals from Getting Stuck
- Match the promise to the risk. If the risk is tax exposure, the R&W should be tax-focused, and the indemnity should cover the relevant loss categories.
- Define the loss. “Losses” should specify whether it includes penalties, interest, defense costs, and whether it excludes consequential damages.
- Set a time window. Survival periods determine how long the buyer can bring claims. Longer survival increases seller cost; shorter survival increases buyer risk.
- Control the claim process. Notice, cooperation, and settlement consent rules prevent surprise payments and reduce disputes.
- Coordinate with caps and baskets. Caps limit maximum seller exposure; baskets determine when small claims become payable.
Core R&W Categories and How They Allocate Risk
Financial and accounting. These R&Ws typically cover the accuracy of financial statements and the absence of undisclosed liabilities. Example: if the seller’s working capital target assumed no accrued bonuses, but payroll records show an unpaid bonus liability, the buyer can claim breach of financial-related R&Ws and seek indemnified losses.
Title and authority. These cover ownership of assets, absence of liens, and corporate power. Example: if a key piece of equipment is subject to a security interest not disclosed, the buyer’s remedy often flows through title R&Ws plus a specific indemnity for lien-related losses.
Compliance and legal. These cover laws, permits, and litigation. Example: if a regulatory inspection found noncompliance before closing and the matter was not disclosed, the buyer can pursue a breach of compliance R&Ws and indemnity for third-party claims or remediation costs.
Taxes. These are usually the most negotiated. Example: if a sales tax audit relates to pre-closing periods and the seller’s filings were incorrect, the buyer wants a tax indemnity that covers assessments, interest, and penalties.
Contracts and customers. These cover material contracts, defaults, and change-of-control clauses. Example: if a major supplier contract allows termination upon change of control and the seller failed to disclose it, the buyer can argue breach of contract-related R&Ws and seek indemnity for resulting losses.
Indemnity Mechanics That Matter in Practice
Indemnities come in different shapes. A common structure is third-party indemnity for claims by others (e.g., lawsuits, tax authorities) and direct indemnity for losses suffered by the buyer without a third-party claim (e.g., undisclosed liabilities).
Key drafting choices:
- Defense and settlement control. If the seller controls the defense, the buyer should still have visibility and consent rights for settlements that impose non-monetary obligations.
- Causation and mitigation. The buyer should be required to mitigate losses where reasonable, but not to take actions that increase seller exposure.
- Exclusions. Many deals exclude consequential damages, lost profits, or punitive damages unless tied to specific indemnity categories.
Disclosure Schedules: The “Reality Check” Tool
Disclosure schedules are where risk allocation becomes concrete. A seller can qualify a warranty by disclosing exceptions. Example: the seller discloses a pending wage claim in the schedules. That disclosure can prevent a breach finding for the general “no litigation” warranty, while still leaving room for a targeted indemnity if the contract provides one.
A practical best practice is to ensure the schedule language is consistent with the warranty text. If the warranty is “no undisclosed material contracts,” but the schedule lists “material contracts” without identifying which ones are exceptions, you’ve created ambiguity that both sides will later interpret with enthusiasm.
Survival Periods, Caps, Baskets, and Claim Thresholds
- Survival periods. Tax and fundamental title warranties often survive longer than general operational warranties.
- Caps. Caps may be a percentage of equity value or enterprise value. Example: a 10% cap means the seller’s total indemnity exposure for capped claims cannot exceed that amount.
- Baskets. A deductible basket means the buyer absorbs losses up to the basket; a tipping basket means once exceeded, the seller pays from dollar one.
These numbers are not just math. They influence behavior: if the basket is high, the buyer may choose to pursue only the largest issues; if the cap is low, the seller may be less motivated to resolve borderline claims early.
Mind Map: R&Ws and Indemnities Risk Allocation
Example: Turning a Warranty Breach Into a Payable Claim
Assume the buyer discovers that a pre-closing environmental inspection resulted in an obligation to remediate a site, but the seller did not disclose it.
- Identify the breached R&W. The buyer points to the compliance and legal warranty and any environmental-specific warranty.
- Confirm the indemnity scope. The buyer checks whether the indemnity covers remediation costs and whether it is direct or third-party.
- Apply limits. The buyer verifies survival timing, whether the claim falls under the cap, and whether the basket threshold is met.
- Follow the claim process. The buyer provides notice, supports the loss with documentation, and coordinates defense if a third-party claim exists.
If the seller had disclosed the inspection in the schedules, the general “no compliance issues” warranty might not be breached. But a targeted environmental indemnity could still apply if the contract explicitly covers known issues.
Practical Checklist for Negotiators
- Tie each major risk to a specific R&W category.
- Ensure each R&W has a matching indemnity remedy where the buyer expects payment.
- Use disclosure schedules to remove ambiguity, not to create it.
- Set survival, caps, and baskets to reflect the risk’s real likelihood and magnitude.
- Draft claim procedures so the buyer can act quickly and the seller can manage defense costs.
When these elements line up, R&Ws and indemnities stop being legal ornamentation and start functioning like a clear risk map—one that both sides can price and enforce.
4.4 Structuring Covenants and Closing Conditions to Protect Value
Covenants and closing conditions are the deal’s “don’t break the toys” rules. Covenants govern behavior after signing; closing conditions govern whether the deal can close at all. Done well, they protect value without turning the transaction into a constant negotiation.
Foundational Concepts and Why They Matter
Start by separating three time windows:
- Signing to Closing: the company is still owned by the seller, but the buyer is exposed to changes.
- Closing to First Reporting: the buyer is now in control, but systems and reporting may lag.
- Ongoing Ownership: covenants and remedies determine how quickly issues surface and how they are handled.
A practical rule: every covenant should map to a specific value driver identified in diligence and modeling. If you cannot point to the value driver, the covenant is probably just legal noise.
Structuring Closing Conditions That Reduce Pre-Closing Risk
Closing conditions typically include:
- Bring-down of representations: key statements must remain true at closing.
- No material adverse change: define “material” and tie it to measurable thresholds.
- Third-party consents: contracts, leases, or licenses that require counterpart approval.
- Absence of injunctions: no legal order blocks the transaction.
- Completion of required actions: for example, payoff letters, releases, or termination of liens.
Example: working capital target protection
If the purchase agreement includes a working capital target, add a closing condition that the seller delivers a closing statement prepared under agreed accounting principles. Then include a dispute mechanism with a short timetable. This prevents the classic problem where the buyer discovers a mismatch weeks later, after the seller is gone.
Example: customer contract consents
Suppose three major customer agreements require consent to assignment. Make consent a closing condition, but also include a fallback: if one consent is delayed, the buyer can either extend the outside date or reduce the purchase price by a defined amount tied to expected churn risk. The key is that the fallback is objective, not a negotiation at closing.
Designing Covenants That Preserve Value After Closing
Covenants fall into two buckets: affirmative (do something) and negative (don’t do something). The best sets are narrow, measurable, and enforceable.
Affirmative Covenants
Common affirmative covenants include:
- Maintain insurance at specified coverage levels.
- Provide financial statements on a defined schedule.
- Maintain books and records consistent with past practice and agreed accounting principles.
- Comply with laws and file required tax returns.
Example: reporting covenant tied to covenant compliance
If debt covenants require a quarterly leverage test, require delivery of the company’s calculation package within a fixed number of days after quarter-end. Include a requirement that the calculation uses the same definitions as the credit agreement. This reduces the risk of “surprise noncompliance” caused by definitional drift.
Negative Covenants
Negative covenants often cover actions that can drain value:
- Restrictions on additional debt or liens.
- Limitations on asset sales outside the ordinary course.
- Restrictions on distributions to equity holders.
- Limits on related-party transactions.
- Restrictions on mergers or changes in business.
Example: asset sale guardrail
If the business sells equipment regularly, don’t ban asset sales. Instead, set a threshold: sales above a certain dollar amount require lender or buyer consent, and sales must be for fair market value. This keeps the covenant from blocking normal operations.
Covenant Design for Debt and Equity Layers
In many deals, there are both credit agreement covenants (for lenders) and shareholder or management covenants (for the buyer). Align them so the company is not forced to comply with conflicting rules.
A simple alignment checklist:
- Definitions match across documents (EBITDA, working capital, permitted payments).
- Reporting deadlines are consistent.
- Consent rights are not contradictory.
- Remedies are coordinated so the same breach does not trigger multiple inconsistent outcomes.
Example: permitted payments and tax distributions
If the company needs to distribute cash to cover shareholder taxes, define permitted payments clearly. Include a cap tied to prior-year tax expense or a formula based on taxable income. Without this, the company either violates the covenant or starves itself of cash needed for owners’ tax obligations.
Remedies and Enforcement That Are Fast Enough to Matter
Covenants without remedies are just suggestions. Remedies should be proportionate and time-bound:
- Cure periods for non-monetary breaches.
- Waiver processes with defined decision timelines.
- Step-in rights only where necessary and clearly limited.
- Default triggers that are specific, not vague.
Example: cure period for reporting delays
If the company misses the reporting deadline, allow a short cure period (for example, a fixed number of days) before a default. Pair it with a requirement to deliver the missing package and explain the cause. This encourages compliance without turning every late report into a crisis.
Mind Map: Covenants and Closing Conditions
Putting It Together with a Cohesive Example
Imagine a buyer acquiring a distributor with thin margins and customer concentration. The buyer’s value driver is cash conversion and stable customer contracts.
- Closing conditions require assignment consents for the top contracts and a bring-down that customer concentration has not worsened beyond a defined threshold.
- Affirmative covenants require weekly cash reporting during the first month and monthly KPI reporting thereafter.
- Negative covenants restrict new liens and require consent for any asset sales above a threshold.
- Remedies include a short cure period for reporting delays and a waiver process with a fixed response time.
The result is a structure that protects the specific levers that move returns, while keeping day-to-day operations from getting stuck in paperwork loops.
4.5 Drafting Practical Disclosure Schedules and Materiality Thresholds
Disclosure schedules are where the legal text meets reality. They list exceptions to the reps and warranties, and they do it in a way that is usable by both lawyers and deal teams. Materiality thresholds determine what must be disclosed, which affects diligence workload, negotiation leverage, and post-close dispute risk.
Start with the Purpose and the Rep-Warranty Structure
Begin by treating disclosure schedules as a map of “what is different from what we promised.” Each schedule section should correspond to a specific set of reps (for example, contracts, litigation, taxes, employee matters). If a schedule section does not clearly tie back to a rep, it becomes harder to defend later.
A practical rule: draft schedules so a reader can answer, “What is the exception, where is it described, and what rep does it modify?” If you can’t answer that in one pass, the schedule needs restructuring.
Define Materiality Thresholds That Match the Risk
Materiality is not one number. Different reps often use different standards, such as “material,” “in all material respects,” “material adverse effect,” or “knowledge-qualified” concepts. Your goal is to make those standards operational.
Use a two-layer approach:
- Quantitative thresholds for items that naturally scale (for example, unpaid taxes, claims amounts, contract termination payments).
- Qualitative triggers for items that scale poorly (for example, regulatory findings, customer concentration risk, or a single contract that is critical even if the dollar amount is modest).
Easy example: If you set a $250,000 threshold for disclosed litigation exposure, a $40,000 claim involving a key license renewal might still be disclosed because it threatens the business continuity rep, even though the amount is small.
Build a Consistent Schedule Template
A consistent template reduces errors and makes updates manageable. For each schedule section, include:
- Reference field to the rep number or sub-rep.
- Exception description written in plain language.
- Supporting detail that points to the underlying document or dataset.
- Materiality note explaining why the item is included or excluded.
If you use internal systems, keep the schedule aligned to how the company tracks facts. For instance, if tax issues are tracked by jurisdiction and tax type, mirror that structure in the schedule.
Draft Exceptions with “Specificity That Holds Up”
A disclosure that is too vague invites arguments about whether it actually qualifies the rep. Specificity does not mean long prose; it means enough detail to locate the issue and understand its scope.
Example: Instead of “Certain customers have disputes,” write “Customer A disputes $180,000 of invoices for delivery timing under Contract 12-34; dispute notice received May 2024; management believes the dispute is not valid; no termination notice issued.” Then attach or reference the dispute notice and the contract excerpt.
Use a Mind Map to Keep the Logic Tight
Mind Map: Disclosure Schedules and Materiality Thresholds
Apply Thresholds to Common Schedule Areas
Contracts: Disclose contracts that are unusual in a way that affects performance or termination rights. A small contract can still be material if it is the only supply source or contains a change-of-control termination right.
Litigation and Claims: Use a dollar threshold for claim amounts, but add qualitative triggers for claims that involve regulators, product safety, or core IP. If a claim is “small but systemic,” it belongs in the schedule.
Taxes: Quantitative thresholds help, but tax disclosures often need jurisdiction-level granularity. A $100,000 underpayment in one jurisdiction may be disclosed if it indicates a pattern that could expand.
Employees and Benefits: Dollar thresholds are less helpful for compliance issues. Disclose matters that could affect plan qualification, wage and hour compliance, or required filings, even when the immediate financial exposure is limited.
Avoid Common Drafting Pitfalls
- Orphan disclosures: An item is disclosed but not tied to a rep section, making it unclear what it qualifies.
- Over-disclosure: Listing everything creates noise and makes it harder to defend what truly matters.
- Under-disclosure by math alone: A threshold-based approach can miss qualitative risk.
- Inconsistent terminology: If “material” is used differently across schedules, disputes get easier to start.
Practical Example: Turning Facts Into a Schedule Entry
Assume the company has a contract with a customer that allows termination for convenience with 30 days’ notice. The contract value is $90,000 annually, below a $250,000 quantitative threshold.
A defensible schedule entry would:
- Identify the contract and counterparty.
- State the termination right and notice period.
- Explain why it is disclosed: it affects revenue stability and ties to the contracts and customer-related reps.
- Reference the contract section and the internal contract summary.
This approach keeps the schedule readable and makes the materiality reasoning explicit.
Final Consistency Check Before Signing
Before the schedules are finalized, run a checklist:
- Every exception has a rep reference.
- Every schedule section has a clear inclusion logic.
- Quantitative thresholds are applied consistently.
- Qualitative triggers are documented in the drafting notes.
- Supporting documents are referenced in a way that a third party can locate.
If you do this, the schedules become less of a legal appendix and more of a structured record of what the buyer needs to know—without turning the deal into a scavenger hunt.
5. Financial Modeling for Acquisition Structuring and Value Creation
5.1 Building a Three Statement Model With Acquisition Financing Integration
A three-statement model ties operating performance to cash, and cash to financing. The goal is simple: every assumption you make about operations must show up in the income statement, then flow into the balance sheet, and finally determine whether the acquisition financing behaves the way your term sheet implies.
Step 1: Start with the Operating Engine
Build the income statement first, because financing should not be used to “fix” operating results.
- Revenue: model by driver (units × price, or contracts × average revenue). Keep it consistent with your diligence view of customer mix.
- Cost of goods sold and operating expenses: separate fixed vs variable where possible. If you only have historical totals, create a reasonable split using cost behavior.
- Depreciation and amortization: link to capex and purchase accounting assumptions later, but create a placeholder now so EBITDA-to-cash logic stays coherent.
Example: If revenue grows 8% annually and gross margin is 35%, then COGS must fall in line with revenue and margin. If you later change financing, you should not have to revisit gross margin.
Step 2: Convert Earnings Into Cash with the Cash Flow Statement
Next, build the cash flow statement using the income statement and working capital logic.
- Cash from operations: start with EBITDA, subtract cash taxes, adjust for working capital changes, and include non-cash items.
- Working capital: model accounts receivable, inventory, and accounts payable using days or turnover assumptions.
Example: Suppose AR is 45 days sales and revenue is $100 million. Average AR is about $12.3 million. If revenue rises to $108 million, AR becomes about $13.5 million, creating a working capital use of roughly $1.2 million. That cash need must appear in cash flow even if net income looks fine.
- Cash from investing: capex and any purchase accounting cash impacts.
- Cash from financing: debt draw, equity contribution, interest, principal repayments, and any fees paid at closing.
Step 3: Integrate Acquisition Financing Into the Balance Sheet
Now connect financing to the balance sheet so the model “balances” for the right reasons.
- Debt: create lines for opening balance, new draws, scheduled amortization, and ending balance.
- Interest expense: calculate from average debt balance and the interest rate terms.
- Equity: include sponsor equity contribution at closing and any subsequent equity injections if your structure requires them.
- Cash: ending cash equals beginning cash plus net change from cash flow.
Example: If you assume a $200 million acquisition with $120 million of term debt and $80 million of equity, then at closing the balance sheet must show debt and equity funding the purchase consideration, with cash reduced by fees and any net working capital adjustments.
Step 4: Add Purchase Price and Purchase Accounting Where It Matters
You don’t need perfect accounting detail to get value creation right, but you do need the parts that affect cash.
- Purchase price allocation drives amortization and depreciation, which affects net income and taxes.
- Goodwill and indefinite-lived intangibles typically do not amortize; finite-lived intangibles do.
- Tax effects: apply tax rates to deductible amortization and interest, and ensure tax cash is consistent with your tax policy assumptions.
Example: If you allocate $30 million to amortizable intangibles with a 10-year life, annual amortization is $3 million. That reduces taxable income and changes cash taxes, which then changes operating cash.
Step 5: Build a Debt Service Logic That Matches the Term Sheet
Financing integration fails when the model treats debt like a static line item.
- Interest: use the correct compounding and payment frequency assumptions.
- Amortization: model scheduled principal repayments and any bullet components.
- Fees: include one-time fees at closing and recurring fees if applicable.
- Covenants: if you track them, compute covenant metrics from the same definitions used in the credit agreement.
Example: If interest is paid quarterly, interest expense in the income statement should reflect accrual, while cash interest in cash flow should reflect payment timing.
Step 6: Reconcile and Stress the Model with Targeted Checks
Use checks that catch structural errors quickly.
- Balance sheet check: assets equal liabilities plus equity every period.
- Cash reconciliation: ending cash on the balance sheet equals ending cash from cash flow.
- Debt reconciliation: ending debt equals opening debt plus draws minus principal repayments.
- Margin and working capital sanity: if revenue rises, AR and inventory should not shrink unless your assumptions say so.
Mind Map: Three Statement Model with Financing Integration
Example: One-Period Walkthrough of the Flow
Assume a period where revenue increases from $100 million to $105 million.
- Income statement: apply gross margin and operating expense behavior to compute EBITDA, then subtract depreciation, interest, and taxes to get net income.
- Cash flow: compute working capital changes using AR days, inventory days, and AP days. Even if net income rises, a working capital build can reduce operating cash.
- Financing: calculate interest from average debt and schedule principal repayment. Add any debt draw or equity contribution at closing if this is period 0.
- Balance sheet: update cash, working capital accounts, fixed assets, intangibles, debt, and equity. The model should balance without manual plug adjustments.
When these steps are consistent, the model becomes a decision tool rather than a spreadsheet that merely looks balanced. It will show you exactly where cash is created or consumed, and whether the acquisition financing supports the operating plan instead of fighting it.
5.2 Converting Operational Assumptions Into Cash Flow and Debt Service Coverage
Cash flow is where operational assumptions either pay rent or quietly move out. The goal in this section is to translate what you expect the business to do—sales, pricing, costs, working capital behavior—into the timing and amount of cash available to service debt.
Foundational Mapping from Operations to Cash
Start with a simple rule: income statement items do not automatically equal cash. Cash flow timing is driven by collections, payments, inventory movement, and capital spending.
A practical workflow:
- List operational assumptions by driver: revenue growth, gross margin, operating expenses, capex, and working capital levers.
- Convert each driver into cash timing: when cash is received and when it is paid.
- Aggregate into free cash flow available for debt service, then compare to required debt payments.
Operational Assumptions That Actually Move Cash
Focus on assumptions that change cash timing, not just totals.
- Revenue and collections: If you assume revenue grows 10% but collections lag, cash may not follow. Model customer payment terms and collection curves.
- Gross margin and cost structure: Margin improvements can be cash-positive only if they reduce cash costs or improve inventory turns.
- Operating expenses: Some expenses are cash, some are not. Depreciation is non-cash; payroll taxes and vendor payments are cash.
- Working capital: Accounts receivable, inventory, and accounts payable determine whether growth consumes cash.
- Capex and maintenance: Capex is cash out. Separate maintenance capex from growth capex so debt coverage is not surprised.
Mind Map: the Cash Flow Translation
Converting Assumptions Into Free Cash Flow
Use a consistent bridge so each assumption has a home.
Step 1: Build operating cash flow from EBITDA with adjustments.
- Start with EBITDA.
- Subtract cash taxes (not accounting taxes).
- Subtract changes in working capital.
- Add back non-cash charges if you started from net income, or keep them consistent if you started from EBITDA.
Step 2: Subtract capex to reach free cash flow.
- Maintenance capex reduces cash available for debt.
- Growth capex should be modeled with the same discipline as any other cash outflow.
Step 3: Define cash available for debt service. This is typically free cash flow after any required reserves or mandatory payments defined in the financing documents.
Debt Service Coverage Mechanics
Debt service coverage compares cash available to required payments.
Common components:
- Interest payments based on drawn debt and interest rate assumptions.
- Principal payments based on amortization schedule or mandatory paydowns.
- Covenant coverage often uses a specific definition, so align your calculation to the term sheet.
A simple example: assume the business generates $12.0m EBITDA. Collections improve, reducing receivables by $0.8m versus plan. Working capital change is therefore +$0.8m to cash. After cash taxes of $2.2m and maintenance capex of $1.5m, free cash flow is $12.0m - $2.2m + $0.8m - $1.5m = $9.1m. If annual interest is $6.0m and required principal is $2.0m, total debt service is $8.0m. Coverage is $9.1m / $8.0m = 1.14x.
Example: Timing Matters More Than Totals
Assume revenue increases by $5m, but collections terms shift from 45 days to 60 days.
- Revenue impact on EBITDA might be positive.
- Cash impact can be negative if receivables build faster than sales.
If the incremental $5m revenue is spread evenly through the year, the receivable balance roughly scales with the average days outstanding. Moving from 45 to 60 days increases receivables by about 15/365 of annual incremental revenue: $5m × 15/365 ≈ $0.21m additional receivables. That $0.21m is a cash use in the working capital change, reducing debt coverage even when EBITDA looks fine.
Practical Modeling Checks to Prevent Silent Errors
- Sign discipline: Working capital increases are cash uses, so they reduce cash available.
- Consistency of definitions: If you use EBITDA-based cash flow, ensure taxes and working capital are cash-based.
- Capex split: Maintenance capex should be treated as recurring unless the diligence supports otherwise.
- Covenant alignment: Calculate coverage using the same inputs and adjustments the covenant uses.
Diagram: Cash Flow and Coverage Flow
    flowchart TD
  A[Operational Assumptions] --> B[Revenue and Cost Timing]
  B --> C[EBITDA]
  C --> D[Cash Taxes]
  C --> E[Working Capital Change]
  D --> F[Operating Cash Flow]
  E --> F
  F --> G[Maintenance Capex]
  G --> H[Free Cash Flow]
  H --> I[Cash Available for Debt Service]
  I --> J[Interest and Principal Payments]
  J --> K[Debt Service Coverage]
Putting It Together in the Model
When you review the model, trace each major assumption to a cash line item. If a driver affects EBITDA but not cash, confirm whether it truly should. If it affects cash but not EBITDA, confirm whether the driver is working capital, capex, or timing of payments. That discipline is what turns a spreadsheet into a financing-ready story.
5.3 Modeling Synergies Cost Takeout and Revenue Retention with Controls
Synergies modeling works best when you treat it like two separate engines that share one steering wheel: (1) cost takeout and (2) revenue retention. Both engines need timing assumptions, operating constraints, and controls that prevent “modeled” benefits from turning into “explained later” shortfalls.
Foundations for Modeling Synergies
Start by defining the synergy thesis in operational terms, not accounting terms. Cost takeout should map to specific levers such as procurement pricing, reduced labor hours, or eliminating duplicated overhead. Revenue retention should map to customer-facing levers such as contract continuity, service-level stability, and sales coverage.
Then set three modeling rules:
- Separate baseline from synergy. Baseline reflects what the business would do without the deal. Synergy entries should be incremental and time-phased.
- Use cash timing, not just accounting timing. A cost synergy that reduces expenses may not reduce cash immediately if it requires severance, system changes, or transition costs.
- Attach controls to each synergy lever. Controls are the mechanism that makes the lever measurable and enforceable.
Cost Takeout Modeling
Cost takeout usually has a ramp. You can model it as a monthly schedule with three phases: transition, stabilization, and run-rate.
Example lever: procurement savings.
- Transition (months 1–3): renegotiation and supplier onboarding; include one-time consulting and internal time.
- Stabilization (months 4–6): partial adoption of new pricing; assume 50% of target savings.
- Run-rate (months 7+): full adoption; assume 100% of target savings.
In the model, represent savings as:
- Gross savings from lower unit costs.
- Implementation costs (one-time and recurring).
- Net savings after implementation costs.
Control idea: require a “price realization” report that compares contracted rates versus actual purchase prices. If realization is 92% of target, reduce the synergy ramp accordingly.
Example lever: overhead rationalization.
- Identify duplicated functions (e.g., two finance teams).
- Model severance and retention bonuses as one-time costs.
- Model ongoing savings as reduced headcount plus reduced vendor spend.
Control idea: track headcount reductions and vendor contract terminations with dates. If a role is not eliminated by month 4, do not assume the savings hit in month 4.
Revenue Retention Modeling
Revenue retention is not “keep customers.” It is “keep the revenue drivers stable while changes happen.” Model retention using cohorts or segments, because different customer groups react differently to operational change.
Example: service contract retention.
- Segment customers by contract type and renewal cycle.
- Estimate churn risk during transition (months 1–6) due to process changes.
- Estimate recovery after stabilization (months 7–12) if service levels return to baseline.
A practical approach is to model revenue as:
- Starting revenue by segment
- Retention rate by month (baseline retention minus transition churn plus recovery)
- Price effects (usually separate from retention unless pricing changes are part of the plan)
Control idea: define a service-level KPI such as on-time resolution rate or SLA compliance. If SLA compliance drops below target for two consecutive months, increase churn assumptions for the affected segment.
Integrating Cost and Revenue with Controls
Synergies interact. Cost takeout can harm service quality if implemented poorly, and revenue retention can require spending that offsets cost savings. Your model should include a “constraint layer” that links levers to operational capacity.
Example constraint: customer support staffing.
- If overhead reductions reduce support coverage, retention assumptions must adjust.
- If you plan to cut support hours by 10%, require a staffing plan that shows how coverage remains adequate.
Use a simple control matrix in the model documentation:
- Lever owner (who is accountable)
- Metric (what you measure)
- Target (what “good” looks like)
- Timing (when it should happen)
- Escalation rule (what triggers corrective action)
Mind Map: Synergy Modeling Inputs and Controls
Example: Putting It Together in a Monthly Synergy Schedule
Create a monthly table for the first 12 months with columns for: cost synergy gross, implementation costs, net cost synergy, retention churn impact, and net revenue retention impact. Then add a “control adjustment” column that updates assumptions when metrics miss targets.
Example outcome logic:
- Procurement savings target: $2.0m run-rate.
- Price realization control shows 90% in months 4–6.
- Model reduces those months’ savings to 90% of the ramped amount while keeping the run-rate assumption unchanged only if realization returns to target.
This approach keeps the model honest: it ties synergy benefits to measurable operational behavior, and it prevents the common failure mode where the spreadsheet assumes execution without verifying it.
5.4 Stress Testing Key Variables Using Sensitivities and Scenario Sets
Stress testing answers a simple question: “If the assumptions wobble, does the deal still work?” In acquisition financing, the “still work” part usually means (1) debt service coverage stays above lender thresholds, (2) liquidity remains positive through seasonal or working-capital swings, and (3) the equity return doesn’t collapse because one driver was optimistic.
Foundational Concepts That Make Stress Tests Useful
Start with three layers of analysis.
-
Sensitivities isolate one variable at a time. Example: reduce gross margin by 200 bps and observe the impact on EBITDA, free cash flow, and leverage.
-
Scenario sets combine multiple changes that tend to occur together. Example: margin down plus slower collections plus higher interest expense.
-
Stress paths test timing, not just totals. Example: working capital deterioration happens in months 1–6, so liquidity matters even if annual cash flow looks fine.
A practical rule: sensitivities are for understanding; scenarios are for deciding.
Step 1: Identify the Variables That Actually Move the Numbers
Focus on variables that connect directly to cash flow and covenants.
- Revenue growth and retention: affects EBITDA and collections.
- Gross margin: affects EBITDA and pricing power.
- Operating expense efficiency: affects EBITDA and cost-to-serve.
- Working capital: affects cash conversion cycle and liquidity.
- Capex and maintenance needs: affects free cash flow.
- Interest rate and refinancing assumptions: affects debt service.
- Tax and one-time items: affects cash taxes and normalization.
Example: If the company sells on 60-day terms, a “small” increase in DSO from 60 to 75 days can drain cash for months, even if EBITDA is stable.
Step 2: Build Sensitivities That Are Interpretable
Use a consistent method so results can be compared across variables.
- Choose a base case with clearly documented assumptions.
- For each variable, apply a small set of shocks (for example, -5%, -10%, +5%).
- Recalculate the full model impact, not just EBITDA.
- Track outputs that lenders care about: leverage, interest coverage, and minimum liquidity.
Example sensitivity set for a mid-market buyout:
- Gross margin: -100 bps, -200 bps, -300 bps
- DSO: +5 days, +10 days, +15 days
- Revenue growth: -2 pts, -4 pts, -6 pts
- Interest rate: +100 bps, +200 bps
Then rank sensitivities by “cash impact per unit change.” A variable with a modest effect on EBITDA can still be the top cash risk if it hits working capital.
Step 3: Create Scenario Sets That Reflect Real Coupling
Scenario sets should combine changes that plausibly co-occur. Avoid random combinations; use cause-and-effect logic.
Scenario A: Margin Compression Without Demand Collapse
- Gross margin down (pricing pressure)
- Operating expenses partially offset (cost control)
- Revenue growth slightly down
- Working capital roughly stable
Scenario B: Revenue Softness With Collection Strain
- Revenue growth down
- DSO increases
- Bad debt expense rises
- Inventory turns slow
Scenario C: Cost Inflation With Higher Debt Service
- Operating costs up
- Interest rate up
- Capex up for maintenance
- EBITDA down and free cash flow down
Scenario D: “Two-Front” Stress
- Margin down and DSO up together
- Liquidity buffer shrinks
- Covenant headroom narrows
For each scenario, record not only the end-of-year results but also the lowest monthly liquidity point and the month when covenant pressure peaks.
Step 4: Stress Timing with a Liquidity Lens
Many deals fail on timing, not averages. Add a simple liquidity timeline view.
- Compute monthly cash available after interest, taxes, and capex.
- Include working capital movements explicitly.
- Identify the first month where cash falls below a minimum threshold.
Example: Annual free cash flow might be positive in Scenario B, but if collections slip in months 2–4, the company could breach a minimum cash covenant in month 3. That’s the moment to negotiate tighter purchase price adjustments, a working capital true-up, or a financing structure with a liquidity reserve.
Step 5: Translate Results Into Deal-Structuring Actions
Stress testing should feed back into terms.
- If DSO stress drives liquidity risk, consider stronger working capital definitions, tighter covenant language, or a debt structure with a cash sweep only after a liquidity floor is met.
- If interest rate stress is dominant, evaluate fixed vs floating mix, interest rate hedging, or amortization profile.
- If margin stress is dominant, ensure earnout metrics and measurement controls align with how margin is actually realized.
The goal is not to “pass” stress tests; it’s to understand what must be true for the deal to work.
Mind Map: Sensitivities and Scenario Sets
Worked Example: Turning Stress Results Into a Clear Decision
Assume the base case shows interest coverage of 2.5x and minimum liquidity of $10 million. Sensitivities show that a 200 bps margin drop reduces interest coverage to 2.1x, still above a 2.0x threshold. But Scenario B combines margin down with DSO up, and the liquidity trough falls to $6 million in month 3.
That pattern suggests the deal is more sensitive to working capital timing than to EBITDA alone. The structuring response is therefore targeted: tighten working capital mechanics and ensure the financing includes enough liquidity buffer to survive the collection gap, rather than overreacting to margin alone.
5.5 Documenting Assumptions for Investment Committee and Lender Review
Investment committees and lenders don’t just want numbers; they want to know which assumptions produced those numbers, how those assumptions were derived, and what would change if reality disagreed. Good documentation turns a model from a black box into a set of defensible decisions—without requiring the reader to guess what you meant.
Foundational Assumption Categories
Start by grouping assumptions so reviewers can jump to what matters.
- Operating drivers: volume, pricing, utilization, headcount, productivity, churn, defect rates.
- Cost drivers: labor rates, benefits, raw material costs, freight, overhead allocation, maintenance.
- Working capital mechanics: days sales outstanding, days inventory, days payable, seasonality, collections timing.
- Capital structure and financing: debt amount, interest rate, amortization, fees, covenant definitions, equity contribution timing.
- One-time items and normalization: add-backs, restructuring costs, litigation expenses, owner compensation adjustments.
- Synergies and integration: timing, cost takeout vs. revenue retention, implementation capacity, measurement method.
A simple rule: every assumption in the model must map to exactly one category, and every category must have a clear source or rationale.
The Assumption Narrative That Reviewers Can Follow
Write a short narrative that mirrors the model’s logic.
- Purpose: what the assumptions are meant to support (base case, downside case, covenant test).
- Source: where the assumption came from (management interviews, historical trends, contract terms, vendor quotes, bank guidance).
- Method: how it was calculated (averages, regression, cohort retention, contract roll-forward).
- Timing: when the assumption applies (month 1 vs. year 2, ramp schedules, step changes).
- Linkage: which outputs it affects (EBITDA, free cash flow, leverage ratio, interest coverage).
- Sensitivity: what happens if it’s wrong (directional impact and which variable is the “control knob”).
If you can’t state the linkage in one sentence, the model likely has hidden dependencies.
Mind Map: Assumption Documentation
Building an Assumption Register That Doesn’t Drift
Create an assumption register that is consistent with the model and easy to audit.
Include these columns:
- Assumption name (matches the model label)
- Category (from the categories above)
- Value and unit (e.g., 45 days DSO)
- Time period (month or year range)
- Source (document name or interview date)
- Method (one-line calculation description)
- Model linkage (which line items it drives)
- Owner (who can answer questions)
- Sensitivity variable (which input changes in downside)
For example, “DSO = 45 days” should specify whether it’s based on trailing twelve months, a seasonal adjustment, or a collections improvement plan. If it’s a plan, document the operational mechanism that makes it plausible.
Example: Documenting a Working Capital Assumption
Assume the model uses inventory days to forecast cash flow.
- Assumption: Inventory days = 60 in Year 1, 55 in Year 2.
- Source: SKU-level inventory aging report and historical turns.
- Method: Weighted average of days on hand by SKU class; Year 2 reduction tied to procurement cycle changes and safety stock policy.
- Timing: Policy change starts in Month 4; full effect by Month 12.
- Linkage: Impacts cash conversion and free cash flow used for debt service coverage.
- Sensitivity: Downside case increases inventory days by +5.
This is the difference between “we think inventory will improve” and “we changed a policy, and here’s how it changes days on hand.”
Example: Documenting a Financing Assumption
For lenders, financing assumptions must align with the term sheet and covenant definitions.
- Assumption: Term loan interest rate = SOFR + 6.25%, with a floor of 5.00%.
- Source: lender commitment letter dated April 2026.
- Method: Use the forward curve for SOFR for the base case; apply the floor when the curve is below 5.00%.
- Timing: Rate resets quarterly; fees amortize over the stated period.
- Linkage: Impacts interest expense and interest coverage covenant.
- Sensitivity: Increase spread by +0.50% in downside.
If the model uses a simplified rate, document why the simplification still preserves covenant accuracy.
Review Readiness Checklist
Before sending to the committee or lender, confirm these items are present and consistent:
- Assumption register matches model labels with no orphan inputs.
- Change log exists showing what changed since the last review and why.
- Exception list is explicit for assumptions that lack direct evidence (and how you mitigated that gap).
- Version control is clear so reviewers don’t compare different model builds.
- Covenant-linked assumptions are highlighted and tied to the covenant calculation logic.
Good documentation is not longer; it’s tighter. It answers the questions reviewers ask when they’re trying to decide whether the model is a tool or a story.
6. Operational Improvement Planning for Post Close Execution
6.1 Setting Day One Priorities and Establishing Operating Cadence
Day One is not about grand plans; it’s about preventing avoidable value leaks. In a private equity context, the first two weeks often determine whether the business runs on facts or on memory. The goal is to establish a repeatable operating rhythm that produces decisions, not just meetings.
Foundational Principles for Day One
Start by separating three things: (1) what must keep running, (2) what must be clarified, and (3) what can wait. “Must keep running” includes payroll, customer commitments, debt-related reporting inputs, and any safety or compliance processes. “Must be clarified” covers ownership of decisions, approval thresholds, and who signs off on exceptions. “Can wait” is everything that doesn’t affect cash, customers, or legal obligations in the near term.
A practical rule: if a task affects cash within 30 days, it belongs in the Day One plan. If it affects a customer within 30 days, it belongs in the Day One plan. If it affects compliance within 30 days, it belongs in the Day One plan. If it affects none of those, it can be scheduled later.
Day One Priorities That Prevent Value Leakage
- Stabilize cash and reporting inputs
Create a “cash truth” checklist: bank access, payment approval workflow, accounts receivable aging ownership, and the person who can produce the weekly cash forecast. Example: if the prior CFO left during the transition, assign a temporary owner to compile cash receipts and disbursements every Monday by 10:00 a.m.
- Confirm customer and revenue continuity
Identify top 20 customers by revenue and ensure contract terms, pricing approvals, and renewal dates are understood. Example: a sales manager may have discretionary pricing authority that the new owners don’t know about. Day One should confirm who can approve price exceptions and how those exceptions are documented.
- Lock down operational controls
Define approval levels for spend categories that can quietly drain cash: expedited freight, overtime, vendor credits, and non-standard repairs. Example: set a threshold where any unbudgeted spend above a fixed amount requires sign-off from the operating lead plus finance.
- Establish people and decision rights
Clarify who leads each function and who decides what. Example: if operations and finance disagree on inventory valuation assumptions, decide the dispute path immediately—who resolves it, by when, and what evidence is required.
- Create a baseline performance view
Pick a small set of KPIs that reflect the business model and can be measured weekly. Example: for a distributor, track fill rate, days sales outstanding, and gross margin after rebates. For a services firm, track utilization, billable rate realization, and churn.
Operating Cadence That Produces Decisions
A cadence is a schedule plus a purpose. Meetings without outputs become expensive calendar decoration.
Week 1: Stabilization and fact gathering
- Daily standup for operational blockers (15 minutes, same time each day).
- Weekly cash and covenant review (finance-led, with clear action owners).
- Customer continuity check (commercial lead, focused on exceptions and risks).
Weeks 2–4: Execution and control
- Weekly KPI review with variance explanations and corrective actions.
- Biweekly cross-functional problem-solving for the top 3 constraints.
- Monthly board pack with standardized reporting and a short decision section.
To keep it systematic, define the “inputs” and “outputs” for each meeting. Example: the KPI review requires a variance bridge (actual vs. plan, drivers, and actions). The output is a list of decisions and owners, not a narrative.
Mind Map: Day One Priorities and Operating Cadence
Example: A Two-Week Day One Plan
Day 1–2: Confirm bank access, payment workflow, and who can approve vendor payments. Create an exception register for customer pricing and contract deviations.
Day 3–5: Run daily standups focused only on blockers that affect cash, customers, or compliance. Produce the first weekly cash forecast using the same template every week.
Week 2: Hold the first KPI review using three to five KPIs. Require each variance to include a driver and an action owner. If a KPI can’t be measured reliably yet, track it as “pending” rather than pretending it’s known.
Example: Operating Cadence Template for Action
Use a single action log across meetings. Each action should include an owner, a due date, and a measurable outcome. Example: “Reduce DSO by improving invoice approval cycle” is too vague; “Implement invoice approval SLA and report DSO weekly” is specific enough to manage.
Finally, set a short escalation rule. If an action owner misses a due date, the next meeting agenda must include the reason and a revised plan. That one rule keeps the cadence from drifting into polite conversation.
6.2 Building a Baseline Operating Model and Performance Measurement System
A baseline operating model is your “before” picture: how the business runs today, what it costs, what it produces, and which numbers move together. A performance measurement system is the “after” dashboard: how you track progress without arguing about definitions every month. Together, they prevent a common problem—improvement plans that are based on opinions rather than measurable cause-and-effect.
Start with the Business Logic, Not the Spreadsheet
Begin by writing a simple chain: inputs → activities → outputs → outcomes. For example, if you want margin expansion, your model should show how pricing, labor, scrap, and freight affect unit contribution. If you want working capital improvement, it should show how order-to-cash timing and inventory turns affect cash.
A practical baseline model usually includes:
- Volume drivers (units, orders, customers, hours)
- Commercial drivers (price, discounting, mix, retention)
- Operational drivers (cycle time, yield, utilization, defect rate)
- Cost drivers (labor rates, overtime, materials, overhead absorption)
- Cash drivers (DSO, DPO, inventory days, capex timing)
Define the Level of Detail and the Time Buckets
Choose a level of detail that matches decision-making. If the operating team manages weekly production schedules, a monthly model may still work, but you must translate weekly actions into monthly outcomes. If the team manages by customer segments, build segment-level views even if the financial statements are consolidated.
Use consistent time buckets across the model and measurement system. A common approach is monthly for financial performance and weekly for operational execution, with a clear mapping between them.
Build the Baseline Operating Model Structure
Create a model that can explain variance, not just totals. A clean structure is:
- Revenue module
- Volume × price × mix
- Returns, credits, and allowances as explicit line items
- Cost of goods module
- Direct materials and labor tied to production volume
- Scrap, rework, and yield as measurable drivers
- Operating expense module
- Headcount and productivity assumptions
- Allocation rules for shared services
- Working capital module
- Inventory, receivables, payables with operational drivers
- Capex and depreciation module
- Capex timing and its impact on capacity and maintenance
- Debt service and cash sweep logic
- If financing is in-scope, ensure covenant metrics can be derived
A baseline model should be able to answer: “If we change X, what happens to Y?” If you cannot trace the logic, the model will not support decisions.
Create a Performance Measurement System That People Will Use
Your measurement system should include three layers:
- North Star metric tied to value creation (for example, gross margin dollars or free cash flow)
- Driver metrics that explain the North Star (for example, yield, price realization, DSO)
- Execution metrics that teams can influence weekly (for example, schedule adherence, quote turnaround time)
Keep the metric set small enough to be consistent. A useful rule is that each driver metric must have an owner and a data source with a defined refresh cadence.
Example: Turning a Margin Goal Into a Measurable System
Suppose the goal is to increase gross margin by 300 bps. The baseline model shows gross margin dollars depend on:
- Price realization
- Product mix
- Yield (scrap and rework)
- Direct labor hours per unit
The measurement system then assigns:
- Owner for yield: operations manager, measured weekly by defect rate and scrap cost
- Owner for labor productivity: plant manager, measured weekly by hours per unit
- Owner for price realization: sales lead, measured monthly by discount rate and contract terms
When results miss, you can identify whether the issue is commercial, operational, or both—without rewriting the story.
Mind Map: Baseline Model and Measurement System
Validate the Baseline with a “Variance Walkthrough”
Before you lock the baseline, run a variance walkthrough for the last 2–3 months. Pick one outcome metric, such as gross margin dollars, and explain the change using the driver metrics from the model. If the walkthrough cannot be completed in a reasonable meeting, the model is missing a driver or the measurement definitions are inconsistent.
Lock Definitions and Data Rules
Document definitions in plain language: what counts as revenue, how credits are treated, how yield is calculated, and how working capital items are measured. Then define data rules: which system is the source of truth, how adjustments are handled, and when numbers are considered final for reporting.
A baseline model is only as good as its assumptions, and a measurement system is only as good as its definitions. When both are consistent, improvement work becomes less about persuasion and more about execution.
6.3 Improving Pricing Margin and Commercial Execution Controls
Pricing margin improves when three things line up: the price reflects value, the sales process consistently applies the rules, and exceptions are handled with discipline. The easiest way to lose margin is not “bad pricing,” but inconsistent execution—different reps, different discounts, different approvals, and different interpretations of what counts as a deal.
Foundational Concepts That Make Margin Measurable
Start with a simple margin equation you can audit:
- Gross margin dollars = Revenue × Gross margin %
- Gross margin % = 1 − (Cost of goods sold / Revenue)
Then separate pricing from volume. If revenue rises because volume rises, margin dollars may still fall if discounts creep in. Your controls should track both price realization and discount behavior.
A practical baseline is to compute, by product and customer segment:
- List price vs. realized price
- Discount rate (realized discount as a % of list)
- Mix shift (whether higher-discount items are growing)
Example: A rep closes more units by discounting 8% instead of 3%. Volume increases 12%, but realized price drops enough that gross margin dollars fall 4%. The control system should flag the discount deviation and show the margin impact, not just the discount number.
Commercial Execution Controls That Prevent Margin Leakage
Execution controls are the “guardrails” between pricing policy and signed contracts.
-
Define pricing rules in plain language
- What discount levels are allowed without approval?
- Which customers qualify for exceptions?
- Which products require margin floors?
-
Standardize quoting and approvals
- Every quote should pull from the same price book and cost assumptions.
- Approvals should be triggered by discount thresholds, not by who asks.
-
Require deal documentation for exceptions
- If a discount exceeds policy, the quote must include a reason code and a justification tied to measurable tradeoffs.
- Examples of acceptable tradeoffs: longer contract term, higher volume commitment, reduced service scope, or payment terms improvement.
-
Close the loop with post-close audits
- Compare approved quote terms to the executed contract.
- Track “quote-to-contract variance” and “approval-to-contract variance.”
Example: A deal is approved for a 6% discount with a 24-month term. The contract is signed for 12 months. The audit catches the mismatch, and the next approval cycle requires term confirmation before signature.
Pricing Governance That Works in the Real World
Governance is not a committee that meets more often; it’s a decision system.
- Decision rights: who can approve what, and under which conditions.
- Escalation paths: what happens when a deal is outside policy.
- Time limits: approvals must have a turnaround target so deals don’t stall.
A useful control is a margin floor by product family. If the floor is violated, the system forces either a discount reduction or a documented offset.
Example: For Product A, the margin floor is 35% gross margin. A discount request would drop margin to 31%. The rep can either reduce discount or add an offset such as reduced warranty coverage or a higher minimum order quantity.
Mind Map: Pricing Margin and Commercial Execution Controls
Implementation Steps from Baseline to Control
Step 1: Build a pricing scorecard. Track realized price, discount rate, and margin dollars by segment. Include a “variance” column that compares realized terms to policy.
Step 2: Map the quote workflow. Identify where pricing changes happen: quote creation, negotiation notes, approval, and contract finalization. Controls should sit at the points where changes are most likely.
Step 3: Create approval logic. Use discount thresholds and margin floors. Require reason codes and offsets for exceptions.
Step 4: Add contract validation. Before signature, confirm the term length, payment terms, and service scope match the approved quote.
Step 5: Run a monthly variance review. Focus on repeat offenders and repeat deal types. If the same product family repeatedly needs exceptions, the pricing policy likely needs adjustment or the sales team needs clearer guidance.
Example: After three months, you find that discounts above policy are concentrated in one customer segment during renewal. The control review shows that the renewal process lacks a standardized “renewal offer ladder.” Fixing the ladder reduces exceptions without changing the overall sales motion.
Example Control Package for a Mid-Sized Manufacturer
Assume a company sells three product families and offers discounts based on volume and contract term.
- Margin floors: set by product family using historical cost and standard overhead allocation.
- Discount thresholds:
- Up to 3% no approval
- 3–7% manager approval
- Above 7% finance + sales leadership approval
- Exception requirements: any discount above 7% must include one offset (term extension, volume commitment, or reduced service scope).
- Validation checks: contract term and payment terms must match the approved quote.
Result: reps can move quickly within policy, while exceptions become auditable decisions rather than last-minute bargaining.
Practical Checklist for Day-to-Day Pricing Discipline
- Does the quote use the correct price book and cost assumptions?
- Is the discount within threshold, or is it approved with a reason code?
- If approved, do contract terms match the approved quote?
- Are margin floors enforced or offset documented?
- Are variances reviewed monthly with clear corrective actions?
When these controls are consistent, pricing margin stops being a “hope and spreadsheet” exercise and becomes a repeatable operating system—slightly less fun than improvising, but much more reliable for the numbers.
6.4 Streamlining Procurement Inventory and Supply Chain Performance
Procurement and inventory are tightly linked: buy too much and cash sits idle; buy too little and production stops. Streamlining means reducing the time and uncertainty between “we need it” and “it arrives,” while keeping service levels stable. The goal is not to minimize inventory at all costs—it’s to hold the right inventory in the right place for the right duration.
Foundational Concepts That Drive Inventory
Start with three basics.
- Lead time is the total time from placing an order to receiving usable goods. It includes internal approvals, supplier processing, transit, and receiving.
- Demand variability is how much usage fluctuates. Even if average demand is steady, spikes create safety stock needs.
- Order cycle is how often you replenish. Infrequent ordering increases the average inventory level.
A practical way to connect these is to treat inventory as a buffer for lead time and variability. If you shorten lead time or reduce variability, you can usually reduce safety stock without increasing stockouts.
Map the Supply Chain to Find the Real Bottlenecks
Before changing purchasing rules, map the flow for the top 20–30 SKUs by spend or production impact. For each SKU, capture:
- Where it is used (plant, line, or customer-facing assembly)
- Forecast source and update frequency
- Supplier lead time and its variability
- Minimum order quantity and packaging constraints
- Quality acceptance time and typical defect rates
- Where inventory is held (supplier-managed, warehouse, line-side)
A common surprise: the “supplier lead time” is stable, but receiving and inspection take longer than expected. Another surprise: the bottleneck is not the supplier, but the internal approval step that delays order release.
Procurement Practices That Reduce Inventory Without Breaking Service
1. Tighten demand signals. If procurement receives forecasts that are updated monthly, inventory becomes a guess. Use a rolling horizon: update requirements weekly for near-term needs and monthly for longer-term needs. For example, if a component is consumed at 100 units per week but forecasts swing between 80 and 120, safety stock must cover that spread. Better weekly updates reduce the spread.
2. Use the right replenishment logic. Two simple patterns work well:
- Reorder point for items with stable usage and known lead times.
- Periodic review for items with more variable demand or less reliable lead times.
Example: A fast-moving packaging material with consistent weekly usage can use a reorder point. A custom gasket with irregular orders may be better served by periodic review tied to production planning.
3. Reduce batch sizes where constraints allow. If minimum order quantities force large buys, inventory stays high even when demand is low. Negotiate smaller lots, split shipments, or vendor-managed inventory for specific items. If negotiation is not possible, consider whether the constraint is truly necessary by testing a pilot with a subset of SKUs.
4. Improve supplier performance measurement. Track on-time-in-full (OTIF) and quality acceptance separately. A supplier can deliver on time but still cause delays if defects require rework. Example: If OTIF is 95% but quality acceptance is 85%, your effective usable lead time is longer than expected.
5. Standardize and rationalize SKUs. Excess variants create procurement complexity and slow replenishment. If two SKUs are functionally interchangeable, consolidating them can reduce safety stock and simplify forecasting.
Advanced Details That Make the System Work
Safety stock should be calculated, not guessed. Use variability and lead time to set safety stock. Then validate it with real service outcomes. If stockouts occur, the system is underestimating variability or lead time. If inventory sits untouched, the system may be overestimating.
Working capital discipline belongs in procurement. Set targets for days inventory on hand (DIO) and tie them to service-level metrics. Example: If a plant reduces DIO by 10 days but service level drops from 98% to 92%, the “savings” are likely just moving costs into expedited freight and downtime.
Receiving and quality are part of supply chain performance. Streamline receiving by pre-approving documentation, using clear inspection criteria, and setting escalation paths for nonconforming lots. A supplier that ships correctly but is delayed at receiving still increases effective lead time.
Mind Map: Procurement Inventory and Supply Chain Performance
Example: Turning a Stockout Into a Repeatable Fix
A manufacturing line experiences a weekly stockout of a critical component. The procurement team initially blames the supplier. After mapping the flow, they find the supplier lead time is 10 days consistently, but internal approvals delay order release by 6–8 days when demand spikes. They implement weekly planning updates and a pre-approved reorder trigger for the component. They also separate OTIF from quality acceptance and discover that 3–4% of lots fail inspection, extending usable lead time. The fix is two-part: faster order release for the near term and tighter supplier quality checks for the affected batch type. Inventory drops because safety stock is now based on the true effective lead time, not the optimistic supplier promise.
Practical Checklist for Implementation
- Select top SKUs by spend and production impact.
- Build a lead time map including receiving and approvals.
- Set a rolling horizon for demand signals.
- Choose replenishment logic per SKU type.
- Track OTIF and quality acceptance separately.
- Validate safety stock with service outcomes.
- Tie DIO targets to fill rate and downtime metrics.
6.5 Implementing Cost Management Programs With Measurable Outcomes
Cost management works best when it is treated like a system, not a one-time squeeze. The goal is to reduce avoidable spend while protecting the drivers of revenue, quality, and delivery. A practical program starts with clarity on what “cost” means in your business, then builds a repeatable method to find, fund, execute, and verify savings.
Foundational Cost Definitions and Boundaries
Begin by defining the cost categories you will manage and the boundary of responsibility. For example, decide whether you manage only controllable expenses (like overtime, freight, and maintenance) or also semi-controllable items (like commodity-linked inputs). A simple rule: if a manager can change the spend within 90 days, it belongs in the program.
Next, standardize how costs are measured. Use a consistent chart of accounts mapping to cost drivers such as labor hours, units produced, shipments, or service tickets. If your finance team reports “cost of goods sold” but operations tracks “scrap rate,” you will waste weeks reconciling numbers instead of improving them.
Program Design from Baseline to Savings Verification
A measurable program has four stages: baseline, initiatives, tracking, and verification.
-
Baseline: Build a baseline using the last 6–12 months, adjusted for one-time events. For instance, if a plant shut down for a week, exclude the abnormal downtime so you don’t “save” money that was never going to be spent.
-
Initiatives: Translate each cost category into specific levers. Examples include reducing overtime by improving scheduling, lowering freight by consolidating shipments, or cutting rework by tightening quality checks.
-
Tracking: Assign an owner and a metric for each initiative. Track leading indicators weekly (e.g., overtime hours, on-time delivery, defect rate) and lagging indicators monthly (e.g., total labor cost, warranty expense).
-
Verification: Confirm savings after implementation using a before-and-after approach with a control where possible. If you reduce freight by changing lanes, compare lanes that did not change to avoid confusing savings with demand shifts.
Cost Initiative Selection with Simple Logic
Not every cost item deserves attention. Use a two-step filter: impact and feasibility.
- Impact: Estimate annual spend and the portion that is controllable. Example: if expedited freight is $2.0M annually and 70% is avoidable through better planning, the addressable amount is $1.4M.
- Feasibility: Check whether the lever can be executed within the operating rhythm. If a savings idea requires a new ERP module and a vendor contract that takes 9 months, it may be better as a later phase.
A useful practice is to create a “savings backlog” with effort, owner, and expected timeline. Then fund the top items that can deliver within 60–120 days.
Example Cost Program: Freight and Overtime
Freight: Start with a shipment review. Segment shipments by lane, weight band, and service level. You might find that 25% of shipments use expedited service due to late order releases. The fix is not “negotiate rates first,” it is “reduce the triggers.”
- Leading metric: % of orders released by the cutoff time.
- Initiative: implement a daily release checklist and a single escalation path for exceptions.
- Verification: compare expedited freight cost per shipment before and after, controlling for volume changes.
Overtime: Use timekeeping and production schedules to identify why overtime occurs. Often it is caused by late material arrivals or last-minute schedule changes.
- Leading metric: overtime hours per 1,000 labor hours.
- Initiative: improve weekly scheduling with a material availability buffer and a rule that prevents schedule changes within 48 hours without approval.
- Verification: compare overtime hours and total labor cost per unit, not just overtime alone.
Governance and Cadence That Prevents “Savings Theater”
Set a rhythm that forces reality checks.
- Weekly: initiative owners report leading metrics and blockers.
- Monthly: finance validates cost movement versus baseline and confirms whether savings are real or timing.
- Quarterly: leadership reviews whether savings are sustainable and whether any cost cuts harmed quality or delivery.
A practical tool is a savings tracker with three fields: expected savings, current run-rate, and verified savings. If “expected” keeps changing, the program is not under control.
Mind Map: Cost Management Program Structure
Advanced Details: Preventing Hidden Cost Shifts
Cost cuts often “move” rather than disappear. For example, reducing maintenance spend can increase downtime, which then increases overtime and expedited freight. To prevent this, require a cross-metric check for each initiative.
For freight initiatives, also monitor on-time delivery and customer complaints. For overtime initiatives, monitor output quality and rework rates. If a cost initiative reduces one metric but worsens another, treat it as a tradeoff and quantify the net effect.
Finally, document the mechanism of change. If you can’t explain why savings should occur, you can’t verify them. A good mechanism statement is specific: “Expedited freight decreases because order releases meet the cutoff time, reducing last-minute shipping.”
When the program is run this way, savings become measurable outcomes rather than hopeful guesses. The best part is that the same structure can be reused for any cost category, from procurement to labor to logistics, without reinventing the wheel each quarter.
7. Revenue Growth and Customer Retention Programs
7.1 Segmenting Customers and Defining Retention and Growth Targets
Customer segmentation is the practical step that turns “we need to grow” into “we know which customers, which offers, and which outcomes.” The goal is not to create a fancy taxonomy; it’s to make retention and growth targets measurable enough to manage.
Start with What You Can Measure
Begin by listing the customer attributes you can reliably capture today. Typical fields include revenue, gross margin, contract type, product usage, service tickets, payment behavior, and tenure. If you can’t measure something consistently, don’t use it as a primary segment driver—use it later as a secondary lens.
A simple starting point is a two-axis view:
- Value: current contribution margin or gross profit.
- Behavior: engagement level (active usage, ticket frequency, on-time payments) or risk signals (declining usage, frequent disputes).
This produces segments that are actionable even before you refine the data model.
Build Segments Using Decision-Relevant Drivers
Use segmentation drivers that map to how you will act. For example:
- Commercial driver: contract renewal timing, pricing tier, or channel.
- Operational driver: implementation complexity, service intensity, or product adoption.
- Risk driver: churn likelihood based on usage and support interactions.
A good test: for each segment, you should be able to name the playbook you’ll run (renewal outreach, onboarding support, pricing review, or service escalation). If you can’t, the segment is probably descriptive rather than decision-driving.
Define Retention Targets by Segment and Time Horizon
Retention targets should be specific about both what is retained and when. Common choices are:
- Logo retention: percentage of customers that renew or remain active.
- Revenue retention: percentage of prior-period revenue retained.
- Gross profit retention: percentage of contribution margin retained.
Use a time horizon aligned to your sales cycle and contract terms. For instance, if renewals occur quarterly, set quarterly retention targets; if contracts are annual, set annual targets with interim leading indicators.
Easy example:
- Segment A: high-margin customers with stable usage. Target 90% logo retention and 95% gross profit retention over 12 months.
- Segment B: mid-margin customers with declining usage. Target 80% logo retention but 85% gross profit retention, because you expect some churn unless adoption improves.
Notice the targets differ because the segments differ in what’s realistically controllable.
Define Growth Targets That Match Segment Economics
Growth targets should reflect how growth will be generated. For each segment, specify whether growth comes from:
- Expansion: more seats, more volume, additional modules.
- Cross-sell: adoption of adjacent products.
- Repricing: moving customers to a better-fit pricing tier.
- New logos: acquiring similar customers.
Easy example:
- Segment A (high-value, high-adoption): growth target is expansion—increase average gross profit per customer by 6% by adding a module.
- Segment B (high-risk, low-adoption): growth target is activation—reduce time-to-first-value by 30% and convert 25% of customers into the “active” sub-status.
This keeps growth targets from becoming wishful thinking.
Use Sub-Segments to Prevent “One Size Fits None”
Within each segment, create sub-segments based on a leading indicator you can influence quickly. Examples:
- Adoption stage: onboarding, active, power user.
- Support posture: low-touch, medium-touch, high-touch.
- Commercial posture: at-risk renewal, renewal-ready, upsell-ready.
Then assign different retention and growth targets to each sub-segment. You’ll avoid the classic problem where a single segment target hides that half the customers are improving while the other half are quietly slipping.
Mind Map: Segmentation and Target Setting
A Practical Template You Can Use Immediately
Create a one-page segmentation table with columns for: segment name, value definition, behavior definition, retention metric, retention target, growth metric, growth target, and the primary playbook. Keep it simple enough that sales, customer success, and finance can agree on it without a meeting marathon.
Mini example (illustrative):
- Segment: High-margin active users
- Retention metric: gross profit retention
- Retention target: 95% over 12 months
- Growth metric: expansion module adoption
- Growth target: 20% of customers add module within two renewal cycles
- Playbook: quarterly business reviews and usage-based outreach
When segmentation and targets are connected to specific actions, you get a system that can be managed, not just reported.
7.2 Designing Sales Incentives and Territory Coverage Improvements
Sales incentives work best when they are tied to measurable behaviors and paired with a territory plan that makes those behaviors possible. If the territory is wrong, even a perfect plan becomes a spreadsheet exercise.
Start with What You Want Salespeople to Do
Begin by listing the specific actions that drive the outcomes you care about: winning target accounts, converting qualified leads, expanding existing customers, and keeping forecast accuracy grounded in reality. Then translate each action into a metric that can be measured consistently.
A practical way to avoid “one metric to rule them all” is to use a two-layer scorecard:
- Performance layer: revenue, gross margin, retention, or new logo wins.
- Quality layer: forecast accuracy, quote-to-close conversion, or on-time proposal delivery.
Example: A mid-market software firm wants more renewals and fewer late surprises. It sets revenue targets for renewals and adds a quality metric for renewal forecast accuracy. Sales reps earn full credit only when the forecast matches actual renewal timing within a defined tolerance.
Build Incentives That Don’t Reward Bad Math
Incentives should not pay for revenue that later gets reversed. Use guardrails that prevent “collect now, regret later” behavior.
Common guardrails include:
- Cash or collected revenue basis: pay on cash received rather than invoiced revenue.
- Margin floor: require gross margin to exceed a minimum threshold.
- Chargeback or clawback: reduce payouts when refunds or credits exceed a set level.
Example: A distributor pays commissions on invoice value, but returns spike after shipments. Switching to collected revenue and adding a margin floor reduces payout volatility and aligns incentives with operational reality.
Choose a Pay Mix That Matches Sales Motion
Different sales motions need different incentive structures.
- Faster, transactional motion: higher weight on conversion and collected revenue.
- Longer, consultative motion: higher weight on pipeline quality and stage progression, with a smaller portion paid at close.
A simple pay mix template:
- 60% on collected revenue or gross profit
- 25% on quality metrics tied to the sales process
- 15% on retention or expansion outcomes
Example: For a services business with project-based delivery, the company weights retention and expansion more heavily because churn directly impacts future work.
Design Territory Coverage That Matches Buying Patterns
Territory design should reflect how customers buy, not how org charts look. Start with three inputs:
- Customer concentration: where revenue and renewal risk cluster.
- Sales capacity: how many active accounts each rep can manage.
- Channel and segment behavior: whether certain segments respond to different outreach styles.
Then apply coverage rules:
- Account ownership clarity: each account has one primary owner.
- Coverage ratios: define target counts by segment complexity.
- Rotation rules for shared accounts: specify when co-selling is allowed and how credit is split.
Example: A company discovers that two reps both chase the same top 20 accounts while mid-tier accounts go untouched. It reassigns territories using coverage ratios and introduces a shared-account credit rule that splits credit only when both reps contribute measurable activities.
Use Incentive Mechanics That Prevent Gaming
Even well-intended plans get gamed. Reduce loopholes by specifying how credit is earned.
Key mechanics:
- Attribution rules: what counts as a “contributed” deal.
- Deal registration: require deals to be registered before a certain stage.
- Stage definitions: require evidence for moving opportunities forward.
Example: A rep inflates pipeline by moving deals to “proposal sent” too early. The plan requires a dated quote and a documented next step before the opportunity qualifies for pipeline credit.
Mind Map: Incentives and Territory Coverage
Example: Putting It Together in a Simple Plan
Assume a team of 8 reps covers three segments: SMB, mid-market, and enterprise. The company sets:
- Territory coverage: 120 SMB accounts per rep, 60 mid-market, 25 enterprise.
- Incentive pay mix: 60% collected gross profit, 25% quality metrics, 15% retention.
- Guardrails: margin floor of 35% and clawback for refunds above 2% of collected revenue.
- Quality metric: forecast accuracy measured monthly by comparing forecasted close dates to actual close dates.
After implementation, overlap drops because account ownership is enforced, and forecast accuracy improves because reps lose payout if deals are advanced without evidence. The plan stays fair because credit attribution is explicit, and the territory rules make it possible to hit the targets without heroic effort.
7.3 Strengthening Sales Pipeline Hygiene and Forecast Accuracy
Pipeline hygiene is what keeps your forecast from turning into a creative writing exercise. It means every opportunity in the pipeline is real, measurable, and progressing in a way that matches the sales process you claim to follow.
Start with a shared definition of an opportunity. A common mistake is treating “someone might buy” as an opportunity. Instead, require minimum entry criteria: identified buyer, a defined problem, a next meeting scheduled, and a documented stage. For example, if a rep logs a deal after a first call but there is no agreed next step, it belongs in a separate “early interest” bucket, not the forecast pipeline.
Next, standardize stages so they describe observable behavior, not vibes. A stage should answer: what must be true for the deal to move forward? For instance, “Proposal” should require that pricing has been discussed and a proposal document has been sent, not merely that the rep plans to send one. When stages are behavior-based, forecasting becomes less subjective because stage conversion rates can be measured.
Then, enforce data completeness at the moment it matters. Minimum fields should be required before an opportunity can be marked as forecastable: estimated value, expected close date, decision process, and probability driver. A practical example: if the close date is missing, the deal cannot be forecasted because you cannot aggregate timing. If the value is missing, you cannot assess capacity or debt service implications for the business plan.
Probability should be tied to stage and verified with evidence. Avoid arbitrary percentages that never change. Use a simple rule: probability equals the historical likelihood of deals in that stage closing, adjusted only when specific conditions differ. For example, if “Security Review” is usually 40% to close but this customer already completed a similar review with no findings, you can document a reason to adjust upward. The key is that adjustments require a note tied to a concrete fact.
Forecast accuracy improves when you separate pipeline creation from pipeline movement. Pipeline creation is about adding new opportunities; pipeline movement is about advancing existing ones. Track both. If a team adds many deals but few move stages, the forecast will be inflated. A weekly hygiene routine helps: every opportunity is reviewed for stage correctness, next step clarity, and whether the close date still makes sense.
A useful cadence is a two-step review. First, a quick “data check” before the weekly forecast meeting: missing fields, stale next steps, and opportunities stuck in a stage too long. Second, a “stage validation” during the meeting: confirm that the evidence supports the stage and that the next step is scheduled with an owner and date.
To make this systematic, use a pipeline scorecard. Score each rep or team on three measurable items: percentage of opportunities with complete required fields, percentage of opportunities with an updated next step within the last 14 days, and stage aging distribution. Example: if 30% of deals have next steps older than 14 days, your forecast will be noisy because the pipeline is not reflecting current reality.
Example:
A rep logs a $120,000 deal after a discovery call. The buyer is interested, but there is no decision date and no next meeting. Under strict hygiene rules, the deal is placed in early interest. Two weeks later, the buyer agrees to a technical deep dive on March 12 and the rep records the decision process. Only then does it enter the forecast pipeline at the correct stage with a close date estimate.
Another example: an opportunity sits in “Negotiation” for 45 days with no documented next step. During the weekly data check, it is flagged as stale. The rep either schedules the next step and updates the expected close date or downgrades the stage if the proposal is not yet accepted. This prevents the forecast from counting a deal that is effectively paused.
Finally, keep forecasting honest by reconciling forecast vs actual at the stage level. If deals in “Proposal” close at 25% historically but the team is consistently forecasting at 60%, the issue is not “market conditions.” It is stage definitions, evidence quality, or probability logic. Fix the process, not the spreadsheet.
7.4 Improving Contracting Practices and Reducing Revenue Leakage
Revenue leakage often comes from contracts that look fine on paper but behave badly in day-to-day operations. The goal here is simple: make the contract easy to administer, hard to misinterpret, and aligned with how the business actually sells, ships, bills, and collects.
Foundational Concepts That Prevent Leakage
Start with three definitions your team can use without arguing.
First, revenue leakage is any amount the company should have billed or collected but did not, due to contract terms, billing mechanics, or process failures.
Second, contract interpretability is how reliably different people reach the same answer when they face a real transaction. If sales, finance, and operations interpret the same clause differently, leakage is likely.
Third, billing determinism is whether the contract provides enough information to bill correctly without heroic judgment. If billing requires “guessing” on key inputs like service dates, usage quantities, or acceptance criteria, you have a leakage risk.
A practical way to connect these ideas is to treat each contract clause as either a billing input, a billing rule, or a billing exception. Clauses that are none of the three are usually where disputes and underbilling begin.
Contracting Controls from Draft to Execution
1) Standardize the Contract “Data Model”
Before negotiating special terms, define the fields your billing system needs. For example, a services agreement might require: customer entity, contract start and end dates, service location, rate card version, invoicing frequency, milestone definitions, acceptance rules, and dispute windows.
Example: A contract includes “monthly reporting” but never states what counts as a month for reporting. If one team bills by calendar month and another by service month, you can lose a full month of billable activity.
2) Build a Clause-to-Process Map
Every clause should point to an operational owner and a process step. If a clause affects revenue, it must have a named owner for inputs, a named owner for billing, and a named owner for exceptions.
Example: A clause says the customer can withhold payment for “material nonconformance.” Without a process for documenting nonconformance and notifying billing, the customer will withhold longer than the contract allows.
3) Require “Billing Proof” Before Signature
Ask the contracting team to run a short test: take one realistic order and show how it becomes an invoice. This is not legal theater; it’s a sanity check.
Example: A pricing clause references “discounts based on volume tiers,” but the contract does not define whether tiers apply per order, per month, or per contract year. Billing proof forces the missing definition to surface before money is at stake.
4) Tighten Change Control
Most leakage grows after signature, when amendments arrive late or informally. Implement a change control rule: no amendment changes pricing, scope, or acceptance without a documented impact on billing.
Example: Sales agrees to add a feature “at no charge” during a call. If finance never receives a written scope change, the feature may still be billed under the original scope.
Advanced Details That Reduce Disputes and Underbilling
Acceptance and Service Timing
Acceptance clauses are a common leakage source because they determine when revenue is billable. Make acceptance criteria measurable and align them with operational reality.
Example: “Customer acceptance upon satisfaction” is hard to administer. Replace it with a checklist of deliverables and a clear timeline for deemed acceptance if the customer does not respond.
Usage, Measurement, and Audit Rights
For usage-based contracts, define measurement method, data source, rounding rules, and dispute resolution. Also ensure audit rights are operationally usable.
Example: If usage is measured by system logs but the contract allows the customer to dispute “any period,” you may spend months reconciling. Limit disputes to periods with documented discrepancies and require timely notice.
Billing Frequency and Proration
Contracts often fail at the edges: partial months, mid-cycle start dates, and cancellations. Define proration rules and cancellation billing.
Example: A contract starts on the 20th but says “billed monthly in advance” without proration. You either overbill (creating refunds) or underbill (creating leakage). A simple proration rule prevents both.
Mind Map: Contracting Practices That Stop Leakage
Example Workflow for a Single Contract
- Sales drafts using a template with required billing fields.
- Contracting runs billing proof on one sample order.
- Operations signs off on acceptance and service timing mechanics.
- Finance confirms proration, invoicing frequency, and dispute windows.
- After signature, any amendment triggers a billing impact checklist.
Example: A customer requests a scope reduction after signature. The amendment checklist forces the team to update the scope field, confirm whether acceptance milestones change, and ensure the next invoice reflects the revised rate and deliverables.
Practical Checklist for the Contracting Team
- Does every revenue-impacting clause map to a billing input, rule, or exception?
- Are acceptance criteria measurable and aligned to operational steps?
- Are pricing mechanics defined for tiers, discounts, and timing?
- Are proration and cancellation rules explicit?
- Is there a documented change control path for amendments?
- Can finance produce a correct invoice from the signed contract using defined inputs?
When these items are consistently true, revenue leakage drops because the contract becomes a tool for billing accuracy, not a source of interpretation battles.
7.5 Enhancing Customer Success and Service Delivery Metrics
Customer success is easiest to manage when it is treated like a system: inputs (what you promise), processes (how you deliver), and outputs (what you measure). Service delivery metrics should connect directly to customer outcomes, not just internal activity. If your dashboard shows “tickets closed,” but customers still churn, you are measuring your own busyness.
Start with a simple metric hierarchy. At the top sit customer outcomes such as retention, expansion, and satisfaction. Beneath those are leading indicators that explain why outcomes move, like onboarding completion, time to first value, and issue resolution quality. Finally, include operational metrics that ensure the leading indicators are achievable, such as staffing coverage, SLA adherence, and knowledge base usage.
A practical way to define metrics is to map each customer journey stage to one outcome metric and two supporting metrics. For example, during onboarding you might track: onboarding completion rate (outcome), time to first successful setup (leading), and number of onboarding steps completed without assistance (supporting). During ongoing service, you might track: renewal rate (outcome), first-contact resolution (leading), and average time to acknowledge and triage (supporting). This structure prevents the common problem of collecting many metrics that never explain anything.
Service delivery metrics should also be designed to avoid perverse incentives. If you measure average handle time, agents may rush and increase rework. If you measure SLA compliance without measuring resolution quality, you may “meet the clock” while leaving customers unsatisfied. The fix is to pair speed metrics with quality metrics. A simple pairing is: first-contact resolution rate plus customer effort score, or SLA compliance plus repeat-contact rate within seven days.
Below is a mind map that ties customer success metrics to the operational levers that drive them.
Mind Map: Customer Success and Service Delivery Metrics
To make this concrete, use a small set of metrics with clear definitions and consistent time windows.
1) Time to First Value
Define it as the elapsed time from contract start (or go-live date) to the first verified customer outcome. Example: for a logistics software customer, first value could be “first shipment successfully processed end-to-end.” Track it by onboarding cohort so you can see whether improvements actually reduce the metric.
2) Onboarding Completion Rate
Define completion as finishing required steps, not merely attending sessions. Example: a B2B SaaS onboarding might require data import, user provisioning, and a successful test workflow. If completion is low, investigate which step fails most often and whether support is the bottleneck.
3) First-Contact Resolution Rate
Measure the percentage of issues resolved without a follow-up ticket or escalation. Example: a billing dispute resolved with corrected invoices and confirmation in one interaction counts as first-contact resolution; a “we’ll look into it” response does not.
4) Repeat-Contact Rate Within Seven Days
Track how often customers contact you again about the same underlying problem shortly after resolution. Example: if a customer reports a reporting error and then reports the same error again within a week, your resolution quality is likely incomplete.
5) SLA Adherence With Quality Guardrails
SLA adherence is necessary but insufficient. Pair it with resolution quality. Example: if you promise acknowledgment within four hours, also track whether the issue is correctly categorized at triage. Misclassification can still “meet the SLA” while sending the customer down the wrong path.
6) Customer Effort Score
Use a short post-interaction survey question such as “How much effort did you have to put in to get your issue resolved?” Example: if customers report high effort, you likely have friction in documentation, unclear next steps, or repeated identity verification.
Once metrics are defined, assign ownership and review cadence. A weekly review should focus on leading indicators and operational enablers: queue health, triage time, and first-contact resolution. A monthly review should focus on customer outcomes: retention, renewal preparation progress, and satisfaction trends. When a metric moves, the team should know which process lever to pull. If time to first value rises, check onboarding step failure rates and support coverage during the first two weeks.
Finally, segment metrics so you can act. A single blended number hides causes. Example: if repeat-contact rate rises, split it by issue category (billing, configuration, integrations) and by customer size. You may find that small customers experience higher repeat rates due to missing setup guidance, while large customers are stable.
Good customer success metrics are not a scoreboard for internal performance. They are a map from delivery behavior to customer outcomes, with enough detail to tell you what to change and enough discipline to prevent gaming.
8. Margin Expansion Through Process and Capability Upgrades
8.1 Diagnosing Margin Drivers Using Unit Economics and Variance Analysis
Margin is just math with a memory: it reflects what you earn per unit, and it remembers what changed since last period. Unit economics gives you the “per unit” story, while variance analysis explains why the story changed. Together, they show which levers to pull and which ones to stop pulling.
Start with the Margin Identity That You Can Actually Use
Begin with a simple bridge from revenue to gross margin:
- Gross margin dollars = Units × Selling price per unit − Units × Variable cost per unit
- Gross margin % = Gross margin dollars ÷ Revenue
If your business sells bundles, services, or subscriptions, define the “unit” as the smallest repeatable commercial unit you can measure consistently (for example, per order, per customer-month, per service ticket, or per ton shipped). If you can’t measure it consistently, you can’t diagnose it consistently.
Build a Unit Economics Template That Separates Fixed from Variable
Create a table with these columns for the current period and the prior period (or budget):
- Volume (units)
- Price (revenue per unit)
- Variable cost (variable cost per unit)
- Gross margin per unit (price − variable cost)
- Contribution margin per unit if you also track variable operating costs
Keep variable costs truly variable. A common mistake is treating semi-fixed costs (like a partially utilized warehouse team) as variable, which makes variance results lie.
Easy example: A packaging company sells 10,000 boxes.
- Prior period: price $2.00/box, variable cost $1.40/box → margin $0.60/box
- Current period: price $2.05/box, variable cost $1.55/box → margin $0.50/box
Even though price rose, margin per unit fell because variable cost rose faster.
Use Variance Analysis to Split the Change Into Meaningful Buckets
For gross margin dollars, you can decompose the change into:
- Volume effect: (Current units − Prior units) × Prior margin per unit
- Price effect: Current units × (Current price − Prior price)
- Variable cost effect: Current units × (Current variable cost − Prior variable cost)
If you want more precision, split variable cost into components (materials, labor, freight, commissions, processing fees). Then you can identify which component moved.
Easy example continuation:
- Prior units: 10,000; current units: 10,500
- Prior margin per unit: $0.60; current margin per unit: $0.50
Gross margin dollars change =
- Volume effect: (10,500 − 10,000) × $0.60 = $300
- Price effect: 10,500 × ($2.05 − $2.00) = $525
- Variable cost effect: 10,500 × ($1.55 − $1.40) = −$1,575
Net change = $300 + $525 − $1,575 = −$750. The math says the problem is variable cost, not volume or price.
Diagnose Variable Cost with a Component-Level Variance Tree
Once you know variable cost is the culprit, break it down. A clean structure is:
- Materials
- Quantity per unit (usage)
- Price per input (supplier cost)
- Labor
- Hours per unit
- Wage rate
- Freight and logistics
- Cost per shipment
- Shipments per unit
- Other variable costs
- Processing fees per transaction
Easy example: Variable cost per box rose from $1.40 to $1.55.
- Materials: $0.80 → $0.90 (usage up 5%, supplier price up 7%)
- Labor: $0.35 → $0.36 (hours flat, wage rate up 3%)
- Freight: $0.25 → $0.29 (more expedited shipments)
Now you can choose actions: renegotiate suppliers, fix yield, reduce expedited shipping, or adjust routing.
Mind Map: Margin Diagnosis Workflow
Validate the Numbers Before You Blame Anyone
Variance analysis is only as good as the data mapping. Do three quick checks:
- Unit consistency: Are units defined the same way across periods? (e.g., returns netted or not)
- Timing alignment: Did revenue and variable costs land in the same period? If not, you may be diagnosing timing noise.
- Normalization: Exclude one-time items that distort variable cost per unit (like a special freight charge for a one-off rush).
Easy example: If a period includes a large one-time rework batch, variable cost per unit spikes. If you don’t normalize, you’ll “fix” the wrong lever.
Turn Findings Into a Clear Action List
Your output should be specific enough that an operator can act without guessing. For each driver, state:
- What changed (price, volume, variable cost component)
- By how much (per unit and total dollars)
- Likely cause supported by the component breakdown
- Immediate next check (for example, compare usage yield by product line, or review expedited shipment rate)
If you can’t state the likely cause with at least one measurable supporting detail, you haven’t diagnosed yet—you’ve only observed.
Case-Style Example with a Clean Conclusion
Suppose gross margin % fell from 30% to 27% on flat revenue. Unit economics shows margin per unit dropped from $0.60 to $0.50. Variance analysis attributes the change to variable cost: materials usage increased and freight per shipment rose due to more expedited orders. Volume and price effects are near zero. The action list becomes: reduce expedited shipments via routing rules, and run a yield improvement on the affected material lot and process step. The diagnosis is complete because it links dollars, per-unit mechanics, and component-level causes.
8.2 Reducing Waste and Rework Through Lean Process Improvements
Lean process improvement starts with a simple question: where does time go that does not create value for the customer? In practice, “waste” shows up as waiting, unnecessary movement, extra processing, defects, and work that gets redone because the first attempt was wrong. “Rework” is the waste with receipts—scrap, reprints, returns, and corrections that consume labor and delay delivery.
Foundational Waste Categories and What They Look Like
A useful starting point is to classify waste in a way that teams can recognize on the floor. For example:
- Waiting: operators idle because materials are missing or approvals are slow. If a workstation consistently waits 10 minutes per batch, that is not “normal downtime”; it is a process design issue.
- Motion: people walk back and forth for tools, labels, or forms. If the same item is fetched from storage 3 times per shift, the layout is doing unpaid work.
- Overprocessing: work that exceeds requirements, such as collecting data no one uses or performing inspections that do not change outcomes.
- Defects and Rework: wrong parts, incorrect specs, or documentation errors that trigger correction cycles.
- Inventory: piles of WIP that hide problems. If defects are discovered late, inventory is often the reason.
A practical rule: if you cannot point to a waste category with a specific example from the last week, the improvement effort will drift into opinions.
Map the Current Flow Before Fixing Anything
Lean improvements stick when they begin with a process map that includes handoffs, queues, and decision points. A “swimlane” map works well because it shows who owns each step. Include these details:
- Start and end conditions for each step (what triggers it, what completes it).
- Cycle time and touch time (how long the work is actively handled vs. waiting).
- Quality checks and where defects are detected.
- Inputs required at each step and where they come from.
Example: In a small assembly line, the map shows that operators wait for printed work instructions because the document release happens after engineering approval. The waste is not “people being slow”; it is the release sequence.
Root Cause Logic for Rework
Rework usually has a small set of root causes. Use a structured approach:
- Standardize the “right way”: if instructions are ambiguous, people will interpret them differently.
- Control the “right inputs”: if parts or specs vary, the process will compensate by correcting later.
- Detect problems early: if defects are found only at final inspection, rework becomes inevitable.
A simple way to connect symptoms to causes is to ask: “What must be true for the first attempt to succeed?” Then verify whether the process actually enforces those conditions.
Lean Tools That Reduce Waste Without Creating New Problems
1) 5S for motion and search time
- Sort: remove rarely used items from the station.
- Set in order: label locations and standardize tool placement.
- Shine: clean to reveal issues.
- Standardize: keep the same layout across shifts.
- Sustain: audit with a short checklist.
Example: A packaging area reduces search time by placing tape, labels, and cutters in fixed positions. Operators stop walking to the supply room mid-task, and the line steadies.
2) Visual controls and mistake-proofing
Use “show me” controls that reduce reliance on memory.
- Color-coded bins for part families.
- Templates that prevent incorrect placement.
- Checklists that require sign-off before moving to the next step.
Example: If the wrong label format causes returns, a poka-yoke approach can require scanning the correct label type before printing or applying.
3) Standard work and takt alignment
Standard work defines the sequence, timing, and quality checks. It should match the pace of the process so work does not pile up.
Example: If a station’s cycle time is 6 minutes but the schedule assumes 4, the station will either fall behind or produce rushed work that later fails inspection.
4) Small batch sizes and WIP limits
Large batches hide defects and increase waiting. Smaller batches with WIP limits make problems visible sooner.
Example: A team reduces batch size from 200 to 50 units and sets a WIP cap of 1 batch per step. Defects surface earlier, so rework time drops because corrections happen before downstream processing.
Mind Map: Lean Waste Reduction and Rework Control
Example: From Waste Observation to Measurable Rework Reduction
A mid-sized manufacturer tracks rework as “scrap plus corrections.” In one product family, rework is driven by incorrect torque settings. The team maps the process and finds that torque values are stored in a shared document and updated inconsistently across shifts.
They implement standard work with a single torque card at the workstation, plus a visual control that flags the correct setting before the operator starts. They also add an early check right after setup rather than waiting for final inspection.
Within the next two weeks, the rework rate drops because the first attempt succeeds more often. Lead time improves because fewer units cycle back to the correction step, and the team stops spending time chasing documentation updates.
Advanced Details That Make Improvements Last
Lean fails when teams improve the process but not the system around it. To prevent backsliding:
- Define ownership for each standard work element and each visual control.
- Use short audits that check compliance and quality, not just cleanliness.
- Track leading indicators like first-pass yield and setup errors, not only lagging metrics like total rework cost.
- Update standards when reality changes so the “standard” does not become a museum piece.
When waste is reduced, rework usually follows, because fewer defects are created and detected earlier. The best part is that the fixes are often straightforward: clearer steps, controlled inputs, and fewer opportunities to do the wrong thing quickly.
8.3 Upgrading Quality Management and Defect Reduction Controls
Quality management is easiest to run when it is treated like a system: inputs are defined, processes are controlled, outputs are measured, and problems are handled with discipline. In a private equity value creation plan, this matters because defects usually show up as cash leaks—returns, rework, warranty claims, expedited freight, and lost customers who quietly stop ordering.
Foundational Quality Controls That Actually Prevent Defects
Start by separating “quality assurance” from “quality control.” Quality control tests the output; quality assurance prevents the output from going wrong in the first place. A practical upgrade begins with three basics.
First, define critical-to-quality characteristics (CTQs) that map to customer requirements. Example: if a component must meet a specific torque range, the CTQ is not “quality of assembly,” but “torque within tolerance at shipment.”
Second, standardize the process steps that influence CTQs. If operators can choose between two tightening methods, you have two processes and two defect rates. Standard work should include the exact tool settings, inspection points, and what to do when readings drift.
Third, set control limits and response rules. A control chart is only useful if someone knows what action to take when a point crosses a limit. Example: if torque readings exceed the upper control limit for two consecutive samples, the rule triggers a tool calibration check and a stop-and-hold on the affected batch.
Building a Defect Reduction Loop from Data to Action
Once CTQs and process controls exist, defects become manageable because you can trace them to causes. The loop has five steps.
-
Capture defect data consistently. Use one defect taxonomy and one location for recording. Example: if “scratches” are logged sometimes as “cosmetic” and sometimes as “surface damage,” you will waste time arguing about labels instead of fixing the cause.
-
Prioritize by impact, not by volume alone. A small number of failures can be expensive if they trigger returns. Example: ten units failing a safety-related test may cost more than fifty units failing a cosmetic check.
-
Perform root cause analysis with a structured method. Use 5 Whys for simple, localized issues; use a fishbone diagram when multiple categories are plausible (materials, method, machine, measurement, people).
-
Convert root causes into controls. The goal is to change the process or the detection method so the defect cannot recur.
-
Verify effectiveness. After implementing a change, compare defect rates and process capability metrics before declaring victory.
A common mistake is treating root cause analysis as the end. In practice, the “analysis” is only valuable when it produces a control that measurably reduces defects.
Upgrading Measurement Systems So “Inspection” Means Something
Defect reduction fails when measurement is unreliable. Measurement system analysis checks whether variation comes from the product or from the measurement method.
Example: two inspectors measure the same part and disagree by 0.2 mm. If the tolerance is 0.3 mm, that disagreement can create false rejects and false accepts. Upgrades include calibrating gauges, standardizing measurement technique, and training inspectors to use the same reference points.
A simple rule: if measurement variation is large relative to the tolerance, you must fix the measurement system before you can trust defect trends.
Strengthening Process Capability and Control Plans
After measurement is credible, you can evaluate whether the process can consistently meet CTQs. Process capability metrics help, but the control plan is what keeps capability from drifting.
A control plan should specify: the CTQ, the process step, the sampling frequency, the measurement method, the control limits, and the escalation path. Example: for a coating thickness CTQ, the plan might require sampling every 30 minutes during steady-state, with immediate escalation if readings trend upward.
Escalation should be concrete. “Investigate” is not an escalation. “Stop the line, check spray nozzles, verify material batch, and re-qualify the first article” is.
Mind Map: Quality Management and Defect Reduction Controls
Example: Turning a Recurring Defect Into a Controlled Process
Assume a packaging line produces occasional seal failures. The defect rate is low, but each failure triggers customer complaints and replacement shipments.
- Define CTQ: seal integrity meeting a pass/fail test at shipment.
- Standardize method: specify dwell time and pressure settings, plus how to verify the settings before the first run.
- Upgrade measurement: calibrate the seal tester and standardize how samples are taken.
- Create a control plan: sample every 15 minutes; if two consecutive failures occur, stop the line and check the heat element temperature.
- Root cause analysis: when failures occur, 5 Whys points to inconsistent material thickness from one supplier batch.
- Corrective action: add incoming material checks and tighten supplier batch acceptance.
- Verify: defect rate drops and the control chart stabilizes within limits.
The key is that the fix is not “be more careful.” It is a chain of controls that makes the process behave predictably and makes deviations visible quickly.
Governance That Prevents Quality from Becoming a Side Project
Controls need ownership and routine. A lightweight governance cadence works: a short daily review for active issues, a weekly review for trends, and a monthly audit of control plan adherence.
CAPA tracking should be simple and time-bound. Example: if a corrective action is due in two weeks, the system should show whether the action is complete, what evidence was collected, and whether the defect rate improved afterward. When governance is this concrete, quality stops being a topic and becomes a measurable operating outcome.
8.4 Improving Labor Productivity and Workforce Planning
Labor productivity is the ratio of output to labor hours. In practice, you improve it by reducing avoidable labor time, increasing throughput per hour, and matching staffing to demand without creating quality problems. Workforce planning is the discipline that keeps those improvements from collapsing when volumes shift.
Foundational Concepts That Make Productivity Measurable
Start with a simple baseline that you can explain to a shift supervisor. Pick one primary output measure and one labor measure.
- Output measure examples: units produced, service tickets resolved, orders shipped, or billable hours delivered.
- Labor measure examples: direct labor hours, total labor hours, or labor hours by function.
Then define productivity as:
- Productivity = Output ÷ Labor Hours
If output is seasonal, productivity will look noisy. Fix that by using rolling averages (for example, last 8 weeks) and by separating volume effects from process effects. A useful split is:
- Volume effect: more work with similar methods.
- Efficiency effect: better methods, fewer delays, faster cycle times.
Workforce Planning That Matches Demand Without Guessing
Workforce planning should answer three questions: How many people do we need, when do we need them, and what skills do we need.
-
Forecast demand at the level you schedule
If you forecast only monthly totals, you will schedule wrong. Convert demand into weekly workload by shift. For example, if customer orders spike on Mondays, staffing must reflect that pattern. -
Translate workload into standard work
Standard work is the time required to complete a unit of work under normal conditions. You can build it from historical averages, but tighten it by observing a few representative tasks and removing outliers caused by rework. -
Plan capacity with a realistic utilization target
If you schedule everyone at 100% utilization, you create a backlog whenever something changes. A practical approach is to plan for a utilization level that leaves room for training, breaks, and small disruptions.
Mind Map: Labor Productivity and Workforce Planning
Practical Examples That Turn Theory Into Schedules
Example 1: Manufacturing line labor planning
A plant notices productivity drops when a new product mix arrives. The baseline shows output per labor hour fell by 12%. The team breaks the problem down:
- Cycle time increased from 8.0 to 9.0 minutes per unit.
- First-pass yield dropped from 96% to 90%, creating rework.
Workforce planning then changes in two ways. First, they schedule additional quality checks during the first two weeks of the new mix. Second, they adjust staffing by shift based on the weekly mix forecast, not the monthly production plan. Productivity improves because labor hours stop being consumed by avoidable rework and because staffing aligns with the actual workload curve.
Example 2: Service operations staffing for ticket queues
A support team uses monthly headcount targets. When ticket volume rises mid-month, the team relies on overtime and customer wait times spike. The fix is to forecast tickets by week and by category, then map categories to skill requirements.
They create a simple competency matrix: Category A requires skill level 2, Category B requires level 1, and so on. Staffing becomes role-based coverage rather than generic headcount. Productivity improves because the right people handle the right work, reducing transfers and rework caused by incomplete resolution.
Advanced Details Without the Usual Confusion
1) Separate direct productivity from system drag
If productivity falls, check whether labor hours increased due to system drag. Common sources include late materials, unclear handoffs, and waiting for approvals. Track “queue time” and “handoff delays” as leading indicators. When these improve, labor productivity often follows.
2) Use a flex pool for predictable variability
Not all variability is random. If you have known weekly patterns, create a flex pool for roles that can be reassigned quickly. This reduces overtime while keeping service levels stable.
3) Build a ramp plan for new hires and cross-training
Training time is labor time. Treat it as an investment with milestones: shadowing, supervised work, then independent work. Track ramp completion by competency so managers can plan capacity realistically.
4) Guard quality while chasing speed
If you push throughput without quality controls, rework will eat the gains. Tie productivity targets to quality metrics like first-pass yield, defect rate, or customer satisfaction scores measured at the same cadence.
A Simple Governance Rhythm That Works
Run a weekly staffing review using three numbers: planned labor hours, actual labor hours, and output. Then add two operational drivers: cycle time and rework rate. Daily huddles should focus on constraints for the next shift—materials, bottlenecks, and queue buildup—so the plan adjusts before the backlog becomes a habit.
When labor productivity improves, it should show up as more output per labor hour without a quality penalty. When workforce planning is correct, staffing changes should be driven by workload patterns and skill coverage, not by last-minute panic.
8.5 Standardizing Operating Procedures and Management Reporting
Standardization is what turns “we think this is working” into “we can prove it.” In an operating improvement program, the goal is not to create paperwork for its own sake; it’s to make execution repeatable across teams, shifts, locations, and add-on acquisitions.
Foundational Principles for Procedure Standardization
Start with three rules. First, every procedure must answer what to do, when to do it, and what “done” looks like. If a procedure only describes tasks, it will drift during busy weeks. Second, procedures should be written for the person doing the work, not for the person auditing it. A good test is whether a new hire can follow the steps without guessing. Third, reporting must be tied to procedures; if a metric is reported but no one owns the actions behind it, the metric becomes a spectator sport.
A practical way to begin is to select five “control points” that protect value: order-to-cash accuracy, production scheduling adherence, quality defect containment, inventory accuracy, and month-end close completeness. Then standardize the procedures around those points before expanding.
Procedure Design That Holds Up Under Pressure
Use a consistent procedure template:
- Purpose and scope: One paragraph on why it exists and where it applies.
- Inputs: Systems, documents, and data required.
- Steps: Numbered actions with decision points.
- Controls: Checks that prevent errors from reaching customers or the balance sheet.
- Exceptions: What to do when the normal path fails.
- Records: What gets saved, where, and for how long.
- Owner and cadence: Who maintains it and when it is reviewed.
Example: A procedure for “Customer Order Changes” should specify how to validate pricing, how to update the order in the system, and what approval is required if the change affects margin beyond a threshold. The control is not “someone reviews it,” but “the system blocks unapproved changes and the review log is stored.”
Management Reporting That Connects Actions to Outcomes
Management reporting should be structured like a chain: leading indicators drive operational actions, and lagging indicators confirm results. A common mistake is to start with financial statements and then try to reverse-engineer operational drivers. Instead, begin with operational control points and build upward.
A simple reporting stack looks like this:
- Daily operational dashboard for teams (e.g., schedule adherence, defect rate, backlog aging).
- Weekly management review for cross-functional issues (e.g., root causes for missed shipments, recurring quality escapes).
- Monthly performance pack for governance (e.g., KPI trends, variance explanations, cash and covenant status).
Each KPI needs a definition that prevents argument. Include the formula, data source, refresh timing, and who can change it. If a KPI is “on-time delivery,” define whether it’s measured by ship date, delivery date, or promise date, and specify the denominator.
Mind Map: Operating Procedures and Reporting System
Implementation Approach Without Chaos
Begin with a pilot. Choose one site or one functional area and standardize the procedures for the selected control points. Train the team using real examples from the last month, not hypothetical scenarios. Then run a short “certification” step: each participant demonstrates the procedure using a sample transaction (for example, processing a customer change order or reconciling an inventory count).
Next, connect procedures to reporting. If the procedure includes a control that blocks unapproved pricing changes, the reporting should include a metric that shows how often the block triggers and how many exceptions were manually approved. That way, the reporting reflects both performance and process discipline.
Example: Month-End Close and Variance Explanations
A standardized month-end close procedure should specify the sequence of tasks, responsible roles, and reconciliation requirements. For instance, inventory reconciliation might require a variance threshold that triggers investigation. The management reporting pack then includes:
- Close timeline adherence (e.g., days to close)
- Top reconciliation variances (by account)
- A short variance narrative using a consistent structure: cause, impact, corrective action, and prevention step
If the inventory variance is caused by a missed cycle count, the corrective action is to complete the count; the prevention step is to adjust scheduling rules in the procedure and confirm the updated schedule is reflected in the reporting.
Advanced Details That Prevent Drift
Standardization fails when procedures are treated as static documents. Add two mechanisms. First, maintain a change log with reason codes (process improvement, system change, control tightening). Second, run a monthly “exception review” where the team lists the top five procedure exceptions and updates the procedure if the exception is recurring.
This is where the system becomes self-correcting. Procedures become more accurate because they absorb real-world friction, and reporting becomes more useful because it reflects the actual process rather than an idealized one.
9. Integration Planning for Platform and Add on Acquisitions
9.1 Defining Integration Scope and Separating Must Do from Nice to Have
Integration scope is the set of changes you will actually make after close, and the boundaries that keep the project from eating the entire company. A good scope starts with a simple question: which decisions must be true for the deal thesis to hold, and which improvements can wait until the business is stable?
Start with the Deal Thesis and the Value Mechanisms
Integration work should map to specific value mechanisms you already modeled. If the thesis assumes margin improvement, scope must include the levers that create it, such as pricing discipline, procurement savings, or process standardization. If the thesis assumes revenue retention, scope must include customer-facing continuity, contract handling, and service levels.
A practical way to begin is to list the top three value mechanisms and attach one “integration requirement” to each. Example: “Retention relies on uninterrupted service” becomes a requirement to keep service SLAs and staffing stable for the first 90 days.
Define the Integration Boundary: What Changes and What Stays
Scope becomes clearer when you separate “system of record” decisions from “process preference” decisions.
- System of record decisions: which ERP, CRM, billing platform, or data warehouse is authoritative.
- Process decisions: how approvals, forecasting, purchasing, and reporting are done.
- People decisions: who owns customer relationships, who signs off on exceptions, and who runs the operating cadence.
If you don’t decide these boundaries early, teams will spend weeks arguing about tools while customers experience real-world delays.
Use a Must Do vs Nice to Have Filter
The filter is not about ambition; it’s about risk and timing.
Must Do Criteria
Must do items are those that:
- Protect cash flow (billing accuracy, collections, working capital controls).
- Prevent operational failure (supply continuity, payroll, core production scheduling).
- Enable covenant compliance (reporting timeliness, KPI definitions, debt service visibility).
- Reduce legal or contractual exposure (contract terms, customer notifications, required consents).
- Stabilize people and customers (clear ownership, service SLAs, escalation paths).
Nice to Have Criteria
Nice to have items are those that:
- Improve efficiency but do not break the business if delayed.
- Require heavy change management with uncertain payoff.
- Depend on data cleanup that will take longer than the integration window.
- Are “good ideas” that do not directly support the deal thesis.
A helpful rule: if a task can be paused for 90 days without creating a measurable negative outcome, it’s probably nice to have.
Build the Integration Scope Inventory
Create an inventory of integration initiatives, then score each one against the must do criteria. Keep the scoring simple: Protects Cash Flow / Prevents Failure / Enables Compliance / Reduces Exposure / Stabilizes Customers-People. Mark each as Yes or No.
Example initiatives and how they typically score:
- Unify billing master data: Must do (Yes to cash flow).
- Standardize expense policy: Often nice to have (may be delayed if controls remain).
- Set a single monthly operating review cadence: Must do (Yes to compliance and stability).
- Migrate CRM fields to a new taxonomy: Often nice to have (depends on reporting needs).
Mind Map: Integration Scope and Prioritization
Turn Scope Into a 30-60-90 Day Plan
Must do items should land in the first 30 to 60 days, because that’s when operational drift and customer confusion are most likely.
- First 30 days: stabilize ownership, confirm reporting definitions, ensure billing and collections continuity, and establish escalation paths.
- Days 31–60: implement the minimum controls that support the thesis, such as pricing approval rules and working capital routines.
- Days 61–90: complete the “must do” system/process changes that require more effort, while parking “nice to have” work behind a gate.
A gate is a decision point with a checklist: data readiness, process owner assigned, training plan confirmed, and KPI baseline captured.
Example: Two Integration Scopes for the Same Deal Thesis
Assume the thesis is “retain customers and improve gross margin through pricing discipline.”
Scope A (Must Do Focused)
- Must do: keep customer service teams intact, enforce pricing approval workflow, standardize discount authorization, and align reporting on gross margin components.
- Nice to have: redesign the sales compensation plan and migrate CRM fields.
Scope B (Overreaching)
- Must do: everything in Scope A.
- Nice to have: also migrate CRM immediately and re-train sales on a new territory model.
Scope B often creates avoidable friction: sales teams spend time learning tools instead of executing pricing discipline, and reporting lags because field mapping is incomplete.
Practical Output: A One-Page Integration Scope Statement
Your final scope should fit on one page for the operating team:
- Must do initiatives with owners and target dates.
- Nice to have initiatives with a “parked” status and the reason.
- Boundaries for systems of record and decision rights.
- KPIs that prove the must do work is working.
When scope is explicit, integration meetings stop being debates about preferences and start being decisions about outcomes.
9.2 Harmonizing Systems Data and Reporting Across Entities
When a platform company buys an add-on, the biggest reporting risk is not missing numbers—it’s comparing numbers that were produced with different rules. Harmonizing systems data and reporting across entities means standardizing how data is captured, transformed, and presented so that KPIs mean the same thing everywhere.
Foundational Concepts That Prevent Misalignment
Start with three definitions that you will reuse throughout the work:
- System of record: where the “truth” is stored for each data element (for example, invoices in ERP, headcount in HRIS).
- Business definition: how a KPI is calculated (for example, “gross margin” equals revenue minus cost of goods sold, using specific accounting treatment).
- Reporting grain: the unit of time and level of detail (for example, weekly by customer segment, monthly by cost center).
A simple rule keeps teams sane: if two entities disagree on a KPI, you should be able to trace the discrepancy to either the system of record, the business definition, or the reporting grain.
Step 1: Inventory Data Sources and Map Ownership
Create a data inventory for both entities. For each KPI, list:
- Source systems (ERP, CRM, WMS, payroll)
- Data owners (finance, operations, sales)
- Update frequency (daily, weekly, monthly)
- Known exceptions (manual adjustments, legacy fields)
Example: Entity A records customer returns as negative invoices; Entity B records them as a separate credit memo type. If you don’t map that difference, “net revenue” will look inconsistent even when the underlying economics match.
Step 2: Standardize Data Models and Field Semantics
Harmonization fails when the same field name means different things. Standardize semantics by defining a canonical model. For instance:
- Customer: unique customer ID, legal entity mapping, billing vs shipping identity
- Product: SKU master, active/inactive status, category mapping
- Cost center: hierarchy rules and reclassification logic
Example: One entity might treat “freight” as part of COGS, while the other books it as operating expense. You can harmonize reporting by either reclassifying in the transformation layer or by defining two separate metrics and then aligning them to a single KPI definition.
Step 3: Build a Transformation Layer with Controlled Logic
Instead of forcing every system to change immediately, use a transformation layer that converts source data into the canonical model. Keep transformations auditable:
- Version the mapping rules
- Log exceptions and overrides
- Reconcile totals at each stage (source totals → transformed totals → KPI totals)
Example: If Entity B uses different tax codes, the transformation layer can normalize tax treatment so revenue is comparable. You’ll still see the raw tax differences in the source, but the KPI uses the standardized view.
Step 4: Harmonize Reporting Cadence and KPI Definitions
Agree on a reporting calendar and KPI pack. Include:
- KPI definitions and calculation formulas
- Required supporting schedules
- Variance thresholds that trigger review
Example: If one entity reports “EBITDA” including management fees and the other excludes them, you’ll get false variance. Put the management fee treatment into the KPI definition and ensure the same general ledger mapping is used.
Step 5: Validate with Reconciliation and “Same Question” Testing
Validation should answer one question: “If we ask for the same business fact, do we get the same result?”
Run reconciliation tests:
- Month-end totals tie-out from ERP to transformed dataset
- Customer-level rollups tie-out from CRM/invoicing to revenue KPIs
- Headcount tie-out from HRIS to labor cost allocations
Example: If customer churn is calculated from contract end dates in one system and from last invoice dates in another, churn will differ. Fix by standardizing the churn definition to a single date basis and documenting how missing dates are handled.
Mind Map: Harmonizing Systems Data and Reporting
Practical Example: One KPI, Three Places It Can Break
Pick a single KPI—say, net revenue—and trace it end-to-end.
- System of record mismatch: Entity A uses invoicing; Entity B uses billing statements.
- Definition mismatch: Entity A nets returns; Entity B nets returns only if they are processed by month-end.
- Grain mismatch: Entity A reports by billing month; Entity B reports by invoice date.
Fixing net revenue requires aligning all three. After harmonization, you should be able to reproduce the same net revenue number for the same set of transactions, regardless of which entity’s source data you start from.
Operational Cadence That Keeps It Working
Harmonization isn’t a one-time migration. Establish a lightweight operating rhythm:
- Weekly mapping review for new exceptions
- Monthly KPI pack sign-off after close
- A single change log for definitions and transformations
This prevents the classic problem where the first month looks great, and the second month quietly drifts because someone updated a mapping rule “just for this one case.”
9.3 Managing People Integration and Retention of Key Talent
People integration is where deal math meets human reality. If you treat it like an HR checklist, you’ll lose the very capabilities you bought. The goal is simple: keep critical roles stable long enough to execute the operating plan, while making necessary changes in a controlled way.
Start with a clear definition of “key talent.” Use a two-part test: (1) the person owns a value driver (pricing discipline, engineering throughput, sales conversion, regulatory compliance), and (2) the person is hard to replace quickly (unique relationships, specialized knowledge, or sole ownership of a process). Then map each key role to a risk level based on time-to-replace and business criticality. For example, the controller who closes books on a tight calendar is often replaceable slower than a generalist finance manager because the close rhythm and lender reporting are already embedded.
Next, build an integration operating model for people. Assign decision rights for org design, compensation alignment, and role changes. Without this, managers end up negotiating informally, which creates inconsistent offers and resentment. A practical approach is to set a “decision cadence” for the first 60 days: weekly leadership meetings for org and role decisions, and a separate weekly forum for compensation and retention actions.
Retention works best when it is specific and time-bound. Create a retention plan that ties to measurable milestones rather than vague promises. For instance, a sales leader might receive a retention bonus contingent on maintaining pipeline coverage and closing a defined set of priority accounts through the first quarter post-close. A plant manager might be retained based on achieving safety targets and hitting a production schedule for a defined number of weeks. The key is to define the milestone, the measurement source, and the consequence of missing it.
Communication should be accurate, consistent, and role-aware. Key talent needs clarity on what changes and what does not. A useful pattern is a three-message sequence: first, confirm employment continuity and reporting lines; second, explain the integration timeline and what decisions are already made; third, outline what support exists for the transition (training, systems access, decision escalation). Keep it short enough to be read, and structured enough to be repeated.
Cultural integration is not about “blending” everything. It’s about preventing friction in the behaviors that affect performance. Identify the top five behaviors that drive results in the target company and the top five behaviors that drive results in the platform. Then decide which behaviors must be preserved, which can be adapted, and which will be replaced. Example: if the target has a weekly customer escalation meeting that resolves issues within 48 hours, preserve it even if other meeting formats change.
To avoid losing people during the transition, manage the “uncertainty budget.” People tolerate change; they don’t tolerate constant ambiguity. Reduce uncertainty by publishing a simple org chart timeline and a list of decisions that will be made by specific dates. If you cannot commit to a date for compensation alignment, at least commit to the process: who decides, what inputs are used, and when an interim decision will be communicated.
Finally, execute a structured onboarding for key talent into the new governance and reporting environment. Provide a “first 30 days” plan that includes: access to systems, cadence for KPI reporting, escalation paths for operational issues, and clarity on what the board and lenders will ask for. For example, if the platform requires monthly covenant reporting, ensure the controller and finance team have the exact templates and definitions on day one, not after the first reporting cycle.
Mind Map: People Integration and Retention
Example: Retention Plan for a Customer-Facing Leader
A platform acquires a regional services firm. The key role is the head of customer success, who owns renewal negotiations and service escalation. The retention plan includes a 12-month bonus paid in two tranches. Tranche one requires renewal of 90% of at-risk contracts and a reduction in average resolution time from 10 days to 8 days, measured from the service ticket system. Tranche two requires maintaining customer satisfaction scores above the agreed threshold and completing the transition of escalation workflows into the platform’s governance. The contract also specifies what happens if the role is terminated without cause or if the role changes materially.
Example: Reducing Uncertainty During Org Changes
In the first month post-close, managers are told that reporting lines will change, but the exact structure is still being finalized. Instead of leaving everyone guessing, leadership publishes a “decision ladder”: weekly updates on what is decided, what is under review, and what is not changing. For instance, finance reporting definitions and lender reporting templates are finalized immediately, while the broader org chart is finalized in week six. This prevents key talent from spending their time preparing for multiple competing futures.
Example: Behavioral Alignment That Protects Performance
The target company runs a weekly operations huddle that resolves bottlenecks with a clear owner and due date. The platform uses a monthly review with broader discussion. The integration decision is to preserve the weekly huddle for the first quarter, while adding the platform’s monthly reporting structure on top. This keeps the operational rhythm intact while still meeting governance needs.
Case-Ready Checklist for Key Talent Integration
- Key roles identified with value-driver and replaceability logic
- Risk tiers assigned and retention actions matched to tiers
- Decision rights and weekly cadence established for org and compensation
- Retention incentives tied to milestones with defined measurement sources
- Communication sequence prepared and repeated consistently
- Behavioral alignment choices documented: preserve, adapt, replace
- Decision timeline published to control uncertainty
- First 30 days onboarding plan delivered with systems and reporting access
9.4 Capturing Synergies Through Commercial and Back Office Coordination
Synergies don’t appear because two teams shake hands. They show up when commercial decisions and back office execution move in the same direction, with shared definitions, shared timing, and shared accountability. This section explains how to coordinate both sides so synergy targets translate into cash.
Foundations for Synergy Capture
Start by separating synergy types into two buckets:
- Commercial synergies: revenue uplift, retention improvement, pricing discipline, and cross-sell.
- Back office synergies: cost reduction, process standardization, and working capital improvements.
Then connect them through a simple rule: every commercial change must have a back office “plumbing” owner, and every back office change must have a commercial “demand signal” owner. If you can’t name both, the synergy is still a slide.
Shared Definitions That Prevent Misfires
Before planning initiatives, align on how you will measure outcomes. Use the same definitions for:
- Revenue retention (what counts as retained, and how churn is treated)
- Gross margin (whether rebates, freight, and returns are included)
- Cost savings (run-rate versus one-time reductions)
- Working capital (how you treat inventory valuation, credit terms, and dispute timing)
A practical example: if commercial teams promise “better pricing,” finance must know whether that means higher list price, lower discounting, or reduced rebates. Otherwise, the back office may report savings that don’t match the commercial story.
Coordination Model for Commercial and Back Office
Use a two-lane operating rhythm.
Lane 1: Commercial Execution
Commercial initiatives typically require back office support in three areas:
- Order-to-cash accuracy: correct pricing, discount approvals, and contract terms.
- Customer experience consistency: billing timing, dispute handling, and service-level commitments.
- Pipeline and forecasting discipline: clean CRM data feeding planning and capacity decisions.
Example: A cross-sell program targets existing customers with add-on products. If the back office cannot set up new SKU pricing rules quickly, sales will either stall or create manual workarounds that later become billing disputes.
Lane 2: Back Office Execution
Back office initiatives typically require commercial input in three areas:
- Policy choices: credit limits, dispute thresholds, and approval matrices.
- Process design: how exceptions are handled when customers request non-standard terms.
- Data mapping: customer, product, and contract structures that affect reporting.
Example: Standardizing credit terms reduces risk and improves cash conversion, but commercial must confirm that the new terms won’t break key customer agreements or cause avoidable churn.
Mind Map: Synergy Capture
Practical Workflow from Plan to Benefits
Step 1: Build a Synergy Initiative Register
For each synergy target, record:
- Initiative owner (commercial or back office)
- Dependent owner (the other function)
- Systems or process impacted
- Definition of success and baseline
- Timing for Day One, 30/60/90 days, and run-rate
Example: “Reduce billing disputes by 20%.” Commercial owns the contract and pricing rules; back office owns dispute workflows and billing corrections.
Step 2: Create a Dependency Map for Critical Paths
Most synergy delays come from dependencies, not effort. Identify the top five dependencies that must land before benefits can be measured. Typical ones:
- Pricing and discount rule configuration
- Contract clause interpretation and billing logic
- CRM-to-ERP data mapping
- Credit policy approval workflows
- Reporting reconciliation cadence
Step 3: Validate Benefits with a Reconciliation Loop
Set up a monthly reconciliation that compares:
- Commercial-reported outcomes (retention, pricing realization)
- Finance-reported outcomes (margin, cash collection)
- Operational metrics (order accuracy, dispute cycle time)
If commercial says pricing improved but finance shows margin flat, the reconciliation reveals whether discounts shifted into rebates, or whether freight and returns absorbed the gain.
Example: Coordinated Pricing and Collections Initiative
Goal: Improve cash collections and protect margin.
- Commercial changes: tighten discount approvals and standardize contract terms for new orders.
- Back office changes: update billing rules, enforce credit limits, and standardize dispute categories.
Coordination: the commercial owner confirms which customers can receive exceptions; the back office owner ensures exceptions are coded so they don’t break reporting.
KPI set:
- Pricing realization versus baseline
- Gross margin after rebates and freight
- Days sales outstanding
- Dispute rate and average dispute resolution time
When these move together, you can attribute the synergy to the initiative rather than to random month-to-month noise. When they don’t, the reconciliation loop points to the exact dependency that failed.
9.5 Tracking Integration Benefits and Preventing Value Erosion
Integration benefits don’t show up because a slide says they will. They show up because you can measure them, assign ownership, and stop value leakage early. This section explains a systematic way to track integration benefits while preventing the quiet erosion that happens when processes, incentives, and reporting don’t line up.
Foundational Principle: Benefits Must Be Measurable and Time-Bound
Start by translating each planned synergy or improvement into a metric with a baseline, a target, and a measurement cadence. For example, if procurement savings are expected, define the metric as “average unit cost for top 50 SKUs” rather than “procurement efficiency.” If revenue retention is expected, define it as “net revenue retention by cohort” rather than “customer stickiness.”
A simple rule: if a metric can’t be audited from source systems (invoices, CRM, payroll, GL), it will eventually become a debate instead of a number.
Benefit Tracking System: From Workstreams to Outcomes
Use a three-layer structure so you can trace results back to actions.
- Workstream outputs: what the integration team does (new pricing tool live, new vendor contracts signed, revised billing workflow).
- Operational KPIs: what changes in operations (order-to-cash days, defect rate, on-time delivery, invoice accuracy).
- Value outcomes: what changes financially (gross margin, EBITDA, free cash flow, covenant headroom).
When these layers are connected, you can answer two questions quickly: “Did we do the work?” and “Did it change the business?”
Mind Map: Integration Benefit Tracking and Value Protection
Example: Procurement Savings Without Value Erosion
Assume the plan targets $2.0 million annualized savings from renegotiating freight and packaging. The tracking approach should include:
- Baseline: average freight cost per shipped unit for the prior quarter.
- Target: reduce freight cost per unit by 6% by month 6.
- Cadence: weekly for contract activation milestones, monthly for cost metrics.
- Audit trail: carrier invoices and shipment volumes.
Value erosion often appears as “savings that cause service problems.” Prevent this by adding a guardrail KPI: on-time delivery percentage. If freight costs drop but late deliveries rise, the savings may be offset by expedited shipping, chargebacks, or churn. Track both, and require the workstream owner to explain deviations.
Example: Revenue Retention Tracking That Doesn’t Get Gamified
If the plan expects improved retention after integrating sales and customer service systems, track retention using cohorts based on contract start dates or customer acquisition channels. Include:
- Baseline: churn rate and average revenue per customer for the last two quarters.
- Target: reduce churn by 1.5 percentage points over the first six months.
- Guardrails: average discount rate and complaint volume.
A common failure mode is “discounting to keep customers,” which can mask churn while damaging margin. Guardrails keep the team honest by showing whether retention is achieved through sustainable economics.
Preventing Value Erosion Through Measurement Integrity
Value erosion frequently comes from measurement breakdowns, not from bad intentions.
- Chart of accounts alignment: If the combined company changes how costs are booked, savings can look real while cash doesn’t move. Require a mapping document and a reconciliation step each month.
- Timing differences: One-time charges or delayed billing can distort KPI trends. Use trailing averages and separate “run-rate” from “integration costs.”
- Ownership clarity: Every metric needs a named owner who can explain movement and propose corrective action.
Governance Cadence: Make Tracking a Habit, Not a Report
A practical cadence looks like this:
- Weekly: workstream milestones and KPI movement for the top 10 metrics tied to value outcomes.
- Monthly: value review that reconciles operational KPIs to financial impact, including a short variance narrative.
- Escalation: predefined thresholds for guardrail breaches, such as on-time delivery dropping below a set level or working capital days increasing beyond a band.
When escalation triggers, the goal is not blame. It’s to restore the measurement and the process quickly.
Advanced Detail: Attribution Without Endless Complexity
Attribution answers “what caused the change?” You don’t need perfect causality to be useful. Use a structured approach:
- Before-and-after with guardrails: compare KPI movement around key integration milestones.
- Cohort segmentation: separate customers, products, or sites that were actually migrated from those still running legacy processes.
- Counterfactual checks: if possible, compare to a segment that didn’t receive the change yet.
This keeps the team from claiming credit for market effects while still recognizing real operational wins.
Close the Loop: Turn Tracking Into Corrective Action
Tracking is only valuable if it drives decisions. Each metric review should end with one of three outcomes: confirm progress, adjust the plan, or fix the measurement. If you can’t do that, the metric isn’t yet fit for purpose.
10. Governance Reporting and Value Protection After Closing
10.1 Establishing Board and Management Governance With Clear Decision Rights
Good governance is mostly about preventing avoidable confusion. In a private equity-backed company, the board sets direction and oversight, while management runs the business day to day. The trick is making decision rights explicit enough that people know what to do when time is short and information is incomplete.
Foundational Principles for Decision Rights
Start with three rules.
-
One decision owner per decision. If two groups can approve the same action, you will eventually get two approvals that disagree, or no approvals at all.
-
Escalate by threshold, not by mood. Use clear triggers such as spend size, leverage impact, covenant risk, or customer concentration.
-
Separate oversight from execution. The board reviews outcomes and risks; management executes plans. When the board starts “doing,” management stops “deciding.”
A practical way to implement this is to define decision categories and assign an owner and an approval path for each.
Decision Categories and Ownership
Use a simple taxonomy that maps to how value is created and protected.
- Strategy and capital allocation: major growth bets, divestitures, and multi-year investment priorities.
- Financing and balance sheet actions: debt amendments, refinancing, equity injections, and material guarantees.
- Operating plan and budgets: annual plan approval, quarterly updates, and major reforecasts.
- Risk management: insurance coverage changes, compliance remediation, and material litigation responses.
- People and incentives: executive hiring, compensation changes, and retention plans.
- Commercial actions: pricing frameworks, key contract terms, and customer retention programs.
- Transactions and exceptions: acquisitions, add-ons, related-party transactions, and waivers.
For each category, specify: who proposes, who decides, who approves, and who is informed.
Governance Operating Rhythm
Decision rights work only if the governance cadence supports them.
- Board meetings: focus on performance vs plan, covenant and liquidity status, major risks, and decisions requiring board approval.
- Management operating reviews: weekly or biweekly for execution metrics, issues, and corrective actions.
- Committee structure: use committees only where they reduce friction, such as an audit/risk committee and an investment committee.
A common best practice is to require management to submit board decision memos with a consistent structure: decision requested, background, options considered, recommendation, financial impact, risks, and the specific approval sought.
Practical Example of a Decision Rights Matrix
Below is a compact RACI-style matrix for common actions. The point is not the labels; it’s the clarity.
| Decision | Propose | Decide | Approve | Informed |
|---|---|---|---|---|
| Annual budget | CEO/CFO | CEO | Board | PE sponsor reps |
| Capex above threshold | CFO | CFO | Board | CEO |
| Debt amendment affecting covenants | CFO | CFO | Board | Lenders |
| New executive hire | HR lead | CEO | Board for top role | PE sponsor reps |
| Pricing change for top 20 customers | Sales leader | CEO | — | CFO |
| Add-on acquisition | CEO | CEO | Board | Audit/risk committee |
| Settlement of material litigation | General counsel | CEO | Board | CFO |
Set thresholds based on your financing structure and risk tolerance. For example, if leverage is tight, capex and working capital actions that affect cash conversion should require board approval at lower levels.
Mind Map: Board and Management Governance
Advanced Details That Prevent Governance Drift
Even well-designed rights can degrade. Three controls help.
-
Action logs with owners and dates. After each board meeting, record decisions, owners, and due dates. If an action is “discussed” but not assigned, it will quietly disappear.
-
Policy versioning. When you update spending limits, approval thresholds, or contracting authority, keep a single source of truth. People should not rely on memory or email threads.
-
Escalation paths for deadlocks. Define what happens when management and board members disagree. For example, management can present a revised recommendation within a set timeframe, or the board can vote on a bounded set of options.
Example: Avoiding a Common Failure Mode
Imagine management wants to accelerate a working capital initiative that requires a short-term vendor payment increase. If decision rights are vague, the CFO may wait for board approval, losing the timing window. With clear thresholds, the CFO can decide within a defined range, while the board receives a decision memo showing expected cash conversion improvement and covenant impact. The board still provides oversight, but management keeps momentum.
Summary of What “Clear Decision Rights” Looks Like
Clear governance is a system: defined decision categories, assigned owners, thresholds that match the financing reality, a cadence that supports timely approvals, and documentation that turns decisions into execution. When those pieces fit, the board becomes a reliable control point rather than a bottleneck.
10.2 Implementing Monthly Operating Reviews and KPI Dashboards
A monthly operating review is a recurring meeting with a simple job: turn a pile of numbers into decisions that change what happens next month. The dashboard is the tool; the review is the discipline.
Foundations for Monthly Operating Reviews
Start by defining the review’s purpose in one sentence: confirm performance versus plan, explain variances, and assign actions with owners and due dates. If the meeting becomes a status report, it will quietly drift into theater.
Use a consistent cadence:
- Week 1: finalize the month’s numbers and reconcile differences between accounting and operational systems.
- Week 2: publish the dashboard and pre-read to leadership.
- Week 3: hold the operating review with prepared variance explanations.
- Week 4: track action completion and close the loop in the next pre-read.
A practical rule: every KPI shown must have a named owner and a clear action pathway. If a metric cannot trigger an action, it should not be on the dashboard.
KPI Dashboard Design That People Actually Use
Build the dashboard around three layers.
- Outcome KPIs measure what you care about (for example, gross margin, cash conversion, on-time delivery).
- Driver KPIs explain why outcomes move (for example, price realization, defect rate, schedule adherence).
- Control KPIs catch problems early (for example, overdue purchase orders, backlog aging, training completion).
Keep the dashboard readable. A good target is 12–20 KPIs total, grouped so a reviewer can find answers in under five minutes.
Use a consistent visual language:
- Show actual, plan, and prior month.
- Include variance with a short label for direction and magnitude.
- Use traffic-light thresholds that reflect operational reality, not wishful thinking.
Variance Explanations That Don’t Waste Time
Require a structured variance note for each material KPI movement. A template that works:
- What changed: one sentence describing the movement.
- Why it changed: two to three bullet drivers.
- What we did: actions already taken.
- What we will do next: actions for the coming month.
- Owner and due date: who is accountable.
To keep meetings efficient, limit the discussion to the top drivers. If everything is “important,” nothing is.
Mind Map: Monthly Review System
Example: A Simple Manufacturing Dashboard
Assume a mid-sized manufacturer wants to improve cash and margin. The dashboard might include:
- Outcome: gross margin %, cash conversion cycle.
- Drivers: material cost per unit, yield %, overtime hours per production hour.
- Controls: scrap rate by line, supplier on-time delivery %, work order backlog aging.
In the review, if gross margin drops, the team does not start with “we need to be better.” They trace the movement: yield fell on Line 3 due to a specific changeover issue, and supplier delays increased expedited freight. The actions become concrete: fix the changeover checklist by Line 3 lead, and renegotiate expedited freight triggers with procurement.
Example: A Service Business Dashboard
A services firm might track:
- Outcome: revenue collected, utilization rate.
- Drivers: billable hours delivered, average rate, churn.
- Controls: overdue timesheets, project staffing gaps, customer dispute count.
If utilization slips, the driver note should show whether it is staffing gaps, rate changes, or project churn. The action list then targets the correct lever: reforecast staffing for the next two weeks, tighten timesheet approval, and address the top dispute categories.
Advanced Details That Prevent Dashboard Drift
- Definitions and data lineage: write KPI definitions once and attach them to the metric. If “on-time delivery” changes, the dashboard becomes a different instrument.
- Variance thresholds: set rules for when a KPI requires a deep explanation. For example, explain any KPI that misses plan by more than 5% or changes by more than 10% versus prior month.
- Action closure evidence: require proof, not just completion. “Implemented new approval workflow” should be supported by a before/after metric or a sample audit.
- Meeting roles: assign a facilitator to keep time, a finance lead to validate numbers, and functional owners to present driver explanations.
Example: Action Tracking That Stays Honest
Actions should be tracked in a single list with status and evidence. For instance:
- Owner: Operations Manager — “Reduce Line 3 scrap by 20%” — Due: 2026-04-15 — Status: In progress — Evidence: scrap trend shows improvement from 6.2% to 5.4%.
When evidence is missing, the action is not “done.” This is how the review becomes a system rather than a monthly ritual.
Mind Map: Variance to Action Flow

A well-run monthly operating review makes the next month more predictable. It does that by forcing clarity: which numbers matter, what caused the movement, and what will change because of it.
10.3 Monitoring Covenants and Liquidity with Cash Forecasting
Covenants are the contract’s way of saying, “Stay within these boundaries, or we reserve the right to intervene.” Liquidity is the practical question behind that statement: “Do we have cash when we need it?” The bridge between the two is cash forecasting that is detailed enough to be trusted and disciplined enough to be updated.
Foundational Concepts That Make Covenants Actionable
Start by translating each covenant into a measurable line item and a measurement date. For example, a leverage covenant might be tested quarterly based on trailing twelve-month EBITDA, while an interest coverage covenant might use the same EBITDA but a different numerator. The key is not the label; it’s the exact formula, test period, and permitted adjustments.
Next, map covenant outcomes to cash realities. A company can “technically comply” while still running short on cash due to working capital swings, capex timing, or tax payments. That’s why liquidity monitoring should run in parallel with covenant tracking rather than being treated as a backup plan.
Building a Cash Forecast That Supports Covenant Compliance
A useful forecast has three layers: timing, drivers, and controls.
-
Timing: Use a weekly cash view for the next 8–13 weeks, then move to monthly for the remainder of the year. Covenants are quarterly, but cash problems often show up earlier.
-
Drivers: Tie cash movements to operational drivers you can influence. Examples include collections by customer segment, inventory purchases by production plan, and payroll timing by headcount and overtime.
-
Controls: Define who updates what, when, and with which source. If the forecast is updated “when someone remembers,” it will be wrong in the exact way that matters.
A simple example: if accounts receivable collections are assumed to be 60 days, but the sales team has recently shifted to longer payment terms, your forecast should reflect that change immediately. Otherwise, you’ll discover the covenant risk only after cash has already tightened.
Covenant Monitoring Workflow That Prevents Surprise
Run a recurring workflow that connects forecast outputs to covenant calculations.
- Monthly: Update the cash forecast and a covenant “bridge” that shows how forecasted EBITDA and debt metrics are trending.
- Weekly: Review liquidity headroom, including minimum cash thresholds and near-term debt service.
- Quarterly: Reconcile forecast assumptions to actuals and document any covenant-relevant adjustments.
When you reconcile, focus on the deltas. If EBITDA is trending down, identify whether it’s driven by gross margin, operating expenses, or one-time items. If the covenant formula excludes certain items, confirm the documentation trail so the adjustment is defensible.
Liquidity Headroom and Covenant Buffer Management
Liquidity headroom is the gap between available cash and required cash. Required cash includes scheduled interest, principal, taxes, capex, and working capital needs. A practical approach is to set internal “warning levels” that are tighter than the covenant thresholds.
Example: Suppose the leverage covenant allows 4.0x, and your model shows 3.6x at quarter-end. That sounds safe until you notice that collections are trending slower by 10 days. Slower collections reduce cash and can also delay revenue recognition or increase costs tied to carrying inventory. You can respond early by tightening collections, pausing discretionary spend, or adjusting payment terms with suppliers—actions that improve both liquidity and the covenant path.
Mind Map: Covenant and Liquidity Monitoring
Example: Turning Forecast Variance Into a Covenant-Safe Plan
Assume a portfolio company has a quarterly interest coverage covenant. The forecast shows coverage of 2.2x, with a covenant minimum of 1.8x. Two weeks into the quarter, cash collections lag by 5% due to a customer dispute. The immediate risk is liquidity: the company may miss a scheduled interest payment.
A structured response looks like this:
- Liquidity action: Accelerate collections from other customers by offering standard early-payment terms already used in the past, and pause nonessential vendor spend.
- Covenant action: Confirm whether the disputed revenue affects EBITDA timing. If the dispute is likely to reverse, document the accounting treatment and track it separately.
- Forecast update: Re-run the cash forecast weekly and update the covenant bridge monthly, showing the coverage ratio under the revised assumptions.
If the dispute resolves quickly, the plan prevents unnecessary covenant stress. If it doesn’t, the company still has time to negotiate amendments or take corrective actions before the test date.
Practical Checklist for the Month-End Covenant Bridge
- Covenant formulas are copied verbatim into the model with test dates.
- Forecast assumptions are linked to operational drivers with named owners.
- Cash forecast includes a minimum cash line and near-term debt service schedule.
- Variances are explained by category: margin, volume, opex timing, working capital, or adjustments.
- Documentation for permitted adjustments is tracked in a single place with dates.
Covenants are not just numbers on a report. When cash forecasting is driver-based and updated on a disciplined cadence, covenant compliance becomes a management activity rather than a quarterly surprise.
10.4 Managing Capital Expenditures and Working Capital Discipline
Capital expenditures (capex) and working capital are the two levers that quietly decide whether the business generates cash or just generates accounting profit. Capex buys future capacity; working capital decides how quickly that capacity turns into cash. Managing both means setting rules before the first invoice arrives, then enforcing them with the same seriousness as financial reporting.
Foundations: What You Are Actually Controlling
Start with definitions that prevent category mistakes.
- Capex: spending that creates or upgrades long-lived assets. Examples include new equipment, major system implementations, and facility expansions.
- Working capital: the cash tied up in inventory, accounts receivable, and accounts payable.
- Free cash flow: operating cash flow minus capex. If you only manage EBITDA, you can still miss cash.
A practical rule: every capex request must state the cash impact path, not just the operational benefit. For example, a machine that reduces scrap should explain how scrap reduction changes production output, which changes sales timing, which changes receivables, which changes cash.
Capex Governance That Prevents “Good Ideas, Bad Timing”
Create a capex process with three gates.
-
Stage 1: Business case and affordability
- Require a simple payback or internal rate of return calculation using conservative assumptions.
- Include a funding plan: how the project is paid without breaking debt covenants or minimum liquidity.
- Example: A $2.0 million line upgrade is proposed. The business case assumes 8% annual savings, but the affordability gate checks whether the company can fund it while maintaining a 12-week cash buffer.
-
Stage 2: Technical and operational readiness
- Confirm lead times, installation downtime, and whether production can continue.
- Require a commissioning plan with acceptance criteria.
- Example: If the upgrade requires a two-week shutdown, the plan should include how lost production is covered and how customer commitments are protected.
-
Stage 3: Execution controls
- Use purchase orders with approval thresholds.
- Track commitments vs. spend weekly.
- Example: If a vendor quote is $1.8 million but the purchase order is $1.95 million due to “small changes,” the variance must be explained and approved before it becomes a trend.
A useful discipline is to separate capex for growth from capex for maintenance. Maintenance capex is often underestimated because it has no obvious sales story. Yet underfunding it increases downtime and working capital needs through rework and expedited freight.
Working Capital Discipline That Matches the Cash Cycle
Working capital management is about controlling the timing of cash in and cash out.
-
Inventory: manage by turns and aging, not by “we have stock.”
- Example: A distributor holds 90 days of inventory. After reviewing SKU velocity, it reduces slow movers by 20% and improves forecasting accuracy. The cash released can fund capex without extra borrowing.
-
Accounts receivable: manage by collection effectiveness and dispute prevention.
- Example: A manufacturer sees receivables grow because invoices are delayed by billing disputes. The fix is operational: align delivery confirmation with invoicing and add a short dispute resolution workflow with clear ownership.
-
Accounts payable: manage without damaging supplier relationships.
- Example: Instead of stretching payments, negotiate payment terms tied to delivery performance. If suppliers accept net-45 instead of net-30, the company improves cash while keeping service levels stable.
A simple weekly rhythm works: track DSO, DIO, and DPO alongside cash balance and covenant headroom. When one metric worsens, require a root-cause action, not a “we’ll catch up next month” response.
Integrated Mind Map for Capex and Working Capital
Mind Map: Capex and Working Capital Discipline
Example: One Decision, Two Cash Outcomes
Assume a company plans a $1.5 million capex project to reduce production defects. The operational team expects fewer returns, which should improve gross margin. The finance team adds two working capital checks.
- Receivables impact: fewer defects reduce the number of credits and invoice disputes. That shortens the dispute cycle and reduces DSO by two days.
- Inventory impact: fewer defects reduce rework inventory and safety stock. That lowers DIO by five days.
If the project is approved only on capex ROI, it might look marginal. When you include working capital effects, the cash payoff becomes clear. The discipline is not to “force” working capital benefits into the model; it is to measure whether the operational change actually changes cash timing.
Advanced Controls That Hold Up Under Pressure
When the business is busy, controls must be simple enough to follow.
- Capex accrual discipline: reconcile commitments, invoices, and asset capitalization monthly. If spend is delayed but commitments are real, liquidity planning must reflect commitments.
- Working capital exception reporting: define thresholds for aging receivables, inventory obsolescence, and overdue payables. Exceptions get owners and due dates.
- Link capex to operating KPIs: if a project targets scrap reduction, track scrap, rework hours, and return rates. If those don’t move, capex benefits are likely overstated.
The goal is consistent cash behavior: capex is planned and executed with affordability in mind, and working capital is managed as a cash cycle with measurable ownership.
10.5 Handling Material Events Through Defined Escalation Processes
Material events are the moments when “normal operations” stop being normal: a covenant breach risk, a customer contract termination notice, a key supplier failure, a lawsuit filing, a sudden working-capital swing, or a financing disruption. The goal of an escalation process is simple—make sure the right people see the right facts fast enough to protect value, cash, and reporting integrity.
Foundational Principles for Escalation
Start with a shared definition of “material.” Use a threshold-based approach so teams do not argue about interpretation during stress. For example, define material events as those that could reasonably impact (1) liquidity within the next 30–60 days, (2) covenant compliance, (3) revenue recognition or major customer retention, (4) legal exposure beyond an agreed limit, or (5) the accuracy of the financial statements used for lender reporting.
Next, define what “escalation” means. Escalation is not a meeting; it is a sequence: notify, assess, decide, document, and communicate. Each step should have a named owner and a time target. If you cannot state the time target, you do not yet have a process.
Finally, separate facts from interpretations. Facts include dates, amounts, contract clauses, and correspondence. Interpretations include what the facts mean for cash, covenants, and reporting. Mixing them early is how you get confident wrong decisions.
Escalation Triggers and Severity Levels
Use severity levels so responses scale with impact. A practical setup:
- Level 1: Operational variance that may affect KPIs but is unlikely to threaten liquidity.
- Level 2: Financial reporting risk or covenant sensitivity that requires management action within days.
- Level 3: Liquidity or legal exposure that could require lender communication, board involvement, or immediate mitigation.
Example: A customer disputes an invoice for $250k. If it is isolated and expected to resolve within the quarter, it may be Level 1. If the dispute blocks cash collection and pushes days sales outstanding beyond the covenant-sensitive range, it becomes Level 2. If the customer issues a termination notice tied to performance and the contract includes a right to accelerate payments, it becomes Level 3.
Roles, Decision Rights, and Communication Cadence
Assign roles before anything happens:
- Event Owner: the person closest to the facts, responsible for initial triage.
- Finance Lead: assesses covenant and reporting impact, coordinates modeling updates.
- Legal/Compliance Lead: evaluates legal exposure, notice requirements, and documentation.
- Treasury/Cash Lead: runs liquidity scenarios and cash forecast updates.
- CFO or Deal Lead: makes final decisions for Level 2 and Level 3 actions.
- Board or Investment Committee: informed and consulted based on severity and pre-agreed thresholds.
Communication cadence should be explicit. For Level 2, aim for an initial assessment within 24 hours and a decision memo within 72 hours. For Level 3, aim for immediate notification and a first mitigation plan within 48 hours. The exact hours matter less than consistency.
Documentation That Holds Up Under Scrutiny
Every material event should produce a short “event packet” stored in a single location. Include:
- timeline of key dates and actions
- amounts and affected accounts
- relevant contract or covenant excerpts
- updated cash forecast and covenant calculations
- decision taken and rationale
- next steps with owners and due dates
Example: If you receive a lender notice alleging a covenant calculation error, the event packet should show the original calculation, the corrected method, and the revised forecast. This prevents rework and reduces the chance of inconsistent messages.
Mind Map: Escalation Process for Material Events
Example: From Trigger to Mitigation Without Chaos
On 2026-04-10, a key customer sends a notice that it will withhold payment for $400k pending a quality review. The event owner logs the notice, captures the contract clause, and confirms the expected review duration. Finance lead updates the cash forecast and runs a covenant sensitivity: if the cash shortfall persists beyond 30 days, the debt service coverage ratio could fall below the threshold.
Because the risk is covenant-sensitive, the matter is Level 2. The CFO requests a mitigation plan within 72 hours. Treasury proposes two actions: (1) accelerate collections from other customers with similar payment terms and (2) negotiate a partial payment schedule tied to inspection milestones. Legal lead drafts a short addendum proposal to clarify that withheld amounts are limited to the disputed portion. The final event packet records the timeline, the covenant math, and the agreed mitigation owners.
The process works because it forces clarity: what happened, what it changes, who decides, and what gets done next. When the next material event arrives, the team does not start from scratch; it follows the same sequence and updates the facts.
11. Exit Planning and Transaction Readiness for Maximizing Returns
11.1 Defining Exit Objectives and Preparing for Multiple Exit Paths
Exit planning starts with a simple question: what does “success” look like when the deal is over? In private equity, “success” is rarely one number. It is a combination of timing, value realization, certainty, and operational continuity. The best exit plans treat exit as a project with measurable objectives, not a hope with a calendar.
1) Set Exit Objectives That Match Your Investment Thesis
Begin by translating the investment thesis into exit objectives. If the thesis depends on margin expansion, the exit objective should include evidence that margin is sustainable, not just improved during a short window.
Use four objective categories:
- Value: target enterprise value or equity value range, plus the drivers that must be true to reach it.
- Timing: the window in which you can credibly claim performance stability for buyers.
- Certainty: what level of execution risk you can tolerate, such as customer retention or covenant headroom.
- Continuity: how much operational change can be absorbed by a new owner without breaking the results.
Example: A sponsor buys a business with a thesis of pricing discipline and reduced churn. The exit objective is not “sell at a high multiple.” It is “demonstrate gross margin improvement with retention above X% for two consecutive quarters, while maintaining working capital discipline.” That phrasing tells you what evidence to build.
2) Identify Multiple Exit Paths and Their Buyer Logic
Multiple exit paths exist because buyer preferences differ. A single path can fail even when the business performs well, simply because the buyer’s constraints do not match your profile.
Common exit paths include:
- Strategic sale: buyers care about customer fit, product adjacency, and integration cost.
- Financial sponsor sale: buyers care about repeatable cash flows, governance, and downside protection.
- Secondary recapitalization: buyers care about leverage capacity and near-term cash generation.
- IPO: buyers care about reporting quality, scale, and market readiness.
For each path, write the buyer’s “logic chain” in plain language: what they must believe, what they will test in diligence, and what could cause them to walk away or reprice.
3) Build an Evidence Plan That Survives Diligence
Exit readiness is mostly about documentation and consistency. Buyers test whether performance is real, repeatable, and transferable.
Create an evidence plan with three layers:
- Financial evidence: normalized earnings, working capital behavior, and cash conversion.
- Operational evidence: KPI trends tied to management actions, not one-off events.
- Commercial evidence: retention, pipeline quality, contract terms, and customer concentration controls.
Example: If you improved EBITDA by reducing discretionary spend, diligence will ask whether those cuts are reversible. Your evidence plan should include a cost governance process, not just a spreadsheet showing lower expenses.
4) Define Decision Gates and Timing Milestones
A practical exit plan uses decision gates. Each gate answers whether you should proceed, adjust, or pause.
Suggested gates:
- Gate A: Performance stability after a defined period, such as two quarters of KPI consistency.
- Gate B: Reporting readiness when monthly close quality meets buyer expectations.
- Gate C: Financing and covenant health when leverage and liquidity remain within plan.
- Gate D: Market readiness when you can run a sale process without scrambling for data.
Use a dated internal milestone to keep teams aligned. For example, set “Exit Readiness Review” for 2026-04-15 and require a checklist sign-off from finance, operations, and legal.
5) Manage Tradeoffs Across Exit Paths
Different exit paths reward different strengths. If you optimize only for one path, you may weaken another.
Tradeoff examples:
- Leverage: high leverage can support returns but may reduce buyer interest from strategic buyers who prefer lower risk.
- Integration story: strategics value synergy narratives; financial buyers value operational repeatability.
- Reporting depth: IPO readiness requires more granular controls than a typical private sale.
The solution is not to do everything. It is to define a “minimum viable readiness” baseline that supports all paths, then add path-specific enhancements.
6) Create a Practical Mind Map for Exit Objectives
Mind Map: Exit Objectives and Multiple Exit Paths
7) Example: Turning Objectives Into a Two-Track Readiness Plan
Assume the business has improving margins and stable retention. Your baseline readiness supports all paths:
- Monthly close with consistent normalization methodology.
- KPI dashboard with definitions and owners.
- Working capital policy and variance explanations.
Then add track-specific work:
- Strategic track: build a synergy cost model with integration milestones and owners.
- Financial track: strengthen downside documentation, including customer concentration mitigation and cost governance.
When diligence arrives, you are not scrambling for proof. You are handing over a coherent story supported by consistent numbers and operational controls. That is what makes “multiple exit paths” real rather than theoretical.
11.2 Building a Clean and Transferable Business Narrative for Buyers
A buyer’s diligence team is trying to answer one question: “Can we understand this business well enough to underwrite it, operate it, and explain it to our own stakeholders?” A clean, transferable business narrative makes that easier by connecting strategy, performance, and cash flow in a consistent story.
Foundations of a Buyer-Ready Narrative
Start with a single-page spine that you can expand into a full narrative package. The spine should state: what the company sells, who it sells to, why customers buy, how the business makes money, what drives results, and what risks could break the model. If you cannot summarize those items without hand-waving, the rest of the narrative will feel like a collection of facts rather than a coherent explanation.
Next, ensure the narrative matches the numbers. If adjusted EBITDA is used in the investment case, the narrative must explain the adjustments and show where the underlying cash impact sits. For example, if you add back one-time legal costs, the narrative should clarify whether similar costs are expected to recur and how you treat them in operating planning.
Finally, keep the narrative transferable. That means the story should not depend on personal knowledge of the current CEO or a single finance person. Use process descriptions, ownership assignments, and documented decision rules so a new operator can run the business without guessing.
Performance Story That Connects to Cash Flow
Buyers care about cash because it funds debt service, reinvestment, and returns. Build the narrative around a simple chain: revenue drivers → gross margin drivers → operating expense discipline → working capital behavior → capital expenditures.
A practical example: suppose revenue growth is driven by repeat orders from mid-market customers. The narrative should specify what “repeat” means (for instance, orders in the last 12 months), what retention looks like by segment, and what operational activities support it (service response times, inventory availability, and pricing governance). Then connect that to working capital by explaining how order patterns affect inventory and receivables. If customers pay faster when service levels are met, say so and show the relationship using historical data.
Risk Explanation Without the “Everything Is Fine” Tone
A clean narrative does not hide risks; it explains them with boundaries and controls. Buyers expect risk to exist, but they want to see how management monitors it.
Use a consistent risk format:
- Risk statement in plain language
- Evidence from historical performance
- Leading indicators you track monthly
- Mitigation actions and who owns them
Example: “Customer churn increases when onboarding takes longer than 30 days.” Evidence might include a correlation between onboarding cycle time and churn. Leading indicators could include onboarding duration by cohort and backlog size. Mitigation actions could include a playbook for implementation staffing and escalation steps.
Data Consistency and Terminology Hygiene
Narrative clarity collapses when terms shift between documents. Standardize definitions for revenue recognition, churn, backlog, adjusted EBITDA, and customer segments. If “adjusted EBITDA” excludes stock-based compensation, specify whether it also excludes one-time restructuring costs and how those are identified.
A simple hygiene checklist helps:
- One glossary used everywhere
- One KPI dashboard template used in management reporting
- One mapping from KPIs to drivers and to financial statements
Mind Map: Buyer Narrative Structure
Example Narrative Outline You Can Reuse
Use this outline to draft the narrative section that accompanies the financial package.
1. What the business does
Describe the offering, typical customer profile, and how customers buy. Include one concrete example of a customer journey from first contact to repeat purchasing.
2. Why customers stay
Explain retention drivers using measurable elements such as response times, service coverage, and product performance. If retention is influenced by contract terms, describe how renewal decisions are made.
3. How performance is produced
Connect operational activities to financial outcomes. For instance, show how procurement lead times affect inventory and how inventory availability affects fulfillment and revenue.
4. How cash is generated and protected
Explain working capital patterns and capex discipline. If receivables are seasonal, state the seasonality and the collection process that manages it.
5. What could go wrong and what management does
List the top risks and the monitoring system. Include at least one example where management previously identified a leading indicator and took action.
6. What a buyer can run on day one
Summarize the operating cadence, reporting rhythm, and documented processes. Mention who owns each KPI and what happens when a metric misses its threshold.
A Short Integrated Example
A mid-market software services firm can frame its narrative like this: revenue comes from implementation projects and recurring support. Customers choose the firm because delivery teams are staffed with domain specialists and projects follow a standardized onboarding process. Gross margin is driven by utilization and rework rates, which are monitored weekly through project health metrics. Cash flow depends on billing milestones and collections; the firm reduces receivables by enforcing milestone documentation and running a monthly collections meeting with clear escalation steps. The main risk is project scope creep, controlled through a change-order workflow and a gate review before each milestone. The narrative is transferable because the delivery playbook, KPI dashboard, and escalation rules are documented and owned by named roles, not individuals.
When buyers can follow that chain without hunting for definitions or reconciling conflicting stories, diligence becomes a verification exercise rather than a translation exercise.
11.3 Preparing Financial Reporting Quality and Normalization Support
High-quality financial reporting is what lets buyers trust the numbers without hiring a detective team. In an exit process, your goal is simple: make historical results understandable, consistent, and supportable with evidence.
Foundations of Financial Reporting Quality
Start with a clear definition of “what the numbers mean.” Buyers typically expect (1) consistent accounting policies, (2) complete and accurate period cutoffs, and (3) a bridge from management reporting to statutory or audited statements. If your internal reporting uses adjusted EBITDA, you still need a disciplined link back to the underlying income statement and cash flow.
A practical first step is to create a “reporting map” that lists each financial statement line item and the source system or schedule behind it. For example, revenue should trace to billing systems and contract terms; cost of goods sold should trace to inventory movements and standard costing assumptions; operating expenses should trace to GL accounts with documented allocation logic.
Normalization Support That Holds Up Under Questions
Normalization is not about making results look better; it’s about explaining what is recurring versus non-recurring and what is owner-specific versus business-specific. Build a normalization schedule that includes: the adjustment amount, the period, the reason, the accounting treatment, and the evidence.
Use a consistent adjustment taxonomy so buyers don’t have to guess. Common categories include:
- One-time transaction costs (deal, integration, refinancing)
- Restructuring or severance
- Litigation or insurance recoveries
- Owner compensation adjustments
- Non-recurring legal settlements
- Non-operating income or expenses
For each category, attach a short evidence pack. Example: if you normalize severance, include the HR termination summary, payroll records, and the GL posting reference. If you normalize owner compensation, include employment agreements or board minutes and a rationale for the market-rate alternative.
Building a Buyer-Ready Evidence Trail
Buyers usually ask for “show me” support, not just “trust me” explanations. Organize evidence by adjustment and by financial statement line item.
A simple structure works well:
- Adjustment folder: one folder per normalization item
- Period folder: one folder per fiscal quarter or year
- GL tie-out folder: reconciliations from management P&L to audited or statutory P&L
Include a reconciliation for key working capital accounts because it affects cash conversion and debt-like adjustments. Example: if accounts receivable includes disputed invoices, show the aging detail, reserve methodology, and subsequent collections.
Consistency Controls Across Periods
Normalization often fails when policies drift. Lock down accounting policy changes and document them. If you changed revenue recognition, capitalization thresholds, or depreciation methods, provide a policy memo and quantify the impact.
Also control for cutoff errors. A classic example is shipping terms: if revenue is recognized based on delivery, but the cutoff process is weak, you can see revenue spikes at quarter-end. Fixing this before diligence reduces the number of “can you explain this movement?” questions.
Advanced Detail for Complex Areas
Some areas require extra care because they are easy to misunderstand.
Revenue and contract terms. Provide a summary of major contract types and how they map to billing. If you have variable consideration, show how estimates are determined and updated. Buyers will ask whether the variability is recurring.
Inventory and cost of goods sold. If you use standard costs, show variances and how they are absorbed. If inventory reserves exist, explain the reserve triggers and the review cadence.
Related-party transactions. Normalize only when the transaction is truly not representative of the business. Provide agreements, invoices, and board approvals so the buyer can see the economic substance.
Mind Map: Financial Reporting Quality and Normalization Support
Example: Normalization Schedule with Evidence
Imagine you normalized $450,000 of transaction costs in 2024. Your schedule should show:
- Adjustment: Transaction costs
- Period: Q2 2024
- Amount: $450,000
- Rationale: Non-recurring acquisition and financing fees
- Accounting treatment: Expensed in operating expenses
- Evidence: invoices from advisors, GL posting references, and board approval for the transaction
Then add a tie-out: show total operating expenses in management reporting, the portion reclassified or excluded, and the resulting normalized operating expenses. Buyers care that the adjustment is traceable and that the remaining numbers are still consistent with the underlying accounting.
Example: Owner Compensation Normalization
If owner compensation includes $300,000 of salary plus $80,000 of discretionary benefits, normalize only the portion that is clearly owner-specific. Provide:
- payroll records for the salary
- benefit invoices and usage summaries
- board minutes or employment terms
- a market-rate rationale for the replacement compensation
The key is not the number; it’s the logic and evidence. When the buyer sees the same logic applied across periods, diligence becomes a review rather than a debate.
11.4 Managing Legal and Operational Readiness for Due Diligence
Due diligence is where “we think” turns into “show us.” Legal and operational readiness should therefore be treated as one system: legal documents prove what happened, operational evidence proves how it runs, and both together support the purchase price and closing timeline. The goal is not to be perfect; it is to be consistent, traceable, and easy to verify.
Legal Readiness Foundations
Start with a document map that mirrors the diligence request list. Create a single index that links each item to its owner, last update date, and what it supports in the deal. For example, if the diligence request asks for customer contracts, the index should also indicate whether key terms are summarized in a separate schedule used for revenue normalization.
Next, reconcile “what the company says” with “what the company can prove.” Common friction points include:
- Entity and authority: confirm signatory authority for material contracts and board approvals for major actions.
- Material contracts: ensure amendments, side letters, and renewals are included, not just the latest master agreement.
- Litigation and claims: provide a claims log with status, dates, and reserve amounts where applicable.
- Compliance records: show training completion, audit results, and remediation steps, not just policies.
A practical example: if the company claims it follows a documented procurement process, diligence should find purchase order approval evidence and exception logs that match the policy language.
Operational Readiness Foundations
Operational readiness means the business can demonstrate repeatable performance. Build a baseline operating pack that includes KPI definitions, source systems, and a short explanation of how numbers are produced. If EBITDA is adjusted for one-time items, the operational pack should identify the operational driver behind those items so the legal and financial narratives align.
Focus on traceability:
- Revenue: tie invoices, contract terms, and fulfillment records to the revenue recognition approach.
- Costs: show how labor hours, vendor invoices, and overhead allocations map to the cost categories used in the financial model.
- Working capital: provide aging reports, inventory valuation support, and a clear policy for reserves.
A simple test: pick one month from the last twelve and reproduce the reported KPIs from raw data to management reporting. If the chain breaks, fix it before diligence asks.
Integrated Legal and Operational Evidence
The strongest diligence responses connect legal terms to operational execution. For instance, if contracts include service-level credits, the legal pack should show the clause, and the operational pack should show how credits are calculated and recorded. If there is a change-control clause in customer agreements, the operational evidence should show how change requests are tracked and approved.
To keep this integrated, use a “claim-to-evidence” matrix. Each row states a diligence claim, such as “No undisclosed related-party transactions,” and each column lists the evidence type: bank statements, GL accounts, vendor master checks, and board minutes.
Mind Map: Due Diligence Readiness System
Example: Handling a Contract Risk Without Panic
Assume diligence flags a customer contract with an early termination right tied to performance. The legal response should include the full contract, amendments, and any communications that interpret performance metrics. The operational response should include the performance measurement method, the historical results, and the process for calculating credits or penalties.
If the company has been meeting the metric, the evidence should show the calculation steps and the underlying data. If the company has not been meeting it, the response should show remediation actions and whether any termination notice was received. This is where readiness pays off: the buyer can assess risk quickly because the evidence is complete and consistent.
Execution Details That Prevent Delays
Set up a workflow before diligence begins. Assign one owner per workstream, one reviewer for legal consistency, and one person responsible for version control. Use a single Q&A log that records the question, the evidence provided, the answer status, and any follow-up items.
For redactions and privilege, apply them consistently. If a document is withheld, provide a privilege log entry that matches the document description and date. A buyer should not have to guess whether “withheld” means irrelevant or sensitive.
Finally, run a pre-diligence mock request using the buyer’s likely categories. For example, request the last two quarters of customer contract changes, then verify that the operational revenue schedule reflects those changes. If the numbers and the contracts disagree, fix the mismatch first; it is cheaper than explaining it later.
11.5 Running a Structured Sale Process and Coordinating Stakeholders
A structured sale process is mostly about reducing avoidable surprises. The goal is to keep buyers focused on the same facts, keep internal teams aligned on what matters, and keep the deal moving when questions get detailed.
Sale Process Foundations and Timeline Discipline
Start by defining the “decision points” that drive the process: who qualifies, who gets access, who submits, and what constitutes a final bid. Then build a timeline that matches those decisions, not the calendar. For example, if you need lender consent for a covenant change, schedule that work before you release draft financing terms to bidders.
A practical cadence looks like this:
- Week 0–1: finalize process letter, confidentiality approach, and data room readiness.
- Week 2: qualify bidders and confirm their ability to close.
- Week 3–4: management presentations and Q&A with a controlled question log.
- Week 5: first-round bids with a standardized bid template.
- Week 6: diligence deep dives for shortlisted bidders.
- Week 7: final bids and best-and-final negotiations.
Use a single “source of truth” for deal terms and assumptions. If two teams answer the same question differently, buyers will treat it as a signal that something is unclear.
Stakeholder Map and Role Clarity
Sale processes fail when responsibilities overlap. Assign owners for each workstream and define what “done” means.
- Deal lead: controls process, manages bidder communications, and approves what goes into the data room.
- Finance lead: owns quality of earnings support, purchase price adjustments, and model consistency.
- Legal lead: owns draft SPA, disclosure schedules, and risk allocation positions.
- Operations lead: owns operational facts, KPI definitions, and integration-related disclosures.
- Tax lead: owns transaction structure inputs and any known tax exposures.
- Lender/financing liaison: owns consent requirements and payoff mechanics.
A simple rule: if a question affects valuation, it must be answered by the finance lead or with finance sign-off.
Data Room Strategy and Q&A Control
Treat the data room like a curated exhibit, not a dumping ground. Organize files by diligence category and keep naming consistent. When buyers request something missing, log it and assign an owner with a due date.
For Q&A, use a question log with three fields: question, answer owner, and status. When you respond, include the level of specificity buyers need. For instance, if a buyer asks about customer concentration, provide both the top customer percentage and the definition of “customer” used in reporting.
Example: A buyer asks whether revenue is recurring. Instead of a yes/no, provide a breakdown of contract types, average contract length, and the share of revenue tied to renewals versus usage. That prevents follow-up questions from turning into a debate about definitions.
Bid Management and Standardized Bid Templates
To compare bids fairly, require bidders to submit using a template that captures:
- purchase price and payment structure
- working capital target and adjustment mechanics
- earnout terms if any
- financing contingencies and timing
- key legal exceptions
When bidders propose deviations, force them to quantify the impact. If a bidder wants a lower working capital target, ask for the implied cash flow effect and how it changes the purchase price economics.
Negotiation Focus and Risk Allocation
Negotiations should be anchored to the same risk categories used in diligence: revenue recognition, working capital, customer churn, capex needs, and legal exposures. Keep a “risk register” that links each risk to the proposed contractual protection.
Example: If there is a known dispute about a vendor invoice, decide whether to handle it via an indemnity, a specific disclosure schedule entry, or a purchase price adjustment. Mixing approaches creates confusion and can slow closing.
Mind Map: Structured Sale Process and Stakeholder Coordination
Example: Coordinated Sale Week in Practice
Assume the process is in the Q&A phase. A buyer asks for a reconciliation of EBITDA adjustments. The finance lead prepares a reconciliation table with the same line items used in the model, and the legal lead confirms whether any adjustments relate to disclosed items that require schedule support. The operations lead provides the operational basis for the adjustment drivers, such as labor reclassifications or one-time project costs. The deal lead then posts the response to the data room and updates the question log so no other team answers the same topic inconsistently.
If a second buyer asks a similar question, you reuse the same response and highlight any differences in their requested scope. That keeps the process efficient without sacrificing accuracy.
Closing Readiness and Stakeholder Alignment
Before final bids, confirm that internal teams can support closing mechanics: payoff letters, consent timelines, and the final working capital target methodology. Buyers will test these areas when they sense uncertainty. Aligning early prevents last-minute edits that change economics or create new disclosure obligations.
A structured sale process is not about speed alone. It is about consistent facts, clear ownership, and contract terms that match the diligence record. When those pieces fit, negotiations become a matter of numbers and risk allocation rather than interpretation and rework.
12. Practical Deal Examples from Structuring to Exit Outcomes
12.1 Example: Structuring of a Leveraged Buyout with Debt and Equity Mix
A leveraged buyout (LBO) is a cash-flow game with a legal contract attached. The goal is to fund the purchase price with a mix of equity and debt that (1) fits lender requirements, (2) leaves enough cash for operations and required payments, and (3) still produces an attractive equity return if the business performs as expected.
Step 1: Start with the Purchase Price and Cash Needs
Assume a target purchase price of $200 million. The deal also requires $10 million of transaction fees and $5 million of initial working capital support, so total cash outlay at closing is $215 million.
A common first pass is to set a target leverage level based on sustainable cash flow. If the business generates $35 million of normalized EBITDA and can support $25 million of annual cash available for debt service (after maintenance capex and working capital needs), then debt capacity is not “whatever the model can stretch,” but “whatever survives a downside.”
Step 2: Choose the Debt Stack and Explain Why It Matters
A practical LBO often uses multiple debt layers:
- Senior secured term loan: typically the first claim on cash flows; lenders expect tighter covenants.
- Second lien or unitranche: sits behind senior secured; usually higher yield and sometimes looser covenants.
- Subordinated notes or mezzanine: higher cost; may include equity-like features such as PIK interest.
For this example, use a simplified stack:
- $120 million senior secured term loan
- $50 million unitranche (blended second layer)
- $45 million equity
Total sources: $215 million, matching total uses.
Step 3: Translate the Mix Into Repayment Mechanics
Debt service depends on interest rate and amortization. Suppose:
- Senior secured: 9.0% interest, 1% annual amortization
- Unitranche: 10.5% interest, 0.5% annual amortization
Annual interest in year one is approximately:
- Senior secured interest: $120m × 9.0% = $10.8m
- Unitranche interest: $50m × 10.5% = $5.25m
Total interest: $16.05m. Amortization adds roughly:
- Senior secured: $120m × 1% = $1.2m
- Unitranche: $50m × 0.5% = $0.25m
Total scheduled principal: $1.45m. So baseline cash required for debt service is about $17.5m before any mandatory prepayments.
Now compare to cash available for debt service of $25m. That leaves a buffer of roughly $7.5m for taxes, fees, and operational variability. This is the “why the mix works” moment: equity is not just a funding source; it is the cushion that keeps debt from becoming a cash-flow hostage.
Step 4: Check Covenant Headroom with a Simple Stress
Lenders often care about metrics like leverage ratio and interest coverage. If the covenant requires interest coverage of at least 2.5x, and EBITDA declines by 15% to $29.75m, then interest coverage becomes:
- Coverage ≈ EBITDA / interest = $29.75m / $16.05m ≈ 1.85x
That fails. The fix is not “hope.” It is to adjust structure. Options include reducing total debt, increasing equity, lowering interest rate via refinancing terms, or adding flexibility such as permitted payments and restricted cash mechanics.
For this example, increase equity by $15m and reduce unitranche by $15m:
- Senior secured: $120m
- Unitranche: $35m
- Equity: $60m
Recompute interest:
- Senior interest: $10.8m
- Unitranche interest: $35m × 10.5% = $3.675m
Total interest: $14.475m. With EBITDA at $29.75m, coverage becomes $29.75m / $14.475m ≈ 2.06x. Still tight, but now the covenant can be satisfied if the covenant is based on a different definition (for example, EBITDA less certain adjustments) or if the base case includes modest cost discipline.
Step 5: Use Equity to Shape Return and Risk
Equity return improves when debt is higher, but covenant failure turns “higher return” into “higher risk of restructuring.” The deal team should therefore link equity sizing to covenant survival, not just target IRR.
A simple way to communicate this internally is to show three outcomes:
- Base case: debt service comfortably covered
- Mild downside: coverage tight but compliant
- Severe downside: coverage fails, triggering negotiation or payment restrictions
The equity mix is the lever that determines which outcomes are realistic.
Mind Map: LBO Debt and Equity Mix Logic
Worked Summary of This Example
- Uses: $215m total cash outlay
- Initial structure: $120m senior secured + $50m unitranche + $45m equity
- Covenant stress revealed insufficient interest coverage
- Revised structure: $120m senior secured + $35m unitranche + $60m equity
The revised mix keeps the model coherent: debt is sized to cash flow, equity is sized to covenant survival, and the contract terms are treated as part of the economics rather than paperwork.
12.2 Example: Earnout Design With Controls and Dispute Avoidance
Earnouts can bridge valuation gaps, but they also create a new job: defining what “good performance” means and proving it fairly. The goal is simple—make the earnout formula hard to game, easy to measure, and clear enough that both sides can argue with numbers instead of feelings.
Foundational Principles for Earnout Design
Start with three inputs: (1) the performance metric, (2) the time window, and (3) the control environment. If any one is vague, disputes usually follow.
Metric choice. Pick a metric the seller can influence through operating decisions and the buyer can’t easily distort through accounting changes. For example, use “Net Revenue” rather than “Adjusted EBITDA,” because revenue is less sensitive to discretionary cost classification.
Time window. Use a window that matches the business cycle. If the target sells annual contracts, a one-quarter window can reward timing rather than execution. A common compromise is a 12-month earnout aligned to contract renewal and billing cadence.
Control environment. Define what the buyer may change without affecting earnout eligibility. If the buyer can reprice products, reclassify revenue, or pause marketing, the seller will want explicit guardrails.
Example Earnout Structure with Controls
Assume a software-enabled services business acquired for $60 million. The buyer and seller disagree on growth rate. They agree to an earnout paying up to $12 million over 12 months.
Earnout formula.
- Earnout target: $30 million Net Revenue in the 12-month period.
- Payment rate: 40% of the amount by which Net Revenue exceeds $30 million, capped at $12 million.
- Floor: no payment below $30 million.
Why this works. The seller benefits from incremental revenue, not from shifting costs. The buyer limits downside by capping the total.
Controls That Reduce Disputes
Controls should be written as “allowed actions” and “prohibited actions,” then tied to measurement.
1. Accounting and reporting rules.
- Revenue recognition follows the same policy used in the last full fiscal year.
- Any change in policy requires mutual written agreement and a restatement of prior-period comparatives for earnout calculation.
2. Commercial decision boundaries.
- The buyer may adjust pricing only within a defined band, for example ±5% from the baseline price list, unless the seller agrees otherwise.
- Discounts above the band require documented approval by a joint committee.
3. Customer and contract handling.
- The buyer cannot terminate customer contracts for convenience during the earnout period.
- If a contract is restructured, the earnout calculation uses the original contract’s revenue streams where feasible.
4. Operating expense neutrality.
- The buyer can manage costs, but the earnout metric is revenue-based, so the seller is not penalized for cost-cutting that reduces service quality.
- To prevent “revenue without delivery,” include a delivery quality gate: earnout payments are reduced by 2% for each month where the business misses a defined service-level threshold.
Dispute Avoidance Mechanics That Actually Matter
Most disputes come from timing, data access, and interpretation. Fix those with process.
Measurement schedule. Provide a quarterly calculation and a final annual true-up. Quarterly numbers reduce end-of-period surprises.
Data access. Give the seller read-only access to the earnout calculation workbook and the underlying revenue detail (customer, invoice date, and contract reference).
Audit rights. Allow the seller to request an independent audit of the earnout calculation once per year, limited to the earnout period and capped in scope.
Dispute escalation. Use a tiered approach:
- First: joint review meeting within 15 business days.
- Second: independent accountant determination limited to the earnout calculation.
- Third: arbitration or court only after the accountant step.
This structure keeps disagreements technical and time-bound.
Mind Map: Earnout Design with Controls and Dispute Avoidance
Worked Mini-Example with Numbers
Suppose Net Revenue in the 12-month period is $33.5 million. Incremental revenue over the $30 million target is $3.5 million. At a 40% payment rate, the earnout before quality adjustments is $1.4 million.
If the service-level threshold is missed in 3 months out of 12, and the reduction is 2% per missed month, the total reduction is 6%. The final earnout becomes $1.4 million × (1 − 0.06) = $1.316 million.
Because the formula ties payment to measurable revenue and measurable delivery quality, both sides can reconcile the outcome without rewriting history.
12.3 Example: Operational Improvement Plan With Baseline Targets and KPIs
A private equity team buys a $60M revenue manufacturer with EBITDA of $9M. The diligence work shows margin pressure from inconsistent scheduling, high expedite costs, and uneven quality performance. The operating plan starts with a baseline that is specific enough to measure and simple enough to run.
Step 1: Establish the Baseline with Evidence
The team selects a 12-week baseline window ending on 2026-04-01 to avoid seasonal noise. They pull data from ERP, production logs, quality systems, and customer service tickets.
Baseline metrics (illustrative):
- On-time in-full (OTIF): 82% (target later: 92%)
- Expedite spend: $1.2M per quarter (target later: $0.6M)
- First-pass yield: 86% (target later: 93%)
- Warranty and returns cost: 2.8% of revenue (target later: 1.8%)
- Inventory turns: 4.0x (target later: 5.0x without stockouts)
To keep the baseline credible, each metric has an owner, a data source, and a definition. For example, OTIF is defined as “delivered quantity meeting the customer’s requested date and quantity, excluding cancellations.” That definition prevents later arguments that sound like accounting poetry.
Step 2: Translate Problems Into Improvement Levers
The team groups issues into three operational levers that can be executed in parallel:
- Planning and execution discipline to reduce expedites and missed deliveries.
- Quality control and process stability to raise first-pass yield and reduce returns.
- Inventory and material flow to improve turns while protecting service levels.
Each lever gets a small set of initiatives with clear outputs.
Step 3: Set Targets and KPIs That Link to Cash
The plan uses a KPI hierarchy: leading indicators drive lagging financial outcomes.
KPI hierarchy example:
- Leading: schedule adherence, changeover time, defect rate, supplier OTIF
- Lagging: OTIF, first-pass yield, warranty cost, gross margin
- Financial: EBITDA improvement through lower costs and fewer revenue-impacting failures
Illustrative 6-month targets:
- OTIF: 82% → 88% by month 3, 92% by month 6
- Expedite spend: $1.2M → $0.9M by month 3, $0.6M by month 6
- First-pass yield: 86% → 90% by month 3, 93% by month 6
- Warranty cost: 2.8% → 2.3% by month 3, 1.8% by month 6
Targets are set with constraints. For instance, inventory turns cannot rise if OTIF drops; otherwise the company “wins” on paper and loses in customer trust.
Step 4: Build the Initiative Portfolio with Owners and Cadence
The team runs a 30-60-90 day cadence.
Initiatives and examples:
- Planning and execution discipline
- Create a weekly production meeting with a single-page schedule health report.
- Example: if schedule adherence falls below 90%, the meeting produces a corrective action within 24 hours (supplier expediting, labor rebalancing, or job sequencing).
- Quality control and process stability
- Implement a defect containment routine: when a defect category exceeds a threshold, the line pauses for root-cause capture.
- Example: if first-pass yield drops below 88% on a line for two consecutive days, the team runs a targeted process check and updates the work instruction.
- Inventory and material flow
- Introduce min/max controls for high-usage components and tighten reorder points.
- Example: for a component that causes line stoppages, the team sets a reorder point based on average lead time plus a safety buffer, then tracks stockout days.
Each initiative has an owner, a start date, and a measurable output. “Improve quality” becomes “reduce top three defect categories by X% using containment and updated work instructions.”
Step 5: Define Reporting and Governance That Prevent Drift
The operating cadence is simple:
- Weekly: KPI review with root-cause notes for any KPI that misses its weekly threshold.
- Monthly: cross-functional review of initiative progress and whether targets still make sense given real constraints.
- Quarterly: financial bridge review from operational KPIs to EBITDA movement.
A practical rule: if a KPI is not reviewed on schedule, it stops being a KPI and becomes a poster.
Mind Map: Operational Improvement Plan Structure
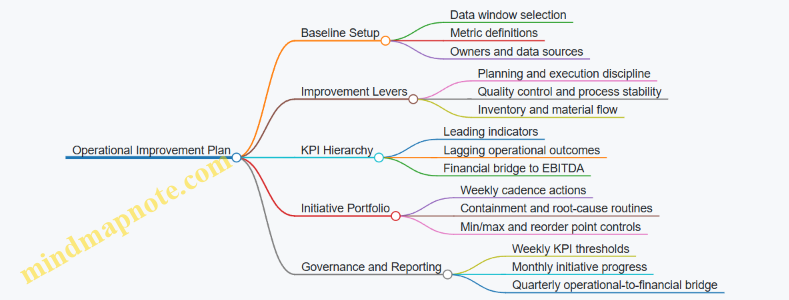
Step 6: Show How the Plan Converts Into Results
At month 3, the team expects partial movement: OTIF rises to 88%, expedite spend drops to $0.9M, and first-pass yield reaches 90%. If OTIF improves but warranty cost does not, the team investigates whether quality gains are concentrated in the wrong product families. If warranty cost drops but OTIF stalls, they check whether schedule changes are creating rushed production that later shows up as defects.
By month 6, the plan targets the full set of operational outcomes that support EBITDA expansion: fewer expediting costs, fewer returns, and fewer revenue disruptions from missed deliveries. The plan is not just a list of actions; it is a measurement system with enough discipline to keep everyone honest.
12.4 Example: Integration Plan for an Add on Acquisition With Synergy Tracking
Integration Goal and Scope
Assume a PE platform acquires a smaller competitor to add capacity and cross-sell into overlapping customer segments. The integration plan is built around two goals: (1) protect cash flow during the first 90 days, and (2) convert the synergy thesis into measurable actions with owners. Scope is limited to what changes customer experience, cost structure, and reporting accuracy; everything else stays stable until the baseline is understood.
Foundational Steps Before Day One
Start with a “single source of truth” for synergy tracking. Create a synergy register that lists each synergy, the mechanism to achieve it, the metric that proves it, the baseline, the target, and the owner. For example, if the thesis includes procurement savings, the mechanism is consolidating vendor contracts; the metric is annualized spend by category; the baseline is the last full quarter spend.
Then define integration workstreams that match how value is created:
- Commercial: pricing, sales coverage, customer onboarding
- Operations: production planning, quality, inventory turns
- Back Office: finance close, billing, HR processes
- Systems and Data: reporting definitions, master data
Day One to Day 30 Execution Plan
Day One is about continuity. The integration lead confirms that billing, shipping, and customer support processes remain uninterrupted. A practical example: if the add-on uses a different billing cycle, keep both cycles running for the first month while mapping invoice timing differences into the reporting model.
During the first 30 days, run “process pairing” workshops. Each workshop ends with a decision: adopt platform process, adopt add-on process, or run a temporary hybrid. For instance, if the add-on’s returns process is faster but less controlled, the decision might be to adopt the platform’s approval workflow while keeping the add-on’s turnaround time targets.
Day 31 to Day 90 Stabilization and Synergy Activation
Synergies should start showing up as leading indicators, not just end-of-year results. For example, procurement savings can be tracked through RFQ issuance and contract renegotiation milestones. If the target is $2.0 million annualized savings, set quarterly milestones such as “80% of spend categories under consolidated sourcing by Day 90.”
Commercial synergy often fails when sales teams are told to “cross-sell” without a concrete motion. A workable example is a joint account plan for the top 50 overlapping customers. Each plan includes: target products, expected margin impact, and the first meeting date. Track completion rate and conversion rate, not just activity.
Synergy Tracking System and Governance
Use a monthly synergy review with a consistent agenda: metric status, milestone completion, issues requiring escalation, and cash impact. The synergy register should be updated with actuals and a short explanation of variance.
Example synergy register entries:
- Procurement consolidation: metric “annualized spend by category,” baseline “Q-1 spend,” target “$2.0m,” owner “VP Procurement,” leading indicator “% of categories with new contracts executed.”
- Revenue retention: metric “net revenue retention,” baseline “last 12 months,” target “+3 pts,” owner “Head of Sales,” leading indicator “on-time onboarding of transferred accounts.”
- Integration cost control: metric “integration spend vs budget,” baseline “approved budget,” target “≤100%,” owner “CFO,” leading indicator “purchase orders approved under policy.”
Integration Plan Mind Map
Mind Map: Integration Workstreams and Synergy Linkage
Diagram: Synergy Tracking Flow
    flowchart TD
  A[Synergy Thesis] --> B[Synergy Register]
  B --> C[Define Metric and Baseline]
  B --> D[Assign Owner and Mechanism]
  C --> E[Set Leading Indicators]
  D --> E
  E --> F[Monthly Governance Review]
  F --> G[Update Actuals and Variance]
  G --> H[Escalate Issues]
  H --> I[Adjust Execution Plan]
Example: A Complete 90-Day Integration Snapshot
By Day 30, the platform and add-on agree on one pricing policy and one returns policy. The finance team completes a mapping of invoice timing and revenue recognition differences so the monthly reporting dashboard is comparable. By Day 60, procurement categories are consolidated for the first two spend areas, and the RFQ process is complete for the next two. By Day 90, the top overlapping customers have joint account plans, and onboarding completion is tracked with a simple scorecard.
The synergy tracking discipline keeps the plan honest. If procurement milestones slip, the register shows whether the delay is execution-related or data-related. If revenue retention lags, the register points to onboarding completion and service-level adherence rather than blaming “market conditions.”
Practical Checklist for the Add-On Integration Lead
- Synergy register created before closing
- Each synergy has a metric, baseline, target, owner, and leading indicator
- Process pairing decisions documented by Day 30
- Reporting definitions aligned by Day 30-45
- Monthly synergy review with variance explanations
- Escalation path used when milestones slip beyond tolerance
12.5 Example: Exit Readiness Checklist and Buyer Diligence Response Playbook
Exit readiness is less about polishing slides and more about making the business easy to verify. Buyers tend to trust what they can reconcile: reported results to underlying transactions, cash to working capital, and guidance to operational drivers. This playbook turns that into a checklist you can run like a project.
Exit Readiness Checklist
1) Financial reporting that reconciles
- Confirm the last 12–24 months of monthly close can be reproduced. Example: if EBITDA is adjusted for “one-time consulting,” keep the invoice trail, approval emails, and a brief memo that ties each adjustment to a specific period.
- Ensure revenue recognition policies are documented and consistently applied. Example: for subscription contracts, show how upgrades, downgrades, and churn are treated and how they flow into revenue.
2) Normalization support that is tidy
- Maintain a normalization log with columns for adjustment type, amount, period, business rationale, and evidence. Example: if owner compensation is above market, include a compensation benchmark summary and the calculation method.
- Track recurring “adjustments” that buyers will challenge. If an item happens every quarter, it probably isn’t one-time.
3) Working capital discipline
- Produce a working capital bridge template. Example: show how inventory turns into cash by linking inventory aging, purchase orders, and sales receipts.
- Validate the working capital target used in the purchase agreement. Example: if the target assumes a certain AR aging, confirm collections history and dispute rates.
4) Debt and covenant readiness
- Compile covenant definitions, calculation formulas, and the last 6–12 covenant tests. Example: if leverage is tested quarterly, show the exact numerator and denominator used and reconcile to the credit agreement.
- Ensure cash forecasting is consistent with the model. Example: if the model assumes collections timing, tie it to actual DSO by customer segment.
5) Legal and operational completeness
- Create a contract inventory by customer, supplier, and key vendor. Example: flag contracts with auto-renewal, termination for convenience, or pricing resets.
- Maintain a dispute register. Example: for a customer claim, include status, estimated exposure, and whether revenue is being recognized conservatively.
6) Management continuity and decision trail
- Document who owns what. Example: if pricing changes require approval, record the approval workflow and keep samples of executed price changes.
- Keep a “decision trail” folder for major operational changes. Example: if you changed procurement terms, include the negotiation summary and the impact on gross margin.
Buyer Diligence Response Playbook
Step 1: Pre-wire the data room
- Organize by diligence workstream: financial, tax, legal, commercial, operations, HR, and IT. Example: under commercial, include customer lists, top accounts, churn/retention calculations, and contract summaries.
- Use consistent naming. Example: “Revenue_Recognition_Policy_v3_2025-04-15” beats “Revenue Policy Final.”
Step 2: Assign a single owner per question type
- Financial questions go to the controller; commercial questions to sales ops; legal questions to counsel. Example: if a buyer asks about a revenue adjustment, the controller answers with the normalization log and the contract evidence.
Step 3: Answer with reconciliation, not narrative
- For each question, provide: what changed, why it changed, where it shows up in the statements, and what evidence supports it. Example: if EBITDA excludes litigation costs, show the GL accounts, the legal invoices, and the period cut-off.
Step 4: Use a “question-to-evidence” matrix
- Track each buyer question, the response owner, the evidence folder, and the status. Example: “Customer concentration risk” links to top-10 customer revenue, churn by cohort, and contract termination terms.
Step 5: Run a diligence rehearsal
- Conduct a mock Q&A with internal stakeholders. Example: ask the controller and sales ops to explain revenue retention calculations in 10 minutes, then test whether the numbers reconcile to the model.
Mind Map: Exit Readiness and Diligence Response
Example: Putting It Together in a Sale Process
Assume a buyer asks, “Why did EBITDA margin improve last quarter?” Your response should connect three layers: (1) the income statement movement, (2) the operational driver, and (3) the evidence. Example: you show gross margin up due to procurement terms, then attach the supplier contract amendment and a purchase price variance report, and finally reconcile the variance to the GL accounts used in EBITDA.
If the buyer then asks about customer retention, you provide the retention calculation method, the cohort definition, and the contract terms that explain churn. The goal is simple: every claim has a trail, and every trail points back to the numbers.