Modbus and OPC UA Industrial Protocols Guide
1. Industrial Communication Requirements and System Context
1.1 Defining Data Flows Between Controllers Gateways and Applications
A data flow description answers one practical question: who sends which values to whom, how often, and what “good” looks like when the values arrive. In industrial systems, the same physical signal can appear in multiple places—controller registers, gateway tags, application objects—and each hop can change timing, scaling, and meaning. Defining the flow early prevents mismatched expectations later.
Data Flow Building Blocks
Start with four roles:
- Controllers produce measurements and accept commands. They typically expose data as registers, coils, or internal variables.
- Gateways translate between protocols and normalize data into a consistent model. They also handle buffering, batching, and quality tagging.
- Applications consume data for monitoring, historian logging, optimization, or operator interfaces. They may also send commands.
- Network and time provide the transport and timing assumptions that affect latency, ordering, and freshness.
A complete flow definition includes:
- Source (controller signal or register)
- Transport (Modbus polling, OPC UA subscriptions, method calls, etc.)
- Transformation (type conversion, scaling, bit packing, unit mapping)
- Delivery pattern (polling interval, subscription sampling, event triggers)
- Quality and status (validity, stale detection, error codes)
- Control semantics (read-only vs command, acknowledgment rules)
From Use Cases to Flows
Pick a use case first, then derive the flow. Example use cases:
- Tank level monitoring: application needs a number and a quality flag.
- Pump start/stop: application needs a command path plus confirmation.
- Batch recipe tracking: application needs consistent identifiers and timestamps.
For each use case, decide whether the application needs continuous updates or state changes. Continuous updates usually map to polling or subscriptions with a fixed sampling rate. State changes often map to event-like behavior, but even then you still need a rule for how the system detects and reports changes.
Polling Versus Subscriptions
Polling is straightforward: the gateway (or application) asks for registers on a schedule. Subscriptions are also deterministic when configured well: the server pushes changes based on monitored items.
A useful rule of thumb is to align the delivery pattern with the application’s tolerance for delay:
- If the application can accept “every 200 ms,” polling at 200 ms with a timeout and retry policy can work.
- If the application needs “as soon as it changes,” subscriptions with a defined sampling interval and publishing interval reduce unnecessary traffic.
Either way, the flow definition must state the expected update period and what happens when the expected period is missed.
Data Freshness and Quality
Freshness is not a vibe; it is a measurable contract. Define:
- Staleness threshold: e.g., data older than 2× the sampling interval is “stale.”
- Quality states: good, uncertain, bad. For example, “bad” can mean communication failure or invalid scaling.
- Timestamp source: controller time, gateway receive time, or application receive time. Mixing these without rules leads to confusing charts.
Example: A controller updates a temperature register every 100 ms. The gateway polls every 200 ms. If the gateway receives no new value for 400 ms, it marks the OPC UA variable as stale and sets a quality flag. The application can then avoid triggering alarms based on old data.
Transformation Rules That Prevent Surprises
Transformation is where many integration bugs hide. Define transformations explicitly:
- Scaling and offsets: raw register 0–27648 maps to 0.0–100.0 °C using a linear formula.
- Endianness and word order: 32-bit values split across two 16-bit registers must be reassembled consistently.
- Bit fields: a status word might pack multiple flags; define each bit’s meaning and whether it is active-high or active-low.
- Type mapping: Modbus “unsigned 16-bit” to OPC UA “UInt16,” or Modbus “signed 16-bit” to OPC UA “Int16.”
Example: A Modbus register holds a 16-bit status word. Bit 0 means “ready,” bit 1 means “fault.” The gateway maps this to two OPC UA Boolean variables and also sets an overall status code variable. The application reads Booleans for UI and reads the status code for logic.
Command Paths and Acknowledgment
Read flows are easier than write flows because writes change system state. A command path should define:
- Command write location (which register or OPC UA method)
- Command format (value meaning, valid ranges)
- Interlocks (what the gateway or controller checks before acting)
- Acknowledgment (how the application learns the command took effect)
Example: To start a pump, the application writes 1 to a “StartCommand” register. The controller sets “StartCommandAck” to 1 when the pump is actually running. If “StartCommandAck” does not become 1 within a timeout, the gateway marks the command as failed and the application can display a clear reason.
Mind Map: Data Flow Definition Checklist
Example: One Monitoring Flow End to End
Consider a pressure sensor exposed by the controller as a Modbus holding register 40001 (raw unsigned 16-bit). The gateway polls it every 200 ms. The gateway applies scaling: pressure_bar = raw * 0.01. It publishes an OPC UA variable Pressure with units bar and a quality flag.
The application subscribes to Pressure and uses the gateway’s quality flag to decide whether to display the value as reliable. If the gateway has not updated within 400 ms, the application shows the value as stale and suppresses pressure-based alarms. This is not extra work; it is the difference between “a number” and “a number you can trust.”
1.2 Selecting Protocols Based on Device Capabilities and Network Constraints
Choosing between Modbus and OPC UA is less about preference and more about matching what the devices can do with what the network can reliably carry. A good selection starts with capabilities you can verify, then moves to constraints you can measure.
Start with Device Capabilities You Can Actually Confirm
Begin by listing each endpoint’s communication options and limits. For Modbus, confirm whether the device supports Modbus TCP, Modbus RTU, or both, and which function codes it implements for reads, writes, and control. Also confirm register addressing style, data type behavior, and whether the device uses holding registers, input registers, or coils.
For OPC UA, confirm whether the device is an OPC UA server, what security modes it supports, and whether it exposes data as variables, methods, and events. Check whether the server supports subscriptions and how it handles sampling and publishing intervals. If the device only supports basic browsing but not subscriptions, you may end up polling in disguise.
A practical rule: if you cannot map a required operation to a supported protocol feature, you will compensate later with a gateway or custom logic. That compensation is usually where integration time goes to hide.
Identify Network Constraints That Affect Protocol Behavior
Next, evaluate the network characteristics that directly impact each protocol’s traffic pattern.
- Topology and segmentation: If devices sit on different VLANs or security zones, you need to know whether routing and firewall rules allow the required ports and traffic types.
- Latency and jitter: Modbus TCP traffic is typically request-response, so jitter increases response time and can cause timeouts. OPC UA subscriptions reduce repeated polling, but they still depend on timely delivery of publish messages.
- Bandwidth and packet loss: OPC UA can send updates for multiple variables in fewer messages, but loss can delay or degrade delivery. Modbus can generate many small requests if you poll many registers individually.
- Serial vs Ethernet: Modbus RTU over serial has framing and timing constraints. If you have long cable runs or noisy environments, RTU reliability may be the limiting factor.
Match Protocol Traffic Patterns to Your Use Case
Different use cases stress different protocol behaviors.
- Simple telemetry with periodic reads: Modbus TCP often fits well when you can tolerate polling intervals and you have a clear register map.
- Mixed data types with semantic meaning: OPC UA’s structured data model can reduce ambiguity by carrying units, ranges, and status semantics alongside values.
- Event-driven alarms and state changes: OPC UA events and subscriptions can reduce unnecessary traffic compared to polling for changes.
- Control commands with acknowledgment: Both protocols can support control, but OPC UA methods and status variables can make the workflow clearer. With Modbus, you must design your own acknowledgment pattern using registers and state bits.
Use a Decision Checklist Before You Commit
Use this checklist to avoid surprises during commissioning.
- Can the device act as a server or client for the protocol you need?
- Do you need subscriptions or is polling acceptable?
- Are required data types and scaling supported consistently?
- Do you require secure transport and certificate-based trust?
- Will the network allow the required ports and traffic rates?
- Do you have a strategy for timeouts, retries, and stale data?
If you answer “no” to any item, plan for a gateway, a redesign of the data model, or a different integration approach.
Mind Map: Selecting Protocols Based on Capabilities and Constraints
Example: Choosing Modbus TCP for a Polling-Heavy Telemetry Panel
Suppose a packaging line controller exposes 300 temperature and pressure points as Modbus holding registers. The network is a flat industrial Ethernet segment with stable latency, and the control system already polls at 1-second intervals.
A Modbus TCP approach works well if:
- the device supports the needed read function codes,
- the register map is stable and documented,
- you can batch reads efficiently (for example, reading contiguous register blocks rather than one register per request),
- you define timeouts and retry limits so stale values are detectable.
If the same panel also needs alarm events with precise timestamps, you might still use Modbus for values but add an event channel via OPC UA from a gateway that can interpret state transitions.
Example: Choosing OPC UA for Mixed Semantics and Secure Access
Consider a utility substation gateway that must expose transformer status, analog measurements, and operator actions. The system requires certificate-based security and consistent units and ranges.
OPC UA is a strong fit when:
- the device can run an OPC UA server,
- you can model measurements as typed variables with engineering units,
- you can implement methods for operator actions with explicit input/output parameters,
- you can use subscriptions to reduce repeated polling.
In this scenario, Modbus would force you to encode semantics in register conventions and rely on external documentation for units and limits, which is workable but easier to get wrong.
Example: When Network Constraints Push You Toward a Gateway
Imagine Modbus RTU devices on a serial segment connected to an Ethernet control network with strict firewall rules. Direct Modbus TCP access is not allowed, and serial-to-Ethernet bridging must be controlled.
A gateway can translate Modbus RTU to OPC UA, letting the Ethernet side use secure OPC UA while keeping the serial side unchanged. The key is to ensure the gateway handles:
- consistent scaling and data typing,
- command acknowledgment semantics,
- and clear quality indicators when the serial link becomes unreliable.
Selecting the protocol is ultimately about aligning three things: what devices can express, what the network can carry, and what your application needs to do reliably.
1.3 Mapping Use Cases to Data Models Polling Patterns and Event Needs
A good integration starts by translating “what the system must do” into “what data must exist” and “how it should be delivered.” This section gives a systematic path from use cases to a concrete data model, then to polling patterns and event needs, so the design stays consistent when you implement it.
Step 1: Start with Use Cases and Delivery Expectations
Write each use case as a short statement with three fields: trigger, required freshness, and consumer behavior. For example:
- Trigger: operator presses Start
- Required freshness: command acknowledged within 2 seconds
- Consumer behavior: UI shows “Running” only after confirmation
This prevents a common mismatch: polling a value that must be event-driven, or expecting events for data that only changes when you poll.
Step 2: Classify Data by Change Behavior
Not all data deserves the same delivery method. Classify each signal into one of these buckets:
- State: changes occasionally but must be correct when read (e.g., motor running)
- Measurement: changes continuously and tolerates sampling (e.g., temperature)
- Alarms: must be noticed promptly and often require acknowledgement (e.g., over-temperature)
- Commands: require request/response semantics (e.g., set speed)
A simple rule of thumb: if the consumer must react immediately, treat it as event-like even if the source is polled.
Step 3: Map Use Cases to a Data Model
A data model is more than a list of tags. It defines types, units, constraints, and relationships.
Use a three-layer structure:
- Identifiers: stable names and grouping (e.g., Area, Asset, Function)
- Attributes: value, type, units, scaling, and quality
- Semantics: meaning of transitions, valid ranges, and acknowledgement rules
Example mapping for a pump asset:
- State variable:
Pump1.Running(boolean) - Measurement:
Pump1.SpeedRpm(float, unit rpm, range 0–3600) - Alarm:
Pump1.Alarm.OverTemp(boolean with severity and ack state) - Command:
Pump1.Cmd.SetSpeed(float input) andPump1.Cmd.SetSpeed.Status(enum)
Step 4: Choose Polling Patterns for Each Data Class
Polling patterns should reflect both network cost and control requirements.
Recommended patterns:
- Periodic polling for measurements and slowly changing states
- Fast polling windows after a known trigger (e.g., after issuing a command)
- Backoff polling when quality degrades or errors increase
Example schedule for one pump:
Runningstate: every 500 msSpeedRpm: every 200 msOverTempalarm: every 100 ms plus event-style handling when detected- Command verification: poll
Cmd.SetSpeed.Statusevery 50 ms for up to 2 seconds
This keeps the system responsive without turning the network into a constant stream of requests.
Step 5: Define Event Needs and How They Are Produced
Even if the source protocol is polled, you can still model events at the integration layer.
Define events as transitions with rules:
- Alarm event fires when alarm condition becomes true
- Alarm clears when condition becomes false
- Acknowledgement event fires when ack state changes
To avoid duplicate notifications, include an event key such as (AlarmId, TransitionType, TimestampBucket) and store the last emitted transition.
Mind Map: Use Cases to Data Models to Delivery
Example: From Use Case to Concrete Tag and Timing Decisions
Use case: “When the tank level exceeds 80%, raise an alarm within 300 ms and require acknowledgement.”
Mapping decisions:
- Data model
Tank1.LevelPct(float, 0–100)Tank1.Alarm.HighLevel(boolean)Tank1.Alarm.HighLevel.Acked(boolean)
- Polling
LevelPctevery 100 ms- Alarm evaluation on each sample
- Event needs
- Emit alarm event on
HighLeveltransition false→true - Emit ack event on
Ackedtransition false→true
- Emit alarm event on
This approach ensures the alarm is noticed quickly, while acknowledgement remains an explicit state change rather than a vague “someone clicked a button.”
Step 6: Validate the Mapping with Acceptance Checks
Before implementation, verify three things for each use case:
- Correctness: the data model expresses the required meaning (not just raw values)
- Timeliness: polling and event rules meet the freshness requirement
- Consistency: command and alarm transitions cannot contradict each other
A small checklist like this catches most integration bugs early, especially those caused by treating state, measurement, and alarm data as if they were interchangeable.
1.4 Establishing Performance Reliability and Interoperability Requirements
Performance, reliability, and interoperability requirements are the three knobs that keep industrial communication from turning into a guessing game. You set them early because they shape everything that follows: polling intervals, subscription settings, gateway behavior, and even how you name and scale data.
Performance Requirements
Start with what “fast enough” means in your system. Define end-to-end latency for each critical data path, not just protocol-level timing. For example, if a tank level alarm must reach an operator display within 500 ms, the requirement includes sensor update time, gateway translation time, network transit, and client rendering delay.
Next, specify throughput and load. Polling-based systems need a request rate budget per device and per gateway. If you poll 200 registers every 250 ms, you are effectively asking for 800 reads per second (before retries). For subscription-based systems, define expected publish rates and the maximum number of monitored items per client.
Then add jitter tolerance. Many systems can handle occasional delays, but they need to know how much variation is acceptable. A practical requirement might be: 95th percentile latency under 500 ms, with no more than 1% of updates exceeding 800 ms.
Finally, define how you measure. Use consistent metrics such as round-trip time for Modbus requests, publish interval adherence for OPC UA subscriptions, and observed update age at the consumer.
Reliability Requirements
Reliability is not “no errors.” It is “errors are handled predictably.” Define acceptable failure modes and recovery behavior.
Set a maximum tolerated communication error rate. For polling, this can be expressed as “no more than N consecutive timeouts” before marking data quality as stale. For subscriptions, define what happens when publishing stops: how quickly the client should detect it and how long it should wait before attempting a session or subscription restart.
Specify retry policy boundaries. Retries improve success rates but can overload a struggling network or device. A good requirement states both retry count and backoff behavior, plus an upper bound on total time spent trying before declaring failure.
Define idempotency and command verification for write paths. If a “start pump” command is retried, the system must avoid double-start. Requirements should include a command acknowledgment mechanism and a way to correlate writes with observed state changes.
Also define data freshness rules. Consumers need a clear definition of stale data, such as “data older than 2× the expected update interval is invalid.” This prevents the classic problem where old values look valid because they still arrive occasionally.
Interoperability Requirements
Interoperability is about making different systems agree on meaning, not just bytes on the wire.
First, define a data contract. For Modbus, requirements include register layout, scaling factors, signedness, and byte/word order. For OPC UA, requirements include node types, units, engineering ranges, and status semantics. The gateway must map these consistently so that a value of 25.0 °C is not interpreted as 25.0 °F or as a raw integer.
Second, define naming and addressing conventions. For OPC UA, require stable namespace usage and consistent browse paths so clients can find nodes without brittle assumptions. For Modbus, require a documented register map with explicit offsets and function code usage.
Third, define quality and diagnostics behavior. Requirements should specify how communication errors are represented. For OPC UA, this typically means using status codes and quality indicators. For Modbus, it means mapping exception responses into the gateway’s quality model.
Fourth, define time semantics. If timestamps exist, require a consistent time base and timezone handling strategy. If timestamps do not exist at the source, require the gateway to attach a “received at” timestamp and document it.
Mind Map: Performance Reliability Interoperability Requirements
Example: Turning Requirements into Concrete Targets
Assume a gateway exposes a Modbus temperature register as an OPC UA variable.
- Performance requirement: “Update age at the OPC UA client shall be under 1.0 s for 99% of updates.”
- Reliability requirement: “After 3 consecutive Modbus timeouts, mark the OPC UA variable quality as stale and stop issuing further reads for 5 s.”
- Interoperability requirement: “Modbus register value is a signed 16-bit integer scaled by 0.1 with big-endian word order; OPC UA variable type is Double with unit °C and engineering range -40 to 125.”
These targets remove ambiguity. The gateway knows how quickly to poll, when to declare stale data, and how to interpret the raw register so the client receives the same physical meaning every time.
Example: Write Path Requirements for Safe Commands
For a Modbus coil or holding register used to start a motor, require:
- “A start command must be acknowledged by observing a corresponding status register transition within 2 s.”
- “If the command write times out, retries are allowed up to 2 times, but only if the observed status is still ‘stopped’.”
- “If acknowledgment does not occur, the OPC UA method call returns a failure status and the gateway logs the last observed state.”
This makes retries safe and makes failures diagnosable without guessing whether the device received the first attempt.
1.5 Documenting Assumptions for Integration Scope and Acceptance Criteria
Integration projects fail in predictable ways: the hardware behaves “correctly,” but the system behaves differently than expected because someone assumed the wrong unit, timing, or meaning of a bit. This section turns those assumptions into explicit, testable statements so scope stays stable and acceptance is objective.
Start with a Shared Vocabulary
Before writing criteria, define the terms everyone will use. For Modbus, clarify whether you mean holding registers vs input registers, and whether addresses are zero-based or one-based in your tooling. For OPC UA, clarify whether you mean a variable’s engineering value, its raw value, or both.
A practical approach is to create a “data dictionary” table with three columns: Source field name, Engineering meaning, and Transfer representation. Example: “Pump Speed” might be represented as a Modbus register scaled by 0.1 (engineering RPM), while the OPC UA variable stores engineering RPM as a Double.
Define Integration Boundaries
Assumptions should state what is in scope and what is not. Typical boundaries include:
- Which devices are authoritative for each signal (PLC vs gateway vs historian).
- Which direction is controlled (read-only telemetry vs closed-loop commands).
- Which network segments are reachable (and which are intentionally blocked).
- Which failure modes are handled by the integration layer vs by the device logic.
Write these as short sentences that can be checked. Example: “The gateway is the only component allowed to write control commands to the PLC.” That single sentence prevents a common “two masters” problem.
Convert Assumptions into Testable Statements
Acceptance criteria should be measurable without requiring guesswork. Use the pattern: Condition → Expected Result → Measurement Method.
For timing assumptions, specify both the target and the tolerance. Example: “When a Modbus register changes, the corresponding OPC UA variable updates within 500 ms under normal network load, measured using timestamped logs at the gateway and OPC UA client.”
For data assumptions, specify conversions and edge behavior. Example: “A Modbus value of 3000 maps to 300.0 RPM using scale 0.1; values outside the configured engineering range are clamped and flagged with a bad quality status.”
Document Data Semantics and Quality Expectations
Many integrations “work” but still cause operational confusion because semantics are missing. Document:
- Units and scaling for every numeric signal.
- Bit meanings for status words, including reserved bits.
- How invalid or missing data is represented.
- What “good” quality means for each signal type.
A useful rule: if a value can be wrong, define how you will detect it and how you will communicate that to consumers. For OPC UA, this often means using quality/status indicators consistently rather than silently substituting defaults.
Specify Write Safety and Command Acknowledgment
Control paths need assumptions that prevent accidental actuation. Document:
- Which writes are permitted (single register vs multiple registers).
- Whether commands require an enable bit or a handshake.
- How acknowledgment is detected (state change, echo register, or method result).
- What happens if acknowledgment does not arrive.
Example acceptance criteria: “A Start command write is considered successful only when the PLC sets the corresponding ‘Running’ status within 2 seconds; otherwise the gateway marks the OPC UA method call as failed and does not re-issue the command automatically.”
Define Observability Requirements
If you cannot see what happened, you cannot accept correctness. Document required logs and identifiers:
- Correlation IDs for each command attempt.
- Timestamps at the gateway boundary.
- Error codes for Modbus exceptions and OPC UA service results.
- Metrics for read latency, write latency, and failure counts.
Acceptance criteria should include “evidence requirements.” Example: “For any failed command, the system must produce a log entry containing function code, register address, payload, OPC UA method identifier, and the PLC acknowledgment state.”
Mind Map of Scope and Acceptance Documentation
Mind Map: Assumptions, Scope, and Acceptance Criteria
Example Assumption-to-Criteria Set
Assumption: “Modbus register 40001 is treated as zero-based address 0 in the gateway configuration.”
Acceptance criteria: “Reading the configured address returns the same value as the PLC diagnostic view for at least 10 sampled points; mismatch is flagged as configuration error.”
Assumption: “OPC UA variable stores engineering units as Double with scale applied at the gateway.”
Acceptance criteria: “For a Modbus raw value range of 0–5000, the OPC UA engineering values match expected scaling within rounding rules; out-of-range values produce bad quality with a defined reason code.”
Assumption: “Start command requires Running status within 2 seconds.”
Acceptance criteria: “If Running is not observed within 2 seconds, the OPC UA method returns failure and the gateway records the last observed PLC status word.”
Keep It Stable and Reviewable
Assumptions should be versioned and reviewed with the same rigor as code. A simple practice is to maintain a single “Assumptions and Acceptance” document where each assumption has a matching acceptance criterion. If an assumption changes, the criterion changes too, and the team can see exactly what moved. This keeps scope from drifting quietly, like a unit conversion that nobody remembers to update.
2. Modbus Fundamentals for Practical Engineering
2.1 Modbus Message Structure Function Codes and Addressing Concepts
Modbus Message Structure
A Modbus message is a compact instruction plus data, designed to be easy for simple devices to parse. The structure depends on the transport, but the core idea stays the same: identify the target, state what operation to perform, and carry the parameters needed to read or write registers.
The Big Picture
Think of a Modbus request as three questions:
- Who should act? (Unit Identifier / Slave Address)
- What should happen? (Function Code)
- With which details? (Address, quantity, and payload)
A response answers the same questions in reverse: it echoes the function code and returns either data or confirmation of what was written.
Addressing Concepts
Modbus addressing is often the first place integration goes sideways, because “address” can mean different things.
- Slave Address: Identifies the device on a network. In Modbus TCP, this is typically carried as the Unit Identifier inside the MBAP header.
- Register Address: Identifies where in the device’s register space the operation applies.
- Zero-Based vs One-Based Confusion: Many documentation sets show register numbers starting at 1, while many implementations treat the register offset as 0. If you see “40001” in a manual, it often maps to offset 0 in the protocol field.
A practical rule: when you test, verify the mapping by reading a known register value and confirming it matches the expected physical tag.
Function Codes
Function codes define the operation type. They also determine the response format.
Common function codes you’ll see in engineering work:
- Read Holding Registers (03): Returns register values.
- Read Input Registers (04): Returns read-only register values.
- Write Single Register (06): Writes one register and echoes the address and value.
- Write Multiple Registers (16): Writes a block and returns confirmation.
- Read Coils (01) and Read Discrete Inputs (02): Return packed bit states.
- Write Single Coil (05) and Write Multiple Coils (15): Write packed bit states.
The key nuance: register-based function codes use 16-bit registers, while coil-based function codes use bit packing. Mixing them produces “valid” frames that still don’t mean what you think.
MBAP and Payload Separation
In Modbus TCP, the message is split into:
- MBAP Header: Transaction Identifier, Protocol Identifier, Length, and Unit Identifier.
- PDU: Function code plus the operation parameters.
This separation matters when debugging: if the MBAP header is wrong, the server may ignore the request even if the function code and parameters are correct.
Mind Map: Modbus Message Structure
Examples That Match Real Integration Work
Example: Reading Holding Registers
Suppose a device manual says “Holding Register 40001 contains the motor speed in rpm.” You want to read one register.
- Manual label: 40001
- Protocol start address field: often 0 (because 40001 maps to offset 0)
- Function code: 03
- Quantity: 1
If you read and get a value that matches the expected rpm, your mapping is correct. If you get something else, try offset 1 next—don’t guess forever, test with a known value.
Example: Writing a Control Register Safely
You want to set a “Start Command” register to 1 using Write Single Register (06).
A safe engineering pattern is:
- Write the command value.
- Read back the same register.
- Confirm the device reports the expected state change (often via a separate status register).
This avoids the classic failure mode where the write is accepted at the protocol level but the device ignores it due to mode, interlocks, or sequencing.
Example: Coil Packing vs Register Values
If you use Read Coils (01), the response returns bits packed into bytes. If you instead use Read Holding Registers (03), you’ll get 16-bit register values. Both frames can look “reasonable” in a capture, but only one matches the semantics of your tag.
A quick sanity check: if your expected values are only 0/1, prefer coil function codes; if you expect numeric ranges, prefer register function codes.
Advanced Details Without the Pain
Error Responses and Function Code Echo
When a request can’t be completed, Modbus returns an error response where the function code is modified (typically the function code plus 0x80) and an error code is included. The practical takeaway: always check whether the response function code matches what you sent, and if not, treat it as an error path.
Quantity Limits and Payload Size
Read requests include a quantity field. Many devices impose maximum quantities per request. If you request too many registers, you may get an exception response rather than partial data. Designing your client to batch reads into reasonable chunks prevents “works on my bench” surprises.
Addressing Consistency Across the Whole System
Once you confirm the mapping between documentation labels and protocol offsets, keep it consistent in your integration layer. A clean approach is to store a single canonical representation internally (for example, “protocol start offset”), then generate the correct request fields from that canonical form.
That one decision prevents a whole class of off-by-one bugs, especially when you later add more tags or switch devices.
2.2 Modbus RTU Over Serial Links Framing Timing and Error Handling
Modbus RTU over serial links turns a stream of bytes into discrete messages. The “RTU” part matters: framing is not done with explicit start/end markers; instead, the receiver decides where one frame ends and the next begins. That decision depends on timing, so the physical layer and serial settings are part of the protocol.
Serial Framing Basics
A Modbus RTU frame is typically:
- Address (1 byte)
- Function code (1 byte)
- Data (N bytes, depends on function)
- CRC (2 bytes, low byte first)
The serial line itself must be configured consistently on both ends: baud rate, parity, data bits, and stop bits. If those don’t match, you may still see “valid-looking” bytes, but CRC checks will fail and the receiver will discard the frame.
Timing Rules That Define Frame Boundaries
Because there are no explicit frame delimiters, Modbus RTU uses a silent interval to separate frames. The key idea is:
- A new frame starts after a gap of at least 3.5 character times.
- Within a frame, the gap between bytes must be less than 1.5 character times.
A “character time” is the time to transmit one full serial character, including start bit, data bits, parity bit (if used), and stop bit(s). For example, with 8 data bits, no parity, and 1 stop bit, the character is 10 bit-times. At 19200 baud, one character time is about 10 / 19200 seconds ≈ 0.521 ms. Then 3.5 character times is about 1.82 ms.
Practical implication: if your serial driver buffers and sends bursts with long pauses, the receiver may interpret the burst as multiple frames. If your system is too slow to read bytes promptly, the receiver’s UART FIFO may overflow, causing missing bytes and CRC failures.
Error Handling with CRC and Silent Discard
Modbus RTU relies on CRC-16 to detect corrupted frames. The receiver computes CRC over address, function, and data, then compares it to the received CRC. If it doesn’t match, the frame is discarded and no response is sent (for requests). This “no response” behavior is why timeouts are essential in the master.
Common failure modes and what they look like:
- Wrong serial settings: frequent CRC failures, often no valid responses.
- Noise or loose wiring: occasional CRC failures, sometimes recover after retries.
- Timing violations: frames split into fragments, CRC fails because the data is incomplete.
- Address mismatch: frames are valid CRC-wise but ignored because the address doesn’t match.
Master Request Strategy with Timeouts and Retries
A robust master does three things: sends a request, waits for a response within a defined timeout, and retries when no valid response arrives.
Timeout selection should account for:
- Serial transmission time for the request and expected response
- Processing time on the slave
- Any line turnaround delay if using RS-485
Retries should not be blind. For write commands, you want to avoid unintended repeated writes if the first attempt actually succeeded but the response was lost. A practical approach is to include an application-level sequence number in the payload when possible, or to design the slave behavior so repeated writes are idempotent.
RS-485 Turnaround and Half-Duplex Timing
On half-duplex RS-485, the master must switch from transmit to receive at the right moment. If you switch too early, you may cut off the last bytes of your own request. If you switch too late, you may miss the beginning of the slave’s response.
A simple rule: keep the transmitter enabled until the last byte has fully left the UART shift register, then switch to receive. Many UART/RS-485 transceivers provide a “transmit complete” signal or you can wait for the UART to drain.
Mind Map: Modbus RTU Framing Timing and Error Handling
Example: Estimating Timing Thresholds
Assume baud rate 9600, 8 data bits, no parity, 1 stop bit. That’s 10 bit-times per character. Character time ≈ 10 / 9600 = 1.0417 ms.
- 3.5 character times ≈ 3.65 ms
- 1.5 character times ≈ 1.56 ms
If your software pauses for 5 ms between bytes of a single request, the slave may treat the request as two frames. If you pause 0.8 ms between bytes, it stays within the same frame.
Example: CRC Check and Retry Logic
Below is a compact pseudocode sketch for a master that waits for a valid response and retries on timeout or CRC failure.
send_request(frame)
start_timer(timeout_ms)
while timer_not_expired:
  if bytes_received:
    resp = assemble_bytes()
    if resp.length_ok and crc_ok(resp):
      return resp
  else:
    continue
retry_count += 1
if retry_count <= max_retries:
  send_request(frame)
else:
  raise communication_error
This structure matters because “some bytes arrived” is not the same as “a valid Modbus RTU frame arrived.” CRC validation is the gatekeeper.
Example: Designing Idempotent Writes
Suppose you write a “start pump” command. If the master retries after a lost response, the slave might receive the command twice. To avoid double-start side effects, the slave can treat the command as a state set rather than an edge trigger: writing value 1 sets “running=true” and writing 1 again leaves it unchanged. Writing 0 clears it. That way, retries don’t create new behavior beyond the intended state.
2.3 Modbus TCP Encapsulation Session Behavior and Transaction Identifiers
Modbus TCP wraps Modbus function requests and responses inside a TCP stream. Unlike serial Modbus RTU, there is no timing-based frame boundary; instead, the protocol relies on a fixed header and the fact that TCP preserves byte order. That means your “session behavior” is mostly about how you correlate requests and responses while TCP handles delivery.
What “Session” Means in Modbus TCP
In Modbus TCP, a “session” is simply the TCP connection between a client and a server. The connection can be long-lived, but Modbus itself does not define a login phase or application-level session state. You still need to handle practical realities:
- The server may close the connection after inactivity.
- The client may reconnect after a network glitch.
- Multiple requests can be in flight depending on the client implementation.
Because Modbus TCP is request/response, the key engineering task is correlating each response to the correct request.
The Transaction Identifier Role
Every Modbus TCP message includes a Transaction Identifier (often called TID). The client chooses it, and the server echoes it back in the response. This lets the client match responses even when several requests are outstanding.
A typical Modbus TCP header contains:
- Transaction Identifier (TID): 2 bytes
- Protocol Identifier: 2 bytes (usually 0 for Modbus)
- Length: 2 bytes (number of following bytes)
- Unit Identifier: 1 byte (used for bridging to serial or multi-unit setups)
The TID is not a “session id.” It is a per-request correlation token. If you reuse a TID too quickly, you risk mis-association when responses arrive late.
Length Field and Message Framing over TCP
TCP is a byte stream, so the receiver must know where one Modbus TCP message ends. The Length field provides that boundary. The server reads the header, uses Length to determine how many more bytes belong to the message, then processes it.
A practical best practice is to implement strict parsing: do not assume that a single TCP read equals one Modbus message. Your code should buffer bytes until a full header and payload are available.
Request/Response Correlation with In-Flight Messages
If your client sends a request, waits for the response, then sends the next request, correlation is simple. If your client pipelines requests, correlation depends on TID.
Mind Map: Modbus TCP Session Behavior and Transaction Identifiers
Example: Sequential Requests
Assume a client sends two reads one after another. It uses TID 0x000A for the first request and waits for the response before sending the second.
- Request 1: TID=0x000A, Function=Read Holding Registers
- Response 1: TID=0x000A, Function=Read Holding Registers
- Request 2: TID=0x000B
- Response 2: TID=0x000B
Even if the TCP connection is stable, sequential behavior avoids the need for a TID map with multiple pending entries.
Example: Pipelined Requests
Now suppose the client sends two requests without waiting:
- Request A: TID=0x0100, Read Holding Registers
- Request B: TID=0x0101, Read Holding Registers
If the server responds out of order, the client must route each response by TID:
- Response for TID=0x0101 arrives first → complete Request B
- Response for TID=0x0100 arrives later → complete Request A
This is where a pending-request table matters.
Minimal Implementation Pattern
Below is a compact pattern showing how to correlate responses using TID and a pending map. It assumes you already have a function that extracts complete Modbus TCP frames from the TCP stream.
pending = Map<TID, PendingRequest>()
nextTid = 1

function sendRequest(pdu):
  tid = nextTid; nextTid = (nextTid + 1) mod 65536
  frame = buildModbusTcpFrame(tid, pdu)
  pending[tid] = new PendingRequest(timeout)
  tcp.write(frame)
  return pending[tid].waitForResponse()

function onFrameReceived(frame):
  tid = frame.transactionId
  if tid in pending:
    pending[tid].complete(frame)
    remove pending[tid]
  else:
    discard frame
Common Failure Modes and How TID Helps
- Timeouts: If a response doesn’t arrive before the timeout, you remove the pending entry. When a late response arrives, it will have a TID that no longer exists in the map, so you discard it.
- Reconnects: When the TCP connection drops, you typically clear pending requests because the server may have lost state or the responses will never arrive.
- TID reuse: If you wrap TID quickly (after 65535), ensure you do not reuse a TID while a previous request with that TID could still be in flight.
Diagram: End-to-End Correlation Flow
    flowchart TD
  A[Client builds request PDU] --> B[Assign TID]
  B --> C[Build Modbus TCP frame with Length and Unit Identifier]
  C --> D[TCP send]
  D --> E[Server reads full frame using Length]
  E --> F[Server processes function]
  F --> G[Server builds response frame and echoes TID]
  G --> H[TCP send response]
  H --> I[Client receives full frame]
  I --> J[Lookup pending request by TID]
  J --> K[Complete correct request]
Practical Takeaways
Treat Modbus TCP “session behavior” as TCP connection management plus strict message framing. Treat Transaction Identifier as the correlation mechanism that makes pipelining safe. If you implement buffering based on the Length field and route responses by TID, the rest of the system becomes much easier to reason about.
2.4 Common Data Types Register Layouts and Scaling Conventions
Industrial engineers rarely get burned by “wrong protocol.” They get burned by “wrong meaning.” In Modbus, the meaning comes from how you lay out registers and how you scale raw values into engineering units. This section builds a practical approach: start with register types, then define scaling rules, then lock down byte and word order, and finally verify with examples.
Register Types and What They Actually Represent
Modbus register space is fundamentally 16-bit. Everything else—32-bit values, signed numbers, floating-point, and bit fields—must be represented using one or more 16-bit registers.
Common patterns:
- Unsigned 16-bit: 0 to 65535. Typical for counters, raw ADC codes, and enumerations.
- Signed 16-bit: -32768 to 32767 using two’s complement. Typical for temperatures, offsets, and deltas.
- 32-bit values: two consecutive registers. Used for large counters, accumulated energy, and some process variables.
- Bit fields: one register holding multiple flags. Used for status, interlocks, and mode selection.
A good layout rule is: decide the semantic type first (counter, temperature, flag set), then choose the register representation that preserves it.
Scaling Conventions from Raw Codes to Engineering Units
Scaling converts the raw register value into a physical quantity. The most reliable scaling conventions are explicit and consistent across the register map.
A common linear form is:
- Engineering value = (Raw × Scale) + Offset
Where:
- Scale is often a power-of-ten fraction like 0.1, 0.01, or 0.001.
- Offset is used when the physical zero is not raw zero.
Example: a temperature register stores tenths of degrees Celsius.
- Raw = 253 → Engineering = 253 × 0.1 = 25.3 °C
Example with offset: a pressure sensor outputs kPa with an offset of -100 kPa.
- Raw = 1200 → Engineering = (1200 × 0.1) - 100 = 20.0 kPa
Scaling pitfalls to avoid:
- Mixing “scale” and “divisor” conventions across devices.
- Using different rounding rules in different registers.
- Treating signed values as unsigned during conversion.
Byte Order and Word Order for Multi-Register Values
For 32-bit values, you must define how the two 16-bit registers map to the original 32-bit number. Two separate issues exist:
- Word order: which 16-bit register comes first.
- Byte order: how bytes inside each 16-bit word are ordered.
Many Modbus integrations only define word order, but some devices effectively swap bytes too. When you see a value that is “plausible but wrong,” suspect ordering.
Practical Layout Templates
Use these templates to keep your register map readable and testable.
Template A: Signed 16-bit with tenths
- Raw type: int16
- Scale: 0.1
- Offset: 0
- Engineering = Raw × 0.1
Template B: Unsigned 16-bit enumeration
- Raw type: uint16
- Scale: 1
- Offset: 0
- Engineering is the enumeration label
Template C: 32-bit unsigned counter
- Raw type: uint32
- Scale: 1
- Offset: 0
- Engineering = Raw
Template D: 32-bit signed with scaling
- Raw type: int32
- Scale: 0.01
- Offset: 0
- Engineering = Raw × 0.01
Example: Building a Correct Conversion for a 32-Bit Value
Assume two registers hold a signed 32-bit temperature in hundredths of degrees Celsius. You must also know word order. Let’s say register A is the high word and register B is the low word.
Given:
  RegA = 0x0001
  RegB = 0x86A0
Word order:
  value32 = (RegA << 16) | RegB
Signed conversion:
  if value32 >= 0x80000000 then value32 -= 0x100000000
Scaling:
  engineering = value32 * 0.01
Result:
  value32 = 0x000186A0 = 100000
  engineering = 100000 * 0.01 = 1000.00 °C
If you swap word order, you’ll get a different number that may still look “numeric,” which is why validation matters.
Validation with Known Values and Range Checks
A register map is only as good as its tests. Use a small set of known inputs:
- Zero: raw 0 should map to the expected engineering zero.
- Positive max: confirm scaling and sign handling.
- Negative sample: for signed types, verify two’s complement conversion.
- Boundary rounding: confirm how you handle values like 1.005 with your chosen rounding rule.
A practical rule: keep raw values as integers internally, apply scaling only when presenting engineering units. That avoids accidental rounding drift during repeated computations.
Finally, document the conversion in the register map itself: type, scale, offset, and ordering. When someone else reads your map later, they should be able to compute the engineering value from raw registers without guessing.
2.5 Implementing Robust Polling Strategies with Timeouts and Retries
Polling is the quiet workhorse of Modbus integrations: it asks for data on a schedule, then turns answers into usable values. Robust polling means you can survive slow devices, occasional network hiccups, and occasional bad reads without turning your system into a jittery mess.
Core Polling Loop and Failure Modes
A practical polling loop has four stages: build a request, send it, wait for a response, then validate and publish results. Each stage has distinct failure modes.
- Request build failures: wrong function code, invalid address range, or inconsistent register mapping. These are configuration errors and should fail fast.
- Send failures: socket errors, serial port timeouts, or gateway overload. These are transient and should trigger retries.
- Response wait failures: no response within the timeout window. This is where timeouts and retries matter.
- Response validation failures: exception responses, CRC errors (RTU), or unexpected byte counts. These should be treated as failed reads, not as “maybe good.”
A good default is to treat “no response” and “exception response” similarly at the control-flow level, but record different diagnostics so you can tell the difference later.
Timeouts That Match Reality
Timeouts should reflect the slowest expected path, not the average. Start with a baseline: typical device response time plus network/serial latency plus a small margin. Then add a rule: timeouts must be shorter than your polling interval, or you risk overlapping cycles.
If you poll every 1 second, a timeout of 900 ms leaves almost no room for processing and logging. A more stable setup is to budget, for example, 200–400 ms for the request/response exchange and keep the rest for scheduling and computation.
Retry Policy That Doesn’t Multiply Load
Retries should be limited and structured. Retrying immediately can worsen congestion, especially when multiple clients poll the same gateway.
A simple, effective policy:
- Retry count: 2 retries after the first failure (total 3 attempts).
- Backoff: wait 50–150 ms before retrying, increasing slightly each time.
- Stop conditions: do not retry on configuration errors; do retry on timeouts and Modbus exceptions.
Keep retries per register group, not per individual register, when possible. Batching reduces the number of request/response exchanges and therefore reduces the number of failure opportunities.
Polling Granularity and Batching
Polling everything at the same rate is rarely necessary. Split your register map into groups by change rate and criticality.
- Fast-changing control/status: poll frequently with small batches.
- Slow-changing measurements: poll less often with larger batches.
- Rarely used diagnostics: poll on demand or at a very low rate.
Batching also helps with retries. If a group read fails, you retry the group read once or twice rather than retrying each register separately.
Example: Grouped Polling with Timeouts and Retries
The example below shows a polling worker that reads a Modbus register block, validates the response, and retries on timeout or Modbus exception.
function pollGroup(client, group, timeoutMs, maxRetries):
  attempts = 0
  while attempts <= maxRetries:
    attempts += 1
    start = now()
    result = client.readHoldingRegisters(
      group.startAddress,
      group.length,
      timeoutMs
    )

    if result.ok and validate(result, group):
      publish(group, result)
      return

    if result.errorType == "config":
      logError("Config error", group, result)
      return

    logWarn("Poll failed", group, result, attempts)

    if attempts <= maxRetries:
      sleep(backoffMs(attempts))

  markGroupUnhealthy(group)
In practice, validate checks byte counts, expected register count, and any known invariants like “status register must be within defined range.”
Mind Map: Polling Robustness
Advanced Details That Prevent Subtle Bugs
- Avoid overlapping cycles: If a poll interval is 1 second and a group read can take 500 ms, ensure the scheduler doesn’t start a new cycle while the previous one is still waiting.
- Use consecutive-failure thresholds: After N consecutive failures, mark the group unhealthy and reduce polling frequency or switch to a degraded mode that still keeps critical signals alive.
- Quality indicators matter: Publish a “stale” or “bad” quality flag when a read fails or when the last successful timestamp exceeds a threshold. Downstream logic needs a reliable signal, not just old values.
- Differentiate exception types: Modbus exception codes can indicate illegal address, device busy, or other conditions. Treating all exceptions as identical leads to confusing diagnostics.
Example: Quality-Aware Publishing
When a read fails, do not silently keep the previous value as if it were fresh. Instead, update metadata.
if readSuccess:
  value = decoded
  quality = "Good"
  timestamp = now()
else:
  value = lastValue
  quality = "Bad" or "Stale"
  timestamp = lastTimestamp
  incrementFailureCounter(group)
This keeps control logic deterministic: it can refuse commands when quality is not good, and it can alert operators when a specific group is failing.
Practical Defaults to Start With
Use these defaults as a baseline: group registers by rate, batch reads, set a timeout that leaves room inside the polling interval, retry twice with small backoff, and mark groups unhealthy after a short run of consecutive failures. Then tune based on observed response times and failure logs, not on guesses.
3. OPC UA Fundamentals for Practical Engineering
3.1 OPC UA Architecture With Clients Servers Address Space And Services
OPC UA is built around a simple idea: a client asks for information and actions, a server provides them, and both agree on a structured model of the plant data. The “architecture” is the set of parts that make that agreement reliable and understandable.
Core Roles
A server hosts an address space, which is a structured representation of what the system knows: devices, signals, states, and operations. A client connects to one or more servers, discovers what is available, and then reads values, receives updates, or invokes actions.
A useful mental model is: the address space is the “map,” while services are the “roads.” Clients use services to travel the map.
Address Space Fundamentals
The address space is organized as nodes connected by references. Nodes can represent variables (data values), objects (groupings and semantics), methods (callable operations), and more.
Key building blocks:
- Objects: containers that represent real-world groupings like a Pump, a Tank, or a Production Line.
- Variables: typed values like
Temperature,Pressure, orMotorSpeed. - Methods: callable operations such as
Start,Stop, orResetFault. - References: relationships like “has component,” “organizes,” or “has property.”
Nodes live in namespaces. Namespaces prevent collisions when different vendors or subsystems use similar names. A node’s identity is stable even if display names change.
Services and How Clients Use Them
OPC UA defines services as the standardized operations that clients and servers perform. Services cover:
- Discovery and browsing: find what exists and how nodes relate.
- Reading and writing: get current values or request changes.
- Subscriptions and monitoring: receive updates when values change.
- Method calls: execute operations with inputs and outputs.
- Session management: establish and maintain a communication context.
A practical flow for a typical client looks like this:
- Connect to the server endpoint.
- Create a session.
- Browse the address space to locate the nodes of interest.
- Read initial values.
- Set up monitoring or subscriptions.
- Optionally write values or call methods.
If you’ve ever used a spreadsheet to find a column header and then read cells, the analogy is close: browsing finds the right nodes; services fetch or act on them.
Sessions and Communication Context
A session is a logical relationship between a client and server. It carries state such as authentication context and subscription-related bookkeeping. Sessions help the server apply access control consistently and allow clients to reuse context rather than repeating setup for every operation.
When a session ends, the server can clean up resources like active subscriptions.
Data Modeling: Types, Semantics, and Quality
OPC UA encourages modeling that makes integration less fragile. Variables have data types and often include engineering metadata such as units and valid ranges.
Servers also provide data quality information alongside values. That quality is not decoration; it tells the client whether a value is current, uncertain, or stale. A client that ignores quality will eventually act on the wrong number and then wonder why the plant disagreed.
Mind Map: OPC UA Architecture
Example: From Browse to Read to Action
Imagine a client wants the status of a conveyor and the ability to start it.
- Browse: the client navigates from a top-level object like
Conveyor1to a variable likeRunningStatus. - Read: it reads
RunningStatusto decide whether the conveyor is already running. - Write or Method Call: if the conveyor is stopped, the client calls a method like
Startrather than writing a raw control bit. Methods can return execution results and status, which makes the workflow easier to validate.
This pattern reduces ambiguity: a variable read tells you what is happening; a method call tells you what you asked the system to do.
Example: Node Identity and Namespaces
Two servers might both expose a variable named Speed. If a client relies only on display names, it can mix up the meaning. With namespaces and stable node identifiers, the client can consistently target the correct node even when names differ.
In practice, the client stores the node identifiers it discovers during browsing and uses them for subsequent reads and writes.
Example: Services in a Single Sequence
Client
  1) Connect
  2) Create Session
  3) Browse for Conveyor1/RunningStatus
  4) Read RunningStatus
  5) Subscribe to RunningStatus changes
  6) If stopped, Call Conveyor1/Start
Server
  1) Validates permissions
  2) Returns values with quality
  3) Tracks subscription state
  4) Executes method and reports results
Practical Design Implication
When you design an OPC UA server, treat the address space as the product. When you design a client, treat services as the contract for how you interact with that product. If either side is vague—missing types, inconsistent references, or unclear method semantics—integration becomes guesswork. If both sides are precise, the architecture does its job quietly and predictably.
3.2 Sessions Subscriptions Monitored Items and Data Change Delivery
Sessions, Subscriptions, Monitored Items, and Data Change Delivery
OPC UA separates communication into layers so you can scale from a single dashboard to many clients without turning the server into a traffic jam. The key pieces are sessions, subscriptions, monitored items, and data change delivery.
Sessions
A session is a logical relationship between a client and a server. It is created after the client establishes a secure channel and then requests a session with a chosen timeout. During the session, the client can call services such as browsing, reading, writing, and creating subscriptions.
A practical way to think about it: the secure channel is the tunnel, and the session is the paperwork that lets you use the tunnel for a specific client identity and set of permissions. If the session timeout expires, the server can drop it, and the client must recreate it before it can reliably receive updates.
Example: A plant historian client opens a session with a 60-second timeout and then immediately creates subscriptions. If the client pauses for 90 seconds due to a restart, the server may close the session; the client must re-establish the session before it can continue receiving data changes.
Subscriptions
A subscription defines how the server should watch for changes and how it should deliver them. It includes timing parameters that control the sampling and publishing behavior.
- Publishing interval: how often the server sends notifications to the client.
- Publishing lifetime: how long notifications can wait before expiring.
- Keep-alive: how often the server sends a minimal message when nothing changes.
- Lifetime and max notifications: how long the subscription remains valid and how many notifications can be queued.
The server does not push every raw sample immediately. Instead, it samples monitored items, collects changes, and then publishes them according to the subscription settings. This is why you can reduce network load without losing the ability to detect changes.
Monitored Items
A monitored item is a specific data source the server watches, typically an OPC UA node such as a variable. For each monitored item, you choose:
- Sampling interval: how frequently the server checks the value.
- Monitoring mode: typically enabled for data change monitoring.
- Deadband: a rule to avoid reporting tiny changes.
- Queue size and discard policy: how to handle bursts.
Deadband is the simplest “don’t spam me” mechanism. If a temperature changes by 0.05 °C and your deadband is 0.1 °C, the server can suppress that update.
Example: You monitor a motor speed variable. With a sampling interval of 100 ms and a publishing interval of 500 ms, the server may sample five times but publish at most one notification per publishing interval, containing the latest change that meets the deadband rules.
Data Change Delivery
Once a subscription exists, the server delivers updates using notifications. The client receives them through a service designed for subscription notifications.
Key behaviors to understand:
- Notifications are not guaranteed to contain every sample. They contain changes that meet the monitored item rules and fit within queue limits.
- Queueing can drop data when the client cannot keep up. The discard policy determines whether old or new notifications are dropped.
- Keep-alives prevent silent failures. If nothing changes, the server still sends a periodic message so the client knows the subscription is alive.
Example: A client temporarily stalls for 2 seconds while the publishing interval is 200 ms. If the subscription queue can hold only 5 notifications, it may discard some updates. The client should treat the next notification as “current state,” not as a perfect time series.
Mind Map: Sessions, Subscriptions, Monitored Items, Delivery
Integrated Example: From Session to Notifications
- The client creates a session with a 60-second timeout.
- It creates a subscription with a 500 ms publishing interval and a keep-alive of 5 seconds.
- It adds monitored items:
MotorSpeedwith 100 ms sampling and 1 rpm deadband.StatusWordwith 100 ms sampling and no deadband.
- The server samples values, detects changes, and publishes notifications every 500 ms.
- If
MotorSpeedchanges by less than 1 rpm, the server suppresses those updates, reducing traffic. - If the client misses notifications due to load, the queue rules decide what gets discarded, and the next notification reflects the latest acceptable state.
This structure keeps responsibilities clear: sessions manage access and identity, subscriptions manage timing and delivery, monitored items manage what “counts as a change,” and data change delivery manages how updates arrive over the network.
3.3 Node Identifiers Namespaces and Browse Paths for Integration
OPC UA integration starts with a simple question: “How does the client find the exact thing it needs?” The answer is a combination of Node Identifiers, Namespace URIs, and Browse Paths. If you get these three right, everything else—subscriptions, method calls, and data quality—becomes much easier to wire up.
Node Identifiers as Stable Keys
A Node Identifier is the unique key for a node in an OPC UA server’s address space. In practice, you should treat it like a primary key in a database: stable, unambiguous, and not something you “guess” at runtime.
OPC UA supports several identifier formats, but the integration-friendly mindset is consistent: prefer identifiers that remain stable across server restarts and configuration reloads. If you use numeric identifiers, document the mapping to your engineering model. If you use string identifiers, keep them deterministic and derived from the same source model every time.
Example: a gateway exposes a tank level sensor. The server might represent it as a variable node with an identifier like Tank1.Level. Even if the internal address space is rebuilt, the identifier should remain the same so clients don’t break.
Namespaces as Scoping Rules
Namespaces prevent collisions. A Node Identifier alone is not enough to guarantee uniqueness across servers because the same identifier value can appear in different namespaces. The Namespace URI is the human-readable scope, while the Namespace Index is the server’s internal numeric mapping.
Integration best practice: clients should not hardcode Namespace Index values. Instead, they should resolve the Namespace URI to the current Namespace Index during connection. That way, if the server reorders namespaces, your client still finds the correct nodes.
Example: your client expects http://example.com/gateway/plantA. On connection, it asks the server for the Namespace Index corresponding to that URI, then uses that index when building Node Identifiers or Browse Paths.
Browse Paths as Human-Readable Navigation
Browse Paths are how clients navigate from a known starting point to a target node. They are built from reference names and hierarchy, not from raw Node Identifiers. This makes them resilient to changes in internal numeric identifiers, as long as the hierarchy and reference structure remain consistent.
A Browse Path is typically expressed as a sequence of “steps.” Each step names a reference relationship, such as Objects, DeviceSet, or Tank1, and the final step lands on the target node.
Example: instead of searching for a variable node by identifier, the client can browse from the server’s Objects folder to a device object and then to a variable.
Designing a Predictable Address Space
To make Browse Paths reliable, design the server’s address space with a consistent hierarchy:
- Use
Objectsas the root for application data. - Model physical or logical groupings as Objects (for example,
Plant,Line,Device). - Represent measurable values as Variables under the relevant device object.
- Keep reference names consistent and stable. If you rename a reference, Browse Paths break.
A practical rule: if an engineer can point to the node in a server browser and describe the path in words, your Browse Path design is probably good.
Mind Map: Node Identifiers, Namespaces, Browse Paths
Example: Building a Browse Path for a Variable
Assume the server organizes nodes like this: Objects → PlantA → Line1 → Tank1 → Level.
A client would:
- Resolve the Namespace URI for the gateway model to get the Namespace Index.
- Start at the standard
Objectsfolder. - Apply a sequence of browse steps using the reference names that match the server’s hierarchy.
- Retrieve the target node and then use it for subscriptions or reads.
If the server changes the internal Node Identifier for Level but keeps the same hierarchy and reference names, the Browse Path still works. If the hierarchy changes, the Browse Path fails—so the hierarchy is the contract.
Example: When to Use Node Identifiers Instead
Browse Paths are great for navigation, but Node Identifiers are best when you already know the exact node. For example, if your gateway stores a mapping table from engineering tags to Node Identifiers, you can use those identifiers directly to reduce browsing overhead.
A simple integration pattern is: use Browse Paths during initial commissioning to verify the hierarchy, then store the resulting Node Identifiers for fast runtime access. This keeps commissioning flexible while runtime stays deterministic.
Common Integration Pitfalls
- Hardcoding Namespace Index values instead of resolving Namespace URIs.
- Changing reference names or hierarchy without updating client configurations.
- Using non-deterministic identifiers that differ after restarts.
- Treating Browse Paths as “optional” when the server’s address space is not designed for stable navigation.
When you treat Node Identifiers as stable keys, Namespaces as scoping rules, and Browse Paths as navigation contracts, your integration becomes predictable. Clients stop guessing, servers stop surprising, and the rest of the OPC UA features can be used without constant rework.
3.4 Encoding Rules for Data Types, Variants, and Status Codes
OPC UA uses a typed information model, but the wire format still needs rules for how values and their “meaning” travel together. This section explains how encoding rules keep data consistent across vendors, languages, and network conditions—without forcing you to guess what a number actually represents.
Core Encoding Concepts
OPC UA represents values using a combination of:
- Data type: what the value is (e.g., Int32, Boolean, Float, String).
- Value: the actual payload.
- Variant wrapper: a container that carries both the data type and the value.
- Status code: a separate field that tells whether the value is valid, uncertain, or not available.
A practical way to remember it: the Variant answers “what is it,” while the Status code answers “can you trust it.”
Variants and Data Types
A Variant is the standard container used in services like Read, Browse, and in subscription data change notifications. Encoding rules ensure that the Variant includes enough information to interpret the bytes correctly.
Example: Boolean and Int32
- If a variable is modeled as Boolean, the Variant encodes a Boolean value.
- If it is modeled as Int32, the Variant encodes a 32-bit signed integer.
Even if both are “just bytes” on the wire, the encoding rules prevent accidental reinterpretation.
Common pitfall: treating a scaled register as the wrong type. If your Modbus register map says “temperature is Int16 scaled by 0.1,” but your OPC UA variable is modeled as Int32 without scaling rules, you’ll end up with values that look plausible but are numerically wrong.
Status Codes and Their Meaning
Status codes accompany values to represent quality and availability. They are not decoration; they drive client behavior such as whether to display, alarm, or ignore a data point.
Typical categories you’ll encounter:
- Good: the value is valid.
- Uncertain: the value may be usable but not fully reliable.
- Bad: the value is not valid or not available.
Example: Stale sensor with a good-looking number
A gateway might still send the last known temperature value, but mark it with a Bad or Uncertain status. A client that checks status codes will avoid acting on stale data, even though the numeric payload exists.
Encoding Rules for Variants
Encoding rules can be summarized as a checklist:
- Use the modeled data type for the Variant.
- Encode the value in the expected binary representation for that type.
- Include the Variant type information so receivers can interpret the payload.
- Attach a status code that matches the quality of the value.
Example: String vs Byte String
- String expects character data.
- ByteString expects raw bytes.
If you encode a JSON payload into a ByteString but model the node as String, clients may display gibberish or fail parsing.
Encoding Rules for Status Codes
Status codes should be consistent with the situation:
- If the device read fails, encode a Bad status and avoid implying the value is current.
- If the device is reachable but the measurement is out of range or incomplete, use an Uncertain status.
- If the value is correct and current, use Good.
Example: Command acknowledgments
For a control workflow, you might write a command request and then read back a status variable. If the write succeeded but the device hasn’t acknowledged yet, the acknowledgment variable should carry a status that reflects “not yet confirmed,” rather than Good.
Mind Map: Variant and Status Encoding
Worked Example: From Model to Wire Meaning
Assume an OPC UA variable is modeled as Float with engineering units “°C.” A gateway reads a Modbus holding register, scales it, and publishes it.
- If the Modbus read succeeds and scaling is applied correctly, the Variant encodes a Float value and the status is Good.
- If the Modbus read times out, the gateway should not invent a temperature; it should encode a Bad status. The numeric payload may be omitted or set to a default depending on implementation, but the status must clearly indicate unusable data.
This separation lets clients make consistent decisions: they can still log the event, but they won’t treat the value as trustworthy.
Worked Example: Composite Values and Status
If you model a composite measurement as separate variables (e.g., value and quality), keep the encoding rules aligned:
- The measurement variable carries the encoded numeric value plus a status that reflects measurement quality.
- The quality variable carries its own status and meaning.
Don’t rely on one variable’s status to imply the other’s correctness. When both are encoded independently, debugging becomes straightforward: you can see exactly which part failed.
3.5 Handling Communication Errors and Service Level Diagnostics
Communication errors are inevitable; the goal is to make them measurable, explainable, and actionable. In OPC UA, diagnostics come from two layers: the service response itself (status codes and diagnostic info) and the session lifecycle (timeouts, subscriptions, and keep-alives). A good approach starts with a simple classification, then maps each class to a concrete handling strategy.
Error Classification That Drives Handling
- Transport and connectivity failures: TCP drops, DNS issues, or routing problems. Symptoms include abrupt session termination or repeated timeouts.
- Protocol-level service failures: The request reached the server, but the service returned a non-good status code (for example, access denied or invalid node).
- Data delivery failures: Subscriptions do not deliver expected updates, or delivered values are stale or marked with bad quality.
- Client-side processing failures: Parsing, type conversion, or application logic rejects a value even though the service succeeded.
A practical rule: treat transport failures as “retry with backoff,” treat service failures as “fix the request or permissions,” and treat data delivery failures as “re-evaluate subscription health and staleness.”
Service Level Diagnostics Using Status Codes
OPC UA services return a StatusCode plus optional diagnostic details. Start by logging the service name, request parameters that matter (node ids, method ids, subscription id), and the returned status code. Then normalize handling by status class:
- Bad_ConnectionClosed / Bad_Timeout: session or request timing issue; trigger reconnect and resubscribe.
- Bad_UserAccessDenied / Bad_NotAuthorized: permissions or certificate trust; do not retry blindly.
- Bad_NodeIdUnknown / Bad_AttributeIdInvalid: configuration mismatch; verify node ids and attribute ids.
- Bad_InvalidArgument: request shape is wrong; validate inputs before calling.
- Bad_OutOfRange: scaling or conversion mismatch; check engineering units and data type expectations.
When you log, include a correlation id per logical operation. That way, if a subscription update fails and a method call fails around the same time, you can tell whether they share a root cause.
Subscription Health and Staleness Checks
For subscriptions, “no new data” is not the same as “communication is down.” Use two signals:
- Keep-alive and publishing behavior: if publishing stalls, the server may be unable to deliver notifications.
- Staleness and quality: values carry quality and timestamps. If the timestamp stops advancing beyond your tolerance, treat it as a delivery failure even if the session is still alive.
A simple staleness policy: define a maximum acceptable age per signal based on your polling/refresh expectations. If a value exceeds that age, mark it as stale in the application and raise a diagnostic event.
Mind Map: Diagnostics Workflow
Example: Method Call Failure with Targeted Recovery
Suppose a client calls a control method to start a machine. The method returns a non-good status code.
- If the status is Bad_UserAccessDenied, the client should stop and surface “permission issue,” not retry.
- If it is Bad_Timeout, the client should retry after reconnecting if the session is no longer valid.
- If it is Bad_InvalidArgument, the client should re-check the input mapping (for example, a boolean mapped to an integer field).
Operation: StartMachine
Correlation: op-7f3a
Service result: Bad_Timeout
Action: reconnect session, recreate subscription if needed, retry once
Next log: StartMachine retry result
Example: Subscription Stale Data Detection
A temperature signal is expected to update at least every 2 seconds. The client receives values with timestamps.
- If the timestamp age exceeds 2 seconds + a small tolerance (for example, 200 ms), mark the value stale.
- If staleness persists for N consecutive intervals, treat it as a delivery failure and attempt a subscription re-establishment.
Signal: TankTemperature
Expected interval: 2.0s
Tolerance: 0.2s
Rule: stale if age > 2.2s
Escalation: after 3 stale intervals, recreate subscription
Operational Diagnostics That Stay Useful
Diagnostics should produce evidence, not just messages. Include:
- A short “what happened” line (service name + status code).
- A “what we did” line (retry, reconnect, resubscribe, or stop).
- A “what to check” line (permissions, node mapping, subscription parameters, or network path).
For example, if a node id is wrong, the logs should show the exact node id used and the returned status code, so the fix is mechanical rather than interpretive.
Mind Map: Decision Table for Handling
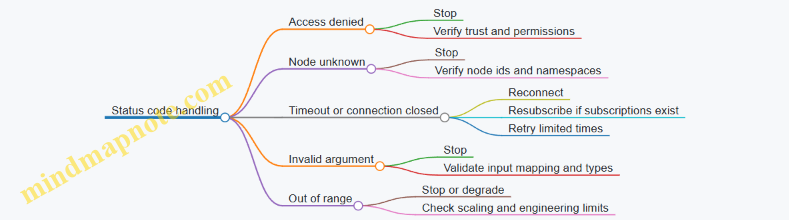
A disciplined diagnostic flow turns “it didn’t work” into a sequence of verifiable steps. That’s the difference between debugging and guessing, and it keeps the system’s behavior consistent even when the network is not.
4. Designing a Modbus Integration Plan
4.1 Building a Register Map With Correct Offsets Word Order and Endianness
A register map is the contract between a Modbus device and the system that reads it. If offsets, word order, or endianness are wrong, everything else—scaling, alarms, control logic—will be built on sand. The goal here is to produce a map that is unambiguous, testable, and consistent across engineers and tools.
Start with a Clear Addressing Model
Modbus addressing has two common sources of confusion: the protocol address space and the documentation address space. Many vendors label registers starting at 40001 for holding registers, while Modbus function calls use zero-based offsets. Pick one convention for your internal map (for example, “Modbus offset” starting at 0) and convert everything into that convention.
For each register entry, record:
- Register type (Coil, Discrete Input, Input Register, Holding Register)
- Modbus function code that will access it (e.g., 03 for holding input read)
- Modbus offset (zero-based)
- Data width in registers (1 for 16-bit, 2 for 32-bit, etc.)
- Data type and scaling rules
- Byte/word order rules
Define Offsets as a Contiguous Layout
Offsets should be planned so related values sit next to each other when possible. This reduces the number of read requests and makes it easier to validate with a single “known range” read.
A practical approach:
- Group values by update rate and access pattern (fast-changing status vs. slow configuration).
- Allocate contiguous blocks per group.
- Leave explicit gaps only when you must match an existing vendor layout.
Example layout for Holding Registers (function 03/06/16):
- 0–9: Process values (fast)
- 10–19: Control and feedback (fast)
- 20–39: Configuration (slow)
Specify Word Order for Multi-Register Values
A 32-bit value occupies two 16-bit registers. The tricky part is the order of those 16-bit words. Common patterns are:
- Big-endian word order: high word first
- Little-endian word order: low word first
Write it down as a rule tied to your map, not as a vague note. For instance: “For 32-bit values, register offset N contains the high word; offset N+1 contains the low word.”
Specify Endianness for Bytes Within Words
Endianness can also apply within each 16-bit register. Some devices swap bytes inside the word, which affects how you interpret signed integers, IEEE 754 floats, and bit patterns.
To avoid ambiguity, describe the byte mapping explicitly. For a 32-bit float stored across two registers:
- Word order rule (which register is first)
- Byte order rule (how bytes inside each register are ordered)
If your system uses a standard “network order” interpretation but the device uses swapped bytes, you must swap before converting to float.
Use a Mind Map to Keep the Rules Straight
Mind Map: Register Map Decisions
Build an Example Register Map Entry Set
Assume you want to expose three values from a device:
- Temperature: signed 32-bit, scaled by 0.1 °C
- Pressure: unsigned 32-bit, scaled by 0.01 bar
- Status word: 16-bit bitfield
Choose offsets:
- Temperature uses Holding Registers 0–1
- Pressure uses Holding Registers 2–3
- Status uses Holding Register 4
Now define the rules:
- Word order for 32-bit: register N = high word, N+1 = low word
- Byte order within each 16-bit register: big-endian (byte 0 is MSB, byte 1 is LSB)
Example table (conceptual, not tool-specific):
- Offset 0–1: Temperature32
- Type: int32
- Scaling: value = raw * 0.1
- Word order: high word first
- Byte order: big-endian within each word
- Offset 2–3: Pressure32
- Type: uint32
- Scaling: value = raw * 0.01
- Word order: high word first
- Byte order: big-endian within each word
- Offset 4: Status16
- Type: uint16
- Bits: 0=Running, 1=Fault, 2=Local/Remote
Validate with Known Values Without Guesswork
Validation should be deterministic. Use a device mode or simulator that can output known raw patterns.
- For Temperature, set the device to a known raw integer that maps cleanly after scaling. For example, raw 250 corresponds to 25.0 °C.
- Read the two registers as a single block (offset 0 length 4 if you also want pressure and status).
- Reconstruct the 32-bit raw using your word and byte rules.
- Confirm the reconstructed raw equals the expected raw.
If the reconstructed value is off by a byte swap or word swap, you’ll see it immediately because the magnitude and sign will not match.
Common Failure Modes and How the Map Prevents Them
- Offsets off by one: your map uses one convention, and you convert at the boundary.
- Word order reversed: your map explicitly states which register holds the high word.
- Byte order swapped: your map states byte mapping within each 16-bit register.
- Mixed interpretation: your map ties each offset block to a specific type (int32 vs uint32 vs float) so you don’t “reinterpret” the same raw bits differently.
Quick Checklist Before You Call It Done
- Every multi-register value has both word order and byte order rules.
- Every offset is documented in the chosen convention.
- Related values are placed in contiguous blocks for efficient reads.
- At least one known test value validates each multi-register rule.
When these pieces are written down clearly, integration becomes mostly mechanical: read registers, apply the documented reconstruction, then apply scaling and bit decoding.
4.2 Choosing Function Codes for Reads Writes and Control Operations
Function codes are the “verbs” in Modbus. Picking the right one is less about memorizing numbers and more about matching the device’s capabilities to your system’s intent: read data safely, write configuration predictably, and control actuators without surprises.
Start with Intent Not Numbers
Before selecting a function code, write down what the operation must guarantee.
- Read intent: Do you need periodic measurements, status snapshots, or event-driven reads? Reads should be fast and non-invasive.
- Write intent: Are you updating setpoints, calibrations, or mode selections? Writes should be validated and traceable.
- Control intent: Are you commanding a start/stop, acknowledging an alarm, or toggling a latch? Control operations must be idempotent where possible.
A simple rule: if the operation changes behavior, treat it like a control path and design for verification.
Map Your Data to the Modbus Access Model
Modbus exposes data through register spaces. Your function code choice depends on whether the target is:
- Coils: single-bit outputs or statuses.
- Discrete Inputs: single-bit inputs.
- Holding Registers: typically writable configuration and setpoints.
- Input Registers: typically read-only measurements.
Example: a motor start command is often modeled as a coil, while a speed setpoint is commonly a holding register. If you try to write a coil using a register write function, you’ll get either errors or silent misbehavior depending on the gateway.
Reads Function Codes for Measurements and Status
For reads, prefer the smallest operation that meets your timing needs.
- Read Coils: Use when you need multiple boolean outputs or status flags.
- Read Discrete Inputs: Use for boolean inputs reported by the device.
- Read Holding Registers: Use for measurement values that the device exposes as holding registers, or for reading configuration.
- Read Input Registers: Use for measurement values the device exposes as input registers.
Best practice: batch reads. Instead of reading one register at a time, read a contiguous block so you reduce request overhead and keep your polling schedule stable.
Example: if you poll 12 consecutive registers for temperature, pressure, and flow, read them in one block rather than three separate single-register reads. Your gateway logs will thank you.
Writes Function Codes for Configuration and Setpoints
Writes come in two flavors: single-item writes for low-rate changes, and multi-item writes for bulk updates.
- Write Single Coil: Use for one-bit control or mode toggles.
- Write Single Register: Use for one setpoint or one configuration value.
- Write Multiple Coils: Use for bulk boolean updates.
- Write Multiple Registers: Use for bulk setpoints or configuration blocks.
A practical selection heuristic:
- If you change one value occasionally, use the single-item write.
- If you update a group that must be consistent, use the multi-item write so the device receives them together.
Example: updating a PID parameter set (Kp, Ki, Kd) should usually be a multi-register write. If you write them one at a time, the controller might briefly run with a mixed parameter set.
Control Operations with Verification Steps
Control operations often require more than “write and hope.” Even when the function code is correct, you still need to confirm the effect.
Common control patterns:
- Command then verify: Write a coil or register, then read back the status that indicates the command was accepted.
- Command with acknowledgment: Some devices expose an acknowledgment bit or a state register; use it to confirm completion.
- Command idempotency: If the device supports it, design so repeating the same command does not cause repeated unintended actions.
Example: start/stop.
- Write Start as a coil.
- Immediately read back a Running status coil or a State register.
- If Running doesn’t change within your timeout, treat it as a failure and avoid re-sending blindly.
Mind Map: Choosing Function Codes
Worked Example Selection
Suppose you need to:
- Poll 20 consecutive measurement registers every 200 ms.
- Update a speed setpoint once per second.
- Toggle a pump enable bit.
Selection:
- Measurements: Read Input Registers for the contiguous block.
- Speed setpoint: Write Single Register for one value.
- Pump enable: Write Single Coil for the boolean command.
Verification:
- After writing the speed setpoint, read the relevant status or echo register if available.
- After toggling enable, read the Running status coil to confirm the command took effect.
This approach keeps reads efficient, writes precise, and control behavior measurable rather than assumed.
4.3 Designing Polling Schedules for Throughput and Deterministic Behavior
Polling schedules decide how often each Modbus register range is read, how reads are grouped, and what happens when the network or device misbehaves. A good schedule balances throughput (how many requests you can finish) with determinism (how predictable the timing is). The trick is to treat time as a resource and to make the schedule measurable.
Start with Timing Budgets and Determinism Targets
First, define a target update rate per data item or group. For example, a tank level might need updates every 250 ms, while a motor runtime counter can update every 10 s. Then convert those targets into a timing budget per poll cycle.
A simple budget model for one Modbus TCP request is:
- Request time = network latency + device processing + protocol overhead
- Cycle time = sum of request times for all requests in the cycle + intentional spacing
- Determinism risk = variance from retries, timeouts, and device slowdowns
If you need “every 250 ms,” you must ensure the worst-case cycle time stays below 250 ms, not just the average. That usually means fewer requests per cycle, batching reads, and strict retry rules.
Group Registers into Polling Ranges
Deterministic behavior improves when you reduce the number of requests. Instead of reading one register at a time, group contiguous registers into a single read. For example:
- Bad: read holding register 40001, then 40002, then 40003
- Better: read holding registers 40001–40003 in one request
When values are not contiguous, consider whether you can reorder the register map in the device configuration or gateway mapping. If you cannot, split into two ranges and accept the extra request, but keep the split count small.
Use a Multi-Rate Schedule Instead of One Big Loop
A single polling loop that reads everything at one frequency is rarely deterministic. Use a multi-rate schedule with tiers:
- Fast tier for control-relevant values (e.g., 100–500 ms)
- Medium tier for status and trends (e.g., 1–5 s)
- Slow tier for diagnostics and counters (e.g., 10–60 s)
Each tier has its own queue and cycle. The gateway or polling service interleaves tiers so the fast tier is not delayed by slow reads.
Add Jitter Control with Slotting and Deadlines
Determinism is about meeting deadlines. Assign each request a deadline based on its tier period. Use slotting: reserve time slots for fast-tier requests and allow medium/slow tiers to fill remaining capacity.
If a fast-tier request misses its deadline, do not “catch up” by flooding the device. Instead, skip or degrade that cycle and log the miss. Catch-up traffic increases contention and makes future deadlines worse.
Handle Retries Without Breaking the Schedule
Retries are necessary, but they must be bounded. A practical rule:
- Retry only for transient failures (timeouts, connection resets)
- Cap retries per request (e.g., 1–2)
- Use exponential backoff only within the same tier’s slack, not across tiers
Example: if a fast-tier request times out, retry once immediately. If it still fails, mark the data as stale and move on. Your schedule stays predictable, and downstream logic can use quality indicators.
Mind Map: Polling Schedule Design
Example: Two-Tier Schedule with Concrete Numbers
Assume Modbus TCP request time averages 12 ms, but worst-case is 25 ms. You have:
- Fast tier period: 250 ms
- Fast tier requests: 6 batched reads
- Medium tier period: 2 s
Worst-case fast cycle time = 6 × 25 ms = 150 ms. That leaves 100 ms of slack for minor variance and one bounded retry without exceeding 250 ms. The medium tier can run in the slack and between fast cycles.
Now suppose one fast request times out. With one retry, that request might consume an extra 25 ms. Even then, the fast cycle stays under 250 ms if you planned slack. If you had only 5 ms of slack, the schedule would start missing deadlines and you’d see stale fast data.
Example: Stale Data and Downstream Safety
When a request misses its deadline or fails, set a “stale” flag (or quality code) for the affected values. Downstream logic should avoid treating stale measurements as fresh. For instance, a control loop can hold the last known good value until a new read arrives, while a monitoring dashboard can show “data quality degraded” instead of silently updating with old numbers.
Mind Map: Failure-Aware Scheduling
Validation Checklist for Deterministic Polling
- Compute worst-case cycle time per tier, not just average.
- Minimize request count via batching contiguous ranges.
- Use deadlines and skip/carry-forward behavior on misses.
- Bound retries and ensure they consume slack, not future capacity.
- Measure jitter and deadline miss rate during load and failure injection.
A polling schedule is deterministic when you can explain what happens at the edges: when the network is slow, when a device hiccups, and when deadlines collide. The schedule should fail in a controlled way, not in a chaotic one.
4.4 Implementing Write Safety with Interlocks and Command Acknowledgment
Write safety is about preventing “wrong write at the wrong time.” In Modbus-based control, the risk is usually not the protocol itself, but the system behavior around it: missing preconditions, ambiguous command states, and writes that succeed even when the process is not ready. A good design makes the controller refuse unsafe writes, and it makes the client prove that the command was accepted and executed.
Foundational Concepts for Safe Writes
Start with three ideas that stay consistent across the whole implementation.
- Interlocks are preconditions. A write is allowed only when required conditions are true (for example, “motor enable switch is on” and “door is closed”).
- Acknowledgment is a two-step truth. The system should first acknowledge that it accepted the command, then later confirm that the process reached the expected state.
- Idempotency prevents duplicate side effects. If a client retries due to a timeout, the same command should not cause repeated actions.
A practical way to think about it: interlocks decide whether the command can be staged; acknowledgment decides whether the command was staged and whether it completed.
Interlock Design That Matches Real Process Constraints
Interlocks should be expressed as explicit boolean conditions in the gateway or device logic. Keep them close to the actuator control, not in the client.
Example interlocks for a “Start Pump” command
DoorClosed == truePressureOK == trueLocalMode == true(prevents remote start while in local maintenance)NoFaultActive == true
Instead of writing directly to the actuator coil/register, the system writes a command request and the control logic evaluates interlocks.
Recommended register layout pattern
CMD_START_REQ(write-only request)CMD_START_ACK(read-only accepted flag)CMD_START_DONE(read-only completion flag)CMD_START_TOKEN(read-only token echoed back)CMD_START_ERR(read-only error code)
This pattern keeps the client from guessing state based on a single write.
Command Acknowledgment with Tokens and State Progression
Acknowledgment should be deterministic. Use a token so the client can correlate retries with the same logical command.
Token approach
- Client writes
CMD_START_REQ = 1andCMD_START_TOKEN = N. - Device logic checks interlocks.
- If interlocks pass, device sets
CMD_START_ACK = 1and copiesNintoCMD_START_TOKEN_ECHO. - When the pump actually reaches “running,” device sets
CMD_START_DONE = 1. - If interlocks fail, device sets
CMD_START_ACK = 0and writes an error code.
This avoids the classic failure mode: client retries after a timeout, and the second write accidentally triggers a second start.
End-to-End Workflow Example
Assume the client wants to start a pump.
- Client reads current status:
DoorClosed,PressureOK,NoFaultActive, and the lastCMD_START_TOKEN_ECHO. - Client generates a new token
N. - Client writes
CMD_START_REQandCMD_START_TOKEN. - Client polls
CMD_START_ACKuntil it becomes 1 or an error appears. - Client polls
CMD_START_DONEuntil it becomes 1. - Client clears the request (optional but useful) and logs the token and timestamps.
If the client times out at step 4, it retries by writing the same token N. The device logic recognizes the token and does not re-trigger the action.
Mind Map: Write Safety Flow
Implementation Sketch for Modbus Register Writes
Below is a compact pseudo-flow for the device-side logic. It assumes the gateway owns the interlock evaluation.
on write CMD_START_REQ with token N:
  if token N equals last_token_processed:
    return (no new action)

  if not interlocks_ok():
    CMD_START_ACK = 0
    CMD_START_ERR = interlock_error_code()
    return

  CMD_START_ACK = 1
  CMD_START_TOKEN_ECHO = N
  stage_start_action()

on process state update:
  if pump_is_running() and CMD_START_ACK == 1:
    CMD_START_DONE = 1
Common Pitfalls and How to Avoid Them
- Interlocks evaluated in the client: the client can be wrong or stale; the device must enforce.
- Single-flag acknowledgment: a single “ack” often means “received,” not “executed.” Separate acceptance from completion.
- No token or no idempotency: retries become accidental repeats.
- Unbounded polling: define timeouts and require the client to stop polling and surface the error code.
Minimal Example Register Semantics
A clean semantic contract for the client is:
CMD_START_ACK == 1means “device accepted request and interlocks passed for token N.”CMD_START_DONE == 1means “process reached running state for token N.”CMD_START_ERR != 0means “request rejected or failed; do not assume action occurred.”
With these rules, the client can behave consistently even when networks are slow and responses arrive late. The device remains the source of truth, and the token makes retries safe.
4.5 Creating Test Plans with Known Values and Boundary Conditions
A good test plan for Modbus register maps and OPC UA variable models does two things: it proves correctness for values you can predict, and it proves behavior at the edges where bugs usually hide. The trick is to start with a small set of known values, then expand systematically across boundary conditions, representation limits, and protocol-specific quirks like word order and scaling.
Test Plan Foundations
Begin by writing a compact “data contract” for each signal:
- Source: Modbus register address range or OPC UA node.
- Type: 16-bit register, 32-bit pair, bitfield, enum, float, etc.
- Scaling: raw-to-engineering formula (for example,
eng = raw * 0.1). - Word Order: for 32-bit values, which register comes first.
- Valid Range: engineering min/max and any reserved codes.
- Write Rules: which values are allowed, and what happens on invalid writes.
Then define test categories that map to real failure modes:
- Read correctness: raw registers produce the expected engineering values.
- Write correctness: writing engineering values results in expected raw registers.
- Boundary behavior: min, max, and just-beyond values.
- Representation behavior: sign handling, overflow, NaN/Inf cases (if floats), and bitfield packing.
- Protocol behavior: timeouts, partial failures, and retry idempotency.
Mind Map: Test Coverage Structure
Known Values That Catch Real Bugs
Pick values that are easy to compute and hard to misinterpret.
Example: 16-bit scaled value
- Contract:
eng = raw * 0.1, valid engineering range0.0to100.0. - Known raw values:
0,1,1000,65535. - Expected engineering values:
0.0,0.1,100.0,6553.5(this last one should be rejected or flagged as invalid depending on your rules).
Example: 32-bit signed value split across two registers
- Contract: engineering value is signed int32 with word order
high word first. - Known test points:
0,1,-1,2147483647,-2147483648. - Expected raw register pairs: compute using two’s complement, then verify that the gateway swaps words correctly.
Example: Bitfield flags
- Contract: a 16-bit register where bit 0 is
Start, bit 3 isFault, bits 8–11 encode a mode. - Known patterns:
0x0000(all off),0x0001(Start only),0x0008(Fault only),0x0F00(mode = 0xF), and0xFFFF(all on) to verify masks and shifts.
Boundary Conditions That Matter
Boundary tests should be expressed as “just inside” and “just outside” the allowed range.
For scaled integers
If eng = raw * 0.1 and valid 0.0–100.0, then:
- Min exact:
eng = 0.0→raw = 0. - Just above min:
eng = 0.1→raw = 1. - Max exact:
eng = 100.0→raw = 1000. - Just below max:
eng = 99.9→raw = 999. - Just above max:
eng = 100.1→raw = 1001(should be rejected or clamped; your contract decides). - Just below min:
eng = -0.1→raw = -1(for unsigned raw registers, this is a conversion error and should fail safely).
For register addressing Include an off-by-one test:
- Read the expected range (for example, registers
40001–40010). - Also read one register before and after (if your system allows) to confirm you’re not accidentally shifting the map.
For enum and reserved codes
If an enum uses raw values 0–5 and 6–65535 are reserved:
- Test raw
5maps to the last valid label. - Test raw
6and raw65535to ensure the system marks the value as invalid or “unknown” rather than pretending it is a valid mode.
Evidence and Pass/Fail Criteria
For each test case, record:
- Input: engineering value or expected raw register pair.
- Expected output: engineering value, status/quality, and any alarm state.
- Observed output: from logs or packet captures.
- Pass/Fail: strict equality for raw values, and tolerance for scaled floats (for example, allow
±0.05when converting from decimal scaling).
Example: Pass/Fail rule for scaled values
- If
eng = raw * 0.1, then expected engineering is exact for integer raw values. Use exact comparison for engineering when the system uses integer math or deterministic scaling. - If the system uses floating-point conversions, compare within a small tolerance and also verify the raw register written matches the expected rounding rule.
A Compact Test Case Template
Use a consistent structure so results are comparable across signals.
Test Case ID: TC-<signal>-<boundary>
Signal: <name>
Protocol: Modbus Read/Write or OPC UA Read/Write
Input Engineering Value: <value>
Expected Raw Registers: <hex or decimal>
Expected Engineering Value: <value>
Expected Quality/Status: <OK/Bad/Invalid>
Steps: <brief sequence>
Observed: <captured result>
Pass Criteria: <exact or tolerance>
This approach keeps the plan systematic: you verify the mapping with known values, then stress it at the edges where scaling, sign, word order, and masking errors show up. The result is a test suite that’s small enough to run often and specific enough to explain failures without guesswork.
5. Designing an OPC UA Integration Plan
5.1 Modeling Industrial Data with Objects Variables Methods and Events
A good OPC UA model makes integration boring in the best way: clients can browse predictable structures, values carry clear meaning, and actions have explicit inputs and outputs. In OPC UA, you model this meaning using Objects, Variables, Methods, and Events.
Objects as Containers for Meaning
Objects represent real-world things or logical groupings: a pump, a conveyor, a tank, or a control function. Start with a hierarchy that matches how operators and engineers think.
Example: create an object Pump_101 under a Site or Line object. Inside it, group related items:
Measurements(variables like flow, pressure)Status(variables like running state)Commands(methods like start/stop)Alarms(events)
This structure reduces client guesswork. A client can browse to Pump_101/Measurements/FlowRate without needing vendor-specific documentation.
Variables as Typed Values with Semantics
Variables hold data that changes over time or is read on demand. Each variable should have:
- A data type (e.g.,
Double,UInt16,Boolean) - A value and a status (quality)
- Optional engineering metadata such as units and valid ranges
Example: FlowRate as a Double with unit m3/h, and Pressure as a Double with unit bar. If your device provides raw integers, model the scaled engineering value as the variable value, and document the scaling in the variable’s metadata.
For discrete signals, prefer Boolean for simple states. If you must represent multiple flags, model them as separate variables or as an explicit structured type rather than packing everything into one ambiguous integer.
Methods as Controlled Actions
Methods represent operations that clients can request. They are not “write a variable and hope.” A method should:
- Define input arguments (what the client must provide)
- Define output arguments (what the server returns)
- Provide a clear execution status
Example: StartPump method with input TargetSpeed (RPM) and output Accepted (Boolean). The server can validate conditions like IsInterlocked or IsInMaintenance. If the method is rejected, return a status that explains the failure through standard status codes.
A practical pattern is to separate intent from effect:
- A method triggers the action
- Variables reflect the resulting state changes
This keeps the model consistent: method calls are about requesting work; variables are about observing outcomes.
Events as Time-Stamped Occurrences
Events represent notable occurrences: alarms, trips, warnings, and operator-relevant messages. Unlike variables, events are delivered when something happens.
Example: define an event type PumpTripEvent with fields like TripReason (string or enum), TripCode (UInt32), and Severity (UInt16). When the pump trips, the server emits the event with a timestamp and the relevant fields.
Modeling events well prevents clients from polling for “something changed” by scanning status variables. Instead, clients subscribe to events and react when they arrive.
Mind Map: Modeling Building Blocks
Integrated Example: One Pump Model End to End
Consider Pump_101.
- Variables:
Running(Boolean),FlowRate(Double),Pressure(Double),IsInterlocked(Boolean). - Method:
StartPumptakesTargetSpeedand returnsAccepted. - Events:
PumpTripEventfires whenRunningtransitions to false due to a trip.
A client workflow becomes straightforward:
- Browse
Pump_101and findStartPump. - Call
StartPumpwith a target speed. - Monitor
Running,FlowRate, andPressurevariables for the outcome. - Subscribe to
PumpTripEventto capture failures with reasons.
This is the core modeling discipline: Objects organize, Variables describe state, Methods request actions, and Events report occurrences.
Modeling Rules That Prevent Integration Headaches
- Keep naming consistent across objects and variables so browse paths remain stable.
- Use types and metadata to reduce client-side guessing.
- Treat methods as transactions with explicit inputs and outputs.
- Use events for meaningful occurrences, not for every minor change.
- Ensure state variables reflect reality after method calls, not just the request.
When these rules are followed, the model reads like a map rather than a scavenger hunt. Clients can integrate with confidence because the structure and behavior match the physical system.
5.2 Defining Semantics With Units Ranges Engineering Limits and Constraints
Semantics are what turn raw numbers into usable meaning. In OPC UA, semantics live in the data model; in Modbus, they must be inferred from the register map. Either way, the goal is the same: a client should know what a value represents, how to interpret it, and what values are acceptable.
Units That Match What Operators Expect
Start by choosing units that align with how the process is measured and displayed. If a sensor reports temperature, decide whether the engineering unit is °C or K, and keep it consistent across the system.
In OPC UA, represent units using the standard unit identifiers and store the engineering value in the variable. If you must scale from Modbus registers, apply scaling so the OPC UA variable already carries the engineering unit.
Example: A Modbus holding register stores temperature as an integer where 1 unit = 0.1 °C. The gateway reads 253 = 25.3 °C and writes 25.3 into the OPC UA variable with unit °C.
Ranges That Separate “Possible” From “Allowed”
Use at least two kinds of ranges.
- Operational range: what the process can realistically produce.
- Engineering range: what the system can represent and safely process.
In OPC UA, you typically express these with properties such as minimum and maximum, and you can also use constraints to indicate valid intervals. In Modbus, you document the valid register-derived engineering range in the register map.
Example: A pressure transmitter outputs 0–10 bar, but the PLC logic only supports 0–8 bar for a specific control mode. The operational range is 0–10 bar; the engineering constraint for that mode is 0–8 bar.
Engineering Limits That Guard Against Bad Inputs
Engineering limits are hard boundaries used for validation and safety logic. They should be strict, not “best effort.”
Define:
- Low and high limits for normal operation.
- Out-of-range behavior such as clamping, rejecting, or marking invalid.
- Special values for sensor faults if your Modbus device uses them.
Example: If the sensor uses 65535 to indicate “sensor fault,” treat it as invalid rather than converting it into an absurd engineering value.
Constraints That Make Data Contracts Enforceable
Constraints specify relationships and rules beyond simple min/max. They prevent subtle integration bugs, like writing a command that violates a physical relationship.
Common constraint types:
- Step constraints: values must change in increments (e.g., setpoint step of 0.5).
- Discrete enumerations: a status code must map to a known set.
- Cross-field constraints: e.g., ramp rate must be consistent with target change.
In OPC UA, constraints can be modeled using properties and validation logic in the gateway or application layer. In Modbus, constraints belong in the integration specification and in the gateway’s write validation.
Mind Map: Semantics Building Blocks
A Practical Modeling Workflow
- Identify the physical quantity: temperature, pressure, speed, energy, etc.
- Define the unit: pick one unit and stick to it.
- Define scaling rules: Modbus register width, signedness, byte/word order, and conversion formula.
- Define operational range: what the process can produce.
- Define engineering range: what the system can represent.
- Define engineering limits: strict boundaries and fault handling.
- Define constraints: rules for valid values and valid transitions.
- Test with boundary values: min, max, just-below, just-above, and fault codes.
Example: Temperature Register with Full Semantics
Assume a Modbus register TempRaw (unsigned 16-bit) with:
- Conversion:
TempC = TempRaw * 0.1 - Fault code:
TempRaw = 65535 - Operational range: 0.0 to 120.0 °C
- Engineering limits: -10.0 to 130.0 °C (anything outside is invalid)
- Constraint: setpoints must be multiples of 0.5 °C
In the gateway, values are validated before writing to OPC UA. If TempRaw = 65535, the OPC UA variable is marked invalid (or a status code is set), rather than producing 6553.5 °C.
Example: Command Constraints for Safe Writes
For a Modbus “setpoint” register, define constraints so the gateway rejects invalid writes.
Example: Setpoint step is 0.5 °C. If a client requests 25.3 °C, the gateway rejects the write with a clear reason, or rounds according to a documented policy. Either way, the behavior must be deterministic so the client can handle it.
When units, ranges, limits, and constraints are defined together, integration becomes less about guessing and more about enforcing a data contract. That contract is what keeps a system consistent when multiple teams, devices, and gateways touch the same values.
5.3 Configuring Subscriptions Sampling Publishing and Keep Alive Behavior
OPC UA subscriptions decide how often the server checks values, how it packages updates, and how it signals “nothing changed.” Getting these three knobs right prevents both stale dashboards and unnecessary network traffic.
Subscription Roles and Data Flow
A subscription lives on the client side, but it is enforced by the server. The client requests a set of monitored items, each with its own sampling behavior. The server then:
- Samples each monitored item at the requested sampling interval.
- Applies filtering rules to decide whether a data change should be queued.
- Publishes queued notifications at the publishing interval.
- Sends keep-alive notifications when no data changes occur.
A useful mental model is a kitchen timer (sampling), a tray that collects plates (queue), and a delivery run (publishing). Keep-alive is the driver checking in when the tray is empty.
Sampling Interval and Monitoring Filters
Sampling interval is the server’s check period for each monitored item. If you set it too low, you waste CPU and network packaging effort; too high, you miss short-lived changes.
For each monitored item, you typically combine sampling with one or more filters:
- Deadband filter: Only queue changes that exceed a threshold. Example: temperature changes of less than 0.2 °C are ignored.
- Percent deadband: Useful when values scale with magnitude. Example: ignore changes under 1% of the current value.
- Absolute deadband: Best for fixed units like pressure in bar.
Example: A tank level sensor reports 0–100%. If you sample every 200 ms but use a 0.5% deadband, the server will queue fewer notifications during steady operation.
Publishing Interval and Queue Behavior
Publishing interval controls how frequently the server sends notifications to the client. It is not the same as sampling. Multiple samples can be condensed into one notification.
If the client cannot keep up, the server may build a queue. Two parameters govern this:
- Max notifications per publish: Limits how many queued notifications are sent in one message.
- Queue size: Limits how many notifications can wait.
Practical guidance: set publishing interval to match the client’s ability to process updates. If your client writes to a database, a publishing interval that is too aggressive can cause backpressure and dropped notifications.
Keep Alive Count and “No Change” Signaling
Keep alive count defines how many publishing cycles can pass without any data change before the server sends a keep-alive notification. Keep-alive messages help clients detect that the subscription is still active and that the connection is not silently broken.
Example: If publishing interval is 1 s and keep alive count is 10, the server sends a keep-alive roughly every 10 s when nothing changes. This is long enough to avoid spam, short enough to confirm liveness.
Coordinating Multiple Monitored Items
Different items often need different sampling and filtering. For example:
- Fast-changing signals like motor current: shorter sampling, small deadband.
- Slow-changing signals like batch ID: longer sampling, no deadband.
A common mistake is using one subscription configuration for everything. Instead, group items by similar update needs so you can tune sampling and filters without penalizing the whole set.
Mind Map: Subscription Tuning
Example Configuration Walkthrough
Assume you monitor three items: motor current, conveyor speed, and a status word.
- Motor current: sampling 100 ms, absolute deadband 0.5 A.
- Conveyor speed: sampling 200 ms, percent deadband 0.5%.
- Status word: sampling 1 s, no deadband.
Set publishing interval to 1 s so the client receives at most one notification per second per subscription cycle under normal conditions. Set keep alive count to 10 so the client gets a liveness signal about every 10 s when the plant is steady.
Example: Reasoning About Timing
If motor current changes by 0.2 A for several seconds, deadband prevents queueing, so the client receives keep-alives instead of data changes. If the change jumps by 1.0 A, the next sampling cycle queues a notification, and the client receives it at the next publishing opportunity.
This separation—sampling decides what qualifies, publishing decides when it arrives—keeps the system predictable even when values fluctuate quickly.
Example: Minimal Pseudocode for Parameter Selection
Given:
  targetUpdateRate = 1 Hz
  clientCanProcessPerSec = 5
Choose:
  publishingInterval = 1 / targetUpdateRate
  keepAliveCount = 10
For each item:
  set samplingInterval based on dynamics
  set deadband based on acceptable error
  ensure worst-case queued notifications <= queueSize
With these settings, the subscription behaves like a controlled filter-and-deliver pipeline: it samples often enough to notice meaningful changes, publishes at a rate the client can handle, and keeps the connection honest when nothing happens.
5.4 Implementing Client Browsing Discovery and Stable Referencing Strategies
Client browsing is the part of an OPC UA integration that answers two practical questions: “Where is the data?” and “How do I keep pointing to the same thing after changes?” The goal is to browse reliably at startup, then reference nodes in a way that survives routine engineering updates.
Foundations: Address Space, Node Identity, and Why Browsing Exists
OPC UA servers expose an address space made of nodes connected by references. A client typically begins with a discovery step, then browses to find the nodes it needs. Browsing is not just convenience; it is how you avoid hard-coding assumptions about server-specific naming.
Node identity is the anchor. In OPC UA, a node can be identified by a combination of namespace index and an identifier (for example, a string or numeric value). Namespace indexes can differ between servers, so stable referencing should rely on identifiers that remain consistent within the server’s namespace.
Discovery Workflow That Stays Predictable
A robust client startup sequence looks like this:
- Connect and create a session.
- Read the server’s namespace array to map namespace URIs to namespace indexes.
- Browse from a known entry point, usually the Objects folder, to locate your target nodes.
- Validate that the found nodes match expected semantics (data type, engineering unit, or a known modeling pattern).
- Cache the resolved node identities for later use.
This approach keeps the client resilient to server reordering of nodes while still being strict about what it accepts.
Stable Referencing Strategies That Survive Changes
Stable referencing means your client can re-resolve nodes after a restart or after a server update without silently binding to the wrong signals.
Use a two-layer strategy:
- Resolution layer: browse using a deterministic path or a set of semantic checks.
- Binding layer: store the resolved node identity (namespace URI + identifier) and re-validate it on reconnect.
When browsing, prefer stable modeling cues over display names. Display names are meant for humans and can change. Identifiers and modeling structure are meant for systems.
A practical pattern is to search for nodes by a combination of:
- Expected node class (Variable, Object, Method)
- Expected browse name or identifier pattern
- Expected data type and unit metadata
- Optional: presence of a specific reference type or modeling relationship
Mind Map: Client Browsing and Stable Referencing
Example: Finding a Temperature Variable Without Hard-Coding Names
Assume the server models a sensor as an Object with Variables beneath it. A client should not assume the variable’s display name is unchanged. Instead, it can browse for a Variable under a known parent object and verify type and unit.
Example criteria:
- Parent object has a browse name like
TemperatureSensor1or an identifier pattern. - Child variable is a
Variablenode. - Variable has data type
Double. - Variable has engineering unit
°C.
If multiple variables match, the client should fail fast with a clear log message rather than picking one. Ambiguity is a bug wearing a trench coat.
Example: Caching and Re-Validation on Reconnect
On first successful discovery, cache the node identity in a configuration store. On reconnect:
- Map namespace URI to current namespace index.
- Reconstruct the node identity.
- Perform a lightweight read (for example, read the Value attribute or metadata) to confirm it still matches expected data type and unit.
If validation fails, fall back to browsing resolution again. This prevents “working” connections that are actually pointing at the wrong node.
Failure Handling That Keeps Integrations Honest
Handle these cases explicitly:
- Missing Node: treat as configuration mismatch; do not silently continue.
- Mismatched Type: reject the node; type mismatches often indicate modeling changes.
- Ambiguous Matches: require stricter criteria or explicit configuration.
- Namespace Mapping Issues: if the namespace URI is absent, browsing must re-run using a broader search strategy.
Minimal Pseudocode for Discovery and Validation
connect()
session = createSession()
nsMap = readNamespaceArray()

candidates = browse(objectsFolder, criteria)
validated = filter(candidates, expectedType, expectedUnit)

if count(validated) != 1:
  logErrorAndFail()

nodeId = toStableIdentity(nsMap, validated[0])
cache(nodeId)

onReconnect:
  nodeId = loadCached()
  if !validate(nodeId, expectedType, expectedUnit):
    repeatDiscovery()
Practical Checklist for Stable Referencing
- Use namespace URIs, not namespace indexes, as the long-term key.
- Cache node identities only after semantic validation.
- Prefer modeling structure and metadata checks over display names.
- Fail on ambiguity; “best effort” is how you get wrong numbers with confidence.
- Re-validate cached bindings on every reconnect.
This combination of deterministic browsing and strict validation is what makes client integrations both maintainable and predictable, even when the server’s address space evolves.
5.5 Designing Method Calls with Inputs Outputs and Execution Status Handling
Method calls in OPC UA let you model actions, not just measurements. A good design makes the call self-explanatory, keeps the client and server synchronized, and turns “did it work?” into a structured answer rather than guesswork.
Inputs That Are Clear and Safe
Start by defining inputs as typed parameters with constraints. For example, a “StartPump” method might accept:
PumpIdas an unsigned integerStartModeas an enumeration (e.g.,Local,Remote)RampSecondsas a bounded integer
Even if the underlying device is permissive, the method signature should be strict. If RampSeconds must be between 0 and 300, enforce that at the server boundary and return a meaningful status when it fails.
A practical pattern is to include a CommandId input generated by the client. The server can use it to detect duplicates caused by retries. If the client resends the same CommandId, the server returns the same outcome instead of starting the action twice.
Outputs That Support Verification
Outputs should help the client verify what happened without forcing extra reads. For a “StartPump” method, outputs might include:
AcceptedbooleanEffectiveRampSecondsintegerExecutionStateenumeration (Queued,InProgress,Completed,Rejected)ResultMessagestring for operator-friendly detail
Keep outputs consistent with the method’s execution model. If the method is synchronous, ExecutionState should usually end at Completed or Rejected. If the method is asynchronous, outputs should reflect the initial acceptance and provide a handle the client can use to track completion.
Execution Status Handling That Separates Transport from Meaning
OPC UA method calls return a service-level status code plus method-specific outputs. Treat them as different layers:
- Service-level status answers whether the call was processed at the protocol level.
- Method outputs answer whether the action succeeded in the industrial sense.
For example:
- Service status
Bad_Timeoutmeans the server did not respond in time. - Service status
Goodmeans the server received and evaluated the call. - Method output
ExecutionState = Rejectedmeans the server refused the action due to process conditions.
This separation prevents a common integration mistake: retrying a command that was already rejected because the client misread a transport outcome as an action outcome.
A Systematic Flow for Client and Server
Use a predictable sequence so both sides can reason about state.
- Client validates inputs locally (type, range, required fields).
- Client calls the method with
CommandId. - Server checks authorization and process interlocks.
- Server performs idempotency handling using
CommandId. - Server returns service status and method outputs.
- If asynchronous, client monitors completion using a correlation identifier.
Mind Map: Method Call Design
Example: Start Pump with Idempotent CommandId
Client sends:
PumpId = 3StartMode = RemoteRampSeconds = 45CommandId = 9f2a1c7b-...
Server behavior:
- If
RampSecondsis outside 0–300, return service statusGoodand outputExecutionState = Rejectedwith a message like “RampSeconds out of range.” - If the pump is in a safety stop interlock, return service status
Goodand outputExecutionState = Rejectedwith “Safety interlock active.” - If the same
CommandIdwas already processed, return the sameExecutionStateandResultMessageas the earlier call.
Client interpretation:
- If service status is not
Good, treat it as a transport or server availability issue and decide whether to retry. - If service status is
Good, trustExecutionStateas the action outcome and avoid duplicate starts.
Example: Asynchronous Stop with Correlation
For a “StopPump” method that takes time to ramp down, outputs can include:
ExecutionState = QueuedStopRequestId = 1042
The client then uses StopRequestId to correlate later status updates from variables or events. This keeps the method call response small and focused: it confirms acceptance and provides a handle, not a guess about completion.
Practical Rules That Prevent Integration Headaches
- Make method signatures enforceable: constraints belong in the server contract, not in tribal knowledge.
- Use
CommandIdfor any action that can be retried. - Treat service status and method outcome as separate questions.
- Keep output meanings stable across synchronous and asynchronous variants.
When these rules are followed, the client can make correct decisions from a single call response, and operators get messages that match what the controller actually did.
6. Bridging Modbus and OPC UA in Real Systems
6.1 Selecting a Gateway Approach for Data Translation and Control Paths
A gateway is the part of your system that translates between Modbus and OPC UA while also enforcing rules for control actions. The selection is mostly about two paths: the data path (how values move) and the control path (how commands move). If you get those two paths right, the rest becomes configuration instead of firefighting.
Start with the Two Paths You Actually Need
Data path goals usually include consistent scaling, predictable update timing, and clear data quality when communication degrades. For example, a Modbus holding register might represent temperature as a scaled integer, while OPC UA expects a typed value with units and a quality indicator.
Control path goals usually include safe writes, command acknowledgment, and protection against repeated or out-of-order actions. For example, a Modbus “write single register” might start a motor, but OPC UA clients should see a method call that returns success only after the motor confirms it reached the requested state.
A practical way to decide is to list each signal as one of four categories:
- Read-only telemetry: frequent updates, no writes.
- Writable setpoints: writes are allowed, but must be validated.
- Commands with confirmation: a request must be acknowledged by feedback.
- Status and interlocks: writes are blocked unless conditions are met.
Choose the Gateway Type by Where Translation Happens
There are three common gateway approaches, and each maps cleanly to the two paths.
Protocol Translation Gateway
This gateway sits between Modbus devices and OPC UA clients and translates requests and responses.
- Data path: OPC UA reads become Modbus reads; OPC UA subscriptions become periodic Modbus polling.
- Control path: OPC UA method calls become Modbus writes, optionally followed by a verification read.
When it fits: you need a single integration point and you want OPC UA clients to behave like they are talking to a native OPC UA server.
Example: A PLC exposes Modbus registers for pressure setpoint and actual pressure. The gateway maps them to OPC UA variables with engineering units. When an OPC UA client writes the setpoint variable, the gateway writes the corresponding Modbus register and then reads back the “actual pressure” register to confirm the system is responding.
Data Concentrator with Mapping Layer
This gateway focuses on maintaining a local model of values and states, then exposes that model via OPC UA.
- Data path: Modbus polling updates an internal cache; OPC UA reads and subscriptions use the cache.
- Control path: commands update a desired-state model, and the gateway drives Modbus writes based on rules.
When it fits: you need stable timing, batching, and consistent quality indicators.
Example: A site has 200 Modbus tags but only a few OPC UA clients. The concentrator polls in batches, updates a cache with timestamps, and serves OPC UA subscriptions from the cache. For control, it blocks writes if interlock registers indicate a fault.
Embedded Gateway in the Controller or Edge Device
Here the gateway logic runs close to the Modbus endpoints.
- Data path: translation happens near the source, reducing network chatter.
- Control path: command verification can use local feedback registers quickly.
When it fits: you need tight control-loop responsiveness or you want to reduce traffic across the plant network.
Example: An edge computer reads Modbus RTU from a local serial gateway, translates to OPC UA, and executes command verification by reading a “command complete” register before returning success to the OPC UA method call.
Mind Map: Decision Criteria
Make the Control Path Concrete with a Workflow
Regardless of gateway type, control should follow a repeatable workflow:
- Receive request from OPC UA (variable write or method call).
- Validate against interlocks and allowed ranges.
- Write command to Modbus.
- Verify by reading a feedback register or status bit.
- Report result to OPC UA with a clear success/failure outcome.
Example workflow: An OPC UA method “StartPump” takes a speed setpoint. The gateway checks an OPC UA-exposed interlock variable that mirrors a Modbus “ready” bit. If ready is false, the method returns a failure status without writing. If ready is true, the gateway writes the speed setpoint register, then polls a “running” status bit until it becomes true or a timeout occurs. Only then does it return success.
Avoid Common Selection Mistakes
- Treating subscriptions as instant: Modbus polling is periodic, so subscriptions should reflect polling cadence and quality.
- Skipping verification: a write that “went through” is not the same as “did what you asked.”
- Mixing telemetry and commands without rules: a single mapping table should still encode which tags are safe to write and how to confirm outcomes.
Practical Selection Summary
If you want straightforward translation and can tolerate polling-based subscription behavior, choose a protocol translation gateway. If you need consistent timing, batching, and a clean quality model, choose a data concentrator with a mapping layer. If you need fast verification and minimal network traffic to the Modbus endpoints, choose an embedded gateway near the source.
The best choice is the one that makes the control workflow unambiguous: validate, write, verify, and report. Everything else is just wiring.
6.2 Mapping Modbus Registers to OPC UA Variables with Correct Types
A reliable gateway mapping starts with one simple rule: every Modbus register value must become an OPC UA variable with an explicit type, explicit scaling, and explicit meaning. If you skip any of those, you’ll eventually “fix” it by guessing, and guessing is expensive.
Start with a Data Contract Mindset
Before writing mappings, define a small data contract per signal:
- Source: Modbus function code, register address, and whether it’s holding or input.
- Representation: raw register width (16-bit), signedness, and whether multiple registers form one value.
- Scaling: how raw units convert to engineering units.
- Semantics: what the value means (temperature, pressure, command state).
- Quality: how you represent “communication failed” or “value stale.”
For example, a Modbus register might be a raw temperature in tenths of degrees Celsius. Your OPC UA variable should not just be a number; it should be a number with a known unit and scaling.
Choose the OPC UA Variable Type from the Modbus Encoding
Modbus registers are 16-bit. OPC UA types are richer, so you must decide how to combine and interpret registers.
Common patterns:
- Single register integer: map to
Int16orUInt16depending on signedness. - 32-bit values: combine two registers into
Int32orUInt32. - Floating point: combine two registers into
FloatorDoubleusing the device’s word order. - Bit fields: map to
Booleanvariables or to an integer plus separate interpretation variables.
A practical example: if Modbus register 40001 contains a status code where bit 0 means “Pump Running,” you can map:
PumpRunningasBooleanderived from bit 0.PumpStatusCodeasUInt16for raw traceability.
Handle Word Order and Endianness Explicitly
Many integration bugs come from register order, not math. For 32-bit and floating point values, define:
- Register order: which Modbus register is the high word.
- Byte order: how bytes inside each register are arranged.
Use a repeatable test: write or simulate known values and verify the OPC UA result. For instance, if the device sends 1.0 as two registers, confirm the gateway reconstructs exactly 1.0 before scaling.
Apply Scaling and Units Without Hiding the Raw Value
Scaling should be deterministic:
EngineeringValue = RawValue * scale + offset
In OPC UA, keep both:
- A variable for the engineering value with
EngineeringUnitsand correct numeric type. - Optionally a variable for the raw value as
Int16/UInt16orInt32/UInt32for diagnostics.
Example: raw pressure is UInt16 in kPa with scale 0.1. Then:
Pressure_kPaisFloat(orDouble) with unitkPa.Pressure_RawremainsUInt16.
Represent Quality and Staleness with Meaningful Rules
When polling fails, you need a consistent OPC UA quality strategy. A common approach:
- Update variables only when the Modbus read succeeds.
- Mark variables with a quality indicator such as “Bad” or “Uncertain” when data is stale.
This prevents clients from treating old values as current. It also makes troubleshooting less guessy: you can correlate bad quality with gateway logs.
Mind Map of the Mapping Workflow
Mind Map: Mapping Modbus Registers to OPC UA Types
Example Mapping Table for a Small Register Set
| Modbus Register | Meaning | Modbus Encoding | OPC UA Variable | OPC UA Type | Scaling | Notes |
|---|---|---|---|---|---|---|
| 40001 | Temperature | Int16, tenths °C | Temperature | Int16 or Float | x / 10 | Keep raw if you want traceability |
| 40002-40003 | Flow Rate | Float32, word order A | FlowRate | Float | none | Verify word order with known value |
| 40004 | Pump Status | UInt16 bitfield | PumpRunning | Boolean | none | bit 0 extraction |
| 40004 | Pump Status | UInt16 bitfield | PumpMode | UInt16 | none | bits 1-3 mask |
Implementation Sketch for Type-Safe Reconstruction
Below is a compact reconstruction approach for 32-bit values. The key is that you decide word order once, then reuse it.
Given registers rHi and rLo (16-bit each):
- If word order is [Hi, Lo]:
  u32 = (rHi << 16) | rLo
- If word order is [Lo, Hi]:
  u32 = (rLo << 16) | rHi
- For signed Int32: cast u32 to Int32
- For Float32: reinterpret u32 as IEEE-754 float
Validation Steps That Catch Real Bugs
Use three checks:
- Known-value test: confirm reconstruction and scaling for at least one positive and one negative value.
- Boundary test: verify max/min raw values map without overflow surprises.
- Staleness test: stop the Modbus source and confirm OPC UA quality changes as expected.
When these pass, your mapping is not just “correct on paper.” It behaves correctly under the messy conditions that actually show up in commissioning.
6.3 Handling Bit Fields and Composite Values Across Protocol Boundaries
Bit fields and composite values are where “it works on my bench” becomes “why is the motor command ignored in production.” The core challenge is that Modbus and OPC UA often disagree about how meaning is packed: Modbus commonly stores raw bits and 16-bit registers, while OPC UA expects typed values with explicit semantics.
Foundational Concepts for Packing and Meaning
Start by separating three layers:
- Transport representation: Modbus registers or coils, OPC UA Variant values.
- Encoding rules: bit positions, word order, scaling, and endianness.
- Semantic model: what the bits mean (e.g., “Start requested”) and how composite values should be interpreted (e.g., “Temperature = raw * 0.1”).
A reliable integration keeps these layers explicit. If you treat a Modbus register as “just a number,” you lose the ability to validate meaning when you map into OPC UA.
Bit Fields from Modbus Coils and Registers
Modbus provides coils (1-bit) and registers (16-bit). Many devices pack multiple flags into a single holding register. When mapping to OPC UA, prefer representing each flag as its own boolean variable, even if the source is packed.
Example: Packed status flags
- Modbus holding register
40001contains:- bit 0:
Ready - bit 1:
Fault - bit 2:
Running - bit 3:
LocalControl
- bit 0:
In OPC UA, create four boolean variables with clear names and attach a consistent mapping rule:
Ready = (reg & 0x0001) != 0Fault = (reg & 0x0002) != 0Running = (reg & 0x0004) != 0LocalControl = (reg & 0x0008) != 0
This avoids a common mistake: exposing the raw register as a single integer and forcing clients to decode bits themselves. Clients then become part of your decoding logic, which makes troubleshooting harder.
Composite Values Across 16-Bit Boundaries
Composite values typically span multiple 16-bit registers: 32-bit integers, 32-bit floats, or 64-bit timestamps. The integration must define:
- Register count (2 for 32-bit, 4 for 64-bit)
- Word order (which 16-bit word comes first)
- Byte order (how bytes inside each word are arranged)
- Signedness and scaling (for integers)
Example: 32-bit temperature from two registers
- Modbus registers
40010and40011form a signed 32-bit value. - Device uses big-endian word order: high word first.
- Scaling:
Temperature_C = raw / 10.
Mapping rule:
- Read both registers in one transaction.
- Combine into a 32-bit signed integer using the agreed word order.
- Convert to engineering units and store as an OPC UA variable with a numeric type and unit metadata.
If you get word order wrong, you’ll see values that look “plausible but wrong,” which is the most annoying kind of wrong.
Mind Map: Bit Fields and Composite Values Mapping
Practical Mapping Workflow That Stays Consistent
Use an update cycle that treats packed data atomically:
- Read the full source region needed for the mapping (all bits or all registers for a composite value).
- Decode into intermediate fields (booleans and typed numbers).
- Write to OPC UA variables in a single logical update.
- Validate with lightweight checks (e.g., reserved bits should be zero; composite values should fall within expected ranges).
Example: Atomic update for a packed status plus temperature
- Read holding registers
40001(status flags) and40010-40011(temperature) in two transactions or one if the device supports it. - Decode flags into four OPC UA booleans.
- Decode temperature into one OPC UA numeric variable.
- If decoding fails due to unexpected reserved-bit patterns, set OPC UA variable quality to “uncertain” for those specific outputs while leaving other outputs intact.
Minimal Decoding Example
Given statusReg = 0x000D (binary 1101)
Ready      = (statusReg & 0x0001) != 0  -> true
Fault      = (statusReg & 0x0002) != 0  -> false
Running    = (statusReg & 0x0004) != 0  -> true
LocalCtrl  = (statusReg & 0x0008) != 0  -> true

Given regHi=0x0001 regLo=0x86A0
raw32 = (regHi << 16) | regLo = 0x000186A0 = 100000
Temperature_C = raw32 / 10 = 10000.0
Common Pitfalls and How to Avoid Them
- Bit numbering mismatch: confirm whether the device labels bit 0 as least significant bit of the 16-bit register.
- Partial reads: don’t read only one register of a composite value; you’ll mix old and new halves.
- Type ambiguity: store composite values in OPC UA with the correct numeric type and unit, not as strings.
- Hidden decoding in clients: keep decoding in the integration layer so clients consume stable, meaningful variables.
When you map packed bits and multi-register composites this way, the integration becomes predictable: the device’s raw layout is handled once, and the OPC UA model stays clean and self-describing.
6.4 Implementing Command Translation With State Tracking And Acknowledgment
When a Modbus write or coil command needs to drive an OPC UA method call (or the reverse), the hardest part is not the byte mapping—it’s making sure the system agrees on what happened. Command translation should therefore include three layers: a deterministic mapping, a state machine that tracks progress, and an acknowledgment strategy that prevents “write storms” and ambiguous outcomes.
Core Concepts for Reliable Command Translation
Start by separating intent from execution. The intent is “operator requested Start.” Execution is “gateway issued Modbus write and confirmed device response.” In practice, you’ll represent intent as a command object with fields like commandId, target, payload, requestedAt, and expectedAckMode.
Next, define an acknowledgment contract. For Modbus, the natural acknowledgment is the successful completion of the write request (and optionally a read-back verification). For OPC UA methods, acknowledgment is the method call result plus any output values that confirm state. Your gateway should normalize these into a single internal outcome model: Accepted, Executed, Verified, or Failed.
Finally, implement state tracking. Without it, retries can cause duplicate actions. With it, retries become safe because the gateway can recognize the same commandId and avoid re-issuing the underlying write.
Mind Map: Command Translation Responsibilities
Designing the State Machine
Use a small, explicit state machine. A practical sequence for a “Start” command looks like this:
- Received: gateway receives an OPC UA method call or a Modbus write request.
- Mapped: payload is converted into Modbus function code and address/value.
- Issued: gateway sends the Modbus write.
- Acked: Modbus write request succeeded at the protocol level.
- Verified: gateway reads back a status register or confirms OPC UA method outputs.
- Completed: gateway returns success to the caller.
- Failed: gateway returns failure with a reason code.
Idempotency is the glue. If the same commandId arrives again while the command is in Issued or Acked, the gateway should return the existing outcome rather than sending a second Modbus write.
Example: OPC UA Method to Modbus Write with Verification
Assume an OPC UA method StartMotor takes motorId and commandId, and the device exposes a Modbus coil Start plus a status register MotorState.
- Mapping:
motorIdselects a coil offset. - Modbus action: write coil
Start= 1. - Verification: read
MotorStateuntil it equalsRunningor until timeout.
Input: StartMotor(motorId=2, commandId=7)
Map: coilAddress = 2000 + motorId
Issue: Modbus Write Single Coil(coilAddress, 1)
Acked: write request succeeded
Verify: Read Holding Register(statusAddress=3000+motorId)
Result: if status == Running then Completed else Failed
If the OPC UA client retries the method due to a timeout, the gateway checks commandId=7. If it already reached Completed, it returns the stored result immediately.
Example: Modbus Write to OPC UA Method with Output-Based Acknowledgment
Now invert the direction. A Modbus client writes a register SetSpeed with a scaled integer value. The gateway translates this into an OPC UA method ApplySpeed that returns acceptedSpeed and executionStatus.
- Mapping: Modbus value
vbecomes engineering unitsspeed = v / 10.0. - OPC UA method:
ApplySpeed(speed, commandId). - Acknowledgment: treat
acceptedSpeedmismatch asFailedeven if the method call succeeded.
Input: Modbus Write Single Register(speedReg=4100, value=523)
Map: speed = 52.3
Call: ApplySpeed(speed=52.3, commandId=auto)
Acked: method call returned
Verified: if executionStatus == Success and acceptedSpeed == 52.3 then Completed
Else: Failed with reason InvalidSpeedOrRejected
This approach avoids the common trap where “protocol success” is mistaken for “device accepted the command.”
Practical Timeout and Retry Rules
Set timeouts per stage, not one giant timeout. For example:
- Write timeout: short, since Modbus write should complete quickly.
- Verification timeout: longer, since the device may take time to change state.
Retry only the stage that failed. If the write request failed due to a network error, you can retry the write while keeping the same commandId. If the write was acknowledged but verification failed, you should not blindly retry the write; instead, re-check current device state and decide whether to re-issue based on whether the device already reached the target.
Acknowledgment Payload Design
Return a structured acknowledgment to the caller (OPC UA client or Modbus-side requester). Include:
commandIdoutcome(Accepted,Executed,Verified,Failed)reasonfor failures (e.g.,TimeoutDuringVerification,DeviceRejected,TypeMismatch)observedStatewhen verification is involved
This makes troubleshooting straightforward: you can tell whether the gateway failed to send, failed to confirm, or confirmed a different state than expected.
Mind Map: State Tracking and Idempotency

Implementation Checklist for the Gateway
- Use a single internal command model for both directions.
- Correlate every log line with
commandId. - Make acknowledgment levels explicit and consistent.
- Verify device state for commands that change behavior.
- Store outcomes so retries return the same result.
With these pieces in place, command translation becomes predictable: the gateway can explain what it did, confirm what the device did, and handle retries without causing duplicate actions.
6.5 Validating End to End Behavior With Traceable Test Scenarios
End-to-end validation proves that a change in one place (a Modbus register write, a gateway mapping, or an OPC UA method call) produces the expected outcome everywhere else. The goal is not to “see data move,” but to show that the system’s behavior is correct, repeatable, and explainable when something goes wrong.
Define the Traceability Spine
Start by listing the exact artifacts you will trace across layers:
- Trigger: the initiating action (e.g., Modbus function code 0x06 write to holding register 40010).
- Mapping: the gateway rule that translates the trigger into an OPC UA node write or method call.
- Execution: the OPC UA server behavior (variable update, method execution, event emission).
- Observation: the client-side subscription or read that confirms the outcome.
- Evidence: logs, message captures, and correlation IDs.
A practical rule: every test case should produce at least one “before” snapshot and one “after” snapshot, plus a log line that ties them together.
Build a Minimal Yet Complete Scenario Set
Use a small set of scenarios that cover the system’s critical paths:
- Read path correctness: Modbus read of a value matches OPC UA variable value after mapping.
- Write path correctness: Modbus write results in OPC UA variable update with the right scaling and data type.
- Command path correctness: Modbus command triggers an OPC UA method, and the method’s status is reflected back.
- Error path correctness: invalid writes or out-of-range values produce predictable quality/status.
- Timing path correctness: subscription delivery and polling refresh align with configured intervals.
To keep tests traceable, assign each scenario a stable ID like E2E-READ-001 and include it in gateway logs.
Mind Map of the Validation Flow
End-to-End Validation Mind Map
Example Scenario with Concrete Assertions
Scenario: Modbus Write to OPC UA Variable Update
Assume:
- Modbus holding register
40010represents a temperature setpoint. - Gateway mapping scales raw value by
0.1(raw 253 means 25.3 °C). - OPC UA variable
ns=2;s=Plant/Temp/Setpointis aDoublewith engineering units.
Test steps
- Capture baseline: read Modbus
40010and read OPC UA variable value. - Write Modbus: send function code
0x06to set40010to raw253. - Wait for delivery: observe OPC UA via subscription or repeated reads until the value changes.
- Capture evidence: record gateway log lines containing
E2E-WRITE-002.
Assertions
- Value: OPC UA value equals
25.3(not253and not25.30rounded incorrectly). - Quality/Status: variable quality is “good” after update; if the gateway uses status codes, confirm the expected code.
- Timing: update occurs within the configured maximum propagation window (e.g., subscription publish interval plus one cycle).
- No side effects: unrelated OPC UA nodes remain unchanged.
If the OPC UA value becomes -25.3, you likely have an endianness or signedness mismatch. If it becomes 25.3000000007, you likely have a conversion/rounding expectation issue—decide whether to assert exact equality or a tolerance.
Example Scenario for Command Path and Acknowledgment
Scenario: Modbus Command Triggers OPC UA Method and Returns Status
Assume:
- Modbus register
40020is a command code. - Writing
1means “start motor.” - OPC UA method
ns=2;s=Plant/Motor/Startreturns a status code and emits an event. - Gateway writes method result back to Modbus register
40021.
Test steps
- Write command code
1to40020. - Observe OPC UA method execution logs and confirm the method input matches the command payload.
- Wait for Modbus
40021to update.
Assertions
- Acknowledgment:
40021changes from “idle” to “accepted” and then to “completed” (or “rejected”). - Consistency: the final status matches the OPC UA method return status.
- Idempotency: repeat the same command write; confirm the gateway does not start the motor twice. If it does, your gateway needs a command de-duplication key.
Evidence Strategy That Makes Failures Explainable
When a test fails, you want the failure to point to a layer:
- Modbus packet capture shows the write but OPC UA doesn’t change: mapping or gateway routing issue.
- Gateway logs show mapping but OPC UA rejects: type conversion, constraints, or method input validation.
- OPC UA changes but Modbus feedback doesn’t: reverse mapping, polling interval mismatch, or stale cache.
Use correlation IDs consistently across gateway and OPC UA server logs. A simple approach is to include E2E-<scenario>-<sequence> in gateway logs and mirror it in OPC UA server diagnostics.
Timing Assertions Without Guesswork
Timing tests should measure what the system is configured to do:
- For polling-based confirmation, assert “within N polls” rather than “within X milliseconds.”
- For subscriptions, assert “within one publish cycle plus processing time,” using the configured publish interval.
A good practice is to record the observed propagation time during the test run and compare it to the configured bounds, not to a vague expectation.
Acceptance Checklist for End to End Validation
A scenario is accepted when:
- The trigger-to-observation chain is traceable via IDs.
- Values match with the correct scaling, type, and sign.
- Status and quality codes match the intended semantics.
- Timing behavior matches the configured polling/subscription model.
- Failure cases produce predictable, diagnosable outcomes.
With these scenarios and evidence rules, you can validate the system end to end and still know exactly where the story breaks when it does.
7. Network Engineering for Industrial Protocol Performance
7.1 Physical Layer Choices for Serial and Ethernet Links
Choosing the physical layer is choosing the “shape” of your communication: voltage levels, cabling, timing, and how signals survive noise. The right choice reduces integration pain later, because it constrains what the protocol can reliably do.
Serial Links: When Wires Are the Whole Story
Serial links are common when devices are distributed, legacy equipment is present, or wiring runs are short-to-medium. The key physical decisions are electrical standard, topology, and timing.
Electrical standard and signaling. RS-232 uses single-ended signaling and is sensitive to ground differences; it works over short distances. RS-485 uses differential signaling, tolerates noise better, and supports multi-drop networks. A typical industrial pattern is RS-485 with a single master and multiple slaves.
Topology and termination. RS-485 often needs termination at the ends of the bus to reduce reflections. If you have a long cable with branches, reflections can cause framing errors that look like “random” Modbus failures. Terminate only at the physical ends unless the manufacturer specifies otherwise.
Timing behavior. Serial protocols depend on timing gaps. For Modbus RTU, the receiver uses silent intervals to detect frame boundaries. That means baud rate, cable delay, and processing latency all matter. If your gateway is busy and misses the required inter-frame timing, you’ll see intermittent CRC errors.
Practical example. Suppose you connect a gateway to three meters over RS-485. You set 9600 baud, 8 data bits, even parity, and 1 stop bit. If one meter is wired with a different polarity or missing termination, you may still get occasional reads, but writes may fail more often because they trigger different response timing.
Ethernet Links: When Networks Become the Medium
Ethernet provides a packet-based physical layer that carries both Modbus TCP and OPC UA traffic. The physical layer choices here are cabling, link speed, and how you segment traffic.
Cabling and link speed. Use the correct cable type for the distance and speed you need. Mismatched speed or duplex settings can cause retransmissions and latency spikes. Even when the link “comes up,” subtle negotiation issues can degrade performance under load.
Switching and segmentation. A managed switch can isolate broadcast traffic and reduce interference between control traffic and other systems. VLAN segmentation also helps keep discovery and diagnostics from wandering into the wrong network.
Link health and observability. Ethernet gives you link-layer counters and logs. If OPC UA subscriptions appear to “stall,” check for interface errors, dropped frames, and frequent link renegotiations before blaming application logic.
Practical example. An OPC UA client reads a temperature variable via subscriptions. After adding a new device, the subscription keeps reconnecting. Packet captures show bursts of retransmissions aligned with a misconfigured port speed on the switch. Fixing the port to match the device restores stable publish intervals.
Mind Map: Physical Layer Decision Flow
Bridging to Protocol Behavior Without Surprises
Physical layer choices directly shape protocol behavior.
- Modbus RTU is sensitive to serial timing gaps and line noise; CRC errors often trace back to termination, baud mismatch, or timing jitter.
- Modbus TCP and OPC UA are sensitive to packet loss, retransmissions, and congestion; link-layer errors and retransmission bursts are the physical-layer fingerprints.
A simple rule of thumb: if you see errors that correlate with load or network changes, start with Ethernet link health. If errors correlate with specific frames or appear only on certain slaves, start with serial termination, wiring, and timing.
Quick Selection Checklist
- Choose RS-485 when you need multi-drop and noise tolerance on a bus.
- Choose RS-232 only when distances are short and grounding is controlled.
- Choose Ethernet when you need higher throughput, easier diagnostics, and integration with modern networks.
- Verify termination, baud/parity/stop bits, cable type, and switch port settings before tuning protocol parameters.
Example Configuration Notes You Can Actually Use
Serial (RS-485) notes:
- Set termination resistors at the bus ends.
- Ensure all devices share a common reference where required by the transceiver design.
- Confirm the gateway’s serial port parameters match every slave.
Ethernet notes:
- Match port speed and duplex settings to device capabilities.
- Use VLANs to separate control traffic from general traffic.
- Monitor interface error counters during commissioning.
7.2 IP Addressing VLAN Segmentation and Routing Considerations
A good VLAN and routing design starts with a simple goal: keep industrial traffic predictable, limit blast radius, and make troubleshooting less of a scavenger hunt. IP addressing is the backbone of that goal, because every firewall rule, route, and access control decision depends on it.
Foundations for Addressing and Segmentation
Begin by separating concerns into three layers.
- Addressing plan: decide which subnets exist, what they contain, and how they are labeled.
- Segmentation plan: decide which VLANs map to those subnets and which traffic is allowed between them.
- Routing plan: decide where routing happens, which paths are permitted, and how you avoid accidental reachability.
A practical approach is to allocate one subnet per trust zone, not per device. For example, group PLC networks, historian/SCADA networks, and engineering workstations into distinct subnets. Then map each subnet to a VLAN. This keeps rules readable and reduces the chance that a single misconfigured host becomes a network-wide problem.
VLAN Design That Stays Manageable
VLANs are most useful when they reflect trust boundaries. A common pattern is:
- VLAN for field devices: PLCs, I/O gateways, and sensors.
- VLAN for control/SCADA: systems that monitor and supervise.
- VLAN for engineering: laptops and configuration tools.
- VLAN for services: DNS, NTP, certificate services, and jump hosts.
Keep VLAN IDs consistent across sites if you operate multiple plants. Consistency reduces human error during commissioning and during incident response.
When you trunk VLANs across switches, ensure the trunk carries only the VLANs you intend. If you must carry many VLANs, document the trunk policy per link so you can quickly spot where an unexpected VLAN is leaking.
Routing Considerations That Prevent Accidental Access
Routing between VLANs should be explicit and centralized. In many industrial networks, the “router” is a firewall or a routed security gateway. That design forces all inter-zone traffic through a policy engine.
Use routing rules that are narrow in scope:
- Allow only required ports and protocols between zones.
- Prefer destination-based rules for services (for example, only allow OPC UA traffic to the SCADA subnet).
- Avoid broad “any to any” rules, even inside the same building.
Also pay attention to default routes. If a VLAN has a default route pointing somewhere unintended, devices may send traffic to the wrong place and fail in confusing ways. For troubleshooting sanity, keep each VLAN’s routing behavior intentional.
Mind Map: Addressing, VLANs, and Routing
Example: Clean Subnet and VLAN Layout
Assume you have a single plant with three zones. You can use a simple private addressing scheme:
- VLAN 10 Field:
10.10.10.0/24(PLCs and Modbus gateways) - VLAN 20 Control:
10.10.20.0/24(SCADA and OPC UA server) - VLAN 30 Engineering:
10.10.30.0/24(engineering laptops)
Then route only through a security gateway that enforces policy. For example, allow engineering to reach only the OPC UA server and the gateway management interface, not the entire field subnet.
Example: Routing and Firewall Rule Logic
A common mistake is to allow routing and then rely on “hope” for protocol behavior. Instead, tie routing to explicit policy.
- From Engineering VLAN 30 to Control VLAN 20: allow OPC UA (typically TCP 4840) to the OPC UA server IP.
- From Control VLAN 20 to Field VLAN 10: allow only the Modbus gateway IP to be reachable for the specific functions you use.
- Deny everything else by default.
This makes packet captures easier: when something fails, you know whether it’s blocked by policy or broken by addressing.
Practical Validation Steps
After implementing addressing, VLANs, and routes, validate in this order:
- L2 reachability: confirm VLAN membership and tagging on trunks.
- L3 reachability: confirm each device can reach its intended gateway and peer IPs.
- Policy enforcement: check firewall counters for allowed flows.
- Name and time dependencies: verify DNS and NTP paths, because many industrial protocols behave badly when identity or timestamps are inconsistent.
A network that is segmented and routed with clear intent turns troubleshooting from a guessing game into a checklist. And yes, that checklist should fit on one screen.
7.3 Latency Jitter and Bandwidth Planning for Polling and Subscriptions
Latency is how long it takes for a value to show up at the consumer. Jitter is how much that time varies from one update to the next. Bandwidth is the total capacity consumed by messages, plus the overhead that comes with framing, acknowledgments, and retransmissions. Planning these three together prevents the classic “it works on the bench, then it stutters in production” problem.
Foundations for Timing Behavior
Start with the update path. For polling, the cycle is typically: schedule → request → device response → processing. For subscriptions, the cycle is typically: publish interval → data collection → publish → delivery to the client. In both cases, the end-to-end delay is not just network time; it includes device processing, gateway translation time, and client handling.
Jitter mostly comes from variable queueing and variable service times. Queueing varies with traffic bursts and competing flows. Service time varies with device load, gateway mapping work, and how many items are bundled into a single response or publish.
Bandwidth Planning That Matches the Real Message Shape
Polling bandwidth depends on how many requests you send per second and how much each response carries. If you poll 200 holding registers individually at 10 Hz, you send 2000 requests per second, even if each response is small. If you batch reads into a single request that covers a contiguous range, the request count drops dramatically and so does overhead.
Subscriptions bandwidth depends on the number of monitored items, the publish interval, and how often values actually change. Even if values rarely change, you still pay for keep-alives and periodic publishes depending on configuration. The practical approach is to estimate two rates: steady-state traffic and change-driven traffic.
A simple planning method is to compute message rate first, then multiply by average payload plus protocol overhead. For polling, message rate is requests per second. For subscriptions, message rate is publishes per second, multiplied by the average number of changed items per publish.
Jitter Sources and How to Reduce Them
Queueing jitter is reduced by shaping traffic so it is not synchronized across many devices. If every gateway polls at exactly the same second boundary, their responses collide and queue. A small phase offset per device spreads bursts.
Device processing jitter is reduced by avoiding overly large reads that force the device to scan or assemble too much data per request. If you need many points, split them into a few ranges that match the device’s natural grouping.
Client-side jitter is reduced by ensuring the client can process incoming updates quickly enough. If the client’s handler is slow, messages accumulate, and the observed jitter increases even when the network is stable.
Practical Planning Workflow
- Define the timing requirement per signal. Some values need near-real-time updates; others can tolerate slower refresh.
- Choose polling or subscription per requirement. Polling is predictable when you control the schedule. Subscriptions are efficient when changes are sparse.
- Estimate worst-case traffic shape. Assume the heaviest burst you can reasonably trigger: many registers changing at once, or multiple devices responding simultaneously.
- Set intervals with headroom. Use a publish interval and polling period that leave margin for retransmissions and processing delays.
- Validate with measurement. Compare observed end-to-end delay and jitter against your computed expectations using timestamps at the gateway and client.
Example: Polling Period and Jitter Control
Suppose you must update 500 registers with a target refresh of 200 ms. If you poll every 200 ms and read all 500 in one request, the response time might vary depending on device load, creating jitter. If instead you split into five contiguous blocks of 100 registers and read one block per 40 ms, you still achieve an effective 200 ms refresh for the full set, but each request is smaller and more consistent.
To avoid synchronized bursts, offset each block schedule by a small amount per device. If you have 10 devices, stagger their 40 ms block cycles by 0–36 ms in steps of 4 ms. The result is fewer queueing spikes.
Example: Subscription Publish Interval and Bandwidth
Assume a subscription with 300 monitored items and a publish interval of 100 ms. If values change frequently, many items will be included in each publish, increasing payload size and delivery time. If values change rarely, you still get periodic publishes, but payload size stays smaller.
A practical configuration is to set the publish interval to meet the timing requirement, then tune monitored item sampling and deadbands so that minor fluctuations do not trigger updates. For instance, if a temperature sensor jitters by ±0.1 °C but the control logic only cares about 0.5 °C steps, applying a deadband reduces the number of changes that become publish-worthy.
Mind Map: Latency Jitter and Bandwidth Planning
Quick Checklist for Integration
- Batch reads for polling to reduce request count and overhead.
- Stagger polling schedules across devices to reduce queueing collisions.
- Keep request sizes consistent to reduce device processing jitter.
- Choose subscription publish intervals that match the slowest acceptable update, then reduce unnecessary item changes with sampling and deadbands.
- Validate with measured latency and jitter at the gateway and client, not just on the network.
7.4 Timeouts Retransmissions and Backoff Policies for Stability
Stability in industrial protocols is mostly about what you do when things go wrong, not about how fast you are when everything is fine. Timeouts, retransmissions, and backoff policies work together to prevent two common failure modes: endless waiting that blocks control loops, and frantic retry storms that make congestion worse.
Foundations: What Timeouts Actually Control
A timeout is the maximum time you allow for an operation to complete before you treat it as failed. In polling systems, the timeout bounds how long your cycle can be delayed. In request/response systems, it bounds how long you keep a transaction “in flight.” A good timeout is tied to the expected communication path and processing time, not to a random number.
Start with a simple budget:
- Network transfer time: typically small but not zero.
- Device processing time: varies with load and firmware.
- Gateway or application handling: includes parsing and mapping.
- Scheduling delay: your own thread or task may not run immediately.
If you set the timeout too low, you’ll create false failures and trigger retries. If you set it too high, you’ll stall the system and accumulate stale data.
Retransmissions: When Repeating Is Safe
Retransmission means sending the same request again after a timeout. It is safe when the operation is idempotent or when the protocol and application can detect duplicates.
For read operations, retransmission is usually safe because repeating a read does not change device state. For write operations, it depends on the semantics:
- If the write sets a value to a specific target, repeating it usually converges to the same final state.
- If the write triggers an action like “start” or “increment,” repeating can cause unintended multiple actions.
A practical pattern is to separate command writes from verification reads. For example, write a “StartRequested” bit, then read back a “Running” status bit. If the write times out, you can avoid re-sending the command if the status already indicates the intended state.
Backoff: How to Avoid Retry Storms
Backoff controls the delay between retries. Without backoff, multiple clients or repeated timeouts can synchronize retries and amplify congestion. With backoff, retries spread out and give the network and devices time to recover.
Use a backoff strategy that matches the failure type:
- Short linear backoff for transient packet loss.
- Exponential backoff for persistent congestion or link instability.
- Jitter to prevent synchronized retries across multiple nodes.
A simple policy that works well in many industrial setups is exponential backoff with jitter and a cap on maximum delay. Also cap the number of retries so the system can fail gracefully and continue operating with degraded quality.
Mind Map: Stability Controls
Example: Polling with a Bounded Cycle
Assume you poll a Modbus register every 200 ms. If your read timeout is 150 ms and the device is slow, one delayed response can consume most of the cycle. A better approach is to set a timeout that fits the cycle budget, then skip or mark the data as stale when the timeout expires.
Example behavior:
- Timeout: 80 ms
- Retries: 1 (only one repeat)
- Backoff: 20 ms before the second attempt
- If both attempts fail: publish “data quality degraded” and continue to the next cycle.
This keeps the control loop responsive even when the network hiccups.
Example: Write Command with Verification
Suppose you write a “Pump Start” command via a gateway. The write request times out, so you might be tempted to resend the command. Instead:
- Send the command once.
- If it times out, read the “Pump Running” status.
- If “Running” is already true, treat the operation as successful and do not resend.
- If “Running” is false, retry the command using backoff.
This approach prevents accidental double-start when the first write actually succeeded but the response was lost.
Example: Backoff Policy in Practice
A concrete retry schedule for a request that can be safely repeated (like a read) might look like:
- Retry 0: immediate request
- Retry 1: wait 50 ms + random jitter up to 20 ms
- Retry 2: wait 100 ms + random jitter up to 40 ms
- Retry 3: wait 200 ms + random jitter up to 80 ms
- After retry 3: stop and mark the operation failed for this cycle
The jitter is the small detail that prevents multiple clients from retrying at the exact same moments.
Operational Checks That Keep It Honest
Stability policies should be validated with metrics you can act on:
- Timeout rate per operation type.
- Average and worst-case latency including retries.
- Stale data duration when failures occur.
- Write verification outcomes to confirm that timeouts do not cause duplicate actions.
If you see timeouts clustering at the same times, it often indicates synchronized retries or periodic load spikes. Adjusting backoff and adding jitter usually fixes that without changing the protocol itself.
Finally, document the policy so integration teams can reason about behavior during faults. A system that fails predictably is easier to operate, and it makes debugging feel less like guesswork and more like engineering.
7.5 Observability With Packet Capture Metrics And Application Logs
Observability is what you use when the system is already misbehaving. For Modbus and OPC UA integrations, that usually means you need to correlate what the network carried with what your gateway or application believed it did. Packet capture tells you what happened on the wire; application logs tell you what your software decided. The trick is to make them line up.
What to Measure First
Start with three foundational signals:
- Connectivity: Can the client reach the server or gateway reliably? Look for repeated connection resets, timeouts, and retransmissions.
- Protocol Health: Are requests and responses completing with expected timing and sizes? For Modbus TCP, watch transaction behavior; for OPC UA, watch service outcomes and subscription delivery.
- Data Integrity: Are values consistent with the protocol semantics? Packet capture can confirm the bytes; logs can confirm scaling, type conversion, and mapping.
A simple rule keeps teams sane: every log entry that matters should include a correlation key that can be matched to a packet capture window.
Correlation Strategy That Actually Works
Use a correlation key that survives across layers. Common choices are:
- Gateway request ID generated per upstream request.
- Modbus transaction identifier for Modbus TCP.
- OPC UA request handle or operation ID for service calls.
In practice, you log the key, the target endpoint, and a monotonic timestamp. Then you capture packets and filter by the same endpoint and time window. If you can’t align timestamps precisely, align by sequence: request logged first, packet observed next, response logged last.
Packet Capture Metrics That Point to Root Causes
Packet capture is most useful when you extract metrics instead of staring at raw frames.
- Round-trip time distribution: Track median and tail latency for request/response pairs. Tail latency often reveals retransmissions or overloaded devices.
- Retransmission rate: High retransmissions correlate with congestion, duplex mismatches, or noisy links.
- Error flags and malformed patterns: For Modbus TCP, confirm function code, unit identifier, and expected response length. For OPC UA, confirm message type and service response codes.
- Inter-arrival gaps: Polling loops that drift can cause bursts that overload gateways.
A practical workflow is to capture during a known incident, then compare metrics from a stable period. The difference usually tells you whether the problem is network-level, protocol-level, or mapping-level.
Application Logs That Support Forensics
Logs should be structured and intentionally boring. Include:
- Event type: read, write, subscription publish, method call, reconnect.
- Correlation key: request ID, transaction ID, or operation ID.
- Target and direction: upstream device, gateway, downstream client.
- Outcome: success, timeout, protocol error, mapping error.
- Timing: start time, duration, and retry count.
When mapping fails, log both the raw source value and the interpreted value. For example, record the Modbus register words and the scaled engineering value you produced.
Example Log Lines and Packet Filters
Example log lines for a Modbus TCP read:
2026-02-15T10:22:41.104Z reqId=7f3a unit=1 txId=42 func=03 addr=40001 qty=10 start=mono:123456
2026-02-15T10:22:41.132Z reqId=7f3a txId=42 outcome=ok duration_ms=28 rawWords=[0x03E8,0x000A,...]
2026-02-15T10:22:41.133Z reqId=7f3a mapped value=25.40 unit=bar quality=good
A matching packet capture filter focuses on the endpoint and time window:
tcp and host 192.168.10.50 and port 502
Then you verify that the response contains the expected function code and that the payload length matches the requested quantity.
Mind Map: Observability with Packet Capture and Logs
Advanced Details Without the Pain
Once the basics work, add two refinements.
- Quality indicators in logs: Record whether values are fresh, stale, or invalid. This prevents “it was received” from being mistaken for “it was usable.”
- Retry visibility: Log retry attempts with backoff parameters. Without that, packet captures show repeated traffic but logs hide the reason.
Finally, keep a consistent vocabulary across Modbus and OPC UA paths. If a timeout means the same thing in both protocols, your incident reports become shorter and your debugging sessions become less of a scavenger hunt.
8. Security Engineering for Modbus and OPC UA
8.1 Threat Modeling for Industrial Communication Paths and Trust Boundaries
Threat modeling starts by answering three practical questions: what data moves, who can influence it, and what “good” looks like at each hop. In industrial systems, the tricky part is that trust is rarely uniform. A sensor might be trusted by the controller, but the network between them is not. A gateway might be trusted by an OPC UA server, but not by the engineering workstation that configures it.
Step 1: Define Communication Paths and Assets
Begin with a path inventory. For Modbus and OPC UA, typical assets include register values, command bits, alarm states, authentication material, and configuration data.
Example path set:
- Field device to gateway over Modbus TCP
- Gateway to OPC UA server over an internal network
- OPC UA server to client over OPC UA sessions and subscriptions
- Engineering workstation to gateway for mapping and write permissions
For each asset, record the impact of compromise in plain terms: wrong pressure reading, unauthorized start command, altered scaling that makes alarms meaningless, or loss of visibility due to stale data.
Step 2: Identify Trust Boundaries and Actors
A trust boundary is where assumptions change. Common boundaries in these systems:
- Network boundary between OT segments and IT segments
- Protocol boundary between Modbus and OPC UA translation layers
- Authorization boundary between read-only and read-write roles
- Configuration boundary where mapping rules and write permissions are changed
Actors include:
- Legitimate clients and controllers
- Maintenance tools and scripts
- Misconfigured or compromised devices
- Unauthorized users on the same network segment
A useful rule: if a component can cause a state change, treat it as a high-value actor even if it is “internal.”
Step 3: Enumerate Threats by Category
Use a structured list so you don’t miss the boring failures that become security incidents.
- Spoofing and impersonation: a rogue endpoint pretends to be a legitimate server or gateway.
- Tampering: data is altered in transit, or mapping rules are changed.
- Repudiation: actions cannot be traced to an identity, making incident response slow.
- Information disclosure: sensitive identifiers, topology, or credentials leak.
- Denial of service: flooding requests, exhausting sessions, or forcing timeouts.
- Elevation of privilege: a client gains write access through misconfiguration or weak authorization.
Example: If an OPC UA client can write to a “Start Pump” method without role checks, the threat is not just unauthorized control. It also includes accidental misuse by a legitimate operator using the wrong client profile.
Step 4: Map Threats to Concrete Attack Scenarios
Turn categories into scenarios that match your architecture.
Scenario A Modbus register manipulation
- Entry point: Modbus TCP read/write requests to a gateway.
- Boundary: network segment and gateway authorization.
- Likely outcome: altered setpoints or command bits.
- Mitigation targets: strict write allowlists, command acknowledgment logic, and monitoring of unusual write rates.
Scenario B OPC UA session abuse
- Entry point: OPC UA client session creation and subscription requests.
- Boundary: OPC UA server authorization and resource limits.
- Likely outcome: service degradation or unauthorized reads.
- Mitigation targets: certificate trust rules, per-user permissions, and session/subscription throttling.
Scenario C Configuration tampering
- Entry point: engineering workstation actions that change mapping or permissions.
- Boundary: configuration interface and identity verification.
- Likely outcome: silent data corruption where values still “look valid.”
- Mitigation targets: change control, signed configuration artifacts, and audit logs that record who changed what.
Step 5: Define Trust Controls and Verification
Controls should be testable. For each boundary, specify what must be true.
- Network controls: segmentation so only required ports can reach the gateway and server.
- Protocol controls: OPC UA security policies with certificate-based trust, and Modbus isolation when possible.
- Authorization controls: least privilege for read vs write, and separate roles for configuration.
- Integrity controls: validation of register ranges and command state transitions.
- Observability controls: logs that tie actions to identities and include correlation IDs across hops.
Example verification checklist:
- Attempt a write to a disallowed register and confirm the gateway rejects it with a logged identity.
- Create an OPC UA subscription as a low-privilege user and confirm only permitted nodes are readable.
- Change a mapping rule and confirm the audit log records the user, time, and affected tags.
Mind Map: Threat Modeling for Industrial Communication
Step 6: Prioritize and Document Decisions
Prioritization should follow impact and likelihood, but keep it grounded. A low-likelihood scenario that causes direct physical actuation deserves attention if the impact is high.
Document outcomes as boundary statements. For example: “Only authenticated OPC UA clients with the Operator role may invoke Start methods, and every invocation is logged with identity and method parameters.” This turns threat modeling into engineering requirements you can implement and test.
8.2 Network Security Controls with Firewalls ACLs and Segmentation
Industrial protocols often run on networks that were designed for convenience, not containment. The goal of this section is simple: reduce the blast radius, make traffic intent explicit, and ensure only the right systems can talk to the right endpoints.
Foundations of Network Control for Industrial Traffic
Start by separating three concerns: who is allowed to initiate connections, what traffic is allowed, and where it is allowed to go. Firewalls and ACLs enforce these rules at different layers. Firewalls typically sit at network boundaries and between zones; ACLs often live on routers, switches, or host firewalls to filter traffic more locally.
A practical way to reason about rules is to classify flows:
- North-south: engineering workstations and servers reaching devices through a gateway or directly.
- East-west: device-to-device traffic, often unnecessary for Modbus and usually unnecessary for OPC UA servers.
- Management: device configuration, firmware, and monitoring access.
If you can’t name the required flows, you can’t write rules that won’t break operations.
Segmentation Strategy That Matches Real Roles
Segmentation works best when it mirrors operational roles. A common layout is:
- Corporate zone: user accounts, email, general IT services.
- OT DMZ: protocol gateways, jump hosts, and limited services that bridge zones.
- Control zone: PLCs, RTUs, sensors, and local HMIs.
- Safety zone: safety controllers, if present, kept isolated from general control traffic.
Keep the DMZ small and boring. If a gateway is the only intended bridge for Modbus and OPC UA, then only that gateway should be able to reach the control zone on protocol ports.
Firewall Rules That Express Intent
Write rules in the order you want the network to think: allow the minimum, deny the rest, and log what you deny.
For Modbus TCP, typical ports are 502. For OPC UA, the default is 4840, but many deployments use custom ports. Use the actual configured ports, not defaults.
A good rule set includes:
- Allow from specific sources to specific destinations.
- Allow only required ports and protocols (TCP vs UDP).
- Restrict management interfaces to jump hosts or bastions.
- Enable logging for denied traffic at least during commissioning.
Example: allow an OPC UA client server in the OT DMZ to reach an OPC UA server in the control zone on TCP 4840, but block the same client from reaching PLC web interfaces.
ACL Design for Switch and Router Filtering
ACLs are most useful when you need local enforcement close to the traffic source. They also help prevent accidental lateral movement when someone plugs in a new device.
Use ACLs to enforce three patterns:
- Source pinning: only known IPs or subnets can reach device ports.
- Port pinning: only the exact service ports are allowed.
- Direction pinning: block inbound where devices should only respond.
Example: on a router interface facing the control zone, deny any traffic from the corporate subnet to TCP 502 and TCP 4840, while allowing only the DMZ gateway subnet to reach those ports.
Practical Rule Construction Workflow
A systematic workflow prevents “allow everything until it works” habits:
- Inventory endpoints: list IPs, roles, and required services.
- Define flows: for each flow, specify source, destination, port, and direction.
- Group by zone: write rules per zone boundary first.
- Apply least privilege: start with deny-by-default and add allows one flow at a time.
- Validate with tests: confirm both connectivity and application behavior.
When validating, test at two levels: TCP reachability (can a connection be established) and protocol behavior (does the client successfully read or subscribe). A firewall can allow the port but still break application expectations if NAT, routing, or session handling is wrong.
Mind Map: Network Security Controls
Example: A Minimal, Safe Connectivity Policy
Assume:
- OPC UA gateway in OT DMZ: 10.20.30.10
- OPC UA server in control zone: 10.20.40.20
- Modbus TCP device in control zone: 10.20.40.30
- Corporate engineering workstation subnet: 10.10.0.0/16
Policy:
- Allow 10.20.30.10 → 10.20.40.20 TCP 4840
- Allow 10.20.30.10 → 10.20.40.30 TCP 502
- Deny 10.10.0.0/16 → 10.20.40.0/24 for TCP 4840 and TCP 502
- Allow management only from a jump host subnet to device management ports
This keeps the corporate network from directly touching control endpoints, while still enabling the required protocol traffic through a controlled bridge.
Common Failure Modes to Avoid
Two issues show up repeatedly. First, rules that allow ports but ignore routing and NAT behavior, causing sessions to fail after the initial connection. Second, overly broad source ranges that “work” during testing but later allow unintended devices to reach sensitive services.
A firewall is not a substitute for correct network design; it’s the enforcement layer that makes the design hold under real-world messiness.
8.3 OPC UA Security Policies Certificates and Trust Management
OPC UA security is built from two cooperating ideas: a security policy defines how messages are protected, and a certificate trust model defines who is allowed to do that protection. If you treat these as separate, you’ll eventually ship something that “works” but fails the first real integration test.
Security Policies What They Control
A security policy specifies the cryptographic choices used for a session, including:
- Message protection: whether messages are signed only or signed and encrypted.
- Key establishment: how session keys are derived from certificates.
- Algorithm selection: which signature and encryption algorithms are used.
In practice, you pick a policy based on the environment:
- Use signing only when confidentiality is not required but integrity is.
- Use signing and encryption when credentials, process data, or commands must not be readable on the network.
A common engineering mistake is enabling encryption without checking whether the rest of the system can handle it. For example, some gateways or packet inspection tools may break assumptions about payload visibility and logging.
Certificates What They Prove
A certificate is the identity document used during the OPC UA handshake. It answers: “Which endpoint is this?” and “Is it allowed to participate?”
Key properties you should verify during design and commissioning:
- Subject and Subject Alternative Names: match the expected endpoint identity.
- Validity period: avoid surprises during long maintenance cycles.
- Key usage and extended key usage: ensure the certificate is meant for the intended purpose.
- Key size and algorithm strength: align with the security policy requirements.
A practical tip: treat certificate fields as part of your integration contract. If you later change naming conventions, you may break trust rules even though cryptography still works.
Trust Management the Who and the How
Trust management is the process of deciding which certificates are accepted and how that decision is enforced. OPC UA typically uses a combination of:
- Trust lists: collections of certificates that a server trusts for client connections.
- Rejected lists: certificates that are explicitly denied.
- Application instance certificates: the certificates used by specific server or client applications.
The workflow is straightforward:
- A client presents its application instance certificate.
- The server checks whether that certificate is in its trust list and not in its rejected list.
- If trusted, the server proceeds with the selected security policy.
- The session is established with keys derived from the certificates.
If you ever see “BadCertificateUntrusted” style errors, the issue is usually not the security policy. It’s the trust decision.
Mind Map: Certificate Trust Flow
Example: Signing Only with Trust Lists
Assume a plant uses signing-only protection for integrity while keeping payloads readable for troubleshooting. The server is configured to trust a specific client certificate.
- The client connects using a security policy that signs messages.
- The server checks the client certificate against its trust list.
- If the certificate is trusted, the server accepts the session and the client can read a temperature variable.
What to test during commissioning:
- Confirm the server rejects a client with an untrusted certificate even if the security policy matches.
- Confirm the server accepts the trusted certificate even if the client uses the same policy but a different endpoint URL.
This separates “cryptography matches” from “identity is trusted,” which is where many integration failures hide.
Example: Certificate Rotation Without Breaking Trust
Certificate rotation is a common operational task, and trust management is where it can go wrong. A safe approach is to add the new certificate to the trust list before removing the old one.
A typical sequence:
- Generate a new application instance certificate for the client.
- Add the new certificate to the server’s trust list.
- Connect using the new certificate and confirm normal reads and writes.
- Remove the old certificate only after successful verification.
Use a clear operational record. For example, if you rotate on 2026-02-15, document the server trust list update time and the certificate thumbprints used, so troubleshooting doesn’t turn into archaeology.
Advanced Details: Matching Policy and Certificate Capabilities
Even when trust is correct, the handshake can fail if the certificate cannot support what the security policy requires. Validate compatibility by checking:
- The certificate’s key algorithm matches what the policy expects.
- The certificate’s key size meets the policy’s minimum.
- The certificate is allowed for the intended role in the handshake.
A useful debugging habit is to log both the trust decision and the policy negotiation result. When you only look at one, you end up chasing the wrong layer.
Mind Map: What to Verify During Troubleshooting
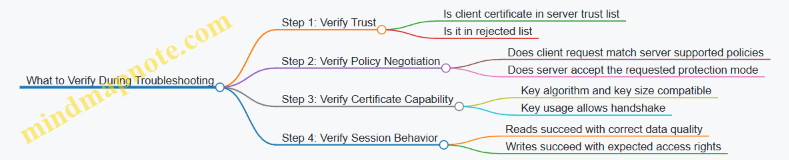
Practical Checklist for Integration
Before go-live, confirm these items in a single pass:
- The server trust list contains the exact client application instance certificate(s) used in production.
- The client trust list contains the exact server application instance certificate(s) it will accept.
- The selected security policy is consistent across endpoints and matches certificate capabilities.
- Certificate validity windows cover the maintenance period you actually operate with.
- Rotation procedures update trust lists in the correct order.
When these are aligned, OPC UA security behaves predictably: trust decides “who,” and the security policy decides “how.”
8.4 Authentication Authorization and Least Privilege for Client Access
Authentication and Authorization Foundations
Authentication answers “who is this client,” while authorization answers “what may this client do.” In industrial systems, the practical goal is to prevent accidental control actions and to make intentional misuse harder than it needs to be.
Start with a clear trust boundary: the OPC UA server (or gateway) is the enforcement point, not the network. Even if traffic is segmented, credentials still matter because segmentation does not stop a misconfigured client from sending a valid request.
Authentication Methods for Client Access
Use strong, explicit identity checks. In OPC UA, the server typically supports multiple user identity tokens, such as username/password, certificate-based identity, or anonymous (which should be disabled for any control path).
A good baseline policy is:
- Require certificate-based identity for any client that can write or call methods.
- Allow username/password only for read-only clients, and only if transport security protects credentials.
- Deny anonymous access entirely when the server exposes writeable nodes or executable methods.
Example: A historian client needs read access to process values. It authenticates with a certificate tied to a “read-only” role. A commissioning tool needs write access to calibration parameters and method calls for “start calibration,” so it uses a different certificate mapped to a “calibration operator” role.
Authorization Model and Least Privilege
Least privilege means each client gets only the permissions required for its tasks. Implement this as role-based access control (RBAC) or attribute-based rules, but enforce it consistently at the server.
A practical authorization workflow:
- Map the authenticated identity to a role.
- Apply role permissions to node access (read/write) and method execution.
- Enforce per-action checks, not just per-session checks.
Example: The “calibration operator” role may write to nodes under Calibration/* but must not write to Safety/*. Even if the client can browse the address space, the server denies writes to restricted nodes.
Mapping Permissions to OPC UA Capabilities
OPC UA authorization should cover three categories:
- Node read access for variables and data types.
- Node write access for writable variables.
- Method call access for executable methods.
A common mistake is granting method execution without checking the method’s input constraints. For example, a “Set Setpoint” method should validate that the requested value is within engineering limits and that the caller role is allowed to change that specific setpoint.
Concrete Least Privilege Patterns
Use these patterns to keep permissions tight and predictable.
Separate Identities by Function
Do not reuse the same credentials for engineering, operations, and maintenance. If a single credential leaks, the blast radius becomes “everything that credential can do.”
Split Read and Write Roles
Read-only clients should never have write permissions, even if they “usually” don’t write. This prevents accidental writes from test code or misconfigured UI actions.
Restrict Method Calls by Role and Input Validation
Authorization is necessary but not sufficient. A method call should also validate inputs and enforce state conditions.
Example: A “Reset Fault” method requires both role permission and a condition that the plant is in a safe state. The server rejects the call if the precondition fails, even if the caller is authenticated.
Mind Map: Authentication Authorization and Least Privilege
Example Policy and Decision Table
Below is a compact example of how a server might decide access.
| Identity Role | Node Read | Node Write | Method Call | Notes |
|---|---|---|---|---|
| HistorianReader | Allowed | Denied | Denied | Read only, no control actions |
| OperatorConsole | Allowed | Allowed | Allowed | Writes limited to Process/* |
| CalibrationOperator | Allowed | Allowed | Allowed | Writes limited to Calibration/* |
| SafetyEngineer | Allowed | Denied | Allowed | Can execute safety diagnostics methods only |
If a client tries to write to Safety/Enable, the server denies the request even if the client can read Safety/Enable.
Auditing and Verification
Least privilege only works if you can verify it. Log authorization decisions with enough context to troubleshoot without exposing secrets.
A useful audit record includes:
- Identity (role or certificate subject)
- Requested action (read/write/method)
- Target node or method identifier
- Result (allowed/denied) and reason code
Verification example: Use a test client with the HistorianReader identity and attempt a write to a calibration node. The expected outcome is denial with a clear reason code indicating missing write permission. Then repeat with the CalibrationOperator identity and confirm the write succeeds only for allowed nodes.
Summary
Treat authentication as identity proof and authorization as action permission enforced at the server. Apply least privilege by separating identities, splitting read and write roles, restricting method calls, and validating inputs and state. When you can test and audit these decisions, the system becomes predictable—exactly what you want when industrial control is on the line.
8.5 Modbus Security Mitigations with Network Isolation and Safe Gateways
Modbus is simple by design, which means it also tends to be simple to misuse. The most effective mitigations therefore start outside the protocol: isolate where Modbus traffic can go, and place a controlled gateway between Modbus devices and the rest of your network. Think of the gateway as a bouncer with a clipboard—every request is checked, logged, and translated into safe actions.
Foundational Isolation Principles
Network isolation reduces the blast radius of misconfiguration, credential mistakes, and accidental exposure. Use segmentation so only the gateway can reach Modbus endpoints.
- Separate VLANs or subnets for Modbus devices and the gateway.
- Default-deny firewall rules from the corporate network to the Modbus subnet.
- Allow only required ports (commonly Modbus TCP port 502) from the gateway to devices.
- Restrict east-west traffic so other servers cannot “helpfully” poll the same devices.
Example: A historian server should never talk to Modbus devices directly. Instead, it connects to the gateway using a different, controlled interface (for example, OPC UA or an internal API), and the gateway performs Modbus reads.
Safe Gateway Responsibilities
A safe gateway enforces policy at the boundary. It should not merely translate addresses; it should also enforce which operations are permitted and how they are validated.
Key responsibilities:
- Allowlist mapping: only configured register ranges and coils can be read or written.
- Type and range validation: reject values outside engineering limits before issuing Modbus writes.
- Command gating: require an explicit “enable” condition for control writes (for example, a permissive bit or a safety state).
- Write verification: after a write, read back the target register(s) and confirm the expected value.
- Rate limiting: cap write frequency to prevent accidental rapid toggling.
- Audit logging: record who requested what, which registers were touched, and whether verification succeeded.
Example: If a Modbus register represents a motor speed setpoint scaled by 0.1, the gateway converts the client’s engineering units to the raw register value, checks the allowed range (say 0–1500 rpm), writes the raw value, then reads back to confirm.
Modbus Write Safety Patterns
Control writes are where mistakes become physical events. Use patterns that make unsafe actions harder.
- Two-step control: first write a “prepare” command, then a “commit” command only when a permissive condition is true.
- Edge-triggered commands: require a rising edge on a command bit rather than level-sensitive behavior.
- Idempotent command handling: if the same command is repeated, the gateway should avoid re-triggering the physical action.
Example: A valve open command uses a bit. The gateway tracks the last command state per device. If the client repeats “open” while the valve is already open, the gateway returns success without rewriting the coil.
Firewall and Routing Rules That Actually Help
Isolation is only as good as the rules. Apply rules that match your topology.
- Gateway to Modbus devices: allow Modbus TCP 502 only from gateway IP(s) to device IP(s).
- Modbus devices to gateway: allow only responses; block unsolicited inbound connections.
- No direct access from clients: block Modbus ports from user workstations, application servers, and monitoring systems.
- Management access separation: keep device management interfaces on a different path than Modbus data.
Example: If a maintenance laptop needs access, route it through a jump host that can reach only the gateway management interface, not the Modbus subnet.
Monitoring and Detection at the Boundary
Even with isolation, you still need visibility. The gateway is your best observation point because it sees normalized requests.
Monitor:
- Denied requests due to allowlist or range checks.
- Write attempts to forbidden registers.
- Verification failures after writes.
- Abnormal request rates from a single client.
Example: If a client repeatedly tries to write outside the configured register range, the gateway logs the attempt and returns a clear error without touching the device.
Mind Map: Isolation and Safe Gateway Mitigations
Integrated Example Flow
- A control application requests a setpoint update.
- The gateway checks the client identity, verifies the requested register is in the allowlist, and converts engineering units to raw Modbus values.
- The gateway validates the value against configured limits and confirms a permissive condition is currently true.
- The gateway writes the Modbus register, then reads it back to verify.
- The gateway returns a success or failure result to the application and logs the full transaction.
This flow keeps Modbus traffic confined to the gateway-to-device path, while ensuring that only validated, verified actions reach the field devices.
9. Reliability Engineering with Error Handling and Resilience
9.1 Designing for Partial Failures and Graceful Degradation
Partial failure is the normal state of industrial networks: a single device can reboot, a gateway can drop a connection, or a packet can vanish without asking permission. Graceful degradation means the system keeps doing useful work, reports what changed, and avoids turning one fault into a cascade.
Foundational Principles for Graceful Degradation
Start by separating three ideas: availability, correctness, and timeliness. A system can remain available while correctness drops (for example, serving cached values), and it can remain correct while timeliness drops (for example, delaying non-critical updates). Your design should state which combinations are acceptable per data item.
Next, define failure domains. In practice, Modbus polling and OPC UA subscriptions often fail independently. A Modbus timeout should not automatically invalidate OPC UA data quality, and an OPC UA session reconnect should not block Modbus reads needed for safety interlocks.
Finally, plan for observable behavior. If you degrade silently, operators will treat the system as “working” until it isn’t. If you degrade loudly but inaccurately, you’ll cause unnecessary interventions. The goal is accurate, item-level quality reporting.
Mind Map: Failure Modes and Degradation Paths
Degradation Strategy by Layer
Device communication layer. For Modbus, treat timeouts and CRC/framing errors as transient unless they persist beyond a threshold. A practical approach is to retry once quickly, then fall back to the last known good value while marking it stale. For example, if a pressure sensor register read fails for 3 consecutive cycles, keep the last value but set quality to “stale” and stop issuing writes to any dependent control registers.
Gateway and mapping layer. Gateways often fail in ways that look like data corruption. If a register map is wrong, you’ll get consistent but incorrect values. Graceful degradation here is not “retry harder”; it’s validation. Add sanity checks such as range limits and monotonic expectations for counters. If a value violates constraints, mark it invalid and exclude it from control logic.
Application layer. Decide which features can pause. A common pattern is to keep safety-critical logic running using the most reliable inputs, while non-critical analytics can tolerate missing updates. For instance, if OPC UA subscriptions lag, you can continue running a basic dashboard using cached values, but you should pause alarm evaluation that depends on fresh timestamps.
Concrete Example: Modbus Polling with Stale-Value Policy
Assume you poll Modbus holding registers every 250 ms. You maintain for each tag: value, timestamp, and quality.
- On success: update all three.
- On transient failure: keep
value, updatequalityto stale, and settimestampto the last successful time. - On persistent failure: switch the tag group to read-only mode and stop attempting writes that could cause unintended state changes.
This prevents a control loop from “chasing ghosts” during a network hiccup.
Concrete Example: OPC UA Subscription Gap Handling
With OPC UA, subscriptions can experience publish gaps. When a monitored item reports bad quality or when your application detects that the last update is older than an allowed age, you should treat the item as stale rather than assuming it is still valid. If the item drives a command decision, require a fresh read or a separate confirmation path before acting.
Advanced Details That Prevent Cascades
Backoff and circuit breakers. If Modbus timeouts spike, reduce polling frequency for that device to avoid saturating the network and the gateway thread pool. Similarly, if an OPC UA session repeatedly fails, stop reconnect attempts for a short cooldown window and keep serving cached data with clear quality.
Queue management. For write commands, use bounded queues. When the queue fills, reject new non-critical commands and keep the system responsive. Safety-critical commands should have a separate path with stricter admission rules.
Idempotency and confirmation. If a write is retried after a timeout, you must ensure the device doesn’t apply it twice. Use a command sequence number stored in a dedicated register or variable, and only treat the command as complete after you observe the expected state change.
Mind Map: Decision Rules for Quality and Actions
Summary of the Design Outcome
A robust system degrades in a controlled way: it keeps the right functions running, marks data quality accurately, avoids unsafe retries, and limits the blast radius of each failure. The result is less “everything stops,” more “the system knows what it knows,” which is exactly what operators need when networks misbehave.
9.2 Detecting Stale Data With Quality Indicators and Heartbeats
Stale data is what you get when “the last good value” is still sitting in a variable, but the underlying process has stopped updating. The fix is not just timing; it’s making freshness visible and actionable. In practice, you combine (1) quality indicators that describe the state of the data and (2) heartbeats that prove the communication path is alive even when values don’t change.
Foundational Concepts for Freshness
Start with two clocks: the producer’s update cadence and the consumer’s observation cadence. A value becomes stale when the time since the last successful update exceeds a defined threshold. That threshold should be tied to the expected sampling period plus a margin for jitter and occasional retries.
Quality indicators answer: “Is this value valid, uncertain, or stale?” Heartbeats answer: “Is the system still talking?” Together they prevent two common failures:
- Treating a frozen sensor as a real measurement.
- Treating a healthy communication link as a healthy process.
Defining Quality Indicators That Mean Something
A useful quality indicator has at least three states:
- Good: Updated within the freshness window and passes basic sanity checks.
- Uncertain: Communication is working, but the value is missing, out of range, or derived from incomplete inputs.
- Stale: No update within the freshness window.
Add a fourth state if you need it:
- Bad: The value is invalid due to protocol errors, mapping failures, or explicit device fault flags.
Concrete example: a gateway reads a temperature register every 500 ms. If no update arrives for 1.5 s, mark the OPC UA variable quality as Stale and keep the last numeric value only for diagnostics. Your control logic should ignore numeric value when quality is not Good.
Heartbeats That Separate “No Change” From “No Updates”
Heartbeats are periodic signals that indicate liveness. They can be implemented as:
- A dedicated heartbeat tag updated at a fixed interval.
- A monotonically increasing counter (preferred over a boolean) so the consumer can detect missed intervals.
- An event that triggers even when the measured value is constant.
Concrete example: if a pressure sensor legitimately stays at 2.00 bar for hours, a heartbeat counter still increments every second. If the counter stops changing, you know the communication path is stale even though the pressure value looks steady.
Freshness Windows and Margin Rules
Pick a freshness window that matches the worst-case behavior you actually see. A practical rule is:
- Freshness window = expected period × (number of missed cycles allowed) + jitter margin.
Example: expected period 200 ms, allow 3 missed cycles, jitter margin 100 ms. Freshness window = 200×3 + 100 = 700 ms.
Then implement two timers on the consumer side:
- Time since last update for the value.
- Time since last heartbeat change for liveness.
If heartbeat is stale but value is still updating, you likely have a mapping or tag configuration issue. If heartbeat is good but value is stale, the producer might be stuck on that specific measurement.
Integrated Logic for Quality and Heartbeats
Use a single decision pipeline so quality is consistent across all tags.
- On each successful read or subscription notification, record
lastValueTimeand validate the payload. - On each heartbeat update, record
lastHeartbeatTimeand validate the counter monotonicity. - Compute
valueFresh = now - lastValueTime <= freshnessWindow. - Compute
heartbeatFresh = now - lastHeartbeatTime <= heartbeatWindow. - Assign quality:
- If protocol or mapping error: Bad.
- Else if not heartbeatFresh: Stale for all dependent tags.
- Else if not valueFresh: Stale for that tag.
- Else if sanity checks fail: Uncertain.
- Else: Good.
Example: Modbus to OPC UA Gateway Behavior
Assume the gateway polls Modbus every 500 ms. It exposes OPC UA variables with quality and a heartbeat counter.
TemperatureCquality becomes Stale if no Modbus update arrives for 1.5 s.HeartbeatCounterquality becomes Stale if it stops incrementing for 2.0 s.- If
HeartbeatCounteris stale, the gateway sets Stale quality for all mapped variables, even if some values appear unchanged.
This avoids the “frozen value looks fine” trap and gives operators a clear explanation: the link is quiet.
Mind Map: Freshness, Quality, and Heartbeats
Example: Sanity Checks That Prevent False “Good”
Quality should not be based on timing alone. Add lightweight checks that catch obvious issues without heavy computation:
- Range check using engineering limits.
- Type check for register-to-type conversion.
- Bitfield consistency check (e.g., mutually exclusive status bits).
If a value fails sanity checks, mark it Uncertain even if it arrived on time. That way, “fresh” does not automatically mean “trustworthy.”
Operational Outcome
When freshness logic is implemented this way, consumers can make deterministic decisions: ignore numeric values when quality is not Good, and use heartbeat quality to distinguish “process not changing” from “communication not updating.” The system becomes boring in the best possible way: predictable, explainable, and resistant to silent failure.
9.3 Implementing Reconnect Logic for Sessions and Subscriptions
Reconnect logic is where “it usually works” becomes “it works when the network misbehaves.” The goal is to restore communication without breaking control semantics, duplicating commands, or flooding devices with retries.
Foundational Concepts for Reconnect Behavior
A reconnect attempt typically happens at two layers: the transport/session layer and the data delivery layer.
- Session layer: For OPC UA, a client session may be lost, requiring a new session establishment. For Modbus-over-TCP gateways, the TCP connection may drop and must be re-established.
- Subscription layer: Even if the session returns, subscriptions may need to be recreated, or at least republished, depending on the server behavior.
A practical design starts with a state machine that tracks what is safe to retry. Reads are usually safe to retry; writes and commands require extra care.
Reconnect Strategy That Respects Semantics
Use a two-phase approach:
- Recover connectivity: Recreate the session or TCP connection.
- Recover data delivery: Restore subscriptions and monitored items.
During recovery, keep the application behavior deterministic:
- Mark incoming values as stale and stop using them for control decisions.
- Queue outgoing writes/commands with an explicit policy: either block until recovery completes or allow only idempotent writes.
A simple rule helps: never assume the first message after reconnect corresponds to the last known state. Treat the first post-reconnect update as a new observation.
Backoff, Jitter, and Retry Budgets
Reconnect storms are common when many clients restart at once. Implement:
- Exponential backoff with a maximum delay.
- Jitter so clients do not retry in lockstep.
- Retry budget per outage window to avoid infinite loops.
Example policy for an OPC UA client:
- Retry delays: 1s, 2s, 4s, 8s, then cap at 30s.
- Stop after 10 attempts, then require manual intervention or a higher-level restart.
Session Recovery Steps for OPC UA
When the session is lost, the client should:
- Detect loss via service call failures or keep-alive timeouts.
- Stop subscription processing and clear “data is fresh” flags.
- Create a new session.
- Recreate subscriptions and monitored items.
- Resume publishing and re-enable application consumers.
If your server supports it, you can reuse configuration (sampling interval, publishing interval, queue size). Still, assume subscription identifiers may change.
Subscription Recovery Steps for Monitored Items
Subscriptions can fail independently from the session. After reconnect:
- Recreate subscriptions with the same parameters.
- Re-add monitored items using stable node identifiers.
- Validate that the server acknowledges the monitored items.
To prevent confusion, keep a generation counter in your client. Increment it on each reconnect. Tag each received data change with the generation; discard updates from older generations.
Idempotent Writes and Command Acknowledgment
Reconnect logic must not accidentally re-issue a non-idempotent command.
Use one of these patterns:
- Command acknowledgment: Send a command with a unique correlation id, then wait for a confirmation signal (status variable change or method result). After reconnect, resend only if confirmation is missing and the command is safe to repeat.
- Write verification: For setpoint writes, read back the target value and only resend if it does not match the intended state.
If you cannot verify, block writes during recovery. It is better to pause than to guess.
Mind Map: Reconnect Logic for Sessions and Subscriptions
Example: Minimal Pseudocode for a Safe Reconnect Loop
state = READY
generation = 0
retry = 0

onConnectionLost():
  state = RECOVERING
  generation += 1
  markAllDataStale()
  stopSubscriptionProcessing()
  retry = 0
  scheduleReconnect()

scheduleReconnect():
  if retry >= MAX_RETRIES: failRecovery(); return
  delay = min(BASE * 2^retry, MAX_DELAY) + randomJitter()
  wait(delay)
  retry += 1
  if establishSession():
    if recreateSubscriptions():
      state = READY
      resumeSubscriptionProcessing()
Example: Generation Counter for Data Freshness
onDataChange(update):
  if update.generation != generation:
    discard(update)
  else:
    markFresh(update)
    publishToApplication(update)
Operational Checks That Prevent Subtle Bugs
After reconnect, verify three things before re-enabling control logic:
- Freshness: at least one monitored value arrived in the current generation.
- Completeness: all required monitored items are active.
- Consistency: command acknowledgments match the intended correlation ids or verified values.
This turns reconnect from a “best effort” into a controlled workflow, where the system either resumes safely or stays conservative until it can do so.
9.4 Managing Idempotency and Duplicate Command Effects
Idempotency means that repeating the same command does not change the final outcome after the first successful application. In industrial systems, duplicates happen for boring reasons: timeouts, retries, gateway buffering, or a client not knowing whether a write succeeded. The goal is to make “retrying” safe, so operators and automation logic can recover without guessing.
Foundational Concepts That Prevent Duplicate Damage
A command typically has three parts: intent (what to do), target (where to do it), and parameters (how to do it). Duplicates usually repeat intent and parameters, but they may arrive after the system has already moved to the next state.
To manage this, you need two layers:
- Application-level idempotency: the receiving component recognizes repeated requests and suppresses re-execution.
- State-aware command handling: the receiving component checks whether the requested transition is already achieved.
A practical rule: if the command changes a physical state, treat it like a state transition, not a raw “write and hope.”
Idempotency Keys and Request Identity
Use an idempotency key that uniquely identifies a command attempt. The key can be derived from a client-generated sequence number plus a source identifier. The gateway or device controller stores the last processed key per command category (or per target).
Example: a “Start Pump” command includes idempotencyKey = <lineId>-<pumpId>-<sequence>. If the same key arrives again, the controller returns the prior result instead of reissuing the start logic.
If you cannot add a key to the protocol payload, you can still approximate identity by combining fields that already exist, such as command type, target address, and a monotonic sequence embedded in a separate register.
State Checks That Make Retries Safe
Even with keys, you should also implement state-aware guards. Consider a pump with states: Stopped, Starting, Running, Stopping.
- If a “Start Pump” command arrives while the pump is already
Running, the correct behavior is to acknowledge success without changing anything. - If it arrives while
Starting, you can acknowledge “in progress” and avoid restarting the motor.
This prevents duplicates from causing repeated transitions, which is especially important when the command triggers side effects beyond the immediate write.
Mind Map: Idempotency and Duplicate Command Effects
Example: Modbus Write Command with Verification
Assume a Modbus gateway exposes a control register 40001 for StartPump with values 0=Stop, 1=Start. A naive implementation writes 1 and assumes success.
A safer pattern:
- The client writes
StartPumpRequestincluding an idempotency sequence in a companion register, e.g.40002. - The gateway forwards to the controller.
- The controller checks:
- If the idempotency key was already processed, return the stored result.
- If pump state is already
Running, treat the request as successful.
- The controller updates
StartPumpStatusregister40003toRunningorInProgress.
If the client times out and retries, it writes the same sequence again. The controller suppresses re-execution and the status remains consistent.
Example: OPC UA Method Call with Idempotent Execution
For OPC UA, use a method like StartPump(idempotencyKey, targetId). The server keeps a small cache mapping (targetId, idempotencyKey) to the last result.
When a duplicate method call arrives:
- The server returns the cached result immediately.
- It does not re-trigger the start logic.
If the method includes an output like executionState, the server can return Running even if the call is repeated after the pump already started.
Advanced Details Without the Usual Hand-Waving
Cache scope matters. Store idempotency history per target and per command type, not globally. Otherwise, a repeated key for one device could suppress a legitimate command for another.
Retention policy matters too. Keep keys long enough to cover the maximum retry window and any gateway buffering delays. If the key store is cleared on restart, you must ensure the client does not reuse keys across restarts, or you must fall back to state-aware guards.
Result consistency matters. If the first attempt partially executed and then failed, the cached result must reflect the actual final state. That means the server should only mark a key as “processed” after it reaches a stable outcome (for example, after the pump transitions to Running or after an interlock blocks the action).
Practical Checklist for Implementers
- Use an idempotency key that survives retries.
- Cache results per target and command type.
- Add state-aware guards for already-achieved transitions.
- Cache only after reaching a stable outcome.
- Ensure restart behavior does not accidentally treat new commands as duplicates.
When done well, retries become boring: the system either repeats nothing or repeats exactly what is safe, and the client gets a consistent answer every time.
9.5 Building Operational Runbooks for Fault Diagnosis and Recovery
Operational runbooks turn “something is wrong” into a repeatable sequence of checks, decisions, and actions. The goal is not to guess faster; it is to reduce ambiguity so the next person can follow the same logic and reach the same conclusion.
Runbook Foundations and Scope
Start by defining what the runbook covers: which gateway, which protocols, which data flows, and which failure modes. A good scope statement prevents the classic problem where the runbook is technically correct but operationally useless.
Include these baseline elements:
- System boundaries: where Modbus ends, where OPC UA begins, and where the gateway translates.
- Roles and permissions: who can restart services, who can change configuration, and who can approve security changes.
- Safety constraints: which writes are allowed during recovery and which require manual confirmation.
Mind Map: Fault Diagnosis and Recovery
Runbook Mind Map
Stepwise Triage Logic That Actually Works
Use a consistent order: detect → localize → classify → verify evidence → act.
- Detect: confirm the symptom with at least two signals. For example, “OPC UA variable quality is bad” plus “gateway reports Modbus timeout” is stronger than either alone.
- Localize: determine whether the issue is on the Modbus side, the OPC UA side, or the gateway translation layer.
- Classify: map the symptom to a fault category. If the gateway logs show repeated timeouts for a specific unit ID, treat it as connectivity or device availability. If OPC UA shows “Bad_IdentityTokenRejected,” treat it as security.
- Verify evidence: check counters and recent events. If Modbus errors spike only for one function code, focus on that operation’s register map or endianness.
Recovery Playbooks by Fault Category
Connectivity and Availability
Symptoms: timeouts, connection resets, stale data, or subscription keep-alive failures.
- Action: restart the smallest component first (gateway communication module before the whole service).
- Retry policy: retry with backoff and a maximum attempt count to avoid hammering a struggling device.
- Verification: confirm at least one successful read cycle and that OPC UA quality transitions back to good.
Example: If Modbus TCP reads fail for holding registers, verify the gateway can reach the device IP, then confirm the unit ID and port. After restart, validate by reading a known register that should hold a stable value.
Protocol and Mapping Errors
Symptoms: values are consistently wrong, scaling is off, bit fields don’t match expected states, or control commands don’t take effect.
- Action: compare the gateway mapping configuration to the device register specification.
- Focus: endianness, word order, signed vs unsigned, and bit packing.
- Verification: perform a read-back check after any write, and compare against expected engineering units.
Example: A 32-bit float stored across two 16-bit registers might appear as a “reasonable” but incorrect number if word order is swapped. The runbook should instruct operators to test both word orders using a calibration value.
Security and Authorization Failures
Symptoms: OPC UA session establishment fails, certificate trust errors appear, or authentication is rejected.
- Action: do not retry indefinitely. Validate trust configuration and credentials.
- Safety: block control writes until authentication is restored.
- Verification: confirm session creation and that subscriptions can be created without errors.
Example: If only one client identity fails while others work, the runbook should direct the operator to check that client’s certificate mapping and permissions rather than restarting everything.
Control Path Failures and Idempotency
Symptoms: commands are sent but acknowledgments never arrive, or repeated writes cause unintended effects.
- Action: require a command acknowledgment workflow. The runbook should specify the exact sequence: write command → wait for “in-progress” → wait for “done” or “error” → verify final state.
- Idempotency rule: include a command ID or sequence number where possible, so retries don’t re-trigger actions.
- Verification: confirm the controlled output state via a separate status register or OPC UA variable.
Runbook Templates for Consistent Execution
Use a repeatable structure for each fault:
- Trigger: what alarm or log line starts the process.
- Impact: which tags or control functions are affected.
- Checks: the exact evidence to collect.
- Decision: the branching criteria.
- Recovery: the ordered actions.
- Stop Conditions: when to stop and escalate.
- Verification: what “good” looks like.
Example Runbook Entry
Trigger: “OPC UA subscription keep-alive missed” and “Modbus timeout reading register block A.”
- Impact: telemetry tags mapped from register block A.
- Checks: confirm device reachability, confirm unit ID, confirm gateway mapping for block A.
- Decision: if only block A fails, treat as mapping or register range issue; if all blocks fail, treat as connectivity.
- Recovery: restart Modbus communication module; if still failing after two attempts, switch gateway to safe mode and escalate.
- Verification: confirm one successful read of a known register in block A and that OPC UA quality returns to good.
Operational Notes and Change Discipline
Record the runbook version, the last update date (for example, 2026-02-15), and the evidence used during recovery. After each incident, update the runbook with the specific failure signature and the most reliable verification step. This keeps the runbook from becoming a museum exhibit and ensures the next troubleshooting session starts with better information.
10. Data Quality Semantics and Interoperability Practices
10.1 Handling Scaling Offsets Units and Engineering Conventions
Industrial data rarely arrives as “engineering-ready.” A raw register might be an integer count, a bit-packed status, or a scaled measurement. Your job is to convert it into a value with the right unit, the right magnitude, and the right meaning—consistently across Modbus, OPC UA, and the applications that consume them.
Core Concepts That Prevent Confusing Numbers
Start with three facts for every signal: the raw representation, the engineering representation, and the convention that links them.
- Raw representation: what the device stores, such as a 16-bit unsigned register holding 0…65535.
- Engineering representation: what engineers expect, such as temperature in °C or pressure in bar.
- Engineering convention: the mapping rule, typically scale and offset, plus unit and rounding behavior.
A common mapping is:
engineering_value = (raw_value × scale) + offset
If the device uses a different order, document it explicitly. For example, some systems apply offset before scaling; the difference matters when scale is not 1.
Units and Scaling: Make Them Explicit, Not Implicit
Units are not decoration. They determine how downstream logic interprets thresholds, alarms, and calculations.
Best practice is to treat unit metadata as part of the data contract. In OPC UA, that means assigning the correct unit to the variable and ensuring the engineering value matches that unit. In Modbus, the unit may not exist in the protocol, so you must carry it in your gateway configuration or mapping layer.
Example: A pressure sensor reports “counts” where 1 count equals 0.01 bar, and the sensor is calibrated so that raw 1000 corresponds to 0 bar.
- raw_value = 1000
- scale = 0.01 bar/count
- offset = 0 bar − (1000 × 0.01 bar/count) = −10 bar
- engineering_value = (1000 × 0.01) + (−10) = 0 bar
If you skip the offset, you’ll get 10 bar instead of 0 bar, and the error will look like a calibration issue rather than a mapping issue.
Engineering Conventions That Matter in Practice
Sign, Type, and Register Interpretation
Scaling is meaningless if the raw value is interpreted incorrectly. Decide whether the register is unsigned or signed, and whether it uses two’s complement for negative values.
- If a temperature can be −40…125 °C, the raw register must be treated as signed.
- If a flow counter only increases, treat it as unsigned and handle wraparound at the device’s maximum.
Word Order and Multi-Register Values
For 32-bit values split across two 16-bit Modbus registers, word order and byte order can flip the magnitude. Scaling then “works” but produces nonsense.
A practical approach is to validate mapping with at least two known points: one near zero and one near the top of the expected range. If both are wrong by a consistent factor, scaling is likely wrong; if one is wildly wrong, word order is likely wrong.
Rounding and Quantization
Devices often quantize measurements. Your gateway should define how it rounds engineering values.
- If the device scale is 0.1 °C/count, then one count is the smallest step.
- Rounding engineering values to one decimal place is usually consistent with the device resolution.
Avoid rounding too early. Keep full precision in intermediate calculations, then round only when presenting values or comparing against thresholds.
Mind Map: Scaling, Offsets, Units, and Conventions
Example: From Modbus Registers to OPC UA Values
Assume a Modbus holding register 40001 stores a scaled temperature as an unsigned 16-bit value with:
- scale = 0.1 °C/count
- offset = −40 °C
- valid raw range = 0…1650
Steps:
- Read raw_value from Modbus.
- Validate raw_value is within 0…1650; if not, mark the OPC UA value quality as bad and avoid applying the transform.
- Compute engineering_value = (raw_value × 0.1) + (−40).
- Round to one decimal place (because 0.1 °C is the quantization step).
- Set OPC UA variable unit to °C and publish the engineering_value.
If raw_value = 600:
- engineering_value = (600 × 0.1) − 40 = 60 − 40 = 20.0 °C
That single number now carries the right unit, the right magnitude, and a predictable rounding behavior.
Practical Checklist for Consistent Conversions
- Confirm signedness and register width before scaling.
- Confirm word/byte order for multi-register values.
- Record the exact formula and the order of operations.
- Attach units in the integration layer where the protocol lacks them.
- Validate with known reference points and check both low and high ends.
- Define rounding rules based on the device’s quantization step.
- Propagate quality when raw values are out of range or invalid.
When these conventions are consistent, scaling stops being a “math detail” and becomes a reliable part of your system’s meaning.
10.2 Representing Status Conditions and Alarm States Consistently
Status conditions and alarm states are the two places where systems tend to disagree in subtle ways: one system says “running,” another says “ready,” and a third says “faulted but recovering.” Consistency comes from treating status as a defined set of meanings, not as free-text labels.
Foundational Concepts for Meaning
A status condition answers: “What is the current condition of this asset or function?” An alarm state answers: “Is there a condition that requires attention, and what is its severity and lifecycle?”
To keep them consistent, separate three layers:
- State meaning: the agreed semantics (e.g., Running, Stopped, Faulted).
- State representation: how the meaning is encoded (integer, boolean, enumerated string, OPC UA status code).
- State lifecycle: how it moves over time (active, acknowledged, cleared).
A practical rule: status conditions should change frequently and predictably; alarm states should change only when attention-worthy thresholds or logic evaluate to true.
A Common Status Model
Use a small, stable enumeration for status conditions. For example:
- 0 = Unknown
- 1 = Stopped
- 2 = Starting
- 3 = Running
- 4 = Paused
- 5 = Faulted
Then define alarm states as a separate enumeration:
- 0 = No Alarm
- 1 = Active
- 2 = Acknowledged
- 3 = Cleared
This separation prevents the classic mismatch where a “faulted” status is treated as an alarm without lifecycle handling.
Mapping Across Modbus and OPC UA
Modbus often exposes status as registers or bitfields. OPC UA often represents status via variables, enumerations, and quality/status codes.
A consistent mapping strategy looks like this:
- Modbus register holding status condition value maps to an OPC UA enumeration variable.
- Modbus bitfield for alarm active maps to an OPC UA alarm state variable.
- OPC UA quality/status code should reflect communication and data validity, not the plant’s meaning. If the device is faulted, that is a status condition; if the gateway can’t read it, that is a quality issue.
Example: If a Modbus read fails, do not set “Faulted.” Instead, keep the last known status condition and mark the OPC UA variable quality as bad or uncertain.
Mind Map: Consistent Semantics
Concrete Example with Clear Logic
Assume a pump has:
- Status condition register:
40001(0–5) - Alarm bits in
30010where bit 0 is Overtemperature
Logic:
- If
40001 = 3, the pump is Running. - If bit 0 of
30010is set, the alarm state becomes Active. - If the operator acknowledges the alarm in the HMI, the alarm state becomes Acknowledged while the status condition may remain Running.
- When the overtemperature bit clears, the alarm state becomes Cleared; the status condition may move to Faulted if the device latched a fault.
This example shows why alarm lifecycle must be independent from status condition. Acknowledgment is a human workflow step; status condition is a device condition.
Advanced Details That Prevent Inconsistency
1. Define precedence rules. If multiple alarm conditions are true, decide how to represent the “current alarm state” for each alarm category. Keep categories separate rather than forcing everything into one number.
2. Use stable identifiers. Enumerations should not change meaning over time. If you must add values, append them and keep old values intact.
3. Treat “Unknown” as a real state. When the device is not yet initialized or the gateway has not received valid data, set status condition to Unknown rather than guessing.
4. Keep timestamps aligned with meaning. Status condition timestamps should reflect when the device condition was observed. Alarm timestamps should reflect when the alarm logic evaluated to active or cleared.
5. Validate with a small truth table. Before integration, write down what each combination of status condition and alarm bits should produce in the target model. For instance, “Faulted + No Alarm” might be valid if the fault is informational and not attention-worthy.
Practical Checklist for Consistent Output
- Status condition is an agreed enumeration with fixed meanings.
- Alarm state has lifecycle semantics separate from status.
- Communication quality never masquerades as plant meaning.
- Last known values are preserved when reads fail, with quality updated.
- Alarm evaluation timestamps match the lifecycle transitions.
When these rules are followed, integrations stop arguing about labels and start sharing the same meanings—quietly, reliably, and with fewer surprises during commissioning.
10.3 Normalizing Time Stamps and Synchronization Across Systems
Time stamps look simple until you try to compare them across devices, protocols, and time sources. Normalization is the process of turning “whatever time each system reports” into “a consistent meaning you can reason about.” The goal is not perfect time; it is consistent time.
Foundational Concepts for Time Meaning
A time stamp always has at least four properties: the time value, the time scale, the time zone or offset handling, and the reference quality. In industrial systems, the time value might come from a device clock, a gateway, or a controller. The time scale might be UTC, local time, or an unspecified “device time.” If you ignore these properties, you can end up with correct-looking numbers that still sort events incorrectly.
A practical rule: treat every incoming time stamp as “untrusted until normalized.” Normalization should convert to a single canonical representation, typically UTC with an explicit offset policy and a quality indicator.
Canonical Time Representation and Quality Indicators
Choose one canonical format for your integration layer. A common choice is UTC epoch milliseconds plus a quality field. Quality should capture whether the time is synchronized, estimated, or stale. For example, a gateway can attach a quality code based on whether it has a valid time source and whether the device clock drift exceeds a threshold.
Example: if a Modbus register provides a “seconds since boot” value, you cannot directly compare it to an OPC UA event time. You must anchor it to a known reference (such as gateway receive time) and mark the resulting time as derived.
Synchronization Strategies That Actually Work
Synchronization usually means one of three approaches:
- Central time source: a gateway or time server provides time to clients and devices.
- Device time with validation: devices maintain their own clocks, and the gateway validates drift.
- Event-time approximation: when true synchronization is unavailable, you use receive-time or sequence-time with clear labeling.
For Modbus polling, event time is often approximated by the poll cycle. For OPC UA subscriptions, you may receive data change notifications with server-side time. Normalization should preserve both: the “source time” and the “integration time.” That way, you can choose which one to use for ordering and which one to use for latency measurement.
Mapping Time Semantics Between Modbus and OPC UA
Modbus commonly provides timestamps as registers only if the device supports it; otherwise, you infer timing from polling. OPC UA can carry server timestamps for data changes and event timestamps for alarms and events.
Normalization should define a mapping contract:
- Source time: the time reported by the device or server.
- Gateway time: the time when the gateway processed the message.
- Canonical time: the normalized UTC time used for storage and correlation.
When a Modbus value is polled, set canonical time to gateway receive time unless the device provides a valid timestamp register. When OPC UA provides server time, canonical time should use server time converted to UTC, while gateway time remains available for diagnostics.
Mind Map: Time Normalization Workflow
Validation Rules and Plausibility Checks
Normalization should include checks that catch common integration mistakes.
- Monotonicity: if a device reports decreasing times for successive samples, treat the later sample as suspect.
- Reasonable bounds: reject timestamps far in the past or future relative to gateway time.
- Drift detection: if device time differs from gateway time beyond a configured window, mark quality as derived and keep both timestamps.
Example: a device reports “2026-02-15 10:00:00” but the gateway is receiving data around “2026-02-15 10:30:00.” If the device is supposed to be synchronized, you flag the timestamp quality as stale and still store canonical time using gateway receive time.
Example: Correlating an Alarm with a Process Value
Suppose an OPC UA alarm event arrives with server time T_event, and a process value update arrives via subscription with server time T_value. To correlate them:
- Normalize both to canonical UTC.
- Compute
Δ = T_value - T_event. - Use quality to decide whether to trust ordering.
If T_event quality is derived (for example, the server time was unsynchronized), you still compute Δ, but you treat correlation as “approximate” by relying more on gateway time for ordering.
Example: Polling-Based Timing for Modbus
A Modbus gateway polls every 200 ms. If the device does not provide timestamps, canonical time becomes gateway receive time. To avoid misleading latency calculations, store the poll interval as metadata and compute “sample age” as gateway_receive_time - previous_poll_time rather than pretending the value changed exactly at receive time.
Operational Guidance for Consistent Storage
Store three fields for each record: canonical UTC time, source time, and gateway time. This makes later troubleshooting straightforward because you can answer: “What did the device think time was?” and “When did we actually see it?” The extra fields prevent the classic problem where you only keep one time stamp and later discover it was the wrong one for the question you’re trying to answer.
10.4 Ensuring Type Safety With Variants And Register Conversions
Type safety in industrial integrations is mostly about refusing to guess. When you convert Modbus register data into OPC UA Variant values, you want every conversion to be explicit, validated, and reversible enough to debug. This section focuses on the practical mechanics: how to represent types safely, how to convert registers without surprises, and how to keep the resulting Variant values consistent with the OPC UA data model.
Foundations: Variants, Types, and Register Reality
OPC UA uses Variants to carry a value plus a specific data type. A Variant that says “I am a Float” should actually contain a Float, not an integer that merely looks like one. Modbus registers, on the other hand, are just 16-bit words. Any meaning—signedness, scaling, byte order, bit packing—must be reconstructed.
A safe design therefore separates three layers:
- Wire representation: Modbus words (16-bit each).
- Conversion rules: how words become a numeric or boolean value.
- Semantic type: the OPC UA data type and the expected units/range.
If any layer is implicit, you eventually get a value that is “technically valid” but semantically wrong.
Mind Map: Type Safety Workflow
Register Conversion Rules That Don’t Lie
1) Assemble Multi-Word Values Deterministically
For a 32-bit value from two Modbus registers, define a single canonical mapping. For example, if you expect big-endian word order and big-endian byte order, then:
- Register A contains the high 16 bits.
- Register B contains the low 16 bits.
- Combined value is
(A << 16) | B.
If your device uses swapped word order, you must swap A and B before combining. The key is that the rule is configured once, not re-inferred per data point.
2) Apply Signedness Before Scaling
Signedness affects the raw integer interpretation. If you treat a two’s complement 32-bit value as unsigned, scaling will produce a number that looks plausible but is wrong.
A safe pattern is:
- Combine words into a 32-bit integer.
- Convert to signed if required.
- Then apply scaling and offsets.
3) Convert Bits to Booleans with Explicit Masks
Status registers often pack multiple flags. Instead of converting the whole word to a boolean, extract each bit:
flag = (word & mask) != 0
This keeps the OPC UA Variant type as Boolean and prevents accidental “truthiness” from nonzero values.
Variant Type Safety: Enforce Type Contracts
To ensure the Variant’s data type matches the conversion result, use a contract per signal:
- Expected OPC UA type:
Int16,UInt32,Float,Boolean, etc. - Conversion function: takes raw registers and returns a typed value.
- Validation: checks conversion success and range constraints.
If conversion fails (for example, missing registers or unsupported configuration), set the Variant to a safe default and mark quality/status accordingly, rather than silently producing a number.
Example: Safe Conversion from Two Registers to Float
Assume a device stores a scaled temperature as a signed 32-bit integer with factor 0.1 and offset -40.0. It uses swapped word order.
Conversion steps:
- Read registers
r0andr1. - Swap word order: high word becomes
r1, low word becomesr0. - Combine to 32-bit:
raw = (high << 16) | low. - Interpret
rawas signed 32-bit. - Compute
tempC = raw * 0.1 - 40.0. - Create an OPC UA Variant of type
FloatcontainingtempC.
Given: r0=0x000A, r1=0xFFFE
Swap words: high=0xFFFE, low=0x000A
raw = 0xFFFE000A
Signed raw = -131070
tempC = (-131070 * 0.1) - 40.0 = -13107.0
Variant type = Float, value = -13107.0
Even if the final number is outside a typical operating range, the conversion is still type-correct and traceable. Range checks can then set quality to “bad” without breaking the type contract.
Example: Boolean Flags from a Status Word
Suppose a status register contains:
- Bit 0:
PumpRunning - Bit 3:
FaultActive
If the raw word is 0b00001001:
PumpRunning = (word & 0x0001) != 0→ trueFaultActive = (word & 0x0008) != 0→ true
Each flag becomes its own OPC UA Variant of type Boolean.
Practical Validation Checklist
Before publishing Variants to OPC UA clients, validate these points:
- The conversion rule specifies word order and byte order.
- Signedness is applied before scaling.
- The OPC UA Variant type matches the conversion output type.
- Bit fields are extracted with masks, not by comparing whole words.
- Conversion errors set quality/status rather than returning misleading values.
When these checks are consistent, type safety becomes less of a “best effort” and more of a predictable system behavior—exactly what you want when debugging at 2 a.m. with a packet capture and a coffee that has seen things.
10.5 Documenting Data Contracts for Long Term Maintainability
A data contract is the written agreement between systems about what a value means, how it is encoded, and what quality to expect. In Modbus-to-OPC UA integrations, the contract is what prevents “it worked on the bench” from becoming “it broke in production.” The goal is not to document everything forever; it is to document the parts that must remain stable for correct operation.
Start with the Contract Boundary
Define the boundary first: which system produces the data, which system consumes it, and where the translation happens. For example, a gateway may read Modbus registers from a motor drive and expose OPC UA variables to a supervisory controller. The contract should explicitly list the producer, consumer, and gateway role so that later changes do not silently shift responsibilities.
A practical contract begins with a short “contract header” that includes:
- Scope: which signals are covered
- Transport assumptions: Modbus TCP, serial RTU, OPC UA subscriptions
- Update behavior: polling interval, subscription publishing interval
- Control direction: which signals are read-only versus write-capable
Define the Data Item Template
Use a consistent template for every signal. This makes reviews faster and reduces the chance of missing a detail. A good template includes:
- Identifier: stable name used in both systems
- Source address: Modbus register address or coil index
- OPC UA node mapping: namespace and browse path or node identifier strategy
- Data type: integer, float, boolean, bitfield, enumerated
- Encoding rules: endianness, word order, scaling factor, offset
- Units and semantics: engineering unit and meaning of the value
- Quality indicators: how “invalid,” “stale,” or “out of range” is represented
- Write rules: allowed transitions, required acknowledgments, and safety constraints
- Test vectors: at least one normal value and one boundary value
Here is a compact example for a temperature signal.
| Field | Contract Value |
|---|---|
| Identifier | MotorTemp |
| Source Address | Modbus TCP holding register 40010 |
| OPC UA Mapping | ns=2; s=Motor/Temperature |
| Data Type | Float32 |
| Encoding Rules | Big-endian word order, scale 0.1 °C per count |
| Units and Semantics | Temperature of motor winding |
| Quality Representation | OPC UA StatusCode Bad_Stale if no update in 2× poll interval |
| Write Rules | Read-only |
| Test Vectors | 250 -> 25.0 °C, 0x7FC00000 -> NaN treated as Bad |
Specify Encoding and Conversion Rules Precisely
Most long-term failures come from ambiguous conversion. For Modbus, document register layout and byte/word order in plain language. For example, if two 16-bit registers form a 32-bit float, state whether the first register holds the high word or low word. If scaling is applied, specify whether scaling happens before or after type conversion.
A small but effective rule: every conversion rule should be accompanied by a numeric example. If the contract says “scale by 0.1,” it should also show what raw value 250 becomes.
Define State, Commands, and Acknowledgments
For control signals, the contract must describe behavior over time, not just value meaning. Include:
- Command input: what write triggers the action
- Expected feedback: which readback confirms completion
- Timing expectations: maximum time before feedback must change
- Idempotency: what happens if the same command is written twice
Example command contract for a “Start” action:
- Write to Modbus register 40020 with value 1 triggers start request
- Gateway writes OPC UA method StartMotor with input StartRequested=true
- Completion is confirmed when MotorRunning becomes true within 5 seconds
- If StartMotor is called again while MotorRunning is true, the method returns success without re-triggering
Document Quality and Staleness Rules
A contract should define how the consumer detects “no data.” In OPC UA, this often maps to StatusCode quality and timestamps. State the exact rule: for instance, “mark Bad_Stale if the last successful Modbus read is older than 2× polling interval.” Also specify how the gateway behaves when Modbus returns an error: keep the last value with Bad quality, or clear it, or switch to a defined safe default.
Keep the Contract Machine-Readable Where It Matters
Humans read prose; systems read structure. Even if you store the contract as documentation, mirror key fields in a structured form used by the gateway configuration. This reduces drift between “what the docs say” and “what the code does.”
Example contract snippet for a gateway mapping configuration:
signals:
  - id: MotorTemp
    modbus:
      type: holding
      address: 40010
      registers: 2
    opcua:
      node: ns=2;s=Motor/Temperature
      datatype: Float
    transform:
      encoding: float32
      word_order: big
      scale: 0.1
      offset: 0
    quality:
      stale_after_ms: 2000
    access: read
Mind Map: Contract Contents
Versioning and Change Logs That Don’t Lie
Include a version number and a change log entry format. Each change should state what was modified, which signals it affects, and what compatibility impact it has. If a scaling factor changes, the contract should say whether old values remain interpretable or whether consumers must update immediately.
A simple rule: if the gateway configuration changes, the contract version changes too. That way, troubleshooting can start with “which contract version was deployed,” not “which engineer remembers what happened.”
Close the Loop with Acceptance Tests
Finally, tie the contract to tests. For each signal, define at least one test vector that checks encoding, scaling, and quality behavior. For control signals, add a scenario test that verifies command-to-feedback timing and idempotency. When the contract and tests agree, long-term maintainability becomes a property of the system, not a hope held together by documentation.
11. Implementation Patterns and Integration Examples
11.1 Building a Modbus Polling Service with Batching and Caching
A Modbus polling service is the part of your system that turns “what the plant is doing” into “what your application can reliably use.” The tricky part is that Modbus is request/response and often slow compared to how frequently your application wants updates. Batching reduces the number of requests, while caching reduces the number of times you re-send data that hasn’t changed.
Core Goals and Constraints
Start by writing down three measurable goals:
- Freshness: how old a value may be when the application consumes it.
- Coverage: which registers must be read and how often.
- Stability: how the service behaves when devices are slow or unreachable.
Then translate them into constraints:
- Prefer fewer, larger reads over many small reads, but keep request sizes within device limits.
- Avoid hammering the network with unchanged values.
- Ensure writes and reads don’t fight each other for the same registers.
Data Model for Polling
Represent each polled item with metadata that drives batching and caching:
- Address: Modbus register address (and unit id for Modbus TCP).
- Type: 16-bit register, 32-bit pair, or bit field mapping.
- Scale and offset: convert raw values to engineering units.
- Read Group: which batch it belongs to.
- Cache Policy: when to refresh even if unchanged.
A practical rule: group by contiguous address ranges and by function code (typically holding registers). If you need mixed types, keep them inside the same contiguous range and decode after the read.
Batching Strategy That Actually Works
Batching is about forming read ranges that minimize wasted bytes. Suppose you need registers 40001–40010 and 40020–40025. Two reads are better than one huge read that includes 40011–40019 unless you truly need those middle registers.
Use a simple range builder:
- Sort items by address.
- Start a new range when the gap between consecutive addresses exceeds your threshold.
- Cap each range by a maximum register count.
Here’s a compact example of range building logic.
def build_ranges(addresses, max_gap=3, max_len=20):
    # Addresses: Sorted List of Register Addresses
    ranges = []
    start = prev = addresses[0]
    for a in addresses[1:]:
        gap = a - prev
        length = a - start + 1
        if gap > max_gap or length > max_len:
            ranges.append((start, prev))
            start = a
        prev = a
    ranges.append((start, prev))
    return ranges
Caching Strategy That Avoids Stale Surprises
Caching should not mean “never update.” It means “update only when it matters.” Use two layers:
- Value Cache: last decoded engineering value and last raw registers.
- Quality Cache: last successful read time, communication status, and optional heartbeat.
A good policy is:
- If the raw registers are identical to the last raw registers, skip downstream processing.
- Still refresh on a maximum staleness interval so the application can recover from missed changes.
For bit fields, compare the full underlying register(s) so you don’t accidentally miss a change masked by decoding.
Polling Loop Design
A polling loop typically has three phases per cycle:
- Plan: choose which ranges to read this cycle.
- Execute: send Modbus requests with timeouts and retry rules.
- Publish: decode results, update caches, and emit only meaningful changes.
To keep latency predictable, avoid reading every range every cycle. Instead, assign each range a poll period (for example, fast for commands and slow for diagnostics). Then schedule ranges by next due time.
Mind Map: Polling Service Architecture
Example: Two Ranges with Different Poll Rates
Imagine you read:
- Range A: registers 40001–40010 (poll every 200 ms)
- Range B: registers 40050–40060 (poll every 2 s)
Batching forms two ranges. Caching then prevents repeated publishing when Range A values stay constant between cycles. If Range B hasn’t changed for a while, downstream consumers still get a periodic “quality refreshed” update at the staleness interval, even though the engineering values remain the same.
Advanced Details Without the Headaches
- Decode deterministically: define endianness and word order once, then apply it consistently.
- Handle partial failures: if one range times out, keep cached values but mark quality degraded for those items.
- Avoid write/read collisions: if your service also writes, serialize access per unit id and consider reading back only the registers that were written.
A polling service that batches and caches well is less about cleverness and more about disciplined bookkeeping: ranges are planned, raw results are compared, and only meaningful updates move through the system.
11.2 Building an OPC UA Client with Subscriptions and Monitored Items
An OPC UA client becomes useful when it can receive timely updates without constantly polling. Subscriptions and monitored items provide that push-style delivery: the client tells the server what it wants to watch, and the server sends notifications when values change or when a keep-alive condition is met.
Core Concepts You Need Before Writing Code
A subscription is a container for delivery settings such as publishing interval and lifetime. A monitored item is a specific data source on the server, identified by a NodeId, with a sampling and filtering strategy. The client receives notifications that include the latest value and metadata such as source timestamp and status.
A practical mental model: the client defines “what to watch” (monitored items) and “how often to check” (sampling) while the server decides “when to send” (publishing and change detection). If you mix these up, you’ll see either unnecessary traffic or delayed updates.
Mind Map: Subscription and Monitored Item Design
Step-by-Step Structure for a Working Client
-
Connect and create a session: establish a secure or non-secure channel, then open a session with the server. Keep the session alive; subscriptions depend on it.
-
Create a subscription: choose a publishing interval that matches your application’s tolerance for latency. A common starting point is 1000 ms for general monitoring, then tighten only where needed.
-
Add monitored items: for each NodeId, set sampling interval and filtering. If you monitor 200 signals with the same sampling interval, you may overload the server’s sampling workload. Group signals by update needs.
-
Handle notifications: parse each notification, verify status codes, and update your internal model. Treat “bad” status as a data-quality event, not as a normal value.
-
Manage queues: if notifications arrive faster than your client can process them, the server uses the monitored item queue settings. A small queue with discarding keeps the client current; a larger queue preserves history but increases memory and latency.
Concrete Example: Monitoring a Small Set of Signals
Imagine a packaging line where you care about:
MotorSpeed(changes frequently)BatchCount(changes occasionally)AlarmActive(binary state)
You can create one subscription for all three, but tune monitored items individually:
MotorSpeed: sampling 200 ms, deadband 0.5 rpm to avoid tiny jitterBatchCount: sampling 1000 ms, no deadbandAlarmActive: sampling 500 ms, deadband not needed because it’s discrete
This avoids the common mistake of using one sampling interval for everything.
Example: Minimal Client Flow in Pseudocode
connect(endpoint)
session = createSession()
sub = createSubscription(publishingInterval=1000, lifetime=60000)

item1 = createMonitoredItem(nodeId=MotorSpeed,
  samplingInterval=200, deadband=0.5, queueSize=10)
item2 = createMonitoredItem(nodeId=BatchCount,
  samplingInterval=1000, queueSize=5)
item3 = createMonitoredItem(nodeId=AlarmActive,
  samplingInterval=500, queueSize=5)

sub.addMonitoredItem(item1)
sub.addMonitoredItem(item2)
sub.addMonitoredItem(item3)

sub.onNotification(function(notification){
  for each value in notification.values:
    if value.status is Good:
      updateModel(value.nodeId, value.value, value.sourceTimestamp)
    else:
      markQualityBad(value.nodeId, value.status)
})
Filtering and Deadband: Make Updates Useful
Deadband is a practical tool for analog signals. If MotorSpeed fluctuates by 0.1 rpm due to measurement noise, deadband prevents notifications for changes that don’t matter. For discrete signals like AlarmActive, deadband is unnecessary because the value either changes or it doesn’t.
When you apply filters, confirm they match your units and scaling. If the server exposes a scaled engineering value, deadband should be in engineering units. If it exposes raw counts, deadband must be in raw units. Mixing these is how you end up with “updates that never arrive.”
Handling Timestamps and Status Codes
Each notification typically includes a source timestamp (when the server observed the value) and a server timestamp (when the server packaged it). Use source timestamp for ordering and latency calculations, and use status codes to decide whether to trust the value.
A simple rule: update your application state only when status is good; otherwise, keep the last good value and record the quality change separately. That way, your UI and control logic don’t accidentally treat “bad” as “zero.”
Mind Map: Notification Processing Rules
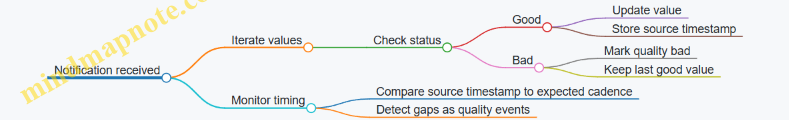
Operational Checklist That Prevents Most Headaches
- Use different sampling intervals per monitored item, not one size fits all.
- Set queue size intentionally; default values often hide backpressure problems.
- Keep notification handlers fast; heavy processing should move out of the callback.
- Log status changes, not every value, to avoid drowning in output.
- Validate NodeIds and permissions during setup so you fail early rather than silently.
With these pieces in place, your OPC UA client can receive change-driven updates reliably, while still keeping network and server load under control.
11.3 Implementing a Read Write Control Workflow With Verification Steps
A read write control workflow is a disciplined loop: read the current state, write a command, verify the outcome, and record evidence. The key idea is simple: treat writes as proposals until verification proves they took effect. This matters for both Modbus and OPC UA because networks drop packets, devices reject invalid values, and control logic can change state between your read and your write.
Workflow Overview
- Read current state: Fetch the process value and the relevant status flags.
- Validate preconditions: Confirm the device is in a state that allows the command.
- Write command: Send the control value or command bit.
- Verify change: Re-read the process value and status, or observe an OPC UA data change.
- Handle failure: If verification fails, stop, report, and avoid repeated blind writes.
- Log and correlate: Store request parameters, timestamps, and verification results.
A practical workflow uses a small state machine in the gateway or application layer. Even if you implement it in a single function, thinking in states prevents “write then hope” behavior.
Preconditions That Prevent Bad Writes
Before writing, check at least three categories of information:
- Permission: A “remote enable” or “operator control” flag.
- Safety interlocks: For example, “door closed” or “pressure within range.”
- Command readiness: A “ready” status or “not busy” flag.
Example: A Modbus coil StartPump should only be written when RemoteEnable is true and PumpFault is false. If PumpFault is set, writing StartPump might be ignored or could trigger a fault escalation.
Verification Strategies That Actually Work
Verification can be done in two ways, often combined:
- State verification: Read back a status bit or a measured value that should change after the command.
- Command acknowledgment verification: Use an explicit “command accepted” flag or a returned status code.
For OPC UA, verification can also use subscription notifications for the same variables you would otherwise poll. Subscriptions reduce latency, but you still verify because notifications can be delayed or missed if the client reconnects.
Mind Map: Read Write Control Workflow
Example: Modbus Start Command with Verification
Assume:
RemoteEnableis a coil.PumpFaultis a coil.StartPumpis a coil.PumpRunningis a coil.
Workflow:
- Read
RemoteEnable,PumpFault, andPumpRunning. - If
RemoteEnableis false orPumpFaultis true, do not writeStartPump. - Write
StartPump = 1. - Wait a short interval (for example, 200 ms to 1 s depending on your process).
- Read
PumpRunningand verify it becomes true. - If it doesn’t, write
StartPump = 0to avoid leaving a latched command, and report failure.
This avoids a common mistake: repeatedly writing StartPump = 1 while the device is faulted or not ready.
Example: OPC UA Method Call with Verification
For OPC UA, a clean pattern is:
- Call a method like
StartPumpwith inputs. - Verify a returned status code and observe a state variable like
PumpRunning.
If the method returns “accepted,” you still verify PumpRunning changes. If the method returns “rejected,” you skip the verification wait and report immediately.
Implementation Pattern with Verification Loop
Use a bounded loop with explicit exit conditions. The loop should stop on success, stop on precondition failure, and stop on verification timeout.
function controlWithVerify(command):
  state = readState()
  if not preconditionsMet(state):
    return fail("preconditions")

  correlation = newId()
  writeCommand(command, correlation)

  for attempt in 1..maxAttempts:
    wait(pollInterval)
    state2 = readState()
    if verificationPasses(state2, correlation):
      return ok(state2)
    if state2 indicates hardFault:
      break

  writeCommand(command, correlation, stop=true)
  return fail("verification timeout")
Verification Details That Prevent Subtle Bugs
- Correlation: If your system supports it, correlate the write with the observed acknowledgment. Without correlation, a delayed response from an earlier command can look like success.
- Timeout choice: Use a timeout that matches the process dynamics. Too short causes false failures; too long slows recovery.
- Idempotency: If you must retry, ensure repeated writes do not cause repeated actions. For example, use momentary command bits that reset after acceptance.
- Quality and status: Treat “bad quality” or “uncertain” data as verification failure, not as “probably fine.”
Case Study: Safe Stop Command
Suppose you implement StopConveyor.
- Preconditions:
RemoteEnablemust be true. - Verification:
ConveyorRunningmust become false.
If ConveyorRunning stays true after the timeout, you do not keep issuing stop commands. Instead, you record the last observed status flags and raise an operator-visible fault. This keeps the control logic honest: the system tried, verification failed, and the evidence is preserved.
11.4 Creating a Gateway Mapping Layer with Configuration Driven Models
A gateway mapping layer translates between Modbus registers and OPC UA nodes without turning your project into a pile of one-off code. The core idea is simple: define a configuration-driven model that describes what each field means, how it is encoded, and how it should behave when values change or commands are issued.
Foundational Concepts That Keep Mappings Honest
Start with three artifacts that work together:
- Source address: where the value lives in Modbus (unit id, register type, offset, bit position).
- Target node: where the value lives in OPC UA (namespace, node id, variable or method, expected data type).
- Transformation rules: how to convert and validate values (scaling, endianness, bit masks, quality/status mapping).
A configuration-driven approach stores these artifacts in a structured format (YAML, JSON, or a database table) and uses a small, stable runtime engine to apply them. The engine should not know your plant’s specifics; it should only execute the rules.
Model Design from Addresses to Semantics
Define a mapping schema that separates concerns:
- Transport mapping: Modbus read/write operations and OPC UA service calls.
- Data mapping: type conversions, scaling, and bit extraction.
- Behavior mapping: polling cadence, subscription update strategy, and command acknowledgment.
- Validation mapping: range checks, required fields, and “reject with reason” behavior.
For example, a Modbus holding register might represent temperature in tenths of degrees Celsius. The transformation rule should explicitly state: raw -> scaled -> engineering units, and the OPC UA variable should declare the engineering unit and valid range.
Mind Map: Configuration Driven Mapping Layer
Gateway Mapping Layer Mind Map
Example: Temperature Register to OPC UA Variable
Assume Modbus holding register 40001 (offset 0) contains temperature in tenths of °C. The OPC UA variable expects a Double in °C with range -40 to 125.
{
  "mappings": [
    {
      "id": "temp_tank_1_c",
      "source": {
        "protocol": "modbus",
        "unitId": 1,
        "registerType": "holding",
        "offset": 0,
        "wordOrder": "big"
      },
      "target": {
        "protocol": "opcua",
        "namespace": 2,
        "nodeId": "ns=2;s=Tank1.TemperatureC",
        "dataType": "Double"
      },
      "transform": {
        "scale": 0.1,
        "offset": 0.0
      },
      "validation": {
        "min": -40.0,
        "max": 125.0,
        "onViolation": "reject"
      },
      "quality": {
        "staleAfterMs": 5000
      }
    }
  ]
}
When the gateway reads the register, it decodes the raw integer, applies scaling, validates the result, and then updates the OPC UA variable with a quality indicator. If the value is out of range, the gateway should not silently clamp it; it should mark the OPC UA variable as bad quality (or reject the update) and include a reason in logs.
Example: Bit Field to OPC UA Boolean with Status
A Modbus register might pack multiple flags. Map each bit to its own OPC UA variable, but keep the source address shared to reduce reads.
{
  "mappings": [
    {
      "id": "pump1_running",
      "source": {
        "protocol": "modbus",
        "unitId": 1,
        "registerType": "holding",
        "offset": 20,
        "bitIndex": 3
      },
      "target": {
        "protocol": "opcua",
        "namespace": 2,
        "nodeId": "ns=2;s=Pump1.Running",
        "dataType": "Boolean"
      },
      "transform": {
        "bitMask": 8
      },
      "quality": {
        "staleAfterMs": 5000
      }
    }
  ]
}
The runtime engine should batch reads by shared register offsets, then fan out decoded bits to multiple OPC UA updates.
Write Path with Verification Without Guesswork
For commands, the mapping must define how to confirm success. A practical pattern is: validate input, encode raw value, write to Modbus, then re-read the relevant register (or read a dedicated status bit) to confirm.
Use a correlation id per command so logs can tie together the OPC UA method call, the Modbus write, and the verification read. If verification fails, update the OPC UA method result status accordingly and keep the error reason precise.
Implementation Checklist That Prevents Common Mapping Bugs
- Type discipline: declare expected OPC UA data types and enforce conversions at the mapping layer.
- Explicit endianness: never rely on defaults for multi-word values.
- Single source of truth: keep scaling and units in the mapping, not scattered across code.
- Batching strategy: group Modbus reads by register ranges to reduce traffic.
- Quality semantics: define stale thresholds and status mapping rules per variable.
If you set up the mapping model on a stable baseline—say, using a configuration snapshot created on 2026-02-18—you can reproduce behavior during commissioning and keep integration tests consistent.
11.5 Producing Integration Artifacts With Naming Conventions And Tests
Integration artifacts are what keep a Modbus-to-OPC UA system understandable after the first demo. They include configuration files, mapping documents, test cases, and small scripts that prove the system behaves the way the documentation claims. The goal is simple: when something breaks, you should be able to trace the symptom to a specific artifact and a specific test.
Naming Conventions That Survive Real Life
Start with a naming scheme that encodes meaning without forcing humans to memorize it. Use the same pattern for Modbus addresses, OPC UA node paths, and test identifiers.
Recommended pattern
- Device:
DEV_<site>_<line>_<asset> - Modbus register:
MB_<addrType>_<start>_<count>whereaddrTypeisHR(holding),IR(input),CO(coil),DI(discrete input) - OPC UA variable:
UA_<namespace>_<object>_<variable> - Test case:
TC_<protocol>_<device>_<feature>_<expected>
Easy example
- Device:
DEV_PLANT1_LINE2_PUMP3 - Modbus holding register range:
MB_HR_40010_2 - OPC UA variable:
UA_2_PUMP3_SpeedRpm - Test:
TC_MODBUS_DEV_PLANT1_LINE2_PUMP3_SpeedRpm_ReadScaling
This structure helps you answer three questions quickly: Which device is this? Which data source is it? Which behavior is being verified?
Artifact Set That Covers Configuration, Mapping, and Proof
A practical artifact set usually includes:
- Mapping specification: a table that links each Modbus register or bit to an OPC UA node, including scaling, units, and quality rules.
- Configuration files: gateway settings, namespace choices, and subscription parameters.
- Test suite: deterministic tests that can run in a simulator or against a known reference device.
- Run log template: a consistent place to record outcomes, timestamps, and deviations.
Mapping specification example (excerpt)
| Modbus Source | OPC UA Target | Type | Scale | Units | Quality Rule |
|---|---|---|---|---|---|
MB_HR_40010_1 | UA_2_PUMP3_SpeedRpm | UInt16 | 0.1 | rpm | Mark bad if no update in 2 cycles |
MB_HR_40020_1 | UA_2_PUMP3_StartCmd | Bool from bit | N/A | N/A | Reject write if device state is not Ready |
Quality rules belong in the mapping spec because they affect both runtime behavior and test expectations.
Mind Map: Artifacts, Naming, and Tests
Test Design That Matches the Mapping
Tests should be written from the mapping spec, not from memory. Each mapping row implies at least one test.
Test categories
- Read tests: verify scaling, type conversion, and quality transitions.
- Write tests: verify command gating, bit packing, and acknowledgment behavior.
- End to End tests: verify that the gateway translates correctly in both directions.
Easy example: scaling test
- Mapping says
SpeedRpm = raw * 0.1. - Test sets Modbus holding register
40010to150. - Expected OPC UA value is
15.0 rpm. - Also verify quality becomes bad if updates stop for the configured number of cycles.
Example Test Case Template
Use a template so every test records the same evidence.
TC_MODBUS_DEV_PLANT1_LINE2_PUMP3_SpeedRpm_ReadScaling
- Preconditions: Gateway connected, namespace 2 enabled
- Input: Set MB_HR_40010_1 raw value to 150
- Expected: UA_2_PUMP3_SpeedRpm equals 15.0 rpm
- Quality: Good after first update, Bad after 2 missed cycles
- Evidence: Gateway log entry ID and captured UA read result
Consistency Checks That Prevent Slow Bugs
Before running a full integration test, perform consistency checks that catch common mistakes:
- Address coverage: every mapping row must reference an existing Modbus address range.
- Type alignment: OPC UA variable type must match the conversion rules in the mapping spec.
- Naming alignment: test identifiers must include the same device and feature names used in the mapping.
These checks are small, but they stop the most time-consuming failures: “the system works, but the documentation doesn’t.”
Practical Acceptance Criteria for Artifacts
Treat artifacts as deliverables with measurable acceptance criteria:
- Mapping spec is complete for all configured nodes.
- Configuration files reproduce the same node names and namespaces.
- Test suite passes and produces a run log with consistent identifiers.
- Every test case references at least one mapping row.
When these conditions are met, the integration becomes easier to maintain because behavior, configuration, and proof all point to the same set of names and rules.
12. Commissioning Testing and Acceptance for Industrial Protocol Systems
12.1 Test Environment Setup With Simulators And Known Reference Devices
A good commissioning test environment answers one question: “Can we trust the results we measure?” That trust comes from controlling variables, using repeatable stimuli, and comparing system behavior against known references. The setup should support both protocol-level checks (frames, services, timing) and integration-level checks (data mapping, scaling, command workflows).
Define Test Scope and Boundaries
Start by listing what you will test and what you will not. For example, you might test Modbus register mapping and OPC UA variable updates, but not the PLC’s internal control logic. Then define boundaries: which components are real, which are simulated, and where the gateway sits. A simple boundary table prevents accidental “testing the wrong thing.”
Example scope statement:
- Real: gateway, test client/server, network capture tooling
- Simulated: Modbus device(s), OPC UA device(s) where needed
- Known reference: a small set of registers and nodes with fixed expected values
Build a Layered Environment
Use a layered approach so failures are easy to localize.
- Physical and network layer: stable cabling, fixed switch ports, deterministic VLAN tagging.
- Protocol layer: Modbus TCP or RTU endpoints, OPC UA endpoints, and gateway translation.
- Data layer: register maps, node models, units, scaling, and status semantics.
- Test harness layer: scripts or test clients that generate reads/writes and validate outcomes.
A practical rule: if you can’t reproduce a failure when only one layer changes, you don’t yet have a test environment—you have a guessing game.
Use Simulators for Repeatable Stimuli
Simulators should generate controlled patterns rather than “random but plausible” values. Build scenarios that cover:
- Normal operation: steady values with expected scaling
- Boundary values: min/max register values and engineering limits
- Fault conditions: timeouts, malformed responses, and stale data triggers
- Command sequences: write-then-read verification and interlock behavior
Concrete example for Modbus:
- Simulator holds holding registers for temperature and a status word.
- Test harness writes a command register to start a process.
- Simulator updates temperature over time and sets status bits when the process completes.
Concrete example for OPC UA:
- Simulator exposes variables with known engineering units and a status variable.
- Test harness subscribes to data changes and verifies sampling and publish timing behavior.
Add Known Reference Devices for Ground Truth
Simulators are great for repeatability, but known reference devices provide ground truth. Choose a small set of reference points that are stable and well understood.
Reference device strategy:
- Pick one Modbus device with a documented register map and known scaling.
- Pick one OPC UA server or device with a stable address space and known node semantics.
- Validate the gateway’s translation by comparing gateway outputs against reference reads.
Example reference checks:
- Modbus register 40001 contains raw temperature 2500 with scaling 0.1 °C, so expected engineering value is 250.0 °C.
- OPC UA variable “Temperature” reports 250.0 °C and a matching quality/status.
Instrument the Environment for Evidence
Testing without evidence turns every issue into a debate. Instrument at three levels:
- Network capture: verify Modbus transactions and OPC UA service calls.
- Gateway logs: correlate request IDs, mapping decisions, and error codes.
- Application assertions: verify values, timestamps, and state transitions.
Keep logs structured so you can filter by scenario name. When a test fails, you should be able to answer: “Which layer disagreed, and when?”
Mind Map: Test Environment Setup
Example Scenario Flow for Commissioning
A systematic scenario flow prevents “random testing.” Use a consistent sequence:
- Baseline read: confirm initial values match reference expectations.
- Stimulus: apply a controlled write or simulated device update.
- Verification: read back through the opposite protocol path.
- Timing check: confirm updates arrive within expected windows.
- Fault injection: simulate timeout or invalid status and verify quality handling.
- Cleanup: reset registers/nodes to baseline and confirm recovery.
Example scenario:
- Baseline: read Modbus temperature and OPC UA temperature via gateway.
- Stimulus: write command register to start process.
- Verification: confirm OPC UA method or command status reflects completion.
- Fault injection: pause simulator updates to trigger stale-data quality.
- Cleanup: restore baseline registers and confirm quality returns to normal.
This structure keeps tests readable, repeatable, and diagnostic—so the environment earns its keep.
12.2 Functional Testing for Reads Writes Events and Methods
Functional testing proves that your protocol mapping does what the spec says, not what the register map spreadsheet hopes. For Modbus and OPC UA integrations, the goal is to verify each interaction type—reads, writes, events, and method calls—while also checking the glue logic: scaling, addressing, data quality, and command acknowledgment.
Test Foundations That Prevent “It Works on My Bench”
Start with a test harness that can generate known inputs and observe outputs deterministically. Use a simulator or a controlled device profile with fixed values for:
- Known register values for Modbus (including boundary addresses and invalid ranges).
- Known OPC UA node values and expected status/quality behavior.
- A repeatable timing model for polling and subscription delivery.
Define a data contract for each signal: source address or node, data type, scaling, units, and expected quality/status. Then define pass criteria per interaction type. Examples:
- Read: returned value equals expected after scaling, and quality is “good” when the source is healthy.
- Write: device state changes only when preconditions are met, and the system reports success with traceable correlation.
- Event: event trigger occurs once per condition, with correct payload and timestamp.
- Method: inputs are validated, execution status is returned, and side effects match the method’s contract.
Mind Map: Functional Testing Coverage
Functional Testing Reads with Concrete Checks
A read test should verify three things: correct target, correct interpretation, and correct metadata.
- Correct target: Read the exact Modbus address range or OPC UA node you mapped. If your gateway maps Modbus holding register 40001 to an OPC UA variable, test both 40001 and the adjacent register to catch off-by-one errors.
- Correct interpretation: For scaling, pick values that reveal mistakes. If the contract says
engineering = raw * 0.1, then raw 123 should yield 12.3. If byte order is wrong, you’ll see a wildly different number. - Correct metadata: For OPC UA, verify status and quality. If the source is unreachable, the gateway should not keep serving the last good value as if it were current.
Example read scenario:
- Setup: Modbus register 40010 contains raw 250.
- Contract:
temperature_C = raw * 0.1. - Expected: OPC UA variable
Temperaturereads 25.0 with good quality. - Negative: set the gateway to simulate a communication failure; expected quality becomes “bad” or “uncertain” per your contract, and timestamps reflect staleness.
Functional Testing Writes with Safety and Verification
Write tests must confirm both the request handling and the resulting device state. Treat writes as transactions with verification.
- Precondition checks: If your system uses an enable bit or mode register, test that writes are rejected when the mode is not “remote.”
- Validation: Attempt writes outside the allowed range. For example, if
Pressuremust be 0–10 bar, write raw values that would map to -1 bar and 11 bar and confirm the system returns an error status. - Acknowledgment and correlation: After a write, read back the affected register or node to confirm the device accepted it. If the gateway uses a command ID, verify the same ID appears in logs and in any acknowledgment variable.
- Retry behavior: Simulate a timeout after the write request is sent. The system should retry safely without causing repeated side effects. A practical way to test idempotency is to write a “setpoint” value that is deterministic and verify the device ends in the correct final state.
Example write scenario:
- Setup: OPC UA method or variable write sets
MotorSpeed. - Contract: Modbus register 40020 expects raw RPM with scaling
raw = rpm * 10. - Test: write 1500 rpm.
- Expected: gateway writes raw 15000 to 40020, then read-back confirms 1500 rpm in OPC UA and the status indicates success.
- Negative: write 20000 rpm; expected error and no change in device state.
Functional Testing Events with Delivery Semantics
Event tests focus on “when” and “what,” not just “that something happened.”
- Trigger conditions: Define a specific threshold crossing or discrete state change. For instance, an alarm bit changes from 0 to 1.
- Delivery semantics: Verify whether events are edge-triggered or level-triggered in your design. Edge-triggered events should fire once per transition; level-triggered events may fire repeatedly until cleared.
- Payload mapping: Confirm event payload fields match the contract: alarm code, severity, and the timestamp source.
- De-duplication: If your gateway polls and synthesizes events, test that repeated polling of the same state does not create duplicate events.
Example event scenario:
- Setup: Modbus coil or status register changes from 0 to 1.
- Expected: OPC UA event is raised exactly once, with the correct alarm ID and a timestamp consistent with the gateway’s event time policy.
- Clear: change back to 0; expected behavior depends on your contract, but it must be consistent and testable.
Functional Testing Methods with Inputs, Status, and Side Effects
Method tests verify the full lifecycle: input validation, execution, status mapping, and resulting state.
- Input validation: Provide valid and invalid inputs. If the method expects a target value and a duration, test missing fields, wrong types, and out-of-range values.
- Execution status mapping: Confirm that method results map to OPC UA status codes or structured result fields. A failed Modbus write should produce a method failure, not a silent “success.”
- Side effects verification: After method completion, verify the underlying Modbus registers or OPC UA variables reflect the intended outcome.
- Correlation: If the method triggers a command that later updates a status register, test that the method result correlates with the subsequent status update.
Example method scenario:
- Method:
StartBatch(targetRecipeId). - Expected flow: method validates recipe ID, writes a command register, then the system observes a status register transition to “running.”
- Test: call with a valid recipe ID; expected method returns success and the status transitions within the configured window.
- Negative: call with an invalid recipe ID; expected method returns failure and no command register change occurs.
Reset, Cleanup, and Evidence Collection
After each test, reset device state to a known baseline. Evidence matters: capture request/response logs, correlation IDs, and the exact values read back for verification. This turns debugging from guesswork into arithmetic.
12.3 Performance Testing for Polling Rates Subscription Latency and Load
Performance testing for industrial protocols is mostly about measuring what you already decided to care about: how fast values arrive, how consistently they arrive, and how hard the system works while doing it. The trick is to test with realistic traffic patterns and to separate protocol overhead from application behavior.
Define Performance Goals and Test Boundaries
Start by writing measurable targets and what counts as “good.” For polling, typical goals include maximum end-to-end update time, jitter, and the fraction of reads that succeed within a timeout. For subscriptions, goals include publish interval adherence, delivery latency from server to client, and the rate of missed or late notifications.
Example goals you can translate into checks:
- Polling update time: 95th percentile under 250 ms for a 10 ms poll group.
- Polling success: at least 99.5% of requests complete without timeout.
- Subscription latency: median under 50 ms with bounded jitter.
- Load: CPU on gateway below 60% during steady state; network utilization below a chosen ceiling.
Set boundaries so results are interpretable. Fix the number of tags, the payload sizes, and the mapping logic (scaling, bit extraction, command verification). If you change those, you change the workload.
Build a Test Matrix That Matches Real Traffic
A useful matrix varies three dimensions: polling rate, number of points, and read/write mix. For example:
- Polling rates: 10 ms, 50 ms, 200 ms
- Point counts: 100, 1,000, 5,000
- Mix: read-only vs. read plus occasional writes (e.g., 1 write per second per 100 points)
Keep the test duration long enough to cover transient effects like connection warm-up and cache fill. A practical baseline is 15 minutes per configuration, with a shorter 5-minute run to validate instrumentation.
Instrumentation and Metrics That Actually Explain Behavior
Collect metrics at three layers: network, protocol, and application.
Network layer:
- Round-trip time distribution for request/response traffic
- Packet loss and retransmissions
- Throughput and retransmission bursts
Protocol layer:
- Modbus request duration and timeout counts
- OPC UA service timing for Publish and Monitored Item delivery
- Subscription queue behavior such as overflow or late publish
Application layer:
- Time from “value changed” to “value processed”
- CPU time per worker thread or per gateway component
- Garbage collection pauses if your gateway is managed-code
Mind the difference between “server update time” and “client observed time.” A subscription can publish quickly but the client may process slowly.
Polling Rate Testing with Controlled Load
For Modbus polling, group points to reduce overhead. Then test how grouping affects latency and load.
Example: Suppose you have 1,000 holding registers. Compare two strategies:
- Strategy A: 1,000 single-register reads
- Strategy B: 10 reads of 100 registers each
Expected outcome: Strategy B typically lowers request count and CPU overhead, but it may increase per-request duration. Your job is to confirm that the 95th percentile update time improves rather than just shifting where time is spent.
Use a timeout that reflects your target. If the timeout is too high, you’ll “succeed” slowly and hide problems. If it is too low, you’ll create avoidable failures.
Subscription Latency Testing with Publish and Queue Effects
For OPC UA subscriptions, latency is influenced by sampling interval, publishing interval, and server-side queueing. Test with multiple publish intervals while keeping sampling constant.
Example setup:
- Sampling interval: 50 ms
- Publish intervals: 50 ms, 100 ms, 200 ms
- Monitored items: 500, 2,000
Measure:
- Delivery latency distribution from server timestamp to client receipt
- Count of notifications dropped due to queue overflow
- Client processing time per notification batch
If latency grows with item count, check whether the server is spending more time encoding notifications or whether the client is falling behind.
Interpreting Results Without Guessing
A systematic way to interpret results is to correlate spikes in latency with load metrics.
- If latency increases while CPU stays flat, suspect network retransmissions or contention.
- If latency increases with CPU and request duration, suspect serialization, mapping logic, or thread starvation.
- If subscription latency increases with queue overflow counters, suspect publish interval mismatch or client processing limits.
Mind Map: Performance Testing Workflow
Example: One Configuration Walkthrough
Run a configuration: Modbus polling at 50 ms for 1,000 points using grouped reads, and OPC UA subscriptions with sampling at 50 ms and publish at 100 ms. During the run, record request duration histograms and notification delivery latency histograms.
If Modbus shows a wide tail in request duration, you’ll see it as jitter in update time. If OPC UA shows stable publish timing but rising client processing time, you’ll see delivery latency increase even when server timestamps look fine. In both cases, the fix is different: batching and timeout tuning for Modbus, versus client-side processing and notification handling for OPC UA.
Acceptance Criteria and Reporting Format
Finish by stating pass/fail criteria tied to your goals, not to “it seems fine.” Report:
- The configuration that meets latency targets at the chosen point count
- The load metrics at that configuration
- The dominant bottleneck layer based on correlations
- The failure modes observed, such as timeouts or subscription queue overflow
A good report makes it easy to reproduce the test and easy to explain why a change helped or hurt. That’s the whole point of performance testing: fewer surprises, more evidence.
12.4 Security Testing for Certificate Trust and Access Control Enforcement
Security testing here focuses on two things: whether the system trusts the right certificates, and whether it enforces access rules consistently when real clients and real credentials show up. The goal is simple—prove that “allowed” stays allowed and “not allowed” stays blocked, even when inputs are messy.
Certificate Trust Foundations for Testing
Start with a trust model you can state in one sentence: which certificates are trusted, which are rejected, and how the system decides. For OPC UA, that decision is typically driven by trust lists and certificate validation rules. For gateways that translate Modbus to OPC UA, the gateway often becomes the trust boundary: it must validate upstream identity before it forwards requests.
Test the following trust behaviors in order, because later tests depend on earlier assumptions:
- Trusted certificate succeeds: Use a client certificate that is explicitly trusted. Confirm the handshake completes and the session is created.
- Untrusted certificate fails: Use a certificate not present in the trust list. Confirm the connection is rejected before any authorization checks matter.
- Revoked certificate fails: If your environment supports revocation, test a revoked certificate. Confirm failure is deterministic and logged.
- Wrong certificate for endpoint fails: Present a valid certificate from a different trust group or intended purpose. Confirm it does not get accepted just because it is “valid.”
A practical example: in an OPC UA test environment, create two client certificates—Client A is trusted, Client B is not. Attempt a connection with both. You should see a clear difference: Client A reaches session creation; Client B fails during certificate validation.
Access Control Enforcement Checks
Once trust is correct, test authorization. Authorization is about what the authenticated identity can do.
Use a small matrix of identities and actions. Keep it concrete:
- Identities: Operator, Maintenance, Guest
- Actions: Read status variables, Write setpoints, Call control method, Browse address space
For each identity, verify the expected outcome and the error type. “Blocked” is not enough; you want the system to block in the right place.
Example workflow for an OPC UA method call that triggers a control action:
- Operator: method call allowed; verify method execution status is success.
- Guest: method call denied; verify the server returns an authorization-related failure and does not change any underlying control state.
- Maintenance: method call allowed only for specific parameters; verify invalid parameters are rejected without performing partial writes.
Negative Testing That Actually Proves Enforcement
Negative tests should be targeted, not random. Focus on common ways systems accidentally become permissive.
- Wrong identity with trusted certificate: If your system maps certificates to roles, test a certificate mapped to a different role than expected.
- Missing or malformed credentials: For OPC UA, test that missing user identity or malformed tokens lead to denial, not fallback to anonymous access.
- Cross-tenant confusion: If you have multiple trust lists or namespaces, test that a certificate from one area cannot access another.
- Replay-like behavior: Reuse the same authentication material across sessions to confirm the server does not treat it as a one-time exception.
Mind Map: Security Testing Scope
Example Test Cases and Expected Outcomes
Use a table-like checklist in your test plan so results are easy to compare.
- TC1 Trusted client connects: Expected session created; audit entry includes certificate thumbprint.
- TC2 Untrusted client connects: Expected connection rejected; no session created; audit entry indicates trust failure.
- TC3 Guest reads status: Expected read allowed only if policy permits; otherwise denied with authorization error.
- TC4 Guest writes setpoint: Expected write denied; verify the setpoint register value remains unchanged.
- TC5 Operator calls control method: Expected method returns success; verify downstream command is issued exactly once.
- TC6 Maintenance calls method with invalid parameter: Expected method fails; verify no partial write occurs.
Evidence Collection and Acceptance Criteria
For each case, record three things: the client identity used, the server-side decision point (trust vs authorization), and the resulting state. Your acceptance criteria should include “no unintended state change” for denied actions. If a denied write still updates a cached value or triggers a command, you have a bug—usually a sequencing or transaction boundary issue.
Finally, ensure logs are consistent enough to support troubleshooting. When a certificate is rejected, the log should point to trust validation. When a certificate is accepted but an action is denied, the log should point to authorization. That separation makes future debugging far less painful than guessing which layer failed.
12.5 Acceptance Criteria and Handover Documentation for Operations Teams
Acceptance is where engineering meets reality: the system must behave predictably under normal operation, recover cleanly from common faults, and provide enough evidence for operations to diagnose issues without guessing. The goal is not to prove perfection; it is to prove that behavior matches the agreed contract.
Acceptance Criteria Structure
Start with a checklist that maps directly to what operations will monitor and what engineers will troubleshoot.
-
Data correctness
- Every mapped point must match the expected type, scaling, and units.
- Example: a Modbus register representing temperature in tenths of degrees should become an OPC UA variable with engineering units of °C and a value conversion of
raw / 10.
-
Timing and freshness
- Define freshness windows for polled data and subscription updates.
- Example: if polling is configured for 1 s, stale data is anything older than 3 s; operations should see a quality indicator or status flag when stale.
-
Control safety
- Writes must be gated by allowed states and must confirm effect.
- Example: a “Start Pump” command is accepted only when the OPC UA state variable indicates “Ready”; after the write, the system must observe the corresponding “Running” feedback within a defined timeout.
-
Error handling behavior
- Specify what happens on timeouts, bad responses, and session interruptions.
- Example: on Modbus timeout, the gateway marks affected points as “Uncertain” and logs the function code and target address; it does not silently keep old values as if they were current.
-
Security enforcement
- Confirm that only authorized clients can read or write, and that certificate trust rules are applied as designed.
- Example: an unauthorized OPC UA client must be rejected at session creation, and the gateway must record the reason code.
-
Operational observability
- Define which metrics and logs operations will use.
- Example: gateway health includes “last successful poll,” “subscription publishing status,” and “command queue depth.”
Handover Documentation Package
Operations needs documents that answer three questions: What is it supposed to do, how do we know it is doing it, and what do we do when it is not.
-
System overview
- A one-page diagram of devices, gateway, and client applications.
- A short description of data direction: which signals are read-only, which are commands, and which are feedback.
-
Data mapping contract
- A table listing each point: source (Modbus address or OPC UA node), destination (OPC UA node), data type, scaling, units, and allowed ranges.
- Example row:
Holding Register 40010→ns=2;s=Machine/Tempwithint16, scale0.1, units°C, range-40..150.
-
Operational runbook
- A fault-to-action matrix for the most common issues.
- Example: “Stale data” → check gateway connectivity to device, verify polling schedule, confirm network path, then restart only the gateway service if required.
-
Acceptance test evidence
- For each criterion, include the test method, expected result, and actual outcome.
- Example: “Command acknowledgment” test shows that a Start command transitions from
ReadytoRunningwithin 5 s, and that a disallowed command is rejected with a specific status.
-
Change management notes
- Document what can be changed safely (e.g., polling intervals within limits) and what requires re-acceptance (e.g., register map offsets or scaling rules).
Mind Map: Acceptance and Handover
Example Acceptance Checklist Snippet
| Criterion | Test Method | Expected Result | Evidence to Store |
|---|---|---|---|
| Temperature scaling | Write raw 250 to register, read OPC UA value | OPC UA shows 25.0 °C | Screenshot/log of read value |
| Command safety | Attempt Start while state is Fault | Write rejected with status | Gateway log with reason |
| Freshness | Stop device communication for 4 s | Points marked stale/uncertain | Quality flag trend |
| Reconnect | Drop network for 10 s | Sessions recover, values resume | Session status logs |
Handover Sign-Off Flow
Use a simple sequence: engineering completes the mapping contract and test evidence, operations reviews the runbook and monitoring fields, and both parties confirm that the acceptance criteria are traceable to stored artifacts. If a criterion fails, the system can still be accepted only if the failure is explicitly documented with a mitigation and an operational boundary (for example, “Control commands disabled until manual intervention” is acceptable only if operations can reliably detect and enforce it).