Plasma Surface Processing and Thin Film Engineering
1. Fundamentals of Plasma and Surface Interactions
1.1 Plasma States and Discharge Regimes for Materials Processing
Plasma is a gas where a meaningful fraction of particles are charged. For materials processing, the key question is not “is it plasma?” but “what kind of plasma is it, and what does it do at the surface?” The answer depends on discharge regime, which is governed by pressure, power, geometry, and gas composition.
Core Plasma States
A practical way to think about plasma states is by how electrons gain energy and how often they collide.
- Non-ionizing or weakly ionizing glow: Electrons exist, but ionization is limited. You may still get surface activation, especially if reactive neutrals and metastables are present.
- Glow discharge: Ionization is sustained mainly by electron impact. The plasma typically shows a relatively uniform glow region, and the sheath near surfaces accelerates ions toward the substrate.
- Arc or thermal discharge: Energy input is so high that the gas temperature rises significantly. This can damage substrates and coatings because the process becomes dominated by heat rather than controlled ion bombardment.
In most thin film and surface functionalization work, you want controlled glow-like conditions rather than arc-like behavior.
Discharge Regimes and What They Mean for Surfaces
The “regime” tells you how electrons, ions, and neutrals distribute energy.
Low-Pressure Glow and Sheath-Dominated Processing
At lower pressures, the mean free path increases, so ions can reach the substrate with fewer collisions. The sheath becomes the main actor: it sets the ion energy scale that drives densification, sputtering, and interface mixing.
Easy example: If you reduce pressure while keeping power similar, you often see improved film density because ions arrive with more direct energy rather than losing it through collisions.
Collisional Glow and Energy Loss by Collisions
At higher pressures, ions and electrons collide more frequently. Ion energy at the surface becomes less sharply defined, and more energy is dissipated in the gas phase.
Easy example: If you increase pressure during deposition, you may get a softer film with more voids because ion bombardment becomes less effective at compacting the growing layer.
Townsend and Early Breakdown Behavior
Before a stable discharge forms, the system passes through breakdown conditions where electron multiplication begins. This regime is sensitive to electrode spacing, gas purity, and initial electron availability.
Easy example: A small change in gas pressure or electrode condition can cause the discharge to ignite at a different voltage, which then changes the downstream plasma chemistry.
Secondary Electron Emission and Sustained Glow
Sustained glow requires mechanisms that keep electron numbers from collapsing. Secondary electron emission from surfaces (and in some systems, photoemission) helps maintain the discharge.
Easy example: If you change electrode material or surface condition, the same power setting may produce a different plasma intensity because secondary emission changes.
Arc Transition and Why It’s Usually Unwanted
Arcs occur when current concentrates and the system shifts toward thermal dominance. The surface sees intense localized heating and uncontrolled sputtering.
Easy example: If you push current too high in a system designed for glow, you can observe sudden voltage drops and visible hotspots—often followed by rough films or damaged substrates.
Mind Map: Plasma States and Discharge Regimes
A Systematic “Regime-to-Outcome” Reasoning Path
- Start with pressure and power: They set collision frequency and electron energy gain.
- Infer sheath behavior: In glow-like conditions, the sheath largely determines ion energy at the substrate.
- Predict surface effects: Higher effective ion energy tends to densify and improve adhesion, while excessive thermal input increases roughness and stress.
- Check stability: Stable glow gives repeatable film properties; regime drift or arc transitions produce inconsistent results.
Concrete example workflow: Suppose you observe poor adhesion. First, verify you are not near an arc transition by checking for sudden electrical changes and visible hotspots. Then adjust pressure to tune ion energy delivery: lowering pressure often increases ion effectiveness without raising gas temperature as much as increasing power would.
Practical Indicators to Distinguish Regimes
Even without advanced diagnostics, you can use electrical and visual cues.
- Ignition voltage and current stability: Stable glow shows smoother transitions and steady current at a given power.
- Voltage drop behavior: Sudden drops with rising current can indicate arc-like behavior.
- Uniformity of the discharge region: Glow discharges are typically more spatially uniform than arcs, which localize current.
These indicators help you keep the process in the regime that supports controlled surface modification rather than uncontrolled heating.
1.2 Plasma Species and Energy Distributions Relevant to Surfaces
Plasma is not just “ions and electrons.” For surface processing, what matters is the mix of charged and neutral species and how their energies are distributed when they reach the near-surface region. Those energies determine whether bonds break, whether atoms stick, whether films densify, and whether the surface chemistry stays gentle or turns aggressive.
Species That Actually Reach the Surface
Charged Species
Electrons are abundant and fast, but they usually do not directly bombard the surface with high energy because they are repelled by the sheath potential. Ions, in contrast, are accelerated through the sheath and arrive with energies that are closely tied to the plasma potential and any applied substrate bias.
A practical way to think about it: electrons set up the plasma and charge balance, while ions do the surface “work” by delivering momentum and enabling surface reactions.
Neutral Species
Neutrals include atoms and molecules formed from the feed gas and from dissociation products. They arrive without being accelerated by the sheath, so their energy is often closer to the gas temperature plus whatever energy they gained during collisions in the plasma volume.
Neutrals matter when deposition or functionalization relies on chemical reactions rather than purely physical bombardment.
Metastables and Excited States
Excited species can carry internal energy that helps reactions proceed at lower substrate temperatures. They are not accelerated like ions, but they can still change surface outcomes by changing reaction pathways.
Photons and Secondary Electrons
VUV/UV photons can drive surface reactions and desorption, especially in low-pressure systems. Secondary electrons emitted from surfaces can also influence local charging and reaction rates.
Energy Distributions Near the Surface
The key idea is that “energy” is not a single number. Each species has a distribution, and the surface responds to the portion of that distribution that overlaps with reaction thresholds.
Electron Energy Distribution
Electrons typically follow a distribution that can be approximated by an effective temperature in many low-pressure discharges. Even when the electron energy distribution is broad, the surface impact is indirect: electrons mainly control dissociation and ionization rates in the plasma volume.
Ion Energy Distribution
Ions are accelerated across the sheath, so their energy distribution is often narrower than electrons. However, it is not perfectly monoenergetic. Variations come from sheath dynamics, gas pressure, and geometry.
A useful rule of thumb for process planning: increasing substrate bias generally increases ion energy, which tends to increase densification and sputtering, but can also reduce film adhesion if bombardment becomes too harsh.
Neutral Energy Distribution
Neutrals are usually described by a thermal-like distribution, but dissociation and recombination can create non-thermal tails. Those tails can matter for sticking probability and for surface activation.
Internal Energy Distribution
For excited molecules and metastables, internal energy distributions can be broad. The surface may react efficiently with the high-energy fraction even if the average internal energy seems modest.
How Species and Energies Shape Outcomes
Adhesion and Interfacial Bonding
Ion bombardment can remove weak boundary layers and activate surface sites. Meanwhile, reactive neutrals can form chemical bonds across the interface. If you only increase ion energy without providing reactive chemistry, you may get rougher surfaces but not better bonding.
Film Density and Microstructure
Higher ion energies generally increase adatom mobility and promote densification, shifting microstructure toward denser films. Too much energy can also increase defect formation through re-sputtering and stress buildup.
Functionalization and Wettability
Surface functional groups often come from reactive neutrals and excited species. Ion energy controls how many of those groups survive versus being etched away.
Mind Map: Species and Energy Paths to the Surface
Example: Choosing Between Ion-Driven and Chemistry-Driven Processing
Imagine two runs on the same polymer surface.
Run A: Higher substrate bias, mostly inert gas. Ions arrive with higher energy and can physically activate and clean the surface. Reactive group formation is limited because the neutral chemistry is weak. Result: improved surface activation but limited long-term wettability stability.
Run B: Lower bias, reactive gas mixture. Ions arrive with gentler energies, reducing etching of newly formed groups. Reactive neutrals and excited species provide functional groups that can attach to the surface. Result: stronger functionalization with less physical damage.
The point is not that one run is “better,” but that the dominant species and their energy distributions must match the target mechanism.
Example: Interpreting a Simple Energy Budget
Suppose you increase pressure. Collisions in the plasma volume and sheath become more frequent. Ions may lose energy through charge-exchange and scattering, narrowing the effective ion energy at the surface. Meanwhile, dissociation can increase up to a point because electrons collide more often. If your film suddenly becomes less dense after the pressure increase, the likely culprit is reduced ion energy at the surface rather than a lack of reactive species.
In practice, you treat energy distributions as a budget: ion energy controls physical activation and densification, while neutral and excited species control chemistry. When the budget is balanced, you get consistent surface outcomes instead of “it depends” surprises.
1.3 Surface Chemistry and Physical Mechanisms of Plasma Treatment
Plasma treatment changes a surface by combining chemical reactions with physical energy transfer. The key idea is simple: ions, electrons, radicals, and photons arrive at the surface with different energies and lifetimes, and each group drives different steps in the overall outcome.
What Reaches the Surface and Why It Matters
A surface in a plasma environment is exposed to four main actors. First, ions are accelerated across the sheath and can physically break bonds or promote reactions through impact energy. Second, radicals and reactive neutrals can react without needing charge, often at lower energies than ions. Third, electrons mainly contribute to dissociation in the gas phase and can also cause surface charging effects that shift local reaction rates. Fourth, photons can initiate reactions by exciting adsorbed species, especially when the surface has accessible electronic states.
A practical way to think about it is to separate “chemistry first” from “energy first.” If radicals dominate, you often see functional group changes with relatively mild damage. If ion bombardment dominates, you often see faster cleaning, higher activation, and sometimes more roughening.
Surface Chemistry Pathways
Plasma chemistry starts with adsorption and reaction of species already on the surface. Many surfaces carry a thin layer of water, hydrocarbons, or native oxides. Oxygen-containing plasmas commonly remove hydrocarbons by forming volatile products such as CO and CO2. Nitrogen-containing plasmas can introduce amine-like groups by reacting with carbonaceous fragments and leaving nitrogen-containing moieties behind.
The reaction sequence usually follows a pattern:
- Activation: reactive species create new reactive sites by breaking existing bonds.
- Functionalization: fragments recombine with incoming radicals or incorporate heteroatoms.
- Rearrangement: surface groups can migrate or reorient, changing wettability and adhesion.
- Stabilization: the surface reaches a steady state where incoming and outgoing reactions balance.
A concrete example: treating polyethylene with an oxygen plasma often increases surface energy by introducing oxygen-containing groups. The contact angle drops because water can form stronger interactions with polar groups. If the treatment is too aggressive, the surface can become rougher and the contact angle may change again due to altered wetting geometry.
Physical Mechanisms and Their Consequences
Physical effects come primarily from ion bombardment and momentum transfer. Ion impacts can:
- Sputter weakly bound contaminants and sometimes parts of the substrate.
- Create defects such as dangling bonds that act as chemical “hooks.”
- Promote densification in thin films by knocking atoms into more stable positions.
- Increase roughness by preferential removal or micro-masking.
These effects are not independent. For instance, sputtering can remove the very functional groups you just created, especially if the ion energy is high. That’s why two processes with the same gas chemistry can yield different results when bias or pressure changes.
The Role of the Sheath and Ion Energy
Most ion energy is determined by the sheath potential, which depends on plasma power, pressure, and substrate bias. At lower pressure, ions travel farther without collisions, so they arrive with higher effective energies. At higher pressure, collisions reduce ion energy and broaden the energy distribution.
A clear example: in an argon plasma used for cleaning, increasing substrate bias typically increases removal rate and can improve adhesion by increasing surface activation. However, on polymers, higher ion energy can cause embrittlement or excessive etching, leading to worse mechanical performance even if wettability improves.
Pressure, Transport, and Reaction Balance
Pressure affects both transport and reaction rates. Higher pressure increases the probability of gas-phase collisions, which can reduce the mean free path and change the balance between radicals and ions reaching the surface. It can also increase residence time, allowing more gas-phase dissociation and secondary chemistry.
A useful rule of thumb: if you want more chemical functionalization with less damage, you often reduce ion energy (lower bias) and choose gases that generate the desired radicals. If you need rapid cleaning and activation, you often allow stronger ion bombardment while monitoring roughness and substrate integrity.
Mind Map: Plasma Treatment Mechanisms
Example: Oxygen Plasma on Two Different Substrates
Consider oxygen plasma treatment for (1) a metal surface and (2) a polymer surface.
-
Metal: oxygen radicals and ions can form or modify an oxide layer. The surface energy may increase due to polar oxide groups, improving wetting and adhesion of subsequent coatings. Excessive ion bombardment can thicken oxides and increase roughness, which can help mechanical interlocking but may also introduce stress at the interface.
-
Polymer: oxygen plasma removes hydrocarbons and introduces oxygen-containing groups that raise surface energy. If ion energy is too high, the polymer can undergo chain scission and surface erosion. The result can be a surface that wets well initially but fails under mechanical load because the near-surface region is weakened.
Example: Argon Cleaning Followed by Reactive Functionalization
A common integrated approach is to use argon plasma first for physical cleaning and activation, then switch to a reactive gas such as oxygen or nitrogen. The argon step removes loosely bound contaminants and creates reactive sites. The reactive step then adds functional groups more selectively than argon alone.
The practical benefit is that you separate “remove and activate” from “chemically decorate.” That separation reduces the chance that the same mechanism both creates and destroys the functional layer during a single continuous treatment.
1.4 Interfacial Phenomena Including Adsorption Ionization and Reaction Pathways
Plasma processing changes surfaces through a chain of events: species must reach the surface, adsorb or react, and then reorganize into a new interfacial chemistry and structure. The “interface” is not just the top atomic layer; it includes the near-surface region where bonds break, new bonds form, and stress or charge effects influence film growth.
Mind Map: Interfacial Phenomena
Transport to the Surface
Before any chemistry happens, reactive species must arrive. At lower pressures, mean free paths increase and ions can travel more directly toward the substrate. At higher pressures, collisions randomize trajectories, increasing the chance that neutrals thermalize and adsorb rather than impact-react. A practical rule of thumb: if you see strong sensitivity to geometry and shadowing, ion-driven transport and sheath effects are likely dominating; if the process is more uniform, diffusion and sticking of neutrals may be more important.
Adsorption and Sticking
Adsorption depends on both the species and the surface state. Oxygen-containing plasmas often create polar sites on metals and polymers, increasing the sticking probability of subsequent reactive fragments. On polymer surfaces, oxygen plasma can introduce oxygen-containing functional groups that act like “chemical landing pads,” improving later bonding for thin films. On freshly sputtered or oxide-covered metals, adsorption competes with immediate surface reactions, so the effective sticking coefficient can be lower than expected from gas-phase reactivity alone.
A simple example: treating a polymer with an argon/oxygen plasma. Early in the run, oxygen fragments react with the top layer, increasing surface energy and wettability. If the treatment continues too long, excessive etching can roughen the surface and remove the very functional groups that were improving adhesion. The interface is dynamic, not a static target.
Ionization and Charge Effects
Ionization occurs primarily in the plasma volume, but what matters for the interface is the ion energy distribution at the surface. The sheath near the substrate accelerates ions according to the local electric potential. Higher substrate bias typically increases ion energy, which can enhance densification and promote bond rearrangement, but it can also increase damage if energies are too high.
Charge effects also influence reaction rates. Secondary electrons emitted from the surface can sustain local plasma conditions and alter the balance between ion bombardment and neutral chemistry. In practice, this is why two processes with the same gas recipe but different electrode configurations can produce different interfacial bonding.
Reaction Pathways
Once species adsorb, reactions proceed along pathways that depend on available sites and competing processes. Three common pathway motifs are:
- Surface-mediated formation: adsorbed fragments react with neighboring adsorbates to form new bonds, often leading to an interlayer that improves film adhesion.
- Radical recombination: radicals meet and recombine, which can either build a film precursor layer or remove it through etching, depending on chemistry.
- Etch–deposit balance: in reactive plasmas, the same species can both deposit and etch. The net result depends on relative rates, which shift with pressure, ion energy, and gas composition.
Example: reactive deposition using a silicon-containing precursor with hydrogen and oxygen. Oxygen can form a thin silicon-oxide-rich interfacial region that improves chemical bonding to oxide-forming films. However, if ion energy is high, it can also accelerate removal of loosely bound species, narrowing the window where deposition outpaces etching.
Interfacial Outcomes and How They Show Up
Interfacial chemistry and structure influence measurable outcomes:
- Adhesion improvement often correlates with formation of a chemically compatible interlayer and reduced contamination at the interface.
- Composition gradients can form when reactive fragments adsorb faster than the film grows, leading to a “chemically active” top region.
- Defect creation can occur when ion bombardment breaks bonds faster than they can be reformed, producing voids or weakly bonded regions.
A practical diagnostic mindset: if adhesion fails at the interface, suspect insufficient activation, poor interlayer formation, or residual contamination. If adhesion fails within the film, suspect stress, densification mismatch, or overly aggressive bombardment.
Control Levers That Tie the Whole Story Together
- Gas chemistry sets which fragments adsorb and what bonds can form.
- Pressure controls collision frequency, residence time, and the neutral-to-ion ratio at the surface.
- Substrate bias tunes ion energy and therefore bond rearrangement versus damage.
- Temperature and time affect surface mobility, which determines whether reactions lead to stable bonding or to re-etching.
When these levers are aligned, the interface becomes a controlled reaction zone rather than a gamble. The best processes are the ones where adsorption, ion-assisted rearrangement, and net deposition/etching all agree on what the surface should become.
1.5 Linking Plasma Parameters to Surface Outcomes Using Mechanistic Models
Mechanistic models connect what you set in the plasma system to what you measure on the surface. The trick is to treat the surface as a reaction site with a measurable energy and chemistry budget, not as a black box. A useful workflow is: (1) identify the dominant surface process, (2) write the rate-limiting steps, (3) map plasma parameters to species fluxes and energies, and (4) predict observable outcomes like adhesion, wettability, or film density.
Start with Surface Outcomes and Their Controlling Steps
Common surface outcomes have distinct controlling steps:
- Cleaning and activation: removal of organics and native oxides, plus creation of reactive sites.
- Adhesion improvement: formation of interfacial bonds and increased real contact area.
- Film densification: reduction of voids and columnar porosity via ion-assisted rearrangement.
- Composition control: maintaining stoichiometry by balancing deposition and etching reactions.
A mechanistic model begins by choosing which step is slowest. For example, if adhesion is poor despite aggressive cleaning, the limiting step may be interfacial bond formation rather than contaminant removal.
Translate Plasma Settings into Surface Inputs
Plasma parameters rarely act directly on the surface; they act through two surface inputs: flux and energy.
- Flux is set by plasma density and gas chemistry. Higher density increases the number of reactive neutrals, ions, and radicals arriving per unit time.
- Energy is set by ion energy distributions and substrate bias. Ion bombardment energy controls how strongly atoms are displaced, how much densification occurs, and which chemical bonds survive.
A practical mapping looks like this:
- Pressure changes mean free path and collision frequency, shifting the balance between energetic species and thermalized species.
- Power changes electron density and therefore overall species production.
- Gas composition changes which radicals and ions are present and whether etching competes with deposition.
- Substrate bias changes ion energy at the surface and therefore microstructure and interfacial chemistry.
Build a Rate Picture for Competing Processes
Most surface outcomes come from competition between arrival, surface reaction, and removal.
A compact mechanistic form is:
- Net deposition rate = (arrival rate of film-forming species) − (etching rate by reactive species and energetic ions)
- Net surface modification rate = (creation rate of functional sites) − (loss rate via recombination or desorption)
Each term can be linked to plasma parameters. For instance, increasing oxygen fraction often increases radical-driven etching and surface oxidation, which can improve wettability but reduce film thickness if etching becomes dominant.
Use Ion Energy and Flux to Predict Microstructure
Ion-assisted growth is often governed by the balance between surface mobility and ion-driven densification.
- Low ion energy: atoms land and stick with limited rearrangement, producing porous or columnar structures.
- Moderate ion energy: enhanced surface mobility and subplantation can densify the film.
- Too high ion energy: excessive damage increases defect density and can weaken adhesion.
Mechanistic models express this as a dependence of densification on ion energy and ion-to-neutral arrival ratio. Even without full numerical simulation, you can reason about trends: if bias increases while pressure stays fixed, ion energy rises and the ion-to-neutral ratio typically increases, pushing densification until damage starts to dominate.
Mind Map of the Mechanistic Chain
Mind Map: Plasma Parameters to Surface Outcomes
Worked Example Cleaning to Adhesion
Suppose you treat a polymer surface before applying a thin coating. You increase oxygen plasma power and keep pressure constant.
Mechanistic reasoning:
- Higher power increases radical flux, so the creation rate of oxygen-containing functional sites rises.
- Those sites improve wetting and enable stronger interfacial bonding.
- If power becomes too high, chain scission and over-oxidation can create a brittle, low-molecular-weight layer that reduces adhesion.
So the model predicts a non-monotonic adhesion response: initial improvement from functionalization, followed by degradation when removal and damage outpace beneficial bond formation.
Worked Example Deposition to Density
Now consider depositing a hard oxide film with a reactive gas mixture. You raise substrate bias while holding deposition power constant.
Mechanistic reasoning:
- Bias increases ion energy at the surface.
- Higher ion energy increases densification by promoting rearrangement and reducing void formation.
- At higher energy, ion-driven resputtering and defect creation increase, which can lower net thickness and weaken adhesion.
The model predicts an optimum bias window where densification improves without excessive removal or damage.
Practical Modeling Without Overcomplication
You do not need a full kinetic simulation to use mechanistic models effectively. A minimal approach is to track:
- which species dominate (from gas chemistry and discharge regime)
- whether the surface is in a deposition- or etch-dominated balance
- how ion energy and ion flux change with pressure and bias
Then you connect those to the specific outcome you measure. If the data contradicts the model, the most likely issue is misidentifying the rate-limiting step or the dominant competing process.
2. Plasma Generation Systems and Process Hardware
2.1 DC Glow RF and Microwave Sources for Thin Film and Surface Processing
Thin film and surface processing need a plasma that is both stable and controllable. The “source” is the part that creates the discharge, and it largely determines how easily you can tune ion energy, plasma density, and uniformity. Three common families are DC glow, RF (radio frequency), and microwave sources. Each one has a characteristic way of handling charge, which shows up directly in film properties and surface outcomes.
DC Glow Sources for Surface Activation and Simple Coatings
A DC glow discharge uses a direct voltage between electrodes in a low-pressure gas. Electrons accelerate toward the anode, ionize gas, and sustain the plasma. Because the system is not inherently symmetric, the surface that collects ions typically sees stronger bombardment, which is useful for activation and cleaning.
A practical example: cleaning a metal coupon before deposition. You can run a DC glow in argon or argon-oxygen. Argon ions physically remove weakly bound contamination, while a small oxygen fraction helps convert remaining hydrocarbons into volatile species. The key best practice is to keep the pressure and current in a range that avoids arcing; arcing usually means the discharge is trying to “escape” the intended glow regime.
DC glow is also used for sputtering-like processes when a target is the cathode. In that case, the ion energy is tied to the cathode fall voltage, so controlling voltage and current is the main lever for film density.
RF Sources for Bias Control and Reduced Charging Issues
RF sources drive the discharge with alternating fields, typically at 13.56 MHz. Because the polarity flips, both electrodes periodically become “the more positive side.” This reduces the long-term charge buildup that can plague DC systems, especially on insulating or partially insulating substrates.
The most important concept for RF is the self-bias. Even with symmetric RF drive, the powered electrode often develops a negative DC component due to electron mobility differences. That negative bias accelerates ions toward the substrate. In practice, you tune ion energy by adjusting RF power, matching network settings, and chamber geometry.
Example: depositing a thin oxide on a polymer-coated component. With RF, the polymer is less likely to accumulate charge that would deflect ions and create patchy films. You still need to manage thermal load, so you choose a lower power and slightly higher pressure to keep the plasma stable while reducing ion energy.
RF also supports reactive chemistries more smoothly than many DC setups because the discharge can remain stable across a wider range of gas compositions. That stability matters when you are balancing film stoichiometry, such as switching between oxygen-lean and oxygen-rich conditions.
Microwave Sources for High Density and Uniform Plasmas
Microwave sources couple energy into the gas through resonant or waveguide structures, producing a plasma with high electron density at relatively low substrate bias. This is useful when you want strong dissociation of process gases without relying on heavy ion bombardment.
A concrete use case: surface functionalization that depends on reactive radicals rather than ion impact. In a microwave system, you can generate a dense radical environment that activates surfaces while keeping the substrate at a lower effective ion energy. That reduces damage to delicate coatings or microstructured parts.
Microwave processing often emphasizes uniformity. You manage it through chamber design, gas flow distribution, and coupling geometry. The best practice is to map uniformity at the substrate level early, because plasma density variations can translate into thickness or chemistry gradients.
Choosing a Source by What You Need from the Surface
Source selection is not a popularity contest; it’s a mapping from your target outcome to the discharge behavior.
- If you need strong ion bombardment for activation or sputter-like densification, DC glow is straightforward.
- If you need controlled ion energy with reduced charging problems, RF is usually the safe default.
- If you need high radical density with gentler ion impact, microwave is often the better fit.
Mind Map: Source Families and Their Practical Levers
Example: A Simple Decision Workflow for a New Process
- Write the surface goal: cleaning, adhesion promotion, densification, or chemistry-driven functionalization.
- Decide whether ion bombardment is required. If yes, prioritize DC glow or RF; if no, prioritize microwave.
- Identify substrate constraints. Insulating or composite substrates push you toward RF.
- Set initial pressure and gas mix to keep the discharge stable, then tune power or bias to reach the desired ion energy.
- Validate with a quick diagnostic: thickness uniformity for deposition, contact angle or surface energy for functionalization, and adhesion or scratch response for bonding.
A good rule of thumb is to treat stability and uniformity as first-class requirements. Once the discharge behaves, the rest of the process becomes a controlled conversation between ion energy, radical chemistry, and surface reactions.
2.2 Vacuum Chambers and Substrate Handling for Repeatable Processing
Repeatability in plasma processing starts before the plasma turns on. A vacuum chamber is not just a container; it is a controlled environment where pressure stability, surface cleanliness, and substrate positioning determine whether your results match the last run or the last surprise.
Chamber Foundations for Stable Pressure and Clean Surfaces
A plasma process needs a predictable gas residence time, which depends on chamber volume, pumping speed, and leak tightness. When pressure control is stable, the plasma chemistry stays consistent because the balance between ionization, dissociation, and surface reactions remains similar.
Equally important is the chamber’s “memory.” Residual water, hydrocarbons, and previously deposited film fragments can desorb during later runs, changing gas composition at the moment you care about. A practical approach is to treat the chamber as having three layers of cleanliness: base vacuum cleanliness (low outgassing), process cleanliness (minimal carryover between recipes), and surface cleanliness at the substrate region (where the plasma actually interacts).
Best-practice example: If you switch from an oxygen-containing recipe to a hydrocarbon-containing one, run a short purge and a controlled bake-out or plasma cleaning step to reduce cross-contamination. Even a small reduction in background carbon can noticeably improve adhesion and film stoichiometry.
Pumping, Valves, and Pressure Control That Behave the Same Every Time
Repeatable pressure control comes from consistent pumping and gas flow paths. Use a pumping system sized for your pressure range and include appropriate throttling (often a throttle valve) so that setpoints are reached with similar dynamics each run.
Gas delivery should be designed so that flow changes translate into pressure changes predictably. Mass flow controllers should be calibrated, and line lengths should be consistent to avoid time delays that shift the plasma ignition point.
Best-practice example: Record the time from “gas on” to “pressure stable” for each recipe. If the time drifts, you likely have a valve sticking, a clogged line, or a changing leak rate.
Substrate Mounting and Positioning for Uniform Plasma Exposure
Substrate handling is where many “mystery nonuniformities” are born. Plasma density and ion energy can vary across the chamber due to geometry, magnetic fields, and sheath formation. Mounting must therefore be repeatable in both position and electrical boundary conditions.
Use fixtures that locate the substrate consistently and minimize shadowing. If the process uses biasing, ensure electrical contact is stable and that the substrate holder does not introduce unintended grounding paths.
Best-practice example: For a batch of coupons, mark the fixture orientation and always load them the same way. A 180-degree rotation can flip which side faces the dominant ion flux, changing film thickness and surface chemistry.
Handling Workflow That Prevents Recontamination
Substrates should be handled to avoid recontamination between cleaning and processing. Even when the chamber is clean, fingerprints and adsorbed moisture can reappear quickly on exposed surfaces.
A systematic workflow is: clean → dry → transfer under controlled conditions → load quickly → pump down with consistent ramp → ignite plasma only after pressure and temperature stabilize.
Best-practice example: If you clean polymer samples and then leave them exposed to room air for 30 minutes, you may see inconsistent wettability after plasma activation. Reducing the exposure time and standardizing transfer conditions often improves repeatability more than tweaking plasma parameters.
Temperature, Outgassing, and Conditioning During Pump Down
During pump down, substrates can outgas, especially polymers, adhesives, and porous materials. That outgassing changes chamber background pressure and can alter plasma chemistry at ignition.
Conditioning helps: pre-pumping to a defined base pressure, optionally preheating under vacuum, and using a consistent pump-down profile. The goal is to make the chamber “start from the same baseline” each run.
Best-practice example: For a polymer-coated part, compare two runs: one with a short pump-down and one with a longer conditioning step. If film adhesion improves after conditioning, the earlier run likely suffered from residual outgassing interfering with surface activation.
Mind Map: Vacuum Chambers and Substrate Handling
Example: A Repeatable Load-to-Plasma Sequence
- Load substrates into a fixture that enforces orientation and contact.
- Close the chamber and start pump down using the same ramp profile each time.
- Wait until the chamber reaches the defined base pressure and stabilizes.
- Introduce process gases using calibrated flows and confirm pressure stability time.
- Ignite plasma only after pressure and temperature reach the recipe’s steady conditions.
This sequence turns “what happened last time” into a controlled set of steps, so differences in results more likely reflect intentional parameter changes rather than chamber or handling variability.
2.3 Gas Delivery Pumping and Pressure Control for Stable Discharges
Stable discharges start with boring fundamentals: you must deliver gas at a known rate, remove it at a matching rate, and keep pressure from wandering during ignition and steady operation. In practice, “stable” means the plasma sees nearly the same gas composition and pressure every second, so film properties don’t drift.
Core Concepts That Drive Stability
Mass flow sets the supply. Use calibrated mass flow controllers (MFCs) to set each gas stream. A good mental model is that the MFC is your “volume knob,” but only if it is calibrated for the exact gas and installed correctly.
Pumping sets the removal. The vacuum pump and conductance path determine how quickly gas leaves the chamber. If pumping capacity is too low for the chosen flow, pressure rises and the discharge can shift regimes.
Pressure control closes the loop. A throttle valve (often with a capacitance manometer feedback signal) adjusts effective pumping speed. The controller changes valve position to hold pressure near the setpoint.
Conductance and geometry matter. Tubing length, bends, and chamber inlets act like bottlenecks. Two systems with identical MFC settings can behave differently if one has higher conductance losses.
System Layout and Signal Path
A typical setup routes gas from cylinders through regulators into MFCs, then into the chamber. On the exhaust side, the chamber connects to a pump through a throttle valve and vacuum lines. Pressure measurement sits where it best represents the chamber bulk—usually near the main volume, not at the far end of a narrow tube.
A stable loop needs clean signals. If the pressure sensor is noisy or poorly located, the controller “chases” fluctuations and can cause oscillations in valve position, which then creates pressure ripple.
Stepwise Best Practices for Stable Discharges
Start with Correct Baseline Vacuum
Before introducing process gas, evacuate to a baseline pressure that is low enough to reduce residual oxygen, water vapor, and air. This matters because residual gases can change ignition behavior and initial plasma chemistry.
Example: If you run an oxygen-containing recipe, leaving the chamber at a high residual pressure can cause oxygen to be effectively “double counted,” shifting film stoichiometry even when your MFC setpoints are unchanged.
Use Staged Gas Introduction
Introduce gases in a controlled sequence rather than dumping everything at once. Many systems ignite more reliably when the chamber reaches a target pressure with the carrier gas first, then the reactive component is added.
Example: For a reactive coating, you can flow argon to establish a stable plasma-supporting environment, then introduce the reactive gas after ignition. This reduces the chance of runaway reactions during the ignition transient.
Tune Pressure Control for the Process Time Scale
Pressure controllers have response speed. If the loop is too aggressive, it can overshoot during valve motion; if too slow, pressure drifts during ignition.
Example: During ignition, pressure often changes quickly due to gas mixing and plasma heating. A controller that is tuned for slow thermal processes may lag, causing a brief period of elevated pressure that alters early film nucleation.
Keep Throttle Valve Operation Smooth
Throttle valves can stick or exhibit hysteresis. Regularly verify that the valve moves smoothly over its operating range and that the controller does not repeatedly hit mechanical limits.
Example: If you notice pressure oscillations at a fixed setpoint, check whether the valve is repeatedly saturating near fully open or fully closed positions. A saturated valve turns your “closed loop” into an open-loop system.
Manage Line Pressure and Regulator Stability
Upstream regulator fluctuations can show up as MFC output variation. Ensure cylinder pressure is high enough and regulators are functioning within spec.
Example: When a cylinder nears empty, regulator performance can degrade. The MFC may still display the same setpoint, but the actual delivered flow can drift, shifting pressure and plasma chemistry.
Advanced Details That Prevent Subtle Drift
Mixing time is real. Pressure setpoints can be met while local composition near the inlet differs from the bulk. Use appropriate inlet placement and allow sufficient stabilization time before deposition.
Outgassing changes the effective gas load. Chamber walls, fixtures, and seals release gases after pump-down. If you switch recipes frequently, the outgassing profile can differ between runs.
Conductance changes with configuration. If you swap substrates, masks, or liners, you may change effective conductance and pumping speed. Re-check pressure stability after hardware changes.
Mind Map: Gas Delivery, Pumping, and Pressure Control
Practical Example Workflow
- Pump down to a low baseline pressure.
- Flow carrier gas to reach the target pressure setpoint.
- Ignite the discharge under carrier conditions.
- Introduce reactive gas after ignition and allow pressure to settle.
- Start deposition only after pressure and flow signals are steady.
This workflow reduces the chance that the plasma “learns” a different gas mixture during the critical early seconds, which is where many coating properties are decided.
2.4 Electrode Configurations and Biasing Strategies for Ion Energy Control
Ion energy at the substrate is the steering wheel for many plasma coating outcomes, because it shapes surface mobility, densification, and defect formation. Electrode configuration determines where the electric fields concentrate, while biasing determines how much of the ion energy actually reaches the growing film rather than being wasted elsewhere.
Core Idea: Where Bias Turns into Ion Energy
In most low-pressure plasma processes, ions accelerate through the sheath near the substrate. The sheath voltage is set by the electrical bias and the plasma potential, so ion energy is closely tied to the effective sheath potential. A practical way to think about it: the plasma provides ions and electrons, but the sheath provides the “push.” If you change electrode geometry or grounding, you change how that push is distributed.
Electrode Configurations
Substrate-Driven Bias with a Self-Biased Electrode
A common arrangement uses an RF-powered electrode where the substrate sits on a powered chuck. Because the powered surface area and electrical impedance are not equal to the grounded surfaces, the system often becomes self-biased. This is convenient, but it also means bias magnitude can shift when chamber conditions change.
Easy example: If you coat a small coupon on a large grounded plate, the powered area fraction changes. The self-bias can become more negative, increasing ion energy and sometimes causing film stress to rise.
Externally Biased Substrate Chuck
An externally controlled DC or RF bias applied to the substrate chuck decouples ion energy from the plasma power balance. This is useful when you need consistent ion energy across different recipes or when you must keep plasma chemistry stable.
Easy example: Keep gas flows and RF plasma power fixed, then step the substrate bias from 0 V to −100 V. You should see densification increase and columnar growth reduce, while adhesion may improve up to a point and then degrade if the surface becomes too damaged.
Grounded Substrate with Ion Energy from Indirect Acceleration
If the substrate is grounded and only the plasma source is powered, the substrate sheath is typically smaller. Ion energy becomes more dependent on plasma conditions than on a controllable bias.
Easy example: In a process where you want gentle surface activation for polymers, grounding the substrate can reduce energetic bombardment compared with a biased chuck.
Multi-Electrode and Shielded Geometries
Some systems use grids, shields, or additional electrodes to shape the sheath and reduce charging on complex parts. The goal is to make the electric field near the surface more uniform and to limit stray fields that cause edge effects.
Easy example: For a recessed feature, a shielded configuration can reduce the tendency for ions to preferentially hit the rim, improving step coverage.
Biasing Strategies for Ion Energy Control
Choosing Bias Type
- DC Bias gives a steady sheath potential and is often used for stable ion energy.
- RF Bias can be used when you need to match impedance or control coupling, but it introduces time-varying sheath behavior.
- Pulsed Bias can reduce average ion energy while keeping peak energies high enough for densification.
Easy example: For a coating that must remain smooth, pulsed bias can help maintain densification without continuously hammering the surface.
Controlling Ion Energy Distribution
Ion energy is not a single number; it has a distribution shaped by sheath dynamics and collisions. Lower pressure tends to narrow the energy spread because ions experience fewer collisions on the way to the surface.
Easy example: At 1 Pa, ions may arrive with energies close to the sheath potential. At 10 Pa, more collisions occur, and the energy distribution broadens, often increasing micro-roughness.
Managing Self-Bias and Impedance Effects
Self-bias depends on the relative impedance of powered and grounded surfaces. Changing electrode size, insulating layers, or even chuck temperature can alter effective impedance.
Easy example: If you swap a thick ceramic carrier for a thin one, the coupling changes. The same RF power can yield a different self-bias, so you should verify bias with a measurement rather than assuming it stays constant.
Using Feedback and Measurement
A robust workflow measures bias and chamber conditions and then tunes for target ion energy. Even if the system reports “set bias,” the actual sheath potential can differ due to plasma potential shifts.
Easy example: If you target −80 V ion energy but see poor adhesion, check whether the actual substrate bias is drifting during the run, not just whether the controller is set correctly.
Mind Map: Electrode and Bias Levers
Example Workflow: From Setup to Target Ion Energy
- Select configuration: Use an externally biased chuck when you need repeatable ion energy across parts.
- Set plasma chemistry: Fix gas flows and source power to establish the ion population and plasma potential.
- Tune bias: Adjust substrate bias to reach the desired sheath voltage, then hold it steady.
- Check uniformity: Inspect edge versus center thickness or film density; if edges are over-energetic, consider shielding or geometry changes.
- Validate with a simple response: Run a short series varying bias in steps, then choose the lowest bias that achieves the needed densification and adhesion.
This approach keeps the logic clean: electrode geometry defines how fields form, bias defines how strongly ions are accelerated, and measurements confirm that the intended ion energy actually reaches the surface.
2.5 Diagnostics for Plasma Characterization Including Optical and Electrical Methods
Plasma diagnostics answer a practical question: what is happening in the gas and at the surface, and how do we know? The trick is to connect measurements to the specific process goal—film growth rate, ion energy at the substrate, surface activation, or uniformity—without pretending one sensor can do everything.
Mind Map: What to Measure and Why
Optical Diagnostics: Reading the Light
Optical emission spectroscopy (OES) measures photons emitted by excited species. Each line or band corresponds to a transition, so the spectrum is a fingerprint of what is present and how strongly it is excited. A useful starting practice is to record spectra at fixed pressure and gas flow while stepping RF power in small increments. You will typically see emission intensities rise with power, but the relative changes across species reveal whether the discharge is becoming more dissociative or simply hotter.
A concrete example: in an oxygen-argon pretreatment, you may track O I lines alongside Ar lines. If O emission increases faster than Ar emission as power rises, dissociation of oxygen is likely increasing. That matters because surface activation depends on reactive oxygen radicals, not just total plasma brightness.
Actinometry improves this by normalizing to a reference species that tracks overall dissociation. The idea is simple: if a reference line scales with the amount of gas processed, then the ratio of a reactive species line to the reference line estimates relative radical production. For instance, if you use an inert actinometer gas and observe that the ratio of a nitrogen-related line to the actinometer line increases with bias, you can infer that reactive nitrogen formation is strengthening even if total emission changes.
Optical methods also help with uniformity. If your chamber has multiple viewing ports, you can compare spectra across positions. A consistent spectrum shape across ports suggests stable chemistry distribution; a shift in relative line intensities suggests local differences in gas residence time, pumping, or sheath conditions.
Electrical Diagnostics: Measuring the Charge
Electrical methods focus on how the plasma charges surfaces and how much energy ions carry into the sheath. A Langmuir probe is the classic tool: by sweeping probe voltage relative to the plasma, you measure current–voltage behavior and extract electron temperature, plasma potential, and ion saturation current. The practical limitation is that probes disturb the plasma and can be damaged in reactive environments, so they are best used for baseline characterization and careful calibration.
A concrete workflow for a baseline run: first, run a low-risk gas mixture and confirm stable discharge. Then sweep probe voltage slowly enough to avoid hysteresis, and repeat at least three times to check repeatability. If the extracted electron temperature jumps between repeats, the probe may be experiencing transient sheath effects or the discharge may be unstable.
For production monitoring, RF electrical measurements are often more practical. Measuring RF forward and reflected power, along with the matching network settings, tells you whether the discharge is in the intended coupling regime. In many systems, the self-bias voltage on the powered electrode correlates with the ion energy delivered to the substrate. A simple example: if you keep pressure and gas flow constant but see self-bias magnitude drop after a chamber vent, the ion bombardment energy likely changed, which can alter film density and adhesion.
Current and voltage waveforms add nuance. The sheath expands and collapses over the RF cycle, so the instantaneous current shape can indicate whether the discharge is transitioning between modes. If the waveform becomes more distorted while optical emission remains similar, the chemistry may be stable but the ion energy distribution is changing.
Cross Linking: Making Measurements Agree
Optical and electrical diagnostics should be connected through cause-and-effect. Optical emission tells you about excited species and relative dissociation; electrical diagnostics tell you about charge transport and sheath-driven ion energy. For example, if OES shows increasing oxygen radical formation while self-bias stays constant, you can attribute improved surface activation mainly to chemistry. If self-bias increases while OES ratios stay flat, improved activation may come more from stronger ion bombardment than from radical concentration.
Practical Troubleshooting Loop
- Baseline: Record OES spectra and electrical signals at a known-good recipe.
- Change one knob: Adjust RF power, pressure, or gas flow by a controlled amount.
- Compare signatures: Look for consistent trends in OES line ratios and electrical coupling.
- Validate with surface outcome: Confirm adhesion, wettability, or film thickness uniformity matches the diagnostic interpretation.
This loop prevents the common failure mode: fixing the wrong variable because the measurement you trusted was only indirectly related to the surface result.
3. Plasma Surface Preparation for Adhesion and Functional Performance
3.1 Cleaning Strategies for Organic Contaminants and Native Oxides
Plasma coating and thin film deposition start with a simple truth: the surface you clean is the surface you will coat. Organic contaminants and native oxides are the two most common reasons for weak adhesion, poor wetting, and films that look fine until they fail under stress. The goal is not just “clean,” but clean in a way that leaves a surface chemistry and energy state that your next plasma step can work with.
Mind Map: Cleaning Targets and Mechanisms
Step 1: Identify What You’re Removing
Organic contaminants usually show up as low surface energy behavior: water beads, and adhesion can be inconsistent across the part. Native oxides are often more uniform but can still block bonding if they form a stable, chemically inert layer. A practical approach is to check two signals before choosing a method: (1) wetting behavior using a simple water contact angle test, and (2) whether the surface is exposed to air long enough to grow or re-grow oxides.
Example: A stainless-steel fixture that was handled during assembly may have fingerprints and a thin hydrocarbon layer. Water contact angle will often be higher than expected, and plasma activation may initially improve wetting but adhesion can still vary if organics remain.
Step 2: Remove Organics with Compatible Chemistry
For organics, start with methods that dissolve or detach without damaging the substrate.
- Solvent cleaning for oils and greases
- Use a solvent that actually dissolves the contaminant rather than smearing it. Wipe with fresh material, then rinse if the solvent leaves residues.
- Example: For light machining oils on aluminum, a two-stage wipe-rinse approach reduces residue risk. Dry with clean, filtered air or nitrogen to avoid water spotting.
- Detergent and water for particulate and mixed soils
- Detergent helps when contaminants are a mix of oils and dust. Agitation improves emulsification, and thorough rinsing prevents detergent residues from becoming the next contaminant.
- Example: For polymer-coated parts with dust and skin oils, a mild detergent rinse followed by DI water rinse reduces both particulate and organics.
- Thermal desorption for volatile residues
- Gentle heating can drive off adsorbed hydrocarbons. The key is to avoid temperatures that warp polymers or promote oxidation on reactive metals.
- Example: A glass substrate can be baked to remove adsorbed organics, but metals may need a controlled atmosphere or quick transfer to vacuum.
- Plasma oxidation for stubborn organics
- Oxygen-containing plasmas break carbon-hydrogen and carbon-carbon bonds, converting organics into volatile species that leave the surface.
- Example: If a polymer residue persists after solvent cleaning, a short oxygen plasma step can remove it, but overexposure may roughen or change polymer chemistry.
Step 3: Address Native Oxides Without Creating New Problems
Native oxides are tricky because they can be both protective and obstructive. The right strategy depends on the substrate.
- Chemical etching for controlled oxide removal
- Etchants can remove oxides, but they may leave salts or require careful rinsing and drying.
- Example: For some metals, an acid-based etch followed by DI rinse can reduce oxide thickness. If rinsing is incomplete, residues can later interfere with adhesion.
- Ion-based cleaning for activation and sputter removal
- Low-energy ion bombardment can thin oxides and activate the surface by breaking bonds.
- Example: In a plasma system, a brief argon-based sputter/clean step can reduce oxide thickness on metals before reactive deposition.
- Minimize re-oxidation
- Native oxides can regrow quickly after air exposure. The integrated workflow matters: clean, transfer, activate, and deposit with minimal delay.
- Example: If you etch a reactive metal and then wait hours before deposition, you may undo the benefit of cleaning.
Step 4: Use an Integrated Workflow That Matches the Deposition Step
A reliable sequence is:
- Pre-clean in air to remove bulk organics and particulates.
- Transfer to vacuum promptly to limit oxide regrowth.
- Plasma activation tuned to remove remaining organics and lightly activate the oxide surface.
- Immediate deposition to lock in the activated interface.
Example: For a metal-to-film adhesion problem, a common failure mode is “good cleaning, long delay.” Shortening the time between plasma activation and deposition often improves adhesion more than adding extra cleaning steps.
Step 5: Verify Cleaning Effectiveness
Verification prevents guesswork.
- Wetting test: Improved wetting after cleaning suggests reduced organics.
- XPS surface chemistry: A drop in carbon signal and changes in oxide-related peaks indicate progress.
- Adhesion checks: Simple tape or scratch tests can quickly reveal whether the interface is ready.
Example: If contact angle improves but adhesion remains poor, the issue may be oxide chemistry or surface roughness rather than residual organics.
Practical Parameter Guardrails
- Keep plasma activation short when polymers or fine features are involved.
- Use oxygen-containing plasma primarily for organics, and inert or mixed chemistries when oxide thinning or activation is the priority.
- Avoid aggressive sputtering that can roughen surfaces and increase defect density.
A good cleaning strategy is the one that removes the right contaminant with the least collateral damage, then hands the surface to the next step while it is still in the state you intended.
3.2 Surface Activation Using Oxygen Argon and Mixed Gas Treatments
Surface activation is the step where you make a surface easier to wet, bond, and coat. Oxygen argon and mixed-gas treatments do this by changing the top few nanometers: removing weakly bound contaminants, adjusting oxide chemistry, and creating reactive sites that help the next process step “stick” without relying on brute-force adhesion.
Core Concepts That Drive Oxygen Argon Activation
Oxygen is the chemistry side. It forms or modifies surface oxides and introduces oxygen-containing functional groups. Argon is the physics side. It helps by sputtering away loosely attached layers and by assisting surface reactions through energetic ion bombardment.
A useful way to think about the outcome is a balance between three effects:
- Cleaning: removing hydrocarbons, processing residues, and loosely bound adsorbates.
- Chemical functionalization: adding oxygen-containing groups that improve surface energy and wetting.
- Surface roughening at the nanoscale: creating fresh sites and increasing effective area, which can improve adhesion when the film chemistry can interact with those sites.
If you push oxygen too hard without enough ion assistance, you can end up with a surface that is chemically “busy” but still contaminated or poorly bonded. If you push argon too hard without oxygen, you can strip beneficial oxide and leave a surface that re-contaminates quickly.
Oxygen Argon Treatment Workflow
Step 1: Start with a Baseline Clean
Even the best plasma activation cannot fix thick contamination. Begin with a standard cleaning appropriate to the substrate (solvent wipe, detergent wash, or solvent rinse) and dry thoroughly. Then load the parts quickly to reduce re-adsorption of air contaminants.
Step 2: Choose a Treatment Goal
- Improve wetting and adhesion for coatings: prioritize oxygen-driven functional groups with moderate argon assistance.
- Remove native oxides or tailor oxide thickness: use argon more deliberately, but keep oxygen present if you need stable oxide chemistry afterward.
- Activate polymers: oxygen is usually dominant; argon is used carefully to avoid excessive etching.
Step 3: Set Gas Ratios and Power Intelligently
A typical starting point is a mixture where oxygen is the majority and argon is the minority. The oxygen fraction controls the chemical state; the argon fraction controls sputter cleaning and ion-driven activation.
Practical rule: if contact angle is high after treatment, increase oxygen contribution or treatment time. If adhesion is inconsistent and the surface looks overly etched or rough, reduce argon fraction or ion energy.
Step 4: Control Pressure and Residence Time
Lower pressure generally increases mean free path and can make ion energy more predictable at the substrate. Higher pressure increases scattering and can broaden the energy distribution. Longer treatment time increases total dose, but it also increases the chance of over-etching on sensitive materials.
Step 5: Move Directly to the Next Step
Activated surfaces can change quickly due to re-adsorption of contaminants. Minimize the time between activation and deposition or bonding, and keep handling consistent.
Mixed Gas Treatments Beyond Oxygen Argon
Mixed gases let you target specific surface chemistry. Two common patterns are:
- Oxygen plus inert argon for general activation and cleaning.
- Oxygen plus a reactive partner when you need specific functional groups or improved compatibility with a particular film chemistry.
For example, adding a small fraction of a second reactive gas can shift the balance from “oxygen-only” functionalization to a more tailored surface state. The key is to keep the mixture stable and reproducible, because small changes in gas purity or flow ratio can noticeably alter surface chemistry.
Concrete Examples with Reasoning
Example: Activating Aluminum for Better Coating Wetting
Goal: reduce water contact angle and improve film adhesion.
- Use an oxygen-dominant mixture with a modest argon fraction.
- Keep power moderate so you don’t excessively roughen or heat the surface.
- After activation, measure contact angle. If it remains high, increase oxygen dose (time or oxygen fraction) rather than immediately increasing argon.
Reasoning: aluminum surfaces often already have oxide, but it may be contaminated or chemically mismatched to the incoming film. Oxygen helps correct surface chemistry; argon removes the weak boundary layer.
Example: Activating a Polymer Surface for Adhesion
Goal: increase surface energy without destroying the polymer.
- Use oxygen-rich conditions with minimal argon.
- Keep treatment time short and verify by contact angle and surface appearance.
Reasoning: polymers can be etched by energetic ions. Oxygen introduces polar groups that improve wetting, while argon should be limited to avoid turning activation into material loss.
Example: Activating Stainless Steel for Consistent Bonding
Goal: stabilize oxide chemistry and remove hydrocarbons.
- Use oxygen argon with controlled pressure to keep ion energy consistent.
- Confirm repeatability by checking adhesion strength across multiple runs.
Reasoning: stainless steel can form complex oxide states. Oxygen helps standardize the top layer chemistry; argon clears residues that interfere with bonding.
Mind Map: Oxygen Argon and Mixed Gas Activation
Practical Best Practices That Keep Results Repeatable
Use the same loading pattern and minimize time between activation and deposition or bonding. Record gas flows, pressure, power, and treatment time as a single “dose recipe,” because changing one parameter often changes more than one effect. Validate with at least one surface metric (contact angle or a simple wetting test) and one performance metric (adhesion or coating integrity), since chemistry that looks good can still fail mechanically.
Finally, treat oxygen argon as a controlled balance rather than a single “stronger is better” lever. When the balance is right, the surface becomes easier to wet and bond for the next step—without turning activation into unwanted etching.
3.3 Roughness and Topography Control for Improved Film Conformality
Film conformality is limited less by “how good the plasma is” and more by how the surface geometry invites or blocks incoming species. Roughness and topography determine where ions and reactive neutrals land, how they shadow each other, and how quickly the growing film can bridge gaps. The goal is not to make everything perfectly smooth; it is to make the surface predictable enough that the film grows where you expect.
Foundational Concepts of Conformality Limits
Start with three geometric effects.
- Shadowing: Tall features block line-of-sight transport. Even in plasma processes, many species still arrive with a directional component, so deep valleys receive less flux.
- Local field and ion energy variation: Surfaces with sharp curvature can concentrate electric fields, changing local ion bombardment. That shifts densification and reaction rates across the surface.
- Aspect-ratio constraints: As feature depth increases relative to width, the film must bridge over openings. If the bridging step is slower than sidewall growth, you get voids or incomplete coverage.
A practical way to think about it: conformality is a competition between arrival rate (species reaching the bottom) and growth rate (how fast material builds on sidewalls). Roughness increases both the path length and the variability of arrival rate.
Measuring Roughness and Topography in a Way That Guides Process Choices
Use measurements that map to the mechanisms above.
- Ra and Rq give a quick average roughness, but they can hide whether roughness comes from broad waviness or sharp micro-peaks.
- Peak-to-valley height and feature spacing matter for shadowing and bridging.
- 3D surface maps (profilometry or AFM for small scales) help identify whether the surface is dominated by isolated asperities or continuous texture.
A simple workflow: measure the surface before processing, then compare the film thickness distribution after deposition. If thickness is thin only in valleys, you are seeing shadowing. If thickness varies around peaks, you may be seeing local ion energy effects.
Surface Preparation Strategies That Reduce Unwanted Geometry
Roughness control is usually won or lost before the plasma step.
- Mechanical leveling when allowed: If you can machine or polish, do it first. Plasma can smooth at the nanoscale, but it is not a substitute for removing large-scale waviness.
- Controlled chemical cleaning: Residues can create micro-masking, where the film grows differently on leftover islands. A consistent cleaning step reduces “random topography” caused by contamination.
- Pre-treatment smoothing using gentle plasma: A mild plasma can preferentially remove high spots and activate surfaces. The key is to keep the treatment energy low enough to avoid etching that increases roughness.
Easy example: Suppose a polymer part has orange-peel texture from molding. If you only do a strong plasma activation, you may increase micro-roughness and worsen conformality. Instead, use a short, low-power activation to remove surface contamination and slightly soften peaks, then proceed to deposition.
Plasma Parameter Tuning for Conformality on Real Surfaces
Once the surface is reasonably characterized, tune plasma conditions to manage transport and growth.
- Pressure and mean free path: Higher pressure increases collisions, which can reduce directional transport and make arrival more isotropic. That can help fill valleys, but it can also reduce ion energy at the surface. Lower pressure can improve ion-driven densification but may worsen shadowing.
- Substrate bias: Stronger bias increases ion bombardment and can densify sidewalls, but it also increases sensitivity to local curvature. If your surface has sharp asperities, bias can amplify nonuniformity.
- Gas chemistry and reactivity: More reactive chemistries can increase sidewall growth, which helps bridging if bottom coverage is sufficient. If bottom arrival is too low, high reactivity can still trap voids.
A concrete example: For a high-aspect-ratio trench, start with conditions that improve bottom arrival (often via pressure and chemistry choices), then use bias just enough to densify without over-etching or exaggerating curvature effects.
Advanced Topography Control Techniques and Their Tradeoffs
- Graded or multilayer growth: Deposit a thin initial layer that can nucleate on sidewalls and openings, then follow with a thicker layer once coverage is established. This reduces the chance that early shadowing locks in voids.
- Conformal interlayers: An interlayer with better wetting or nucleation behavior can bridge micro-gaps more reliably than the main film.
- Etch-back balancing: If the process includes plasma assistance, a small amount of controlled etching can remove weakly bound material on peaks, improving uniformity. Too much etch-back increases roughness and reduces thickness in valleys.
Mind Map: Roughness and Topography Control
Worked Example: Choosing a Strategy for a Textured Substrate
Imagine a ceramic insert with micro-pores and a roughness that is mostly peak-to-valley rather than widespread waviness.
- If you see film thickness missing only at pore bottoms, focus on improving bottom arrival by adjusting pressure and chemistry.
- If you see thin regions near sharp peaks, reduce bias intensity or shorten the high-energy portion of the cycle to limit curvature-driven nonuniformity.
- If you see early voids that later layers cannot fill, switch to a thin nucleation step or an interlayer so bridging starts earlier.
The common thread is that roughness control is not a single knob. It is a sequence: measure the geometry, remove what you can before plasma, then tune plasma conditions so growth kinetics match the surface’s shape.
3.4 Surface Energy Tuning for Wetting Bonding and Coating Uniformity
Surface energy tuning is the practical art of making a surface “want” to interact with a liquid or a coating precursor in a predictable way. In plasma processing, you typically adjust surface chemistry and near-surface structure so that wetting, adhesion, and film spreading stop behaving like a coin toss.
Foundations: What Surface Energy Controls
Surface energy is not one number in real life; it’s a balance of polar and dispersive interactions at the outermost molecular layer. When a droplet lands, the contact angle reflects how well the surface can attract the liquid. Lower contact angles generally mean better wetting, but the best value depends on the next step: bonding may need strong interfacial interactions, while coating uniformity may need controlled spreading without excessive run-off.
A useful mental model is to treat the surface as a thin “reaction-ready” skin. Plasma can change that skin by introducing functional groups (often oxygen-containing) and by altering how much of the surface is able to form bonds with incoming species.
Plasma Levers That Change Surface Energy
- Chemical functional groups: Oxygen-containing groups (such as hydroxyl and carbonyl-like species) increase polar character. This often improves wetting for water-based systems and increases the likelihood of chemical bonding during curing or deposition.
- Surface roughness at the relevant scale: Mild increases in roughness can enhance apparent wetting through micro-wetting effects. Too much roughness can trap air and create nonuniform wetting, which later becomes nonuniform coating.
- Contamination removal and recontamination control: Plasma cleaning can raise surface energy by removing hydrocarbons. However, surfaces can partially recover hydrophobicity after exposure to air, so timing between treatment and coating matters.
- Plasma dose and energy: Higher effective dose can increase functional group density but may also over-etch polymers or damage delicate substrates, reducing uniformity and sometimes lowering surface energy by creating a more graphitic, less polar surface.
Mind Map: Surface Energy Tuning Workflow
Systematic Practice: From Measurement to Process Settings
Step 1: Establish the baseline wetting behavior. Measure contact angle with at least one liquid that matches your process environment (commonly water for polar surfaces, and a second liquid if your coating chemistry is nonpolar). Record droplet volume, dispense height, and time to stabilize; otherwise, you’ll measure your setup instead of the surface.
Step 2: Pick a plasma chemistry that targets the interaction you need.
- If the surface is contaminated and too hydrophobic, start with an oxygen-containing plasma to remove hydrocarbons and add polar groups.
- If you need activation without aggressive oxidation, use argon or a mixed gas to clean and activate while limiting chemical modification.
Step 3: Tune dose rather than jumping to the maximum. A practical approach is to run a short series of treatments (for example, low, medium, high exposure) while keeping pressure and power constant. After each treatment, measure contact angle quickly and repeatable. You’re looking for a plateau where additional dose no longer improves wetting.
Step 4: Manage roughness and damage. For polymers, excessive oxygen plasma can create a brittle, overly oxidized layer that wets well initially but bonds poorly after curing due to weak interfacial cohesion. If you see rapid loss of adhesion after treatment, reduce dose or shift to a gentler activation step.
Step 5: Control the time gap to coating. If the surface energy drops after air exposure, you’ll see it as a contact angle increase and later as coating beading or edge pullback. In practice, minimize the delay between plasma treatment and coating, and keep handling consistent.
Example: Making a Polymer Surface Wet Like It Means It
Suppose a polymer part shows a water contact angle of 90°. You want uniform primer wetting before a thin film deposition step.
- Baseline check: Confirm the contact angle is stable over a few minutes.
- Oxygen plasma activation: Treat with an oxygen-rich recipe at a low dose. Re-measure contact angle after a fixed delay.
- Dose adjustment: If contact angle drops to 40° but coating still shows patchy coverage, increase dose slightly. If contact angle drops below 20° but adhesion tests show peeling, you likely over-oxidized the surface; reduce dose and consider a mixed gas approach to limit damage.
- Uniformity verification: Inspect coating coverage under consistent lighting and measure thickness uniformity across the part. Patchy wetting often correlates with thickness nonuniformity.
Example: Improving Bonding Without Creating a Roughness Problem
For a metal surface intended for strong bonding, you may not need extreme wetting. Instead, you want consistent interfacial chemistry.
- Use a cleaning/activation step to remove organics and native films.
- Verify wetting with a liquid that reflects your bonding chemistry rather than only water.
- If wetting improves but bonding is inconsistent, the issue may be chemical state heterogeneity across the surface. In that case, focus on uniform plasma exposure and substrate positioning rather than further increasing oxygen content.
Practical Checkpoints and Failure Modes
- Hydrophobic recovery: Contact angle rises after air exposure; fix by reducing delay and improving cleanliness.
- Over-etching: Contact angle improves but adhesion worsens; fix by lowering dose and moderating oxygen fraction.
- Nonuniform roughness: Wetting varies across the part; fix by improving geometry, fixturing, and plasma uniformity.
- Drift from gas purity: Results change run-to-run; fix by controlling gas quality and stabilizing process conditions.
Surface energy tuning works best when you treat it like a controlled variable: measure wetting, adjust plasma chemistry and dose with intent, and verify the outcome with both coating uniformity and adhesion behavior.
3.5 Practical Workflows for Preparing Metals Polymers Ceramics and Composites
A practical plasma-preparation workflow starts with a simple question: what must the surface do after treatment—wet, bond, coat uniformly, or resist failure modes like delamination and pinholes? The answer determines the cleaning chemistry, activation intensity, and whether you need an interlayer strategy.
Step 1: Triage the Surface Condition
Begin by classifying the surface into four buckets: contamination, native oxide or passivation layer, surface energy mismatch, and topography that will trap defects. A quick shop-floor check helps: water beading suggests low surface energy; visible smearing or fingerprints suggest organics; dull or uneven coloration often signals oxide or corrosion; and roughness that looks “sparkly” under light can cause shadowing during deposition.
Example: If a stainless part shows oily handling marks and the coating later peels at edges, you likely have organics plus an edge-related activation gap.
Step 2: Choose the Plasma Goal and Match the Gas Chemistry
Use oxygen-containing plasmas when organics and hydrocarbons dominate, and use inert or mixed gases when you need physical activation without excessive oxidation. For polymers, oxygen plasma typically increases wettability but can also over-etch; for ceramics, oxygen plasma can help remove weak boundary layers but may not fix poor adhesion alone.
A useful rule of thumb: aim for activation that improves bonding and wetting while keeping the surface chemically stable enough for the next step.
Step 3: Standardize the Hardware and Handling
Repeatability beats heroics. Keep substrate loading consistent, minimize time between plasma activation and coating, and control pressure and gas purity. Use a consistent mounting method so the same areas see the same plasma exposure.
Example: If you activate one batch and coat it an hour later, the surface can partially recover (especially polymers), changing wetting and adhesion.
Step 4: Apply Material-Specific Workflows
Metals Workflow
- Degrease to remove bulk oils using an approved solvent or detergent step.
- Plasma clean with oxygen or oxygen/argon to remove remaining organics and lightly modify oxide.
- Optional ion-assisted activation using a mixed inert gas to increase surface reactivity without excessive oxidation.
- Proceed to deposition promptly.
Example: For aluminum, oxygen plasma can improve oxide cleanliness, but too aggressive exposure can thicken oxide and reduce interfacial bonding for some film systems. Use short, repeatable cycles and verify with adhesion testing.
Polymers Workflow
- Mechanical cleaning to remove dust and loose debris.
- Oxygen plasma activation to raise surface energy and remove low-molecular-weight contaminants.
- Control exposure time to avoid excessive roughening and embrittlement.
- If bonding is critical, consider a thin interlayer deposition step immediately after activation.
Example: A polyethylene component may become wettable after oxygen plasma, but if you over-treat, it can turn brittle and show micro-cracking under thermal cycling. Start with brief pulses and measure contact angle changes.
Ceramics Workflow
- Remove residues from polishing or sintering using a compatible cleaning method.
- Plasma activation to clean the near-surface and improve chemical compatibility.
- Address surface charging and uniformity by ensuring stable plasma conditions and proper substrate positioning.
- Use interlayers when needed to manage mismatch in chemistry.
Example: For alumina, plasma cleaning can improve coating wetting, but adhesion may still be limited by a weak boundary layer. A carefully chosen interlayer can convert a brittle interface into a more robust one.
Composites Workflow
- Identify the dominant surface (fiber type, sizing, resin-rich regions).
- Target removal of sizing and resin contaminants with oxygen-containing plasma.
- Avoid preferential etching that exposes fibers unevenly.
- Use staged activation if the surface is heterogeneous.
Example: A carbon-fiber composite may show different activation behavior on fiber-rich versus resin-rich zones. Staged treatment helps prevent one region from becoming overly rough while another remains contaminated.
Step 5: Verify the Outcome Before Committing to Deposition
Verification should be quick and decision-oriented.
- Wetting check: contact angle or simple droplet behavior.
- Adhesion screening: small coupon tests with the same coating recipe.
- Surface chemistry sanity check: if available, confirm removal of organics and appropriate oxide state.
Example: If wetting improves but adhesion fails, the issue may be interfacial chemistry or stress, not just cleanliness.
Mind Map: Practical Preparation Workflow
Example: One Batch, Four Materials, One Coating Recipe
Treat each material with the same deposition recipe but different preparation steps.
- Metals: oxygen clean, short inert activation, coat immediately.
- Polymers: brief oxygen activation, confirm wetting, coat quickly.
- Ceramics: residue removal, plasma activation, add interlayer if adhesion screening flags weakness.
- Composites: staged oxygen activation to handle heterogeneity, then coat.
The key is that the preparation step is not a single “cleaning” action; it is a controlled interface-building sequence that matches each material’s chemistry and failure risks.
4. Plasma Coating Processes and Deposition Mechanisms
4.1 Overview of Plasma Coating Approaches Including Reactive and Nonreactive Modes
Plasma coating uses energetic species in a gas discharge to build a film on a surface. The core difference between approaches is whether the film is formed mainly from sputtered or evaporated coating material (nonreactive) or from chemical reactions that create the film from reactive gases (reactive). In practice, both modes can be mixed, but it helps to start with the clean separation.
Mind Map: Plasma Coating Approaches
Nonreactive Modes: Film Formation from the Coating Source
In nonreactive plasma coating, the film’s elements largely come from a solid or liquid source that is physically transferred to the substrate. A common example is magnetron sputtering of a metal target in an inert gas like argon. Argon ions accelerate toward the target, ejecting atoms that travel through the chamber and condense on the substrate.
Ion bombardment still matters. Even when the chemistry is “nonreactive,” ions can change how arriving atoms pack, which affects density, stress, and adhesion. A simple way to picture it: neutrals bring material, ions decide how tightly it lands and whether it can rearrange before being buried.
Easy example: You want a titanium nitride-like hardness but you don’t want nitrogen chemistry. You sputter titanium in argon only, producing a titanium film. It may be softer than TiN, but it will be compositionally close to titanium because no reactive gas is supplying nitrogen.
What to watch:
- Pressure: Higher argon pressure increases scattering, which can reduce energy at the substrate and change microstructure.
- Substrate bias: More negative bias increases ion energy, often improving density but also raising stress and risk of cracking.
- Target power: Higher power increases deposition rate and can shift microstructure if the substrate cannot dissipate heat.
Reactive Modes: Film Formation from Gas Chemistry
Reactive plasma coating adds a reactive gas such as oxygen, nitrogen, or a hydrocarbon to form compounds. The film composition becomes a function of how much reactive gas is present and how efficiently it is incorporated at the surface.
A key concept is that reactive gas can be consumed in two places: at the target (affecting sputtering yield) and at the substrate (affecting film growth). This is why reactive systems often show “mode switching” behavior: as reactive gas flow increases, the target surface can transition from metallic to compound-covered, changing the discharge and deposition rate.
Easy example: You sputter a metal target in argon plus oxygen to form an oxide film. At low oxygen partial pressure, the target remains mostly metallic, sputtering proceeds efficiently, and the film may be oxygen-deficient. As oxygen increases, the target surface becomes more oxidized, sputtering yield drops, and the film becomes more stoichiometric.
What to watch:
- Reactive gas fraction: Small changes can cause large composition shifts.
- Discharge stability: Unstable plasma can produce thickness and composition fluctuations.
- Transport and residence time: Pumping speed and chamber volume affect how quickly reactive species reach the substrate.
Comparing Reactive and Nonreactive Modes Without Confusion
A practical comparison is to ask: “Where does the film’s identity come from?”
- Nonreactive: identity comes mainly from the target material; plasma energy tunes packing and adhesion.
- Reactive: identity comes from both the target and the reactive gas; plasma energy tunes both incorporation and reaction pathways.
This difference shows up in process tuning. In nonreactive coating, you typically adjust deposition rate and microstructure using power, pressure, and bias. In reactive coating, you also manage chemistry balance, often requiring tighter control of gas flows and partial pressures.
Integrated Example Workflow: Choosing the Mode
Suppose you are coating a steel component and want a hard, corrosion-resistant surface.
- Start with nonreactive logic if you need a simple barrier layer from a chosen target metal. You would sputter that metal in argon and use bias to increase density.
- Switch to reactive logic if you need a compound that matches the application, such as an oxide or nitride. You would introduce oxygen or nitrogen and tune reactive gas fraction to reach the desired stoichiometry.
- Use the same surface preparation step in both cases: remove oils and native contaminants so the first monolayers bond reliably. Otherwise, the mode choice won’t save adhesion.
In both approaches, the plasma is not just a “deposition engine.” It is also a surface-conditioning tool that controls how atoms arrive, react, and lock into the growing film.
4.2 Sputtering and Ion Assisted Deposition Mechanisms at the Surface
Sputtering and ion assisted deposition are two closely linked ways to build thin films in plasma environments. In both, the surface is the main character: ions and energetic neutrals arrive, atoms are ejected or activated, and the growing film reorganizes to match the energy it receives.
Core Idea from Plasma to Surface
Start with a plasma where electrons accelerate under an electric field and collide with gas atoms. Those collisions create ions and excited species. Near the substrate, the sheath forms: a region where the electric field accelerates positive ions toward the surface. The key consequence is that the surface sees an ion energy distribution rather than a single energy value.
A simple mental model is this: sputtering is the surface losing atoms due to ion bombardment, while ion assisted deposition is the surface gaining atoms with help from that same bombardment. Whether the net result is growth or erosion depends on the balance between incoming fluxes and sputter yield.
Sputtering Mechanism at the Surface
In physical sputtering, an energetic ion transfers momentum to surface atoms. If the transferred energy exceeds the local binding energy, atoms are ejected. The ejection is not perfectly directional; it includes a distribution of angles and energies that affects how redeposition occurs.
Two practical details matter for film engineering:
- Sputter yield depends strongly on ion energy and incidence angle. Higher ion energy generally increases yield, but the relationship is not linear. At oblique angles, yield often rises due to more efficient momentum transfer.
- Sputtered atoms can redeposit. In many magnetron systems, sputtered species travel and land on the substrate or chamber walls. That means the film composition can be influenced by geometry and pumping, not just target material.
A concrete example: if you sputter a copper target in argon, increasing ion energy can raise the rate at which copper atoms are ejected. If the substrate is also receiving enough energy to resputter copper, the net growth rate may plateau or even drop.
Ion Assisted Deposition Mechanism
Ion assisted deposition adds a second layer: ions arriving during growth can modify how arriving atoms stick, migrate, and incorporate.
Common surface effects include:
- Enhanced adatom mobility. Energetic bombardment can help atoms move across the surface before they become locked in place.
- Densification. Ion bombardment can knock loosely bound atoms into more compact configurations, reducing voids.
- Re-sputtering of weakly bound species. This can improve film purity by removing atoms that would otherwise remain only because they landed at the wrong time.
A useful way to think about it is energy budgeting. If the ion energy is too low, atoms may stick where they land, producing porous or columnar microstructures. If it is too high, the surface can be repeatedly damaged and growth can become inefficient.
Coupling Between Sputtering and Growth
In many plasma coating processes, sputtering is not a separate step; it is the source of arriving flux. The target sputters atoms into the gas phase, and the substrate receives a mix of arriving neutrals and ion bombardment.
The net deposition rate can be described conceptually as:
- Incoming deposition flux from sputtered atoms (and any reactive species)
- Minus the fraction of those atoms removed by resputtering at the substrate
- Plus any redeposition from chamber surfaces
This is why two runs with the same target power can produce different films: substrate bias changes ion energy at the surface, which changes resputtering and densification.
Microstructure Consequences
Ion assisted deposition strongly influences microstructure because it changes the balance between surface mobility and damage.
- Low ion energy: more columnar growth, higher porosity, and weaker interfacial bonding.
- Moderate ion energy: improved packing, better adhesion, and reduced defect density.
- High ion energy: increased defect generation, possible stress buildup, and roughening from repeated bombardment.
Example: depositing a hard nitride film on a polymer substrate. Without ion assistance, the film may be discontinuous because the polymer surface cannot provide stable nucleation. With controlled ion assistance, the film can become continuous, but excessive ion energy can also overheat or damage the polymer surface, leading to poor adhesion.
Mind Map: Sputtering and Ion Assisted Deposition
Example Workflow for Mechanism-Based Tuning
- Choose a baseline deposition condition that gives a stable discharge and a reasonable deposition rate.
- Adjust substrate bias in small steps while keeping target power and gas flow fixed.
- Watch for microstructure shifts using simple indicators: surface roughness trends, adhesion behavior, and density-related performance (for example, wear resistance in tribology tests).
- Stop when the film stops improving. If increasing bias reduces growth rate and increases roughness, you are likely moving from helpful densification into excessive resputtering and damage.
This mechanism-first approach keeps the process grounded: you are not chasing a number, you are steering the energy balance at the surface so atoms can arrive, reorganize, and stay.
4.3 Plasma Enhanced Chemical Vapor Deposition for Thin Film Growth
Plasma Enhanced Chemical Vapor Deposition (PECVD) grows thin films by combining gas-phase chemistry with surface reactions, while a plasma supplies extra energy to make reactive species. Compared with purely thermal CVD, PECVD can often run at lower substrate temperatures because the plasma helps dissociate stable molecules into radicals and ions that react at the surface.
Core Idea from Gas to Surface
PECVD starts with a feed gas mixture flowing into a vacuum chamber. The plasma region converts part of that mixture into reactive fragments. Near the substrate, these fragments adsorb, migrate across the surface, react, and then desorb as byproducts, leaving behind a solid network.
A useful mental model is a three-step chain:
- Generation: plasma creates radicals and excited molecules.
- Transport: species move from the plasma to the substrate.
- Surface reaction: adsorbed species form the film and release volatile byproducts.
If any step is weak, growth slows or the film composition shifts. For example, too little plasma power reduces radical density, while too high pressure increases gas-phase collisions that can either help or hurt depending on chemistry.
Mind Map: PECVD Growth Mechanism
How Plasma Changes the Chemistry
In thermal CVD, many precursors require high temperatures to break bonds. In PECVD, the plasma performs bond breaking more efficiently, so the surface can build the film at lower temperatures.
Two practical consequences show up in real recipes:
- More reactive fragments arrive at the surface, so growth can start quickly after ignition.
- More hydrogen-containing species may be present when hydrogen-bearing precursors are used, which can reduce film density but also passivate dangling bonds.
A concrete example is depositing silicon nitride using a silicon precursor plus a nitrogen source. In PECVD, the plasma can generate nitrogen radicals that react with silicon-containing fragments, forming Si–N bonds even when the substrate temperature is lower than what thermal routes would require.
Parameter Effects That Actually Matter
RF Power
Higher RF power generally increases radical production and ion activity. The tradeoff is that excessive power can raise ion bombardment, which may densify the film but also increase stress or create defects.
Example: If a film is too porous and shows high etch rate, slightly increasing power can densify it. If the film then cracks or delaminates, reduce power or lower ion energy by adjusting bias.
Pressure
Pressure influences mean free path and collision frequency. At higher pressure, more collisions occur before species reach the substrate, which can increase residence time and change the balance between surface deposition and gas-phase reactions.
Example: For uniformity across a wafer, moderate pressure often helps because species distribution becomes less directional. If you see thickness gradients, check whether pressure and flow geometry are causing uneven delivery.
Substrate Temperature
Temperature still matters because surface reactions and desorption compete. PECVD can reduce the required temperature, but it does not remove the need for enough thermal energy to rearrange bonds.
Example: A film deposited at very low temperature may have higher hydrogen content and lower density. Raising temperature slightly can improve bonding and reduce hydrogen-related instability.
Gas Ratios
Stoichiometry is controlled by precursor ratios and how completely each precursor is converted in the plasma. If the nitrogen source is insufficient, the film may become silicon-rich; if too much nitrogen is present, growth can slow due to less favorable surface chemistry.
Example: In silicon oxide deposition from a silicon precursor and an oxygen source, increasing oxygen fraction can shift the film toward higher oxygen content, which typically increases dielectric strength but may reduce refractive index depending on bonding structure.
Advanced Details: Ion-Assisted Surface Reactions
Even when the main chemistry is radical-driven, ions can influence film growth. Ion bombardment can:
- increase surface mobility by local energy input,
- break weak bonds and promote densification,
- change the balance between deposition and etching.
This is why two PECVD runs with the same gas ratio and temperature can yield different densities. The difference often comes from ion energy, which depends on plasma power, pressure, electrode spacing, and any substrate bias.
Example: If a film grows too slowly despite abundant radicals, ion-assisted etching might be competing with deposition. Lowering ion energy or adjusting pressure can restore net growth.
Practical Recipe Logic with a Worked Example
Suppose the goal is a dense dielectric film with low defect density.
- Start with a baseline gas mixture and moderate pressure.
- Increase RF power gradually until the growth rate reaches a stable, repeatable level.
- If the film remains too porous, raise substrate temperature slightly or increase power a bit more, but watch for stress.
- If stress increases and cracking appears, reduce ion energy by lowering power or adjusting bias rather than continuing to push temperature.
This approach treats PECVD as a controlled balance: radical supply, transport conditions, and surface reaction pathways all have to agree.
Mind Map: Troubleshooting by Mechanism
Summary of the Growth Chain
PECVD thin films form when plasma-generated reactive species reach the substrate and react to build a solid network. The art is not just “more plasma,” but matching radical generation, transport conditions, and surface reaction balance so the film’s bonding, density, and composition come out where you need them.
4.4 Plasma Assisted Atomic Layer Deposition for Conformal Film Formation
Atomic layer deposition (ALD) builds films one surface reaction at a time. In its classic form, the substrate alternates between exposure to a precursor and a reactant, with each step self-limiting. Plasma-assisted ALD (PA-ALD) replaces the reactant step with a plasma, which can be more effective at activating bonds on surfaces that are hard to react with purely thermal chemistry. The payoff is conformal coverage on high-aspect-ratio features, plus better control over film density and composition.
Core Idea of Conformality
Conformality comes from two constraints working together. First, each ALD half-cycle saturates the available reactive sites rather than continuing indefinitely. Second, the reactive species must reach deep into pores before they are consumed. In PA-ALD, the plasma step can be tuned so that the dominant reactive species are short-lived enough to react near where they arrive, yet energetic enough to complete the surface reaction.
A simple mental model: precursor exposure “paints” the surface with a functional group, then the plasma “finishes the job” by converting that group into the next solid-state layer. If either step is not self-limiting or the plasma species are too reactive at the entrance, the film becomes thicker near the mouth of the feature.
Step-by-Step Process Logic
A typical PA-ALD cycle has four conceptual phases: precursor pulse, purge, plasma exposure, and purge. The purge is not optional; it prevents gas-phase reactions that would deposit film where you are not trying to coat.
-
Precursor pulse: The precursor adsorbs on surface sites and forms a saturated monolayer. Example: for an oxide film, a metal-organic precursor can attach to hydroxylated surface groups, leaving a ligand shell behind.
-
Purge: Inert gas removes excess precursor and byproducts. Example: if you skip purge, the plasma step may react with leftover precursor in the chamber volume, creating nonconformal “fog” deposition.
-
Plasma exposure: Reactive plasma species (often radicals and ions) remove ligands and create new surface terminations. Example: oxygen plasma can convert remaining organic fragments into volatile products and regenerate hydroxyl-like sites for the next cycle.
-
Purge: Clears plasma-generated byproducts and stabilizes the next precursor adsorption step.
Plasma Species and Why They Matter
Plasma contains a mix of electrons, ions, and neutral radicals. For conformal growth, neutrals and radicals typically dominate because they can penetrate deeper than ions, which are strongly influenced by electric fields and sheath formation near surfaces.
Practical implication: if ion bombardment is too strong, it can enhance reactions at the feature entrance and cause “top-side biasing.” If it is too weak, ligands may not be fully removed, leaving carbon-rich residues and poor film quality.
Controlling Conformal Growth with Process Knobs
Pressure and mean free path: Higher pressure increases collisions, which can broaden the distribution of reactive species and reduce penetration depth. Lower pressure can improve transport but may reduce plasma density.
Plasma power and duty cycle: More power increases radical production but also increases ion energy and sheath effects. A common best practice is to keep the plasma step short and use enough power to complete ligand removal without over-etching.
Substrate bias and distance to plasma: Bias increases ion energy at the surface. Keeping bias modest helps preserve uniformity in deep features. Increasing distance between plasma source and substrate can reduce ion flux while maintaining radical availability.
Gas chemistry: Oxygen, nitrogen, hydrogen, or mixed plasmas change surface termination and film stoichiometry. Example: oxygen-rich plasma tends to produce denser oxides, while nitrogen-containing plasmas can shift film properties toward nitrides or oxynitrides.
Mind Map: Plasma Assisted ALD Conformality
Example: Conformal Oxide in a Narrow Trench
Imagine coating a trench with aspect ratio 10:1. Start with a surface that has hydroxyl groups, either from substrate preparation or an initial conditioning cycle. Use a precursor pulse long enough to saturate the trench walls, then purge thoroughly. During the plasma step, choose conditions that generate abundant oxygen radicals but limit ion energy by keeping substrate bias low and plasma time short.
What you should see if the process is working: thickness varies modestly along the trench depth, and the film is dense enough to be continuous rather than porous. If thickness is much higher at the entrance, reduce ion energy or shorten the plasma step. If the film shows poor electrical insulation or contains carbon residue, increase oxygen radical availability by adjusting plasma power or plasma chemistry while preserving transport.
Advanced Details Without the Mystery
Self-limiting behavior must be verified: Even with ALD timing, some chemistries can have partial saturation. A practical approach is to confirm that growth per cycle is stable over a range of precursor pulse lengths.
Plasma step should be reaction-limited, not transport-limited: If the plasma is so reactive that it consumes radicals near the entrance, the growth becomes transport-limited. Tuning pressure, power, and bias shifts the balance back toward surface reaction.
Surface termination continuity: Each cycle must leave a termination that the next precursor can react with. Plasma conditions that over-etch or over-oxidize can reduce the number of adsorption sites, lowering growth rate and harming uniformity.
Case-Style Checklist for Conformal PA-ALD
- Precursor pulse long enough for saturation, not just exposure
- Purge long enough to prevent gas-phase reactions
- Plasma step strong enough for ligand removal, not so strong that it drives entrance-only reactions
- Bias kept modest to reduce ion-driven nonuniformity
- Chemistry chosen to match the desired film stoichiometry and cleanliness
When these pieces align, PA-ALD behaves like a disciplined conversation between surface sites and reactive plasma species: one step prepares, the next step completes, and the film grows evenly where the chemistry allows it.
4.5 Deposition Parameter Sets for Thickness Rate Uniformity and Composition Control
Thickness rate uniformity and composition control are linked problems: the same knobs that change how fast material arrives at the surface also change what arrives. A good parameter set therefore starts with a target and works backward through transport, plasma chemistry, and surface growth.
Start with Measurable Targets
Define three numbers before touching the recipe: (1) target thickness rate, (2) allowed thickness nonuniformity across the substrate, and (3) composition tolerance (for example, stoichiometry range or metal-to-oxide ratio). A practical example is a 100 nm coating where you can tolerate ±5% thickness variation and ±2 at.% composition drift. These tolerances determine how tightly you must control pressure, gas flow balance, and bias.
Map the Process into Three Control Loops
Think of the deposition as three coupled loops.
-
Transport loop controls how much precursor reaches each location. Pressure, pumping speed, and gas inlet geometry dominate this loop.
-
Plasma chemistry loop controls what fraction of arriving species becomes the film-forming set. Gas ratios, power, and reactive gas fraction dominate this loop.
-
Surface growth loop controls how the arriving species incorporate. Substrate bias, temperature, and ion-to-neutral ratio dominate this loop.
If you change only one knob, you often move all three loops. The goal is to move them in the same direction toward the targets.
Parameter Set for Thickness Rate Uniformity
Uniformity usually fails for one of two reasons: (a) the deposition rate is higher near the gas inlet or center due to flow patterns, or (b) the plasma density or ion flux varies across the substrate.
A systematic parameter set uses these steps:
-
Pressure and pumping balance: Choose a pressure that keeps mean free path short enough for species to “forget” their initial direction, but not so high that reactions become overly local. Example: if your center grows 10% faster than the edge, slightly increasing pressure can smooth transport by increasing scattering, while reducing total flow can prevent excessive local depletion.
-
Gas distribution tuning: Adjust inlet position or use multiple inlets to reduce concentration gradients. Example: for a circular wafer, a single central inlet can overfeed the center; adding a secondary inlet or changing inlet angle often reduces the center-to-edge gradient.
-
Power distribution and plasma confinement: In many reactors, power affects plasma density nonuniformly. Example: if thickness is higher at the center, lowering power while increasing time can sometimes preserve composition while reducing rate gradients, because plasma density may scale differently across the wafer.
-
Substrate bias uniformity: Bias can change local ion bombardment and thus sticking. Example: if edge regions show lower rate, check whether bias is less effective at the edge due to geometry; improving electrode shielding or adjusting bias waveform can help.
Parameter Set for Composition Control
Composition control is mostly about controlling the relative incorporation of species. In reactive or multi-source systems, composition drifts when the plasma chemistry shifts faster than the surface can incorporate.
A systematic parameter set:
-
Fix thickness rate first, then tune composition: If you chase composition by changing power and pressure simultaneously, you lose the ability to interpret results. Example: hold pressure and total power constant, then adjust the reactive gas fraction in small steps while monitoring composition.
-
Use a “ratio knob” approach: For multi-gas systems, vary one ratio at a time (for example, precursor A to precursor B) while keeping total flow constant. Example: if you increase oxygen fraction to raise oxide content, keep total flow constant so transport conditions remain similar.
-
Control ion-to-neutral balance: Ion bombardment can change surface chemistry and densification, affecting incorporation. Example: if composition becomes too metal-rich when you increase bias, reduce bias slightly and compensate thickness rate with deposition time or source power.
-
Stabilize reactive chemistry: Reactive gas depletion near the surface can cause local composition changes. Example: if composition is higher at the center, reduce reactive gas fraction slightly and increase pressure modestly to improve uniformity of reactive species arrival.
Integrated Mind Map
Mind Map: Deposition Parameter Sets for Uniformity and Composition
Worked Example with a Coherent Recipe Strategy
Suppose you deposit a reactive film where oxygen fraction controls stoichiometry, and you observe center-to-edge thickness nonuniformity of +8% and composition drift of +3 at.% oxygen at the center.
-
Stabilize transport: Increase pressure slightly and reduce total flow to smooth gradients. Re-run long enough to measure thickness confidently.
-
Lock thickness rate: Adjust deposition time to hit the target average thickness rate without changing the plasma chemistry.
-
Tune composition with a ratio knob: Vary oxygen fraction in small increments while keeping total flow and power constant. Measure oxygen content at center and edge.
-
Correct incorporation if needed: If edge oxygen content lags even after transport smoothing, reduce substrate bias slightly and compensate thickness rate with time. This keeps ion-driven incorporation from over-amplifying the center chemistry.
The key is that each run changes one logical lever at a time, so you can attribute improvements to transport, chemistry, or surface growth rather than guessing.
Quick Parameter Checklist for Recipe Documentation
Record these items for every run so later adjustments remain interpretable: pressure, total flow, inlet configuration, power level, reactive gas fraction, substrate bias level, substrate temperature, deposition time, and the measured thickness and composition maps. When the maps improve together, you have a parameter set that is doing the right job for the right reason.
5. Thin Film Materials and Composition Engineering
5.1 Metals Alloys and Conductive Oxide Films for Electrical and Tribological Use
Metals, Alloys, and Conductive Oxide Films for Electrical and Tribological Use
Electrical and tribological performance often fight each other: low electrical resistance prefers dense, continuous conduction paths, while wear resistance prefers stable microstructures and strong interfaces. The practical solution is to engineer both the substrate surface state and the film’s composition, microstructure, and adhesion so that electrical conduction survives mechanical contact.
Core Materials Roles
Metals and alloys provide mechanical strength and electrical pathways, but their surfaces oxidize and roughen under load. Conductive oxide films (typically transparent or semiconducting oxides) add a controlled surface chemistry and can form protective layers that slow wear and reduce friction. The key is matching the film’s electrical conduction mechanism to the way it will be stressed: sliding contact favors films that remain continuous and chemically stable at the contact temperature.
Metals and Alloys for Electrical Conductors
Copper, nickel, and aluminum alloys are common conductor substrates. Their oxide layers can increase contact resistance, especially after plasma exposure or thermal cycling. A useful baseline practice is to treat the surface so that the first deposited layer wets and bonds well, then choose a film that tolerates the substrate’s oxide chemistry.
Alloys add another lever: alloying elements can strengthen the near-surface region and influence oxidation behavior. For example, adding elements that form more stable oxides can reduce the growth of thick, resistive scales. In practice, you still need to control surface cleanliness before coating, because even a thin organic film can disrupt both adhesion and electrical contact.
Tribological Behavior of Metal Surfaces
Wear mechanisms depend on hardness, microstructure, and oxide stability. Soft metals tend to smear and form transfer films, which can lower friction but may increase variability in electrical contact. Harder alloys resist plastic deformation, but brittle surface phases can crack and expose fresh metal, accelerating oxidation.
A simple way to reason about it: if the surface repeatedly breaks and reforms, electrical resistance will drift because the conduction path keeps changing. If the surface stays mostly intact, the conduction path remains stable.
Conductive Oxide Films for Electrical and Wear Performance
Conductive oxide films are often engineered around controlled oxygen content and dopants. Their conductivity can come from charge carriers created by oxygen vacancies or dopant substitution. Tribologically, the film must resist cracking and maintain continuity under shear.
Two practical design targets are continuity and defect control. Continuity reduces local current crowding, which otherwise heats spots and accelerates wear. Defect control balances conductivity with mechanical stability: too many vacancies can soften the film or make it chemically reactive under sliding.
Mind Map: Material Selection Logic
Integrated Best Practices with Examples
-
Start with a surface state you can repeat. If you coat a copper alloy that has a patchy oxide layer, your film adhesion and resistance will vary run to run. A practical workflow is: controlled plasma cleaning to remove organics, then immediate deposition without long air exposure.
-
Use an interlayer when chemistry mismatches. If the substrate oxide is thick or chemically incompatible with the conductive oxide, the film can delaminate under shear. A thin metallic or oxide interlayer can act like a bridge, improving wetting and reducing abrupt changes in bonding.
-
Tune oxygen during deposition to balance conductivity and durability. Consider a conductive oxide where oxygen vacancies increase conductivity. If the film becomes too vacancy-rich, it may wear faster because the network is less stable. A practical approach is to deposit a small matrix of oxygen partial pressures, then compare sheet resistance and wear track continuity.
-
Control densification to reduce crack initiation. Under sliding, cracks often start at pores or column boundaries. Increasing film density through appropriate plasma assistance can reduce those weak points. The tradeoff is stress: densification can raise internal stress, so you must watch for edge cracking and adhesion loss.
Example: Choosing a Stack for Electrical Contact Under Sliding
Suppose you need a conductive surface on a metal component that will experience repeated sliding. A systematic stack could be:
- Substrate: a conductive alloy with stable bulk properties.
- Surface preparation: plasma cleaning to remove organics and lightly activate the surface.
- Interlayer: a thin bonding layer if the native oxide would otherwise interfere.
- Conductive oxide film: deposited with oxygen and dopant conditions chosen to achieve low sheet resistance while keeping the film continuous.
- Verification: measure sheet resistance before and after a short wear test, then inspect the wear track for continuity and adhesion failure.
Example: Diagnosing Failure Modes
If electrical resistance rises sharply after wear, check whether the film became discontinuous or whether the wear exposed an insulating oxide on the substrate. If the film stays visually intact but resistance still increases, the issue may be contact geometry and current crowding at microcracks. If the film delaminates, the root cause is usually interface chemistry or insufficient densification leading to crack growth at the interface.
Practical Summary
Metals and alloys provide the mechanical and electrical base, but their surface oxides and deformation under load can destabilize conduction. Conductive oxide films can improve both electrical stability and wear resistance when their carrier concentration, oxygen content, and microstructure are controlled. The most reliable outcomes come from treating the interface as a first-class design object, not an afterthought.
5.2 Dielectrics and Optical Films Including Oxides Nitrides and Fluorides
Dielectric and optical thin films are thin layers engineered to control how light and electric fields behave at a surface. In plasma-based processing, the film’s final properties come from a chain of cause-and-effect: gas chemistry and plasma species determine what bonds form, ion energy influences density and defect populations, and thermal budget sets how much rearrangement is possible. A practical way to think about these films is to separate three roles: (1) optical function, (2) electrical function, and (3) microstructure that governs both.
Optical and Electrical Roles
Optical films often act as coatings that manage reflection, transmission, or absorption. The key parameter is refractive index, which depends on composition and density. Higher density usually increases refractive index for many oxide systems because the material becomes less porous and more polarizable.
Electrical dielectrics aim for low leakage and stable permittivity. Leakage is strongly tied to defects such as oxygen vacancies, dangling bonds, and grain-boundary pathways. In plasma deposition, these defects can be reduced by choosing chemistry that supplies the right anions (oxygen or nitrogen) and by using ion assistance that densifies without creating excessive damage.
Material Families and What They Tend to Do
Oxides (for example, SiO2, Al2O3, TiO2) are common because oxygen provides strong bonding and often yields good chemical stability. Their refractive index can be tuned by composition and density; for instance, adding metal cations to silica can raise refractive index but may also introduce more complex defect chemistry.
Nitrides (for example, Si3N4, AlN, TiN in dielectric contexts) typically offer good mechanical strength and can provide higher refractive index than many oxides. Nitrogen-rich films can also reduce oxygen-related defect formation, but they may be more sensitive to hydrogen incorporation depending on plasma conditions.
Fluorides (for example, MgF2, CaF2) are valued in optical coatings for low refractive index and good transparency in certain wavelength ranges. Fluorine chemistry is less forgiving: it can be volatile under some conditions, and film stoichiometry can drift if the plasma does not supply enough fluorine-containing species.
Plasma Chemistry to Bond Formation
In plasma deposition, the “ingredients” are not just the target film elements but also the reactive fragments created in the discharge. For oxides, oxygen-containing species (O, O2+, O3, and related radicals) drive oxidation and help fill oxygen sites. For nitrides, nitrogen-containing species (N, N2+, NHx radicals depending on feed) determine how effectively nitrogen bonds to the network.
A simple example: when depositing a silicon oxide film, a higher fraction of oxygen radicals relative to silicon-containing fragments generally increases the likelihood of forming Si–O bonds instead of Si–Si or Si–H remnants. That shift often improves optical uniformity and reduces leakage, because fewer conductive or absorbing defect states remain.
Ion Energy and Microstructure Control
Even with the right chemistry, microstructure can sabotage performance. Ion bombardment can densify films, reduce voids, and improve refractive index stability. However, too much ion energy can create damage, increase defect density, or cause intermixing at interfaces.
A practical rule of thumb for process development is to treat ion energy as a dial that trades densification against defect creation. For instance, if an oxide film shows higher-than-expected absorption, you can check whether the process is over-densifying or creating oxygen-deficient regions. Reducing substrate bias or adjusting pressure to lower ion energy can restore optical clarity.
Thickness, Uniformity, and Optical Design Constraints
Optical films are often built as stacks where each layer thickness is chosen for constructive or destructive interference. That makes uniformity critical: a thickness error shifts the band edges and changes the coating’s spectral response.
In plasma systems, uniformity depends on gas distribution, plasma density, and substrate motion or geometry. A concrete workflow is to map thickness across the substrate using ellipsometry, then correlate the spatial pattern with chamber flow and plasma intensity. If the center is thicker than the edges, you can adjust gas inlet placement or pressure to improve transport.
Mind Map: Dielectrics and Optical Films
Example: Choosing Between Oxide and Nitride for a Coating
Suppose you need a dielectric layer with moderate refractive index and good resistance to moisture-driven degradation. An oxide like Al2O3 often provides strong chemical stability and a robust barrier. If you also need higher mechanical stiffness to resist cracking under thermal cycling, a nitride such as Si3N4 can be a better match. The integrated decision is not just “oxide vs nitride,” but how the plasma chemistry will deliver the anion network and how ion energy will densify without introducing absorbing defects.
Example: Preventing Fluoride Stoichiometry Drift
For a low-index fluoride layer such as MgF2, optical performance depends on maintaining the correct Mg:F ratio and avoiding fluorine loss. In practice, you can monitor refractive index and compare it to the expected value for a dense, stoichiometric film. If the refractive index trends upward while absorption increases, it often indicates that the film is becoming less fluoride-rich or more porous. Adjusting the balance between fluorine-containing feed and plasma dissociation conditions helps restore the intended network.
Summary of Integrated Best Practices
- Treat chemistry and ion energy as coupled controls: chemistry sets bond formation, ion energy sets density and defect outcomes.
- Use optical and electrical measurements together: refractive index tells you about density and composition, while leakage and breakdown reveal defect pathways.
- Validate uniformity early: optical stacks are unforgiving to thickness gradients, so spatial metrology should guide process tuning.
When these steps are followed, oxides, nitrides, and fluorides become predictable building blocks rather than mysterious recipes—still chemistry, still physics, just with fewer surprises.
5.3 Hard Coatings Including Carbides Nitrides and Composite Architectures
Hard coatings aim to reduce wear by combining high hardness, stable adhesion, and a surface chemistry that resists oxidation and chemical attack. In plasma-based deposition, the coating’s performance is shaped by how atoms arrive at the surface, how energetic ions assist densification, and how the film’s microstructure manages stress.
Core Materials for Hardness and Stability
Carbides and nitrides are popular because they form strong bonds and typically produce dense, wear-resistant lattices. Titanium carbide (TiC) and tungsten carbide (WC) are classic carbide choices; titanium nitride (TiN) and aluminum nitride (AlN) are common nitride choices. Their hardness is not just a material property—it depends on stoichiometry, grain size, and defect density.
A practical way to think about it: if the film is too under-stoichiometric, you often get more vacancies and weaker bonding; if it is too over-stoichiometric, you can create secondary phases or reduce the uniformity of the lattice. In plasma processing, gas ratios and target power influence this balance, while substrate bias influences how well the film densifies.
Deposition Mechanisms That Drive Microstructure
Hard coatings usually grow by a mix of surface adsorption, surface diffusion, and ion-assisted rearrangement. Ion bombardment can compact the growing film, reducing porosity and improving hardness. It can also increase stress, so the “more bias is better” idea is only half true.
A useful rule of thumb for reasoning through process changes:
- Increasing ion energy tends to densify and refine grains, raising hardness.
- Increasing ion energy also tends to raise compressive stress and risk cracking or delamination.
- Increasing deposition rate can improve throughput, but may reduce adatom mobility and lead to columnar growth or voids.
Carbide Coatings Including TiC and WC
Carbides often excel in abrasive wear because their hard phases resist cutting and plowing. TiC coatings are widely used for tooling and sliding components because they can form relatively stable microstructures under many operating conditions. WC-based coatings can be extremely hard, but they are sensitive to deposition chemistry and can show brittleness if the microstructure becomes too coarse or if binder phases are poorly controlled.
Easy example: imagine two TiC films grown with the same substrate bias but different carbon-to-metal ratios. The carbon-deficient film may show lower hardness and higher wear rate because the lattice is not fully formed. The carbon-rich film may show different secondary phases that can change friction and wear behavior even if hardness looks similar on a hardness tester.
Nitride Coatings Including TiN and AlN
Nitrides are valued for hardness and for chemical stability. TiN is often chosen when a good combination of hardness, adhesion, and oxidation resistance is needed. AlN can offer strong thermal stability and can be effective in environments where oxidation resistance matters, though its deposition and stress behavior require careful control.
Easy example: if a TiN coating is deposited with insufficient nitrogen availability, you may end up with mixed phases that alter both hardness and color. More importantly, those phases can change how the coating handles thermal cycling, because different phases expand differently.
Composite Architectures for Toughness and Adhesion
Composite architectures aim to keep hardness while improving fracture resistance and adhesion. There are two common strategies: mixing phases within one layer (nanocomposites) and stacking layers with different properties (multilayers).
Nanocomposites often use a hard phase dispersed in a softer or more ductile matrix. The hard phase carries load and resists abrasion; the matrix helps arrest cracks and reduces catastrophic spallation.
Multilayers alternate hard and softer layers to manage stress and crack propagation. A crack that starts in a hard layer can be deflected at interfaces, increasing the energy required for failure.
Easy example: a TiN/SiN multilayer can behave differently from a single TiN layer even if the total thickness is the same. Interfaces can reduce the effective crack length, and the softer interlayers can blunt crack tips.
Stress Management Through Layer Design
Hard coatings frequently develop compressive stress due to ion bombardment and atomic peening. Composite architectures help because they can distribute stress across interfaces and introduce mechanisms for crack deflection.
A systematic approach for designing a composite stack:
- Choose the hard phase for wear resistance.
- Choose the complementary phase for stress relief and crack control.
- Set layer thicknesses so interfaces are frequent enough to interrupt cracks.
- Use substrate bias to densify without over-stressing.
Mind Map: Hard Coatings and Composite Architectures
Example: Choosing Between Single-Layer and Composite Designs
Suppose you coat a sliding pin that experiences abrasive wear plus occasional impacts. A single TiN layer may provide high hardness, but impacts can trigger cracking and spallation if stress is too high. A TiN-based multilayer with a thinner, more compliant interlayer can maintain hardness while improving resistance to crack growth.
A simple decision logic:
- If wear is mostly steady abrasion and the substrate is mechanically stable, a single carbide or nitride layer can be sufficient.
- If impacts or thermal cycling are present, composite architectures are often better because interfaces and phase contrast help manage crack propagation and stress.
Practical Checklist for Building a Composite Hard Coating
- Verify stoichiometry targets with composition-sensitive measurements.
- Tune substrate bias to densify without pushing stress beyond the film’s fracture tolerance.
- Use interface-rich designs when crack deflection is needed.
- Confirm adhesion under representative thermal and mechanical conditions, not only as-deposited.
This section’s core idea is straightforward: carbides and nitrides provide the hardness, while composite architectures provide the “how it fails” control that turns hardness into real-world durability.
5.4 Gradient and Multilayer Films for Stress Management and Performance Optimization
Stress is the quiet saboteur of thin films: it can start as a small mismatch at the interface and end as cracking, peeling, or gradual performance loss. Gradient and multilayer designs manage that mismatch by controlling how composition, density, and structure change with depth. Think of them as “stress ramps” rather than abrupt steps.
Core Idea: Why Stress Builds in Thin Films
Three mechanisms dominate stress in most plasma-deposited films. First, thermal mismatch arises when the substrate and film expand differently during heating or plasma-induced temperature rise. Second, intrinsic stress comes from atomic-scale packing: energetic species can densify the film, while low-energy growth can leave voids and a more open structure. Third, growth stress and interfacial reactions depend on surface preparation and chemistry; even a thin interlayer can shift the balance between adhesion and cohesion.
A useful mental model is to treat the film as a stack of layers, each with its own preferred lattice spacing and density. When the stack is forced to share the same in-plane strain, the mismatch becomes stress. Gradient and multilayer approaches reduce the mismatch per step.
Gradient Films: Continuous Ramps Instead of Abrupt Jumps
A gradient film changes one key property gradually through thickness—commonly composition (e.g., metal-to-oxide ratio), stoichiometry, or density. The simplest practical gradient is a linear ramp in gas ratios during deposition. For example, when depositing a hard oxide on a metal, you can start with a higher fraction of oxygen-poor conditions to form a more compliant, metal-rich transition region, then gradually increase oxygen to reach the fully oxidized hard phase.
A second common gradient is density grading. If ion energy or bias is reduced near the interface, the early film grows with fewer energetic densification effects, lowering intrinsic stress. Later, you increase bias to densify the bulk for wear resistance. The result is a film that is not equally stiff everywhere, which helps it accommodate strain.
Easy example: Suppose you want a TiN coating on a steel tool. A multilayer might alternate TiN and a softer interlayer, but a gradient can continuously shift from a Ti-rich, more compliant nucleation region into stoichiometric TiN. In practice, you implement this by stepping the nitrogen-to-titanium precursor ratio (or reactive gas flow) over the first few tens of nanometers, then holding steady for the remaining thickness.
Multilayer Films: Stepwise Control of Stiffness and Interfaces
Multilayers use discrete layers to control stress distribution and crack behavior. Two design patterns show up repeatedly.
-
Stiffness alternation: Alternate a hard, stiff layer with a softer, more compliant layer. The hard layers provide wear resistance; the softer layers act like internal “shock absorbers.”
-
Interface engineering: Insert thin interlayers that improve adhesion and reduce chemical mismatch. These layers can be only a few nanometers thick but have an outsized effect because they define how the film bonds to the substrate.
Easy example: For a ceramic-like top layer on a polymer or composite, you can use a thin adhesion-promoting interlayer (often oxygen-containing or hydrogen-bonding compatible) followed by a multilayer sequence that alternates between a dense barrier layer and a slightly more compliant layer. The barrier layers slow moisture or corrosive ingress; the compliant layers reduce the chance that a single crack runs straight through.
Mind Map: Stress Management Through Depth Design
Design Workflow: From Requirements to Layer Schedules
Start with what you must protect: adhesion, cracking resistance, corrosion barrier integrity, or tribological durability. Then choose the stress-relevant knob.
-
Define the interface problem. If adhesion is weak, prioritize interlayers and surface activation consistency. If cracking dominates, prioritize stiffness control and crack interruption.
-
Choose gradient or multilayer. Use gradients when you want smooth property transitions and fewer interfaces to manage. Use multilayers when you need repeatable crack-blocking behavior or when you must combine very different material properties.
-
Set the ramp or repeat geometry. For gradients, decide the ramp thickness where the property changes. A common practical range is “the first few tens of nanometers” for nucleation and transition, then a stable bulk region. For multilayers, choose the number of repeats so that each hard layer is thin enough to avoid through-thickness cracking.
-
Implement schedules. Gas ratios and substrate bias are the most direct levers in plasma processes. Keep other variables stable so you can attribute changes in stress and adhesion to the intended gradient or layer sequence.
Validation: Confirm Stress Reduction Without Guessing
Residual stress is not something you infer from appearance alone. Use curvature measurements (wafer bow) when available, and pair them with adhesion tests that reveal failure mode. Cross-sectional microscopy helps confirm whether cracks are arrested at interfaces or whether they cut through.
Easy example: If a coating shows improved scratch resistance after adding a soft interlayer, check whether the failure shifts from substrate delamination to cohesive failure within the coating. That shift usually indicates the interface is no longer the weakest link.
Common Pitfalls and How to Avoid Them
A gradient can fail if the ramp is too abrupt, effectively becoming a step. A multilayer can fail if the soft layers are too thick, reducing barrier performance, or too thin, making them ineffective at crack arrest. Both designs can also be undermined by inconsistent substrate preparation, because interfacial chemistry sets the baseline for adhesion and initial growth stress.
The practical rule is simple: design the depth profile to reduce mismatch per increment, then verify with stress and failure-mode measurements rather than relying on surface appearance.
5.5 Dopant Incorporation and Stoichiometry Control Using Gas Chemistry and Bias
Dopants in thin films rarely “just show up.” Their final concentration and bonding state are set by a chain of cause-and-effect: gas chemistry shapes which reactive species reach the surface, and substrate bias shapes how strongly those species are driven into the growing film. If you treat these as separate knobs, you’ll chase symptoms. If you treat them as one coupled system, you can steer stoichiometry with fewer surprises.
Foundational Idea: What Bias Changes and What Gas Chemistry Changes
Gas chemistry controls the supply and reactivity of dopant precursors. For example, a dopant source may form volatile fragments that either incorporate readily or desorb unless the surface is activated. Bias controls the energy delivered to the surface through ion bombardment, which affects surface residence time, defect creation, and the balance between incorporation and sputter re-erosion.
A simple mental model is: gas chemistry sets the “ingredients,” bias sets the “cooking temperature.” Too little energy and the ingredients don’t stick; too much energy and the film can get cooked unevenly or partially removed.
Step-by-Step Workflow for Stoichiometry Control
- Define the target stoichiometry and dopant role. Decide whether the dopant is meant to substitute into a lattice site, occupy interstitial positions, or form a secondary phase. Each role has different sensitivity to oxygen or nitrogen partial pressure.
- Choose a dopant precursor that matches the desired bonding environment. If the host film requires a specific anion chemistry, pick a dopant source whose fragments do not fight that environment. For instance, a dopant precursor that strongly scavenges oxygen can shift the film from oxide-like to suboxide-like bonding.
- Set a baseline host stoichiometry without dopant. Establish stable deposition first. Measure composition and thickness rate, then only add dopant once the host chemistry is under control.
- Introduce dopant at low fraction and ramp carefully. Start with a dopant flow that is small enough to avoid changing the overall plasma chemistry dramatically. Then increase in steps while tracking both dopant concentration and host stoichiometry.
- Use bias to separate incorporation from re-erosion. Increase bias gradually while monitoring dopant level, film density, and surface roughness. A common pattern is: dopant incorporation rises with bias up to a point, then drops as re-sputtering or defect-driven segregation becomes significant.
- Close the loop with composition measurements. Use XPS for near-surface chemistry and EDS or RBS for bulk composition. Compare dopant concentration trends against host stoichiometry trends; mismatched trends often indicate preferential sputtering or reaction-limited incorporation.
Gas Chemistry Mechanisms That Matter in Practice
- Reactive gas competition. Oxygen or nitrogen partial pressure can determine whether dopant forms substitutional bonds or clusters. Example: in a metal-oxide host, raising oxygen can convert a dopant that would otherwise remain metallic-like into a more oxidized, lattice-compatible state.
- Fragmentation and transport. Dopant precursors may fragment into different species depending on power and pressure. Example: at higher pressure, more collisions can shift the dominant dopant fragment toward less energetic pathways, changing incorporation even if dopant flow is constant.
- Surface reaction pathways. Some dopant species incorporate only when the surface has the right reactive sites. Example: if the host growth relies on oxygen-assisted reactions, adding a dopant precursor that consumes oxygen can reduce both host growth rate and dopant incorporation.
Bias Mechanisms That Matter in Practice
- Ion-assisted incorporation. Moderate bias increases the probability that incoming dopant-containing species are driven into the near-surface region before they desorb.
- Defect-mediated trapping. Bias can create vacancies or interstitials that trap dopant atoms. Example: in a nitride-like host, increased bias can raise dopant retention but also increase stress, which may later affect cracking or adhesion.
- Preferential re-erosion. If the dopant-containing bonds are weaker under ion bombardment, higher bias can reduce dopant concentration relative to the host. Example: a dopant that forms a more sputter-sensitive compound may show a decreasing trend in concentration as bias increases.
Mind Map: Coupled Control of Dopant and Stoichiometry
Example: Tuning Dopant Level in an Oxide Host
Suppose you deposit a conductive oxide film and want a small dopant fraction to adjust carrier behavior. Start with a fixed oxygen partial pressure that yields the desired host oxygen-to-metal ratio. Add dopant precursor at a low flow and keep bias at the baseline value. If dopant concentration is low while host stoichiometry is correct, increase bias slightly to enhance incorporation. If dopant concentration rises but host stoichiometry shifts oxygen-deficient, reduce dopant precursor flow or restore oxygen partial pressure. The key is to watch both signals: dopant incorporation without host stoichiometry control often produces films that look “right” in one measurement and fail in another.
Example: Avoiding Dopant Clustering by Balancing Oxygen Affinity
If the dopant tends to cluster under oxygen-poor conditions, you’ll see dopant concentration increase with dopant flow but bonding-state signatures that indicate non-lattice phases. In that case, keep dopant flow modest and adjust oxygen partial pressure upward until the dopant bonding state matches the host environment. Then use bias to fine-tune concentration rather than relying on bias alone to force incorporation.
Practical Checklist for Reliable Stoichiometry Outcomes
- Keep host stoichiometry stable before adding dopant.
- Ramp dopant flow slowly and track both dopant and host composition.
- Use bias sweeps at fixed gas chemistry to separate incorporation from re-erosion.
- Interpret trends together: dopant up with host oxygen down is a warning sign.
- Confirm bonding state near the surface, not only total concentration.
A well-controlled dopant recipe is less about finding one “magic” parameter and more about maintaining a consistent balance between what the plasma provides and what the surface can retain.
6. Ion Energy Control and Film Microstructure Development
6.1 Substrate Bias and Self Bias Effects on Ion Bombardment
Ion bombardment is the part of plasma processing that most directly controls how films densify, how interfaces bond, and how surfaces smooth or roughen. Substrate bias is the knob that sets the ion energy arriving at the surface; self-bias is what the system often generates automatically when you connect a substrate to an RF-powered plasma.
Core Idea: What Bias Actually Changes
In a plasma, ions accelerate toward the negatively biased surface because the electric field near the sheath points inward. The sheath is the thin region where most of the voltage drop occurs. When you make the substrate more negative relative to the plasma potential, the sheath voltage magnitude increases, and ions hit with higher energy.
A useful mental model is:
- Plasma potential sets the reference for ion acceleration.
- Substrate bias shifts the substrate potential relative to that reference.
- Sheath voltage determines the energy scale of incoming ions.
A common practical outcome is that higher ion energy tends to increase adatom mobility and film densification, but it can also increase damage to soft layers, raise defect density, and enhance resputtering if the energy is too high.
Substrate Bias in RF Systems
In RF plasmas, the substrate potential oscillates. The key quantity is the time-averaged ion energy, which depends on the instantaneous sheath voltage during the RF cycle. Two effects matter:
- External biasing: you intentionally apply a DC or RF bias to the substrate.
- RF coupling: even without an external bias supply, the substrate can acquire a net negative potential due to asymmetric electron and ion mobility.
If you apply a DC bias, the sheath voltage becomes more stable cycle-to-cycle, which often improves repeatability. If you rely on RF coupling only, the ion energy distribution can broaden because the sheath dynamics follow the RF waveform.
Self Bias: Why the Substrate Goes Negative
Self-bias arises from the fact that electrons respond quickly to RF fields while ions are comparatively sluggish. During each RF cycle, electrons can reach the substrate more effectively than ions, so the substrate charges negatively until the electron current is reduced enough to balance the ion current over time. The result is a net DC component of the substrate voltage.
Self-bias magnitude depends on several system parameters:
- Electrode area ratio between powered and grounded surfaces.
- RF power and resulting plasma density.
- Gas pressure, which changes sheath thickness and ion transit time.
- Secondary electron emission from the substrate surface, which can alter the balance.
A practical example: if you scale up the powered electrode area relative to the substrate electrode, the self-bias often becomes less negative because the system can sustain the required current balance with a smaller voltage drop.
Ion Energy Distribution and Its Consequences
Ion energy at the surface is not a single number. It is shaped by sheath voltage fluctuations and by collisions in the sheath. At higher pressure, ions undergo more collisions, which can reduce the effective energy and narrow the distribution in some regimes, while also increasing angular spread.
Consequences for thin films:
- Densification: moderate ion energy increases packing density by promoting surface relaxation.
- Adhesion: ion bombardment can remove weak boundary layers and create interfacial mixing.
- Resputtering: if ion energy exceeds the threshold for significant sputtering of the growing film, thickness rate drops and composition can shift.
- Surface morphology: energetic ions can smooth peaks by preferentially removing protrusions, but they can also roughen surfaces if bombardment is too directional or if resputtering dominates.
How to Use Bias Systematically
A systematic approach is to treat bias as part of a small “energy budget” rather than a standalone setting.
- Start with a preparation step: use a lower-energy bias to activate the surface without aggressive sputtering.
- Move to deposition: increase bias only enough to achieve the desired densification and interface quality.
- Watch for signs of resputtering: if thickness rate falls sharply while deposition time stays fixed, ion energy may be too high.
- Validate with measurements: compare film density, stress, and adhesion across bias steps.
Concrete example workflow for a hard coating on a metal substrate:
- Run a short plasma activation at modest negative bias to clean and activate.
- Deposit the film at a slightly higher bias to improve density.
- If adhesion tests show brittle failure or if the film stress becomes excessive, reduce bias or adjust pressure to reduce sheath energy.
Mind Map: Substrate Bias and Self Bias Effects
Example: Comparing Two Bias Strategies
Consider two runs with the same plasma chemistry and pressure.
- Run A uses an external DC bias that holds the substrate at a steady negative potential. The ion energy distribution is narrower, so the film densifies consistently.
- Run B relies on self-bias from RF coupling. The average ion energy may be similar, but the distribution can be broader, which can lead to more variability in stress and adhesion across the wafer.
The takeaway is not that one method is always better; it’s that external bias tends to improve control over energy stability, while self-bias can be sufficient when the process is tolerant to energy spread.
Key Checks to Keep Bias from Becoming a Guessing Game
- Confirm the substrate potential and bias waveform behavior, not just the setpoint.
- Track thickness rate alongside bias to detect resputtering.
- Use adhesion and stress measurements to identify the energy window where bombardment helps rather than harms.
- Keep pressure and geometry consistent when comparing bias levels, since both strongly affect sheath formation.
When you treat substrate bias as a controlled energy delivery mechanism, ion bombardment becomes predictable enough to engineer interfaces and microstructure instead of merely hoping the film turns out right.
6.2 Ion Flux and Energy Distributions and Their Impact on Densification
Densification in plasma-assisted thin film growth is mostly a story about what ions arrive at the surface, how many of them arrive, and how energetic they are when they arrive. Ion flux sets the frequency of surface impacts; the energy distribution sets how strongly those impacts can rearrange atoms, knock loose weakly bound species, and close voids. The tricky part is that “average ion energy” rarely tells the whole story because real plasmas deliver a spread of energies.
Core Concepts That Connect Flux to Densification
Ion flux is the number of ions per unit area per unit time reaching the substrate. A higher flux increases the rate of ion-driven surface processes such as adatom mobility enhancement and resputtering of loosely bound material. In practice, you can think of flux as the “work rate” of the ion bombardment.
Ion energy distribution describes how ion energies are spread around a mean value. Two plasmas can have the same mean energy but different spreads, leading to different outcomes: a narrow distribution tends to produce more uniform densification, while a broad distribution can create mixed regimes where some sites densify and others get etched or damaged.
Densification mechanisms include:
- Surface relaxation: ions help atoms find lower-energy configurations.
- Void closure: energetic impacts can fill pores by promoting surface diffusion and reattachment.
- Resputtering: too much energy or flux can remove material faster than it can rearrange, undoing densification.
How Ion Energy Reaches the Surface
In many plasma systems, ions accelerate across the sheath toward the biased substrate. The substrate bias strongly influences the mean ion energy, while the sheath dynamics and plasma conditions influence the distribution width.
A useful mental model is: ions gain energy roughly proportional to the sheath potential drop, but the sheath is not perfectly static. That non-ideality is one reason energy distributions broaden.
Mind Map: Flux, Energy, and Densification
Systematic Reasoning from Simple to Advanced
-
Start with the deposition rate balance. Densification improves when ion-driven rearrangement outpaces the formation of open porosity. If deposition is too fast relative to ion-driven relaxation, the film “locks in” voids before they can close.
-
Increase ion flux carefully. Raising flux increases the number of rearrangement events per second. For example, if a porous film forms because adatoms cannot move enough, doubling ion flux can reduce porosity by increasing the frequency of surface activation events.
-
Then check the energy distribution, not just the mean. Suppose you adjust bias to keep the same mean ion energy but change plasma conditions so the distribution broadens. The high-energy tail may locally resputter and create defects, while the low-energy tail may be insufficient for void closure. The result can be a film that looks “partly dense” but has higher defect density.
-
Watch for the densification–resputtering crossover. There is a practical window where ions are energetic enough to promote relaxation and pore closure but not so energetic (or so frequent) that net material removal dominates. Crossing that window can increase roughness and reduce net thickness, even while the film might appear denser in some regions.
Concrete Example: Two Ways to Get the Same Mean Energy
Imagine two process settings that both target a mean ion energy of 100 eV at the substrate.
-
Case A: Narrow distribution. Most ions arrive near 100 eV. The film experiences consistent surface activation, leading to steady void closure and a lower porosity fraction.
-
Case B: Broad distribution. Some ions arrive at 40 eV, which may not move adatoms enough to close pores, while others arrive at 160–200 eV, which can resputter weakly bound species. The net effect can be a film with higher porosity and more surface damage, even though the mean energy matches.
This is why energy distribution width matters: densification depends on whether ions spend enough time in the “useful energy” range.
Practical Example: Flux Increase with Constant Bias
If you increase plasma power while keeping substrate bias constant, ion flux often rises while mean ion energy stays similar. In a porous oxide film, that can improve densification because more surface sites get activated per unit time. However, if the deposition rate also rises, the film may still trap voids. The best outcome typically comes from coordinating flux with deposition rate so that relaxation has time to keep up.
What to Measure to Confirm Densification Drivers
To connect ion flux and energy to densification, you typically correlate:
- Porosity or density proxies such as cross-sectional SEM contrast, XRR density, or ellipsometry-derived effective density.
- Net deposition rate to detect resputtering dominance.
- Stress and microstructure indicators since ion-driven densification often changes internal stress trends.
When these signals move together with flux and bias changes, you can confidently attribute densification behavior to ion-driven mechanisms rather than to unrelated chemistry or substrate effects.
6.3 Nucleation Growth and Columnar Versus Dense Microstructures
Nucleation is the moment a film stops being “just arriving species” and starts being a connected solid. Growth then decides whether the film becomes a dense, well-packed layer or a columnar structure with voids between growth columns. In plasma-assisted deposition, both steps are strongly shaped by ion energy, surface mobility, and the chemistry of arriving species.
Core Concepts of Nucleation
Nucleation sites form where adatoms can stick long enough to meet neighbors. On a clean, activated surface, nucleation density is often higher because more sites are available and surface energy is favorable. On a contaminated or poorly activated surface, nucleation can be sparse, which increases the chance of island growth and later coalescence gaps.
Adatom mobility competes with sticking probability. If adatoms can move across the surface before being trapped, they tend to fill gaps and form a denser film. If they are trapped quickly, they form islands that later merge, leaving grain boundaries and inter-island voids.
Ion assistance adds a second lever: ions can increase surface mobility through localized heating and can also create defects that act as additional nucleation sites. The same ion bombardment that helps densify can also damage the growing film if energy is too high.
Growth Pathways from Islands to Coalesced Films
A common sequence is: (1) island nucleation, (2) island growth, (3) island coalescence, and (4) grain growth or densification. Coalescence quality depends on whether islands meet with enough surface mobility to rearrange their edges. If edges are “frozen” too early, coalescence forms a connected but porous network.
A practical way to reason about this is to compare two timescales: the time for adatoms to diffuse to island edges versus the time for new species to arrive and get trapped. Higher arrival rate or lower mobility favors porous coalescence; higher mobility favors edge smoothing and closure of voids.
Columnar Microstructures: Why They Happen
Columnar films typically form when growth is directional and surface diffusion is limited. In many plasma processes, ions and energetic neutrals arrive with a preferred direction, enhancing growth along the ion incidence direction. Meanwhile, if adatom mobility is low, each “column” grows by capturing species near its own footprint rather than redistributing material laterally.
The result is a microstructure with:
- Column boundaries that often align with grain boundaries.
- Inter-column voids that can reduce barrier performance and increase permeation.
- Anisotropic properties where hardness, modulus, or wear behavior differs along and across the film thickness.
A concrete example: a hard nitride film deposited with low substrate temperature and moderate ion bombardment can show pronounced columnar grains in cross-section SEM. Increasing substrate bias slightly may densify the film, but pushing it too far can increase defect density and roughness, which can worsen column boundary weakness.
Dense Microstructures: How They Form
Dense films form when nucleation is sufficiently dense and growth allows lateral rearrangement. This can be achieved by:
- Increasing surface mobility through substrate temperature or reduced trapping.
- Using ion assistance at energies that promote densification without excessive damage.
- Adjusting gas chemistry so that arriving species create a surface that supports rearrangement.
Dense microstructures tend to show:
- Smaller grains or more uniform grain size distribution.
- Lower void fraction and fewer open grain boundary pathways.
- Better interfacial continuity, which improves adhesion and reduces delamination risk.
Example: an oxide film deposited with moderate substrate heating and controlled ion energy often yields a smoother cross-section with fewer voids. If the ion energy is increased while keeping chemistry stable, densification can improve, but the film may become more stressed; the best outcome is the one that closes voids without creating a crack-prone stress state.
Mind Map: Nucleation and Microstructure Outcomes
Systematic Control Logic for Practitioners
- Start with surface readiness: if nucleation sites are poor, no amount of later tuning will fully remove porosity. A simple check is whether the film shows large island-like features before coalescence.
- Balance mobility and arrival: if deposition rate is high or temperature is low, expect columnar tendencies. Reduce arrival rate or increase mobility to encourage edge smoothing.
- Use ion energy as a scalpel: moderate ion bombardment can densify by enhancing surface rearrangement and defect-assisted nucleation. Excess energy can increase roughness and defect density, which may create weak column boundaries.
- Confirm with cross-section evidence: SEM or focused ion beam cross-sections reveal whether voids are inter-column or confined to grain boundaries. Pair that with density-related measurements such as refractive index trends or mechanical property changes.
Example: Two Deposition Recipes with Different Microstructures
Recipe A: Columnar-leaning outcome
- Lower substrate temperature
- Higher deposition rate
- Moderate ion bombardment
- Typical observation: visible columnar grains and inter-column voids.
Recipe B: Dense-leaning outcome
- Slightly higher substrate temperature
- Reduced deposition rate
- Ion energy tuned to densify without roughening
- Typical observation: fewer voids, more uniform cross-section, and improved barrier-like behavior.
The key is that both recipes can produce a continuous film, but only one produces the internal structure that supports the performance you care about.
6.4 Stress Formation and Mitigation Through Process Design
Thin films rarely fail because the chemistry is “wrong” in a single step. More often, they fail because stress accumulates faster than the film can accommodate it. Stress is not just an afterthought; it is a direct consequence of how ions arrive, how atoms pack, and how the film cools and shrinks.
Stress Formation Fundamentals
Stress in thin films is commonly grouped into three contributors. First is intrinsic stress, created during growth as atoms form bonds and the microstructure densifies. Second is thermal stress, created when the film and substrate expand and contract differently during heating and cooling. Third is interfacial stress, created by mismatches in adhesion, roughness, and chemical bonding at the film–substrate boundary.
A practical way to think about intrinsic stress is to track two competing tendencies. Ion bombardment and energetic surface reactions can densify the film, increasing compressive stress. Meanwhile, limited surface mobility can trap voids and columnar structures, which may shift stress toward tensile or mixed states depending on the microstructure.
Thermal stress is easier to estimate conceptually: if the film has a higher thermal expansion coefficient than the substrate, cooling tends to pull the film into tension; if it is lower, cooling tends to push it into compression. Even when the coefficients are close, a thick film or a large temperature swing can make thermal stress matter.
Interfacial stress is often the quiet culprit. A film that adheres well can distribute strain across the interface. A film that bonds poorly can concentrate strain at the edges of weak regions, leading to delamination that looks like a mechanical problem but starts as a chemical and morphological one.
How Process Design Controls Stress
Process design mitigates stress by controlling three knobs: energy, growth mode, and thermal history.
-
Energy control through bias and ion flux Substrate bias increases ion energy at the surface. Higher energy can improve densification and adhesion, but it also increases compressive stress and can roughen or damage the growing film. A simple example: if you double the bias while keeping deposition rate constant, you often see a denser film with higher compressive stress, and the first sign may be a sudden increase in curvature or a higher probability of cracking.
-
Growth mode control through rate and chemistry Deposition rate affects how much time atoms have to rearrange. Slower growth generally allows better relaxation and can reduce stress, but it may also increase oxidation or contamination if the chamber is not stable. Gas chemistry affects whether the film forms a dense amorphous network, a nanocomposite, or a columnar structure. For instance, adding a reactive gas that promotes cross-linking can raise intrinsic compressive stress if it also increases ion-assisted densification.
-
Thermal history control through temperature and ramping Thermal stress scales with temperature difference and film thickness. If your process heats the substrate, the ramp rate matters because it changes how quickly the film “locks in” its structure. A practical approach is to reduce peak temperature when possible, and to cool in a controlled manner to avoid sudden contraction that the film cannot accommodate.
Stress Mitigation Strategies with Examples
Strategy A: Use graded or multilayer architectures A graded interlayer can transition from a more compliant structure near the substrate to a stiffer, harder top layer. Example: deposit a thin, lower-density nucleation layer first (lower ion energy, slightly different gas ratio), then switch to the main coating conditions. This reduces the abrupt change in modulus and helps prevent stress concentration at the interface.
Strategy B: Reduce ion energy during the most stress-sensitive stages Early growth often determines adhesion and initial microstructure. Example: keep bias moderate during nucleation to avoid damaging the substrate surface, then increase bias only after the film has established a stable growth front.
Strategy C: Adjust deposition rate to balance densification and relaxation Example: if you observe compressive cracking at a certain thickness, reduce deposition rate while keeping composition stable. The film has more time for surface relaxation, which can lower intrinsic stress without changing the target material.
Strategy D: Manage thickness and stress accumulation Stress often scales with thickness until a failure mechanism triggers. Example: if a coating cracks above 1.5 µm, split it into two thinner passes with an intermediate condition that allows partial relaxation, such as a brief low-energy pause or a different interlayer composition.
Mind Map: Stress Formation and Mitigation
A Systematic Workflow for Stress Control
Start by measuring stress trends as a function of thickness and bias. If curvature increases rapidly with thickness, intrinsic stress dominates; if it correlates strongly with temperature, thermal stress is likely. Next, isolate the growth stage that creates the problem: nucleation, steady growth, or cooling. Then apply one mitigation at a time—such as lowering bias during nucleation or introducing a graded interlayer—so you can attribute improvements to a specific change.
Finally, verify the outcome with both mechanical and structural checks. A coating that shows reduced curvature but increased porosity may have traded stress for weakness. The goal is not “minimum stress at all costs,” but stress that stays within the film’s ability to remain intact under service-relevant conditions.
6.5 Microstructure Characterization Using X-Ray Diffraction SEM and TEM
Microstructure is where plasma processing stops being a recipe and starts being a measurable structure. The goal of characterization here is not just to “see” features, but to connect them to the process knobs you already control: ion energy, ion flux, gas chemistry, and substrate bias. A good workflow moves from bulk crystal structure to surface morphology to nanoscale interfaces, using each technique for what it does best.
Start with What You Need to Know
Before loading samples, write down three questions. First, what phases and crystallographic orientations are present? Second, how dense and smooth is the film, and what defects exist at the micrometer scale? Third, what is the nanoscale structure near the interface, including grain size, amorphous content, and possible interlayers?
A practical rule: if you need phase identification and stress-related lattice changes, X-ray diffraction (XRD) is the first stop. If you need morphology, cracks, columnar growth, and voids, scanning electron microscopy (SEM) is the workhorse. If you need grain boundaries, amorphous-to-crystalline transitions, and interfacial layers, transmission electron microscopy (TEM) is the final authority.
X-Ray Diffraction for Phases and Lattice Clues
XRD measures how planes in a crystalline material scatter X-rays. In thin films, the peak positions tell you about lattice spacing, while peak shapes and widths tell you about crystallite size and microstrain.
A concrete example: suppose a nitride film shows broader peaks after increasing substrate bias. Broader peaks can indicate smaller coherent crystallite domains or higher microstrain from energetic ion bombardment. If peak positions shift systematically, that suggests lattice parameter changes, often tied to composition variations or residual stress.
Key practices that keep XRD interpretable:
- Use grazing incidence when the film is thin to reduce substrate dominance.
- Compare peak widths consistently by using the same instrumental settings and applying background subtraction.
- If texture is expected, check for preferred orientation by comparing relative peak intensities to reference patterns.
SEM for Morphology, Defects, and Growth Mode
SEM images the surface by detecting secondary or backscattered electrons. Secondary electrons emphasize topography; backscattered electrons emphasize atomic number contrast, which can help reveal compositional variations.
A concrete example: a film deposited at lower ion energy may show a columnar surface with visible gaps between columns. Increasing ion energy often densifies the film, which can reduce columnar voids and change the surface from “spiky columns” to smoother plateaus. SEM can also reveal cracks that correlate with stress, especially if you compare samples across a bias series.
To make SEM results quantitative rather than purely visual:
- Capture images at consistent magnification and accelerating voltage.
- Measure feature sizes on cross-sections when possible, not only on plan-view.
- Use fracture or focused ion beam cross-sections carefully, since preparation can introduce artifacts.
TEM for Nanoscale Structure and Interfaces
TEM transmits electrons through a thin specimen, enabling direct observation of lattice fringes, grain boundaries, and interfacial layers. For thin films, TEM is often the only way to confirm whether an apparent “single layer” is actually multiple phases or whether an interlayer exists.
A concrete example: after plasma functionalization of a polymer-coated substrate, adhesion may improve. SEM might show no obvious change in surface roughness, and XRD might show no new crystalline peaks. TEM can still reveal a thin modified interfacial region—often amorphous or nanocrystalline—that explains the adhesion change.
Common TEM modes and what they answer:
- Bright-field imaging shows overall morphology and thickness variations.
- Selected area electron diffraction helps identify local crystallinity.
- High-resolution TEM can show lattice spacing and grain boundary structure.
- STEM with elemental mapping can connect microstructure to composition at the interface.
Mind Map of an Integrated Characterization Workflow
Mind Map: Microstructure Characterization Workflow
Example: Interpreting a Bias Series Without Guesswork
Imagine three samples of the same coating material deposited with increasing substrate bias. XRD shows peaks that become sharper at the highest bias, suggesting larger coherent domains or reduced microstrain. SEM cross-sections show a transition from porous columnar growth to a denser film. TEM confirms that the interface contains a thin amorphous region at low bias, which becomes thinner as bias increases, while the overlayer shows smaller grains that coalesce into more ordered domains.
The integrated conclusion is specific: bias changes both densification and interfacial structure, and the phase ordering seen in XRD matches the grain evolution observed in TEM. SEM provides the growth-mode context that explains why the film’s defect population changes. That is the point of combining these tools: each technique answers a different part of the same question, and together they form a consistent, checkable story.
7. Surface Functionalization Using Plasma Chemistry
7.1 Functional Group Introduction Through Plasma Assisted Surface Reactions
Plasma functionalization is about changing what the surface “feels like” by attaching or transforming chemical groups at the outermost few nanometers. The key idea is that plasma creates reactive species—ions, electrons, radicals, and excited molecules—that can both clean the surface and drive surface reactions. If you keep that in mind, the process stops being mysterious: you are managing a controlled chemistry at the interface.
Foundations of Plasma Assisted Surface Reactions
Start with the surface. Before functional groups can be introduced, the surface must have accessible reactive sites. Many materials arrive with adventitious carbon, water layers, or native oxides that block reaction pathways. Plasma can remove weakly bound contamination and generate new surface sites by breaking bonds.
Next, consider the plasma chemistry. In a typical functionalization run, you choose a gas mixture that produces the right reactive species. For example, oxygen-containing plasmas tend to form oxygenated groups, while nitrogen-containing plasmas can introduce nitrogen functionalities. If you use a fluorine-containing gas, you often end up with fluorinated surfaces that change wetting and friction.
Finally, remember that functional groups are not just “added.” They are formed through competing pathways: surface activation, radical attachment, and possible etching or fragmentation. A practical way to think about it is a tug-of-war between deposition-like reactions (building functional groups) and removal-like reactions (breaking them back off).
Reaction Pathways and What They Mean in Practice
Plasma assisted functionalization commonly follows three linked steps.
- Surface activation: Energetic species break bonds on the surface, creating radicals or reactive sites. On polymers, this often means generating carbon-centered radicals; on oxides, it can involve hydroxylation and defect formation.
- Gas phase to surface transfer: Reactive radicals and ions reach the surface. Their energy and residence time matter; too little reactivity gives weak grafting, too much can over-etch.
- Surface stabilization: The newly attached fragments react with neighboring atoms or with other species to form stable functional groups like hydroxyl (–OH), carbonyl (C=O), amine (–NH2), or carboxyl (–COOH).
A simple example: if you treat a polymer surface with an oxygen plasma, you often increase –OH and C=O groups. Those groups raise surface energy and improve wettability. If you extend the treatment too long or increase power too much, you can also roughen the surface and reduce the density of the desired groups by continued oxidation and chain scission.
Mind Map: Functional Group Introduction
Examples You Can Reason About
Example 1: Oxygen Plasma for Oxygenated Groups on Polymers
- Setup: Treat a polymer film with oxygen plasma at moderate power.
- What you expect: Increased –OH and carbonyl content, leading to lower water contact angle.
- Best practice: Use short pulses or lower exposure time first, then step up. This prevents over-oxidation that can degrade mechanical properties and create excessive roughness.
Example 2: Amine Introduction Using Nitrogen-Containing Plasmas
- Setup: Use a nitrogen-containing gas to generate nitrogen radicals.
- What you expect: Formation of amine-like functionalities that improve chemical bonding with polar adhesives.
- Best practice: Control ion energy. Higher bias can increase grafting but also increases damage on polymers; start with conditions that maximize functional group incorporation without turning the surface into a scorched-earth chemistry.
Example 3: Fluorination for Low Surface Energy and Anti-Fouling Behavior
- Setup: Use a fluorine-containing plasma to create fluorinated fragments.
- What you expect: Reduced surface energy and altered wetting.
- Best practice: Confirm that the functionalization is actually fluorinated rather than merely roughened. Wettability changes can come from both chemistry and morphology, so pair contact angle measurements with surface chemistry analysis.
Practical Control Knobs and Their Effects
- Gas choice sets the “vocabulary” of functional groups available.
- Power and bias control how aggressively bonds are broken and how strongly ions assist grafting.
- Pressure affects mean free path and collision frequency, changing radical energy and surface arrival rates.
- Time determines whether you build functional groups or keep etching them away.
A good workflow is to treat functionalization as a balance problem. Measure chemistry (e.g., XPS or FTIR) and properties (e.g., contact angle) after each condition change. When the chemistry and property trends agree, you know you are steering functional group formation rather than just changing surface roughness.
7.2 Hydrophilicity Hydrophobicity and Wettability Control by Plasma Treatments
Wettability is the surface’s preference for water to spread or bead. In practice, you control it by changing three things: surface chemistry (what functional groups are present), surface energy (how strongly the surface attracts polar liquids), and surface topography (how roughness amplifies wetting behavior). Plasma is useful because it can modify all three in one tool—often within minutes—while keeping the bulk material mostly untouched.
Foundational Concepts of Wettability
Start with contact angle: a high water contact angle means water beads (more hydrophobic), while a low contact angle means water spreads (more hydrophilic). Plasma treatments shift contact angle by altering the balance between polar and nonpolar interactions at the outermost few nanometers.
Two mechanisms usually work together:
- Chemical functionalization: Oxygen-containing plasmas tend to introduce polar groups such as hydroxyl (–OH) and oxygen bridges, which increase surface energy and wetting. Hydrocarbon-containing plasmas can leave more carbon-rich, lower-energy surfaces that resist wetting.
- Surface activation and reorganization: Even when the plasma adds oxygen, the surface can rearrange during treatment and cooling. That means the same recipe can behave differently on different substrates.
A practical rule: if you want water to spread, aim for higher polar surface character; if you want water to bead, aim for lower polar character and often a more hydrophobic outer layer.
Plasma Chemistry Pathways for Wetting Control
Oxygen and air plasmas commonly increase hydrophilicity. They can remove weakly bound organics and oxidize the surface, raising the fraction of polar groups. A simple example is treating a polymer film that has been handled with bare hands: the plasma removes fingerprints and boosts wetting so water spreads instead of forming droplets.
Argon or inert plasmas are often used for physical activation. They can clean and create reactive sites without strongly changing chemistry. This is helpful when you plan a later step (for example, a coating or bonding layer) and want the surface to be receptive.
Fluorocarbon plasmas tend to increase hydrophobicity. They deposit fluorinated fragments that lower surface energy. A common example is improving water repellency on glass or polymer parts that must resist splashing and spotting.
Mixed-gas strategies let you tune between these extremes. For instance, a small oxygen fraction in a fluorocarbon plasma can reduce excessive deposition while still maintaining hydrophobic behavior.
Topography Effects and Why Roughness Matters
Plasma can also change roughness through etching. Roughness can amplify wetting outcomes:
- On a hydrophilic surface, increased micro-scale roughness often helps water spread by increasing contact area.
- On a hydrophobic surface, roughness can trap air pockets and further increase beading.
Example: If you treat a porous ceramic with oxygen plasma, you may see improved wetting because the surface becomes both more polar and more accessible. If you treat the same ceramic with a fluorocarbon plasma, roughness can help create stable water beading.
Process Variables That Actually Control the Outcome
Wettability is sensitive to more than gas choice. Use these variables as your control knobs:
- Power and bias: Higher ion energy generally increases surface activation and etching. On polymers, too much energy can cause excessive roughening or damage, leading to unstable wetting.
- Pressure: Lower pressure often yields longer mean free paths and different ion-to-radical ratios, changing how much chemistry versus etching dominates.
- Treatment time: Short treatments can clean and activate; longer treatments can over-etch or remove beneficial layers.
- Gas flow and composition: Small changes in oxygen fraction can shift the surface from hydrophobic to hydrophilic.
- Substrate and contamination state: A freshly cleaned surface responds differently than one with adsorbed water or hydrocarbons.
A simple workflow example for hydrophilicity on a polymer: start with an inert plasma brief clean to remove loosely bound contaminants, then switch to oxygen plasma for functionalization. Measure contact angle after each step so you can separate cleaning effects from chemical functionalization.
Measurement and Interpretation Without Guesswork
Measure contact angle with consistent droplet volume, ambient humidity, and time after deposition. Many surfaces show time-dependent behavior because polar groups can react with airborne species. If you compare recipes, always use the same measurement timing.
Also track repeatability. If contact angle varies widely across a part, the issue may be nonuniform plasma exposure or uneven surface contamination rather than chemistry.
Mind Map: Wettability Control Logic
Example: Choosing a Recipe for a Real Part
Goal: Make a polymer surface wettable for coating adhesion.
- Inspect the surface for visible contamination and handle marks.
- Run a short inert plasma clean to remove weakly bound organics.
- Follow with oxygen plasma at moderate power to introduce polar groups without excessive etching.
- Measure contact angle at a fixed time after droplet placement.
- If water still beads, increase oxygen exposure slightly; if the surface becomes rough or unstable, reduce power or shorten time.
Goal: Make a glass surface water-repellent for splash resistance.
- Clean first so the fluorinated layer forms on a consistent base.
- Use a fluorocarbon plasma to deposit low-energy fragments.
- If water spreads too much, increase fluorocarbon fraction or treatment time.
- If water beading is inconsistent, check uniformity and avoid over-etching that can create defects.
The key is to treat wettability as a measurable balance: chemistry sets the baseline, roughness amplifies it, and process variables determine which effect dominates.
7.3 Antimicrobial and Bioactive Surface Engineering Using Controlled Chemistry
Antimicrobial and bioactive surfaces start with a simple question: what should happen when a biological system touches the material? Plasma chemistry helps answer it by controlling which functional groups, ions, and reactive fragments reach the surface, and how long they remain there before the surface is sealed by air exposure or further processing. The key is to treat the surface like a reaction site, not just a coating target.
Foundational Concepts for Controlled Chemistry
Begin with three controllable levers: (1) surface activation, (2) chemical incorporation, and (3) stability of the introduced functionality.
Surface activation removes weak boundary layers and creates reactive sites. For example, oxygen or nitrogen plasmas can generate polar groups and dangling bonds that improve subsequent attachment of antimicrobial moieties.
Chemical incorporation determines what the surface presents to cells and microbes. In practice, you choose a plasma chemistry that can introduce functional groups such as amines, quaternary ammonium-like motifs, carboxyls, or specific halogenated fragments. A practical rule: if you need strong interaction with microbial membranes, you generally want positively charged or highly polar surface chemistry; if you need protein-guided bioactivity, you often want carboxyl or hydroxyl-rich surfaces that support controlled adsorption.
Stability matters because plasma-introduced groups can rearrange or oxidize in air. A surface that looks antimicrobial immediately after treatment may lose activity after days if the chemistry is not anchored or if it is too easily hydrolyzed.
Process Logic from Pretreatment to Final Function
A systematic workflow keeps the cause-and-effect chain intact.
-
Pretreat for cleanliness and activation: Use a short oxygen plasma step to remove organics and increase wettability. As a sanity check, confirm that water contact angle drops and then stabilizes rather than slowly creeping back up.
-
Introduce antimicrobial or bioactive chemistry: Switch to the functionalizing plasma. For antimicrobial surfaces, nitrogen-containing chemistries are often used to create amine-rich layers; for bioactive surfaces, oxygen- or nitrogen-oxygen mixtures can create carboxyl and hydroxyl functionalities.
-
Stabilize and cap if needed: If the chemistry is too reactive, apply a mild post-treatment such as a low-power plasma in a stabilizing gas (for example, a dilute oxygen or inert step) or deposit a thin barrier layer that preserves the functional groups while reducing rapid loss.
-
Verify with targeted tests: Use both chemical and biological checks. Chemical verification ensures you installed the intended groups; biological tests confirm the surface behavior.
Mind Map: Antimicrobial and Bioactive Surface Engineering
Example: Building an Antimicrobial Amine-Rich Surface
Suppose you want an antimicrobial surface for a polymer component. Start by cleaning with an oxygen plasma for a short duration to remove contaminants and raise surface polarity. Then run a nitrogen-containing plasma under conditions that favor amine incorporation rather than heavy etching. Keep power and time moderate so you don’t roughen the surface excessively or damage the polymer.
After treatment, measure water contact angle. A drop indicates increased polar functionality, but the antimicrobial claim should not rely on wettability alone. Use XPS to confirm nitrogen presence and bonding states consistent with amine-like groups. Finally, test antimicrobial performance using a standard viability assay against a representative bacterium. If activity is strong right after treatment but weak after storage, the likely issue is insufficient anchoring; a mild capping step or a thin protective overlayer can reduce rapid chemical loss.
Example: Bioactive Surface for Controlled Protein Adsorption
For a bioactive surface, the objective is not “kill everything,” but “guide the right interactions.” A common approach is to create a surface rich in hydroxyl and carboxyl groups so proteins adsorb in a configuration that supports cell attachment.
Use oxygen plasma pretreatment to generate polar groups, then apply a nitrogen-oxygen plasma to tune the balance between hydroxyl and carboxyl functionalities. Verify with FTIR or XPS by checking the relative intensities of oxygen- and nitrogen-related bonding features. Then evaluate cell adhesion and viability. If cells attach poorly, the surface may be too oxidized and protein adsorption may be nonproductive; if cells attach but spread poorly, the functional group density or distribution may be off.
Practical Control Points That Prevent Common Mistakes
- Avoid treating wettability as the whole story: contact angle is a proxy for surface energy, not a direct measure of antimicrobial chemistry.
- Separate activation from functionalization: a single gas step often mixes effects and makes it hard to interpret results.
- Check stability in the environment you care about: test after conditioning in relevant media, not only immediately after plasma.
- Watch for cytotoxicity tradeoffs: strongly cationic surfaces can be antimicrobial but also harsh to mammalian cells; tune chemistry intensity rather than maximizing it.
Controlled plasma chemistry turns antimicrobial and bioactive performance into an engineering problem: define the desired surface interactions, install the right functional groups, stabilize them, and verify with both chemistry and biology. When those steps are connected, the results stop being mysterious and start being repeatable.
7.4 Adhesion Promoters and Interlayers for Improved Film Substrate Bonding
Plasma-deposited thin films often fail at the interface, not in the bulk. Adhesion promoters and interlayers reduce that risk by improving chemical compatibility, mechanical interlocking, and charge/energy matching during growth. Think of the interface as a handshake: without the right gestures, the two materials may agree on nothing.
Core Concepts That Control Adhesion
Adhesion is influenced by three coupled factors:
- Interfacial chemistry: Plasma can create reactive surface groups, but the film precursor chemistry must meet them. If the film forms bonds with the wrong atoms, you get weak contact.
- Interfacial energy and wetting: A promoter layer can raise surface energy so the incoming film spreads and covers micro-asperities instead of beading.
- Mechanical coupling: Roughness and graded stiffness help the interface tolerate thermal mismatch and stress from ion bombardment.
A practical rule: if you can’t change the film chemistry, change the interface chemistry and stiffness.
Adhesion Promoters Versus Interlayers
Adhesion promoters are thin, often sub-nanometer to a few nanometers, and primarily act at the interface. They may be created in situ by plasma activation or by depositing a reactive “bridge” layer.
Interlayers are thicker than promoters and provide a controlled transition in composition, structure, and modulus. They are especially useful when the film and substrate have very different bonding preferences, such as polymers to hard coatings.
Mechanisms and How They Show Up in Practice
1. Plasma-activated bonding sites
- Example: Treat an aluminum surface with a short oxygen plasma step to increase hydroxyl and oxide reactivity.
- Then deposit a silane-like interlayer (or a silicon-oxide-rich layer) before the main film.
- Outcome you can check: improved scratch adhesion and fewer cohesive failures within the film.
2. Chemical bridging through functional groups
- Example: For polymer substrates, a nitrogen- or oxygen-containing plasma can introduce polar groups.
- A thin interlayer with compatible chemistry (such as an oxygen-rich oxide) can form stronger interfacial bonds than a purely inert layer.
- Outcome you can check: reduced delamination after thermal cycling.
3. Mechanical interlocking and stress relief
- Example: Use a mild plasma roughening step, then deposit a graded interlayer that transitions from substrate-like composition to film-like composition.
- Outcome you can check: fewer edge-lift failures and improved adhesion across the full wafer.
Selecting Materials and Process Routes
Choose the promoter or interlayer based on the substrate and the film’s bonding needs:
- Metals and alloys: Promote oxide formation or use oxide-forming interlayers to stabilize bonding.
- Oxides and ceramics: Often benefit from thin silicon-oxide or metal-oxide interlayers that match surface chemistry.
- Polymers: Require both surface activation and a barrier-like interlayer to prevent film stress and interfacial swelling.
Process route matters as much as material. A common best practice is sequential processing without breaking vacuum when possible, so the activated surface doesn’t relax back to a less reactive state.
Mind Map: Adhesion Promoters and Interlayers
Example Protocol: Metal Substrate to Hard Oxide Film
- Surface activation: Run a short argon/oxygen plasma to remove weak boundary contamination and increase oxide reactivity.
- Promoter/interlayer deposition: Deposit a thin oxide-rich interlayer (a few nanometers) using a plasma-assisted route that forms bonds with the substrate oxide.
- Main film deposition: Deposit the hard oxide film under conditions that maintain dense growth and avoid excessive interfacial shear.
- Checkpoints: Use scratch testing to confirm the failure shifts from interface to within the film or substrate; use XPS to verify interfacial bonding states.
Example Protocol: Polymer Substrate to Protective Coating
- Gentle activation: Use a low-power oxygen plasma to introduce polar groups without excessive etching.
- Barrier interlayer: Deposit a thin, oxygen-rich interlayer to reduce swelling and improve chemical contact.
- Stress management: Keep the first growth stage low-stress by limiting energetic bombardment and using a controlled deposition rate.
- Checkpoints: Monitor adhesion after humidity exposure and thermal cycling; look for reduced edge delamination.
Common Failure Modes and Targeted Fixes
- Delamination at the interface: Increase chemical compatibility by adjusting promoter chemistry or adding an interlayer transition.
- Poor coverage or pinhole-related failures: Improve wetting via surface energy tuning and ensure the promoter layer is continuous.
- Cracking near the interface: Reduce stress by grading modulus or lowering ion energy during the initial growth stage.
A good adhesion strategy is systematic: activate the substrate, insert the right chemical bridge, manage stress early, and verify with failure-mode-aware testing. If you do those steps in order, the interface usually stops being the weak link.
7.5 Case Based Protocols for Functionalizing Polymers Glass and Biomedical Surfaces
Functionalizing surfaces with plasma is easiest to control when you treat it like a sequence: clean the surface, activate it, introduce the right chemistry, and verify the result. The “case-based” part means you pick a target performance, then choose a protocol that fits the material’s chemistry and the surface’s sensitivity.
Core Workflow That Works Across Materials
- Define the goal: adhesion for a coating, stable wetting for fluid handling, or biointerface compatibility for contact with tissue or blood.
- Choose a plasma role: activation only (surface energy and functional groups), grafting support (creating reactive sites), or thin-film coupling (forming an interlayer).
- Run a two-step process when needed: a short activation step followed by a chemistry step. This reduces the chance that the activation products simply reorient or react away.
- Verify with the right measurement: contact angle for wetting, XPS for chemical state, and adhesion or durability tests for performance.
Mind Map: Protocol Selection Logic
Case 1: Polymers for Stable Wettability and Coating Adhesion
Problem: Many polymers are low-energy and contaminated by processing residues, so coatings bead up and peel.
Protocol
- Cleaning: Use a brief oxygen plasma exposure to remove organics. Keep the time short to avoid excessive etching.
- Activation: Follow with oxygen or oxygen/argon to create polar groups. A practical rule is to stop once contact angle drops sharply but before the surface becomes visibly rough.
- Functionalization: If you need stronger coupling, introduce a plasma chemistry that can form specific linkages. For example, a nitrogen-containing gas can increase amine-like functionalities that improve bonding to polar coatings.
Easy example: Treat a polymer coupon, measure contact angle after each step, and stop when the angle reaches a stable low value for several minutes in air. Then apply a thin coating and perform a simple tape adhesion test. If the coating fails at the interface, increase activation intensity slightly or add a coupling step rather than extending the first oxygen step indefinitely.
Case 2: Glass for Silane Coupling and Durable Interfaces
Problem: Glass often has surface hydroxyl groups, but they can be depleted by drying, storage, or contamination.
Protocol
- Cleaning: Oxygen plasma to remove organics and restore a reactive surface.
- Activation: A short argon or oxygen/argon step can improve uniformity by reducing weakly bound contaminants.
- Functionalization: Use plasma to prepare the surface for silane chemistry. The goal is to increase the density and accessibility of hydroxyl groups so the silane can form stable bonds.
Easy example: After plasma treatment, apply a silane-based coupling layer and compare two samples: one treated immediately and one stored for a day. The immediate sample should show better wetting and stronger adhesion because the hydroxyl availability is higher.
Case 3: Biomedical Surfaces for Controlled Biointerface Chemistry
Problem: Biomedical surfaces must support desired cell or protein interactions while avoiding unstable residues that can trigger unwanted responses.
Protocol
- Cleaning: Use oxygen plasma with conservative exposure to remove organics without creating excessive surface damage.
- Activation: Introduce a step that adds functional groups relevant to the target interaction. For instance, nitrogen-containing plasmas can increase polar functionality that improves protein adsorption stability.
- Coupling or Interlayer: If you need a specific interface, use a plasma-assisted coupling strategy so the functional layer is chemically anchored rather than loosely adsorbed.
- Residue control: After functionalization, include a mild cleaning plasma step to reduce loosely bound fragments.
Easy example: Run a small matrix on identical coupons: vary only the functionalization step while keeping cleaning and activation constant. Measure contact angle and XPS chemical states. Choose the condition that gives the target wetting and the expected chemical signature, then confirm with a simple adhesion or retention test under wet conditions.
Mind Map: Verification and Decision Points

Practical Notes That Prevent Common Failures
- Don’t treat time as the only knob: if contact angle improves but adhesion worsens, the surface may be chemically activated but mechanically weakened.
- Separate activation from chemistry: a short activation step followed by a functionalization step usually gives more consistent results than one long mixed exposure.
- Keep the surface state consistent: measure and coat promptly after plasma treatment, especially for polymers and glass.
Minimal Example Protocol Set for Three Materials
- Polymers: oxygen cleaning → oxygen/argon activation → nitrogen-containing functionalization → optional mild cleaning → coating or bonding.
- Glass: oxygen cleaning → oxygen/argon uniformity step → hydroxyl-supporting functionalization → silane coupling → rinse and dry.
- Biomedical: oxygen cleaning → polar-group activation → anchored coupling/interlayer → residue-reduction step → wet-condition verification.
8. Process Monitoring and Quality Assurance for Thin Film Production
8.1 Thickness Measurement Methods Including Profilometry and Ellipsometry
Thickness is one of those numbers that looks simple until you ask, “Which thickness?” A film can be measured along a line, averaged over an area, or inferred from how light reflects. This section builds a practical workflow: start with what each method actually measures, then choose the right instrument and model, and finally verify the result with cross-checks.
What Thickness Means in Practice
Thickness can refer to:
- Physical height: the step height between substrate and film.
- Optical thickness: an effective thickness inferred from refractive index and absorption.
- Geometric thickness: thickness averaged over a surface region, assuming uniformity.
A good habit is to state the measurement definition before you start. For example, profilometry typically reports a geometric step height, while ellipsometry reports thickness through an optical model.
Profilometry Fundamentals and Measurement Logic
Profilometry measures surface height differences by scanning a stylus or using optical height sensing.
Stylus Profilometry
A stylus traces a line across a film edge or a masked step. The instrument converts deflection into height.
Easy example: If you deposit a film on a wafer with a small masked area, you get a clean step. Scan across the step, and the software reports the step height after subtracting the substrate baseline.
Key best practices:
- Create a real step: masking or scribing gives a measurable height discontinuity.
- Control scan direction: measure multiple directions if the film has directional texture.
- Beware of edge effects: the transition region can be wider than you expect due to redeposition or shadowing.
Optical Profilometry
Optical methods (often interferometric) can measure height without a physical tip. They are useful when the film is soft, rough, or easily scratched.
Easy example: For a delicate polymer coating, use optical height sensing to avoid stylus damage. Measure the same region repeatedly to check repeatability.
Ellipsometry Fundamentals and Measurement Logic
Ellipsometry measures the change in polarization upon reflection. From that change, you infer film thickness using a model that includes refractive index (and sometimes absorption).
Single-Layer Optical Model
For a simple film on a known substrate, you fit ellipsometric parameters to obtain thickness and refractive index.
Easy example: Suppose you have a transparent oxide film on silicon. You can start with a model where the film has a constant refractive index (or a simple dispersion model) and fit thickness. If the fit residuals are small and consistent across angles, the thickness is credible.
Multilayer and Roughness Modeling
Real stacks often include interlayers, native oxides, or graded density. Ellipsometry handles this by using layered models and sometimes an effective medium approximation for roughness.
Easy example: If your film sits on a naturally oxidized metal, include an interfacial oxide layer in the model rather than forcing everything into one thickness number.
Mind Map: Choosing the Right Method
Systematic Workflow from Setup to Final Number
- Confirm film uniformity: take a quick map (even a few points) before detailed measurement.
- Pick the method based on film and geometry:
- If you can create a step and want direct height: profilometry.
- If the film is thin and you can measure optical response: ellipsometry.
- Set up measurement conditions:
- Profilometry: choose scan length and sampling resolution so the step transition is captured.
- Ellipsometry: measure at multiple angles if available to reduce model ambiguity.
- Run the measurement and inspect raw signals:
- Profilometry: check for drift, baseline tilt, and edge artifacts.
- Ellipsometry: check fit residuals and whether fitted parameters behave consistently.
- Report thickness with context:
- Include the area/spot size, model assumptions (for ellipsometry), and whether thickness is an average.
- Cross-check when possible:
- Compare profilometry step height to ellipsometry thickness on the same sample region.
Common Pitfalls and How to Avoid Them
- Profilometry on sloped or rough surfaces: the “step” may include topography. Use baseline subtraction and multiple scans.
- Ellipsometry with an oversimplified model: thickness can compensate for wrong refractive index. If residuals are large, refine the model rather than forcing a number.
- Assuming the film is perfectly uniform: thickness variation across the wafer can be larger than measurement uncertainty. Map before concluding.
Example: A Practical Comparison on One Sample
Imagine you deposit a 50–100 nm oxide film on silicon and mask a small region during deposition.
- Profilometry: scan across the masked edge and obtain a step height. Repeat at several locations to estimate variation.
- Ellipsometry: measure the unmasked region and fit a single-layer model with silicon substrate optical constants. If the fit residuals are low, extract thickness.
- Reconciliation: if ellipsometry thickness is consistently higher, the model may be missing an interfacial layer or roughness; if it is lower, the refractive index assumption may be off.
Mind Map: What to Check Before Trusting the Number

Summary
Profilometry gives a direct geometric height when you can measure a step, while ellipsometry infers thickness from optical response using a model. The most reliable results come from matching the method to the sample geometry, checking raw signals and fit quality, and using cross-method comparison when the sample allows it.
8.2 Composition Verification Using XPS AES EDS and RBS
Composition verification is the part where “it looks right” becomes “it is right.” The trick is that each technique answers a different question: XPS and AES focus on the top few nanometers, EDS surveys elements across the probed volume, and RBS measures areal composition with depth sensitivity. A good workflow combines them so the strengths cover the weaknesses.
Mind Map: Composition Verification Strategy
Foundational Concepts That Decide Which Tool to Use
Start with two questions: “Where am I measuring?” and “What does the signal represent?” XPS and AES are surface-biased because electrons escape only from a shallow region. EDS collects X-rays generated throughout the interaction volume, so it is sensitive to both film and substrate depending on acceleration voltage and film thickness. RBS uses energetic ions and records how many ions scatter back at different energies, which maps composition versus depth.
A practical rule: if you need chemical state information at the surface, XPS is your anchor. If you need ultra-surface elemental confirmation and fast mapping, AES helps. If you need a quick elemental survey across a cross-section, EDS is efficient. If you need depth-resolved areal composition and an independent thickness check, RBS is the tie-breaker.
XPS for Chemical State and Surface Element Ratios
XPS measures core-level binding energies, so it can distinguish, for example, metal oxides from metallic states when peaks are well resolved. Quantification typically uses peak areas corrected by instrument-specific sensitivity factors and an estimate of the inelastic mean free path. The workflow is simple but disciplined:
- Acquire a survey scan to identify candidate elements.
- Collect high-resolution scans for key peaks.
- Fit peaks with a consistent background model and constrained line shapes.
- Convert fitted areas to atomic percentages using sensitivity factors.
Easy example: suppose a TiN coating is expected to be mostly Ti and N. If XPS shows Ti 2p peaks shifted toward TiOx binding energies and an elevated O 1s signal, that often indicates surface oxidation or oxygen incorporation. You can still report Ti:N, but you should treat oxygen as a separate variable rather than forcing it into the same stoichiometry model.
Best practice: sputtering can change chemistry. If you sputter for depth profiling, verify that the sputter conditions do not preferentially remove nitrogen or create artificial reduction/oxidation.
AES for Ultra-Surface Element Checks and Mapping
AES detects Auger electrons, which are even more surface-sensitive than XPS. It is excellent for spotting thin contamination layers, verifying whether an adhesion interlayer is present at the topmost surface, and producing elemental maps.
Easy example: after plasma cleaning, you expect low carbon. If AES shows a persistent C KLL signal while XPS carbon is low, the carbon may be present as a very thin layer that XPS averages differently due to sampling depth and fitting choices. In that case, AES mapping helps locate whether contamination is uniform or localized near edges.
Best practice: use the same acquisition geometry and beam conditions when comparing samples, because AES intensities can shift with electron beam parameters.
EDS for Elemental Survey and Cross-Section Context
EDS is fast and forgiving for major elements, but it is vulnerable to matrix effects, peak overlaps, and geometry. In SEM, the interaction volume grows with accelerating voltage, so a thin film can be “diluted” by the substrate signal.
Easy example: a thin Al2O3 film on steel. If you run EDS at high kV, the Fe peaks can dominate the spectrum, making the film look too thin or too low in Al. Lowering kV reduces interaction depth, improving film-specific sensitivity.
Best practice: report EDS results with an explicit measurement context—accelerating voltage, take-off angle, and whether the analysis is on the surface or a cross-section. When possible, compare EDS to a method with depth sensitivity (RBS) or chemical state sensitivity (XPS).
RBS for Depth-Resolved Areal Composition and Thickness Consistency
RBS measures how ions scatter as a function of energy loss in the material. The output is a spectrum where features correspond to different elements at different depths. Converting spectra into composition requires a stopping power model and a fit that accounts for detector resolution and energy calibration.
Easy example: if a coating is expected to be uniform TiN with a known thickness, RBS should show Ti and N signals aligned in depth. If Ti appears deeper than N, that can indicate nitrogen deficiency near the surface, intermixing at the interface, or preferential sputter loss during processing.
Best practice: use RBS to cross-check thickness and areal stoichiometry. If RBS thickness disagrees with deposition rate assumptions, revisit the deposition parameters or the density used in the model.
Integrated Reconciliation Workflow
A robust approach is to treat each method as a constraint in a single mass-balance story:
- Use XPS to confirm surface chemical states and surface atomic ratios.
- Use AES to verify ultra-surface elemental presence and contamination patterns.
- Use EDS to confirm major elements and spatial context across features.
- Use RBS to confirm depth distribution and areal composition.
When results disagree, the most common causes are measurement depth mismatch (EDS vs XPS), surface contamination (XPS/AES), peak fitting choices (XPS), or incorrect depth calibration and stopping power assumptions (RBS). The fix is rarely “more data”; it is better alignment of measurement conditions and a consistent interpretation model.
8.3 Uniformity Mapping and Statistical Control of Deposition Runs
Uniformity is what you get when the film thickness, composition, and key properties behave the same way across the part—not just on average. In practice, you’re mapping spatial variation and then controlling it so the next run looks like the last one for the right reasons.
Core Ideas for Uniformity Mapping
Start with a clear definition of what “uniform” means for your process. For many plasma and thin-film workflows, thickness uniformity is the first metric because it’s measurable quickly. Composition uniformity matters next because it often explains thickness trends, especially in reactive or ion-assisted deposition.
A useful mental model is: geometry and transport set the baseline, while plasma and surface kinetics set the fine structure. Geometry includes target-substrate distance, chamber shape, and part orientation. Transport includes gas flow paths and pumping speed. Plasma includes ion energy distribution and reactive species availability. Surface kinetics includes sticking probability and re-sputtering.
Measurement Plan That Doesn’t Waste Time
Uniformity mapping is only as good as the sampling strategy. A common mistake is to measure too few points and then “discover” nonuniformity after the part is already coated.
- Choose a grid over the substrate or part. For flat coupons, a 5×5 grid is often enough to reveal radial and angular gradients. For larger substrates, use a coarser grid first (for example, 3×3), then refine where gradients are strongest.
- Pick the measurement method that matches the film. Profilometry works for steps and thicker films; ellipsometry works well for smooth films with known optical models; X-ray methods or EDS/XPS can be used for composition, usually at fewer points.
- Record process context with each point: substrate position, local shadowing, and any masking. If you don’t log these, you’ll later confuse “physics” with “placement.”
From Maps to Numbers
Once you have thickness values across the grid, convert them into metrics you can control.
- Mean thickness: the baseline level.
- Uniformity percent: typically
- (max − min) / mean × 100% for a quick view, or
- standard deviation / mean × 100% for a statistics-friendly view.
- Gradient direction: identify whether variation is radial, azimuthal, or edge-dominated.
A practical workflow is to create two maps per run: one for thickness and one for composition proxy (for example, a ratio from XPS or a spectroscopic signal). When both maps share the same pattern, you know the cause is likely transport or plasma chemistry rather than measurement noise.
Mind Map: Uniformity Mapping and Statistical Control
Statistical Control Across Runs
Mapping a single run tells you what happened once. Statistical control tells you whether the process is stable and whether changes improve uniformity without breaking other aspects.
A straightforward approach is to track a small set of representative locations chosen from the worst-case regions on the grid. For example, select the center, a mid-radius point, and the edge point where max-min uniformity is typically determined. Then, for each run, compute the same uniformity metric and plot it over time.
Use control charts to separate routine variation from special causes. If your uniformity metric suddenly shifts, check for changes in gas delivery (flow controller drift), pumping performance (leaks or clogged lines), substrate handling (rotation timing or tilt), and plasma matching (tuner settings or electrode condition). The point is not to blame; it’s to find the one change that explains the pattern.
Example: Diagnosing an Edge-Heavy Thickness Profile
Suppose your thickness map shows the center is 100 nm while the edge reaches 120 nm, giving a (max − min)/mean of about 18%. The composition proxy map shows the same edge enrichment.
A likely interpretation is that reactive species or sputtered flux is more available near the edge due to transport and local plasma density. If the process uses substrate rotation, confirm rotation speed and start/stop timing. If rotation is correct, check gas inlet orientation and pumping speed; a small change in flow distribution can create a consistent radial gradient.
After adjusting gas flow distribution, you don’t need to re-measure every point. Re-validate using the reduced set: center, mid-radius, and edge. If the edge drops while the center stays stable, you’ve improved uniformity without shifting the whole deposition rate.
Example: When Thickness Uniformity Improves but Composition Uniformity Worsens
In another run, thickness uniformity improves from 18% to 10%, but composition proxy variation increases. This can happen if you tuned parameters that affect deposition rate more than surface reaction pathways. For instance, changing bias can alter ion-assisted re-sputtering differently across the substrate, changing stoichiometry while still producing a flatter thickness.
The control lesson is to track both metrics. If only thickness is controlled, you may “win the map” and lose the film’s functional behavior.
Practical Checklist for Each Run
- Grid selection documented and consistent.
- Measurement method and calibration status recorded.
- Thickness and composition proxy maps generated.
- Uniformity metric computed with a predefined formula.
- Representative locations tracked on control charts.
- Any maintenance or hardware adjustment logged with run ID.
Uniformity mapping and statistical control work best when they’re treated as a loop: measure spatial patterns, reduce them to control metrics, then use run-to-run statistics to decide what to change and what to leave alone.
8.4 Defect Identification Including Pinholes Voids and Delamination Modes
Defects in thin films rarely announce themselves with a single symptom. A pinhole can be a tiny missing island, a void can be a growth shadow, and delamination can be an interface chemistry problem that only shows up after a stress cycle. The practical goal is to connect what you see to where it came from in the process.
Foundational Defect Logic from Process to Failure
Start by mapping each defect to the step that most strongly controls it:
- Pinholes often trace back to incomplete surface coverage during early growth, insufficient adatom mobility, or interruptions that leave gaps.
- Voids commonly relate to columnar growth, shadowing in high aspect ratio features, or gas-phase transport issues that create local starvation.
- Delamination usually points to weak adhesion, residual stress, contamination at the interface, or poor interlayer continuity.
A useful habit is to record the “defect timeline” during the run. If the defect density changes with deposition time, it suggests a growth mechanism. If it correlates with a specific step like substrate bias change or gas switching, it suggests a process transition.
Pinholes Identification and Root Causes
Pinholes appear as small, bright or dark spots depending on imaging mode. In SEM, they often look like localized breaks in the film plane. In optical inspection, they may show up as scattered intensity anomalies.
Easy example: Imagine coating a flat coupon with a thin oxide. At low thickness, the film may form islands that coalesce. If you stop early, you can see pinholes where islands never fully merged. Increasing thickness or improving early-stage coverage typically reduces pinholes.
Common checks:
- Compare pinhole density across thickness steps from the same recipe.
- Inspect the earliest deposited region if you can do time-resolved deposition or segmented runs.
- Verify substrate preparation consistency, since residual organics can prevent uniform nucleation.
Voids Identification and Root Causes
Voids are larger than pinholes and often form networks or pockets. They can be hidden from top-view imaging, so cross-section work matters.
Easy example: Consider a film deposited under conditions that promote columnar microstructure. Columns leave inter-column gaps. Over time, those gaps can evolve into voids, especially if the film is under-densified.
Common checks:
- Use cross-sectional SEM or focused ion beam milling to confirm whether voids are inter-column or intragranular.
- Look for correlation with substrate geometry and gas flow direction; voids that track geometry often involve transport or shadowing.
- Compare void fraction with densification indicators such as refractive index trends or stress signatures.
Delamination Modes and How to Tell Them Apart
Delamination is not one thing. You can see cohesive failure within the film, adhesive failure at the interface, or mixed behavior.
Easy example: If a scratch test lifts film in sheets while the substrate surface remains clean, adhesion may be weak. If the film fractures into fragments with rough edges, cohesive failure inside the film is more likely.
Practical identification workflow:
- Visual and optical inspection after a controlled stress event such as thermal cycling or a standardized scratch.
- Cross-section imaging to locate the separation plane.
- Chemical state checks at the interface when possible, because contamination can reduce bonding even if the film looks fine.
Mind Map: Defect Identification Workflow
Mind Map: Pinholes Voids Delamination Connections
Integrated Examples with Concrete Decision Points
Example 1: Pinholes after a gas switch. If pinholes spike right after changing precursor or reactive gas, the likely cause is a nucleation coverage change. The decision point is to compare early-stage thickness runs before and after the switch.
Example 2: Voids that follow feature geometry. If voids are concentrated near edges or inside recesses, transport and shadowing are suspects. The decision point is to compare coatings on identical substrates with different orientation relative to gas flow.
Example 3: Delamination after thermal cycling. If delamination appears only after cycling, residual stress and interface bonding are likely. The decision point is to separate adhesive versus cohesive behavior using cross-section imaging of the separation plane.
Practical Output: A Defect Map You Can Use
When you finish identification, record three items for each defect type: location, scale, and trigger. Location tells you whether it is surface-wide or feature-specific. Scale separates pinholes from voids. Trigger ties the defect to a process transition or a stress event. This turns “we saw defects” into a traceable explanation you can act on in later runs.
8.5 Documentation of Recipes Including Gas Flows Pressures Bias and Timing
A “recipe” is the complete, reproducible set of settings that turns a plasma process from a one-off experiment into a repeatable production step. Good documentation records not only what you set, but also why you set it and how you verified the result. The goal is simple: if someone reruns the process next week, they should get the same film thickness, composition, and surface state—within defined tolerances.
Recipe Foundations That Prevent Guesswork
Start with a header block that identifies the run: substrate type and batch, chamber ID, plasma source type, target material(s), and the intended film or surface function. Then record the process window you are claiming: target pressure range, bias range, and deposition or treatment time range. Finally, include acceptance criteria such as thickness tolerance, uniformity limits, and adhesion or wettability checks.
A practical rule: every parameter should have a unit, a setpoint, and a measurement method. If you used a mass flow controller, note its model and calibration date. If you used a pressure gauge, note the gauge type and whether readings were taken at the pumping line or near the substrate.
Mind Map: What to Record
Gas Flows That Stay Honest
Document gas flows as a table with setpoint, unit, and controller channel. Include purity and any drying or filtering steps if they affect water or oxygen content. Record the gas switching sequence: for example, whether you start with argon for chamber conditioning, then introduce reactive gas after pressure stabilizes.
Example: A typical reactive coating run might use argon as a carrier and oxygen as a reactive species. Record that argon flow is established first, the chamber is stabilized at the target pressure, then oxygen is introduced to reach the intended partial pressure. If you instead introduce oxygen before stabilization, the plasma chemistry can shift quickly and change the film stoichiometry.
Pressure Control with Defined Stabilization
Pressure documentation should include both the setpoint and the stabilization rule. A stabilization rule is a measurable condition such as “pressure within ±2% for 30 seconds before ignition.” Without it, two runs can share the same nominal setpoint yet differ in the transient chemistry during ignition.
Also record pumping strategy. If you used a throttle valve, note its control mode. If you changed pump speed between runs, that belongs in the recipe because it changes the residence time of reactive species.
Bias and Power Settings That Match the Surface Goal
Bias affects ion energy at the substrate, which in turn influences densification, stress, and surface functional group retention. Record bias setpoint, polarity, and ramp profile. If the system uses RF bias, note the frequency and how self-bias is monitored.
Power documentation should include the control mode (constant power, constant current, or feedback-based control) and the matching network state if it is manually adjusted. If the matching network is tuned during the run, record the tuning procedure and the final state.
Example: For adhesion-focused surface activation, you might use a short oxygen/argon plasma with a low bias and a strict time limit. The recipe should specify the ignition delay and the exact duration, because longer exposure can over-oxidize some polymers and reduce subsequent film bonding.
Timing Sequences That Make Runs Comparable
Timing is more than “process time.” Record the full sequence: pre-pump, gas stabilization, ignition delay, ramp-up, main step, post-plasma dwell, and venting. Include shutter or masking timing if used.
A concrete example sequence for a coating run:
- Pre-pump until base pressure is below a defined threshold.
- Introduce process gases and wait for pressure stabilization.
- Ignite plasma after a fixed ignition delay.
- Ramp power and bias to setpoints over a defined duration.
- Run the main step for a specified time.
- Keep plasma off but maintain vacuum for a short dwell to reduce transient surface reactions.
Verification Fields That Close the Loop
Add a “verification” section that ties recipe settings to measured outcomes. Thickness: specify the method (profilometry, ellipsometry, or quartz crystal monitor) and the sampling location. Composition: specify the method (XPS, EDS, RBS) and the sampling area. Uniformity: specify how you mapped it and the acceptance limit.
If a run fails acceptance, record the observed failure mode and the most likely parameter category to investigate first: gas switching, pressure stabilization, bias ramping, or timing drift.
Example Recipe Entry Template
Use a consistent template so entries can be compared line-by-line.
Run ID: PSP-2026-05-11-001
Chamber: CPX-3 Source: RF-DC Hybrid
Substrate: 304SS batch B17 Pre-clean: O2/Ar 5 min
Target: TiN-like hard coating thickness 2.0 µm ±0.1 µm

Gas Flows: Ar 80 sccm, N2 20 sccm (controller MFC-2 calibrated 2026-03-15)
Pressure: 2.5 Pa setpoint, gauge type capacitance, stabilization ±2% for 30 s
Bias: -80 V setpoint, ramp 0 to -80 V over 10 s
Power: 300 W constant power, matching state M1-locked
Timing: pre-pump 30 min, ignition delay 2 s, main 18 min, post-dwell 60 s
Verification: thickness by profilometry at 5 points, adhesion by scratch test
Notes: no interlocks, substrate loaded within 5 min of pre-clean completion
This structure turns recipe documentation into a tool for consistency: it captures the physics-relevant settings, the operational sequence, and the measurements that prove the settings worked.
9. Characterization of Surface and Interface Performance
9.1 Wettability and Surface Energy Measurements Using Contact Angle Methods
Wettability describes how a liquid spreads on a solid, and contact angle is the most direct way to quantify it. A small contact angle usually means the liquid spreads well; a large angle means it beads up. The trick is measuring the angle consistently and translating it into surface energy without pretending the world is perfectly smooth and chemically uniform.
Core Concepts and What Contact Angle Actually Measures
A sessile drop sits on a surface until gravity, evaporation, and surface forces reach a steady shape. The contact angle is the angle between the liquid interface and the solid surface at the three-phase contact line. That angle reflects a balance among solid–vapor, solid–liquid, and liquid–vapor interfacial tensions.
For an ideal, smooth, chemically homogeneous surface, Young’s equation relates the equilibrium contact angle to interfacial tensions. Real surfaces deviate due to roughness, contamination, and chemical heterogeneity, so you often see different angles during advancing and receding.
Measurement Setup for Repeatable Contact Angles
Start with a clean, dry substrate and control the environment. Temperature and humidity matter because many liquids absorb moisture and many surfaces slowly change after plasma exposure. Use a consistent droplet volume so the curvature and gravity effects stay comparable.
A practical workflow:
- Mount the sample so the surface is level.
- Dispense the same liquid volume each time.
- Capture images quickly after deposition to reduce evaporation-driven angle drift.
- Fit the droplet profile using the same algorithm and baseline selection.
If you need advancing and receding angles, move the contact line deliberately by adding or withdrawing liquid at a controlled rate, then record the maximum and minimum angles.
From Contact Angle to Surface Energy
Surface energy is not a single number you can read off a contact angle like a speedometer, because surface energy has components. A common approach is to use the Owens–Wendt–Rabel–Kaelble (OWRK) model, which splits surface energy into dispersive and polar parts.
You measure contact angles with at least two liquids that have different polar/dispersive characteristics. Then you solve for the solid’s dispersive and polar surface energy components. The result is only as good as your assumptions: the surface should be reasonably uniform, and the liquids should wet the surface without strong chemical reactions.
Mind Map: Contact Angle to Surface Energy Workflow
Example: Comparing Two Plasma Treatments on Polymer
Suppose you treat a polymer with two plasma recipes: Recipe A introduces oxygen-containing groups, Recipe B is more inert and mainly changes surface roughness. You test with water and a low-polarity liquid.
- On Recipe A, water contact angle drops from 85° to 35°, while the low-polarity liquid drops only slightly.
- On Recipe B, both liquids drop modestly, with water decreasing from 85° to 70°.
This pattern suggests Recipe A increased polar surface energy more strongly, likely by adding polar functional groups. Recipe B’s effect looks more like improved wetting from topography or reduced contamination rather than a large polar contribution.
If you apply OWRK using the two liquids, you should see a larger increase in the polar component for Recipe A than for Recipe B. If the computed polar component jumps wildly or becomes negative, it usually means the model assumptions are failing—often due to chemical reaction, poor liquid choice, or unstable droplet shapes.
Example: Detecting Roughness Effects with Advancing and Receding Angles
Consider a coated metal with micro-texture. You measure a single equilibrium angle and get 60°. That number alone can mislead because roughness can cause pinning at the contact line.
When you measure advancing and receding angles, you find:
- Advancing angle: 75°
- Receding angle: 45°
The difference indicates hysteresis, meaning the liquid contact line is getting stuck and released. In practice, hysteresis often correlates with how well a coating resists dewetting under flow, so reporting both angles is more informative than reporting only one.
Practical Quality Checks So the Numbers Mean Something
Before comparing surface energy values across samples, verify:
- The droplet profile fit is stable across frames.
- The contact angle does not drift rapidly during the measurement window.
- Replicates show tight scatter.
- You use the same liquid set and same measurement timing for every sample.
A good measurement is boring: consistent images, consistent fits, and results that change in the direction you expect when you change surface chemistry or roughness.
9.2 Tribological Testing Including Wear Friction and Counterface Selection
Tribology tests answer two practical questions: how much resistance you feel during sliding (friction) and how much material you lose or damage (wear). A third question quietly controls both: what the counterface does to your surface. If you treat counterface selection as an afterthought, your results will look precise and still be misleading.
Foundations of Tribological Metrics
Friction is typically reported as a coefficient of friction, often averaged over a steady-state region. The key detail is that friction is not constant: it evolves as the contact area runs in, debris forms, and transfer films develop. A good test plan therefore defines a run-in period and a measurement window.
Wear is reported as mass loss, volume loss, wear rate, or wear track width and depth. Mass loss is convenient but can be biased by debris that stays on the specimen or is lost during cleaning. Track geometry from profilometry or microscopy is often more informative for comparing coatings, because it shows whether wear is abrasive, adhesive, or fatigue-like.
Contact mechanics matter because the same nominal load can produce different real contact pressures depending on roughness and compliance. That is why surface preparation and roughness measurement are not “nice to have”; they are part of the test.
Counterface Selection as a Controlled Variable
The counterface is the other half of the tribological equation. It determines whether the dominant wear mechanism is abrasion by hard asperities, adhesion between similar chemistries, or mixed behavior.
Choose counterface materials based on the application pairing you want to represent. For example:
- Hard, inert counterface (e.g., polished steel or hard ceramic) is useful when you want to evaluate coating hardness and resistance to abrasive wear.
- Chemically reactive counterface (e.g., similar alloy to the component) helps reveal tribochemical effects that can change transfer film stability.
- Soft counterface (e.g., polymer or low-hardness metal) can highlight whether your coating can survive plastic deformation and third-body formation.
Counterface surface finish also matters. A rough counterface can dominate wear even if your coating is excellent, because asperities plow the surface and generate debris that becomes the “real” abrasive.
Test Setup and Measurement Workflow
A systematic workflow keeps the experiment honest.
- Define the contact scenario: sliding mode (pin-on-disk, ball-on-disk, reciprocating), load range, speed, temperature, and environment.
- Measure baseline surface state: roughness (at least average roughness and a profile), coating thickness, and any pre-existing defects.
- Prepare counterfaces consistently: clean, polish to a defined finish, and record hardness or grade.
- Run a short conditioning step: establish a stable friction regime before collecting wear data.
- Collect friction continuously: log friction versus time and identify steady-state intervals.
- Measure wear after the test: use profilometry or microscopy; report wear track dimensions and wear rate.
- Inspect debris and transfer films: debris morphology often explains why friction changed.
A simple example: if you compare two coatings under the same load and speed but one shows lower average friction yet higher wear track depth, you likely have a transfer film that reduces shear but is mechanically fragile.
Tribological Testing Mind Map
Example Protocol for Counterface Comparison
Suppose you test a plasma-deposited hard coating intended for sliding against steel. You want to know whether performance depends on the counterface.
- Counterface A: polished bearing steel, consistent finish, cleaned with the same solvent procedure.
- Counterface B: the same steel grade but with a rougher finish produced by controlled abrasion.
Run identical tests at the same load and speed. If friction is similar but wear increases sharply on Counterface B, the coating is likely abrasion-limited by asperity plowing. If both friction and wear change together, transfer film formation and adhesion may be sensitive to counterface roughness and debris generation.
Advanced Details That Prevent Misleading Conclusions
- Report the steady-state window: two tests can have the same average friction but different stability; stability often correlates with transfer film durability.
- Normalize wear carefully: wear rate should use consistent contact time and track length, not just total run time.
- Check for third-body effects: if debris becomes trapped, the counterface may be less important than the debris chemistry and particle size.
- Use repeatability checks: at least a few repeats per condition reveal whether the result is robust or dominated by a single outlier track.
A good tribology report reads like a recipe: what you used, how you prepared it, what you measured, and how you interpreted the friction and wear together. The counterface is not a footnote; it is part of the test specimen’s story.
9.3 Corrosion Resistance Evaluation for Coated Metals and Alloys
Corrosion resistance evaluation answers a simple question: does the coating slow down the electrochemical reactions that consume the metal? For coated metals and alloys, the coating is not just a barrier; it also changes ion transport, water uptake, and the chemistry at defects like pinholes, scratches, and grain-boundary pathways.
Foundational Concepts for Coated Systems
Start with three mechanisms that often coexist.
- Barrier protection: A dense film reduces permeation of water and oxygen. If the coating is porous or thin locally, corrosion can start underneath.
- Galvanic and interfacial effects: If the coating and substrate form different electrochemical potentials, local cells can accelerate attack at defects.
- Defect-driven corrosion: Even a good coating fails at the “weak spots.” A scratch that exposes the substrate can become the initiation site for underfilm corrosion.
A practical way to think about performance is to separate coating integrity (how well it blocks transport) from interfacial stability (how it behaves where it’s imperfect). That separation guides both test selection and interpretation.
Test Strategy That Matches Real Failure Modes
Pick tests that stress the same pathways you expect in service.
- Salt spray or cyclic salt fog: Useful for coatings exposed to chloride-rich environments. It emphasizes water and chloride transport through defects.
- Electrochemical impedance spectroscopy (EIS): Useful for distinguishing barrier behavior from charge-transfer processes. It can show whether the coating is acting like a resistor-capacitor barrier or whether corrosion reactions are already active.
- Potentiodynamic polarization: Useful for comparing corrosion rates under controlled conditions, especially when you need a ranking across materials.
- Immersion tests: Useful for coatings where water uptake and ion diffusion dominate.
A systematic workflow is to run one screening test for ranking, then one mechanistic test for explanation. For example, use cyclic salt exposure to find which samples fail early, then use EIS on the survivors to confirm whether the barrier response remains intact.
Mind Map: Corrosion Resistance Evaluation for Coated Metals and Alloys
Concrete Examples and How to Interpret Them
Example 1: Comparing two coatings after cyclic salt exposure
- Setup: Coated steel coupons with identical geometry, same pre-cleaning, and matched thickness targets.
- Observation: Coating A shows isolated rust spots near scratches; coating B shows widespread underfilm blistering.
- Reasoning: A likely indicates that corrosion is confined to defect sites, meaning the coating still blocks lateral transport. B suggests higher water/chloride permeability or weaker adhesion at the interface, allowing corrosion to spread under the film.
- Best next step: Perform EIS on both coatings after the same exposure time to confirm whether coating resistance remains high for A but drops for B.
Example 2: Using EIS to distinguish barrier behavior from active corrosion
- Setup: Measure EIS in a chloride-containing electrolyte at open-circuit potential.
- Observation: Coating C shows a high initial coating resistance and a stable phase angle over time; coating D shows a rapid decrease in resistance.
- Reasoning: Stable resistance implies transport limitation through the film. Rapid resistance loss implies that corrosion reactions are consuming the interface, often triggered by permeation through pores or along interfacial pathways.
- Best next step: Cross-section a few failed regions to link the EIS trend to physical pathways like pores, column boundaries, or interlayer discontinuities.
Example 3: Potentiodynamic polarization for ranking
- Setup: Run polarization scans on coated and uncoated samples under identical electrolyte and temperature.
- Observation: Coated E shows a lower corrosion current density than the uncoated alloy, but still increases after a short hold.
- Reasoning: The coating initially suppresses charge transfer, but the system likely reaches a defect-controlled steady state where exposed substrate areas dominate.
- Best next step: Combine with surface inspection to quantify defect density and correlate it with the measured corrosion current.
Practical Reporting That Prevents Misleading Conclusions
Report the coating thickness range, the substrate finish, and the defect-relevant handling steps. Include replicate counts and a clear failure definition, such as rust onset, blister density, or underfilm length. When you compare coatings, normalize results to the same exposure conditions and sample geometry, because corrosion is sensitive to both electrolyte access and surface area.
Finally, link results to failure mode rather than only ranking by numbers. A coating that shows low average corrosion current but frequent early localized rust may still be unacceptable for applications where localized failure is the real problem. In corrosion testing, the “where” matters as much as the “how much.”
9.4 Mechanical Integrity Testing Including Scratch Adhesion and Nanoindentation
Mechanical integrity is where plasma-coated thin films prove they can survive real handling, contact, and load. Two complementary tests cover most failure modes: scratch adhesion for interface and near-surface integrity, and nanoindentation for film stiffness, hardness, and elastic recovery. Together they help you separate “the film is strong” from “the film stays attached.”
Mind Map: Mechanical Integrity Testing
Scratch Adhesion Testing Foundations
Scratch testing uses a stylus that moves across the surface while the normal load increases. The key idea is simple: as load rises, the film either resists cracking and sliding, or it fails by cracking, delaminating, or both. A good scratch test starts with calibration and geometry control. Use a known stylus tip radius, verify the load calibration, and keep the scratch direction consistent across samples.
A practical workflow looks like this. First, choose a scratch length long enough to include a stable region before failure and a region after failure. Second, run a few preliminary scratches to confirm that the failure occurs within the load range you can interpret. Third, record friction and acoustic emission if available; friction often rises as the film resists deformation, then changes sharply when cracking or delamination begins.
After testing, classify the failure mode. If you see a clean track with film lift-off at the interface, that points to weak adhesion. If the film cracks but remains largely attached, the interface may be stronger than the film itself. Mixed behavior is common: microcracks can form in the film, then the interface fails where stress concentrates.
Easy example: Suppose you coat a steel coupon with a hard oxide film. In one run, the scratch shows a sudden delamination at a relatively low load, and the track edges look jagged. In another run, delamination occurs later and the film shows fine cracking without large spallation. The second run likely improved interface bonding or reduced residual stress at the interface.
Nanoindentation Foundations
Nanoindentation measures hardness and elastic modulus by pressing an indenter into the surface while recording load and displacement. The most common pitfall is letting the indentation probe the substrate too much. A rule of thumb is to keep indentation depth small relative to film thickness, so the measured properties reflect the film rather than the substrate.
Start with tip characterization. The indenter’s effective area function must be known, especially at shallow depths. Then ensure the surface is flat enough that the indenter does not tilt or ride over roughness features. During testing, monitor drift and load stability; even small drift can distort the unloading curve, which affects modulus and elastic recovery.
From each indentation, extract hardness H and reduced modulus Er. Also inspect the residual impression shape. Pile-up can indicate limited plastic constraint, while sink-in can indicate different deformation mechanisms. If you see depth-dependent changes in H and Er across a thickness series, that often signals a transition from film-dominated behavior to substrate influence.
Easy example: A thin coating on glass shows lower hardness than a thicker coating of the same chemistry. If the indentation depth is similar in both cases, the thinner film likely gets “contaminated” by substrate response. Adjusting indentation depth or using a thickness series with consistent depth-to-thickness ratios can clarify whether the coating truly changed or the measurement did.
Integrating Scratch and Nanoindentation Results
Scratch adhesion and nanoindentation answer different questions, so integration should be deliberate. Use scratch critical loads to identify when interface failure begins. Then compare those loads with indentation-derived hardness and modulus to see whether the film’s resistance to deformation aligns with its ability to stay attached.
A useful integration pattern is this: if nanoindentation shows a film with high hardness but scratch delamination occurs early, the interface is the limiting factor. If scratch resistance is good but indentation shows low modulus and large elastic recovery, the film may be too compliant to protect against contact stresses even if it stays attached.
Finally, map results rather than relying on a single spot. Scratch tests sample a line and reveal localized failure; indentation mapping reveals property uniformity. If both show strong scatter, the issue may be process consistency, not measurement noise.
Mind Map: Practical Test Matrix
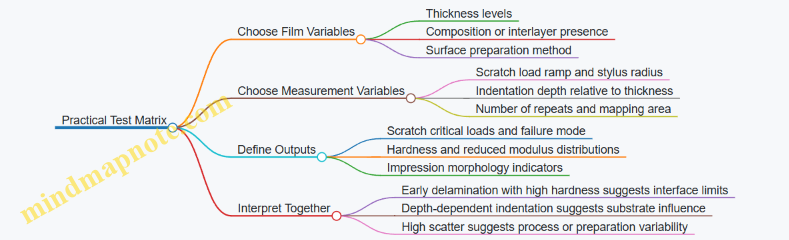
Example: Turning Measurements into Decisions
Imagine three coatings on the same substrate: A is prepared without a plasma activation step, B includes activation, and C adds an interlayer. Scratch tests show A fails by adhesive delamination at low load. B delays delamination and shifts failure toward mixed cracking. C shows the highest critical load and more cohesive cracking within the film.
Nanoindentation supports the story. A has similar hardness to B but a lower effective modulus at shallow depths, consistent with a weaker interface and altered constraint. C shows stable hardness and modulus across the chosen depth range, indicating the film dominates the measurement and the interface can transmit stress without early separation.
This combination lets you make a clear, test-backed decision: the plasma activation and interlayer improved adhesion rather than merely changing film hardness.
9.5 Surface Morphology and Chemical State Analysis for Failure Diagnosis
When a plasma-coated component fails, the failure usually leaves a trail in two places: the surface shape and the chemical state at key interfaces. Surface morphology tells you where material moved, cracked, or detached. Chemical state analysis tells you what reactions happened—often faster than you can see them with the naked eye.
Core Idea: Couple Shape with Chemistry
Start by mapping the failure location and scale. A scratch that exposes substrate chemistry behaves differently from a broad delamination patch. Then connect that map to morphology features such as nodules, pinholes, columnar growth, crater-like defects, and edge buildup. Finally, confirm with chemical state measurements that explain why those features formed.
Step 1: Build a Failure Map Before You Measure
Create a simple grid over the component surface and label regions by appearance: intact coating, transition zones, crack origins, and detached areas. If the part is circular or has known flow direction, note orientation. A practical example: if delamination starts near the leading edge of a rotating fixture, you may see both thicker deposition and altered surface chemistry there due to local plasma exposure and ion bombardment.
Step 2: Morphology Signals and What They Usually Mean
Use microscopy to capture morphology at multiple magnifications.
- Pinholes and crater-like pits often correlate with poor film densification or incomplete coverage during early growth. Example: a hard coating that shows scattered pinholes after wear may have been deposited with insufficient ion energy, leaving pathways for corrosive species.
- Columnar or porous microstructures can appear as vertical features in cross-section. Example: a coating that fails by corrosion at grain boundaries may show columnar morphology and an interfacial chemical gradient.
- Nodule formation can indicate local target/plume instabilities or reactive chemistry that changes nucleation rate. Example: a coating with nodules that later spall under thermal cycling often has weak cohesion around those nodules.
- Edge effects frequently show thicker buildup and different stress states. Example: if the coating peels first at edges, morphology may reveal a steep thickness gradient plus an interfacial chemistry shift.
Step 3: Chemical State Analysis That Actually Explains the Morphology
Chemical state analysis is most useful when it is tied to specific locations from the failure map.
- XPS depth profiling or angle-resolved XPS helps determine whether the interface is chemically bonded or merely in contact. Example: if the coating shows delamination and XPS reveals a thick oxide-rich interlayer at the interface, the plasma pretreatment may have produced an unintended passivation layer.
- Peak shifts and component ratios can indicate oxidation state changes. Example: a metal-containing film that shows higher oxidation at the failure origin suggests either reactive gas exposure during deposition or post-deposition oxidation accelerated by defects.
- Elemental segregation can explain localized weakness. Example: if a fluorine-containing top layer is depleted near cracks, morphology may show crack paths that act as diffusion highways.
- Contaminant detection matters. Example: carbon-rich signatures concentrated at the interface can align with poor adhesion after plasma cleaning.
Step 4: Integrate Results into Failure Mechanisms
The goal is not to list observations; it is to connect them into a mechanism that fits both shape and chemistry.
- Weak interface mechanism: morphology shows early edge lifting or patchy delamination; chemistry shows poor bonding, contamination, or an overly thick interlayer.
- Defect-driven transport mechanism: morphology shows pinholes or porous regions; chemistry shows corrosion products or oxidation concentrated along those pathways.
- Stress and cohesion mechanism: morphology shows cracking networks or spallation; chemistry may show compositional drift that increases internal stress or reduces cohesive strength.
Mind Map: Morphology and Chemical State Workflow
Example: Delamination with an Interface Clue
A coating peels in irregular patches after moderate thermal cycling. Morphology shows a rough, discontinuous interface with small voids near the detachment front. Chemical state analysis finds an oxygen-rich interlayer thicker than expected and reduced signals from the intended bonding chemistry at the same locations. The combined interpretation is straightforward: the plasma pretreatment likely left an oxide or contamination layer that prevented strong interfacial bonding, and thermal cycling then exploited the weak interface.
Example: Pinholes Leading to Chemical Change
A wear test produces localized corrosion spots that match pinhole clusters. Morphology confirms crater-like defects and a porous near-surface structure. Chemical state analysis shows oxidation products concentrated around those sites, while regions away from pinholes show a more stable chemical state. The mechanism is defect-driven transport: pinholes provide access for reactive species, and the chemistry changes where the morphology makes transport easiest.
Step 5: Sanity Checks That Prevent Misdiagnosis
Before concluding, verify that the chemistry and morphology agree spatially. If chemical changes appear where morphology shows no defects, re-check sampling location and consider that the failure may start subsurface. Also confirm that the same failure mode appears across multiple regions of the component; one lucky field of view is not a diagnosis.
Step 6: Turn Findings into Actionable Process Adjustments
Use the mechanism to guide what to change next. Weak interface findings point to pretreatment and interlayer control. Defect-driven transport points to densification and early-stage growth conditions. Stress and cohesion findings point to microstructure control via ion energy and deposition parameters. The best diagnoses end with a clear “because,” not just a list of measurements.
10. Application Workflows for Plasma Coated Components
10.1 Preparing and Coating Tooling Components for Wear Reduction
Tooling parts take a beating: sliding contact, abrasive particles, thermal cycling, and repeated cleaning. Wear reduction starts before any coating is applied, because the coating can only perform as well as the surface it bonds to and the geometry it must cover.
Foundational Goal and Wear Path
Wear on tooling usually follows one or more paths: abrasive wear from hard debris, adhesive wear from metal-to-metal contact, and fatigue wear from cyclic loading. A practical preparation plan maps the dominant path to a surface strategy. For example, if wear is mostly abrasive, you prioritize a hard, dense top layer and a strong interface; if adhesive wear dominates, you prioritize low-shear surface chemistry and good cleanliness to avoid transfer films.
Step 1: Surface Inspection and Measurement
Start with a baseline so you can tell whether improvements are real. Measure roughness (Ra or Rz), check for visible contamination, and record dimensions that matter for fit and clearance. If the tooling has existing coatings, determine whether they are intact or already failing; failing layers often hide undercuts that will become delamination starters.
Easy example: a forming die shows galling at edges. You measure roughness at the galling zone and compare it to a non-galled zone. If roughness is higher where galling occurs, you treat both the surface and the coating plan.
Step 2: Cleaning to Remove What the Coating Cannot Fix
Plasma coatings and thin films rely on intimate contact. Oils, machining residues, and oxide films block adhesion and can create weak interlayers.
A systematic cleaning sequence often looks like this:
- Degrease to remove oils and greases.
- Rinse and dry to avoid residue.
- Mechanical cleaning for loose scale.
- Final plasma or chemical activation to remove remaining thin films.
Easy example: after degreasing, you wipe with a clean solvent-soaked swab. If the swab shows discoloration, you repeat cleaning before proceeding. This simple check prevents “mystery adhesion” problems.
Step 3: Surface Activation and Interfacial Engineering
For wear reduction, the interface must resist both chemical attack and mechanical shear. Plasma activation can improve wettability and promote bonding by removing weak boundary layers and creating reactive surface sites.
Best practice: tailor activation to the substrate. Metals often benefit from oxygen-containing activation to remove residual organics and thin oxides, followed by a controlled transition to deposition conditions. Polymers and some alloys may require gentler activation to avoid excessive surface oxidation.
Easy example: on a steel die, you run a short oxygen-argon activation, then immediately proceed to deposition without long air exposure. The goal is to keep the surface chemistry stable.
Step 4: Geometry-Aware Masking and Edge Control
Tooling wear is often concentrated at edges, corners, and radii. Coating thickness gradients at these features can cause early failure.
Use masking and fixturing to control where the film grows. Plan for shadowing and line-of-sight effects by rotating or using shields where appropriate. If the tooling must maintain tight tolerances, mask critical lands and then verify dimensions after coating.
Easy example: a punch has a sharp edge that must remain within a tight radius spec. You mask the edge land, coat the working face, and then measure the radius to confirm the coating did not thicken the edge beyond the allowable limit.
Step 5: Deposition Parameter Selection for Dense, Wear-Resistant Films
Wear-resistant tooling coatings typically need a dense microstructure with controlled stress. Ion energy and substrate temperature strongly influence densification and adhesion.
Best practice: choose parameters that balance densification and stress. Too little energy can leave porous columns; too much can increase compressive stress and promote cracking.
Easy example: you compare two runs that differ in substrate bias. The higher-bias run yields lower porosity in cross-section, but if scratch tests show earlier cohesive failure, you reduce bias or adjust temperature to manage stress.
Step 6: Post-Deposition Conditioning and Handling
After deposition, avoid careless handling. Touching coated surfaces can introduce oils that reduce performance. If the process includes a thermal step, keep it consistent with the film’s stress state.
Easy example: you store coated tooling in clean, sealed containers and handle with gloves. You also label batches with the exact recipe so troubleshooting can trace back to a specific parameter set.
Mind Map: Tooling Preparation to Wear Reduction
Example Workflow for a Steel Forming Die
- Inspect the die and mark the wear zones.
- Measure roughness at wear and non-wear areas.
- Degrease, rinse, dry, and mechanically remove loose scale.
- Plasma activate the surface, then transfer directly to deposition.
- Mask the die lands that must meet tolerance.
- Deposit a dense wear-resistant film using a bias and temperature set that yields low porosity without cracking.
- Verify thickness and edge geometry, then run a scratch test on coated coupons from the same batch.
This workflow is intentionally boring in the best way: it reduces variables, keeps the interface clean, and ties every coating decision to a measurable outcome.
10.2 Coating Optical and Photonic Surfaces for Reflectance and Durability
Optical and photonic surfaces live a double life: they must look good to light and survive contact with the real world. “Good” usually means controlled reflectance, low scatter, and stable optical constants. “Survive” usually means resistance to abrasion, moisture, and chemical attack, plus adhesion that does not fail when the part flexes or cycles temperature.
Mind Map: Optical and Photonic Coating Goals and Constraints
Foundational Choices That Set the Optical Baseline
Start with the optical target before picking materials. A simple example: an anti-reflective (AR) coating for a glass window at 550 nm often uses a quarter-wave stack where thickness is tied to refractive index. If your refractive index drifts by 2%, the peak performance shifts and reflectance rises. That is why thickness control and refractive index stability matter as much as the design itself.
Next, decide whether you need a single layer or a multilayer interference stack. Single layers are easier to deposit uniformly, but multilayers can flatten reflectance across a band. In both cases, surface roughness sets the scatter floor. A practical rule of thumb: if the substrate has polishing scratches that are comparable to the wavelength scale, the coating can’t “average them away.” Plasma surface preparation should therefore focus on removing residues and smoothing the effective surface without introducing new texture.
Surface Preparation That Protects Both Optics and Adhesion
A common workflow for optical substrates is: (1) remove organics, (2) activate the surface, (3) avoid recontamination before deposition. For example, a polymer window may need oxygen plasma activation to improve wetting, but too aggressive treatment can roughen the surface. For glass, a mild plasma can help remove adsorbed films and improve bonding, while keeping the surface chemistry consistent.
A useful practice is to define acceptance criteria for roughness and surface cleanliness before coating. Measure baseline haze or scatter on a few representative parts, then treat only within a narrow plasma recipe window. If the scatter increases after activation, reduce power or shorten exposure rather than compensating later with thicker films.
Deposition Architecture for Reflectance Control
Interference stacks require tight control of thickness and refractive index. During deposition, ion assistance can densify films and reduce voids, which helps durability and lowers scatter. The tradeoff is that higher ion energy can increase stress or cause intermixing at interfaces. A systematic approach is to tune ion energy using a small set of coupons: keep the optical design fixed, vary bias or ion energy, and pick the condition that yields both the target spectrum and acceptable stress.
For durability, add a protective cap or design a multilayer where the outermost layer is chemically robust. Consider a photonic sensor window exposed to humidity: a thin, dense oxide cap can slow water ingress, while the underlying interference layers maintain the optical function. The cap should be thin enough not to disturb the optical design, so you treat it as part of the optical stack rather than an afterthought.
Durability Mechanisms and How Coatings Address Them
Abrasion resistance is often limited by the outermost layer’s hardness and toughness. A practical example is a scratch-prone cover glass: a harder top layer reduces groove formation, but if adhesion is weak, scratches become delamination events. That is why interlayers matter. An adhesion-promoting interlayer can reduce the risk of film lift-off when the surface experiences micro-strain.
Moisture and chemical attack typically start at defects such as pinholes or column boundaries. Dense deposition and controlled stoichiometry reduce these pathways. If you see optical performance drifting after environmental exposure, check whether the refractive index changed due to water uptake or whether the film partially cracked.
Verification: Measuring What Actually Matters
Optical verification should include both spectrum and uniformity. Measure reflectance at multiple angles if the application is angle-sensitive. Thickness and refractive index can be monitored during the run, but confirm after deposition using ellipsometry or similar methods.
Durability verification should be tied to the failure mode you expect. For abrasion, use a controlled scratch or wear test and inspect for edge lift and haze increase. For moisture, use a humidity exposure that matches the product reality and then re-measure reflectance and scatter. If reflectance changes but haze stays low, the issue may be refractive index shift rather than surface damage.
Integrated Example Workflow for an AR Window
- Define the optical target: AR at 550 nm with low reflectance across a specified bandwidth.
- Prepare the substrate: remove residues with a mild plasma activation; verify baseline scatter before coating.
- Deposit the stack: use a quarter-wave design, control thickness tightly, and apply ion assistance at a level that densifies without excessive stress.
- Add a protective cap: include it in the optical design so it does not spoil the interference condition.
- Verify: measure reflectance spectrum and uniformity; then run a short abrasion and humidity check.
- Iterate with evidence: if performance drops after humidity, adjust cap density or stoichiometry; if it fails mechanically, revisit adhesion and stress control.
Practical Mindset for Systematic Optimization
Treat optical and durability as coupled constraints. If you only optimize reflectance, you may end up with a film that looks perfect on day one and degrades quickly. If you only optimize hardness, you may increase stress and create microcracks that raise scatter. The best recipes are the ones that satisfy both sets of measurements at the same time, using small, controlled experiments to change one major variable at a time.
10.3 Engineering Protective Coatings for Harsh Environments and Fluids
Protective coatings for harsh environments have one job: keep the underlying material from reacting with the surrounding world. In practice, that means controlling three pathways at once—chemical attack, physical wear, and transport of species through the coating. Plasma surface processing helps because it can improve adhesion, densify films, and tailor interlayers so the coating behaves like a system rather than a single layer.
Core Design Logic for Harsh Service
Start with the failure mode, not the coating material. If the environment is wet and chemically active, corrosion and underfilm attack dominate. If the environment is abrasive, coating thickness and microstructure dominate. If both happen, you need a layered strategy: a barrier to slow transport, a mechanically robust layer to resist damage, and an interface that prevents delamination.
A simple way to reason about performance is to treat the coating as a stack of resistances. Chemical species must diffuse through the film, reach defects, and then react at the interface. Plasma processing affects each resistance: surface activation improves bonding, ion-assisted growth can reduce porosity, and interlayers can block fast diffusion along grain boundaries.
Plasma Surface Preparation for Coating Survival
Before deposition, remove contaminants and tune the surface chemistry. For metals, oxygen-argon plasma can reduce weak boundary layers and promote oxide formation that bonds well with many inorganic coatings. For polymers, a short plasma activation step increases surface energy so the subsequent film wets and anchors.
A practical workflow is: (1) clean to remove oils and particulates, (2) activate with a chemistry matched to the coating, and (3) minimize air exposure between activation and deposition. If you must pause, keep the time short because many activated surfaces relax back toward their lower-energy state.
Barrier Layer Engineering for Fluids
Barrier performance depends on density, defect population, and microstructure. Ion-assisted deposition can densify films by increasing surface mobility and promoting re-sputtering of loosely bound material. The result is fewer pathways for water and ions.
For fluid exposure, pay attention to pinholes and columnar growth. Columnar microstructures can look fine in cross-section but still provide fast diffusion channels. Adjusting ion energy and deposition conditions can shift growth toward more compact morphologies.
Example: A coating intended for saltwater contact often fails first at edges and scratches. If the barrier layer is too porous, saltwater reaches the interface quickly. Improving densification and adding a thin, well-bonded interlayer can slow underfilm corrosion even when the outer surface gets damaged.
Mechanical Robustness Under Wear and Flow
Harsh fluids rarely arrive politely. Flow can cause erosion, and suspended particles can abrade the surface. To resist this, choose a coating microstructure that tolerates impact and shear.
Hard coatings such as nitrides and carbides can resist abrasion, but they can be brittle if stress is unmanaged. Plasma-based control of ion energy and deposition rate helps balance hardness with adhesion. Multilayers can reduce crack propagation by interrupting stress gradients.
Example: In a pump seal environment, a single thick brittle layer may crack under thermal cycling and then expose the substrate. A graded or multilayer approach distributes stress and keeps cracks from running straight through to the interface.
Interface Engineering and Adhesion Promoters
Most coating failures start at the interface. Plasma functionalization can create chemical bonding sites, while interlayers can act as stress buffers and diffusion barriers.
A common integrated approach is: activate the substrate, deposit a thin adhesion-promoting interlayer, then deposit the main barrier or wear layer. The interlayer should be thin enough not to add significant transport resistance, but engineered enough to prevent delamination.
Example: On stainless steel, direct deposition of a hard film can lead to weak bonding if the native oxide is inconsistent. A controlled plasma activation step followed by an interlayer deposition can stabilize the interface chemistry and improve scratch adhesion.
Process Parameters That Matter in Harsh Service
Focus on parameters that change density, stress, and defect density.
- Substrate bias: higher bias often increases densification but can raise residual stress.
- Gas chemistry: reactive gases can change film stoichiometry and defect chemistry.
- Deposition rate: too fast can trap voids; too slow can increase thermal stress.
- Thickness planning: thicker is not always better if stress and cracking dominate.
Use small, structured trials where you vary one parameter at a time and measure adhesion and barrier indicators, not just thickness.
Mind Map: Protective Coatings for Harsh Environments and Fluids
Integrated Example Workflow for a Wet Wear Application
- Identify the dominant failure: wet corrosion plus particle abrasion.
- Prepare the substrate with cleaning and a short activation step matched to the intended coating chemistry.
- Deposit a thin interlayer to stabilize bonding and reduce fast diffusion.
- Deposit a dense barrier layer with ion-assisted conditions to minimize pinholes.
- Add a harder wear layer or multilayer to resist abrasion while managing stress.
- Validate with adhesion testing and wet exposure checks that include edges and scratch sites.
This approach keeps the coating from being judged only by its average thickness. In harsh environments, the details that matter are the interface quality, defect population, and how the stack responds when the surface gets damaged.
10.4 Coating Electrical Components for Insulation and Reliability
Electrical components fail in predictable ways: insulation breaks down, surfaces track along contaminants, and coatings crack or delaminate under thermal and mechanical stress. Plasma-based surface processing helps because it can clean, activate, and deposit films with controlled chemistry and adhesion. The goal is not just “more insulation,” but stable electrical performance over time.
Foundations of Electrical Insulation Coating
Start with what must be true at the interface. A coating that looks uniform can still fail if the surface energy mismatch prevents wetting during deposition, if micro-voids form at the substrate/coating boundary, or if contaminants remain trapped. A practical baseline is a three-layer thinking model: (1) substrate surface condition, (2) coating microstructure, and (3) electrical field distribution.
A simple example: coating a connector pin. If the surface still has machining oil, the first few microns can become porous. Under voltage, moisture and ions migrate into those pores, accelerating breakdown. Plasma cleaning and activation before deposition reduces that risk by removing organics and improving interfacial bonding.
Selecting Coating Targets and Electrical Metrics
Define the performance targets before choosing materials. Common metrics include dielectric strength, surface resistivity, volume resistivity, dielectric constant, and tracking resistance under humidity. For insulation, surface behavior often matters as much as bulk properties because contaminants and water create conductive paths.
Example: for a humid environment, a coating with high bulk resistivity but poor surface chemistry can still track along the surface. In that case, you prioritize low water uptake and stable surface energy, not only high dielectric strength.
Surface Preparation for Adhesion and Low-Defect Growth
Plasma preparation should be treated like a recipe with checkpoints. First, remove organics and native oxides that interfere with bonding. Second, activate the surface so the initial film nucleates densely rather than islanding.
Example workflow for a polymer housing: use a mild oxygen-containing plasma to remove residues and increase surface energy, then proceed quickly to deposition to limit recontamination. If you wait too long, the surface can re-adsorb contaminants, undoing the activation.
Deposition Strategy for Dense, Reliable Dielectrics
Electrical reliability depends on film density and defect control. Dense films reduce pathways for charge transport and moisture ingress. Deposition parameters that influence density include ion energy at the surface, substrate temperature, and gas chemistry.
A practical rule: if you see pinholes or columnar growth, you usually have a density problem. For many dielectric stacks, increasing ion assistance and optimizing pressure can shift growth toward a more compact microstructure.
Example: coating a ceramic insulator with a thin dielectric layer. If the film is too thin or too porous, the electric field concentrates at defects. A slightly thicker film with improved densification can outperform a thinner film with better-looking uniformity.
Managing Interfaces and Thermal Stress
Even a perfect dielectric can fail if it cracks or delaminates. Thermal cycling changes dimensions, and coatings respond differently than substrates. To reduce stress, use multilayers, graded compositions, or buffer interlayers.
Example: coating a metal component. Metals expand more than many ceramics and polymers. A thin adhesion-promoting interlayer can reduce delamination risk, while a thicker dielectric layer provides insulation. The interlayer should be electrically compatible so it does not become a leakage path.
Field Distribution and Geometry Effects
Coating electrical components is not only about material properties; geometry shapes the electric field. Edges, corners, and sharp transitions concentrate fields. A coating that is electrically strong in the middle of a flat surface can fail at the edge.
Example: insulating a cable termination. If the coating thickness is uniform on the flat portion but thin at the crimp edge, breakdown often starts there. Masking and controlled deposition angles help maintain thickness where the field is strongest.
Quality Assurance and Failure-Mode Checks
Reliability requires verification that matches the failure modes you care about. Use thickness measurement to confirm coverage, then electrical testing to confirm insulation performance. Surface inspection should look for pinholes, scratches, and edge thinning.
Example checks:
- Measure thickness across the part to catch edge loss.
- Inspect for pinholes using microscopy.
- Run dielectric withstand tests at controlled humidity if the application involves wet conditions.
When failures occur, interpret them. If breakdown is localized, suspect defects or edge thinning. If breakdown is widespread after humidity exposure, suspect moisture uptake or surface tracking.
Mind Map: Electrical Coating Workflow
Example: Insulating a Switch Housing
A switch housing needs insulation between a conductive insert and the outer shell. The conductive insert is cleaned and plasma-activated to improve adhesion. A thin adhesion-promoting layer is deposited first, followed by a thicker dielectric layer designed for density.
During deposition, thickness is monitored at the insert edges because that is where the electric field concentrates. After curing and conditioning, the part is tested for dielectric withstand under the expected humidity level. If leakage begins at the edge, the next iteration focuses on edge coverage and densification rather than changing the entire material system.
Example: Coating a PCB Connector Area
For a connector region on a PCB, the coating must resist surface tracking from flux residues and handling oils. Plasma cleaning removes residues and increases surface energy, then deposition proceeds to form a compact dielectric layer. A brief surface inspection step catches scratches that can become initiation sites for tracking.
Electrical testing includes both bulk insulation checks and surface-related measurements. If surface resistivity is low, the process is adjusted to improve surface chemistry stability and reduce micro-porosity, since those factors govern moisture-assisted conduction.
10.5 Practical Assembly Integration Including Masking Edge Effects and Handling
Plasma coatings only earn their keep after assembly. The goal of this section is simple: keep the coated surface protected during handling and masking, prevent edge-related defects, and ensure the coating survives the mechanical realities of mounting, sealing, and cleaning.
Start with the Assembly Map and Failure Modes
Before choosing a masking approach, write down where the coating will be stressed. Typical stress points are edges, clamp zones, sliding interfaces, and areas that see cleaning chemicals.
A practical workflow:
- Mark the coated area on the part drawing with three zones: coated functional zone, transition zone near edges, and uncoated mechanical zone.
- Identify assembly actions: insertion, press-fit, screw torque, alignment, gasket compression, and any post-coating cleaning.
- Predict failure modes: edge chipping, coating thinning at mask boundaries, delamination from trapped debris, and contamination from handling gloves.
Example: A coated bearing race is functional on the inner track, but the outer rim is clamped. If you mask only the outer rim, overspray or redeposition at the boundary can create a weak transition band that later spalls under load.
Masking Strategy That Matches the Plasma Geometry
Masking is not just “cover it.” Plasma processes create line-of-sight effects, lateral transport, and local charging. The mask must block the coating flux while also managing heat and debris.
Key best practices:
- Use masks that tolerate vacuum bake and do not outgas. Even a “clean” mask can release organics that later show up as adhesion issues.
- Keep a controlled gap between mask and part when possible. A tight contact can trap particles and create a shadowed pocket that becomes a defect reservoir.
- Design the mask edge to avoid sharp corners. Sharp edges concentrate electric fields and can worsen local deposition or etching near the boundary.
Easy example: For a flat coupon with a coated center, place a stepped mask so the mask edge sits slightly above the surface plane. This reduces the chance of a hard contact line that later becomes a crack starter.
Managing Edge Effects at the Coating Boundary
Edge effects show up as a thin “feather” region, micro-roughness changes, or a sudden adhesion drop. The mechanism is usually a mix of flux gradients and local surface charging.
Practical controls:
- Define a transition width in the design. If the functional zone ends at 10 mm from an edge, plan a 1–2 mm transition where performance requirements are relaxed.
- Align the part so the most critical edge faces the lowest flux direction. If your system has a dominant directionality, rotate the part to place the worst boundary where it is least stressed.
- Consider a brief post-mask stabilization step. A short, controlled plasma exposure can reduce loose redeposits at the boundary, but it must be tuned to avoid thinning the functional region.
Example: A coated optical window has a clear aperture surrounded by a frame. If the mask boundary lands exactly at the aperture edge, the feather region can scatter light. Shifting the boundary into the frame by a few millimeters often fixes the issue without changing the coating recipe.
Handling and Assembly Without Recontaminating the Surface
Handling is where good coatings go to lose. Touching, wiping, and even “clean” packaging can add residues.
Best practices that work in real shops:
- Use dedicated gloves and tools for coated parts. If you must use wipes, choose a method that does not shed fibers and only wipe in a direction that does not drag particles across the functional area.
- Avoid metal-to-metal contact on coated faces. Use soft spacers or temporary fixtures that contact only uncoated zones.
- Store parts in a way that prevents rubbing. A simple foam cradle with a geometry that supports the uncoated edges beats a bag that allows movement.
Example: After coating a polymer-metal composite, technicians often “test fit” before final assembly. That single dry fit can leave transfer films on the coated surface, which later causes poor wetting or adhesion in the final bonding step.
Integrated Mind Map for Masking, Edge Control, and Handling
Mind Map: Practical Assembly Integration
Example Assembly Protocol for a Coated Shaft and Seal
A shaft is coated on the sliding surface, while the seal seat must remain clean and dimensionally stable.
Protocol:
- Mask the seal seat with a stepped mask that contacts only the uncoated shoulder, not the seal surface.
- Leave a small controlled gap to avoid trapped debris at the boundary.
- After coating, remove masks in a way that does not scrape the coated edge; use a gentle lift rather than pulling sideways.
- Handle the shaft with tools that contact only the masked/uncoated regions.
- During assembly, install the seal without dragging it across the coated sliding track.
Outcome logic: the stepped mask reduces sharp-edge field effects, the gap reduces trapped particle defects, and the assembly contact rules prevent transfer films that would otherwise interfere with sealing performance.
Quick Checklist for Production Readiness
- Mask material is vacuum compatible and low outgassing.
- Mask geometry includes a transition zone and avoids sharp boundary corners.
- Part orientation places the most critical edge in the lowest-stress location.
- Handling tools contact only uncoated zones.
- Storage prevents rubbing and particle transfer.
- A small assembly trial confirms edge integrity and functional performance.
11. Troubleshooting and Process Optimization Using Root Cause Methods
11.1 Diagnosing Delamination Through Surface Energy and Interfacial Chemistry
Delamination usually starts as an interface problem, not a bulk-coating problem. The interface can fail because the coating does not wet the substrate well, because chemical bonds are weak or absent, or because the interface changes during processing and cooling. A practical diagnosis ties together two threads: surface energy behavior and interfacial chemistry.
Core Concepts That Control Adhesion
Surface energy sets the baseline for wetting and contact formation. If a liquid-like precursor or sputtered/condensed species cannot spread, the real contact area stays small, and the interface relies on weak physical attraction.
Interfacial chemistry determines whether contact becomes bonding. Oxygen-rich surfaces, hydroxyl groups, and metal oxides can form stronger bonds with many oxide, nitride, and carbide films. Conversely, hydrocarbon contamination, thick native oxides that do not react, or an intentionally inert interlayer can reduce bond density.
A useful mental model is: surface energy controls how much interface forms; interfacial chemistry controls how strong that interface is.
Mind Map: What to Measure and Why
Step 1: Read the Surface Energy Story
Start with a simple comparison: substrate before processing, after plasma activation, and after any pre-deposition steps. Measure contact angles on each state. If plasma activation improves wetting, you should see lower contact angles and higher calculated surface energy.
Example: A stainless-steel coupon is cleaned, then plasma-treated with oxygen/argon. After treatment, water contact angle drops from 75° to 25°. A subsequent coating still delaminates. That outcome tells you wetting improved, so the failure likely involves chemistry at the interface rather than purely poor contact.
If contact angles do not improve, treat it as a contamination or activation problem. Example: A polymer substrate shows water contact angle staying near 90° after treatment. Delamination then often follows because the interface forms with minimal real contact area.
Step 2: Read the Interfacial Chemistry Story
Use XPS to check whether the plasma actually changed the chemical state in a way that supports bonding.
Look for three common patterns:
-
Carbon contamination persists. A high C 1s signal with strong hydrocarbon components suggests incomplete cleaning or recontamination during transfer. Even if surface energy looks acceptable, the interface can be weak because bonding sites are blocked.
-
Oxygen state changes but bonding is not formed. You may see increased O 1s intensity after activation, yet the coating interface shows no corresponding reactive species. This can happen when the film chemistry does not react with the available functional groups, or when the activation produces a surface oxide that is too stable to bond effectively.
-
Interface chemistry evolves after exposure. If delamination appears after humidity or thermal cycling, the interface may be chemically unstable. For instance, an interfacial layer that is initially thin and bonding-friendly can later hydrolyze or oxidize, reducing bond strength.
Example: A ceramic-coated metal shows good initial adhesion, but after 48 hours in humid air, the interface fails. XPS on aged samples often reveals increased hydroxyl-related oxygen features at the interface region, consistent with bond weakening.
Step 3: Map Evidence to Failure Modes
Combine the two threads:
- Low wetting plus high hydrocarbon carbon: interface contact is limited; delamination often initiates early.
- Improved wetting but weak or absent reactive chemistry: interface forms but bonds are sparse; delamination may require stress or cycling to propagate.
- Strong initial bonding but chemistry changes with aging: delamination is delayed and correlates with exposure conditions.
Step 4: Confirm with Targeted Fixes
Choose one variable at a time.
Example protocol:
- If carbon contamination is high, tighten the transfer process and add a short plasma activation immediately before deposition.
- If oxygen state changes but bonding is weak, adjust plasma gas chemistry to create functional groups that match the film chemistry. For instance, oxygen-rich activation may help oxide-forming films, while nitrogen-containing activation can support nitrides.
- If aging drives failure, introduce a thin interlayer that is chemically stable under the same exposure conditions, then re-check adhesion and interface spectra.
A good confirmation is not just “adhesion improved,” but “the measurements moved in the expected direction”: contact angles improve when wetting is the limiting factor, and XPS shows reduced blocking contamination or the presence of bonding-relevant states when chemistry is the limiting factor.
11.2 Addressing Nonuniform Thickness From Flow Pumping and Geometry Effects
Nonuniform thickness usually shows up as a thickness gradient, edge thickening, or patchy “hot spots.” The root cause is often a mismatch between how gas flows through the chamber and how the plasma and surface reactions respond to local conditions. Flow pumping and geometry effects are the two most common culprits because they directly shape local pressure, residence time, and species transport.
Start with What Nonuniformity Looks Like
Before changing hardware, map the thickness across the substrate. Use a grid measurement (for example, 9 points on a 100 mm wafer: 3×3). Record thickness and, if possible, film composition at the same points. A smooth gradient often points to flow-driven transport; sharp edge effects often point to local pumping speed, shadowing, or sheath behavior near the perimeter.
A simple diagnostic: run the same recipe with the substrate rotated 180° (or flipped if your handling allows). If the pattern rotates with the substrate, the cause is surface-facing transport or local deposition conditions. If the pattern stays fixed relative to the chamber, the cause is chamber-side flow and pumping.
Flow Pumping Mechanisms That Create Gradients
Flow pumping refers to how gas is removed by pumping and how that removal competes with gas inflow and diffusion. Even when you set the same mass flow rate, the local gas residence time varies across the chamber.
Key mechanisms:
- Pressure nonuniformity: Higher pumping near an exhaust port lowers local pressure, reducing reactive species density.
- Concentration boundary layers: Near surfaces, gas velocity drops, and diffusion dominates. If the plasma creates reactive species that must diffuse to the surface, the local supply rate changes with position.
- Gas “sweeping” direction: Inlets and exhaust create a preferred flow path. Species carried by that path deposit more where the flux is higher.
Easy example: Suppose you deposit a film using a reactive gas mixture. If the exhaust is closer to one side of the substrate, that side sees lower partial pressure of the reactive component. The film becomes thinner there, even if the plasma power is uniform.
Geometry Effects That Amplify Transport Differences
Geometry affects deposition through three linked pathways: flow path, electric fields, and line-of-sight transport.
- Inlet and exhaust placement: Off-center inlets create a skewed concentration field.
- Showerhead or ring distribution: Nonuniform or clogged distribution holes create local flow imbalance.
- Substrate holder shape and spacing: A small change in gap between substrate and showerhead can shift the local velocity field.
- Edge shadowing and local sheath: Near edges, the sheath can change, altering ion-assisted deposition and resputtering.
Easy example: If the substrate is closer to the showerhead on one side due to holder tilt, the local gas velocity and reactive species flux increase there. The result is a thicker region that tracks the tilt, not the plasma power.
A Systematic Fix Plan That Doesn’t Guess
Use a structured approach: isolate the variable, apply a targeted change, then re-measure.
- Confirm uniform plasma conditions: Verify power stability, matching network tuning, and stable pressure during the run. If plasma diagnostics show drift, fix that first.
- Check gas distribution hardware: Inspect showerhead/ring holes for blockage and verify that the distribution plate is level.
- Validate substrate placement: Confirm substrate centering, holder flatness, and consistent spacing.
- Adjust flow-to-pumping balance: Change total pressure slightly and observe whether the gradient magnitude scales. If it does, transport/residence time is likely dominant.
- Re-route flow distribution: If the gradient direction matches inlet-to-exhaust flow, reposition inlets, add a flow baffle, or use a more symmetric distribution plate.
- Use localized shielding only if needed: Edge thickening can sometimes be reduced with simple mechanical masks that block line-of-sight species.
A practical rule: change one “geometry lever” at a time (spacing, centering, or distribution symmetry). Otherwise, you’ll fix one problem and accidentally create another.
Mind Map of Root Causes and Actions
Mind Map: Nonuniform Thickness from Flow Pumping and Geometry Effects
Example Workflow with Measurable Decisions
Example scenario: A 150 mm deposition shows thicker film near the exhaust side.
- Step 1: Map thickness at 16 points. The gradient increases smoothly toward the exhaust.
- Step 2: Rotate the substrate 180°. The thick region stays near the exhaust, confirming chamber-side transport.
- Step 3: Inspect showerhead holes and verify distribution plate level. No obvious blockage, but the plate is slightly tilted.
- Step 4: Correct holder tilt and repeat. The gradient reduces but does not vanish.
- Step 5: Adjust total pressure upward by a small amount while keeping power constant. The gradient magnitude decreases further, consistent with improved species availability across the substrate.
- Step 6: Add a simple flow baffle to reduce direct sweeping from inlet to exhaust. Repeat measurement shows a flatter profile.
The key is that each step is tied to an observation: pattern orientation, gradient scaling with pressure, and the effect of flow direction control. That’s how you turn “nonuniform” into a controlled, repeatable outcome.
11.3 Managing Cracking Peeling and Stress Related Failures
Cracking, peeling, and other stress-driven failures usually share a root cause: the film and the substrate disagree about how to expand, densify, or bond. The practical goal is to identify which “disagreement” dominates, then adjust the process so the film can accommodate it.
Start with Failure Signatures
Begin by sorting the failure by where it starts and what it looks like.
- Cracking often appears as fine surface lines, then widens into networks. It is commonly linked to tensile stress, rapid densification, or thermal mismatch.
- Peeling or delamination typically begins at edges, scratches, or contamination sites and propagates along the interface. It is commonly linked to weak interfacial bonding, poor surface activation, or trapped stress at the interface.
- Spallation can look like chunks lifting off after a threshold load or thermal cycle. It often combines high stress with low fracture toughness.
A simple check: if cracks are present but the film stays attached, you likely have a stress-within-film problem. If the interface fails first, focus on adhesion and interfacial chemistry.
Map Stress Sources to Mechanisms
Stress in thin films is rarely one thing. Treat it as a sum of contributors.
- Intrinsic stress from growth: Ion bombardment, surface mobility, and densification can lock in tensile or compressive stress.
- Thermal mismatch: Different thermal expansion coefficients create stress during heating and cooling.
- Compositional gradients: Variations in stoichiometry across thickness or time can change lattice parameters and bonding.
- Defects and porosity: Voids and grain boundary structures can either relax stress or concentrate it, depending on the microstructure.
- Interfacial weakness: If the interface has poor chemical bonding or residual contamination, stress concentrates at the weakest plane.
A useful mental model: cracks relieve stress in the film, while peeling relieves stress at the interface. If you see both, you likely have stress plus insufficient interfacial strength.
Control Ion Energy and Growth Conditions
Ion energy strongly influences densification and microstructure. Too much energy can create a dense, stressed film; too little can leave a porous, weak film.
- Easy example: If a coating shows early cracking after deposition, reduce substrate bias or shorten the high-bias portion of the run. Then compare crack density at the same thickness.
- Easy example: If peeling occurs without many surface cracks, keep bias moderate but improve surface activation and interlayer bonding rather than only lowering energy.
Also watch deposition rate. A faster rate can reduce surface relaxation time, increasing stress. Slowing the deposition while keeping chemistry constant often yields a more accommodating microstructure.
Manage Thickness and Stress Evolution
Stress often changes with thickness. Some films are stable early, then crack after a critical thickness.
- Easy example: For a film that cracks at 1–2 µm, try a graded approach: deposit a thin “bonding” layer first, then grow the main layer. The early layer can be engineered for better adhesion and lower stress.
- Easy example: If cracks appear after post-deposition bake, deposit slightly thinner and adjust the bake temperature or ramp rate.
Ramping matters. A slow temperature ramp reduces thermal shock and lowers the peak mismatch stress.
Strengthen the Interface Without Overdoing It
Peeling is often an interface story.
-
Surface activation: Use a consistent cleaning and activation step so the film bonds to a chemically prepared surface.
-
Interlayers: A thin interlayer can bridge bonding differences between substrate and film. Keep it thin enough to avoid becoming a new weak plane.
-
Avoid contamination: Even small residues can block bonding and turn stress into a delamination front.
-
Easy example: If delamination starts at edges, inspect handling and masking practices. Edge regions often see more contamination and less uniform activation.
Use Microstructure as a Stress Tool
Microstructure controls how stress is stored and relieved.
-
Grain size and columnar growth: Columnar structures can reduce some stresses but may create easy crack paths.
-
Porosity: Moderate porosity can relax stress, but excessive porosity reduces cohesion and adhesion.
-
Multilayers: Alternating layers with different stress states can distribute strain and hinder crack propagation.
-
Easy example: If you see crack networks that follow column boundaries, switch to a denser growth condition or introduce a multilayer sequence that interrupts crack continuity.
Mind Map of Stress-Driven Failure Management
Mind Map: Cracking, Peeling, and Stress Failures
A Systematic Troubleshooting Workflow
- Document the failure: note whether cracks appear before peeling, and where delamination initiates.
- Hold thickness constant: compare samples at the same thickness to separate growth stress from thickness evolution.
- Vary one lever at a time: adjust bias or deposition rate first; then adjust surface activation and interlayers.
- Re-check after thermal steps: if failures worsen after bake, thermal mismatch is likely dominant.
- Confirm with microstructure evidence: look for porosity, columnar growth, and interface quality to match the observed failure mode.
- Easy example: If you reduce bias and cracking decreases but peeling remains, you have improved film stress but not interface strength. Next, refine surface activation and add a thin bonding interlayer.
This approach keeps the investigation grounded: identify the failure signature, assign the dominant stress mechanism, then tune the process parameters that directly control that mechanism.
11.4 Correcting Composition Drift From Gas Purity And Reaction Stoichiometry
Composition drift shows up as “the film is not what the recipe says.” In plasma processes, that mismatch often comes from two root causes: gas purity issues (unexpected contaminants) and reaction stoichiometry drift (the intended chemistry is no longer the dominant one). The correction strategy is systematic: confirm what changed, identify which gas or reaction step is responsible, then adjust controls so the same drift cannot reappear.
Foundational Checks Before Changing Anything
Start by separating measurement noise from real composition change. Compare at least two runs that are otherwise similar in power, pressure, substrate bias, and geometry. If thickness also changes, drift may be tied to plasma density or sticking, not only composition. Then verify the “gas-side truth”: cylinder labels, regulator type, and line history.
A practical example: you deposit a TiN-like film using TiCl4 and N2. After a few weeks, XPS shows lower nitrogen content and higher chlorine residues. Thickness is stable, but composition shifts. That pattern points toward either nitrogen availability changes (leaks, mass flow controller drift, or N2 contamination) or altered reaction pathways that leave more Cl-containing species.
Gas Purity Drift and How It Manifests
Gas purity problems rarely present as a single obvious contaminant. More commonly, you see indirect signatures:
- Oxygen contamination increases oxide fraction or shifts binding energies.
- Water vapor increases hydroxyl or oxygen-related residues.
- Hydrocarbon contamination increases carbon incorporation and can reduce adhesion.
- Carrier-gas impurities (for example, Ar with trace O2 or H2O) change surface chemistry even when the target gas is correct.
A simple diagnostic workflow is to run a “no-deposition chemistry check.” Keep plasma on with the same gases but use a witness substrate and short exposure time. If the witness shows unexpected surface chemistry (for example, higher oxygen uptake), the issue is likely gas-side or line-side rather than film growth kinetics.
Reaction Stoichiometry Drift and Why It Happens
Even with perfect purity, stoichiometry can drift because the effective reaction network changes. Common mechanisms include:
- Mass flow controller calibration drift, causing the intended ratio to shift.
- Partial pressure changes due to leaks or pump performance variation.
- Byproduct accumulation in the chamber that alters gas-phase reactions.
- Temperature changes that affect precursor dissociation or surface residence time.
Example: In a reactive sputtering-like plasma coating, you aim for a metal-to-nitrogen ratio that yields a dense nitride. Over time, the chamber walls adsorb and later release reactive species, effectively increasing the reactive fraction. The film becomes more compound-rich and can show higher stress and cracking. The fix is not just “change the gas ratio,” but restore the chamber’s baseline reactivity and stabilize the reactive species balance.
Mind Map: Composition Drift Root Causes and Controls
Correction Actions That Actually Close the Loop
-
Verify and stabilize gas delivery. Calibrate mass flow controllers against a reference method and confirm that the ratio setpoints produce the same delivered flows across the operating range. Then purge the lines with the process gas at a controlled flow for a defined time before deposition.
-
Control line and chamber contamination pathways. If oxygen or water is suspected, focus on seals, regulator diaphragms, and line bake history. A quick sanity check is to compare runs started after a long idle period versus continuous operation; if drift correlates with idle time, adsorption and outgassing are likely.
-
Reset chamber baseline chemistry. For reactive systems, use a conditioning sequence that returns the chamber to a reproducible reactive state. The goal is to reduce wall memory effects so the same gas ratio yields the same effective chemistry.
-
Rebalance stoichiometry using measured composition feedback. Adjust the gas ratio in small steps and measure composition after each step. Keep power and pressure fixed during this tuning so the composition response can be attributed to stoichiometry rather than plasma density.
Example: Nitrogen Content Drop in a Nitride Film
You observe nitrogen content dropping by 8 at.% while film thickness remains nearly constant. You run a witness exposure and find increased oxygen on the surface. Next, you purge the lines and perform a leak check; both pass. You then calibrate the N2 MFC and discover a 3% flow under-delivery at the setpoint. After correcting the MFC and repeating the deposition, nitrogen content returns to the target range and oxygen residues decrease.
Example: Chlorine Residues in a Reactive Precursor Process
Chlorine residues rise and the film becomes less stoichiometric. A short witness run shows persistent Cl-containing surface species even at low exposure time. That points to precursor chemistry imbalance rather than late-stage growth. You reduce the precursor partial pressure slightly and restore the chamber conditioning sequence to limit byproduct accumulation. After rebalancing, XPS shows the expected Cl level and the film properties align with the earlier stable window.
Practical Acceptance Criteria for “Fixed” Drift
A correction is complete when composition returns to the target band and the process remains stable across multiple runs with the same recipe. Track at least one gas-side indicator (delivered flow stability or witness surface chemistry) and one film-side indicator (XPS or compositional analysis). If both stabilize, you have addressed the cause rather than just the symptom.
11.5 Building Controlled Experiments Using DoE for Plasma Parameter Screening
Controlled experiments answer one question at a time: which knobs matter, and how do they move the outcome. In plasma processing, “knobs” include gas flows, pressure, RF power, substrate bias, target-to-substrate distance, and deposition time. The trick is to vary them in a structured way so you can separate cause from coincidence.
Start with a screening goal. For example, you might want to know which parameters most affect adhesion strength and film density for a TiN coating. Screening does not aim for a perfect recipe; it aims to identify the few parameters that deserve deeper optimization.
Step 1: Define Outcomes and Measurement Rules
Pick measurable responses that connect to performance. Typical screening responses include:
- Adhesion proxy: scratch critical load or tape-test pass rate.
- Film density proxy: refractive index from ellipsometry or hardness from nanoindentation.
- Composition proxy: XPS peak ratios or EDS stoichiometry.
- Uniformity proxy: thickness variation across the wafer.
Write measurement rules before running experiments. For instance, define the same substrate cleaning batch, the same measurement spot pattern, and the same dwell time before testing. If you change cleaning each run, your data will blame the wrong parameter.
Step 2: Choose Factors and Ranges
Select factors that are physically plausible and controllable. A practical approach is to list candidate factors, then narrow by feasibility and expected influence.
Example factor set for a reactive plasma coating:
- RF power: 200–400 W
- Chamber pressure: 0.5–2.0 Pa
- Substrate bias: −20 to −80 V
- Reactive gas fraction (e.g., N2/(N2+Ar)): 10–40%
- Target-to-substrate distance: 40–70 mm
Keep ranges tight enough to avoid unstable operation, but wide enough to see trends. If you only test tiny changes, you’ll learn nothing except that the system is stable.
Step 3: Pick a DoE Structure
For screening, use a design that estimates main effects efficiently. Common choices include:
- Fractional factorial designs for many factors with limited runs.
- Plackett–Burman designs for very fast screening.
- Response surface designs only after screening narrows the field.
A good rule: if you have 5 factors, a fractional factorial can often identify the dominant ones within a manageable run count.
Step 4: Randomize and Block to Control Hidden Variables
Plasma systems have time-dependent drift: target condition, chamber wall seasoning, and gas line behavior. Randomization prevents systematic bias from creeping in.
Blocking handles known sources of variation. For example, if you must run experiments over two days, treat “day” as a block. Then compare runs within each day rather than mixing everything blindly.
Step 5: Run Replicates Where It Matters
Replicates estimate experimental noise. You do not need to replicate every condition, but you should replicate at least the center point and a few key corners. If center-point results vary wildly, your process is not ready for confident conclusions.
Step 6: Analyze Main Effects and Interactions
Screening analysis typically starts with main effects: how the average response changes when a factor moves from low to high.
Then check interactions. In plasma, interactions are common because energy and chemistry couple. For instance, increasing bias might densify films only when pressure is low enough to avoid excessive scattering.
Use a simple model first:
- Response = baseline + sum(main effects) + selected two-factor interactions.
If the model fits poorly, revisit measurement consistency and stability logs.
Step 7: Turn Results into a Decision
A screening outcome should produce a short list:
- “Keep” factors: those with clear, consistent effects.
- “De-emphasize” factors: those with negligible impact within the tested range.
- “Investigate” factors: those with strong interactions or inconsistent trends.
Then move to a second-stage design focused on the kept factors.
Mind Map: DoE Workflow for Plasma Parameter Screening
Example: Screening a TiN Coating for Adhesion and Density
Assume you test 5 factors at two levels using a fractional factorial design with 16 runs plus 3 center-point replicates. You measure scratch critical load and refractive index.
After analysis, you find:
- Substrate bias has the largest positive main effect on both scratch critical load and refractive index.
- Pressure shows a negative main effect on density proxy.
- Reactive gas fraction has a strong interaction with pressure: at low pressure, higher reactive fraction improves density; at high pressure, it reduces density.
Your decision list becomes:
- Keep: bias, pressure, reactive fraction.
- De-emphasize: RF power and distance within the tested range.
You then run a confirmation set using the best bias and pressure region, keeping RF power and distance fixed at practical values. The confirmation is not a new discovery; it is a sanity check that the screening conclusions hold under repeatable conditions.
Example: A Minimal Data Sheet That Prevents Confusion
Use one row per run and store both setpoints and measured values.
| Run ID | Block | RF Power set | RF Power meas | Pressure set | Pressure meas | Bias set | Bias meas | Gas flow ratio set | Gas flow ratio meas | Time | Outcome 1 | Outcome 2 |
|---|---|---|---|---|---|---|---|---|---|---|---|---|
| 1 | Day A | 300 | 298 | 1.0 | 1.02 | -50 | -49 | 0.25 | 0.24 | 20 | ||
| 2 | Day A | 200 | 201 | 0.5 | 0.51 | -20 | -21 | 0.10 | 0.11 | 20 |
This structure makes it obvious when a “factor effect” is actually a measurement mismatch.
Example: Common Failure Modes and How DoE Helps
If you see no clear main effects, check whether your factor ranges were too narrow or whether the system drifted between runs. If you see strong effects but poor replicability, your noise is too high—often due to inconsistent substrate prep or unstable gas delivery. DoE cannot fix bad inputs, but it can reveal where the uncertainty is coming from by separating structured variation from uncontrolled variation.
12. Safety Controls and Operational Best Practices for Plasma Processing
12.1 Electrical RF and High Voltage Safety for Plasma Systems
Plasma systems combine RF power, high voltage, and vacuum hardware, so safety is mostly about preventing the three classic bad outcomes: shock, arc, and toxic exposure from damaged components. The good news is that most risks are predictable, and you can manage them with layered controls: engineering design, interlocks, safe operating procedures, and verification.
Foundational Concepts That Drive Safety Decisions
RF plasma power typically feeds an impedance that changes with pressure, gas chemistry, and plasma state. That means the system can produce unexpected voltages at the matching network and at the electrodes if the load is not what the controller expects. High voltage can appear both as intentional bias and as unintended charge buildup on insulating surfaces inside the chamber.
A practical way to think about it: safety controls must assume the system can be “electrically surprised.” Your job is to make sure the surprises either never happen or are caught quickly.
Risk Map from Energy Sources to Failure Modes
- RF source and matching network: risk of shock and RF burns; risk of arcing if tuning is wrong or if water cooling fails.
- Electrodes and bias supplies: risk of high potential relative to ground; risk of arcing due to contamination or pressure excursions.
- Vacuum chamber and feedthroughs: risk of charge accumulation and flashover; risk of leaks that change discharge behavior.
- Interlocks and controls: risk of bypassing or misconfiguration leading to unsafe states.
Mind Map: Electrical and RF Safety Controls
Engineering Controls That Prevent Shock and Arc
Start with grounding and bonding. Every conductive enclosure, rack frame, and chamber support should share a common ground path. A quick example: if a technician measures continuity between the rack ground and the chamber body and finds a high resistance, the system may still “work,” but a fault current can take a weird route through a person’s body.
Next, treat enclosures and barriers as part of the electrical design, not decoration. RF and high voltage should be behind covers that cannot be opened while power is enabled. If you need access for tuning, use a controlled procedure that keeps the system in a safe state until the cover is closed again.
Matching networks and bias supplies often include components that store energy. Even when the generator is turned off, capacitors can hold charge. A safe workflow includes a discharge verification step before touching internal components.
Interlocks and Permissives That Stop Unsafe States
Interlocks should be designed so that failure defaults to “off.” Common permissives include:
- Door and access interlocks: RF enable is blocked unless the chamber door is closed.
- Vacuum and pressure window checks: the controller prevents starting RF when pressure is outside the allowed range.
- Cooling permissives: water flow and temperature must be within limits before RF enable.
- Bias sequencing: bias is enabled only after RF is stable, reducing the chance of uncontrolled arcing.
- Emergency stop: removes power to the RF and bias supplies and leaves the system in a safe, observable state.
Example: if cooling fails, the matching network can overheat and insulation can degrade. A cooling permissive that blocks RF enable prevents that chain reaction.
Operational Practices That Keep You Safe During Real Work
Use a maintenance mindset: lockout tagout for any internal access. Then verify that stored energy is discharged. A simple check is to confirm the bias supply output is at zero and that any discharge indicator circuits show safe status.
During tuning, keep hands away from exposed components and avoid opening covers. If the system requires manual tuning, do it with the smallest safe exposure window and with a second person present if your procedure requires it.
Also manage “state awareness.” Before attempting to restart after a fault, confirm the cause from alarms and logs. Repeatedly restarting without addressing the underlying issue can lead to repeated arcing and progressive damage.
Verification and Testing Without Guesswork
Interlocks should be tested functionally, not just assumed. For example, simulate an open door condition and confirm RF enable is blocked. Similarly, test that emergency stop removes RF and bias and that the system cannot resume without a deliberate reset.
Ground continuity should be checked on a schedule, especially after maintenance that involves moving cables or replacing feedthroughs.
Finally, review fault events. If the same alarm appears repeatedly, treat it as a safety-relevant symptom, not a nuisance.
Example Procedure: Safe RF Enable Sequence
- Confirm chamber door is closed and interlock status is “permissive.”
- Verify vacuum/pressure is within the allowed start window.
- Confirm cooling flow and temperature are within limits.
- Ensure bias is disabled until RF is stable.
- Enable RF using the controller sequence, then monitor reflected power and alarms.
- If a fault occurs, stop and investigate before restarting.
This sequence works because it aligns the system’s electrical energy with the conditions that keep the load predictable and the enclosure closed.
12.2 Vacuum Safety Including Venting Interlocks and Leak Response
Vacuum systems are simple in principle: remove gas, keep it out, and control what happens when you let it back in. Safety comes from treating “pressure changes” as a process hazard, not just a convenience. The core idea is to prevent unsafe states during venting, and to respond to leaks with controlled diagnostics rather than guesswork.
Foundational Concepts for Safe Venting
Start with what venting actually does. When you raise chamber pressure, you change gas density, mean free path, and electrical conditions near electrodes and insulators. That can shift discharge behavior, stress seals, and drive contaminants into the chamber. A safe venting plan therefore includes: a defined vent path, controlled flow rate, verified interlocks, and a known sequence for powering down.
A practical rule: never vent a chamber that is still capable of sustaining a discharge. Even if the process controller “thinks” it is off, residual power paths or misconfigured interlocks can surprise you. So the vent sequence should explicitly enforce power-down and confirm that plasma-related supplies are disabled before any pressure rise.
Interlocks That Prevent Unsafe States
Interlocks are the system’s way of saying “no” when conditions are wrong. For venting, the most important interlocks are:
- Discharge inhibit: prevents RF/DC power enabling when chamber pressure is above a safe threshold.
- Power-down confirmation: requires a verified “off” state from power supplies and matching status signals.
- Valve authority: ensures only the vent controller can open vent valves, and only in the correct sequence.
- Interlock override control: restricts bypassing to trained operators with a documented procedure.
A simple example workflow for a typical RF plasma chamber:
- Operator requests vent.
- Controller commands plasma power supplies to disable.
- System waits for “disabled confirmed” signals.
- Only then does it open the vent valve to a controlled regulator.
- It monitors pressure rise rate and stops if the rate exceeds a limit.
This prevents the classic failure mode where a valve opens while power is still ramping down.
Venting Hardware and Control Logic
Safe venting depends on the vent path. Common components include a vent valve, a throttle/regulator, a check valve, and a controlled gas source (often dry air, nitrogen, or inert gas depending on process needs). The control logic should include:
- Pressure ramp control: use a regulator or mass flow control to avoid rapid pressure jumps.
- Rate limiting: stop venting if pressure rises too quickly, which can indicate a stuck valve or blocked exhaust.
- Exhaust management: ensure the pump-down and exhaust lines can handle the vent flow without backflow.
Example: If your chamber uses a turbo pump with a foreline, rapid venting can push particulates or condensables toward the pump. A controlled ramp reduces that risk and keeps the foreline from becoming an accidental “storage tank” for contamination.
Leak Response That Stays Systematic
A leak is not just “bad.” It changes how the system behaves during pump-down, base pressure hold, and venting. Leak response should follow a consistent decision tree.
Mind Map: Vacuum Safety Leak Response
Stepwise Leak Handling Example
Suppose base pressure fails to reach target and pressure slowly climbs during a hold. You first confirm plasma is off and that no vent valve is partially open. Next, you isolate the chamber from the pump using a gate valve (if your hardware supports it) and watch whether the pressure rise continues. If the rise stops when isolated, the leak is likely in the chamber/piping upstream of the isolation point. If it continues, the leak may be in the isolated volume itself or in measurement plumbing.
Then you perform localized helium sniffing around flanges, feedthroughs, and valve bodies. If the leak is near a vent line fitting, the system may also show abnormal pressure rise rate during venting; that’s your cue to treat vent hardware as part of the leak investigation, not just the chamber.
Venting After a Leak Finding
Once you suspect a leak, venting still must be controlled. If you vent too quickly, you can pull contaminants inward through the leak path or disturb deposits on internal surfaces. Use the same controlled ramp approach, and avoid opening additional valves that could change flow direction through the suspected leak location.
A good operational habit is to record the vent sequence parameters (vent gas type, ramp rate, valve opening times) alongside leak symptoms. If the next run behaves differently, you’ll know whether the change came from hardware condition or from the vent procedure.
Quick Checklist for Operators
- Confirm plasma power is disabled and interlocks are satisfied.
- Vent only through the controlled vent path with rate limiting.
- Monitor pressure rise rate and stop if it exceeds limits.
- For leaks, isolate sections and use pressure behavior to narrow location.
- Vent safely after containment, using the same controlled ramp logic.
- Document valve states, measured pressures, and sequence timing.
12.3 Chemical Handling for Reactive Gases and Byproducts
Reactive gas handling is where good plasma recipes meet real-world constraints: leaks, residues, and unexpected chemistry. The goal is simple—keep reactive species where they belong, keep people safe, and keep the chamber clean enough that the next run behaves like the last one.
Core Concepts That Drive Safe Handling
Reactive gases can be hazardous by inhalation, skin contact, or fire and corrosion risk. Byproducts add a second layer: even if the gas is controlled, the chamber can accumulate reactive residues that later release fumes during venting or maintenance. A practical mindset is to treat every step—delivery, exposure, pumping, and venting—as a chemical pathway, not just a mechanical one.
A useful starting point is the “three boundaries” model. First is the gas supply boundary, where cylinders, regulators, and lines must prevent leaks and backflow. Second is the chamber boundary, where the process must avoid uncontrolled reactions on surfaces. Third is the exhaust boundary, where pumped gases and reaction products must be captured and neutralized before they reach the room.
Gas Delivery and Containment
Begin with verified compatibility: elastomers, seals, and tubing materials must tolerate the specific gas and its likely byproducts. For example, a line that survives one reactive halogen may still fail after repeated exposure because residues attack seals over time.
Next, control flow direction. Use check valves and proper manifold design so that pressure transients cannot push process gas back toward the supply. Pressure regulation should be stable enough that small fluctuations do not create “bursts” of reactive chemistry at the chamber inlet.
Leak checks should be routine, not occasional. A practical workflow is to pressure-test the gas train to a defined threshold, then perform a functional test by running a short purge and confirming that the exhaust capture system responds as expected.
Exhaust Capture and Neutralization
Plasma systems often rely on a scrubber, catalytic oxidizer, or adsorption bed depending on the chemistry. The key is matching the exhaust treatment to the byproducts you actually generate.
A concrete example: if your process uses a fluorine-containing chemistry, the exhaust may contain acidic fluorinated species. In that case, a scrubber chemistry that neutralizes acids is essential, and the scrubber’s capacity must be tracked so it does not silently saturate. For oxidizing chemistries, the exhaust treatment must also handle the heat and reactivity of the stream.
Operationally, confirm capture performance by monitoring exhaust flow and pressure drop. If the pressure drop rises, the system may be loading up with residues, which increases the chance of breakthrough.
Chamber Residue Management
Residues form on chamber walls, electrodes, and viewports. Their composition depends on gas chemistry, power, and temperature. Even when the process seems stable, residues can change over time and alter subsequent runs.
A systematic approach is to define a cleaning trigger. Instead of cleaning “because it’s been a while,” use measurable indicators such as changes in base pressure recovery time, altered optical emission signatures, or increased pumpdown duration after a run.
Vent strategy matters. Venting can mobilize trapped reactive species. Use controlled venting with appropriate purge gas and ensure the exhaust system is active before opening valves. Think of venting as a chemical release event that must be captured.
Mind Map: Chemical Handling Pathways
Example: A Safe Run Sequence for Reactive Chemistry
- Verify the exhaust treatment is online and within normal operating pressure drop.
- Confirm gas train leak integrity and perform a short purge to remove air from lines.
- Start with a low-flow conditioning step to stabilize inlet chemistry and avoid sudden surface reactions.
- Run the plasma process at the defined recipe while maintaining stable inlet flow and chamber pressure.
- After processing, continue purge while plasma is off so reactive species are driven to the exhaust treatment.
- Vent only after exhaust capture is confirmed active, then proceed with cleaning using the defined trigger criteria.
Example: Diagnosing a Scrubber Loading Issue
If base pressure recovery after a run becomes slower, and exhaust pressure drop increases at the same time, the likely cause is scrubber loading or residue buildup. The response is to stop processing, verify exhaust treatment capacity status, inspect for residue accumulation points, and clean the chamber before resuming. This keeps the system from “teaching” itself new chemistry through unintended reactions.
Waste Handling and Documentation
Contaminated wipes, filters, and spent scrubber media must be treated as hazardous waste consistent with their chemistry. Segregate waste streams by process type so you do not mix incompatible residues. Keep a simple record of gas usage, cleaning cycles, and exhaust treatment capacity checks; it turns troubleshooting from guesswork into a traceable chain of evidence.
12.4 Contamination Control for Clean Runs Including Substrate Handling
Clean runs start with a simple idea: contamination is not a single event, it is a chain. A dust particle, a fingerprint oil film, a trace of water, or a leftover film from a previous recipe can each change surface chemistry, nucleation, adhesion, and ultimately film performance. Contamination control therefore needs both physical discipline and process verification.
Core Contamination Pathways and What They Do
Contaminants typically enter through four routes: (1) substrate handling, (2) chamber and hardware carryover, (3) gas and vapor impurities, and (4) process-generated residues. Handling contaminants often appear as low-surface-energy organics that reduce wetting and adhesion; a thin oil layer can survive many “quick wipes.” Hardware carryover includes polymer residues from seals, dust from worn fixtures, and film remnants from earlier depositions. Gas impurities show up as unexpected stoichiometry shifts or extra phases, especially when reactive gases are used. Process-generated residues include sputtered redeposition, reaction byproducts, and water from imperfect vacuum pumping.
Substrate Handling That Actually Prevents Contamination
Start by defining “clean” by action, not by intention. Use dedicated gloves and tools for each cleanliness level, and avoid touching the deposition side even when wearing gloves—gloves pick up oils from the outside world. Store substrates in sealed containers or bags to limit airborne deposition, and label containers with the last cleaning date; for example, mark “Cleaned 2026-03-11” on the container so you can correlate outcomes with handling time.
A practical workflow:
- Inspect incoming substrates under bright light for visible residues.
- Perform solvent cleaning in a controlled sequence, then dry with filtered gas or vacuum drying.
- Handle only edges with tweezers or wafer holders that are cleaned and dedicated.
- Load into the chamber promptly, minimizing ambient exposure.
- Record lot ID, cleaning method, and load time.
If you see repeatable adhesion loss, check whether the failure correlates with longer air exposure between cleaning and loading. That correlation is often stronger than the cleaning method itself.
Chamber and Hardware Carryover Control
Before a clean run, treat the chamber like it has a memory. Residual films can outgas during pumping and later react with incoming gases. Establish a cleaning cadence based on process type: aggressive reactive chemistries and high-rate deposition usually require more frequent chamber maintenance than inert sputtering.
Use a “last recipe” mindset. If the previous run used a reactive precursor, verify that the chamber has been purged and cleaned sufficiently before switching to a different chemistry. Also inspect and maintain consumables that trap residues, such as showerhead components, insulators, and grounded shields.
A simple acceptance check is to run a short pump-down and monitor base pressure stability. If base pressure rises quickly or fails to stabilize, contamination or outgassing is likely still present.
Gas and Vacuum Hygiene
Gas purity issues often look like “mysterious” composition drift. Control this by using clean, compatible lines and by purging lines before introducing reactive gases. Ensure that vacuum pumps and forelines are maintained so they do not become a contamination source through backstreaming or oil vapor migration.
Water is a frequent culprit. Even when base pressure is acceptable, residual water can react during plasma steps. Bakeouts, proper gasket condition, and leak checks reduce water ingress. During process transitions, allow sufficient purge time so the chamber atmosphere matches the intended recipe.
Mind Map: Contamination Control System
Example: Diagnosing a Sudden Adhesion Drop
A coating run shows lower adhesion after switching to a new substrate batch. The chamber base pressure is unchanged, so the issue likely comes from handling. The batch was cleaned with the same solvent, but the substrates sat in open trays for an extra hour before loading. Repeating the run with sealed storage and edge-only handling restores adhesion. The lesson is practical: adhesion is sensitive to thin organics, and time in ambient air is a controllable variable.
Example: Preventing Cross-Chemistry Carryover
A chamber previously processed a fluorinated chemistry, then moved to an oxide-forming recipe. The first oxide film shows unexpected fluorine traces and altered growth. Adding a purge-and-clean step between recipes, plus a short stabilization pump-down before deposition, removes the fluorine signature and returns film properties to normal. The key is treating recipe transitions as contamination events, not just parameter changes.
12.5 Maintenance Procedures for Electrodes Chambers and Gas Delivery Hardware
Maintenance is where good plasma processes stay good. The goal is simple: keep the discharge stable, keep chemistry consistent, and prevent contamination pathways from quietly building up. The procedures below move from foundational checks to deeper component care, with examples you can apply immediately.
Mind Map: Maintenance Workflow and Failure Prevention
Baseline Planning and What to Track
Start by tying maintenance to observable symptoms rather than calendar anxiety. Keep a short log per run: chamber pressure behavior, ignition time, RF matching stability, and any drift in film properties. For example, if ignition time increases from 2–3 seconds to 10–15 seconds while base pressure stays similar, suspect electrode condition or chamber cleanliness before blaming gas purity.
Define intervals by risk. A practical approach is to do quick inspections every week, functional checks every month, and deeper cleaning on a fixed schedule or after a defined number of reactive runs. Acceptance criteria should be measurable: leak rate thresholds, maximum allowable pressure rise after pump-down, and acceptable changes in flow controller calibration.
Safety and Shutdown That Prevents “Accidental Chemistry”
Before opening anything, power down and ensure RF is discharged. Then follow a controlled venting and purge sequence so residual reactive gases and byproducts don’t meet air in a way that creates sticky residues. A simple example: after a fluorine-containing process, purge with an inert gas until exhaust readings stabilize, then vent slowly to avoid drawing contaminants into seals.
Chamber Care Including Leaks and Pump Health
Chamber maintenance starts with leak checks and ends with pump performance.
-
Leak checks: Use a consistent method and record results. If leak rate worsens after a maintenance event, inspect gasket seating and any disturbed fittings.
-
Pressure rise tests: After pump-down, monitor how quickly pressure rises when valves are closed. A faster rise can indicate virtual leaks, outgassing from a contaminated surface, or a failing pump component.
-
Throttle and valve inspection: Sticking throttles can cause pressure instability that looks like a plasma problem. Clean or service them according to manufacturer guidance and verify smooth control.
Example: If you see oscillation in pressure during deposition, check whether the throttle position correlates with the oscillation. If it does, fix the control hardware before changing gas recipes.
Electrode Care Including Erosion and Redeosition
Electrodes are the “wear parts” of plasma systems. Erosion changes local electric fields and can shift ion energy toward or away from the substrate.
- Visual inspection: Look for pitting, crater formation, and uneven wear rings.
- Surface condition monitoring: If redeposition forms a rough layer, it can alter secondary electron emission and ignition behavior.
- Replacement triggers: Replace when erosion reaches a geometry threshold that affects spacing or when redeposition cannot be removed without damaging the base material.
Example workflow: After every cleaning cycle, measure electrode-to-shield spacing and compare to baseline. If spacing drifted by even a small amount, matching behavior may change, and you’ll want to recalibrate process settings.
Gas Delivery Care Including Purity and Flow Accuracy
Gas delivery hardware is where “the chemistry you think you’re using” meets “the chemistry you actually get.” Maintenance focuses on preventing contamination and ensuring stable flow.
-
Line purging and cleaning: Purge before and after reactive runs using a consistent inert sequence. If you switch gas families, purge longer than you think you need, because dead volumes hold onto earlier chemistry.
-
Regulators and mass flow controllers: Verify calibration periodically. A drift of a few percent can shift film stoichiometry enough to change adhesion.
-
Filters and purifiers: Replace on schedule or when pressure drop increases. A clogged filter can cause flow instability that mimics plasma instability.
Example: If a process that used to produce a dense film now yields porous microstructure while chamber pressure control remains stable, check mass flow controller calibration and filter pressure drop before touching bias or power.
Verification After Maintenance Including Process Reproducibility
After maintenance, verify in layers.
- Leak rate verification: Confirm the chamber meets the same leak criteria as before.
- Plasma ignition repeatability: Run a short ignition test at the same starting conditions and record ignition time and matching stability.
- Outcome checks: Use a simple diagnostic run—such as a thickness or adhesion proxy—to confirm the system behaves like the baseline.
Example: If ignition is stable but film adhesion drops, the issue may be residual contamination from cleaning steps or altered surface chemistry on the electrodes or chamber walls.
Documentation That Makes Troubleshooting Faster
Record what you changed: parts replaced, cleaning method, cleaning duration, and any deviations from standard purge sequences. Version your recipes only when necessary, and note the exact maintenance event that preceded a change in behavior. This turns future troubleshooting from guesswork into a short, logical chain of evidence.
Practical Mind Map: Maintenance Checks by Symptom