Corporate Restructuring and Turnaround Finance Essentials
1. Foundations of Corporate Restructuring and Turnaround Finance
1.1 Defining Restructuring Objectives and Stakeholder Outcomes
A restructuring succeeds when everyone can answer the same basic question: “What must be true for this to be considered fixed?” Objectives should be specific enough to guide trade-offs, yet practical enough to measure during execution. Start with outcomes for stakeholders, then translate those outcomes into operational and financial targets.
Core Outcome Logic
Restructuring objectives typically fall into four buckets:
- Survival with continuity: keep the business operating so customers keep buying and employees keep showing up.
- Creditor value protection: maximize recoveries relative to realistic alternatives.
- Equity reset clarity: determine whether equity is preserved, diluted, or written down based on value.
- Governance and control: establish decision rights so the plan can be implemented without constant renegotiation.
A useful test is whether each objective can be tied to a decision. If an objective cannot influence a decision—pricing, asset sales, headcount, financing terms—it is probably too vague.
Stakeholder Map and What They Actually Care About
Different stakeholders use different “success metrics.” Aligning objectives means writing them in stakeholder language, then converting them into measurable internal targets.
- Employees care about job continuity, timing of changes, and whether leadership can execute. A practical outcome is a defined transition plan with clear roles for the first 90 days.
- Customers care about service reliability and pricing stability. A practical outcome is uninterrupted fulfillment for key contracts and a documented policy for contract amendments.
- Secured lenders care about collateral value, repayment priority, and whether the company can avoid value leakage. A practical outcome is a cash management approach that prevents unauthorized spending.
- Unsecured creditors care about transparency, fair treatment, and the likelihood of receiving something meaningful. A practical outcome is a disclosure package that shows how recoveries are calculated.
- Equity holders care about whether they retain value and what rights they receive post-restructuring. A practical outcome is a clear ownership and governance structure after the plan.
- Regulators and counterparties care about compliance, reporting, and contract performance. A practical outcome is a compliance checklist tied to the restructuring timeline.
Turning Outcomes Into Measurable Objectives
Objectives should be written as target statements with a measurement method and a time horizon. Use three time bands: immediate stabilization, plan execution, and post-implementation normalization.
Example of a measurable objective set:
- Liquidity: “Maintain minimum cash of $X and fund payroll and critical vendors each week.”
- Operations: “Reduce order-to-cash cycle time by Y days by month-end through invoice accuracy and collections cadence.”
- Cost structure: “Achieve run-rate cost reduction of $Z by month-end with documented headcount and spend controls.”
- Creditor treatment: “Support recovery assumptions with a waterfall model and consistent cash flow forecasts.”
- Governance: “Implement a restructuring approval workflow for all spend above $N within two weeks.”
If you cannot define the measurement method, you cannot manage the objective. If you cannot define the time horizon, you cannot sequence work.
Mind Map: Objectives and Stakeholder Outcomes
Example: A Simple Objective Set That Drives Real Decisions
Assume a manufacturer is missing payroll and has delayed shipments. The objective is not “fix everything.” It is a set of targets that force trade-offs:
- Objective: “Keep shipments to top 20 customers uninterrupted for 60 days.”
- Decision impact: prioritize inventory allocation and expedite freight for those accounts.
- Objective: “Stabilize cash by weekly collections and payment controls.”
- Decision impact: pause noncritical spend and require approvals for vendor payments above a threshold.
- Objective: “Reduce operating losses by month-end through cost actions already identified.”
- Decision impact: implement a specific headcount plan and stop discretionary projects.
- Objective: “Provide creditors a consistent recovery narrative backed by a waterfall model.”
- Decision impact: standardize assumptions across legal disclosures and negotiation materials.
Notice how each objective points to a concrete action. That is the difference between a plan and a wish.
A Practical Kickoff Checklist
At the start of the restructuring workstream, confirm:
- The top 5 objectives are written as target statements with metrics.
- Each objective maps to at least one stakeholder outcome.
- Every objective influences at least one near-term decision.
- The team agrees on a single measurement cadence for tracking progress.
For example, if the team cannot agree whether “liquidity” means cash on hand, cash available under facilities, or cash after payroll, the plan will stall later. Define it now, and the rest becomes easier.
1.2 Distinguishing Turnaround Finance From Distressed Investing
Turnaround finance and distressed investing both show up when a company is under pressure, but they aim at different problems. Turnaround finance is about restoring operating performance and liquidity through a structured reorganization plan. Distressed investing is about acquiring or financing claims at a discount and earning returns from the eventual resolution of those claims. The overlap is real, yet the emphasis changes what you measure, what you negotiate, and how you manage risk.
Core Purpose and Primary Success Metric
Turnaround finance treats the business like a system that must keep running while it is being fixed. The immediate success metric is survival with controlled cash burn, followed by measurable improvement in cash generation. For example, a lender funding a turnaround may require a weekly cash forecast, a capex approval threshold, and a plan to reduce working capital swings.
Distressed investing treats the capital structure like the main asset. The primary success metric is the value of the claim relative to what was paid, given expected recovery under a restructuring process. An investor buying distressed bonds focuses on recovery ranges, claim priority, and the likelihood of a plan being confirmed.
Time Horizon and Decision Rhythm
Turnaround finance typically operates on a short-to-medium cycle because liquidity and operations cannot wait. Decisions are made in weeks: renegotiate payment terms, pause nonessential spending, and stabilize customer supply. A common practice is a 13-week operating plan with weekly cash reporting, so the team can adjust before a missed payment becomes a cascade.
Distressed investing often follows a longer cycle tied to legal milestones and negotiation outcomes. The investor’s decision rhythm is shaped by events like creditor voting, plan documentation, and confirmation hearings. Even when the investor cares about operations, the operational work is usually evaluated through its effect on recovery.
Who Holds the Levers
In turnaround finance, the levers are operational and governance-based. The financier may require board oversight, reporting covenants, and restrictions on asset sales or additional debt. The goal is to ensure the company can execute the plan without surprises.
In distressed investing, the levers are primarily contractual and structural. The investor influences outcomes through consent rights, voting, and negotiation of claim treatment. The investor may push for a particular waterfall, interest treatment, or equity allocation, even if the company’s day-to-day operations are handled by management.
Risk Profile and What Can Go Wrong
Turnaround finance risks are often execution risks: cash forecasts are wrong, cost cuts remove revenue capacity, or working capital improvements fail to materialize. A practical example is a company that cuts inventory too aggressively to reduce cash, only to trigger stockouts and lost sales. Turnaround finance mitigates this by linking actions to measurable operational KPIs, not just cash targets.
Distressed investing risks are often valuation and process risks: the recovery is lower than expected, the plan is delayed, or claim priority is contested. For instance, if an investor buys unsecured claims assuming a certain recovery, but later discovers that intercreditor agreements shift priority, the expected return can change sharply.
Relationship to the Legal Process
Both approaches can involve reorganization proceedings, but their stance differs. Turnaround finance uses the legal process as a framework to implement operational and capital changes. It cares about what the company can do during the process, including interim financing and authority to pay critical vendors.
Distressed investing uses the legal process to resolve the capital structure. It cares about how claims are classified, how releases are handled, and whether the plan’s economics match the investor’s recovery thesis.
Mind Map: Turnaround Finance vs Distressed Investing
Integrated Example: Same Company, Different Lenses
Consider a manufacturer with declining margins and a near-term maturity wall. A turnaround financier might require a revised weekly cash forecast, restrict new commitments without approval, and fund a short-term working capital facility tied to inventory turns and supplier payment performance.
A distressed investor might buy a portion of the unsecured debt at a discount and then negotiate for a plan where unsecured creditors receive a defined recovery through a mix of cash and new notes. The investor’s analysis centers on whether the operating plan is credible enough to support the recovery economics.
Practical Rule of Thumb
If the question you are answering is “Can the company keep operating long enough to improve cash generation?” you are doing turnaround finance. If the question you are answering is “What is the expected recovery on a specific claim, given the restructuring mechanics?” you are doing distressed investing. Many professionals do both, but the distinction clarifies what to measure first and what to negotiate next.
1.3 Mapping Common Failure Modes and Financial Symptoms
Restructuring starts with a simple discipline: treat symptoms as clues, not conclusions. A cash shortfall can come from slow collections, sudden margin compression, or a working-capital trap created by customer terms. The goal of this section is to connect observable financial symptoms to the most likely failure modes, so the next steps focus on the right fixes.
Core Symptom Patterns and What They Usually Mean
1) Liquidity stress shows up as missed payments, frequent short-term borrowing, or a cash balance that falls below operating needs. The failure modes behind it are often operational (cash conversion worsens), contractual (covenants tighten), or structural (maturities cluster). A practical check is to compare cash burn to operating loss: if cash is draining faster than earnings deteriorate, working capital is usually the culprit.
2) Margin erosion appears as declining gross margin, rising cost of goods sold, or unprofitable product lines. Common failure modes include pricing that no longer covers input inflation, poor procurement terms, or sales mix shifting toward lower-margin customers. If revenue is flat but margin drops, look for cost timing issues first; if both revenue and margin fall, the issue is likely demand plus pricing.
3) Revenue instability shows up as churn, declining bookings, or revenue that swings quarter to quarter. Failure modes include customer concentration, weak pipeline conversion, contract renewals that lag, or delivery performance problems that trigger disputes. A useful diagnostic is to separate new sales from renewals and to track whether the decline is concentrated in a few accounts or spread across the customer base.
4) Balance sheet strain appears as rising accounts receivable aging, inventory build, or payables stretching. These are not just accounting artifacts; they reflect how the business is financing itself. If receivables age up while sales remain steady, collections processes or credit policies are failing. If inventory rises while sales slow, forecasting and replenishment controls are miscalibrated.
5) Leverage and covenant pressure shows up as covenant breaches, waiver requests, or lenders tightening terms. Failure modes include debt maturity walls, interest coverage shrinking due to earnings decline, or EBITDA definitions that no longer match reality. The key is to map each covenant to its driver: if the covenant is leverage-based, you need to know whether the problem is debt growth, equity erosion, or EBITDA decline.
Mind Map: Failure Modes and Financial Symptoms
Integrated Examples That Tie Clues to Causes
Example 1: Cash drops while revenue looks stable. A manufacturer reports steady sales, but cash declines sharply and AR aging moves from 45 to 75 days. The failure mode is working capital deterioration driven by collections. The symptom-to-cause link is direct: if sales are stable but cash conversion worsens, the business is effectively lending to customers.
Example 2: EBITDA falls, but the income statement shows only modest losses. A retailer shows small net losses yet faces covenant pressure. The failure mode is often definition mismatch or non-cash adjustments that no longer hold. If EBITDA is calculated with add-backs that are shrinking due to policy changes or one-time items ending, the covenant driver is not the headline net income.
Example 3: Margin declines after a pricing change. A services firm lowers rates to win volume, then sees gross margin fall and customer disputes rise. The failure mode is pricing not covering delivery costs plus operational strain. The symptom-to-cause link is reinforced by dispute-related revenue recognition delays and higher fulfillment costs.
Example 4: Inventory rises as sales slow, but payables also rise. A distributor builds inventory while stretching payables, creating a short-term illusion of liquidity. The failure mode is forecasting and replenishment miscalibration, compounded by supplier payment terms. The symptom pattern matters: inventory and payables moving together often indicates the firm is financing inventory with supplier credit rather than improving demand.
Turning Mapping Into Actionable Diagnosis
Once symptoms are mapped, the next step is to test the top two or three failure modes with targeted evidence. For liquidity, compare cash burn to changes in AR, inventory, and payables. For margin, reconcile gross margin movement to unit economics and mix. For revenue instability, segment by new sales versus renewals and by customer concentration. For covenant pressure, compute each covenant driver using the same definitions used in the credit agreement. This keeps the diagnosis grounded: you are not just naming problems, you are proving which ones are actually driving the numbers.
1.4 Establishing Governance for Restructuring Execution and Oversight
Governance is the system that turns a restructuring plan from “agreed in principle” into “done with evidence.” In practice, it answers four questions: Who decides, what they decide, how decisions are documented, and how performance is checked without waiting for surprises.
Governance Goals and Operating Principles
Start with clear goals that are measurable and not just ceremonial. A useful set is: (1) protect liquidity by controlling spending, (2) keep legal and financial workstreams aligned, (3) ensure creditor and stakeholder communications are consistent, and (4) prevent rework by locking assumptions early.
Operating principles keep the system from becoming a meeting factory. Use single-thread ownership for each major workstream, require written decision records for items that change economics or risk, and set escalation triggers so issues do not wait for the next weekly call.
Core Governance Bodies and Their Responsibilities
A lean governance stack works best when roles are explicit.
- Steering Committee: senior leadership plus key advisors. It approves major trade-offs, resolves cross-workstream conflicts, and signs off on plan-level changes.
- Restructuring Program Management Office: runs the cadence, maintains the decision log, consolidates reporting, and tracks action items to closure.
- Workstream Leads: legal, finance, operations, treasury, and communications. Each lead owns deliverables and the assumptions behind them.
- Creditors and Stakeholder Liaison: coordinates messaging and manages document requests and voting logistics.
A practical rule: if a decision affects cash, collateral, or claim treatment, it must be reviewed by the Program Management Office before it reaches the Steering Committee.
Decision Rights and a Simple Approval Matrix
Governance fails when authority is fuzzy. Create an approval matrix that maps decision types to approvers and thresholds.
Example thresholds for a mid-sized manufacturer:
- Spend approvals: up to $50k per item by the CFO; $50k–$250k by Steering Committee; above $250k requires Steering Committee plus legal review.
- Contract actions: termination or material amendment requires legal sign-off; renewals beyond 12 months require Steering Committee.
- Financing and collateral: any lien release, new security interest, or covenant waiver requires Steering Committee and treasury sign-off.
The matrix should be short enough to read in one sitting, but strict enough to prevent “informal approvals.”
Cadence and Reporting That Actually Helps
Use a cadence that matches the speed of the problem.
- Daily: treasury and cash control check. Confirm collections, payroll timing, and upcoming obligations.
- Weekly: Program Management Office status report. Include cash forecast variance, top risks, and decisions requested.
- Biweekly: Steering Committee review. Focus on approvals, cross-workstream conflicts, and plan changes.
- Ad hoc: escalation when triggers hit.
Reporting should be structured around decisions, not activity. If a report lists tasks completed but does not state what changed, it is mostly theater.
Risk Escalation Triggers and Escalation Paths
Escalation triggers prevent slow drift into avoidable problems. Define triggers in plain terms.
Examples:
- Liquidity: cash runway falls below a defined threshold for two consecutive weekly forecasts.
- Legal: a filing deadline is at risk due to missing inputs from finance or operations.
- Operational: a critical supplier threatens to stop shipments unless payment terms change.
- Financial: covenant breach probability rises above a set level based on updated forecasts.
Escalation paths should specify who gets notified, what must be included in the escalation note, and the maximum time to respond.
Decision Log and Evidence Trail
Every governance body should feed a single decision log. Each entry should include: decision date, decision owner, options considered, rationale, economic or legal impact, and implementation status.
Example decision log entry:
- Decision: approve amendment to vendor payment terms from net 30 to net 45 for two critical suppliers.
- Rationale: reduces near-term cash outflow while preserving production continuity.
- Impact: improves weekly cash by an estimated $180k; legal review confirms no adverse lien or setoff rights.
- Status: executed on 2026-04-12; tracked in cash forecast.
This evidence trail matters when stakeholders ask why choices were made, and it also helps internal teams avoid repeating the same debate.
Integrated Workstream Coordination
Governance must connect legal, finance, and operations so they do not optimize different goals.
Example Governance in Action
Consider a restructuring where operations propose a plant shutdown to cut costs, while finance needs uninterrupted cash collections to fund payroll.
The Program Management Office requests a decision memo that includes: expected cost savings timing, impact on customer contracts, effect on cash collections, and legal implications for employee obligations. The Steering Committee then approves a phased approach: pause non-essential production first, then schedule shutdown only after a confirmed customer transition plan. The decision log records the rationale and the trigger for moving to the next phase.
This is governance doing its job: it forces trade-offs into the open, ties actions to evidence, and keeps the organization moving without guessing.
1.5 Building a Restructuring Timeline With Key Decision Gates
A restructuring timeline is not a calendar of hope. It is a sequence of decisions backed by evidence, with each gate requiring a specific deliverable. The goal is to prevent “analysis forever” and to avoid committing to transactions before the numbers and constraints are understood.
Timeline Logic from Foundations to Execution
Start with a short discovery phase to establish facts, then move into design, then into negotiation and documentation, and finally into implementation and stabilization. Each phase has a decision gate that answers one question: “Do we proceed, revise, or stop?”
Mind Map: Restructuring Timeline Decision Gates
Phase 1: Discovery
Gate 1: Scope and authority happens early because restructuring work is cross-functional and messy. Deliverables include a mandate document, a workstream map (legal, finance, operations, HR, treasury), and a data room index that lists what exists and what is missing. Example: if payroll tax filings are incomplete, the timeline must include a correction task before any plan relies on “no surprises” assumptions.
Gate 2: Liquidity and default map uses a 13-week cash forecast built from operational drivers, not accounting totals. Include expected cash receipts, payroll timing, vendor payment cadence, and any known tax or insurance due dates. Example: a company may show positive EBITDA but still face a liquidity cliff because customer collections lag by 60 days while supplier terms tighten. The gate decision is whether the company can negotiate from strength, or whether it must seek court protection to stabilize cash and preserve value.
Phase 2: Diagnosis and design
Gate 3: Root-cause and operating plan requires normalized financials and a draft 90-day operating plan. Normalization means adjusting for one-time items and aligning cost categories to how the business actually runs. The operating plan should specify actions, owners, and measurement. Example: if margin is collapsing due to expedited freight, the plan should include a pricing review and a logistics control step, with a KPI such as “freight cost per unit” tracked weekly.
Gate 4: Capital structure and claim treatment turns liability inventory into a restructuring architecture. Build a waterfall model that tests multiple claim treatment scenarios and shows who receives what under each. Example: if secured lenders have collateral coverage that changes with asset sales, the architecture must reflect whether divestitures occur before or after the restructuring effective date.
Phase 3: Negotiation and documentation
Gate 5: Term sheet readiness is where negotiations stop being “talk” and become “terms.” Deliverables include a term sheet with economic points, governance outline, and a list of required exhibits (for example, releases, management retention mechanics, and conditions). Example: if management retention depends on performance metrics, define the metrics precisely and state how they are measured to avoid later disputes.
Gate 6: Plan feasibility and voting strategy combines legal feasibility with creditor behavior. Voting analysis should reflect claim classes, expected objections, and the information creditors need to vote. Include a risk register with mitigation steps. Example: if a class is likely to object due to valuation uncertainty, the disclosure draft should address valuation methodology and key assumptions clearly, not just confidently.
Phase 4: Implementation and stabilization
Gate 7: Closing readiness uses a conditions checklist. The checklist should cover funding mechanics, collateral releases, required consents, and any deliverables that must be signed before money moves. Example: a common delay is missing lien release documentation; the timeline should assign responsibility and a due date for each release.
Gate 8: Post-close control ensures the company can run the new structure without reverting to old reporting habits. Deliverables include a reporting cadence, KPI baselines, and a compliance checklist tied to the restructuring documents. Example: if the new debt includes reporting covenants, define the reporting package format and internal review steps so covenant calculations are consistent.
A Practical Gate Schedule Example
Use a gate cadence that matches decision urgency. For many restructurings, a workable pattern is: two weeks for Gate 1, two to three weeks for Gate 2, three to four weeks for Gate 3 and Gate 4, then two to four weeks for Gate 5 and Gate 6, followed by closing readiness and post-close control.
Mind Map: Gate Deliverables and Owners
A good timeline makes accountability visible. When a gate is missed, the timeline should show why: missing data, unclear ownership, or terms that were negotiated before feasibility was proven. That’s how the plan stays realistic and still moves.
2. Legal and Regulatory Frameworks for Reorganization
2.1 Overview of Insolvency Regimes and Reorganization Pathways
Insolvency regimes are the legal “operating systems” that decide what happens when a company cannot pay its debts as they come due. Reorganization pathways are the routes inside those systems—how the company restructures obligations, keeps operating (or pauses), and emerges with a new capital structure. The practical difference between regimes is not just legal terminology; it changes who controls the process, how creditors are treated, and what documents and approvals are required.
Core Concepts That Drive Pathway Choice
Start with three foundational questions.
-
Is the goal rescue or liquidation? Many regimes offer both, but reorganization requires a plan that can be confirmed by the court and accepted by affected stakeholders.
-
Who controls the company during the process? Some pathways keep management in place under supervision; others replace management or impose tighter control through a court-appointed officer.
-
How are claims treated? Reorganization typically reorganizes payment terms, converts debt to equity, or both. The “waterfall” of priority—secured, priority, unsecured, and equity—determines negotiation leverage.
A simple example: a retailer with secured bank debt and large trade payables may need to keep stores open. If the regime allows continued operations under court oversight, management can focus on inventory turns and cash collection while the plan addresses creditor claims.
Common Insolvency Regimes
Most jurisdictions cluster into a few functional categories.
-
Court-supervised reorganization: A court oversees the process, including stays, plan confirmation, and sometimes management changes. This is common where creditor coordination is difficult.
-
Out-of-court restructuring: Parties negotiate amendments or exchanges without a formal court process. It can be faster, but it often struggles when holdouts block unanimous consent or when a broad stay is needed.
-
Insolvency administration leading to liquidation: The emphasis is on asset realization. Even when a company is “restructured,” liquidation pathways can be used to sell the business or parts.
-
Special regimes for certain entities: Financial institutions and some regulated sectors may have tailored processes with different priorities and controls.
Reorganization Pathways Inside Court Supervision
Within court-supervised systems, pathways usually differ by timing, control, and the strength of creditor protections.
-
Debtor-in-possession style pathways: The company continues operating, often with reporting duties and limits on new obligations. This can preserve customer relationships and employee continuity.
-
Administration or trusteeship pathways: A neutral officer takes control or shares control. This can help when management credibility is questioned or when asset preservation requires tighter oversight.
-
Plan-based confirmation pathways: The company proposes a plan that sets claim treatment. Confirmation typically requires meeting statutory criteria such as feasibility, good faith, and compliance with priority rules.
A practical example: a manufacturer facing a maturity wall may use a plan-based pathway to extend maturities for secured lenders while converting a portion of unsecured debt into equity. The plan’s feasibility analysis ties directly to operational assumptions like production schedules and working capital targets.
Reorganization Pathways Without Court Supervision
Out-of-court routes often rely on contractual mechanisms.
-
Consent solicitations: Amendments require lender consent. If the debt is widely held, coordination costs rise.
-
Exchange offers: Creditors swap old instruments for new ones with different maturities or interest rates.
-
Intercreditor and standstill agreements: Parties agree to pause enforcement while negotiations proceed.
A concrete example: a software company with multiple bond series may negotiate a “majority-supported” exchange where consenting holders receive new notes with longer maturities, while non-consenting holders remain on old terms. The negotiation challenge is aligning incentives so that holdouts do not become a permanent bottleneck.
Mind Map: Regimes and Pathways
How to Map a Real Situation to a Pathway
Use a checklist that connects facts to process.
-
Liquidity urgency: If immediate enforcement risk is high, court-supervised stays may be necessary.
-
Creditor concentration: Concentrated creditor groups can support out-of-court amendments; dispersed groups often need court-backed coordination.
-
Operational dependency: If the business must keep running to preserve value, pathways that allow continued operations under oversight are typically more suitable.
-
Capital structure complexity: Multiple debt classes and intercreditor disputes increase the value of a plan-based confirmation framework.
A final example ties it together: a logistics firm with secured lenders, trade creditors, and leases may choose a court-supervised plan pathway because leases and secured claims require coordinated treatment. The plan then becomes the single document that aligns claim treatment, operational continuity, and reporting obligations into one coherent process.
2.2 Automatic Stay Effects and Creditor Rights During Proceedings
When a court enters a reorganization or insolvency proceeding, the automatic stay typically starts immediately. Its core job is simple: pause certain enforcement actions so the company can stabilize and the process can run on a level playing field. The practical effect is that creditors shift from “collect now” to “participate in the process,” with rights that are real but more structured.
What the Automatic Stay Usually Stops
Most automatic stays prohibit actions that pressure the debtor into paying outside the proceeding. Commonly stayed items include:
- Starting or continuing lawsuits to recover pre-petition claims.
- Enforcing judgments obtained before the filing.
- Repossession and foreclosure on collateral, unless the court grants relief.
- Setoff of mutual debts, depending on jurisdiction and the specific facts.
- Collection calls and demand letters that function as enforcement rather than information gathering.
A useful way to think about it is “no unilateral collection.” The stay does not erase claims; it changes the timing and forum.
What the Automatic Stay Usually Does Not Stop
The stay is not a blanket “nobody can ever act” rule. It often leaves room for:
- Actions to protect collateral through court-approved procedures.
- Proceeding with claims already filed in the bankruptcy case, rather than starting new enforcement.
- Continuing ordinary-course contracts that are not being terminated for pre-petition breach.
- Collecting post-petition obligations that arise after the filing, subject to the proceeding’s rules.
This distinction matters because creditors frequently confuse “stayed enforcement” with “no payment.” Post-petition obligations are usually handled differently from pre-petition claims.
Creditor Rights Under the Stay
Creditor rights typically fall into three buckets: participation, protection, and relief from the stay.
Participation
Creditors generally must file proofs of claim (or comply with the local equivalent) to be counted for distributions. If a creditor misses the deadline, the claim may be disallowed or receive reduced treatment.
Example: A supplier is owed $500,000 for invoices issued before the filing. The supplier receives a notice of the claims bar date. If it files its claim on time and supports it with invoices and a contract summary, it can vote on a plan and potentially receive a distribution. If it files late, it may still be heard, but it risks losing voting and distribution rights.
Protection
Even while enforcement is paused, creditors often have protection mechanisms. For secured creditors, the key concern is collateral value erosion. Courts may require adequate protection, which can include cash payments, replacement liens, or other measures.
Example: A lender holds a lien on equipment. After filing, the debtor continues using the equipment but the value drops due to wear and obsolescence. The lender can request adequate protection so the lender is not forced to absorb the entire value decline.
Relief from the Stay
A creditor may seek stay relief to resume enforcement. Courts usually consider whether the creditor has adequate protection and whether the debtor has a feasible path to reorganize.
Example: A creditor is owed $2 million and holds a lien on a property that is steadily losing value. If the debtor cannot show it will maintain the property or fund necessary payments, the court may grant relief, allowing foreclosure or other enforcement.
The “Pre-Petition vs Post-Petition” Line
Many stay disputes are really timing disputes. Claims for goods or services provided before the filing are typically pre-petition and subject to the stay. Charges for post-petition goods and services are usually handled as administrative or similar categories, depending on the jurisdiction.
Example: A logistics provider continues shipping after the filing under a new arrangement. The provider’s pre-filing invoices are stayed, but the post-filing freight charges are generally payable through the proceeding’s administrative process.
Procedural Mechanics Creditors Should Expect
Creditor involvement often looks like this:
- Notice and initial case information arrive after filing.
- Claims are filed with supporting documentation.
- Creditor committees or groups may coordinate positions.
- Motions for relief or adequate protection are litigated on a schedule.
- Plan voting and confirmation determine final treatment.
The stay is therefore not a dead end; it is a gate that routes disputes into the court process.
Mind Map: Automatic Stay and Creditor Rights
A Practical Walkthrough Example
A secured lender and an unsecured trade creditor both receive notices after filing. The trade creditor focuses on filing its claim and supporting the amount. The secured lender monitors collateral value and asks for adequate protection if the debtor’s use of collateral erodes value. If the debtor cannot maintain payments or collateral, the secured lender may move for stay relief to resume enforcement. Meanwhile, neither creditor can simply seize assets or sue the debtor for pre-petition amounts outside the proceeding.
The stay, in other words, changes the “how” and “where” of creditor action. It trades speed for order, and it does so with specific rights that are procedural, not optional.
2.3 Plan Confirmation Requirements and Voting Mechanics
Plan confirmation is where a restructuring stops being a set of negotiations and becomes a binding outcome. The core idea is simple: the plan must meet legal requirements, and the right groups of creditors and equity holders must approve it under defined voting rules. Think of it as two gates—eligibility and compliance, then approval and fairness.
Plan Confirmation Requirements
Most reorganization frameworks require the plan to satisfy several categories of conditions.
1. Proper classification and treatment. Claims are grouped into classes based on legal rights and economic similarity. Each class must receive a treatment that is consistent within the class. Example: if trade creditors have similar contract terms and payment priorities, they should not be split into multiple classes just to engineer voting outcomes.
2. Feasibility and implementation. The plan must be reasonably capable of being carried out. Courts typically look for a credible path from the current operating reality to the post-confirmation structure. Example: if the plan assumes a new credit facility, the budget should show how the company will meet covenants and liquidity needs until that facility is effective.
3. Good faith and process integrity. The plan must be proposed in good faith, with disclosure that allows stakeholders to make an informed choice. Example: if management proposes a management incentive plan, the disclosure should explain the targets and how they relate to operational KPIs already used in budgeting.
4. Best interests or equivalent fairness test. A common concept is that a dissenting class should not receive worse value than it would in the most likely alternative. Example: if a class is offered a recovery that is lower than what liquidation analysis suggests, the plan must justify why the alternative is less likely or less valuable.
5. Cramdown standards when not all classes vote yes. If some classes reject the plan, confirmation may still be possible if statutory fairness tests are met. A typical structure is that the plan cannot unfairly discriminate and must be fair and equitable with respect to dissenting classes.
Voting Mechanics
Voting mechanics translate the plan’s economics into a measurable approval process.
1. Who votes and what they vote on. Voting rights usually attach to allowed claims and allowed equity interests. Only holders with an allowed claim count for voting. Example: a creditor with a disputed claim may not vote until the dispute is resolved or the claim is otherwise allowed for voting purposes.
2. How classes vote. Each class votes separately. A class generally accepts the plan if it meets a threshold such as “a majority in number and two-thirds in amount,” depending on the jurisdiction and claim type. Example: if a class has 50 creditors holding $10 million total, a vote might require approval by creditors representing both a majority of creditors and at least a specified percentage of dollar value.
3. Treatment of impaired versus unimpaired classes. Unimpaired classes may be deemed to accept, while impaired classes must vote. Example: if a class is left exactly as-is under the plan, it may not need to vote because it is not being changed.
4. Record date and notice. Voting is tied to a record date so the plan can determine who holds claims at the time voting eligibility is set. Notice must be delivered in time for stakeholders to review the disclosure statement and plan.
5. Counting votes and handling abstentions. Abstentions typically do not count as “yes” votes. Example: if a class threshold is based on dollar value, a large creditor abstaining can prevent confirmation even if many small creditors vote yes.
Integrated Example Walkthrough
Assume a company has three classes:
- Class A secured lenders (impaired)
- Class B unsecured trade creditors (impaired)
- Class C equity (impaired)
The plan proposes: Class A receives new secured notes plus a maturity extension; Class B receives a mix of cash and new unsecured notes; Class C is written down to zero.
- The company prepares a disclosure package showing the rationale for each treatment and the valuation basis.
- Each class receives a ballot and votes separately.
- Class A meets the acceptance threshold by both number and amount.
- Class B fails the threshold because a few large trade creditors representing most of the dollar value vote no.
- The company seeks confirmation anyway using cramdown, arguing that Class B is treated fairly and equitably and that the best interests test is satisfied.
The confirmation outcome hinges on whether the plan meets statutory requirements and whether the dissenting class treatment passes the fairness tests.
Mind Map: Plan Confirmation and Voting
Practical Checklist for Voting Day
- Confirm each class is correctly defined and impaired status is accurate.
- Ensure voting eligibility matches allowed claims and the record date.
- Verify ballots reflect the correct dollar amounts and voting thresholds.
- Align disclosure with the valuation and feasibility narrative used for confirmation.
- Prepare the fairness and best interests arguments for any dissenting impaired class.
When these pieces fit together, voting becomes more than arithmetic—it becomes evidence that the plan’s structure is both legally compliant and economically coherent.
2.4 Treatment of Secured Unsecured and Priority Claims
Treatment of Secured, Unsecured, and Priority Claims
When a company reorganizes, the plan has to decide who gets paid, in what order, and under what conditions. The core idea is simple: claims are grouped by legal rights, then the plan assigns value in a way that respects priority rules and the plan’s own economic logic. The tricky part is that “secured,” “unsecured,” and “priority” are not just labels; they determine collateral access, voting power, and how much value each group can realistically expect.
Foundational Concepts That Drive Claim Treatment
Secured claims are backed by collateral. If the debtor defaults, the secured creditor has a right to look to specific assets. In practice, the plan must address the collateral’s value and the secured creditor’s deficiency, if any.
Unsecured claims do not have collateral backing. They are paid only from whatever value remains after secured and priority claims are satisfied. Their treatment often becomes the negotiation center because they usually absorb the largest haircut.
Priority claims sit between secured and general unsecured claims. They are unsecured, but the law gives them higher payment priority due to their nature, such as certain taxes or employee-related obligations. Priority treatment is typically mandatory, not optional.
A useful mental model is a “value waterfall”: collateral value first supports secured claims; then priority claims get their legally required share; then general unsecured claims share the remainder.
Secured Claims: Collateral Value, Deficiency, and Plan Mechanics
Start by determining collateral value. If collateral is worth $60 million and the secured creditor’s claim is $80 million, then $60 million is treated as secured and $20 million becomes an unsecured deficiency claim. Plans often handle this by splitting the claim into two classes: secured portion and unsecured portion.
Next, decide how the secured portion is treated. Common approaches include:
- Pay in full: The plan pays the secured amount, often with interest, either immediately or over a defined schedule.
- Reinstatement: The plan keeps the original loan terms or restores them, assuming the creditor’s rights are satisfied.
- Collateral surrender: The creditor receives the collateral, and any remaining deficiency becomes unsecured.
Example: A retailer has a $50 million secured loan against a distribution center. A valuation shows the center is worth $40 million. The plan proposes to keep the center and pay the secured portion over five years at a market rate. The creditor receives $40 million as secured, and the remaining $10 million votes and is paid as unsecured.
Unsecured Claims: Classes, Haircuts, and Voting Logic
Unsecured claims are usually grouped into classes based on similar legal rights and economic treatment. Even if two creditors are both unsecured, they may not be in the same class if the plan treats them differently.
The plan’s economic choices for unsecured claims typically include:
- Cash plus equity: Some unsecured creditors receive cash and the rest in reorganized equity.
- Debt exchange: Unsecured creditors exchange their claims for new notes with different terms.
- Partial write-down: The plan reduces principal, with repayment based on expected cash generation.
Example: A manufacturer has $120 million of general unsecured claims. After secured and priority payments, $70 million of value remains. The plan offers unsecured creditors $35 million in cash and $35 million in new debt. If a creditor’s claim is $1 million, it receives $291,667 cash and $708,333 in new debt, subject to the plan’s payment schedule.
Priority Claims: Mandatory Treatment and Practical Compliance
Priority claims are often the least negotiable part of the waterfall. The plan must respect statutory priority, which means these claims are typically paid in full or in a manner that satisfies the legal requirement.
Priority claims can be operationally challenging because they may be spread across multiple vendors, agencies, or employee-related categories. A clean approach is to inventory them early, reconcile amounts with supporting records, and confirm whether any portion is disputed.
Example: A services firm has $6 million in unpaid payroll taxes and $2 million in certain employee wage-related priority amounts. The plan sets aside $8 million for priority claims, paid on a defined schedule that matches the company’s cash forecast. General unsecured creditors receive nothing until priority is funded.
Integrated Waterfall and Classification Mind Map
Mind Map: Treatment of Secured, Unsecured, and Priority Claims
Putting It Together in a Single Example
Assume a reorganizing company has $100 million of total claims: $60 million secured, $25 million priority, and $15 million general unsecured. Collateral is valued at $50 million. The plan pays secured creditors $50 million as secured and treats the remaining $10 million as unsecured deficiency. Priority claims are paid in full at $25 million. That leaves $15 million for general unsecured plus the $10 million deficiency, but only $15 million remains total, so unsecured creditors share a $15 million pool.
If the plan groups general unsecured ($15 million) and deficiency ($10 million) into the same unsecured class, each $1 of unsecured claim receives $1.00/ $25.00 of value, meaning a $1 million claim gets $600,000. If the plan separates them into different classes, the economics can differ, but the secured deficiency must still be treated as unsecured for voting and payment purposes.
The practical takeaway is that claim treatment is a structured exercise: classify claims correctly, quantify collateral and priority amounts with support, then apply the waterfall consistently across classes so the plan’s economics match the legal rights.
2.5 Documenting Authority for Restructuring Transactions and Releases
Documenting authority is the part where “we can do this” becomes “we can prove we can do this.” In restructuring, authority flows from a chain: corporate power → board or committee approvals → statutory or court authorization → creditor or stakeholder consent → transaction documents that reflect the approved scope. If any link is missing or unclear, releases and restructuring transactions can become harder to enforce.
Core Principle of Authority Documentation
Start by separating two questions. First: who is allowed to act? Second: what exactly are they allowed to release or modify? Authority documents should answer both with traceable specificity. A common failure mode is a broad approval resolution that doesn’t match the narrow language of the release, or a release that references “the plan” without attaching the plan provisions that define its scope.
Authority Map from Internal Governance to External Effect
Build your documentation in layers.
-
Internal authorization: board minutes, written consents, committee charters, and delegated authority schedules. These should identify the transaction type, the parties, and the approval thresholds.
-
Proceeding authorization: court orders, statutory findings, or confirmation orders that permit the transaction and approve the release mechanism.
-
Stakeholder authorization: creditor votes, class composition evidence, and voting tabulations. For releases, confirm that the release is tied to the approved plan or order and that the class treatment matches the voting outcome.
-
Execution authority: incumbency certificates, officer signatures, and authority certificates for each closing deliverable.
-
Disclosure and record support: disclosure statements, notice packages, and proof of service. Even when not strictly required for authority, they help show that the process was orderly and that parties received what they were promised.
What “Authority” Looks Like in Release Language
Releases are not generic. They should be documented with three precision points.
- Scope: which claims are released, against whom, and for what conduct. Example: “claims arising from prepetition indebtedness” is narrower than “any and all claims.”
- Source: where the release comes from. Example: “pursuant to Article X of the confirmed plan” is better than “as approved.”
- Consideration and conditions: what the releasing party receives and what conditions must be satisfied for the release to become effective.
A practical approach is to create a release crosswalk that maps each release clause to the exact plan or order paragraph and to the exact transaction document section that implements it.
Document Set Checklist for Restructuring Transactions
Use a consistent set of documents so the record is navigable.
- Board and committee approvals: resolutions, meeting minutes, delegation schedules.
- Officer authority: incumbency certificates and signature authority certificates.
- Plan and order package: plan text, confirmation order, and any supplemental orders.
- Voting and notice evidence: voting report, class ballots, notice affidavits, proof of mailing.
- Release implementation: release agreement or plan release exhibit, plus any joinders.
- Closing deliverables: assignment documents, payoff letters, lien releases, and termination statements.
Example: Matching Approvals to Release Scope
Assume a company proposes to restructure secured debt and includes a plan release for “Released Parties.” The board resolution authorizes “execution of the plan and related documents.” The plan defines Released Parties as the debtor, reorganized debtor, and certain affiliates, but the release agreement mistakenly includes additional third parties.
To fix this, the record should show either (a) the release agreement is revised to match the plan definition, or (b) the authority documents and approvals are updated to reflect the corrected scope, including any required supplemental court approval. The key is that the release language must be traceable to the authority that permitted it.
Mind Map: Authority Documentation Workflow
Quality Controls That Prevent Authority Gaps
Before signing, run three checks.
-
Version control: ensure the release agreement version matches the confirmed plan version and the final court-approved exhibits.
-
Traceability matrix: for each release clause, record the exact source paragraph and the approval document that authorizes it.
-
Signature and incumbency alignment: confirm the signatory’s role matches the officer capacity stated in the incumbency certificate.
If you keep these controls consistent, the authority record becomes a coherent story rather than a pile of documents. That coherence is what makes enforcement more straightforward when someone later asks, “Who authorized this, and for what exactly?”
3. Financial Diagnosis and Restructuring Readiness Assessment
3.1 Creating a Diagnostic Data Room and Document Inventory
A diagnostic data room is the place where restructuring decisions stop being opinions and start being evidence. The goal is simple: make it fast to answer specific questions about cash, claims, performance, and constraints—without hunting across emails, drives, and meeting notes.
Start with a document inventory that mirrors the questions your team must answer. If the inventory is built from the questions, the data room becomes a tool instead of a filing project.
Step 1: Define the Question Set
Create a short list of “decision questions,” each tied to a document type. For example:
- What is the company’s true cash position today, and what changes it week to week?
- Which contracts can be terminated, assigned, or renegotiated, and what are the notice periods?
- What obligations exist across debt, leases, taxes, and employee liabilities?
- What performance metrics explain margin and volume trends?
- Where are the covenants and default triggers hiding?
A practical trick: write each question as a sentence that begins with “Show me…” so the document request is unambiguous.
Step 2: Build the Inventory as a Structured Index
Use a folder structure that matches workstreams. Each folder should contain a mix of “source” documents and “analysis-ready” extracts.
Recommended top-level folders:
- 00 Governance and Timeline
- 01 Financial Statements and Accounting
- 02 Cash, Treasury, and Banking
- 03 Debt, Claims, and Security
- 04 Leases, Contracts, and Commitments
- 05 Tax, Payroll, and Benefits
- 06 Operations and Performance
- 07 Litigation, Compliance, and Risk
- 08 Insurance and Guarantees
- 09 Restructuring Plan Materials
Inside each folder, keep a consistent naming convention: YYYY-MM-DD_DocumentType_Counterparty_Version. If you cannot enforce naming, enforce a “document ID” field in the inventory spreadsheet.
Step 3: Populate with Evidence, Not Just Files
For each document request, specify what “good” looks like. For instance, “bank statements” should include all accounts, not just the main operating account. “AP aging” should show aging buckets and the report date.
A small example inventory row:
- Question: What is the weekly cash burn?
- Document request: Weekly cash forecast and actuals
- Required fields: forecast horizon, assumptions, variance notes, last update date
- Owner: Finance controller
- Status: Received, needs reconciliation
This prevents the classic problem where the room contains documents but not the information needed to use them.
Step 4: Add Metadata and Access Controls
Attach metadata to each item: document ID, owner, period covered, currency, and whether it is final or draft. Metadata is what makes searching reliable.
Set access controls by role. Legal needs full contract sets; operations may need only performance and contract summaries; finance needs the full accounting package. Keep a log of who accessed what, because later you will need to explain why a number changed.
Step 5: Validate Completeness with a Reconciliation Loop
Completeness is not “everything is uploaded.” It is “the numbers tie.” Run a reconciliation loop:
- Bank balances tie to treasury reports.
- Treasury reports tie to the cash flow model.
- Debt schedules tie to note disclosures and credit agreements.
- Lease schedules tie to rent expense and lease accounting.
If something does not tie, record the discrepancy in the inventory. Do not silently replace documents; track the reason.
Mind Map: Diagnostic Data Room Components
Example: A Minimal Viable Data Room in 10 Days
Day 1–2: Upload the last two sets of financial statements, the latest trial balance, and the most recent bank statements for all accounts.
Day 3–4: Add debt schedules, lease schedules, and a current AP aging plus AR aging. Include the report dates.
Day 5–6: Upload the top customer and top vendor contract lists with key terms summaries. Full contracts can follow, but summaries must be consistent.
Day 7–8: Add tax and payroll liability reports, plus any material litigation summaries and compliance notices.
Day 9–10: Run the reconciliation loop and update the inventory statuses. The room is “ready” when the cash and liability totals can be explained, even if some details are still pending.
Mind Map: Document Inventory by Workstream
A well-built diagnostic data room reduces friction across teams. It turns “we think” into “we can show,” and it keeps the restructuring process grounded in the same set of facts for everyone involved.
3.2 Normalizing Financial Statements for Restructuring Analysis
Normalizing financial statements means turning “as reported” numbers into a consistent view of how the business would perform under a stable operating baseline. In restructuring, you’re not trying to rewrite history; you’re trying to remove noise so cash, margin, and working-capital behavior can be compared across periods and against scenarios.
Start with a simple rule: every adjustment must have (1) a clear purpose, (2) a source document, and (3) a measurable impact. If you can’t point to the underlying invoice, payroll register, contract, or bank statement, the adjustment is just a guess wearing a tie.
Step 1: Align the Accounting Basis Across Periods
Restructuring analysis often spans multiple reporting periods with different accounting treatments. Normalize by ensuring the same basis for revenue recognition, capitalization versus expensing, depreciation methods, and consolidation scope.
Example: If one quarter includes a one-time reversal of a revenue reserve, keep revenue recognition consistent by separating that reversal from recurring collections. The goal is to measure operating collections, not the accounting mechanics of a single quarter.
Step 2: Separate One-Time Items from Operating Performance
Identify items that are not expected to recur in the same form. Common categories include restructuring charges, asset sales gains/losses, litigation settlements, impairment charges, and insurance proceeds tied to specific events.
Example: A company reports a large “restructuring expense” in the most recent quarter. For analysis, you typically exclude it from recurring operating costs, but you still track it in cash planning because it may require payments. In other words, “non-recurring” for income statement purposes does not mean “non-cash” for liquidity.
Step 3: Normalize Non-Operating and Financing Effects
Remove items that distort operating profitability: interest expense, foreign exchange gains/losses, investment income, and certain tax effects that are not driven by core operations.
Example: If foreign exchange losses are large due to a one-off currency movement, keep them out of operating margin so you can evaluate whether the core business can generate gross profit and cover cash operating costs.
Step 4: Recast Working Capital Using Cash-Linked Logic
Accrual-based working capital can mislead. Normalize receivables, payables, and inventory by linking them to cash collection and payment patterns.
Example: A company shows receivables rising because of revenue growth. Normalization asks whether collections are actually slowing. If days sales outstanding increased from 45 to 70, you adjust the “quality” of receivables by estimating collectible amounts and timing, not just the accounting balance.
Step 5: Standardize Cost Structure for Comparability
Costs may include unusual allocations, management fees, or shared-service charges that don’t reflect standalone operations. Normalize by converting allocated costs into either (a) direct costs that would exist in a standalone model or (b) a consistent allocation method.
Example: If corporate allocates IT costs based on headcount, but the headcount is temporarily inflated by a staffing program, normalize by using a stable staffing level or contract-based cost drivers.
Step 6: Convert “Run-Rate” Into a Credible Baseline
Run-rate is only useful when it’s grounded in evidence. Build a baseline using the most representative recent period, adjusted for known changes such as contract renewals, price changes, or planned cost reductions.
Example: If a price increase took effect mid-quarter, normalize by blending the pre- and post-change pricing impact rather than assuming the entire quarter reflects the new price.
Step 7: Document Adjustments and Reconcile to Reported Totals
Create an adjustment bridge so readers can trace every change from reported to normalized figures. This prevents “black box” models and makes negotiation discussions easier because the logic is visible.
Mind Map: Normalization Workflow
Example: A Normalization Bridge in Practice
Suppose reported EBITDA is negative due to a large impairment and a restructuring charge. Normalization typically produces:
- Operating margin excluding impairment and restructuring charges.
- Cash impact tracked separately in the liquidity forecast.
- Working capital changes recast using collection and payment timing.
If impairment is non-cash, it may not change near-term liquidity, but it can affect covenant calculations and lender perceptions. Normalization keeps both truths in view: one for operating performance, one for cash.
Example: Receivables Normalization with Collectibility Haircuts
If receivables include disputed invoices, normalize by estimating collectible amounts based on dispute status and historical resolution rates. The normalized receivable balance then better reflects expected cash receipts, which is what the restructuring team actually needs to plan payments.
By the end of normalization, you should have a consistent set of income statement, cash flow drivers, and working-capital assumptions that can be compared across periods and used to test restructuring options without being derailed by accounting artifacts.
3.3 Liquidity Stress Testing Using Historical Cash Flow Drivers
Liquidity stress testing answers a simple question: if the business runs into trouble, how quickly does cash run out, and what specific drivers cause it? The trick is to build the stress test from historical cash flow behavior, not from wishful accounting.
Start with a clean baseline. Collect at least 12–24 months of monthly cash flow statements and supporting detail for the components that actually move cash: collections, payments, payroll timing, tax remittances, capex, and debt service. Then reconcile the baseline to the company’s current operating reality. If the last year includes one-off items (a large settlement, a temporary tax benefit), remove or normalize them so the stress test reflects repeatable mechanics.
Next, convert the baseline into cash flow drivers. A driver is a relationship between an operational metric and cash timing. For example, Days Sales Outstanding (DSO) is a driver for cash collections timing; inventory days drive cash tied up in stock; vendor payment terms drive cash out timing. The goal is to model cash, not just profit.
Mind Map: Liquidity Stress Testing from Historical Drivers
Building the Driver Model
Use a driver-based structure that mirrors how cash actually arrives and leaves. A practical approach is a 13-week rolling forecast where each week is driven by historical timing patterns.
-
Collections driver: Build a simple collections waterfall by aging bucket. For instance, take historical collection rates for current invoices, 30–60 days, and 60–90 days. Then apply a stress shock such as a slower collection rate in the current bucket and a higher dispute rate that delays payments. Example: if historically 85% of current invoices are collected within the next two weeks, stress it to 70% while keeping the total invoice volume constant.
-
Payments driver: Model payments using vendor terms and observed payment cycles. If the company historically pays 60% of invoices within 30 days and the rest within 60–90 days, stress the timing by shifting a portion of payments later. Example: assume a temporary liquidity squeeze causes payments to move from the 30-day bucket to the 60–90-day bucket, but cap the delay to what the business can operationally sustain (you are testing liquidity, not turning off the lights).
-
Payroll and taxes driver: Treat payroll as a fixed cadence and taxes as scheduled outflows. Stress the timing only if historical evidence supports it, such as prior deferrals or payment plan behavior. Example: if payroll is always paid weekly, don’t stress it by “reducing payroll” unless that reduction is already reflected in the baseline plan.
-
Inventory and capex driver: Inventory affects cash through working capital. Use historical inventory turns and reorder cadence to estimate cash tied up in stock. For capex, use the approval and procurement cycle: if projects typically start in month 2 and cash out occurs in month 3, reflect that timing. Example: if capex historically averages $2.0 million per month but is lumpy, stress by delaying discretionary items to later weeks rather than assuming a flat reduction.
Designing Stress Scenarios Without Making Them Up
A good stress scenario is grounded in historical ranges. Identify the worst observed behavior for each driver over the last 12–24 months, and also consider a “mixed” scenario where multiple drivers deteriorate together.
Example scenario set:
- Collections delay scenario: Current-bucket collections drop to the lower quartile of historical performance for 4–6 weeks.
- Vendor payment timing scenario: Payments shift later by one historical timing step, sustained for 6–8 weeks.
- Working capital squeeze scenario: Inventory builds slightly (slower sell-through) while collections slow, creating a double hit to cash.
- Financing constraint scenario: Revolver availability tightens because the borrowing base depends on receivables and inventory. Model the borrowing base using stressed receivables and inventory values.
Keep the mechanics consistent: if you stress collections, you should also stress receivables balances that feed the borrowing base.
Output Metrics That Matter
The stress test should produce three outputs: cash runway, minimum cash, and breach points. Cash runway is the number of weeks until cash hits a defined minimum (often $0 or a required operating buffer). Minimum cash shows how close the business gets to that threshold. Breach points identify where constraints activate, such as revolver borrowing base shortfalls or covenant calculations.
Example: if the model shows minimum cash of $0.8 million in week 9 and a borrowing base shortfall in week 6, the immediate focus is not “overall improvement,” but driver-specific actions that restore borrowing capacity by week 6.
Turning Results Into Driver-Specific Mitigations
Mitigations should map directly to the drivers you stressed. If the stress came from collections delays, mitigation options include targeted collections on the most collectible aging buckets and temporary credit holds on low-collection customers. If the stress came from payment timing, mitigation focuses on preserving critical vendor continuity while negotiating extended terms for non-critical spend. If the stress came from inventory build, mitigation focuses on production scheduling and expedited liquidation of slow-moving items.
The best part of a driver-based stress test is that it tells you what to do next, because it already named the levers.
3.4 Identifying Covenant Breach Risks and Default Triggers
Covenant breach risk is rarely a single event. It’s usually a chain: an operating change affects cash generation, cash generation changes leverage or coverage metrics, and those metrics interact with measurement rules that can be stricter than people expect. Default triggers then determine what happens next—often faster than teams can react.
Start by separating three layers of risk: (1) the covenant metric itself, (2) the measurement mechanics, and (3) the consequences and cure rights. A company can “look fine” on a casual reading yet still breach because the calculation uses trailing periods, includes add-backs, or counts certain leases as debt.
Covenant Metrics and Their Failure Modes
Most covenants fall into a few metric families:
- Leverage covenants (e.g., Total Debt to EBITDA). Failure mode: EBITDA drops faster than debt amortizes, or debt increases through new borrowings, capitalized leases, or guarantees.
- Coverage covenants (e.g., EBITDA to Cash Interest). Failure mode: interest expense rises due to rate resets, fees, or refinancing, while EBITDA is pressured by margin changes.
- Liquidity covenants (e.g., minimum unrestricted cash). Failure mode: cash is trapped by restricted accounts, tax payments, or working capital swings.
- Incurrence covenants (e.g., no additional debt without meeting a test). Failure mode: a planned transaction is delayed, but the test is measured on a date that catches the company at its weakest point.
A practical way to spot failure modes is to list every covenant metric and write one sentence describing what must go wrong for it to breach. For example: “Leverage breaches if EBITDA falls or debt rises between measurement dates.” That sentence becomes your checklist for data collection.
Measurement Mechanics That Create Surprise Breaches
Covenants are written with measurement rules that can be more important than the headline ratio.
Key mechanics to verify:
- Measurement period: trailing twelve months (TTM) vs. quarterly vs. annual. TTM can “lag” improvements, so a temporary dip can haunt the ratio for four quarters.
- Definition of EBITDA: recurring vs. adjusted EBITDA, permitted add-backs, and whether restructuring costs are included. If add-backs require documentation, missing paperwork can effectively reduce EBITDA.
- Definition of debt: includes leases, letters of credit drawn, guarantees, and certain preferred equity. A company may think it has no “new debt,” but a guarantee can count.
- Accounting basis: GAAP vs. consistent with past practice, and whether changes in accounting standards require covenant recalculation.
- Netting and exclusions: some agreements allow netting cash against debt for certain calculations, but only if cash is unrestricted and in specified accounts.
A simple example: a retailer forecasts EBITDA improving next quarter, but the covenant uses TTM EBITDA. If the prior year’s margin was weak, the ratio may still breach even after operational improvements begin.
Default Triggers Beyond the Covenant Itself
Covenants often sit inside a broader default framework. Common triggers include:
- Cross-default: a default under another debt agreement triggers a default here.
- Payment defaults: missed interest or principal payments, including grace period limits.
- Material adverse change clauses: typically require a lender determination and can be tied to other events.
- Breach of reporting covenants: late financial statements or failure to deliver certificates by a deadline can be a technical default.
- Misrepresentation: inaccurate compliance certificates can trigger default even if the underlying metric would have passed.
To manage these, build a “trigger map” that lists each default clause and the exact condition that activates it. Then add the operational owner for each condition, such as treasury for payments, finance for reporting, and legal for certificate accuracy.
Building a Covenant Risk Dashboard
Create a dashboard that tracks both the metric and the mechanics. For each covenant, include:
- Current calculated ratio using the agreement’s definitions.
- Headroom: how far the ratio is from the threshold.
- Sensitivity drivers: the top three inputs that move the ratio.
- Timing: the measurement date and the next reporting/certificate deadline.
- Cure rights: whether there is a cure period, equity contribution option, or waiver process.
Example: Suppose a company has a leverage covenant of 6.0x and is currently at 5.6x. The dashboard should show whether the 0.4x headroom is mainly driven by EBITDA add-backs that require specific documentation. If documentation is uncertain, headroom is less real than it looks.
Mind Map: Covenant Breach Risk and Default Triggers
Worked Example: From Metric to Trigger
Assume a credit agreement requires a quarterly leverage test measured on TTM EBITDA. The company plans to sell a non-core asset and expects a one-time gain. The gain may not be included in EBITDA, but the sale proceeds will improve liquidity. The dashboard should therefore show two separate effects: leverage may not improve immediately due to TTM measurement, while liquidity improves quickly. If the company also has a reporting covenant requiring a compliance certificate within 30 days of quarter-end, a late certificate could trigger a technical default even if the leverage ratio would pass.
The key is to treat covenant compliance as an evidence-based process, not a spreadsheet exercise. When you can point to the exact definition, the measurement date, and the required documentation for each metric, covenant risk becomes measurable rather than mysterious.
3.5 Quantifying Value Destruction and Prioritizing Root Causes
Value destruction is what happens when the business spends resources faster than it creates economic value. In restructuring, you quantify it so you can stop guessing and start choosing. The goal is not to produce a perfect number; it’s to produce a defensible map from symptoms to causes, with enough precision to guide decisions.
Start with Economic Value, Not Just Accounting Profit
Accounting loss can be caused by timing, one-time charges, or non-cash items. Economic value focuses on whether the firm generates returns above its cost of capital. A practical first pass uses a simple value bridge:
- Operating cash shortfall: cash from operations minus required cash needs (interest, taxes, maintenance working capital).
- Margin erosion: gross margin and contribution margin decline driven by pricing, mix, or cost-to-serve.
- Capital drag: excess working capital and underutilized assets consuming cash.
Example: A distributor reports EBITDA of -$2M due to higher logistics costs. A cash view shows operating cash flow of -$8M because receivables ballooned by 60 days. The “value destruction” is mostly working-capital drag, not just expense levels.
Build a Value Destruction Scorecard
Use a scorecard that separates value loss into components you can influence. A compact structure:
- Revenue shortfall (volume, price, mix)
- Gross margin shortfall (unit economics, discounts, freight, scrap)
- Operating expense inefficiency (labor productivity, overhead allocation)
- Working capital overuse (DSO, DPO, inventory days)
- Capital inefficiency (idle assets, capex that doesn’t convert to cash)
Assign each component a dollar estimate for the last 3–6 months and a normalized run-rate. Normalization matters because one-off events (a delayed shipment, a temporary supplier issue) can distort the story.
Example: Manufacturing shows inventory days rising from 45 to 75. You quantify the cash impact by multiplying the incremental inventory by the firm’s cost of goods and adding carrying costs (storage, obsolescence). That turns “inventory is high” into “inventory ties up $6M of cash.”
Quantify with Driver-Based Decomposition
To avoid vague conclusions, decompose performance into drivers and compute the contribution of each driver to cash and value.
- Revenue drivers: units × price × mix.
- Cost drivers: variable cost per unit, fixed cost absorption, and cost-to-serve.
- Working capital drivers: receivables aging, payable terms, and inventory turns.
A driver-based approach supports clear tradeoffs. If margin is stable but DSO worsens, the fix is collections and credit policy, not immediate price cuts.
Prioritize Root Causes Using a Two-Axis Logic
Root causes are not all equal. Prioritize using:
- Magnitude: how much value destruction each cause explains.
- Controllability: how quickly management can change it given constraints (contracts, system limitations, customer behavior).
This prevents spending time on causes that are small or hard to move.
Example: Two issues appear: (1) a 2% price discount to win deals, (2) a billing process that delays invoices by 10 days. Even if the discount is visible, the billing delay may explain most of the cash gap because it directly drives DSO.
Mind Map: From Symptoms to Quantified Causes
Turn Numbers Into Decisions with a Root-Cause Inventory
Create a root-cause inventory that links each cause to evidence and an action owner. For each candidate root cause, capture:
- Evidence: which metric moved and when.
- Mechanism: how the cause creates value loss (e.g., delayed invoicing → higher DSO → cash gap).
- Magnitude: estimated dollar impact.
- Time to change: days/weeks/months.
- Dependencies: legal approvals, system changes, customer consent.
Example: “Customer disputes” is a root-cause candidate. Evidence shows disputes increased after a product change. Mechanism: disputes delay collections. Magnitude: disputes account for $2.5M of aged AR. Time to change: 30 days if you revise documentation and dispute workflow.
Use Confidence Levels to Prevent False Precision
Not every estimate deserves the same weight. Label each component with a confidence level based on data quality and normalization.
- High confidence: directly measured cash drivers (aging, payment terms, inventory counts).
- Medium confidence: driver estimates from internal systems with known gaps.
- Low confidence: inferred causes without clean measurement.
This keeps the team focused on the biggest, most provable value leaks first.
Mini Example: A Coherent Value Story
A service firm shows declining cash despite stable revenue. The scorecard attributes value destruction to working capital overuse: DSO rises from 35 to 55 days, consuming $4M cash. Driver decomposition shows revenue is stable, but billing accuracy drops after a process change, increasing rework and delaying invoice approval. The root-cause inventory prioritizes billing workflow fixes and dispute reduction because they are controllable within 4–6 weeks and explain the majority of the cash gap.
By the end of this step, you should be able to answer two questions with numbers: Where is the value going missing? and Which causes can we change first to stop the bleeding?
4. Cash Flow Engineering for Immediate Stabilization
4.1 Building a Weekly Cash Forecast with Operational Inputs
A weekly cash forecast is a map of timing, not just totals. The goal is to predict when cash moves, because that is what determines whether you can pay vendors, meet payroll, and avoid emergency borrowing.
Start with the Cash Question You’re Actually Answering
Build the forecast around a single operational question: “What cash will we have on each day of the next 13 weeks, and what will we need to pay?” If you can answer that daily, weekly reporting becomes straightforward. If you only forecast totals by month, you’ll miss the classic problem: cash arrives on one day, bills hit on another.
Use a 13-week horizon with weekly buckets, then add daily detail for the first two weeks. For example, week 1 and week 2 can be split into days so you can manage payroll timing and vendor payment runs.
Define the Forecast Structure Before You Touch Data
Create three layers so the model stays readable:
- Beginning cash for the week.
- Cash inflows from collections and other receipts.
- Cash outflows for payments and other disbursements.
Then compute net cash movement and ending cash for each week. Keep the chart of accounts simple for this purpose; you can reconcile later.
Mind Map: Weekly Forecast Inputs and Logic
Translate Operations Into Cash Timing
Operational inputs should drive the forecast, not just historical averages.
Collections from customers: Start with AR aging, then adjust using operational signals.
- If a customer is scheduled to receive a shipment on Thursday, their payment is more likely to land after that, assuming your usual terms.
- If invoices are disputed, move those amounts to a “hold” bucket until resolution is confirmed.
Purchases and vendor payments: Procurement plans tell you what will be billed, but payment terms tell you when cash leaves.
- Example: If you buy materials with net 30 terms but you always pay net 25 for a key supplier, reflect that in the vendor payment schedule.
- If you plan to pause a category of spend, remove the expected cash outflow for weeks when purchase orders would have been paid.
Payroll and taxes: Payroll is predictable, but taxes often aren’t. Employer payroll taxes and payroll-related filings can create mid-month cash dips. Use the actual pay dates and known tax remittance schedules.
Build the Forecast Using a Simple Weekly Template
A practical approach is to create a worksheet with rows for each cash line item and columns for weeks 1–13.
- For each inflow/outflow line, include a source (AR aging, purchase orders, payroll calendar, debt schedule).
- Include an assumption field (e.g., “collections assume 70% of invoices paid within 30 days; disputed invoices held”).
Here’s a compact example of how a single week rolls up:
- Beginning cash (Week 3): 2,400,000
- Inflows: 1,050,000
- Customer collections: 900,000
- Other receipts: 150,000
- Outflows: 1,320,000
- Payroll and benefits: 520,000
- Vendor payments: 610,000
- Rent and utilities: 120,000
- Taxes: 70,000
- Net cash movement: -270,000
- Ending cash (Week 3): 2,130,000
Add Operational Detail Without Making It Unmanageable
The forecast should be detailed enough to explain variances.
- Split customer collections into at least three buckets: current, 30–60 days, and over 60 days.
- Split vendor payments into priority and non-priority categories. Priority vendors get modeled with tighter timing; non-priority can be modeled with a payment window.
Example: If you know a non-priority vendor typically gets paid within a 45-day window, you can model a range by week and then lock the first two weeks to actual payment runs.
Use a Variance Loop to Keep the Forecast Honest
At week-end, compare forecasted vs actual cash movement and record why the difference happened.
- If collections were lower, check whether shipments slipped or disputes increased.
- If outflows were higher, check whether purchase orders were accelerated or whether invoices arrived earlier than expected.
This loop improves the forecast without changing the underlying method.
Mind Map: Assumptions That Must Be Logged

Practical Output: Funding Gap by Week
Once you have ending cash by week, compute a funding gap against a minimum cash threshold (for example, a working minimum needed to avoid operational disruption). The gap tells you which week needs attention, and the line-item drivers tell you why. That’s the difference between a forecast that reports numbers and one that helps decisions.
4.2 Working Capital Optimization Through Receivables and Payables
Working capital is the cash tied up between paying suppliers and collecting from customers. Receivables and payables are the two main levers because they sit closest to the daily cash cycle. The goal is not to “squeeze” people; it’s to align payment timing with delivery reality and contract terms, so cash arrives when it’s actually needed.
Core Concepts and Metrics
Start with three practical measures:
- Days Sales Outstanding (DSO): how long, on average, you wait after invoicing to receive cash.
- Days Payables Outstanding (DPO): how long you take to pay suppliers after receiving goods or services.
- Cash Conversion Cycle (CCC): the net time cash is trapped, often summarized as DSO + (inventory days) − DPO.
A useful mental model: receivables are a “collection process,” payables are a “payment process.” Both can be improved with better controls, clearer rules, and fewer exceptions.
Receivables Optimization Foundations
Receivables improve when invoices are accurate, delivered promptly, and collected with consistent follow-up.
-
Invoice accuracy and delivery speed
- Build a checklist that matches invoice lines to purchase orders and delivery confirmations.
- Example: if a customer disputes because the invoice references the wrong contract or includes a line item that was never shipped, the invoice may sit for weeks. Fixing the mapping rules can reduce disputes and shorten DSO.
-
Credit terms discipline
- Use a simple credit policy: approve terms based on creditworthiness and payment behavior, not just sales volume.
- Example: a customer with a history of late payment gets net 30 instead of net 60. The sales team still closes the deal, but the cash cycle becomes predictable.
-
Collection cadence with clear ownership
- Assign a collector to a customer segment and define escalation steps by aging buckets.
- Example: invoices 1–15 days late get a friendly reminder; 16–30 days late triggers a dispute check; 31+ days late triggers a formal notice and management review.
-
Dispute prevention and resolution
- Track disputes by cause: pricing, quantities, service dates, tax treatment.
- Example: if most disputes come from service start dates, fix the service confirmation workflow rather than repeatedly correcting invoices.
Advanced Receivables Techniques
Once the basics are stable, you can refine timing and reduce friction.
- Invoice batching rules: avoid sending invoices in irregular waves. If you invoice weekly, customers can plan payments weekly too.
- Partial billing where appropriate: for long projects, bill milestones that match measurable deliverables.
- Customer-specific payment instructions: store remittance details and ensure invoices always include the same payment reference format.
Example Workflow for Receivables
A mid-sized manufacturer notices DSO rising from 45 to 58 days. The team finds that invoices are sent 7–10 days after shipment because delivery confirmations are delayed. They implement a rule: delivery confirmation must be posted within 24 hours of receipt. Within one month, invoice issuance aligns with shipment, disputes drop, and DSO stabilizes.
Payables Optimization Foundations
Payables improve when you pay on time for the right reasons and avoid unnecessary holds.
-
Match discipline with a controlled tolerance
- Use three-way matching where feasible: PO, receipt, and invoice.
- Example: if invoices frequently fail matching due to minor quantity differences, define an allowed tolerance and require exception handling only when differences exceed it.
-
Supplier onboarding and invoice format consistency
- Standardize required fields: PO number, tax IDs, bank details, and service period.
- Example: a supplier sending invoices without PO numbers forces manual lookup and delays payment, which can increase DPO without improving cash.
-
Payment scheduling and batch processing
- Run payments on a calendar with cutoffs. This reduces last-minute approvals and prevents missed discounts.
- Example: if you take early payment discounts, schedule payments so the discount window is respected without paying everything early.
-
Approval workflow that prevents “zombie invoices”
- Track invoices in a status dashboard: received, matched, pending approval, on hold, ready to pay.
- Example: if invoices sit “pending approval” for 20 days, the issue is not supplier behavior; it’s internal bottlenecks.
Advanced Payables Techniques
- Strategic use of terms: negotiate terms that reflect delivery and service performance.
- Discounts with math, not vibes: only take discounts when the effective cost of capital is favorable.
- Avoiding supplier harm: extend terms only when service levels and dispute rates are controlled.
Example Workflow for Payables
A retailer extends DPO from 35 to 50 days by delaying payments. Cash improves briefly, but suppliers start shipping partial orders and lead times worsen. The fix is to pay reliably for matched invoices while targeting term renegotiations for specific suppliers with stable performance. DPO returns to a healthier range, while operational continuity improves.
Mind Map: Receivables and Payables Optimization
Integrated Operating Rhythm
To keep the two levers working together, run a weekly cycle: review receivables aging and dispute counts, review payables status and approval bottlenecks, and reconcile both to the cash forecast. When receivables collections improve, you can pay suppliers more predictably without stretching terms. When payables processing improves, you reduce internal delays that can otherwise mask cash needs. The result is a cash cycle that behaves like a system, not a series of urgent exceptions.
4.3 Inventory Rationalization and Supply Chain Payment Controls
Inventory rationalization is the part of restructuring that quietly prevents tomorrow’s cash crisis from becoming today’s cash crisis. The goal is simple: reduce tied-up cash and avoid paying for goods that won’t sell, while keeping enough stock to serve customers and avoid production stoppages.
Inventory Rationalization Foundations
Start with a clear definition of “inventory” in your business. Raw materials, work-in-progress, finished goods, spare parts, and in-transit items behave differently, so treat them as separate pools. Then set two constraints: (1) service level targets for critical items, and (2) cash limits for noncritical items. If you skip either, you’ll either starve the business or keep too much stock “just in case.”
A practical first step is to build a one-page inventory map by category and location. For each category, capture on-hand quantity, committed quantity (purchase orders and production commitments), lead time, and unit cost. This turns inventory from a spreadsheet blob into a set of decisions.
Segmentation Using Usage and Criticality
Use a two-axis approach: demand usage (how often and how much you consume) and criticality (what happens if you run out). A fast-moving but noncritical item can be reduced aggressively. A slow-moving but critical component may require a minimum safety stock even if overall levels drop.
Example: A manufacturer has a fast-moving packaging material used daily, but it can be sourced from two suppliers. It can be reduced quickly by negotiating shorter order cycles and lowering safety stock. Meanwhile, a specialized sensor used in a single product line may be slow-moving but critical; you keep a smaller safety stock and prioritize supplier reliability.
Rationalization Tactics That Actually Move Cash
-
Reduce excess and obsolete inventory by identifying items with no consumption over a defined window (for example, 90–180 days depending on your cycle). Create a disposition plan: return to vendor where possible, rework if quality allows, sell at a controlled discount, or scrap with documented approvals.
-
Right-size reorder points using lead time and consumption variability. If lead time is 6 weeks and consumption is stable, your reorder point should reflect that reality. If lead time is erratic, you need tighter supplier controls or smaller, more frequent orders.
-
Shorten cash conversion by aligning purchase orders with actual sales forecasts and production schedules. If your sales plan is unreliable, use a rolling horizon and cap the maximum committed spend per week.
-
Consolidate SKUs when multiple items serve the same function. Even a modest SKU reduction can cut safety stock and simplify purchasing.
Example: A distributor carries 12 similar fasteners. By standardizing to 2 equivalents and adjusting customer ordering guidance, it reduces safety stock across the board and frees cash without changing customer service.
Supply Chain Payment Controls
Payment controls are how you stop cash from leaking out through “automatic” approvals. The key is to separate payment authorization from payment execution.
Begin with a three-step workflow:
- Match: confirm the invoice matches the purchase order and receipt (quantity, part number, and agreed price).
- Validate: check whether the item is still needed based on the current inventory plan and production schedule.
- Approve: route exceptions to a small group with clear authority limits.
This prevents paying for items that are no longer required after rationalization decisions.
Mind Map: Inventory Rationalization and Payment Controls
Example Workflow with Numbers
Assume a company has $2.0 million in monthly supplier spend. After segmentation, it identifies $450,000 of excess and obsolete inventory risk and $300,000 of noncritical items that can be reduced without hurting service.
It implements weekly spend caps: for noncritical categories, approvals are limited to 60% of the prior week’s run rate until inventory levels fall. For critical categories, approvals follow a minimum stock rule tied to lead time.
On the payment side, invoices are paid only after three-way match and validation against the updated inventory plan. If a supplier invoices for a cancelled PO line, it is held for exception review rather than paid automatically. This turns rationalization decisions into cash protection.
Operational Metrics That Keep the System Honest
Track a small set of measures:
- Inventory days by category (not just total inventory).
- Stockout incidents for critical items.
- Obsolete inventory resolved as a dollar amount, not just units.
- Invoice exception rate and time to resolution.
- Committed spend vs cap for weekly purchasing.
When these metrics move together, you know the controls are working as intended: less cash trapped, fewer surprises, and fewer invoices slipping through because “that’s how we always did it.”
4.4 Capex Suspension and Spend Governance With Approval Thresholds
When liquidity is tight, capex is often the first lever because it can usually be paused without breaking day-to-day operations. The trick is to pause the right things, keep critical work moving, and prevent “temporary” spending from becoming permanent. This section lays out a practical governance approach that starts with fundamentals and ends with execution-ready controls.
Foundational Principles for Capex Suspension
- Separate maintenance from growth. Maintenance capex keeps assets safe and compliant; growth capex improves capacity or market position. Suspension should focus on growth first.
- Define “must-pay” versus “nice-to-have.” If a spend item affects safety, legal compliance, or core production continuity, it belongs in the must-pay bucket.
- Use time-boxed approvals. A suspension without a review cadence turns into a blanket freeze that later becomes hard to unwind.
A simple example: a manufacturer can pause a new warehouse build (growth) but cannot pause replacing a failing boiler control system (maintenance and safety). Both are capex, but only one is allowed to stop.
Spend Governance Architecture
Spend governance works best when it is layered:
- Category rules: pre-set treatment by spend type (capex, opex, contractor services).
- Threshold rules: approval authority based on dollar amount and risk level.
- Workflow rules: required documents and sign-offs before commitments are made.
A typical governance set includes a Spend Request Form, a Budget Line Reference, a Funding Source, and a Risk Classification. If any of these are missing, the request does not move forward.
Approval Thresholds That Actually Prevent Drift
Approval thresholds should reflect both amount and impact. A small purchase can be high-risk if it creates compliance exposure or locks the company into long-term obligations.
Use a two-dimensional approach:
- Amount bands (example):
- Under $25k: Department head approval
- $25k–$100k: Finance + Department head
- $100k–$500k: CFO approval
- Over $500k: CFO + Board committee or designated governance group
- Risk tags (example):
- Safety and compliance
- Operational continuity
- Contractual commitment length (e.g., multi-year)
- Vendor concentration risk
Example: a $60k contractor to repair a production line is operational continuity and should require Finance + Department head. A $60k “consulting” scope that creates a multi-year contract should be treated as higher risk even if the amount is the same.
Capex Suspension Rules with Clear Exceptions
Create a written policy with explicit exceptions so teams know what is allowed during the suspension window.
- Default rule: all non-critical capex is paused.
- Exception 1: safety and regulatory compliance projects.
- Exception 2: projects that prevent loss of production for a defined period.
- Exception 3: projects already under contract where termination costs are higher than completion costs.
To keep it concrete, define a production continuity threshold such as: “If the project prevents downtime exceeding 10 production days, it qualifies for exception.”
Documentation Requirements for Fast Decisions
To avoid slow approvals, require a small set of documents that answer the same questions every time:
- Scope and deliverables: what will be built or fixed.
- Cost breakdown: labor, materials, subcontractors.
- Funding and timing: when cash is needed.
- Impact statement: safety, compliance, downtime avoidance, or contract risk.
- Alternatives considered: why suspension is not workable for this item.
Example: for a compliance exception, the request should cite the specific regulation requirement and show how the project addresses it. For an operational continuity exception, it should quantify downtime avoided and the cash cost of that downtime.
Mind Map: Capex Suspension and Spend Governance
Implementation Mechanics and Control Loops
- Issue a suspension memo with a start date (use a date like April 15, 2026). Include the exception criteria and the approval matrix.
- Stand up a weekly spend review. The review should focus on new requests and any exceptions granted.
- Track commitments separately from invoices. Liquidity stress often comes from purchase orders and contract commitments, not just bills.
- Maintain a decision log. Each exception should record the reason, the risk tag, the approver, and the cash impact.
Example: a team may receive an invoice for a paused project months later. If the decision log shows the project was never approved, Finance can challenge the commitment trail and prevent future leakage.
Practical Example: Applying the Thresholds
A retail chain has three capex requests:
- $18k replacement of broken store signage fixtures: under threshold, department head approval.
- $140k upgrade to fire suppression system in two locations: safety and compliance tag, CFO approval.
- $320k new point-of-sale hardware rollout with a 24-month vendor contract: amount band requires CFO approval, and the multi-year commitment increases risk classification, so the request also needs Finance review of contract terms.
The result is not just “stop spending.” It is controlled spending with reasons that can be audited, explained, and acted on quickly.
4.5 Managing Payroll Taxes and Critical Vendor Continuity
When a company is stabilizing cash, payroll taxes and critical vendors are often the first “quiet” drains. They don’t always show up as large line items, but they can trigger immediate penalties, service interruptions, and employee churn. The goal is simple: keep payroll running, keep statutory obligations current, and prevent vendor failures that would stop production or customer service.
Core Principles for Cash-Safe Compliance
Start with a clear rule: payroll taxes are not discretionary. If cash is tight, the question is not whether to pay, but how to sequence payments and document decisions. Create a tax obligation register that lists each tax type, due date, responsible party, and payment method. Then map each obligation to the cash source that will fund it.
A practical way to avoid surprises is to separate obligations into three buckets:
- Must Pay Now: taxes due within the next payroll cycle, plus any amounts already past due.
- Must Pay Soon: taxes due in the following one to two cycles.
- Can Reconcile Later: items that can be corrected through filings or adjustments without immediate operational impact.
This bucket approach prevents the common mistake of treating all tax items as equally urgent.
Payroll Tax Workflow That Prevents Missed Dates
Build a repeatable workflow around each payroll run. For every payroll, you need four outputs: gross payroll totals, statutory withholdings, employer taxes, and remittance amounts. Then you need a payment calendar that ties those outputs to actual remittance dates.
Use a simple internal checklist:
- Confirm payroll completion and verify employee counts and pay periods.
- Recalculate withholdings from payroll registers to catch data-entry errors.
- Reconcile employer tax accruals against prior payroll accruals.
- Approve remittance amounts with a finance lead who is not the payroll preparer.
- Schedule payment and record the confirmation number in the obligation register.
If you have multiple jurisdictions, standardize the register fields so each tax line has the same structure. That makes it easier to spot gaps when you compare expected vs. paid amounts.
Managing Vendor Continuity Without Paying Everyone Equally
Critical vendors are those whose failure stops operations or creates disproportionate cost. Examples include payroll processors, utilities, key logistics providers, essential maintenance contractors, and vendors supplying components with long lead times.
Create a vendor continuity matrix with two axes: operational criticality and substitutability. A vendor that is critical and hard to replace should be treated like a “continuity obligation,” not a normal accounts payable item.
Then align payment timing with the vendor’s risk triggers. Many vendors care about specific thresholds: partial payments to keep service active, confirmation of upcoming payments, or proof of payment timing. Your accounts payable team should communicate using a consistent template that states what you can pay now and what you will pay next, without overpromising.
Integrated Mind Map for Sequencing and Control
Mind Map: Payroll Taxes and Critical Vendor Continuity
Example: Sequencing During a Tight Month
Assume a company runs payroll every two weeks. On the first payroll cycle of the month, cash is sufficient for net payroll but not for all employer taxes. The finance team does the following:
- Updates the tax obligation register for the next remittance date.
- Classifies employer taxes due within the next two weeks as Must Pay Now.
- Pays those taxes first, even if it means delaying non-critical vendor invoices.
For vendors, the team identifies one logistics provider that is critical and hard to replace. Instead of paying all vendors proportionally, it pays a partial amount that keeps service active for the next two weeks and sends a written schedule for the remaining balance.
The key is that both actions are tied to the same sequencing logic: keep statutory remittances current and prevent operational stoppage.
Example: Handling an Error Before It Becomes a Penalty
Suppose payroll withholdings were calculated correctly, but the remittance amount was entered into the payment system using the wrong tax rate. The company catches it during the independent approval step. Because the payment is not yet submitted, the correction is quick and the register is updated.
If the error were discovered after payment submission, the company would still need to file adjustments, but the immediate penalty risk would be higher. That is why the workflow emphasizes recalculation and independent approval before payment.
Control Points That Make the System Stick
To keep this from becoming a one-time scramble, add two control points:
- Expected vs. Paid Reconciliation: after each remittance, compare what should have been paid based on the payroll run.
- Exception Log: record any late payments, partial vendor payments, and the reason, along with the mitigation step taken.
A short exception log prevents repeated mistakes and gives leadership a factual view of what is happening, not a guess.
Finally, document decisions in plain language. If you paid a vendor partially or prioritized certain taxes, the register should show the operational reason and the timing logic. That clarity reduces friction with internal teams and keeps the stabilization effort grounded in reality.
5. Operational Restructuring and Performance Recovery Planning
5.1 Designing a Restructuring Operating Model and Accountability
A restructuring operating model answers two practical questions: who decides, and how work moves from diagnosis to executed actions. Without that, teams produce spreadsheets and meeting notes while cash keeps doing what cash does—leaving.
Core Principles for a Working Model
Start with decision clarity. Every major action should have a single accountable owner, even if multiple teams contribute. Use a simple rule: if a decision can be delayed, it will be; if it has no owner, it will be debated.
Next, design for speed with guardrails. Restructuring work often involves trade-offs between liquidity, legal risk, and operational continuity. Your model should define approval thresholds so routine actions don’t wait for the top, while high-impact actions do.
Finally, connect operating work to financial outcomes. The operating model should translate operational moves—pricing changes, vendor terms, headcount adjustments—into measurable cash and margin effects.
Operating Model Components
1. Workstreams with clear outputs
Common workstreams include: Cash and Working Capital, Operations Performance, Cost and Organization, Legal and Claims, Capital Structure, and Communications. Each workstream must produce tangible outputs such as a weekly cash forecast update, a cost takeout plan with timing, or a draft term sheet.
2. A decision forum with defined cadence
Create a Restructuring Steering Committee that meets on a fixed schedule (for example, twice weekly). It reviews exceptions, approves high-impact items, and removes blockers. The committee should not be a status meeting; it should be a decision meeting.
3. An execution layer with daily rhythm
Below the steering committee, use a daily standup for operational blockers and a weekly program review for deliverables. The execution layer tracks actions to completion, not to “progress.”
4. A single source of truth
Choose one place for current versions of the cash forecast, KPI dashboard, and action log. If people use different files, you don’t have a model—you have a choose-your-own-adventure.
Accountability Design Using RACI
RACI clarifies roles without turning the organization into a bureaucracy. For each key deliverable, define:
- Responsible: the person who does the work.
- Accountable: the person who owns the outcome.
- Consulted: people whose input is required.
- Informed: people who need visibility.
Example: For a vendor payment prioritization policy, the Cash and Working Capital lead is Responsible for the draft, the CFO or turnaround finance lead is Accountable for the final policy, Legal is Consulted for any constraints, and Procurement and Operations are Informed.
Mind Map: Operating Model and Accountability
Practical Example: From Model to Action
Assume a mid-sized manufacturer needs immediate liquidity stabilization and a structured plan for creditor negotiations. The model starts with a 30-day stabilization sprint.
- Cash and Working Capital workstream owns a weekly cash forecast updated every Monday and a payment prioritization policy updated when customer collections or supplier terms change.
- Operations Performance workstream owns a 90-day operating plan with KPIs such as on-time delivery, defect rate, and order backlog. Each KPI has a named owner and a target range.
- Cost and Organization workstream owns a cost takeout list with timing, one-time costs, and savings validation steps. For example, a shift from two shifts to one in a low-volume product line includes a transition schedule and a reallocation plan for remaining production.
- Legal and Claims workstream owns a document readiness checklist and claim treatment inputs. It also defines what information must be available before any major transaction is signed.
- Capital Structure workstream owns the liability mapping outputs and drafts negotiation positions based on the expected cash and operational recovery.
The steering committee receives a one-page reporting pack: cash position, forecast variance, top risks, and the list of items requiring approval. Everything else is handled in the workstreams.
Governance Artifacts That Prevent Chaos
Use three lightweight artifacts:
- Action log with owner, due date, and completion criteria.
- Decision log capturing what was decided, by whom, and why.
- Risk register with mitigation owners and triggers.
A good model makes it easy to answer: “What changed since last week?” If the answer requires searching through emails, the operating model isn’t doing its job.
Implementation Sequence
Begin with the decision structure, then assign workstream owners, then define the execution rhythm. Only after that should you finalize RACI and reporting packs, because roles and cadence determine what information actually matters. For a practical start date, set the first steering committee meeting for April 15 and run the initial two-week cadence as a pilot before tightening thresholds and escalation rules.
5.2 Revenue Stabilization Through Pricing and Customer Retention
Revenue stabilization starts with two questions: what customers will pay today, and what will make them stay long enough to pay it. In a turnaround, you want pricing changes that improve cash quickly without creating avoidable churn. You also want retention actions that reduce service friction and protect the accounts that keep the lights on.
Pricing Foundations That Prevent Accidental Churn
Begin by separating pricing into three layers: list price, contract terms, and commercial execution. Many turnarounds focus only on list price, then wonder why negotiated discounts and billing practices keep revenue flat.
-
List price sanity check: confirm that published rates match the current product catalog and packaging. If your “standard” offering is no longer standard, customers will treat invoices as surprises.
-
Contract terms inventory: identify which discounts, rebates, and price protections are still active. A common example is a contract that grants a 15% discount until a volume threshold is reached; if volume is already below the threshold, you may be over-discounting.
-
Execution consistency: verify quote-to-order and order-to-invoice alignment. A simple control is to sample 20 recent invoices and compare them to the approved quotes. If the difference is systematic, fix the workflow before changing pricing.
A practical rule: change only one variable at a time. If you adjust price and also change packaging and billing, you won’t know which lever caused the result.
Quick Pricing Moves with Measurable Cash Impact
Use a short pricing sprint with clear outputs: updated price sheets, revised quote rules, and a customer communication plan.
-
Reprice where you have evidence: target accounts where you can show margin compression from outdated discounting. Example: a mid-market customer receives 20% off because of an old “intro” deal. If their current usage is stable and your cost base has risen, you can propose a step-down schedule rather than a sudden increase.
-
Standardize discount governance: create discount bands tied to approval levels. Example: reps can offer up to 5% without escalation; 5–12% requires a margin check; above 12% requires finance sign-off. This reduces “hero pricing” that varies by salesperson.
-
Introduce price protection only where it matters: if customers fear sudden increases, offer limited-duration protections tied to renewal dates. Example: a 6-month price hold for existing customers who sign a renewal or updated service level.
-
Fix billing mechanics: if revenue is delayed, pricing may be fine but collections are not. Example: if invoices are issued after a milestone that is routinely missed, shift to monthly billing for the interim period while you renegotiate milestone definitions.
Customer Retention That Targets the Right Accounts
Retention work should be account-specific, not generic. Start with a churn-risk segmentation based on three signals: service friction, commercial risk, and payment behavior.
-
Service friction: track support tickets per account and the time to resolution. Example: if one customer’s tickets spike after a product update, the retention plan should include targeted enablement or a workaround, not a discount.
-
Commercial risk: identify accounts with expiring terms, volume uncertainty, or frequent quote renegotiations. Example: a customer that repeatedly asks for “same price, different terms” may be signaling budget pressure rather than dissatisfaction.
-
Payment behavior: separate “slow pay” from “dispute-heavy” accounts. Example: if disputes are driving delays, the retention plan should include invoice detail improvements and clearer acceptance criteria.
Retention actions should be bundled into a small set of repeatable plays.
Integrated Retention Plays That Work with Pricing
-
Renewal offers with clear trade-offs: pair pricing adjustments with concrete service commitments. Example: if you reduce a discount, offer faster turnaround times or a dedicated onboarding call.
-
Usage-based recovery for underutilized accounts: when customers aren’t using the product fully, retention improves by removing friction to adoption. Example: offer a short “implementation reset” and tie the discount to achieving agreed usage milestones.
-
Dispute prevention as retention: improve invoice clarity and reduce back-and-forth. Example: add a one-page invoice summary that maps line items to the contract schedule.
-
Account-level escalation paths: define who handles billing disputes, delivery issues, and executive concerns. Example: a named billing contact plus a two-day response SLA for disputes prevents small issues from becoming cancellations.
Example Workflow for the First 30 Days
Week 1: sample invoices, map active discounts, and confirm catalog alignment. Week 2: build discount bands and update quote rules; draft customer messages that explain the change in terms of contract updates and service commitments. Week 3: run retention plays for the top churn-risk accounts, focusing on service friction and dispute prevention. Week 4: review results using three metrics—net revenue retention, discount leakage rate, and dispute rate—then adjust only the levers that moved those numbers.
5.3 Cost Restructuring Through Organizational And Process Changes
Cost restructuring works best when you treat it like a system, not a haircut. Organizational changes reduce the number of decisions and handoffs; process changes reduce the number of errors and rework. Together, they cut costs while keeping the business capable of delivering revenue.
Start with Cost Drivers, Not Department Names
Begin by translating “too expensive” into measurable drivers. Typical drivers include labor hours per unit, defect rates, cycle time, overtime, expedite fees, and vendor spend per purchase order. For example, if a plant’s cost is high, the driver might be that each order takes 18 hours of scheduling work because data is inconsistent. Fixing the data and the scheduling workflow can reduce labor without cutting headcount.
A practical approach is to build a simple driver map for the top three cost lines. For each line, list the operational activities that create it, the inputs those activities require, and the failure points that cause rework. This prevents “cost cutting” from becoming random.
Organizational Changes That Reduce Friction
Organizational restructuring should aim to remove layers and clarify ownership. Three common moves are:
- Consolidate overlapping roles. If both Sales Ops and Finance approve pricing exceptions, you can merge approval into one role with clear thresholds.
- Create single-threaded ownership. Assign one owner for each end-to-end process, such as “order-to-cash.” If multiple teams own fragments, costs rise through coordination overhead.
- Right-size decision rights. Move routine decisions closer to the work. For instance, allow supervisors to approve standard vendor substitutions up to a fixed amount, instead of routing every request to procurement leadership.
Example: A mid-sized distributor had frequent stockouts. The root cause was not inventory levels alone; it was that demand planning, purchasing, and customer service each had partial authority. They created one “replenishment owner” role with authority to adjust reorder points and expedite shipments within predefined guardrails. Within two months, expedite fees dropped because fewer orders were placed late.
Process Changes That Remove Rework
Process changes should target the steps that generate defects, delays, and exceptions. Focus on the “repeat offenders”:
- Hand-offs that require re-entry of data. If customer orders are typed into two systems, errors multiply.
- Approvals that happen after work is started. If procurement approves after a purchase is placed, you pay for mistakes.
- Batch processing that delays feedback. If invoices are reconciled weekly, disputes linger.
A useful method is to run a short value-stream review for one product line or one customer segment. Document the current workflow, then mark each step as value-adding, necessary but non-value-adding, or waste. Waste steps become candidates for elimination, simplification, or automation.
Mind Map: Cost Restructuring Through Organizational and Process Changes
Build a Baseline and Choose the Right Scope
You do not need to fix everything at once. Pick a scope that is large enough to matter and small enough to finish. For example, choose one region’s order-to-cash process or one plant’s procurement-to-pay workflow.
Measure before you change. Track cycle time, cost per transaction, and error rates for at least two weeks. If you cannot measure directly, use proxies such as number of manual corrections, number of escalations, or average time spent on exception handling.
Design Changes with Guardrails
Organizational and process changes can backfire if they remove controls without replacing them. Use guardrails:
- Approval thresholds tied to risk and contract terms.
- Standard exception categories with predefined handling rules.
- Segregation of duties for payments and vendor master changes.
Example: A service company reduced costs by changing how invoices were approved. They moved approval earlier in the workflow and introduced three exception categories: missing documentation, rate mismatch, and duplicate invoice. Each category had a defined resolution owner and turnaround time. The result was fewer late disputes and less time spent chasing paperwork.
Implement in a Tight Loop
Execution should follow a tight loop: pilot, measure, adjust. Start with one team, one process, and one set of metrics. After the pilot, update SOPs, train only the affected roles, and revise the escalation path.
A simple weekly cadence works well: review metric movement, list the top three friction points, and decide whether to change the process, the training, or the decision thresholds. This keeps the work grounded in facts rather than opinions.
Use Examples to Translate Changes Into Savings
To make savings real, connect each change to a cost mechanism:
- Fewer hand-offs → fewer coordination hours.
- Earlier approvals → fewer rework cycles.
- Standard exceptions → faster resolution and lower labor time.
- Single ownership → fewer delays caused by unclear responsibility.
Example: After reorganizing order management into one end-to-end team and standardizing exception handling, a retailer reduced customer credit memo processing time from 10 days to 4 days. That shortened the time cash was effectively “stuck,” and it also reduced labor because fewer cases required repeated investigation.
Cost restructuring through organizational and process changes is not about cutting people first. It is about removing the reasons work becomes expensive, then building an organization that can keep the process running without slipping back into old habits.
5.4 Asset Rationalization Through Divestiture and Shutdown Decisions
Asset rationalization is the part of restructuring where you stop paying for things that do not earn their keep. The goal is not to “sell everything”; it is to convert trapped value into cash, reduce fixed costs, and remove operational complexity that blocks recovery. Decisions should be driven by cash impact, strategic fit, and execution feasibility.
Core Principles for Asset Decisions
Start with a simple rule: every asset decision must answer three questions—what cash it generates or consumes, what it enables operationally, and what it costs to keep it running. For example, a distribution site may look profitable on paper but still drains cash through overtime, frequent repairs, and slow inventory turns. In that case, the site might be a candidate for shutdown or divestiture even if accounting profit exists.
Next, separate “asset value” from “business value.” A machine can be sold quickly, but the plant that houses it may still be needed to serve customers. Conversely, a business unit might be worth more as a going concern than as a bundle of assets. Treat divestiture and shutdown as different tools with different timelines and stakeholder impacts.
Finally, define decision boundaries early. If the company is under time pressure, prioritize actions that improve liquidity within weeks: stopping nonessential leases, reducing maintenance spend on underused equipment, and exiting low-volume product lines. Longer actions like complex carve-outs can wait until the cash runway is stable.
Step 1: Build an Asset Inventory with Decision Attributes
Create an asset register that includes not just book value, but also cash drivers and constraints. For each asset or asset cluster, capture:
- Operating cash impact: maintenance, utilities, labor, and working capital tied to the asset
- Revenue linkage: which products or customers depend on it
- Disposal friction: permitting, environmental remediation, contract assignment, and logistics
- Legal and contractual constraints: leases, take-or-pay agreements, and supplier exclusivity
- Execution effort: staffing required, third-party bids, and internal downtime
Example: A retail location might have low sales but high lease termination costs. The inventory will show that shutting it down saves payroll and inventory carrying costs, but the lease makes the net cash benefit smaller than expected. That pushes the decision toward subleasing, lease assignment, or a phased exit.
Step 2: Classify Assets Into Action Buckets
Use a three-bucket approach to avoid endless debate:
- Divest: assets with clear buyers, manageable transfer steps, and positive net cash from sale
- Shutdown: assets that are not worth operating but can be closed with controlled remediation and minimal stranded costs
- Retain and Optimize: assets that support core operations but need cost reduction, utilization changes, or process improvements
A practical test: if you cannot explain how the asset improves cash within the next reporting cycle, it belongs in divest or shutdown discussions.
Step 3: Evaluate Divestiture Options Systematically
Divestiture decisions should compare alternatives, not just “sell or not sell.” Consider:
- Sale of the asset alone versus sale of the operating unit
- Bulk sale versus piecemeal sale
- Asset sale versus equity sale of a subsidiary
- Competitive bid versus negotiated sale
Example: A regional service business may have a buyer who values the team and customer contracts. Selling the unit as a going concern can preserve revenue continuity and reduce buyer friction, even if the asset-only sale would produce a higher headline price. The right choice depends on transaction costs and the speed needed to stabilize liquidity.
Step 4: Evaluate Shutdown Decisions with Cost-to-Close
Shutdown is not free. Model the full cost-to-close, including:
- Severance and termination costs
- Contract breakage and lease surrender expenses
- Inventory write-downs and disposal costs
- Environmental remediation and compliance obligations
- Transition costs for customers and remaining operations
Example: A manufacturing line may be shut down, but the company still needs to fulfill existing orders. A controlled shutdown plan might include a short “last-time buy” window, then a schedule for order transfer to another plant. This reduces customer disruption while keeping closure costs within budget.
Step 5: Decide the Sequence and Tie It to Liquidity
Sequence matters because cash improvements fund the rest of the plan. A common pattern is:
- Immediate: stop nonessential leases, pause discretionary maintenance, and exit low-value contracts
- Near-term: divest noncore assets with straightforward transfer
- Medium-term: shutdown facilities after customer transition and remediation planning
Use a cash calendar that links each action to expected cash timing. If a shutdown saves monthly cash but requires a large upfront payment, it may still be worth doing—just not first.
Mind Map: Asset Rationalization Decision Flow
Example: Putting It Together in a Facility Decision
A company operates three warehouses. Warehouse C has the lowest utilization and the highest maintenance costs due to aging equipment. The asset inventory shows lease flexibility is limited, but the equipment can be sold quickly and the lease can be assigned to a logistics partner. The decision sequence is:
- Divest equipment immediately to generate cash and reduce maintenance.
- Negotiate lease assignment to avoid a large surrender payment.
- Shutdown operations only after customer orders are transferred to Warehouses A and B.
This approach avoids the common mistake of shutting down first and discovering later that the lease and transition costs consume the cash benefit.
Practical Output: What the Team Should Produce
By the end of this section, the restructuring team should have a short list of assets with recommended actions, a cash calendar showing timing, and a cost-to-close or transaction-cost estimate for each major divestiture or shutdown. The recommendations should be traceable to the inventory attributes, so the plan can survive the inevitable “but what about this contract?” question.
5.5 Implementing a 90-Day Operating Plan With Measurable KPIs
A 90-day operating plan is a short, disciplined bridge between “we need cash now” and “we can run the business again.” The goal is not to write a perfect plan; it’s to create a working system where actions, owners, and results connect tightly. Think of it as a control panel: if a KPI moves the wrong way, you should know which decision to make next.
Step 1: Start with the Operating Logic
Begin by translating the turnaround priorities into a simple chain: inputs → activities → outputs → outcomes. For example, if the priority is liquidity, the chain might be: tighten collections (activity) → higher cash receipts (output) → improved weekly cash balance (outcome). This prevents KPI lists that measure everything except the thing you’re trying to fix.
A practical way to set the chain is to pick one “outcome KPI” for each major workstream:
- Liquidity: weekly net cash burn
- Revenue: cash collected from customers (not just invoices issued)
- Cost: weekly controllable spend vs budget
- Execution: on-time completion rate of critical tasks
Step 2: Build the KPI Set That Can Be Managed
Use a small KPI set with clear definitions. Each KPI needs a formula, data source, reporting cadence, and an owner who can act on it.
KPI selection rules that keep the plan usable:
- One KPI per decision. If two KPIs point to the same decision, merge them.
- Lag-aware measurement. Collections today affect cash later; plan reporting cadence accordingly.
- No vanity metrics. “Number of calls made” is only useful if it ties to a measurable collection outcome.
Example KPI definitions for a cash-focused turnaround:
- Weekly Net Cash Burn = (Cash outflows) − (Cash inflows). Owner: CFO/Controller.
- Current-AR Collection Rate = Cash collected from current invoices ÷ Current invoice balance. Owner: Head of Credit.
- Past-Due Reduction = Prior week past-due balance − current past-due balance. Owner: Credit lead.
Step 3: Convert Priorities Into a 90-Day Workplan
Break the 90 days into three 30-day phases with different emphasis:
- Days 1–30: stabilize and remove blockers
- Days 31–60: execute the repeatable processes
- Days 61–90: lock in controls and finish the first cycle of improvements
Each initiative should include: scope, owner, dependencies, deliverables, and the KPI it influences. If an initiative cannot be linked to at least one KPI, it likely belongs in a later phase or needs re-scoping.
Step 4: Set Targets and Guardrails
Targets should be specific and measurable, not motivational. Use guardrails to prevent “fixing one thing by breaking another.”
Example guardrails for a sales-and-cash recovery:
- If collections improve but customer churn rises, the plan is trading short-term cash for long-term revenue.
- If spend drops but production delays increase, cost cuts are creating future cash problems.
A simple guardrail set might include:
- Customer Service Level: orders shipped on time
- Production Availability: uptime percentage
- Spend Compliance: % of spend under approved thresholds
Step 5: Establish Reporting Rhythm and Decision Rules
A plan fails when reporting becomes a ritual. Use a consistent rhythm:
- Weekly: KPI dashboard review and decision log
- Biweekly: initiative status and dependency resolution
- Monthly: budget-to-actual reconciliation and KPI target recalibration
Decision rules keep meetings short. For instance:
- If weekly net cash burn exceeds the threshold for two consecutive weeks, freeze nonessential spend and escalate collections actions within 48 hours.
- If current-AR collection rate drops below target by more than 5 percentage points, require a root-cause review of top 20 accounts and adjust payment plans.
Step 6: Use a Mind Map to Keep the Plan Coherent
Step 7: Example KPI-to-Initiative Mapping
Example:
-
Outcome KPI: Weekly Net Cash Burn
- Initiative: Collections sprint for top 20 past-due accounts
- KPI driver: Past-Due Reduction
- Supporting actions: payment plan offers, dispute resolution SLA, credit holds policy
- Owner: Head of Credit
-
Outcome KPI: Weekly Controllable Spend vs Budget
- Initiative: Capex suspension with approval thresholds
- KPI driver: Spend Compliance
- Supporting actions: spend request workflow, vendor payment prioritization, contract review for termination options
- Owner: CFO/Procurement lead
Step 8: Make It Real with a Day-One Checklist
On day one, confirm the dashboard structure, assign owners, and publish the weekly meeting agenda. By day seven, every initiative should have a deliverable and a KPI link. By day thirty, you should be able to point to at least one measurable improvement and one process change that will repeat.
A 90-day plan is successful when the organization can answer three questions quickly: What are we measuring? Who can change it? What will we do if it misses?
6. Capital Structure Diagnostics and Liability Mapping
6.1 Inventorying Debt Instruments and Contractual Terms
A restructuring starts with a simple question: what exactly do you owe, to whom, under what rules, and what happens if you miss a payment. Inventorying debt instruments and contractual terms is the step where you stop guessing and start reading the contracts like they’re trying to hide something. (They are.)
Core Inventory Goals
First, capture every debt instrument and quasi-debt obligation that can trigger default, restrict cash, or affect claim priority. Second, translate legal language into operational consequences: payment timing, permitted actions, and remedies. Third, create a single “source of truth” dataset so later models and negotiations don’t contradict each other.
A practical way to structure the inventory is to treat each instrument as a record with consistent fields. For example, for a term loan you record principal, interest rate type, maturity date, amortization schedule, covenants, and events of default. For a lease you record payment amounts, change-of-control provisions, and any cross-default language.
Debt Instrument Coverage
Start broad, then tighten. Include:
- Bank loans and revolving credit facilities
- Senior and subordinated notes
- Convertible instruments and warrants
- Vendor financing, factoring, and supply-chain payables with financing-like terms
- Leases and lease-like obligations
- Guarantees, including upstream and downstream guarantees
- Letters of credit and related reimbursement obligations
- Intercompany debt and settlements that behave like debt
A common miss is “hidden leverage” inside agreements that are not labeled as debt. For instance, a services contract may include termination fees that become payable on default, or a purchase agreement may include price adjustments tied to financial metrics.
Contractual Term Extraction Framework
For each instrument, extract terms in four layers.
-
Economics: principal, interest rate, payment frequency, fees, and any step-ups. If interest is SOFR plus a spread, note the fallback rate language and any spread adjustments tied to leverage.
-
Timing: maturity, amortization, payment dates, and any grace periods. Also record notice periods required for waivers, elections, or redemption.
-
Control and Constraints: covenants, negative pledges, restrictions on liens, asset sales, affiliate transactions, and permitted indebtedness. These terms often determine what you can do during a restructuring without triggering default.
-
Remedies and Triggers: events of default, cross-default provisions, acceleration mechanics, and cure rights. Pay special attention to whether default is automatic or requires notice and whether cure periods exist.
Building the “Terms Matrix”
Create a matrix that lets you compare instruments side-by-side. At minimum, include columns for: obligor, lender/holder, instrument type, governing law, principal amount, interest terms, maturity, covenants, events of default, cross-default scope, and collateral or guarantee coverage.
To keep the matrix usable, standardize covenant names. For example, map “Consolidated Leverage Ratio” and “Net Leverage Ratio” into a normalized label, then store the exact definition separately. This prevents later confusion when one covenant uses EBITDA and another uses adjusted EBITDA.
Collateral and Priority Mapping
Inventorying terms is not complete without understanding how claims line up. Record:
- Secured vs unsecured status
- Collateral type and description (all assets, specific receivables, real estate, equipment)
- Perfection status if known (filings, control agreements)
- Guarantees and their scope
- Intercreditor agreements that govern lien sharing and payment waterfalls
If two instruments share collateral, the intercreditor agreement may restrict enforcement or require proceeds to be applied in a specific order. That affects negotiation leverage and the feasibility of certain exchanges.
Mind Map: Debt Inventory and Contract Terms
Example: Turning Contract Language Into Action
Assume a company has a revolving credit facility with a quarterly leverage covenant and a cross-default clause tied to “any other indebtedness exceeding $10 million.” The inventory record should translate this into operational triggers:
- Covenant measurement date: end of quarter
- Reporting deadline: 45 days after quarter-end
- Default trigger: leverage ratio above the threshold at measurement date
- Cure: 30 days after notice of breach
- Cross-default: if another instrument defaults and the default is not cured within its own grace period
Now the restructuring team can plan around notice timing and cure windows. Without this translation, you might treat a covenant breach as a one-time issue, when it actually cascades into cross-default.
Example: Collateral Description That Matters
If a secured lender’s collateral clause says “substantially all assets,” you still need to record what is excluded. Some agreements exclude cash, certain receivables, or assets subject to existing liens. That affects whether a proposed asset sale requires lender consent and whether proceeds can be used freely.
Output Artifacts to Produce
By the end of this section, you should have:
- A complete instrument list with unique identifiers
- A terms matrix with standardized fields
- A covenant and default trigger summary per instrument
- A collateral and priority map that aligns with intercreditor rules
These artifacts become the backbone for later valuation, negotiation strategy, and plan drafting. If the inventory is wrong, everything downstream becomes a well-organized argument with the wrong facts.
6.2 Analyzing Maturity Walls and Refinancing Constraints
A maturity wall is a cluster of debt payments due in a short window—often 12 to 36 months—that forces a company to refinance, sell assets, or raise cash quickly. Refinancing constraints are the reasons refinancing may fail even when the company has a plan on paper: lender unwillingness, covenant limits, insufficient collateral value, or market pricing that makes the deal uneconomic.
Step 1: Build a Maturity Ladder That Shows Timing Pressure
Start with a debt inventory that includes principal, amortization, interest-only periods, and any scheduled maturities. Then lay it out by month or quarter. The goal is to see “cash due” rather than “debt outstanding.”
Example: A company has $120 million of term debt. $60 million matures in 9 months, $30 million in 15 months, and $30 million in 24 months. Even if the company’s total leverage looks manageable, the first $60 million creates the wall. If operating cash flow covers only $10 million per quarter, the company needs either $60 million of refinancing or a combination of asset sales and cost actions that produce the missing cash.
Step 2: Translate Maturities Into a Refinancing Requirement
For each maturity date, calculate the refinancing requirement as:
- Principal due
- Minus expected cash available at that date (from the approved cash forecast)
- Plus any mandatory fees or make-whole amounts triggered by refinancing or prepayment
This turns a calendar into a funding gap. If the gap is covered by cash on hand, the wall is smaller. If the gap depends on new borrowing, the wall is real.
Step 3: Identify the Constraint Type for Each Funding Source
Refinancing usually comes from one or more channels. Each channel has different failure modes.
- Bank revolver capacity: constrained by borrowing base, collateral coverage, and springing covenants.
- Term loan refinancing: constrained by leverage tests, maturity mismatch, and lender appetite.
- Bond refinancing: constrained by credit spread levels and investor demand.
- Asset sales: constrained by buyer availability, valuation discounts, and time to close.
- Equity or preferred instruments: constrained by dilution tolerance and governance approvals.
Example: A firm assumes it can “use the revolver.” The borrowing base is tied to eligible receivables and inventory. If the company’s working capital deteriorates, the borrowing base shrinks right when the maturity hits. The wall is not just timing; it is collateral quality.
Step 4: Stress the Refinancing Process, Not Only the Outcome
Even if a refinancing is theoretically possible, execution risk can break the plan. Model the process timeline: documentation, approvals, and closing conditions. Then test whether the company can meet those conditions before the maturity date.
Practical checks:
- Are there notice periods for prepayment or amendment?
- Do covenants require compliance immediately before closing?
- Is there a minimum liquidity covenant that must be met on a specific measurement date?
- Are there restrictions on liens, guarantees, or asset transfers that block the proposed structure?
Example: A lender requires a liquidity covenant tested at month-end. The company’s forecast shows compliance in the quarter overall, but not at the measurement date. The refinancing can fail even though the company “looks fine” on quarterly averages.
Step 5: Connect Maturity Walls to Covenant and Security Mechanics
Maturity walls often coincide with covenant pressure. If the company is near a leverage or interest coverage threshold, refinancing may be blocked because the new money would violate the same tests.
Also map security and priority:
- If secured lenders have first liens, unsecured lenders may not accept terms that reduce their recovery.
- If collateral is already fully pledged, incremental borrowing may require releases or intercreditor amendments.
Example: A company’s revolver is secured by substantially all assets. It plans to refinance the term loan with a new secured tranche. The intercreditor agreement may require consent from the revolver agent for lien priority changes, adding time and negotiation friction.
Step 6: Quantify “Refinancing Capacity” Using a Simple Scorecard
Create a scorecard per maturity bucket that rates feasibility based on cash, collateral, covenants, and process timing.
- Cash coverage: how much of the due amount is already funded
- Collateral coverage: borrowing base headroom or asset sale realizability
- Covenant headroom: distance to the next test date
- Execution time: whether approvals and documentation fit the calendar
This scorecard prevents the common mistake of treating all maturities as equally solvable.
Mind Map: Maturity Walls and Refinancing Constraints
Example: Turning Analysis Into an Action List
Suppose a company faces $50 million due in 10 months. Cash forecast covers $15 million. The remaining $35 million depends on refinancing.
- Revolver: borrowing base headroom is only $10 million, and it is expected to shrink due to receivables aging.
- Term loan: covenant headroom is negative at the next measurement date.
- Asset sales: two non-core assets could raise $25 million, but closing is likely to take 6 to 9 months.
A coherent response is to combine actions that address the specific constraints: accelerate receivables collection to protect borrowing base, negotiate covenant relief or amend terms ahead of the measurement date, and structure asset sales with binding purchase agreements that reduce execution uncertainty. The analysis is systematic because each action maps to a constraint category rather than a generic “raise liquidity” goal.
6.3 Assessing Intercreditor Agreements and Relative Priority
Intercreditor agreements answer a simple question with very non-simple paperwork: who gets paid first when the company runs out of money. For restructuring work, you need to understand not only the legal priority of claims, but also the contractual behavior that priority triggers—especially across secured debt, unsecured debt, and any superpriority or priming financing.
Core Concepts You Must Map Before Modeling
Start with the hierarchy of rights. Relative priority usually has three layers: (1) statutory priority (for example, certain taxes or insolvency expenses), (2) security interests and their perfection, and (3) contract-defined intercreditor rules. Intercreditor agreements sit in layer three, but they often control how layer two plays out in practice.
Next, distinguish “payment priority” from “control rights.” Payment priority determines who receives cash first. Control rights determine who can steer enforcement, consent to amendments, or block certain actions. A creditor can be high in payment priority but still lose leverage if the agreement restricts enforcement or requires shared decision-making.
Finally, identify the agreement’s scope. Some intercreditor agreements cover only specific debt classes; others cover future issuances or refinancings. If the scope is narrow, a restructuring may accidentally create a new class of debt that is outside the agreement’s protections.
What to Extract from the Intercreditor Agreement
Build a checklist that you can reuse across deals.
- Lien and collateral sharing mechanics: Who holds the security agent role, how collateral is allocated, and whether proceeds are distributed by waterfall or by class.
- Enforcement triggers and standstill: When a senior creditor can enforce, whether junior creditors must wait, and how long the standstill lasts.
- Release and waiver rules: Whether junior creditors must consent to releases of collateral, and whether releases can be partial.
- Amendment and consent thresholds: Which amendments require unanimous consent, which require majority, and which are “sacred rights” requiring class consent.
- Priming and superpriority permissions: Conditions under which new money can prime existing liens, including required notices, valuation or coverage tests, and permitted collateral packages.
- Payment block and turnover provisions: Whether junior creditors must turn over recoveries received in breach of the agreement.
- Subordination language quality: Whether subordination is “payment subordination” only or also includes “liquidation subordination,” which affects insolvency distributions.
Relative Priority in Practice Through a Simple Example
Assume Company A has two secured debt tranches: Senior Secured (Class S) and Junior Secured (Class J). The intercreditor agreement states that Class J is subordinated in payment to Class S and must not enforce until Class S has either enforced or waived enforcement.
Now suppose the company misses interest payments and a creditor wants to accelerate. If Class J accelerates first, the agreement may require Class J to reverse actions, refrain from enforcement, or turn over any proceeds. For restructuring planning, this matters because a “fast enforcement” threat may be contractually constrained, reducing its usefulness as a negotiation lever.
Mind Map: Intercreditor Agreement to Priority Outcome
Advanced Details That Commonly Break Models
First, watch for class definitions that do not match your debt inventory. A tranche may be “Junior Secured” in the intercreditor agreement but “secured” in your internal spreadsheet. If you misclassify, your waterfall will look correct while the legal reality is wrong.
Second, confirm whether the agreement permits structural subordination. Some groups rely on upstream guarantees or collateral held at a parent level. If collateral sits in one entity while the debt is issued at another, priority can shift based on guarantee coverage and intercompany claims.
Third, check whether proceeds are distributed by collateral type. Some agreements require separate treatment for proceeds from certain assets, which can create unexpected outcomes when the company sells a subset of assets during a restructuring.
Fourth, treat consent thresholds as economic constraints. If a key amendment requires consent from a minority class, you may need to design the restructuring so that the required consents are obtained through exchange mechanics or alternative consideration.
Mind Map: Priority Assessment Workflow
Practical Output for the Rest of the Chapter
By the end of this section, you should be able to produce a “priority map” that links each creditor class to three outputs: (1) where they sit in the cash waterfall, (2) what actions they can control, and (3) what actions they can block. That map becomes the backbone for later decisions on debt exchanges, collateral releases, and interim financing structures.
6.4 Evaluating Equity Overhang and Dilution Implications
Equity overhang happens when existing claims—often common shares, preferred shares, or in-the-money options—remain outstanding while new financing or debt restructuring requires issuing additional equity. The result is a mismatch between who owns the company today and who must own it to make the plan work. Dilution implications are the practical side: how much ownership shifts, who takes the hit, and whether the new capital structure can attract ongoing support.
What Equity Overhang Looks Like in Real Documents
Start with the cap table and the “economic rights map.” Look for instruments that can convert, exercise, or receive value under the restructuring plan. Common examples include:
- Unexercised options and warrants with strike prices below expected post-restructuring equity value.
- Preferred shares with conversion features or liquidation preferences that effectively sit above common.
- Contingent equity tied to milestones, where the company must reserve shares even if performance is uncertain.
A simple test: if the plan assumes new equity issuance but the existing instruments still have a path to value, the company may be “selling the same slice twice.” That’s overhang.
Why Dilution Matters Beyond Percentage Ownership
Dilution is not just a math problem; it affects incentives and negotiation dynamics.
- Creditor negotiations: creditors may demand equity because cash is scarce. If common holders or option holders retain meaningful upside, creditors may push for larger equity allocations to compensate.
- Management retention: retention grants often rely on post-restructuring equity value. Heavy dilution can make retention awards look cheap on paper but expensive in practice.
- Future financing feasibility: if the plan creates a cap table that is too crowded with conversion rights, later financing can become harder because new investors fear immediate dilution.
Systematic Approach to Measuring Overhang
Use a structured workflow so you don’t rely on gut feel.
-
Inventory equity-linked instruments
List every class that can receive shares now or later: common, preferred, options, warrants, RSUs, and any contractual conversion rights. -
Determine conversion and exercise mechanics
For each instrument, capture the trigger and the number of shares per unit. Pay attention to anti-dilution provisions and cashless exercise features. -
Compute fully diluted shares under each plan scenario “Fully diluted” should include all instruments that are likely to convert or exercise given the plan’s implied equity value.
-
Estimate ownership outcomes by stakeholder group
Translate share counts into ownership percentages under the base case and any downside case you are using for plan economics. -
Stress-test the plan’s equity allocation
Ask whether the plan still delivers the intended creditor recovery and whether management retention remains feasible.
Example: Options and Warrants That Quietly Inflate Fully Diluted Shares
Assume a company has:
- 100 million common shares outstanding.
- 20 million options with a strike price that is expected to be below post-restructuring value.
- 10 million warrants that are exercisable at the same time as the plan closes.
If the plan issues 30 million new shares to creditors, the naive ownership view might say creditors get 30 / (100 + 30) = 23.1%. But fully diluted shares include options and warrants:
- Fully diluted shares = 100 + 20 + 10 + 30 = 160 million.
- Creditor ownership = 30 / 160 = 18.75%.
That 4.35 percentage-point gap is not cosmetic. It changes the economic bargain and can force renegotiation if creditors expected a higher effective recovery.
Mind Map: Equity Overhang and Dilution Implications
Advanced Details That Prevent Costly Miscalculations
Two issues commonly cause errors.
1. “Stated shares” versus “effective shares.” Some plans describe equity issuance as a fixed number of shares, but the effective ownership depends on what else converts. Always reconcile the plan’s stated issuance with the fully diluted denominator.
2. Timing and conditionality. If options or warrants can be exercised only after a trigger, you still need to model whether that trigger is likely to be met under the plan’s economics. If the plan assumes a certain equity value to satisfy creditor recovery, that same value can make exercise rational for holders.
Practical Checklist for the Plan Team
Before finalizing the equity allocation, confirm these items:
- Every equity-linked instrument is listed with its conversion/exercise terms.
- Fully diluted share counts are computed for the plan’s base case.
- Ownership outcomes are shown for each stakeholder group, not just common.
- Management retention grants are tested against the post-dilution cap table.
- The plan’s creditor recovery is consistent with effective dilution, not just headline percentages.
When these steps are done cleanly, dilution becomes a controlled variable rather than a surprise invoice sent to the wrong party.
6.5 Building a Waterfall Model for Claim Treatment Scenarios
A waterfall model translates “who gets paid” into a repeatable calculation. In restructuring, it helps you test claim treatment options without relying on hand-wavy assumptions. The core idea is simple: start with available value, then allocate it in a legally ordered sequence until it runs out.
Foundational Inputs and Claim Inventory
Begin by listing every claim class that could receive consideration. For each class, capture: (1) claim type (secured, priority, unsecured, equity), (2) principal and accrued amounts, (3) collateral value or recovery assumptions for secured claims, (4) contractual interest treatment, and (5) any expected setoff rights. A practical example: if a secured lender has $50m principal and collateral is estimated at $30m, the model should treat $30m as secured recovery potential and the remaining $20m as unsecured exposure.
Next, define the “value sources” available for distribution. Typical sources include cash on hand, proceeds from asset sales, new financing, and the value of reorganized equity (when relevant). Keep these sources separate so you can see which lever changes outcomes.
Waterfall Mechanics and Priority Logic
A waterfall is usually built in layers. First, allocate to the highest-priority claims. If value is insufficient, the model records partial recovery and stops for lower priorities. If value exceeds a layer, the model moves to the next layer.
To make this concrete, consider a simplified structure:
- Available value: $120m
- Priority claims: $40m
- Secured claims: $60m
- Unsecured claims: $80m
- Equity: residual
The model allocates $40m to priority, leaving $80m. It then pays secured claims up to $60m, leaving $20m. Unsecured claims receive $20m out of $80m, leaving $0 for equity. This is the “no magic, just math” moment that prevents negotiation surprises.
Modeling Secured Claims with Collateral and Deficiency
Secured claims often require a two-part view: collateral recovery and deficiency. In scenario testing, you may change collateral value assumptions or the treatment of liens. The model should compute secured recovery as min(collateral value, secured claim amount) and deficiency as secured claim amount minus secured recovery.
Example: collateral is revised from $30m to $34m. If the secured claim remains $50m, secured recovery becomes $34m and deficiency becomes $16m. That single change can shift the unsecured pool and, downstream, the equity residual.
Scenario Design for Claim Treatment Alternatives
Treat each scenario as a parameter set, not a separate spreadsheet universe. Common scenario parameters include:
- Cash available (including timing assumptions)
- Asset sale proceeds and closing costs
- DIP or interim financing amount and priority status
- Whether certain claims receive new notes, cash, or equity
- Haircuts or valuation discounts applied to specific classes
A clean approach is to create a scenario selector that swaps inputs while keeping the waterfall logic constant. That way, differences in outputs reflect the scenario assumptions, not accidental formula drift.
Allocation Rules for Non-Cash Consideration
When consideration is not purely cash, the model must convert it into value units consistently. If a class receives new debt, you can model its value using a discount rate and expected cash flows, or a simpler proxy such as par value adjusted for terms. If a class receives equity, model its value as the implied enterprise value allocation to equity at the plan level.
Example: unsecured creditors receive 60% cash and 40% new notes. If the model values new notes at 90% of par, then the effective recovery is cash received plus (notes par × 0.90). This prevents the classic mistake of treating “par” as “value.”
Mind Map: Waterfall Model Components
Reconciliation and Integrity Checks
A waterfall model is only trustworthy if it reconciles. Add checks that total allocated value equals total available value within a small tolerance. Also verify that each class’s allocation never exceeds its modeled entitlement unless the plan explicitly provides overpayment mechanics.
A useful control is a “value conservation” row: Available Value − Total Allocations = 0. If it doesn’t equal zero, you likely have a missing cost line, a double-counted source, or a valuation basis mismatch.
Example Walkthrough for a Full Scenario
Assume available value is $200m. Priority claims are $25m. Secured claims total $120m with collateral assumed at $90m. Unsecured claims total $150m. Equity is residual.
- Priority: pay $25m, remaining $175m.
- Secured: pay secured recovery $90m, remaining $85m.
- Unsecured pool includes secured deficiency of $30m plus unsecured claims of $150m, total $180m entitlement.
- Unsecured allocation: pay min($85m, $180m) = $85m, leaving $0 for equity.
Now change collateral assumption to $100m. Secured recovery becomes $100m, deficiency becomes $20m, unsecured entitlement becomes $170m, and unsecured allocation becomes $75m. The model shows the ripple effect clearly: better collateral increases secured recovery but reduces unsecured deficiency, which can still reduce unsecured recovery depending on the total value constraint.
Practical Modeling Tips That Prevent Spreadsheet Headaches
Use consistent units (all values in the same currency and time basis). Keep costs explicit, including transaction fees and professional expenses, because they reduce distributable value. Finally, label every assumption row so someone can audit the logic without reading your mind—an ability even the most optimistic planners do not possess.
7. Turnaround Valuation and Scenario Modeling for Decisions
7.1 Selecting Valuation Approaches for Restructuring Contexts
Valuation in a restructuring is less about finding a single “true” number and more about choosing a method that matches the decision you’re making. A lender wants to know whether a proposed haircut preserves recoveries. A buyer wants to know what cash flows can realistically be produced after reorganization. A court process needs a defensible basis for plan economics. The right approach is the one that aligns with the cash-flow reality, the legal treatment of claims, and the information available at the time.
Start with the Decision You Need to Support
Before picking a valuation technique, clarify the output:
- Feasibility of a plan: Can the reorganized company generate enough cash to meet required payments?
- Fairness of claim treatment: Do different classes receive value consistent with their priority and risk?
- Negotiation leverage: What range of outcomes is plausible given operating constraints?
A common mistake is using a method designed for “going concern” investment decisions to justify a plan that depends on near-term liquidity and operational resets. In restructuring, timing matters as much as magnitude.
Choose Between Income, Market, and Asset-Based Lenses
Restructuring valuation typically uses one primary lens and one supporting lens.
- Income approach: Values the business based on expected cash flows, discounted for risk and timing. This is usually the best fit when the plan’s success depends on operating performance after reorganization.
- Market approach: Uses pricing from comparable transactions or trading multiples. This helps when there are credible comparables and the restructuring does not radically change the business model.
- Asset-based approach: Values net assets, often with adjustments for liquidation risk or replacement cost. This can be useful when cash flows are unreliable or when the balance sheet drives recoveries, such as in asset-heavy businesses.
A practical rule: if the plan’s economics hinge on operating cash generation, prioritize the income approach. If recoveries are dominated by collateral and asset disposition, lean toward asset-based analysis. If comparables are clean and the company’s post-restructuring profile resembles them, market multiples can provide a reality check.
Mind Map: Valuation Approach Selection
Income Approach Details That Matter in Restructuring
The income approach becomes more than a discount rate and a spreadsheet once you incorporate restructuring-specific mechanics:
- Cash-flow normalization: Remove one-time items and reflect realistic working capital needs. For example, if the company’s historical cash was boosted by delayed vendor payments, the post-restructuring plan must assume those payments resume.
- Timing of recovery: Discounting should reflect when cash is actually available to pay claims. A plan that starts paying in year two is not equivalent to one that pays immediately, even if total amounts match.
- Discount rate alignment: The discount rate should reflect the risk of the reorganized entity, not the risk profile of the pre-restructuring distressed period.
Example: A manufacturer proposes a plan that depends on restoring gross margin from 18% to 24% within twelve months. If the operating plan assumes margin recovery but the working capital model requires additional cash to fund inventory during the ramp, the income valuation must include that liquidity need. Otherwise, the valuation will overstate value available for claim payments.
Market Approach Use Without Hand-Waving
Market methods are helpful when comparables are truly comparable. In restructuring, comparables often fail because the subject company is under stress.
To use market data responsibly:
- Prefer transactions involving similar capital structures or similar post-restructuring operating profiles.
- Adjust for differences in control, synergies, and growth only when those adjustments are supported by the operating plan.
- Treat trading multiples as a range, not a precise target, because market prices reflect expectations that may not match the plan’s assumptions.
Example: If a retailer’s plan assumes a new store format and improved unit economics, using multiples from legacy retailers without that format can mislead. A better approach is to use market multiples as a check on the reasonableness of the post-restructuring earnings power, not as a substitute for the plan’s cash-flow model.
Asset-Based Approach When Recoveries Are Collateral-Driven
Asset-based valuation is most persuasive when:
- The company has significant collateral supporting secured claims.
- Operating cash flows are too uncertain to anchor an income model.
- The plan’s value distribution depends on liquidation or sale of assets.
Key steps include estimating net realizable value rather than book value, and explicitly modeling costs such as disposition expenses and time-to-sale.
Example: A logistics firm has specialized equipment that can be sold only at a discount. If secured creditors rely on collateral coverage, the valuation should estimate the equipment’s realizable value after marketability constraints, not assume accounting depreciation equals economic value.
Integrate with Claim Treatment and the Waterfall
No matter which valuation lens you choose, the output must connect to the legal economics. The value you compute should be translated into recoveries by class through the claim waterfall. If the valuation implies that a class receives less than its contractual priority would suggest, the plan either needs economic justification or a different structure.
A clean workflow is: normalize inputs → build the primary valuation model → cross-check with a secondary lens → map value to claim treatment → test sensitivities on the few drivers that actually move the result.
That workflow keeps the valuation from becoming a decorative exercise. It also makes negotiations more concrete: people can argue about assumptions, not about whether the model “feels right.”
7.2 Building Base Case and Downside Cases Without Speculation
A base case is the “most defensible” story your numbers can support, not the story you wish were true. A downside case is the “still plausible” story that shows what breaks first and how much buffer you actually have. The trick is to build both from the same operating drivers and accounting mechanics, then vary only what the evidence supports.
Start with One Operating Engine
Use one driver-based model so the base and downside cases share structure. Typical operating drivers include unit volume, pricing, gross margin, cash conversion cycle, and opex efficiency. Then connect them to financial outputs: revenue, EBITDA, interest expense, taxes, capex, working capital, and ending cash.
Example: A consumer electronics distributor has revenue tied to (a) shipments by customer segment and (b) average selling price. In the model, each segment’s shipments feed accounts receivable and inventory, which then feed cash. If you change only revenue assumptions but leave working capital logic unchanged, you’ll get a “pretty” EBITDA and a misleading cash outcome.
Define the Base Case as a Range, Not a Point
Pick a base case that sits near the center of what your data supports. Use three anchors:
- Recent run-rate: last 8–12 weeks of actuals, adjusted for known one-offs.
- Contract reality: signed pricing, renewal terms, and customer concentration constraints.
- Capacity and cost behavior: how costs move with volume, including any step costs.
Example: If marketing spend is currently $2.0M per quarter and the sales team can only scale lead generation by 10% without hiring, then base case growth should reflect that constraint. Costs that are “mostly fixed” shouldn’t magically scale down in the base case.
Build the Downside Case from Failure Points
Downside cases should be constructed from specific stress mechanisms, not generic “everything goes wrong.” Choose 2–4 failure points that are common in your industry and consistent with your diagnosis.
Common downside mechanisms include:
- Demand shortfall: lower volume due to churn or slower procurement.
- Margin compression: higher input costs or discounting to protect volume.
- Collection delays: longer days sales outstanding from customer stress.
- Supply and fulfillment friction: higher logistics costs or stockouts.
- Cost inflexibility: opex reductions limited by severance, contract terms, or minimum staffing.
Example: A B2B software company may not face inventory risk, but it can face collection delays and churn. A downside case could reduce net retention and extend collections by 15–25 days, which then increases cash burn even if EBITDA looks “not too bad.”
Keep Accounting Consistent Across Cases
Many models accidentally change accounting treatment between cases. Don’t. Keep the same:
- revenue recognition logic,
- depreciation and amortization method,
- tax treatment,
- interest calculation method,
- capex policy framework,
- working capital definitions.
Only adjust the assumptions that drive those lines.
Example: If you assume a downside case includes “fewer sales,” you still calculate receivables using the same collection curve, just applied to a lower revenue base. That’s how you avoid speculation and keep the model honest.
Use a Simple Assumption Ladder
For each key driver, write a ladder: evidence → base assumption → downside assumption → impact path.
- Evidence: what you observed or what contracts say.
- Base assumption: the central estimate.
- Downside assumption: a stress level tied to the evidence.
- Impact path: which financial lines change and why.
Example: Evidence might be that customer A has already reduced orders by 12% year-to-date. Base case assumes another 5% reduction. Downside assumes an additional 12% reduction plus a 20-day collection delay for that customer segment. The impact path is explicit: lower revenue reduces AR inflows, delayed collections increase ending AR, and cash drops.
Mind Map: Base Case and Downside Case Construction
Validate with “Sanity Checks” That Catch Speculation
After building both cases, run checks that reveal hidden assumptions:
- Cash vs. EBITDA: if EBITDA improves but cash worsens, confirm working capital logic.
- Interest and fees: ensure downside doesn’t accidentally reduce interest by changing debt balances without a restructuring mechanism.
- Covenant math: verify covenant calculations use the same definitions as the agreements.
- Step costs: confirm layoffs or cost cuts don’t ignore severance timing.
Example: A company shows stable EBITDA in the downside case, but liquidity still collapses. The sanity check should point you to collections and capex timing rather than forcing a dramatic EBITDA change. That’s not speculation; it’s diagnosis.
Document the Cases So Others Can Rebuild Them
Write a short case narrative for each scenario: what changes, what doesn’t, and which driver assumptions are responsible for the cash outcome. Keep it factual and traceable to the evidence you used. If someone can’t reproduce your base and downside from your assumptions ladder, the model isn’t ready for decisions.
7.3 Linking Operating Assumptions to Financial Outputs
Operating assumptions are the bridge between what management plans to do and what the financial statements will show. The goal is not to create a perfect model; it is to make the model explainable. If someone asks, “Why did cash drop in March?” you should be able to point to a specific operating assumption, such as slower collections or delayed vendor payments.
Start by listing operating assumptions at the level where they can actually be managed. Typical categories include revenue volume, pricing, sales mix, fulfillment capacity, payment terms, labor productivity, and discretionary spend. Then define the financial outputs they drive: revenue recognition timing, gross margin, operating expenses, working capital movements, and cash taxes. A useful discipline is to write each assumption in a “driver format,” such as “Collections lag increases from 45 to 60 days because customer disputes rise.” That sentence already implies which line items will move.
Driver Mapping from Operations to Statements
A practical way to link assumptions is to map each driver to a statement impact and a timing impact.
- Revenue drivers map to income statement lines (revenue, cost of sales) and to cash timing through collections.
- Cost drivers map to operating expenses and to cash through payment schedules.
- Working capital drivers map to balance sheet changes and cash flow (accounts receivable, inventory, accounts payable).
For example, assume the turnaround plan includes a pricing reset and a tighter credit policy. Pricing affects revenue per unit; the credit policy affects the average days sales outstanding (DSO). If you only change revenue and forget DSO, your cash forecast will be optimistic even if the income statement looks fine.
A Systematic Workflow for Building the Link
- Choose a modeling horizon and cadence. Use monthly buckets for financial statements and weekly detail for cash if liquidity is tight. The cadence should match how decisions are made.
- Create an assumption register. Each assumption gets an ID, definition, baseline, planned change, and the exact financial line items it influences.
- Define timing rules. Revenue timing depends on contract terms and delivery; expense timing depends on when invoices arrive and when they are paid.
- Connect assumptions to calculations. Every assumption should have a formula path to outputs. If a driver has no path, it is either irrelevant or missing a link.
- Run consistency checks. Confirm that gross margin changes align with cost of sales assumptions, and that cash movements align with working capital changes.
Mind Map: Operating Assumptions to Financial Outputs
Example: One Assumption, Multiple Outputs
Assume management plans to reduce DSO by tightening credit checks and offering early-payment discounts. You might set DSO from 60 to 45 days over three months.
- Income statement impact: Revenue may not change immediately if sales volume is stable.
- Balance sheet impact: Accounts receivable declines as collections accelerate.
- Cash flow impact: Operating cash improves because cash receipts arrive sooner.
If your model shows improved cash but no change in accounts receivable, the linkage is broken. If it shows improved accounts receivable but no cash improvement, the timing rule for receipts is missing or misapplied.
Example: Cost Assumption That Changes Cash Differently Than P&L
Suppose you cut overtime and renegotiate vendor terms. Overtime reduction lowers labor expense on the income statement, but cash may not fall at the same pace if payroll timing and accruals differ. Vendor renegotiation can also shift cash outflows without changing the expense amount immediately.
To keep the model honest, separate expense recognition from cash payment. For instance, if invoices are paid 30 days after receipt, then a change in payment cadence affects cash flow earlier than it affects accrual balances.
Advanced Details That Prevent Common Modeling Errors
- Mix assumptions must carry through cost of sales. If higher-margin products increase, gross margin should move accordingly.
- Inventory assumptions must include both quantity and timing. Faster turns reduce inventory balances and release cash, but only if sales and replenishment schedules are consistent.
- Disputes and returns are timing multipliers. A dispute rate change affects collections timing and can also affect revenue recognition depending on contract terms.
- Use sign checks. A higher DSO should generally reduce cash in the near term; a higher inventory should generally consume cash.
When operating assumptions are written in driver format, mapped to statement lines, and tied to explicit timing rules, the financial outputs stop being a black box. The model becomes a set of traceable cause-and-effect statements—exactly what you need for restructuring decisions.
7.4 Sensitivity Analysis for Key Drivers Such as Margin and Volume
Sensitivity analysis answers a simple question: if one important assumption changes, how much does the outcome move? In turnaround finance, the goal is not to produce a single “correct” number. It’s to identify which levers actually matter so management can focus attention where it counts—pricing discipline, sales conversion, cost control, or working-capital behavior.
Step 1: Choose the Outcome You Care About
Start by defining the output metric that will drive decisions. Common choices include:
- Liquidity runway (weeks until cash falls below a threshold)
- EBITDA or operating profit for the next 12 months
- Free cash flow (cash after capex and working-capital changes)
- Debt service coverage ratio (DSCR)
Example: If the restructuring plan depends on meeting a DSCR covenant, then DSCR becomes the outcome. If the plan depends on avoiding a cash crunch, liquidity runway becomes the outcome.
Step 2: Select Key Drivers with Clear Causal Links
Pick drivers that connect to operational reality and can be influenced. For margin and volume, typical drivers are:
- Volume: units sold, number of transactions, or revenue growth rate
- Margin: gross margin percentage, contribution margin per unit, or variable cost ratio
- Mix: share of high-margin products or customer segments
- Timing: collection days and payment days that affect cash
A useful rule: each driver should map to at least one operational control (sales pipeline conversion, pricing approvals, procurement terms, or collections process).
Step 3: Build a Driver-to-Outcome Model That Is Easy to Audit
Your model should show the chain from drivers to outcome. A straightforward structure is:
- Revenue = Volume × Price
- Gross profit = Revenue × Gross margin
- Operating profit = Gross profit − Fixed costs − Variable overhead
- Cash flow = Operating profit − working-capital change − capex
Even if you use a spreadsheet, keep the logic explicit. When someone asks, “Where did this number come from?” you should be able to point to a single cell or formula.
Step 4: Define Reasonable Ranges and Step Sizes
Sensitivity works best when ranges are grounded in evidence from the business, not in wishful thinking. Use historical volatility, recent pipeline performance, or budget-to-actual gaps.
Example ranges for a turnaround plan:
- Margin: ±2 to ±5 percentage points
- Volume: ±5% to ±15%
- Mix: shift of 5% of volume from low-margin to high-margin products
Step sizes should be large enough to show movement but small enough to interpret.
Step 5: Run One-Way Sensitivities First
One-way sensitivity changes one driver at a time while holding others constant. This reveals which driver has the biggest impact.
Example: Suppose base case DSCR is 1.10.
- If gross margin drops by 3 points, DSCR becomes 0.95
- If volume drops by 10%, DSCR becomes 1.02
Interpretation: margin is the more critical lever because it pushes the metric below 1.0. That doesn’t mean volume is irrelevant; it means margin deserves priority in the plan.
Step 6: Add Two-Way Sensitivities for Realistic Interactions
Margin and volume often move together. For instance, discounting to win volume can compress margin, and cost inflation can reduce margin while volume declines.
Use a grid:
- Rows: margin levels (e.g., −5, 0, +5 points)
- Columns: volume levels (e.g., −10%, 0, +10%)
Example grid interpretation:
- Worst corner: margin −5 points and volume −10% produces DSCR 0.85
- Best corner: margin +5 points and volume +10% produces DSCR 1.35
- The “cliff” region might occur when margin is below −2 points regardless of volume, signaling that pricing and cost actions are non-negotiable.
Step 7: Convert Sensitivities Into Actionable Thresholds
Sensitivity outputs become useful when tied to decisions. Turn the grid into thresholds:
- “If margin falls below X, trigger pricing approvals and cost containment within 30 days.”
- “If volume falls below Y, accelerate sales conversion actions and revise production schedules.”
Use operational triggers that match how the company actually runs.
Mind Map: Sensitivity Analysis Workflow
Example: Turning a Grid Into a Management Message
Assume base case liquidity runway is 10 weeks. A two-way grid shows:
- Margin −4 points: runway drops to 5 weeks even when volume is flat
- Volume −15%: runway drops to 7 weeks when margin is flat
The integrated takeaway is straightforward: protect margin first to preserve liquidity. Then address volume with actions that do not sacrifice pricing discipline.
Step 8: Document Assumptions and Validate Against Reality
Finally, record what changed and what didn’t. Note whether margin changes come from pricing, product mix, or cost inputs. Note whether volume changes reflect pipeline conversion, churn, or capacity constraints.
Validation is practical: compare the model’s implied revenue and cost behavior to recent actuals. If the model says volume can fall 15% without affecting collections, but the business historically shows otherwise, revise the working-capital linkage before trusting the grid.
7.5 Using Valuation Outputs to Support Negotiation Positions
Valuation outputs are negotiation tools, not trophies. The goal is to translate numbers into defensible positions: what you want, what you can accept, and why the other side should believe you. Start by aligning valuation outputs with the negotiation “asks,” then use them to build a consistent story across economics, timing, and risk.
From Valuation Outputs to Negotiation Inputs
A typical valuation model produces three categories of outputs: (1) value ranges, (2) implied recovery levels by claim class, and (3) sensitivity to key drivers. Negotiation positions should map to these outputs.
- Value ranges become your anchor and your fallback. If your model yields an enterprise value range of $120–$140 million, you can negotiate from a midpoint anchor while keeping a lower bound for downside protection.
- Implied recoveries become the “why” for claim treatment. If secured creditors are modeled to recover 90–100% under a proposed plan, you can justify why they should accept a particular maturity or collateral release.
- Sensitivity becomes your risk language. If recovery is highly sensitive to working capital swings, you can justify tighter reporting, escrow mechanics, or performance-based adjustments.
A useful discipline is to write a one-page “valuation-to-terms bridge” before negotiations. Each term you propose should reference a specific valuation output and a specific driver.
Building a Negotiation Position Stack
Negotiations often fail when parties argue about valuation in the abstract. Instead, build a stack that moves from fundamentals to deal mechanics.
- Fundamental driver statement: Identify the few variables that actually move value. For many restructurings, these are revenue realization, gross margin, and cash conversion cycle.
- Model-to-driver linkage: Explain how each driver flows into cash flows and then into value. Keep it concrete: “A 2-point margin improvement changes annual EBITDA by $X, which changes free cash flow by $Y.”
- Recovery logic: Convert enterprise value into claim recoveries using a waterfall that respects priority and contractual terms.
- Term translation: Tie recoveries to specific terms such as haircut size, interest rate, equity percentage, or release scope.
- Risk controls: Use sensitivities to justify covenants, reporting cadence, or escrow/true-up provisions.
This stack prevents a common mistake: using a valuation number as if it were a single fact rather than a range with assumptions.
Mind Map: Valuation Outputs to Negotiation Terms
Example: Turning a Value Range Into Claim Treatment
Assume a company has modeled enterprise value of $130 million (range $120–$140 million). The capital structure includes $90 million of secured debt, $60 million of unsecured notes, and $10 million of priority claims.
- Waterfall under the base case: If enterprise value less net debt and priority items leaves $95 million available for secured and unsecured, secured debt of $90 million implies a near-full recovery for secured and limited recovery for unsecured.
- Negotiation implication: If your proposal offers unsecured creditors a recovery consistent with the modeled range, you can argue the offer is not arbitrary. You can also show that unsecured recovery improves only if specific drivers improve.
- Risk control: If the model is sensitive to working capital, propose a true-up tied to measurable cash conversion metrics. That converts valuation uncertainty into a structured adjustment rather than a debate.
The key is that the offer is supported by a recovery logic, not by a single valuation point.
Example: Using Sensitivity to Justify Monitoring Terms
Suppose the model shows unsecured recovery changes by 5 percentage points for every 10-day shift in the cash conversion cycle. Instead of arguing about “fairness,” you can propose:
- monthly reporting of receivables and payables aging,
- a covenant that restricts discretionary spending if cash conversion worsens,
- an escrow that releases upon meeting defined cash targets.
This approach makes the negotiation about measurable behavior. It also reduces the chance that the other side feels the valuation is being used selectively.
Practical Checklist for Negotiation Use
Before each negotiation meeting, verify three items:
- Assumption discipline: The assumptions used in the valuation bridge match the assumptions used in the waterfall and term translation.
- Driver clarity: You can explain which two or three drivers dominate the range.
- Term alignment: Every major term has a valuation-backed reason and a risk-control mechanism when uncertainty is material.
When valuation outputs are used this way, they become a coherent argument: grounded in cash flow logic, translated into claim recoveries, and supported by terms that manage the uncertainty that created the range.
8. Debt Restructuring Strategies and Negotiation Mechanics
8.1 Out of Court Restructuring Options and Consent Solicitation
Out-of-court restructuring is a negotiated reset of terms that avoids formal insolvency proceedings. It works best when the company can keep operating while creditors agree to changes that improve liquidity, reduce near-term pressure, and align payments with realistic cash generation. The core idea is simple: you do not change the business overnight, but you do change the contract math.
Core Out of Court Paths
Most out-of-court efforts fall into three buckets. First is a consent solicitation, where creditors vote on amendments to existing documents. Second is an exchange offer, where creditors swap old claims for new instruments with different economics. Third is a bilateral or small-group amendment, often used when only a few lenders hold most of the leverage.
A consent solicitation is usually the fastest because it targets specific provisions—like maturity dates, interest rates, or covenant definitions—without requiring a full replacement of the debt stack. It also tends to be cleaner for accounting and operational continuity, since the company keeps the same legal entity and day-to-day financing relationships.
When Consent Solicitations Make Sense
Consent solicitations are most practical when three conditions hold. The first is concentrated creditor ownership, so you can reach the required voting threshold without chasing dozens of small holders. The second is document flexibility, meaning the indenture or credit agreement allows amendments with consent rather than requiring unanimity. The third is credible interim stability, so the company can keep paying essential expenses and avoid a liquidity cliff while the solicitation runs.
A common failure mode is “paper agreement, cash problem.” If the company’s weekly cash burn is already beyond what the business can sustain, creditors will demand stronger protections than the company can offer. In that situation, the solicitation becomes a negotiation about survival rather than about terms.
Building the Consent Package
A consent package should be designed to answer the questions creditors will ask in order: What is happening? What changes are requested? What do creditors receive if they approve? What happens if they do not?
Start with a concise restructuring overview that explains the cash drivers behind the request. Then specify the exact amendments, not a general promise to “improve flexibility.” For example, list whether the proposal includes (a) extending maturities by 12–24 months, (b) reducing interest rate by a defined margin, (c) adding a covenant holiday tied to performance, or (d) modifying reporting requirements.
Next, include a clear economic summary. Creditors need to understand the trade: lower payments now in exchange for longer duration or revised collateral and covenants. If the proposal includes a fee for consenting, state the fee mechanics and timing.
Finally, provide a baseline for non-consenting holders. Many deals include a “no worse off” concept for certain protections, but the company must be explicit about what remains unchanged for those who do not consent.
Voting Mechanics and Threshold Strategy
Consent solicitation outcomes depend on the voting threshold in the governing documents. Indentures often require a supermajority for certain amendments, while credit agreements may require lender consent by percentage of outstanding principal.
A practical strategy is to map the creditor base into three groups: likely yes, likely no, and uncertain. The uncertain group is where outreach matters most, because their decision often hinges on whether the company’s cash plan is credible and whether the amendments are narrowly tailored.
Outreach should be structured around decision points. For example, first confirm whether the proposed amendments are within the permitted scope. Then discuss the interim liquidity plan. Then address collateral or covenant protections. Each step reduces the chance of last-minute objections.
Example Consent Solicitation Terms in Plain Language
Consider a mid-sized manufacturer with a $200 million secured term loan and $150 million of notes. The company is missing covenant compliance due to margin compression and delayed receivables.
The company proposes:
- Extend the next covenant measurement date by two quarters.
- Replace a strict fixed charge covenant with a liquidity-based covenant measured monthly.
- Reduce interest by 200 bps for the next two quarters, funded by a temporary payment deferral.
- Add a requirement that the company deliver a weekly cash report to consenting creditors.
In the solicitation materials, the company explains that the covenant change is not a blank check; it is tied to a measurable liquidity threshold and enhanced reporting.
Mind Map: Consent Solicitation Workflow
Example Timeline Using a Fixed Date
A typical solicitation runs on a tight schedule. Suppose the company launches on 2026-04-15. It sets a consent deadline 21 days later, with an early consent window during the first week that offers a small consent fee.
During the first week, the company focuses on confirming amendment scope and aligning on the cash plan. During the second week, it answers technical questions about covenant calculations and reporting. In the final days, it confirms the voting tally and prepares closing deliverables so the amendments become effective immediately after the threshold is met.
Practical Checklist for Creditor-Friendly Clarity
A consent solicitation is easier to approve when it is specific. Ensure the package includes: the precise amendment text or a summary that mirrors it; a cash plan that explains how the company avoids missed payments during the solicitation; a covenant calculation example showing how the new test would have worked in the last quarter; and a clear statement of what changes for consenting holders versus non-consenting holders.
When these elements are present, consent becomes a decision about numbers and mechanics rather than a decision about trust. That is the whole point of doing it out of court.
8.2 In Court Restructuring Options and Plan Structuring Basics
In-court restructuring is the “process with a referee” version of reorganization. The court’s role matters because it can bind dissenting parties to a plan, enforce deadlines, and approve key transactions. The core building blocks are (1) the case type, (2) the plan structure, (3) the voting and confirmation mechanics, and (4) the economic and legal treatment of each claim class.
Case Pathways and When Each Fits
Most in-court options share the same logic: you file, you stabilize, you negotiate a plan, and you ask the court to confirm it. The differences are procedural and jurisdictional.
Start with a simple decision tree:
- If the company needs immediate breathing room and court-supervised control, choose a proceeding that provides an automatic stay or equivalent protection.
- If the company can keep operating with limited disruption, the plan can still be confirmed quickly, but you must show the plan is feasible and fair.
- If the capital structure is complex, plan structuring becomes the main workstream, so pick a pathway that supports flexible claim treatment and efficient voting.
A practical example: a regional retailer with multiple secured lenders and a large trade creditor base often benefits from a proceeding that can coordinate claim treatment and prevent holdouts from blocking a workable settlement.
Plan Structure Fundamentals
A plan is not just a promise to pay. It is a legal instrument that specifies what each class of claims receives, when they receive it, and what rights are released or preserved. Think of it as a set of instructions the court can enforce.
A typical plan includes:
- Classes of claims and interests: group creditors with similar legal rights.
- Treatment per class: cash, new debt, equity, reinstatement, or impairment.
- Effective date mechanics: conditions that must be satisfied before the plan starts.
- Distributions and payment waterfall: how money flows after confirmation.
- Release and injunction provisions: what claims are barred after the plan becomes effective.
Mind the practical constraint: if you create too many classes, you complicate voting and disclosure. If you create too few, you risk unfairness because creditors with different economics get lumped together.
Claim Classification and Impairment
Classification is where many plans succeed or stumble. Courts generally require that classes are meaningful—creditors in the same class should have substantially similar rights.
Impairment is the plan’s economic “status label.” A class is impaired if its legal rights are modified. Impairment affects voting and sometimes eligibility for certain confirmation outcomes.
Example: Suppose a secured lender has a lien on equipment and a separate guarantee. If the plan reduces the secured recovery but leaves the guarantee untouched, the lender’s rights are modified in a way that may justify a distinct class or distinct treatment.
Voting Mechanics and Confirmation Standards
Most systems require:
- Solicitation and disclosure to allow informed voting.
- Voting by class using a threshold such as majority in number and amount, or a similar standard.
- Confirmation based on statutory criteria like feasibility, compliance with the plan requirements, and fairness.
A helpful way to organize the confirmation checklist is to map it to four questions:
- Is the plan legally permitted and properly structured?
- Did the voting process follow the rules?
- Is the plan fair to dissenting classes?
- Can the company perform under the plan?
Feasibility is often supported with a budget and assumptions tied to operational reality, not wishful thinking. For instance, if the plan assumes margin recovery, the disclosure should show what operational changes drive that margin.
Economic Treatment Design
Plan economics usually revolve around three levers:
- How much value is allocated to secured claims versus unsecured claims.
- Whether unsecured creditors receive cash, new debt, or equity.
- How equity is treated, including whether existing shareholders are wiped out, diluted, or given a small recovery.
A common structure is a “secured gets paid first, unsecured gets a mix, equity gets reset” approach. The details matter: if unsecured creditors receive new notes, the interest rate, maturity, and covenants must be consistent with the company’s projected cash generation.
Example: A manufacturer with steady but pressured cash flows might offer unsecured creditors a 5-year note with a modest coupon and a principal reduction if certain performance targets are missed. That structure can be easier to administer than frequent cash payments, but it must be clearly described and supported.
Mind Map: In Court Plan Structuring
Example: A Simple Plan Skeleton in Practice
Consider a company with three claim groups: secured lenders, trade creditors, and unsecured bondholders.
- Secured lenders: reinstatement of liens and a reduced principal amount with a new amortization schedule.
- Trade creditors: partial cash payment at the effective date plus a short-term note for the remainder.
- Unsecured bondholders: exchange into new equity and a longer-dated note.
The plan then sets effective date conditions such as approval of the disclosure statement, execution of exchange documentation, and confirmation of the funding source for initial distributions. This is where the plan becomes operational rather than theoretical.
Common Structuring Pitfalls
Avoid these recurring issues:
- Over-classification that slows voting and increases disclosure complexity.
- Under-classification that forces dissimilar creditors into the same bucket.
- Unclear treatment language that creates disputes at implementation.
- Feasibility gaps where the budget assumptions do not match the operational plan.
A plan is easiest to confirm when it is internally consistent: the classification logic matches the economic treatment, the treatment matches the cash flow model, and the disclosure matches what the plan actually delivers.
8.3 Exchange Offers and Debt for Equity Conversions
Exchange offers and debt for equity conversions are two closely related ways to reduce leverage while keeping the company moving. In both, the core idea is simple: creditors receive new consideration instead of cash, and the company improves its balance sheet by changing the form of its obligations.
Foundational Concepts and When Each Tool Fits
An exchange offer is typically a voluntary offer where holders swap existing debt for new debt, new notes, or equity-linked instruments. A debt for equity conversion is a specific swap where debt is exchanged for equity, often with a negotiated valuation and a defined conversion ratio.
A practical rule of thumb: use an exchange offer when you can keep a workable debt structure but need to change terms (maturity, interest, covenants). Use debt for equity conversion when the company’s cash generation cannot support the old debt service, even after term changes.
Example: A retailer with declining sales can’t meet interest payments. If extending maturities and reducing coupons still leaves interest coverage too thin, a debt for equity conversion may be the cleaner fix. If the business can stabilize within a year, an exchange offer that lowers coupons and adds a grace period may be sufficient.
Economic Mechanics That Drive the Outcome
Both transactions hinge on three numbers: the exchange price (or conversion ratio), the consideration mix, and the implied value of the company to each class of holders.
- Exchange price or conversion ratio determines how much new value each old claim receives.
- Consideration mix may include cash, new notes, warrants, or preferred equity alongside common equity.
- Implied value is the bridge between what creditors give up and what they receive.
Example: Suppose $100 million of notes are exchanged. If the company’s agreed equity value implies a conversion ratio that grants creditors 40% of the post-transaction equity, then creditors effectively receive $40 million of equity value (plus any additional instruments). The remaining $60 million is the “value gap” absorbed by other stakeholders or by reduced principal.
Step-by-Step Process for an Exchange Offer
A systematic workflow reduces surprises and keeps negotiations grounded.
- Define the target capital structure: specify the post-transaction debt level, maturity profile, and equity ownership boundaries.
- Segment holders: secured vs. unsecured, large vs. small, and holders with different voting power.
- Set the offer economics: coupon reduction, maturity extension, principal haircut, or conversion ratio.
- Draft the offer documents: include eligibility, proration, withdrawal rights, and settlement timing.
- Run solicitation and collect tenders: track participation thresholds and manage communications.
- Settle and update governance: issue new instruments, record ownership changes, and amend indentures.
Example: A company offers holders a choice: exchange into new notes at a lower coupon with a longer maturity, or convert into preferred equity with a fixed dividend. The choice architecture can increase participation because it lets holders align with their risk preferences.
Consent Thresholds and Participation Design
Exchange offers often require a minimum participation level to be effective. If the company needs a particular outcome—like eliminating a covenant breach or achieving a new maturity wall—it may set a condition that triggers only if enough holders tender.
Proration matters when participation exceeds the company’s desired amount. If only $80 million of debt can be exchanged under the offer, but $120 million tenders, proration determines who gets full consideration and who receives partial consideration.
Example: If a holder tenders $10 million and the offer is oversubscribed, proration might grant them consideration for only $6 million. Their remaining exposure may remain outstanding, which can affect later negotiations.
Debt for Equity Conversion: Valuation and Conversion Ratio
Debt for equity conversions require a conversion ratio that is defensible to stakeholders. The ratio is usually based on an agreed equity valuation method and the amount of debt being converted.
A common approach is to translate debt into equity using a valuation range and then select a ratio that balances creditor incentives with the company’s need to preserve enough equity value for ongoing operations.
Example: If $50 million of debt is converted and the agreed post-transaction equity value implies that converted debt should represent 30% of the company, then converted holders receive equity representing that 30%. The remaining 70% is allocated to existing equity and any new money providers, if applicable.
Mind Map: Exchange Offers and Debt for Equity Conversions
Example Walkthrough: Two Offers with Different Creditor Outcomes
Consider two creditors: one wants near-term income, the other wants upside.
- Offer A: New notes with a lower coupon and longer maturity. The income-focused creditor tenders because the cash interest continues, just at a reduced rate.
- Offer B: Debt converts into preferred equity with a fixed dividend plus warrants. The upside-focused creditor tenders because the warrants provide a path to gains if the company recovers.
Both offers can reduce debt service, but they do it differently. Offer A changes the debt profile; Offer B changes the ownership profile. The company chooses based on what it can sustain operationally and what stakeholders will accept.
Closing the Loop with Settlement and Documentation
After acceptance, the company must ensure the legal and operational steps match the economic deal. That includes issuing securities, amending indentures, updating cap tables, and confirming that the new instruments are properly authorized and recorded. A clean settlement prevents later disputes over what was actually delivered, especially when proration or holder elections are involved.
Example: If a holder elected the equity option but the settlement instructions were misapplied, the company may need corrective issuances or rescissions. Fixing that after the fact is slow and expensive, so the settlement checklist should be treated like a financial control, not paperwork.
8.4 Amend and Extend Transactions With Modified Terms
Amend-and-extend transactions modify existing debt terms while extending maturities, usually to avoid a default while giving the company time to stabilize operations. The core idea is simple: keep the same lenders in place, change the economics and protections, and document the changes so the credit agreement still works after the amendment.
Foundational Concepts That Drive the Deal
Start with the “why” behind the amendment. Lenders typically agree when the company can demonstrate improved cash generation and when the revised terms restore adequate protection. Companies pursue amend-and-extend to reduce near-term liquidity pressure, prevent acceleration, and keep operational momentum.
Key mechanics to understand before drafting:
- Default status: If a default already exists, the amendment may need cure provisions or a waiver. If no default exists, the amendment can be structured to preserve compliance.
- Consent thresholds: Many credit agreements require supermajority or unanimous consent for certain changes. The deal team must map which provisions are amendable under the existing voting rules.
- Economic trade: Lenders usually want either higher yield, tighter covenants, or additional collateral/guarantees. Companies usually want longer maturities, reduced cash interest, or covenant relief.
Term Sheet Elements That Usually Change
A practical term sheet for amend-and-extend typically includes the following categories.
Maturity Extension and Payment Profile
Extend the maturity date and adjust the repayment schedule. A common approach is to keep principal payments light for the first two to four quarters, then step them up as cash flow improves.
Example: A $100 million term loan due in 12 months is amended to mature in 30 months. Principal amortization is reduced from 5% per quarter to 1% per quarter for the first year, then returns to 4% per quarter thereafter.
Interest Rate and Fees
Modify the interest rate margin, add a one-time fee, or both. Fees can be structured as upfront consideration for the risk of waiting.
Example: The margin increases by 150 basis points, but the company receives a temporary interest-rate holiday for the first quarter, funded through an upfront amendment fee.
Covenant Package and Testing
Covenants are often the main negotiation battlefield. Companies may seek covenant relief, while lenders may demand tighter reporting, more frequent testing, or additional triggers.
Example: The leverage covenant is loosened for two quarters, but the company must provide weekly cash reporting and a tighter liquidity covenant thereafter.
Security, Guarantees, and Intercreditor Terms
If the original agreement permits, lenders may require additional collateral or guarantor coverage. Even without new collateral, the amendment can strengthen negative pledge language or expand permitted liens.
Example: The company adds a newly acquired subsidiary as a guarantor and updates the collateral description to include certain equipment previously omitted.
Representations and Conditions
Amendments usually require reaffirmation of key representations and new conditions precedent. These often include updated financial statements, compliance certificates, and confirmation that no material adverse change has occurred.
Example: Lenders require a bring-down certificate confirming that the company’s cash forecast is consistent with the budget used in the amendment model.
Mind Map: Amend and Extend Transaction Flow
Step-by-Step Execution Without Missing Pieces
- Inventory the existing credit agreement: Identify which sections require lender consent and which can be amended by majority. This prevents a “signed but ineffective” outcome.
- Confirm default and waiver needs: If there is a covenant breach, the amendment must include a waiver or cure. Otherwise, the amendment may not stop acceleration.
- Draft the amendment economics first: Align maturity, interest, fees, and amortization so the revised cash plan is coherent. Legal drafting should reflect the agreed payment logic.
- Translate covenant relief into testable numbers: Define calculation methodology, cure periods, and measurement dates. A covenant that looks looser on paper can still be tight if definitions change.
- Update schedules and collateral descriptions: Many amendments fail in the details—missing guarantors, outdated collateral lists, or incorrect permitted lien schedules.
- Run a closing checklist: Ensure officer certificates, board approvals, and legal opinions are delivered exactly as required.
Example: A Covenant Relief Swap That Actually Works
Assume a company has steady revenue but volatile working capital. Lenders agree to extend maturities and reduce amortization, but they require a liquidity covenant tied to a weekly cash minimum.
- Company asks for: loosen leverage covenant and extend maturity by 18 months.
- Lenders ask for: add a liquidity covenant and increase reporting frequency.
- Final structure: leverage covenant is loosened for four quarters, while liquidity is tested weekly with a defined cash definition and a short cure window.
The logic is consistent: leverage improves as margins stabilize, while liquidity protection addresses near-term cash volatility. The amendment is therefore not just “more time,” but a controlled way to manage the specific risk that caused the stress.
Common Failure Points and How to Avoid Them
- Consent threshold mismatch: If the amendment changes a protected term without the required vote, the company may still face enforcement.
- Covenant calculation ambiguity: Vague definitions lead to disputes at the first test date.
- Collateral and guarantor gaps: Missing guarantors or incorrect collateral descriptions can weaken lender protections and complicate enforcement.
- Operational reporting mismatch: If the company cannot produce the required reporting on time, the amendment can create new technical defaults.
Amend-and-extend is a negotiation of time and protection. When the revised terms are internally consistent—cash plan, covenant math, and documentation deliverables—the transaction becomes a practical bridge rather than a legal puzzle.
8.5 Negotiating with Secured Lenders Unsecured Creditors and Trade
Negotiation with secured lenders, unsecured creditors, and trade vendors works best when you treat it like a coordinated set of conversations, not three separate battles. The goal is to align timing, economics, and information so each group can say “yes” for reasons that make sense to them.
Core Principles That Keep Talks from Spinning
Start with a shared fact pattern. Create a single-page “why now” summary that ties liquidity needs to operational actions and shows what changes after the restructuring. Secured lenders will ask whether the collateral value is protected; unsecured creditors will ask whether the plan gives them a realistic path to recovery; trade vendors will ask whether they will keep getting paid enough to continue shipping.
Next, set a negotiation sequence. Typically, you secure buy-in from the party that controls the biggest constraint—often the secured lender—then use that momentum to stabilize trade and reduce unsecured resistance.
Finally, define what “agreement” means. For secured lenders, agreement may be a consent to amend terms, a forbearance, or a structured exchange. For unsecured creditors, it may be a voting commitment supported by a disclosure package and a clear claim treatment. For trade, it may be a payment plan tied to continued supply.
Secured Lenders Negotiation Mechanics
Secured lenders care about three things: collateral coverage, enforcement risk, and control over cash. A practical approach is to offer a package that reduces their enforcement anxiety while improving their ability to recover.
Example: A manufacturer has a borrowing base tied to eligible receivables and inventory. The company proposes a short forbearance plus a revised borrowing base methodology that temporarily includes certain slow-moving inventory categories, but only if the company hits weekly liquidation and aging targets. In return, the secured lender receives tighter reporting, a cash dominion arrangement, and a defined milestone schedule for the restructuring plan filing.
Key tactics that usually land well:
- Collateral protection with measurable actions: weekly reporting on collateral, not just monthly decks.
- Cash control that feels fair: explain how cash will be used to preserve value rather than fund unrelated spending.
- Consent terms with clear triggers: specify what happens if milestones are missed, such as step-down protections or additional reporting.
Unsecured Creditors Negotiation Mechanics
Unsecured creditors often negotiate on relative value: they want to know whether they are being asked to accept a haircut that is justified by the company’s normalized cash flows and asset realizations. They also want to avoid being treated as a “gap filler.”
Example: An unsecured group is offered a plan with a mix of new notes and equity warrants. The company improves acceptance by showing a simple waterfall: expected recoveries under base and downside cases, the assumptions behind them, and how the proposed treatment maps to those recoveries. The company also offers a modest improvement if the company meets post-restructuring EBITDA targets, funded from cost savings already identified in the operating plan.
Key tactics that help unsecured creditors move from skepticism to decision:
- Claim-by-claim clarity: distinguish trade-related unsecured claims from general unsecured claims.
- Disclosure that answers “why this number”: tie valuation inputs to operational drivers.
- Voting support with conditions: provide a structured commitment that depends on plan confirmation milestones and disclosure accuracy.
Trade Vendors Negotiation Mechanics
Trade negotiations are about continuity. Vendors typically do not want to become investors; they want predictable payment and a clear path to continued supply.
Example: A retailer faces a supplier risk because invoices are aging past agreed terms. The company proposes a two-part arrangement: (1) immediate catch-up payments for the most critical SKUs using a weekly cash schedule, and (2) a return to standard terms once the company demonstrates consistent payment for a defined number of cycles. The vendor receives a simple dashboard: invoice dates, payment dates, and any holds.
Key tactics that work:
- Segment vendors by criticality: prioritize those whose disruption would stop operations.
- Offer payment discipline, not promises: use a weekly schedule tied to actual cash receipts.
- Keep communication consistent: one owner for vendor updates reduces confusion and rumors.
Integrated Negotiation Mind Map
Practical Coordination Checklist
Use one timeline that shows when each group receives information, when votes are needed, and when payment changes begin. For example, if the secured lender requires weekly reporting starting on day 7, trade vendors should receive their first payment schedule at the same time so everyone sees the same operational reality. When unsecured creditors receive valuation support, include a short section explaining how the secured lender’s cash protections affect the unsecured recovery, so there are no surprises.
The best negotiations feel “boring” in the right way: each stakeholder gets a decision-ready package, clear numbers, and a defined set of actions that reduce their risk of being stuck with bad outcomes.
9. Equity Reorganization and Ownership Resets
9.1 Determining Whether Equity Should Be Preserved or Written Down
Equity treatment is the hinge between “restructuring as a financial reset” and “restructuring as a survival exercise.” Preserving equity usually means the business can generate enough value after restructuring to justify keeping existing owners in the capital stack. Writing down equity means existing owners are not entitled to that value, either because the company is insolvent on a realistic basis or because the reorganization requires new capital and risk absorption.
Core Concepts That Drive the Decision
Start with three questions, answered using the same valuation logic used for the plan:
- Is the company solvent after restructuring? Solvency is assessed on a realistic, not optimistic, view of operating performance, cash needs, and claim treatment.
- What value remains for equity after satisfying creditors? If creditor claims consume the value, equity has little or nothing to preserve.
- Does the plan require new risk capital? If new funding must be provided by parties willing to take first-loss risk, existing equity may be diluted or written down to make room.
A practical way to keep this systematic is to separate economic value from legal form. The legal structure can be changed without changing the underlying economics, but the plan must reflect economics accurately.
Step-by-Step Decision Framework
Step 1: Build a Post-Restructuring Value Snapshot
Use a valuation model that ties operating assumptions to financial outputs. Then apply a claim waterfall that reflects the plan’s proposed treatment of secured, priority, and unsecured claims.
Example: A manufacturer has $120 million of enterprise value on a realistic base case. Secured claims total $85 million, priority claims total $10 million, and unsecured claims total $40 million. Even before considering haircuts, the $120 million value covers $95 million of claims, leaving $25 million for unsecured claims. If the plan proposes unsecured claims at $40 million, the remaining $15 million shortfall implies equity is not supported by value.
Step 2: Compare Equity Entitlement to the Waterfall Residual
If the residual value after creditor claims is:
- Meaningful and stable, equity preservation is more defensible.
- Thin or negative, write-down becomes the cleaner economic conclusion.
“Meaningful” should be judged against uncertainty. If small changes in margins or working capital swing the residual from positive to negative, equity preservation can become a fragile argument.
Step 3: Test Whether New Capital Changes the Risk Allocation
Even when residual value exists, equity may still be written down if new money is required and the plan needs a clear first-loss position.
Example: A retailer has a small residual value for equity, but it also needs $30 million of interim funding. The funding terms require a conversion or equity-like instrument that effectively places new investors at the top of the risk stack. If existing equity remains unchanged, new investors may demand disproportionate economics or refuse to fund.
Step 4: Evaluate Practical Ownership Outcomes
Equity preservation can still happen through mechanisms that reduce existing owners’ share while keeping some form of participation.
Common outcomes include:
- Full preservation when value supports it and no new risk capital displaces it.
- Partial preservation via dilution, where existing owners receive a smaller stake in exchange for accepting revised terms.
- Write-down when value does not support existing ownership or when the plan needs a clean slate for new capital.
Mind Map: Equity Preservation Versus Write-Down
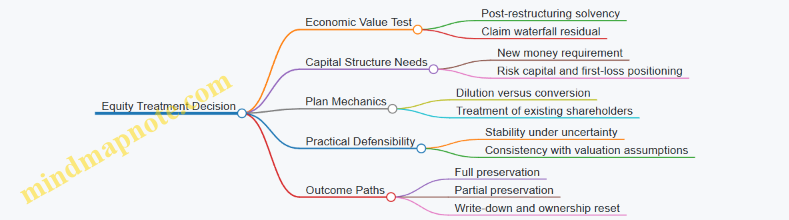
Concrete Examples of Each Outcome
Full Preservation
A software firm has $60 million enterprise value post-restructuring. Secured and priority claims total $35 million, leaving $25 million for unsecured claims and a residual for equity. If the plan does not require new risk capital beyond what existing equity already provides, preserving equity can be consistent with the economics.
Partial Preservation
A logistics business needs $20 million of new funding. Valuation suggests equity has some residual value, but not enough to absorb the funding risk without dilution. Existing shareholders receive a reduced stake, while new investors receive instruments that reflect their added risk.
Write-Down
A construction contractor’s realistic value is $90 million. Secured claims are $70 million, priority is $10 million, and unsecured claims are $30 million. The waterfall leaves no residual for equity. Writing down equity aligns the ownership reset with the economics of creditor recovery.
Evidence and Documentation That Make the Choice Hold Up
The decision should be supported by:
- A valuation that is consistent with the plan’s operating assumptions.
- A waterfall that matches proposed claim treatment.
- A clear explanation of how new capital changes risk allocation.
If you can’t explain the equity outcome using the same numbers that drive creditor recovery, the plan’s logic will feel like it was assembled after the fact. Equity treatment is one of those places where “because the plan says so” is not enough.
A Simple Rule of Thumb for Teams
When in doubt, ask: Would a rational investor pay for the existing equity given the post-restructuring claim stack and funding needs? If the answer is no, write-down is usually the economically coherent choice.
9.2 Common Equity Restructuring Through Reverse Mergers and Splits
When a company needs to reset its equity base, reverse mergers and splits are often used to re-price ownership, simplify the cap table, and align the post-reorganization structure with the plan’s economics. The core idea is straightforward: change the number and/or identity of shares so that the plan’s intended ownership outcomes can be implemented without rewriting every operational contract.
Foundational Concepts and Why These Tools Exist
A reverse merger combines the company with another entity so that the target’s equity becomes the surviving equity, but the share count and ownership mapping can be adjusted to meet plan terms. A split changes the number of shares while preserving proportional ownership at the moment of the split. In practice, both are used to implement plan mechanics: converting old equity into new equity, consolidating classes, or eliminating legacy share structures that complicate distributions.
A useful mental model is the “ownership map.” Before restructuring, each share class points to a set of rights. After restructuring, the plan specifies which stakeholders receive which rights. Reverse mergers and splits are the mechanical steps that translate the ownership map into a legally and operationally workable cap table.
Reverse Mergers: Mechanics and Implementation Logic
A reverse merger typically involves a new holding company or shell entity and a merger where the public or legacy equity is effectively replaced. The plan usually states the economic outcome, such as: existing shareholders receive either no new equity, a small allocation, or a defined number of new shares; creditors receive the bulk of the new equity; and any warrants or rights are either cancelled or replaced.
Key Steps
- Define the post-plan equity classes: common shares only, or common plus preferred, or common plus warrants. The plan should specify the exact allocation basis.
- Choose the share exchange ratio: the ratio determines how many new shares each old share (or each creditor claim bucket) maps to.
- Execute the merger and issuance: the surviving entity issues new shares to the entitled parties.
- Update corporate records and transfer systems: the cap table, registrar instructions, and any brokerage feeds must match the new structure.
Example: Simple Reverse Merger with Creditor Equity
Assume a company has 100 million old common shares. Under the plan, creditors receive 90% of the new common, and old equity receives 10%, with a total of 50 million new shares issued. The reverse merger sets the exchange so that:
- Old equity holders collectively receive 5 million new shares (10% of 50 million).
- Creditor claim holders collectively receive 45 million new shares (90% of 50 million).
If an investor held 1 million old shares, their post-merger allocation is 1 million / 100 million = 1% of old equity, so they receive 1% of 5 million = 50,000 new shares.
Equity Splits: When You Need Precision Without Changing Economics
A split is often used when the plan’s economics are already correct, but the share count, trading units, or class structure needs cleaning. Splits can be forward (increasing shares) or reverse (reducing shares). The proportional ownership stays the same immediately after the split, but the share count becomes compatible with the plan’s distribution and the registrar’s operational requirements.
Example: Reverse Split to Consolidate Legacy Classes
Suppose the company has three legacy common classes that create administrative friction. The plan consolidates them into one class of new common. Before consolidation, the company performs a 1-for-10 reverse split on each legacy class so that the share counts become manageable and consistent with the consolidation ratio.
If Class A has 200 million shares, after a 1-for-10 reverse split it has 20 million shares. The consolidation then maps each legacy class’s proportional ownership into the single new class based on the plan’s specified conversion ratios.
Integrated Mind Map
Mind Map: Reverse Mergers and Splits for Common Equity Restructuring
Controls, Math Checks, and Common Pitfalls
Even when the plan’s economics are clear, implementation can fail on details. Three checks prevent most problems:
- Proportionality check: verify that the exchange ratio preserves the plan’s intended ownership percentages.
- Rounding and fractional shares: decide how fractions are handled (cash in lieu, rounding down, or aggregation rules) and ensure the decision is consistent across all holders.
- Record alignment: confirm that the registrar, transfer agent, and any distribution instructions use the same share counts and class identifiers.
A final practical point: reverse mergers and splits are not substitutes for plan terms. They are the execution layer. If the plan specifies that creditors receive 90% of new common, the math in the merger exchange ratio and any split conversion must land on that outcome, not on what “seems close.”
9.3 New Money Equity and Rights Offer Mechanics
New money equity and rights offers are the practical way to inject fresh capital while giving existing stakeholders a structured path to participate. The mechanics matter because they determine who funds the turnaround, how dilution is calculated, and what protections—if any—new investors receive.
Foundational Concepts That Drive the Mechanics
Start with three building blocks: the capital need, the security being issued, and the pricing logic.
-
Capital need sets the size of the raise and the timeline for funding. For example, if the company needs $25 million to fund a 13-week cash gap, the offer terms should align with that schedule so the company does not promise funds it cannot draw.
-
Security being issued determines how investors get paid if the company later restructures again. A “new money equity” raise typically issues common or preferred shares; a “rights offer” grants existing holders the right to buy new shares.
-
Pricing logic determines dilution and fairness. Most rights offers use a subscription price tied to a reference price, then apply a discount to encourage participation. The discount is not just marketing math; it affects whether the offer is oversubscribed or stalls.
Rights Offer Flow from Announcement to Closing
A rights offer usually follows a predictable sequence.
-
Record date and eligibility: The company sets a record date so only holders of record receive rights. Example: if the record date is 2026-04-15, only shareholders listed on that date receive the rights.
-
Rights ratio: The company specifies how many rights are needed to buy one new share. Example: “1 right to purchase 1 new share” is simple; “3 rights to purchase 1 new share” is more common when the company wants to control dilution.
-
Subscription price: The subscription price is set per new share. Example: if the reference price is $2.00 and the subscription price is $1.60, the discount is 20%.
-
Oversubscription and backstop: If rights are not fully exercised, the company needs a plan. A backstop can be provided by a sponsor or major investor. Example: if only 60% of rights are exercised, the backstop covers the remaining 40% so the company still receives the full target amount.
-
Trading of rights: Rights may trade separately, allowing holders who do not want to buy to sell their rights. This reduces friction and can improve participation.
-
Closing and issuance: After the subscription period ends, the company issues shares to exercising holders and any backstop participants.
New Money Equity Mechanics When Existing Holders Do Not Fully Participate
Sometimes the company needs certainty more than participation. In those cases, new money equity can be structured as a direct issuance with a negotiated investor group, while still offering rights to existing holders.
Key mechanics to get right:
-
Allocation rules: Decide how shares are allocated between exercising rights holders and direct investors. Example: first satisfy rights holders, then allocate remaining shares to the backstop.
-
Dilution protection: Some deals include anti-dilution adjustments or caps on conversion terms if preferred equity is issued. The goal is to prevent the new investors from being diluted by a subsequent issuance at a lower effective price.
-
Use of proceeds: The offer documents should tie the capital to specific turnaround uses, such as funding working capital, retiring near-term maturities, or paying restructuring costs. Investors care because it affects whether the company can meet its immediate milestones.
-
Governance and consent rights: New investors may request board seats or observer rights. These are not decorative; they influence how quickly the company can approve budgets, asset sales, and financing draws.
Economic Terms That Must Be Consistent Across Documents
Rights offers and new money equity issuances live in multiple documents, and inconsistencies create disputes.
-
Reference price and discount must match across the prospectus or offering circular, the rights agreement, and the board resolutions.
-
Subscription mechanics must be operationally clear: payment method, deadlines, and what happens if a holder submits late or incomplete instructions.
-
Rounding and fractional shares rules should be explicit. Example: if a holder’s entitlement results in 0.6 of a share, the documents must state whether cash is paid in lieu, shares are rounded down, or additional shares are allocated through a pool.
-
Representations and conditions should align with closing deliverables, including legal opinions and corporate approvals.
Mind Map: Rights Offer and New Money Equity Mechanics
Worked Example with Clear Numbers
Assume the company wants to raise $10 million.
- Reference price: $2.00
- Subscription price: $1.50 (25% discount)
- Rights ratio: 2 rights to buy 1 new share
- Target new shares: 6,666,667 shares (6,666,667 × $1.50 ≈ $10,000,000)
If existing holders exercise rights for only 70% of the target, the remaining 30% is covered by a backstop investor. The backstop receives the shortfall shares at the same subscription price, so the company still raises the full $10 million and the pricing remains consistent for all new shares.
Practical Checklist for Mechanics That Avoid Friction
- Confirm the rights ratio and subscription price produce the intended gross proceeds.
- Ensure the backstop covers the maximum shortfall scenario.
- Specify rounding and payment-in-lieu rules before launch.
- Align all economic terms across resolutions, rights agreement, and offering circular.
- Build a subscription operations plan so payment deadlines are enforceable.
When these mechanics are coherent, the offer becomes a controlled funding event rather than a negotiation that happens after the paperwork is signed.
9.4 Managing Existing Shareholder Treatment and Release Terms
Existing shareholders are often the loudest part of the room, but the legal and financial mechanics are what matter. This section explains how to decide what happens to old equity and how to draft release terms that are specific enough to be enforceable and narrow enough to avoid accidental overreach.
Foundational Concepts for Shareholder Treatment
Start with two questions: what economic interest do shareholders still have, and what legal exposure does the company want to close. If the company is insolvent or near-insolvent, equity typically has limited value, so the main goal becomes orderly ownership reset rather than preserving upside for old holders.
A practical way to frame treatment is by mapping shareholder categories:
- Common shareholders with voting rights and residual claims.
- Preferred shareholders with liquidation preferences or conversion features.
- Management and employee holders who may have both equity and employment-related claims.
- Minority holders who may be more likely to object to perceived unfairness.
Each category affects both economics and the scope of releases.
Determining the Economic Outcome
Treatment usually falls into one of three buckets.
-
Preserve equity when the company can credibly continue as a going concern and the plan does not require a full balance-sheet reset. Example: a firm with manageable debt and improving cash flow keeps existing shares but amends covenants and issues a small amount of new equity to fund working capital.
-
Write down or cancel equity when debt restructuring requires absorbing losses. Example: a company with heavy secured debt converts part of the debt into new equity, and old common shares are cancelled because their residual value is effectively zero.
-
Exchange equity for new instruments when the plan wants continuity but with a reset of risk. Example: old shares are exchanged for new common shares at a ratio that reflects the post-restructuring valuation, with some holders receiving warrants to smooth negotiation friction.
The key is to tie the exchange ratio or cancellation logic to a valuation approach used consistently across the plan materials.
Release Terms That Close the Right Doors
Releases are where drafting precision pays rent. A release typically aims to prevent post-effective-date claims against certain parties for acts taken in connection with the restructuring.
A clean release package has four features:
- Defined released parties (for example, the debtor, plan sponsor, certain lenders, and their affiliates).
- Defined released claims (for example, claims “arising out of” specified conduct tied to the restructuring).
- Defined carve-outs (for example, claims for post-effective-date obligations, fraud, or specific excluded litigation).
- Defined consideration (what the releasing parties receive in exchange for the release).
Example: if shareholders are receiving new shares or warrants, the release should reference that consideration and the restructuring process. If the company wants to preserve a separate lawsuit against a third party unrelated to the plan, the release should explicitly exclude that claim.
Managing Existing Shareholders Without Creating New Problems
Shareholder treatment and releases interact with voting and disclosure. If shareholders are asked to approve a plan while also being released from claims, the disclosure must explain the trade-off in plain terms.
A useful workflow is to build an internal “treatment-to-release” matrix:
- Row: shareholder class (common, preferred, management).
- Column 1: economic treatment (cancel, exchange, preserve).
- Column 2: whether the class receives consideration.
- Column 3: whether the class grants releases.
- Column 4: carve-outs relevant to that class.
Example: management shareholders might have employment-related claims. The plan can still require a release of restructuring-related claims, but carve out employment claims that are governed by separate agreements or pending proceedings.
Mind Map: Shareholder Treatment and Release Terms
Example: A Practical Release Clause Structure
Below is a structural template showing how releases are typically organized. It is not legal advice, but it illustrates the logic that keeps releases enforceable.
Released Parties: Debtor, Plan Sponsor, certain lenders, and affiliates.

Released Claims: Any claims arising out of or relating to the restructuring
transactions, plan negotiation, and plan implementation.

Consideration: New equity/warrants and other benefits provided under the plan.

Carve-Outs: Claims based on post-effective-date obligations; fraud; and
specified excluded actions or proceedings.

Effective Date: Release becomes effective upon plan effectiveness.
Common Drafting Pitfalls to Avoid
Two mistakes show up repeatedly. First, releases that are too broad without clear claim definitions can be challenged as overreaching. Second, carve-outs that are vague create disputes about what was actually preserved.
A simple discipline helps: every carve-out should point to a specific category of claims or a named proceeding, and every released claim should connect to restructuring conduct that shareholders were informed about during the approval process.
When shareholder treatment and release terms are aligned—economics, disclosure, and claim scope—the plan tends to move forward with fewer surprises, and the company avoids paying for the same uncertainty twice.
9.5 Aligning Incentives Through Management Equity and Retention Plans
Management incentives have two jobs in a restructuring: keep key people while the company is busy, and make sure decisions during the turnaround point in the same direction. Equity and retention plans do both, but only if the economics match the real constraints of the situation.
Foundational Principles for Incentive Alignment
Start with a simple question: what behavior must management repeat every week to stabilize the business? For many turnarounds, the answer is operational discipline—cash collection, cost control, and reliable execution of the 90-day plan. Then translate that behavior into measurable outcomes that can be tracked without heroic data work.
Next, decide what “success” means for the equity component. In restructurings, equity often becomes a smaller slice of a reorganized balance sheet, so the plan must be designed around the post-reorganization reality. If management equity is granted too early or without clear vesting triggers, it can become either meaningless (because it never vests) or risky (because it creates pressure to take short-term actions that harm long-term stability).
Finally, separate retention from performance. Retention addresses the immediate risk of losing people during the transition. Performance addresses the risk of misaligned decisions after the company stabilizes.
Management Equity Design That Works in Practice
A workable management equity plan usually includes four elements: grant size, vesting schedule, performance gates, and transfer restrictions.
Grant size. Keep it tied to roles, not titles. A plant controller who owns cash reporting accuracy may deserve more than a senior executive who is less involved in daily execution. Use a role-based approach so the plan reflects where value is actually created.
Vesting schedule. Use time-based vesting to reward staying through the hard parts, but add performance gates so time alone does not grant value. For example, a CFO might vest 25% after the first budget cycle, then vest the remainder only if liquidity targets are met for two consecutive quarters.
Performance gates. Choose metrics that management can influence and that are hard to game. Common examples include cash conversion cycle improvements, gross margin stabilization, and reduction of past-due receivables. If you use EBITDA, define it tightly and reconcile it to cash where possible, because restructurings often distort accounting measures.
Transfer restrictions. Restrict sale or transfer of equity until the company has met defined milestones. This prevents management from cashing out immediately and reduces the incentive to optimize for a quick exit rather than durable recovery.
Retention Plans That Prevent Talent Flight
Retention plans should be short, specific, and administratively simple. The goal is to pay for continued service during the restructuring window, not to create a long-term compensation obligation that the reorganized company cannot sustain.
Eligibility. Identify “must-keep” roles using operational dependency. If a function cannot be covered without major disruption—payroll processing, treasury operations, key customer account management—those roles are strong candidates.
Payment structure. Use installments tied to service and key milestones. For instance, pay 40% at emergence, 30% after the first on-time financial reporting cycle, and 30% after the company meets a defined working capital target.
Clawbacks and forfeitures. Include clear forfeiture triggers for voluntary departure or misconduct. Avoid overly broad clawbacks that create disputes; narrow triggers reduce friction and make the plan easier to administer.
Integrated Example for a Reorganized Company
Assume a mid-sized manufacturer is reorganizing after covenant breaches. Management proposes a combined plan:
- Retention: 12-month retention for the CFO, controller, head of sales operations, and two plant finance leads.
- Equity: a pool of management equity granted at emergence, with vesting over 24 months.
- Performance gates: (1) past-due receivables reduced by a defined percentage by quarter end, and (2) weekly cash forecast accuracy within a tolerance band for two consecutive quarters.
If the company misses the receivables target due to a one-time dispute with a major customer, the plan should specify how that is handled—such as excluding the disputed amount from the calculation—so management is not punished for events outside their control.
Mind Map: Incentive Architecture
Implementation Details That Reduce Friction
Document the plan economics in plain language for participants and in precise language for administration. Define metric formulas, measurement dates, and who certifies results. If the plan uses a weekly cash forecast, specify the tolerance band and the source of truth for actuals.
Also coordinate the equity and retention plan with the broader restructuring timeline. For example, if emergence occurs on 2026-04-15, set vesting measurement windows that start immediately after emergence rather than mid-cycle, so management does not face a confusing “partial period” calculation.
When the plan is coherent, management understands what to do: stay through the transition, hit the operational targets that protect liquidity, and earn equity only when the reorganized company is actually functioning.
10. Financing the Turnaround with DIP and Interim Capital
10.1 Interim Financing Needs and Funding Source Selection
Interim financing exists to bridge the gap between “we need cash now” and “the final restructuring plan is funded and operating.” The job is not to solve the company’s long-term capital structure in one stroke; it is to keep critical operations running, preserve value, and avoid avoidable defaults while negotiations and documentation move forward.
Step 1: Quantify Interim Cash Needs with a Decision-Ready Forecast
Start with a weekly cash forecast that ties cash movements to specific actions. Build it from three layers: (1) operating cash drivers (collections, payroll, utilities, freight), (2) required payments that cannot be skipped without consequences (taxes, insurance, key vendor terms), and (3) restructuring execution costs (legal, advisory, systems, severance, and any required professional retainers).
A practical way to avoid “forecast theater” is to include a funding trigger table. For each trigger, specify the cash balance threshold, the action to take, and the person responsible. Example: if cash drops below $2.0 million for two consecutive weeks, pause nonessential capex and renegotiate payment timing with selected vendors.
Step 2: Identify What the Interim Money Must Cover
Interim financing typically covers five buckets:
- Working capital to stabilize collections and prevent production stoppages.
- Critical vendor continuity so supply does not dry up.
- Restructuring execution so the process can actually close.
- Cure and default management to address near-term covenant or payment issues.
- Administrative runway for ongoing reporting, payroll, and compliance.
If the company cannot explain which bucket each dollar supports, lenders will assume the money is a general-purpose wish.
Step 3: Match Funding Sources to Constraints and Control Needs
Funding sources differ in cost, speed, collateral requirements, and control rights. Selection should be driven by constraints you can measure.
Speed constraint: If the company needs cash within weeks, prioritize sources that can close quickly and accept interim reporting.
Collateral constraint: If assets are already heavily pledged, unsecured or superpriority structures may be necessary.
Control constraint: Some lenders require tighter budgets, reporting, and consent rights. Decide early how much operational flexibility you can give up.
Covenant constraint: Interim lenders often impose tighter covenants than the company can comfortably meet. Choose terms that align with the forecast, not with optimism.
Step 4: Compare Common Interim Funding Options
Use a structured comparison so the decision is defensible.
- Asset-based lending (ABL): Often fastest when receivables and inventory are reliable. Example: a distributor with strong receivables can borrow against eligible invoices, reducing reliance on uncertain collections.
- Unsecured bridge or term loan: Useful when collateral is limited, but may be expensive and may require stronger governance.
- Equity injection: Can reduce immediate debt pressure, but may be slower to negotiate and can dilute existing stakeholders.
- Debtor-in-possession style financing: Typically designed for court-supervised processes, with defined reporting and priority mechanics.
A simple rule: if the company’s working capital is the main problem, ABL-like structures usually fit better than pure equity. If execution costs and administrative runway are the main problem, unsecured or superpriority structures may be more practical.
Step 5: Design the Funding Package Around Terms That Matter
When negotiating interim financing, focus on the terms that affect day-to-day execution:
- Interest and fees: Ensure the forecast includes all cash costs, not just the headline rate.
- Availability mechanics: Clarify borrowing base calculations, eligibility rules, and cure periods.
- Reporting cadence: Weekly vs. monthly reporting changes lender monitoring and internal workload.
- Budget and variance rules: If the lender can declare a default for small deviations, the company will spend time managing paperwork instead of operations.
- Events of default: Identify which triggers are within management control and which are not.
- Collateral and priority: Confirm how priority interacts with existing liens and administrative claims.
Mind Map: Interim Financing Needs and Funding Source Selection
Example: Choosing Between ABL and Unsecured Bridge
Assume a manufacturing company has $12 million of receivables, but only $7 million are reliably collectible within 60 days. It also needs $3 million for near-term execution costs.
- ABL path: Borrow against eligible receivables and inventory. The company must tighten credit controls and provide aging reports. This reduces uncertainty on working capital but may not fully cover execution costs.
- Unsecured bridge path: Faster to negotiate if collateral is constrained, but the lender will likely require stronger reporting and may charge higher fees. The company must ensure the forecast can meet interest and any covenants.
A common integrated approach is to use ABL for working capital stabilization and pair it with a smaller unsecured tranche for execution costs, so the company does not force every dollar through collateral eligibility rules.
Step 6: Lock in Operational Ownership Before Closing
Interim financing fails most often because the company cannot operationalize the terms. Assign owners for: (1) weekly cash reporting, (2) borrowing base inputs, (3) variance explanations, and (4) trigger actions. Before signing, run a “mock week” where the team produces the first report and calculates availability using the exact lender methodology. If the numbers do not reconcile, fix the process before the money arrives.
10.2 DIP Financing Term Sheet Components and Collateral Structure
A DIP term sheet is the bridge between “we need cash now” and “we can keep operating while the plan is built.” The components below are the ones that actually change outcomes: who gets paid first, what assets secure the money, what reporting and budget controls exist, and what happens if the company misses milestones.
Core Term Sheet Components
1. DIP Amount, Draw Mechanics, and Funding Conditions
The term sheet states the total DIP commitment and how money is released. Many deals use staged draws tied to a budget and a milestone schedule. For example, a $30 million DIP might fund $10 million at closing, then release the rest only after the company delivers an approved 13-week cash flow and evidence that key vendors are being paid on time.
2. Interest Rate, Fees, and Payment Terms
Interest is usually priced above the company’s pre-filing cost of capital to compensate for the risk of being repaid during a restructuring. Fees often include an upfront fee, a commitment fee on undrawn amounts, and a default fee if reporting or covenants fail. A practical example: if the company misses a weekly reporting deadline, the lender may increase the interest rate for the period of noncompliance.
3. Maturity, Amortization, and Optional Repayment
DIP maturity is typically aligned with the restructuring timeline. Amortization may be minimal, with repayment expected at emergence or through a refinancing. If the company sells an asset, the term sheet may require a portion of proceeds to be applied to DIP repayment, reducing lender risk.
4. Budget, Reporting, and Variance Controls
Most DIP structures require a budget approved early in the process, plus weekly or biweekly reporting. Variance thresholds matter. For instance, if payroll or freight costs exceed the budget by more than a set percentage, the company may need lender consent before spending further.
5. Covenants and Milestones
Covenants cover operational actions (like maintaining insurance), legal steps (like filing a plan by a date), and financial discipline (like not incurring new liens without consent). Milestones are where term sheets become real: missing a plan filing date can trigger a default or require a lender waiver.
6. Events of Default and Remedies
The term sheet lists defaults such as failure to deliver reports, breach of budget limits, or failure to maintain collateral value. Remedies often include the right to stop further draws, accelerate repayment, or enforce collateral.
7. Superpriority and Priority Waterfall Effects
DIP lenders typically receive superpriority status, meaning they are paid ahead of other claims to the extent permitted by law. The term sheet should clearly state how DIP repayment interacts with other secured debt and administrative claims.
Collateral Structure: What Secures the DIP
Collateral is the “how the lender gets comfortable” section. It also determines how much flexibility the company retains.
1. Collateral Scope and Grant Language
Collateral usually includes substantially all assets, often described as a blanket lien on current and future property. A common example is a lien on accounts receivable, inventory, equipment, and general intangibles. The company should understand which assets are excluded, such as certain leased assets or assets subject to existing liens.
2. Priority Relative to Existing Liens
The term sheet must address how DIP liens rank against pre-filing secured creditors. If existing lenders have perfected liens, DIP may be structured to prime them under applicable rules, but the practical effect depends on the collateral overlap and the court-approved priority.
3. Perfection and Control Mechanics
Perfection steps include filing UCC-1 financing statements, obtaining possession or control where required (for certain collateral types), and ensuring collateral descriptions are accurate. A simple example: if the company’s receivables are moved into a lockbox arrangement, the lender may require control of the lockbox to ensure collections flow to DIP repayment.
4. Cash Management and Lockbox Terms
Cash management provisions specify where cash is deposited and how it is applied. A typical structure uses a disbursement account for approved expenses and a sweep mechanism for excess cash. This reduces the chance that DIP funds are used for non-approved spending.
5. Valuation and Collateral Maintenance
Some term sheets include requirements to maintain collateral value through insurance, preservation of assets, and restrictions on asset sales. If inventory is a major collateral component, the company may need to maintain certain levels or replace obsolete items.
Mind Map: DIP Term Sheet and Collateral Flow
Example: Translating Terms Into Daily Operations
Assume a company has $8 million in weekly operating needs and expects a 10-week plan negotiation period. The DIP term sheet sets a $25 million commitment with $12 million funded at closing and $13 million available in two additional draws. The budget requires weekly reporting and lender consent if operating expenses exceed the budget by 5% in any week. Collateral is substantially all assets, with a lockbox for receivables collections and a sweep of excess cash above a minimum liquidity buffer. If the company misses the weekly reporting deadline twice, the lender can pause further draws, which forces the company to treat reporting as a core operational function rather than a paperwork chore.
Practical Checklist for Collateral Clarity
A term sheet is easier to manage when the company can answer these questions in plain language: which assets secure the DIP, how cash collections are routed, what approvals are required to spend, what triggers a draw stop, and how DIP repayment priority affects other stakeholders. When those points are explicit, the company can run the turnaround without constantly guessing what the lender will consider “allowed.”
10.3 Budgeting and Reporting Requirements for Ongoing Draws
Ongoing draws—whether under DIP, interim credit, or a revolving facility—depend on a simple idea: the lender funds only what the budget says you need, and the budget stays credible because reporting proves it. The trick is to build a budget that is operationally grounded and a reporting cadence that is consistent enough to prevent “surprise” liquidity.
Budgeting Foundations for Draw Eligibility
Start with a draw budget that ties cash to drivers, not accounting labels. A practical approach is a 13-week cash forecast updated weekly, plus a monthly budget for the remaining months of the facility term. The 13-week view answers “what cash do we need next,” while the monthly view answers “what cash do we need after that.”
Use a driver-based structure:
- Collections: expected receipts by customer segment and aging bucket.
- Disbursements: payments by vendor group, contract type, and due date.
- Payroll and taxes: payroll calendar, statutory remittances, and benefit timing.
- Rent, utilities, and maintenance: recurring commitments and planned maintenance windows.
- Restructuring costs: severance, professional fees, and one-time transition costs.
Then add a “bridge” that explains how the forecast changes week to week. If collections slip, the bridge should show whether it’s timing, disputes, or customer concentration. If spend increases, it should show whether it’s a timing shift or a true cost change.
Reporting Requirements That Match the Draw Mechanics
Most draw frameworks require three things: (1) a budget, (2) a compliance package, and (3) a draw request with supporting evidence. Build the reporting package so it can be reused each draw cycle.
A typical weekly package includes:
- Cash forecast update for the next 13 weeks.
- Actuals vs. forecast for the prior week and month-to-date.
- Variance explanations with driver-level reasons.
- Covenant and liquidity status (if applicable).
- Material changes to assumptions, such as customer payment behavior or vendor payment terms.
For monthly reporting, include:
- Income statement and balance sheet roll-forward sufficient to reconcile cash movements.
- Working capital detail: AR aging, AP aging, inventory movement.
- Restructuring cost tracker with approvals and payment status.
To keep the lender comfortable, include a short “what changed” section in every submission. It should be factual and limited to items that affect cash.
Example Draw Cycle with Concrete Inputs
Assume a facility allows weekly draws up to a maximum, subject to a lender-approved budget. On 2026-04-06, the company submits a draw request for the week of 2026-04-07.
- Forecast cash need: $2.4 million for payroll, taxes, and vendor payments.
- Available cash: $0.6 million.
- Net draw request: $1.8 million.
The reporting package shows:
- Collections expected this week: $1.1 million, based on aging bucket behavior.
- Vendor payments: $1.3 million, based on due dates and negotiated terms.
- Restructuring costs: $0.2 million, supported by approved invoices.
If actual collections from the prior week were $0.2 million lower than forecast, the variance section explains whether it was timing (payments moved by two days) or credit quality (disputes increased). The lender cares about the reason because it determines whether the shortfall repeats.
Mind Map: Ongoing Draw Budgeting and Reporting
Practical Controls That Prevent Reporting Drift
Reporting fails when the budget becomes a spreadsheet exercise. Prevent drift with three controls:
- Single source of cash assumptions: collections and disbursements should be updated from the same operational systems each week.
- Variance thresholds: require explanations only when variances exceed defined tolerances, so the package stays focused.
- Approval trail for restructuring costs: every restructuring line item should link to an approval and payment status.
When these controls are in place, ongoing draws become routine: the lender receives consistent information, and the company uses the same information to manage liquidity rather than merely report it.
10.4 Priority Claims and Superpriority Liens Explained for Execution
When a company needs interim cash to keep operating, the financing terms often create a hierarchy of who gets paid first. In restructuring, that hierarchy is not just accounting—it determines whether lenders will fund the next week, the next month, and the next milestone. Priority claims and superpriority liens are the tools that make that hierarchy enforceable.
Foundational Concepts That Drive Execution
Priority Claims
Priority claims are obligations that, by statute or court order, must be satisfied before other claims in the relevant payment waterfall. In practice, priority status reduces uncertainty for the claimant and increases the likelihood of timely payment.
Example: A debtor incurs professional fees during a case. If those fees are granted administrative priority, they are treated as higher in the payment order than pre-filing unsecured claims. That status affects both budgeting and negotiation leverage.
Superpriority Liens
A superpriority lien is a security interest that jumps above existing liens, typically granted to the interim or debtor-in-possession lender. It is “super” because it can outrank earlier secured creditors, subject to the specific legal framework and court approval.
Example: Suppose a company has a first-lien lender with collateral coverage that looks thin. A DIP lender may receive a superpriority lien on the same collateral pool. Even if the first-lien lender expects limited recovery, the DIP lender’s superpriority position can still justify funding.
Why Courts and Budgets Care
Execution depends on cash timing. If the financing order does not clearly define priority and collateral rights, the lender’s risk increases and funding can stall. The debtor’s budget also becomes harder to defend because cash availability depends on who gets paid first.
How Priority and Liens Show Up in the Term Sheet
A DIP or interim financing term sheet usually translates priority concepts into concrete mechanics:
- Collateral scope: Which assets secure the financing, and whether the lien attaches to proceeds and after-acquired property.
- Lien priority: The order of payment and the ranking relative to existing liens.
- Adequate protection concepts: How existing secured creditors are protected, often through cash payments, replacement liens, or other measures.
- Budget and reporting: The lender’s ability to monitor use of funds, which affects draw approvals.
Example: A lender agrees to fund $5 million in tranches only if the debtor delivers weekly cash reports and the court order confirms the superpriority lien ranking. Without that confirmation, the lender may refuse the second tranche.
Mind Map: Priority Claims and Superpriority Liens
The Execution Workflow from Order to Payment
Step 1: Confirm the Legal Basis
Before drafting, identify what creates priority: statute, court order, or financing documents. Priority that is not grounded in the correct authority can be challenged later, which is the opposite of helpful.
Example: If a debtor assumes a claim is administrative priority but the work was not court-approved, the claimant may face a lower priority classification.
Step 2: Translate Priority Into a Waterfall
Execution requires a payment waterfall that matches the order. The waterfall should map categories of claims to their expected payment order.
Example: A simplified waterfall might place (1) DIP lender principal and interest with superpriority lien proceeds, then (2) administrative expenses, then (3) existing secured claims, then (4) unsecured claims.
Step 3: Draft Collateral and Proceeds Language Carefully
Superpriority liens often hinge on whether they cover:
- Direct collateral (the assets pledged)
- Proceeds (cash received from selling or collecting on collateral)
- Replacement collateral (assets substituted under court-approved conditions)
Example: If the order says the lien covers “proceeds,” then cash collected from accounts receivable can be treated as collateral proceeds. If the language is vague, disputes can arise about whether collections must be remitted to the DIP lender.
Step 4: Align Budget Controls with Priority Rights
Budgets are not just planning documents; they are operational guardrails tied to draw conditions. If the debtor spends outside the approved budget, the lender may restrict draws, which can indirectly affect who gets paid.
Example: A debtor’s approved budget includes payroll and vendor payments. If the debtor diverts cash to non-budgeted expenses, the lender may pause funding, reducing the debtor’s ability to pay administrative expenses.
Example: A Clean Priority Outcome in a Tranche Funding Scenario
Assume a company files for restructuring and needs $6 million DIP financing. The court approves a superpriority lien for the DIP lender on substantially all assets and confirms that DIP repayment is paid from collateral proceeds ahead of existing secured debt.
- Tranche 1: $2 million funds immediate payroll and critical suppliers.
- Tranche 2: $4 million is released after the debtor meets weekly reporting and cash burn targets.
- Payment at liquidation: DIP principal and approved interest are satisfied first from collateral proceeds, then administrative expenses, then remaining secured claims.
Because the order clearly states ranking and collateral coverage, the DIP lender funds both tranches without negotiating midstream, and the debtor can run the operating plan with fewer surprises.
Mind Map: Execution Checks Before Closing
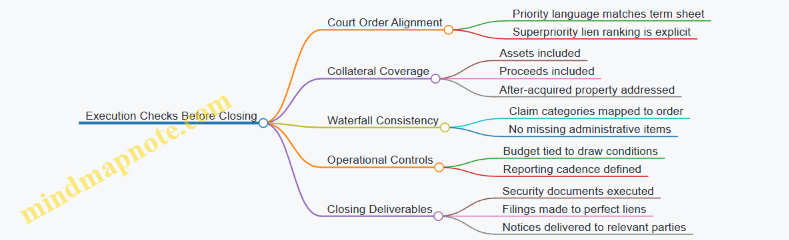
Priority claims and superpriority liens are only useful when they are specific enough to survive real-world friction. Clear ranking, precise collateral scope, and budget-linked draw mechanics turn a financing agreement into executable cash flow.
10.5 Avoiding Liquidity Traps Through Funding Milestones
A liquidity trap happens when a company secures financing on paper but cannot access enough cash when it is needed. The usual culprit is milestone design: funding is tied to conditions that are slow, ambiguous, or dependent on information that arrives late. The fix is to treat funding milestones like engineering requirements—clear inputs, measurable outputs, and predictable timing.
Start with a simple principle: every draw should be linked to a specific cash need and a specific deliverable. For example, if payroll taxes are due in week 3, the funding milestone should not require a “material progress” statement. Instead, it should require a concrete artifact such as an approved weekly cash forecast and evidence of tax payment scheduling. This keeps the draw decision grounded in observable facts.
Funding Milestones That Match Cash Reality
Build milestones around the cash conversion cycle. If collections are slow, the company needs earlier funding for receivables-related working capital. If suppliers require tighter terms, milestones should fund payables before the vendor relationship deteriorates. A practical approach is to create a “cash calendar” for the next 8–13 weeks and then map each draw to a line item on that calendar.
Example: A manufacturer forecasts that it will miss a critical payment to a key supplier unless it receives an interim tranche by day 25. The interim tranche is structured with a milestone that can be satisfied quickly: submission of a signed vendor payment schedule, confirmation of inventory availability, and a weekly reporting cadence. The milestone is designed to be satisfied even if revenue is flat, because the goal is continuity, not performance miracles.
Conditions Precedent That Do Not Stall
Conditions precedent are often written as legal checklists that sound reasonable but fail operationally. Common stall points include:
- Deliverables that require multiple internal approvals with no defined owners.
- Reports that depend on data that is not yet captured in the ERP.
- “No material adverse change” language that is interpreted differently by each party.
To avoid this, define each condition with three elements: owner, timing, and acceptance criteria. Acceptance criteria should be objective. For instance, “weekly cash forecast submitted” is acceptable; “forecast is satisfactory” is not.
A helpful tactic is to run a “milestone dry run” before signing. Take the first milestone and simulate the process: who gathers the documents, how long it takes to compile them, and what happens if a data field is missing. If the simulation shows a two-week delay, adjust the milestone or the reporting system before it becomes a real bottleneck.
Milestones with Built-In Buffer
Even well-designed milestones face friction: legal review cycles, bank processing delays, and internal staffing constraints. Add buffer by separating “submission” from “funding.” For example, require submission by day 10 and funding by day 15, rather than tying funding to submission day. This gives room for review without turning the draw into a hostage situation.
Also consider partial draws. If the full tranche requires a complex deliverable, structure an initial smaller draw tied to simpler items, then a second draw tied to the complex deliverable. This prevents the company from waiting for the perfect package while it runs out of cash.
Reporting Cadence That Supports Draw Decisions
Milestones should not create a reporting burden that the company cannot sustain. Align draw reporting with the operating rhythm. If the company runs weekly cash meetings, the draw reporting should use the same cadence and the same template. Consistency reduces disputes and shortens review time.
Example: A retailer’s interim financing includes a milestone requiring “variance analysis.” The company already produces a weekly variance report for store-level labor and inventory shrink. The milestone references that existing report format, so the team does not invent a new spreadsheet under time pressure.
Mind Map: Funding Milestones to Prevent Liquidity Traps
A Simple Milestone Template in Practice
Use a milestone statement that reads like a receipt. For instance: “On or before Day 10, the CFO submits the weekly cash forecast for weeks 1–8 using the agreed template; acceptance is confirmed within 3 business days if the forecast includes opening cash, collections assumptions, disbursement schedule, and variance explanations for the prior week.” This style makes it harder for anyone to argue about what “good enough” means.
Finally, treat the milestone schedule as part of the cash plan, not a side document. When the milestone calendar is reviewed alongside the cash calendar, the company can adjust operations early—before a missed draw becomes a missed payment.
11. Implementation Planning and Restructuring Governance
11.1 Building a Restructuring Program Management Office
A Restructuring Program Management Office (PMO) is the control center that turns a restructuring plan into coordinated work. It does not replace legal counsel, finance, or operations; it makes sure those teams pull in the same direction, with the same numbers, and on the same calendar. Think of it as the place where decisions become tasks, tasks become deliverables, and deliverables become proof.
Core Purpose and Operating Principles
Start with three non-negotiables.
-
Single source of truth for decisions. Every key decision—cash cut, vendor priority, term sheet change, claim treatment position—gets recorded with owner, rationale, and impact on cash, risk, or value.
-
Integrated workstreams. Legal, finance, operations, and stakeholder communications run on shared milestones rather than separate calendars that drift.
-
Measured progress. The PMO tracks deliverables and dependencies, not just meeting attendance.
A practical way to enforce this is a weekly “decision-to-deliverable” review: the PMO lists the decisions made, then shows the tasks created from them, and finally confirms whether the tasks are on track.
PMO Structure and Roles
A lean PMO usually includes:
- Program Director: owns the integrated plan, escalates blockers, and chairs the decision cadence.
- PMO Lead for Planning and Reporting: maintains the master schedule, RAID log (risks, assumptions, issues, dependencies), and KPI dashboard.
- Workstream Coordinators: one per major track (legal, finance, operations, communications).
- PMO Analyst: supports data room indexing, status consolidation, and variance explanations.
If the company is small, one person can cover multiple roles, but the responsibilities must remain distinct. A common failure mode is “status reporting without control,” where someone produces slides but cannot trace outcomes back to decisions.
Integrated Governance Cadence
Use a consistent rhythm so teams know what to prepare.
- Daily 15-minute operational sync: cash movements, critical vendor issues, and immediate blockers.
- Twice-weekly workstream huddles: legal drafting status, finance model updates, operational KPI movement.
- Weekly steering meeting: confirm decisions, approve changes to scope or assumptions, and resolve escalations.
To keep this from becoming a meeting marathon, the PMO sets a rule: every agenda item must have a proposed decision or a specific request for input.
Master Plan and Milestone Design
The master plan should be built around decision gates, not activity lists. A typical sequence:
- Stabilization gate: cash forecast baseline, working capital actions, and funding needs.
- Diagnosis gate: normalized financials, covenant/default assessment, and value drivers.
- Strategy gate: restructuring pathway selection and high-level claim treatment.
- Documentation gate: term sheet alignment, disclosure readiness, and voting package draft.
- Implementation gate: closing deliverables, reporting controls, and post-reorg operating cadence.
Each gate includes entry criteria (what must be true) and exit criteria (what must be delivered). For example, “documentation gate” should not be considered complete until the disclosure package has consistent claim tables and the economic terms match the latest model.
Data, Controls, and Traceability
The PMO should enforce data hygiene because restructuring decisions are only as good as the numbers behind them.
- Model control: versioning rules for cash forecasts and valuation models.
- Document control: naming conventions and indexing so teams can find the latest draft.
- Assumption register: a list of key assumptions (e.g., recovery rates, cost reductions, timing of divestitures) with owners.
A simple example: if operations proposes a 10% cost reduction starting next month, the PMO ensures finance updates the forecast and legal reflects the timing in the plan narrative. Otherwise, you get “two truths” that later collide.
Mind Map: PMO Components and Flows
Example: One-Week PMO Workflow
Monday: the PMO updates the weekly cash forecast version and records the assumption changes in the register. The operations coordinator confirms which cost actions are actually approved and when they start.
Tuesday: legal drafts the next disclosure section. The PMO checks that the claim treatment table matches the latest liability mapping and flags any mismatch before it becomes “final.”
Wednesday: the steering meeting agenda includes one decision: whether to adjust vendor payment priority based on forecasted liquidity. The PMO presents the cash impact and the operational risk, then records the decision and assigns tasks.
Friday: the deliverable tracker shows whether the assigned tasks are on track, and the RAID log captures any unresolved dependency. If a deliverable is late, the PMO does not just note it; it identifies what decision or input is missing.
Practical Tips for Avoiding Common PMO Traps
- No dashboard without ownership. Every metric must have a named owner and a defined data source.
- No gate without criteria. If “ready” is subjective, teams will argue instead of execute.
- No workstream isolation. Legal drafts, finance models, and operations plans must share the same assumptions and timeline.
A well-run PMO makes the restructuring feel less like a sequence of urgent fires and more like a controlled set of choices, each with a clear owner and a measurable outcome.
11.2 Integrating Legal Operational and Financial Workstreams
Integration is not a meeting schedule; it is a shared decision system. Legal, operations, and finance each see different evidence, but restructuring outcomes depend on how quickly they convert evidence into consistent actions. A practical integration approach starts with three rules: one set of assumptions, one set of approvals, and one set of deliverables.
Shared Assumptions and a Single Source of Truth
Begin by agreeing on a small set of assumptions that all workstreams use. Finance might assume a weekly cash burn rate; operations might assume staffing levels; legal might assume the timing of plan milestones. If these assumptions drift, the team will produce documents that cannot all be true at the same time.
A simple method is to maintain an “Assumptions Register” with fields for owner, version date, scope, and impact. For example, if operations proposes pausing a vendor contract to preserve cash, finance updates the cash forecast and legal checks whether the contract termination triggers notice periods or consent requirements. The register prevents the classic failure mode: finance models the savings, legal blocks the action, and operations already told the vendor it would stop paying.
Workstream Interfaces and Decision Cadence
Integration requires explicit interfaces. Legal needs operational facts to draft accurate provisions; operations needs legal constraints to avoid promising what cannot be delivered; finance needs both to quantify feasibility.
Define three recurring decision points:
- Feasibility Check: Can the proposed operational change be executed within legal constraints?
- Economic Check: Does the financial model reflect the operational plan and legal timing?
- Documentation Check: Are the documents consistent with the approved economics and operational steps?
Use a weekly cadence for feasibility and economics, and a tighter cadence for documentation during major milestones. A useful trick is to attach each decision point to a specific artifact. For instance, “Feasibility Check” produces a short legal feasibility memo; “Economic Check” produces a revised cash forecast; “Documentation Check” produces a redline list.
Mind Map: Integration Map for Legal, Operational, and Financial Workstreams
Example: Vendor Continuity with Contract Constraints
Suppose operations wants to keep a critical supplier running by renegotiating payment terms. Finance estimates that moving from net 30 to net 45 preserves cash for 60 days. Legal reviews the master supply agreement and finds a clause requiring consent for any payment term change.
Integration turns this into a sequence:
- Operations drafts the operational rationale and the exact term change request.
- Legal confirms consent requirements and identifies whether the change can be done under existing authority or needs a formal amendment.
- Finance updates the forecast twice: once assuming consent is obtained, and once assuming it is not.
The team then selects the option that matches both economics and legal feasibility. The key is that the decision is documented once, and every workstream updates its artifacts from that decision.
Example: 90-Day Operating Plan That Matches Legal Milestones
A 90-day operating plan often includes actions like cost reductions, system changes, and asset sales. Legal milestones might require specific dates for plan filing, voting, and confirmation. If operations schedules a sale before legal authorization exists, finance will show cash inflows that cannot legally be realized.
To prevent this, attach each operational action to a legal dependency. For example, “Asset sale closing” depends on court approval or plan effectiveness. Finance then links cash inflows to the dependency date rather than a calendar guess. Operations keeps the action in the plan but marks it as “conditional,” so the team can track whether the dependency is cleared.
Documentation and Approval Discipline
Integration fails when documents are produced in parallel without a shared checklist. Create a single “Closing and Reporting Checklist” that lists deliverables by date and owner, including legal filings, operational handoffs, and finance reporting updates.
A practical checklist item looks like this: “Update weekly cash forecast template to reflect approved claim payment timing.” Legal confirms the timing language; finance updates the model; operations confirms that the spend controls match the forecast.
Practical Integration Artifacts
To keep the system lightweight but reliable, standardize three artifacts:
- Assumptions Register: the agreed facts and their owners.
- Decision Log: what was decided, when, and why.
- Redline List: the exact document changes required to reflect decisions.
When these artifacts are used consistently, legal, operations, and finance stop arguing about the same issue in different rooms. They still disagree sometimes, but the disagreement becomes structured and resolvable, which is the whole point of integration.
11.3 Creating Decision Logs and Approval Workflows for Transactions
A restructuring transaction is a chain of small decisions with big consequences. A decision log and an approval workflow turn those decisions into something you can audit, explain, and defend—without slowing execution to a crawl.
Core Purpose and Scope
A decision log captures what was decided, why it was decided, who approved it, and what evidence supported the choice. An approval workflow defines the path a transaction takes from proposal to signature, including required reviews and escalation rules.
Start by scoping coverage: include any transaction that changes cash, collateral, ownership, or legal rights. That typically covers vendor settlements, contract terminations, asset sales, debt amendments, DIP draw requests, and any agreement that creates new obligations.
Decision Log Structure That Stays Useful
Use a consistent template so entries can be searched and compared.
- Decision ID and Date: Example: D-0147, logged on 2026-04-10.
- Transaction Summary: One paragraph describing the action in plain language.
- Decision Type: Approve, modify, reject, or defer.
- Rationale: Link the decision to the restructuring objective, such as liquidity preservation or claim alignment.
- Key Assumptions: List the operating or financial assumptions used.
- Alternatives Considered: At least two options, even if one was obviously worse.
- Risk Notes: Identify the top legal, operational, and cash risks.
- Approvals: Names and roles, plus the approval level.
- Supporting Evidence: Reference the specific model, memo, or term sheet section.
- Implementation Notes: Who executes, what documents are required, and the closing checklist.
A good log entry reads like a decision memo compressed into a form. If someone can’t understand it without the original email thread, the template is too vague.
Approval Workflow Design with Clear Gates
Design the workflow around decision gates rather than job titles. Gates reflect what must be true before moving forward.
Gate 1: Completeness Check
- Required inputs: term sheet draft, cash impact, legal impact summary, and responsible owner.
- Output: either “ready for review” or “return for missing items.”
Gate 2: Financial and Liquidity Review
- Validate cash timing, covenant effects, and working capital implications.
- Output: “financially acceptable” or “requires changes.”
Gate 3: Legal and Authority Review
- Confirm authority, required consents, and documentation completeness.
- Output: “legally workable” or “blocked pending revisions.”
Gate 4: Stakeholder Impact Review
- For creditor-facing actions, confirm claim treatment logic and disclosure consistency.
- Output: “aligned with plan assumptions” or “needs stakeholder strategy adjustment.”
Gate 5: Final Approval and Execution
- Approvals depend on transaction size and risk tier.
- Output: signature authorization and closing checklist activation.
Mind Map: Decision Logs and Approval Workflows
Example Workflow in Practice
Consider a proposed settlement with a key supplier to preserve supply continuity.
- Proposal submitted with a one-page term sheet: settlement amount, payment timing, and contract continuation language.
- Gate 1 checks completeness: cash impact and contract clause changes are included.
- Gate 2 confirms the settlement does not breach a near-term liquidity minimum and improves forecasted cash by reducing dispute-driven delays.
- Gate 3 verifies authority and ensures the settlement does not unintentionally waive rights needed for plan consistency.
- Gate 4 checks whether the settlement affects claim categorization or disclosure language.
- Gate 5 final approval is granted based on the transaction’s risk tier and threshold.
The decision log entry then records the rationale: “Settlement approved to maintain supply and reduce cash uncertainty,” plus the alternatives considered, such as partial payment without release or continued litigation.
Risk Tiers and Escalation Rules
Define tiers using two dimensions: cash magnitude and rights impact. A small cash payment that changes collateral rights should still be treated as high impact.
Escalation should be deterministic. For example: if legal review flags missing authority or conflicting release language, the workflow returns to the proposer with a specific correction list. If financial review finds covenant sensitivity, the workflow requires revised numbers before any final approval.
Implementation Notes That Prevent Chaos
Version control matters. Every approval should reference the specific draft version of the term sheet or agreement. Closing deliverables should be listed in the decision log so execution doesn’t rely on memory.
Finally, assign a single decision owner per transaction. Multiple approvers are normal; multiple owners create gaps. The log should make it obvious who is accountable for moving the transaction through each gate and confirming completion.
11.4 Stakeholder Communication Plans for Creditors and Employees
A restructuring succeeds or fails partly on what people believe is happening. A stakeholder communication plan turns that belief into something measurable: who gets what information, when, and how decisions are explained without leaving room for rumor to do the work.
Core Principles for Credible Communication
Start with three constraints. First, accuracy beats speed. If a number is not final, label it as “current estimate” and state what will change next. Second, consistency beats volume. Use the same definitions across finance, legal, and operations so stakeholders do not compare apples to “apples with a different label.” Third, usefulness beats reassurance. Every message should answer at least one practical question: payment timing, job impact, process steps, or where to find updates.
Stakeholder Map and Message Ownership
Creditors and employees need different information, but both need a single source of truth. Assign message ownership by topic, not by department. For example, liquidity and cash timing belong to finance; process and legal milestones belong to legal; operational changes belong to operations.
A simple rule: if a message changes behavior (vendors tighten terms, employees stop showing up, creditors withhold votes), it must be reviewed by the owner and approved by a small governance group.
Communication Cadence and Channels
Use a cadence that matches decision cycles.
- Weekly for operational stability: cash position, payroll status, major variances, and what changed since last week.
- Milestone-based for legal and economic terms: filing dates, voting deadlines, hearing dates, and confirmation steps.
- Ad hoc for material events: unexpected funding gaps, court rulings, or changes to the restructuring timeline.
For employees, combine a short live update with a written summary. For creditors, use a formal update package plus a Q&A call when terms or timelines shift.
What Creditors Need to Hear
Creditors care about claim treatment, timing, and the logic behind the plan. A strong creditor update includes:
- Current status of the restructuring process.
- Cash and liquidity summary with a clear “runway” explanation.
- Key assumptions behind the plan economics.
- Any changes to collateral, guarantees, or proposed treatment.
- Voting and next-step calendar.
Example: If the plan proposes extending maturities for unsecured debt, explain the trade-off in plain terms: what changes for creditors now (timing, interest, or security) and what operational improvements make that trade-off possible.
What Employees Need to Hear
Employees need clarity on continuity and expectations. A practical employee update includes:
- Payroll and benefits status, stated plainly.
- Any changes to roles, locations, or headcount, with the decision basis.
- What management is doing to protect critical operations.
- How questions will be handled and where answers will be posted.
Example: If a department is being consolidated, avoid vague language like “restructuring efforts.” Instead, state the decision trigger (e.g., loss of a contract, margin shortfall), the effective date for role changes, and the process for internal transfers.
Handling Questions Without Creating New Problems
A communication plan should include a question-handling workflow.
- Capture questions in a shared log.
- Classify them: factual, process, or interpretation.
- Answer factual questions immediately with the latest approved data.
- For interpretation questions, explain the decision logic and what information is still pending.
- If a question reveals a gap in the plan, fix the plan message rather than repeating the same partial answer.
Mind Map: Stakeholder Communication Plan
Templates That Keep Messages Consistent
Use modular templates so each update has the same structure.
- Creditor update template: “Status, Liquidity, Plan Economics, Claim Treatment Changes, Calendar, Q&A.”
- Employee update template: “Payroll Status, Operational Changes, What Management Is Doing, How to Ask Questions, Where to Find Updates.”
Example: If liquidity improves due to working capital collections, the employee update should mention the operational driver (collections and reduced days sales outstanding) rather than only stating “we are doing better.” That level of specificity helps employees understand why actions matter.
Measurement and Feedback Loops
Communication is not just sending; it is verifying comprehension. Track whether stakeholders ask the same questions repeatedly, whether attendance drops at Q&A sessions, and whether voting participation aligns with the timeline. When metrics show confusion, revise the next message module rather than adding more text.
A well-run plan ends up feeling boring in the best way: fewer surprises, clearer decisions, and fewer people filling in blanks with their own assumptions.
11.5 Post Implementation Controls for Reporting and Compliance
Post-implementation controls are what keep a restructuring from becoming a one-time event. The goal is simple: after the plan is confirmed and transactions close, the organization must produce reliable numbers, meet legal obligations, and prove it did so. Think of controls as the company’s “audit trail on purpose,” not as paperwork for its own sake.
Core Control Objectives
- Financial reporting integrity: Ensure the new capital structure, claim treatment, and accounting policies produce accurate statements.
- Compliance with plan terms: Track covenants, reporting schedules, and any required notices to creditors or the court.
- Operational continuity: Maintain cash discipline and approval limits so the turnaround doesn’t drift back into old habits.
- Evidence readiness: Make it easy to demonstrate control performance during internal reviews and external audits.
A practical way to start is to translate plan requirements into a control map: each obligation becomes a process owner, a control activity, a frequency, and an evidence type.
Control Architecture from Day One
1) Ownership and RACI
Assign a process owner for each reporting stream: financial statements, covenant monitoring, tax filings, and plan notices. Then define who prepares, who reviews, and who approves. For example, the treasury lead may prepare covenant calculations, while the CFO reviews and the controller approves the final submission package.
2) Policy and accounting alignment
Confirm that the chart of accounts, debt schedules, and equity classifications reflect the new structure. A common failure is leaving legacy debt identifiers in systems, which causes reporting mismatches and reconciliation churn.
3) Standard operating procedures
Write short procedures for recurring tasks: monthly covenant calculation, quarterly reporting package assembly, and event-driven notices. Procedures should specify inputs, calculation steps, review checks, and where evidence is stored.
4) Evidence and retention
Decide what “good evidence” looks like. Examples include signed approval emails, system extracts with timestamps, reconciliation workpapers, and version-controlled spreadsheets.
Reporting Controls That Actually Catch Errors
Reconciliation controls
- Reconcile debt balances from the legal debt schedule to the general ledger monthly.
- Reconcile claim-related journal entries to the plan confirmation documentation.
- Reconcile cash movements to bank statements and treasury system logs.
Review controls
- Require a reviewer to check variance drivers against an approved explanation template.
- Use a two-step review for covenant metrics: calculation review first, then reasonableness review.
System controls
- Restrict journal entry posting rights and require maker-checker approvals.
- Lock down templates used for covenant calculations to prevent silent formula changes.
Example:
If the plan requires a minimum liquidity threshold, the control should verify both the numerator and the definition. A frequent mistake is using “cash on hand” while the plan defines “cash plus available revolver capacity net of reserves.” The control should include a checklist that references the plan definition and confirms the correct inputs were used.
Compliance Controls for Plan Obligations
Obligation register
Maintain a single register listing every reporting and notice requirement, including due dates, recipients, responsible owners, and the evidence produced. Use it as the source of truth for reminders and internal sign-offs.
Notice workflow
For event-driven obligations (for example, material defaults or changes in key facts), define:
- trigger criteria,
- escalation path,
- drafting responsibility,
- legal review step,
- final approval and delivery method.
Audit trail discipline
Store the final notice, the approval record, and the delivery confirmation together. If a creditor later questions timing, you can answer with documents rather than memory.
Post Implementation Controls Mind Map
Mind Map: Post Implementation Controls
Testing, Remediation, and Training
Controls must be tested, not just documented. Use a cadence aligned to reporting frequency: monthly for covenant calculations, quarterly for reporting package assembly, and event-driven testing for notice workflows. When issues appear, record them with root cause, impact assessment, and remediation steps. Training should focus on the “how” of the process owners’ tasks: what to check, what evidence to save, and what to do when numbers don’t reconcile.
Example:
During the first two covenant cycles after implementation, require an enhanced review: the reviewer independently recalculates one metric and verifies the plan definition. If the metric is correct but the explanation is weak, remediation targets the explanation template rather than the calculation.
Practical Control Checklist for the First Reporting Cycle
- Confirm chart of accounts and debt identifiers match the plan.
- Produce debt and cash reconciliations with signed approvals.
- Calculate covenants using plan definitions and locked templates.
- Assemble the reporting package using the obligation register.
- Save evidence in the agreed repository with version control.
- Complete a reviewer checklist and document any exceptions.
A good post-implementation control system makes the next reporting cycle easier than the last one. It does that by standardizing definitions, tightening approvals, and ensuring evidence is ready before questions arrive.
12. Practical Case Workflows and Documentation Essentials
12.1 Preparing a Restructuring Memorandum and Executive Summary
A restructuring memorandum is the document that turns “we need help” into a structured plan: what is broken, what will change, what it will cost, and what decisions are required from each stakeholder. The executive summary is the short version that a busy reader can use to decide whether to engage, negotiate, or ask for revisions. Together, they should read like a map with a legend, not like a collection of slides.
Executive Summary Purpose and Reader Fit
Write the executive summary for three audiences at once: (1) leadership who must approve actions, (2) creditors who must decide whether to support a proposal, and (3) advisors who must understand the logic quickly. Keep it factual and decision-oriented.
A practical structure is five blocks, each with one job:
- Current position: liquidity status, key defaults or covenant pressure, and why time matters.
- Root causes: the few drivers that explain the cash problem, not a list of symptoms.
- Stabilization plan: the first 30–90 days of actions that stop bleeding.
- Restructuring proposal: the high-level capital and operational changes, stated in plain terms.
- What you need from stakeholders: approvals, voting support, funding commitments, or waivers.
Example: If a company is missing payroll tax payments, the executive summary should say so directly, then connect it to the cash plan (timing of receipts, vendor prioritization, and any interim financing), rather than describing “operational challenges.”
Restructuring Memorandum Structure and Flow
The memorandum should move from diagnosis to design to execution. A common flow that avoids gaps is:
- Company snapshot: business model, geography, major contracts, and reporting currency.
- Problem statement: what changed, when it changed, and which obligations are now at risk.
- Financial diagnosis: liquidity runway, covenant status, and a clear explanation of cash drivers.
- Operational stabilization: near-term actions with owners, timing, and measurable outputs.
- Capital structure and liability mapping: who is owed what, and how claims are expected to be treated.
- Restructuring proposal: the economic terms at a high level, including any exchange, write-down, or new money.
- Implementation plan: governance, workstreams, reporting cadence, and decision gates.
- Risks and mitigants: only the risks that affect execution or stakeholder outcomes.
- Appendix references: where supporting schedules live.
To keep the logic tight, each section should answer one question and then pass the reader to the next question.
Mind Map: Memorandum Content Logic
Integrated Example: Turning Diagnosis Into Decisions
Suppose the diagnosis shows that cash shortfalls come from three drivers: (1) collections lag due to disputed invoices, (2) inventory is overstated and tied up, and (3) vendor terms have tightened after prior missed payments. The memorandum should connect these drivers to specific actions.
- Collections: create a dispute resolution workflow and ring-fence “clean invoices” for faster payment. KPI: percentage of invoices cleared within 30 days.
- Inventory: pause nonessential replenishment and run a liquidation plan for slow movers. KPI: reduction in days inventory outstanding.
- Vendor continuity: prioritize suppliers that keep production running and renegotiate payment schedules for others. KPI: on-time delivery rate and reduced past-due aging.
Then the capital section should reflect the stabilization plan. If stabilization requires interim funding, the memorandum should state the funding amount, timing, and what it enables operationally. If the proposal includes debt maturity extensions, it should explain how the extensions align with the cash runway and milestone-based reporting.
Executive Summary Draft Template with Concrete Prompts
Use short paragraphs and bullet points that force specificity. Include a “numbers in plain sight” line for each major claim.
- Liquidity and timing: “As of 2026-04-06, cash covers approximately X weeks under the base case; covenant breach risk begins on Y date.”
- Root causes: “Cash gap is driven by collections lag, inventory cash conversion, and vendor term tightening.”
- Stabilization: “First 90 days focus on collections workflow, inventory rationalization, and vendor prioritization.”
- Restructuring: “Proposal combines operational stabilization with a liability treatment plan that targets sustainable payments.”
- Stakeholder asks: “Request voting support for the plan and approval of interim funding mechanics.”
Mind Map: Executive Summary Decision Blocks
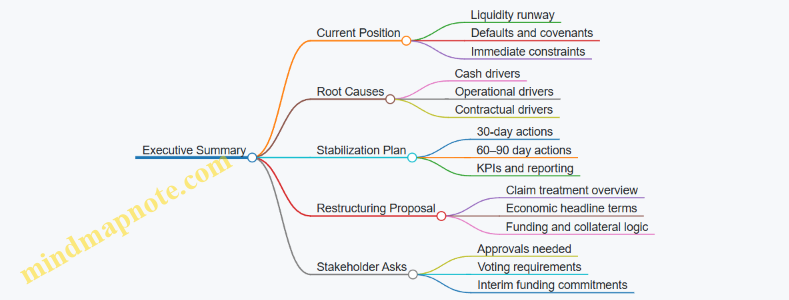
A good executive summary reads like a checklist for action: it tells readers what is happening, why it is happening, what will be done first, and what decisions are required next. The memorandum then provides the evidence, schedules, and governance details that make those decisions defensible.
12.2 Drafting Term Sheets and Key Economic Terms Checklists
A term sheet is the bridge between “we agree in principle” and “we can close without surprises.” In restructuring, it also acts like a map for negotiations: it states what changes, who pays, who receives, and what happens if conditions aren’t met. The goal is not to write a novel; it’s to prevent avoidable misunderstandings.
Foundational Inputs Before You Draft
Start by locking the inputs that drive economics.
- Claim inventory and treatment logic: confirm each class of claims, priority, and expected treatment path. If a creditor group is “unsecured” but has a security interest, the term sheet must reflect that reality.
- Plan mechanics: decide whether the transaction is an exchange, a plan confirmation, or an out-of-court restructuring. The term sheet should match the chosen pathway.
- Operating and liquidity constraints: term economics must be consistent with the cash plan. If the company cannot fund interest during the interim period, the term sheet should not assume it can.
- Documentation scope: list the documents that will implement the term sheet (e.g., exchange agreements, plan documents, DIP budget reporting). This prevents “term sheet only” deals.
Key Economic Terms Checklist
Use this checklist as a line-by-line review. Each item should be stated with numbers, definitions, and timing.
Consideration and Value Transfer
- What each class receives: cash, new debt, new equity, warrants, or a combination.
- Exchange ratios: specify conversion formulas and rounding rules.
- Valuation basis: state whether recovery is based on enterprise value, equity value, or claim-by-claim negotiated recoveries.
Example: If $10 million of allowed unsecured claims exchange into 40% of new equity plus $2 million in new notes, the term sheet should show the exact mapping from claim amounts to equity shares and note principal.
New Money and Funding Mechanics
- Amount and timing: total new money, tranche schedule, and funding conditions.
- Use of proceeds: specify whether funds go to pay creditors, fund operations, or both.
- Interest and fees: coupon, payment frequency, original issue discount, and any upfront fees.
Example: A $5 million interim facility funded in two tranches might require first-tranche funding upon signing and second-tranche funding upon court filing. The term sheet should state what happens if the second tranche conditions aren’t met.
Debt Economics
- Principal amount and maturity date.
- Coupon and payment terms: cash interest vs. PIK interest, and whether PIK accrues at the same rate.
- Amortization: bullet vs. scheduled payments.
- Covenants: define which covenants exist and their thresholds.
Example: If the notes include a springing covenant triggered by a liquidity test, the term sheet should define the test date and the calculation method.
Equity Economics
- Share count and capitalization: pre-transaction shares, new shares, and any treasury shares.
- Rights and preferences: voting rights, dividend rights, liquidation preference if any.
- Warrants: strike price, exercise window, and whether they are cashless.
Example: A rights offering might require holders to elect within 15 business days. The term sheet should specify the election mechanics and oversubscription treatment.
Fees, Expenses, and Priority of Payments
- Transaction fees: identify who pays and when.
- Professional fees: define whether they are paid from the estate, from new money, or from company cash.
- Payment waterfall: specify priority among fees, interest, and principal.
Example: If consent fees are paid only after plan confirmation, the term sheet should not imply they are paid at signing.
Conditions, Milestones, and Termination
- Conditions precedent: list objective conditions (court approval, creditor voting thresholds, regulatory approvals if applicable).
- Milestones: filing date, confirmation date, and outside date.
- Termination rights: what triggers termination and whether any break fees apply.
Example: An outside date should be paired with a clear extension mechanism and who bears the cost of delay.
Release, Indemnity, and Settlement Terms
- Scope of releases: who releases whom and what claims are excluded.
- Indemnities: cap, survival period, and claim process.
- Non-disparagement and confidentiality: include only if necessary and define duration.
Example: If releases exclude fraud or willful misconduct, the term sheet should state that exclusion explicitly.
Term Sheet Economics Mind Map
Mind Map: Term Sheet Economics
Practical Drafting Pattern That Reduces Rework
Write each economic term in the same order: definition → number → timing → condition → consequence. This keeps negotiations focused and makes it easier to convert the term sheet into definitive documents.
Example: For a note coupon, state: “Coupon equals 8.00% per annum, paid quarterly in arrears, commencing on the first payment date after funding, subject to the liquidity covenant test; if the test fails, PIK interest applies and cash interest is suspended.”
Closing Checklist for Consistency
Before circulation, verify internal consistency across the term sheet:
- Exchange ratios match claim totals and class definitions.
- Funding amounts match the cash plan and interim budget.
- Payment priorities match the waterfall and fee sections.
- Conditions precedent align with the outside date and termination provisions.
If any section requires a “we’ll figure it out later,” that’s not a drafting style choice—it’s a future dispute waiting for a calendar invite.
12.3 Building Creditor Voting Packages and Disclosure Materials
A creditor voting package is the practical bridge between “here is what we propose” and “here is how you vote.” It must be complete enough to support informed decisions, consistent enough to avoid surprises, and structured enough that busy readers can find the key numbers quickly. Think of it as a checklist that happens to be written in sentences.
Core Purpose and Audience
Start by stating the voting purpose in plain language: what the creditor is voting on, what approval threshold applies, and what happens if the vote passes or fails. Then tailor the package to the creditor’s role. Secured creditors care about collateral treatment and valuation mechanics; unsecured creditors care about recovery assumptions, releases, and distributions; equity holders care about ownership resets and dilution mechanics. The package should not assume readers are lawyers, but it should not hide the legal structure either.
Required Disclosures and Internal Consistency
Disclosure materials should connect five threads without contradictions: (1) the plan structure, (2) the economic deal, (3) the valuation logic, (4) the operational assumptions that drive cash flows, and (5) the risk and mitigation items that explain why the numbers are believable. A common failure mode is a mismatch between the narrative and the tables—such as describing a distribution timing that the payment schedule later contradicts.
To prevent that, use a “single source of truth” approach: every table referenced in the narrative must match the same exhibit version, and every defined term used in the voting form must match the disclosure definitions. If your package includes a glossary, keep it short and consistent.
Voting Package Components
A complete package typically includes:
- Voting instruction page: who can vote, how to submit, and deadlines.
- Ballot or voting form: creditor identity fields, claim amount fields, and election options.
- Plan summary: a structured overview of treatment by class.
- Disclosure statement: the reasoning behind the plan, including feasibility and key assumptions.
- Exhibits: plan document, schedules of claims, valuation support, and payment mechanics.
- Notice of meeting or solicitation procedure: the procedural steps and voting timeline.
Even when the law requires specific items, the practical goal is the same: the creditor should be able to (a) verify their class and claim treatment, (b) understand the economics, and (c) cast a vote without guessing.
Class-by-Class Treatment Tables
Include a table for each class that shows treatment in a way that can be scanned. A good table has columns that answer the questions a creditor actually asks: what they receive, when they receive it, whether there are conditions, and whether the treatment differs by claim size.
Example table layout:
| Claim Class | Treatment Type | Consideration | Timing | Key Conditions |
|---|---|---|---|---|
| Unsecured Trade | Cash + New Notes | $X cash; $Y notes | Quarterly for 2 years | No material plan default |
| General Unsecured | Recovery Pool | % of allowed claims | After effective date | Confirmation of plan |
Keep the numbers consistent with the distribution waterfall and the plan’s payment schedule. If there are elections, show the election options and the default if no election is made.
Valuation and Recovery Explanation
Creditors do not need a full valuation textbook, but they do need a coherent explanation of how recovery is estimated. Present the valuation method at a high level, then connect it to the plan economics. For example, if the plan assumes a going-concern value, explain what operational drivers support that assumption and how downside cases were handled in the recovery range.
A practical way to make this readable is to separate “inputs” from “outputs.” Inputs include revenue assumptions, margin assumptions, and working capital needs. Outputs include enterprise value, equity value, and the implied recovery by class.
Releases, Injunctions, and Voting Impact
If the plan includes releases or injunctions, disclose them clearly and map them to the voting decision. A creditor should understand whether voting “yes” changes their rights beyond receiving distributions. Use a dedicated section with bullet points that describe what is released, who benefits, and any carve-outs.
Mind Map: Package Flow and Content
Example: A Creditor Ballot That Reduces Confusion
A ballot should minimize ambiguity. Use clear fields and avoid mixing claim amounts with allowed amounts unless the plan defines the distinction. If the ballot requires an election, present it as a simple choice with a default.
Example ballot fields:
- Creditor name and address
- Claim class and claim amount (as filed)
- Allowed claim amount reference (if applicable)
- Election option A or B
- Signature and date
- Submission method and deadline
If you include a date, use a fixed reference such as “June 12, 2026” rather than a moving target.
Quality Checks Before Mailing
Before distribution, run a short checklist: every defined term used on the ballot appears in the disclosure definitions; every class listed on the ballot appears in the plan summary; every exhibit referenced in the disclosure is attached; and every distribution timing statement matches the payment schedule. If you can’t trace a number from narrative to table to exhibit in one pass, the package is not ready. Creditors will notice; they just won’t always tell you where.
12.4 Executing Closing Deliverables Including Assignments and Releases
Closing is where the restructuring plan stops being a document and starts being a set of enforceable actions. The goal is simple: every required deliverable is executed correctly, on time, and in the right order, so the plan’s economics and legal effects match what creditors and the court approved.
Closing Deliverables: What “Done” Means
A closing package typically includes (1) assignments and transfers, (2) releases and waivers, (3) evidence of consideration and payment mechanics, and (4) updated corporate records. “Done” means the counterparty can point to a signed document, a recorded transfer where required, and a clear chain of title or claim treatment.
A practical way to avoid surprises is to treat closing as a checklist with dependencies. For example, you cannot release a claim until the consideration is funded or escrowed, and you cannot record an asset transfer until the plan’s vesting event has occurred.
Step-by-Step Execution Flow
- Confirm the vesting trigger and timing. Verify the plan’s effective date conditions, including any required approvals and satisfaction of conditions precedent.
- Finalize economic inputs. Reconcile claim amounts, election results, and any proration factors. If the plan uses a distribution waterfall, confirm the waterfall inputs match the final claim register.
- Execute assignments and transfers. Deliver executed assignment agreements for contracts, liens, or intercompany claims. Where assets are transferred, ensure the correct legal description and authority signatures.
- Fund consideration and document payment. If distributions are made via escrow or paying agent, confirm funding instructions and obtain bank confirmations.
- Deliver releases and waivers. Execute release agreements consistent with the plan language, including scope, carve-outs, and survival of specific obligations.
- Update corporate and security records. Amend charter documents, update cap tables, cancel or reissue securities, and file UCC releases or equivalent lien terminations.
- Close the loop with evidence. Collect executed documents, recording receipts, and final distribution reports into a closing binder.
Assignments and Transfers: Common Pitfalls and Fixes
Assignments often fail due to mismatched parties, missing schedules, or incorrect notice provisions. A simple fix is to use a “schedule reconciliation” step: compare the list of assigned items in the plan exhibits to the schedules in the assignment agreements.
Example: A plan requires assignment of a customer contract and related receivables. The assignment agreement lists the contract but omits the receivables schedule. The counterparty later refuses to recognize the receivable transfer. The cure is to ensure the receivables schedule is attached, signed, and aligned with the claim register.
For lien releases, confirm the lienholder names exactly match the recorded filings. A one-character mismatch can delay UCC termination filings and create a lingering cloud on title.
Releases and Waivers: Drafting and Execution Discipline
Releases should be executed by the correct parties in the correct capacity. If the plan provides releases for “holders” of claims, confirm the release signatories match the final list of eligible holders.
Carve-outs matter. Many plans preserve obligations like confidentiality, indemnities for specific matters, or post-effective-date performance. If the release form is too broad, it can unintentionally extinguish obligations the plan intended to keep.
Example: A release form includes a blanket waiver of all “known and unknown claims,” but the plan carve-out preserves certain environmental liabilities. The mismatch forces a corrective amendment or a negotiated clarification. Prevent it by mapping each carve-out in the plan to a corresponding clause in the release form before signatures.
Mind Map: Closing Deliverables and Dependencies
Example Closing Checklist with Ordering Logic
- T-10 business days: finalize claim register, election results, and assignment schedules.
- T-5 business days: confirm paying agent instructions and escrow funding method.
- T-1 business day: execute assignment agreements and prepare release forms for signatories.
- Closing day: confirm vesting trigger, fund consideration, deliver assignments, execute releases, and issue distribution confirmations.
- T+2 to T+10 business days: file lien terminations and record transfers; compile the closing binder.
Closing Binder: What to Include
A closing binder should contain: the executed plan confirmation documents, the final claim register summary used for distributions, executed assignment and release documents, evidence of funding, recording receipts, and a final distribution report. If a dispute arises later, this binder is the fastest way to show what was actually done, not what someone assumed was done.
A Small, Useful Rule
If a deliverable affects another deliverable, list it as a dependency in the checklist. That one habit prevents most closing errors, because it forces the team to answer the question: “Which document must exist before the release can be signed?”
12.5 Establishing Post Restructuring Financial Reporting and KPI Baselines
After a restructuring closes, the company’s reporting system has to do two jobs at once: prove that cash is being used as promised, and show whether the operating plan is actually working. The fastest way to lose credibility is to report “what we wish were true” instead of “what the numbers can support.” This section sets up a practical baseline so stakeholders can compare performance consistently from day one.
Step 1: Lock the Reporting Scope and Accounting Boundaries
Start by writing down what “post restructuring” means for reporting. Confirm the legal entity structure, reporting currency, consolidation perimeter, and whether any discontinued operations exist. Then align accounting policies that changed during the process, such as revenue recognition, lease accounting, or impairment triggers. A simple example: if the plan assumes a new lease structure, the baseline must reflect the new lease terms in the first post-close month, not the old ones with a later adjustment.
Step 2: Build a Baseline Month and a Baseline Set of Metrics
Choose a baseline period that is close enough to the closing date to be relevant, but complete enough to be reliable. If closing occurs mid-month, use the first full month after close as the baseline and document any known one-time items. For KPIs, separate them into three layers:
- Financial outcomes: cash balance, operating cash flow, EBITDA (if used), and net income.
- Working capital drivers: days sales outstanding, days inventory on hand, days payables outstanding, and cash conversion cycle.
- Operational performance: order intake, on-time delivery, defect rate, churn/retention, or utilization.
Example: a retailer may track “cash conversion cycle” as the bridge between operations and liquidity. If sales improve but receivables stretch, the baseline will show that cash did not improve yet.
Step 3: Define KPI Calculation Rules and Ownership
Each KPI needs a calculation definition, data source, frequency, and owner. If two teams can compute the same KPI differently, you will get two different answers in the first reporting cycle. For instance, define whether DSO uses gross or net receivables, and whether it includes disputed invoices. Assign ownership so the person who controls the underlying process also controls the KPI inputs.
Step 4: Create a Reporting Calendar and a Close-to-Report Timeline
Set a calendar that matches stakeholder needs and operational reality. A typical cadence is weekly cash reporting for liquidity, monthly KPI reporting for performance, and quarterly financial statements for formal review. Then set a close-to-report timeline: how many days after month-end the numbers must be ready, who signs off, and what gets escalated if the timeline slips. Use a small “issue log” to track recurring delays, such as late vendor confirmations or missing inventory counts.
Step 5: Reconcile Plan Assumptions to Actuals Without Rewriting History
Stakeholders will compare actuals to the plan. The baseline should include a mapping from plan line items to reporting line items. When variance appears, explain it through drivers rather than narrative. Example: if operating cash flow is below plan, break the variance into working capital movement, capex timing, and payroll tax timing. This keeps explanations grounded and prevents “variance theater.”
Step 6: Establish Controls for Data Integrity and Auditability
Implement controls that ensure the baseline is defensible. Minimum set:
- Source controls: confirm data feeds from ERP, billing, procurement, and payroll.
- Reconciliation controls: tie KPI inputs to general ledger accounts.
- Change controls: document any policy or model changes and the effective date.
- Approval controls: require sign-off for KPI definitions and any adjustments.
A practical example: if inventory valuation method changes, record the effective date and show how it affects gross margin and cash conversion cycle inputs.
Step 7: Document the Baseline in a One-Page KPI Pack
Create a KPI pack that can be read without a spreadsheet. Include the KPI list, definitions, formula, data source, baseline values, and variance explanation template. This becomes the reference point for every subsequent report.
Mind Map: Post Restructuring Reporting and KPI Baselines
Example: Baseline Setup for a Manufacturing Company
Assume the plan targets improved liquidity through tighter working capital. The baseline month shows:
- DSO improves by 5 days versus the last pre-close month.
- Inventory on hand decreases by 8% due to SKU rationalization.
- Payables days remain flat because vendor terms are unchanged.
The reporting pack should clearly state that the cash improvement (or lack of it) is explained by the combined effect on cash conversion cycle, not by a vague “better operations” statement. If cash is still weak, the baseline will reveal whether the gap is capex timing, payroll tax timing, or a slower-than-expected reduction in receivables.
Example: Variance Explanation Template for Monthly Reporting
Use a consistent structure so explanations are comparable month to month:
- KPI variance vs plan: amount and direction.
- Driver breakdown: working capital, operating performance, and timing items.
- Data notes: any definition changes or data quality issues.
- Action taken: specific operational steps tied to the driver.
When the baseline is set this way, reporting becomes a tool for decision-making rather than a recurring debate about definitions. Stakeholders can see what changed, why it changed, and whether the company is meeting the plan’s logic.