Rocket Propulsion and Launch Vehicle Engineering
1. Introduction to Rocket Propulsion and Launch Vehicles
1.1 Overview of Rocket Propulsion Systems
Rocket propulsion systems convert stored energy into thrust to propel vehicles through air or space. At their core, these systems operate by expelling mass at high velocity in the opposite direction of desired travel, following Newton’s third law. The main categories of rocket propulsion systems are chemical, electric, and nuclear, with chemical propulsion further divided into liquid, solid, and hybrid types.
Mind Map: Types of Rocket Propulsion Systems
Chemical propulsion remains the most widely used for launch vehicles due to its high thrust and relatively mature technology. Liquid propellant engines use separate tanks for fuel and oxidizer, which are pumped into a combustion chamber where they react. Solid propellant motors contain a pre-mixed fuel and oxidizer in a solid grain, ignited to produce thrust. Hybrid engines combine aspects of both, typically using a solid fuel and a liquid or gaseous oxidizer.
Mind Map: Chemical Propulsion Subtypes
Electric propulsion systems generate thrust by accelerating ions or plasma using electric fields. They produce much lower thrust compared to chemical rockets but offer higher specific impulse, making them suitable for in-space maneuvers rather than launch. Examples include ion thrusters and Hall effect thrusters.
Nuclear propulsion uses nuclear reactions to heat propellant or generate electricity for electric thrusters. While not common in current launch vehicles, nuclear thermal rockets can provide high thrust and efficiency.
Example: Comparing Liquid and Solid Propellant Engines
Consider a satellite launch requiring precise thrust control and restart capability. A liquid propellant engine is preferable because it allows throttling and multiple starts. In contrast, a solid motor is simpler and more reliable but cannot be shut down once ignited, limiting control.
Mind Map: Key Performance Metrics
Thrust is the force produced by the engine, measured in newtons or pounds-force. Specific impulse (Isp) measures how effectively a rocket uses propellant, expressed in seconds. Higher Isp means better fuel efficiency. Thrust-to-weight ratio indicates how much thrust the engine produces relative to its own weight, important for vehicle design.
Example: Thrust and Specific Impulse in Practice
The Space Shuttle Main Engine (SSME) produced about 2,000 kN of thrust with an Isp around 452 seconds in vacuum. A solid rocket booster, by comparison, produced higher thrust but with an Isp closer to 265 seconds. This illustrates the trade-off between raw power and efficiency.
In summary, rocket propulsion systems vary widely in design and application. Understanding their types, characteristics, and performance metrics is essential for selecting the right system for a given mission. The following chapters will focus primarily on liquid propellant engines, orbital mechanics, and launch vehicle design, integrating best practices and practical examples throughout.
1.2 Historical Development of Liquid Propellant Engines
The history of liquid propellant rocket engines is a story of gradual progress, marked by key innovations and practical experiments. Unlike solid rockets, which have been used for centuries in fireworks and simple propulsion, liquid engines required a deeper understanding of fluid dynamics, combustion, and materials engineering.
Early Concepts and Experiments
The concept of liquid propulsion dates back to the early 20th century. Russian scientist Konstantin Tsiolkovsky, often called the father of astronautics, proposed the idea of using liquid propellants for rockets around 1903. However, his work was largely theoretical and lacked experimental backing.
In the 1920s and 1930s, several pioneers began practical experiments. Robert Goddard in the United States successfully launched the first liquid-fueled rocket in 1926. His engine used gasoline and liquid oxygen, demonstrating controlled thrust and flight. Goddard’s work laid the foundation for understanding combustion stability and nozzle design.
Meanwhile, in Germany, the Verein für Raumschiffahrt (VfR) group, including Wernher von Braun, experimented with liquid oxygen and alcohol engines. Their work culminated in the development of the A-4 rocket, later known as the V-2, which became the first long-range guided ballistic missile.
Key Milestones in Engine Development
- 1926: Robert Goddard’s first liquid-fueled rocket launch.
- 1937-1945: Development and deployment of the V-2 rocket by Germany.
- 1940s-1950s: Post-war adoption and advancement of liquid engine technology by the US and USSR.
The V-2 engine used a turbopump to feed propellants, a significant step forward from earlier pressure-fed designs. This innovation allowed higher thrust and efficiency.
Post-War Advances and the Space Race
After World War II, captured German technology and personnel accelerated liquid engine development in the US and Soviet Union. The US developed engines like the Rocketdyne F-1, which powered the Saturn V first stage, while the Soviets developed the RD-107 and RD-108 engines for their R-7 launch vehicle.
These engines incorporated staged combustion cycles, improved cooling methods, and better materials to handle higher combustion pressures and temperatures.
Mind Map: Historical Development of Liquid Propellant Engines
Example: Goddard’s 1926 Liquid Rocket
Goddard’s first liquid rocket was a simple cylinder with a combustion chamber and a nozzle. It burned gasoline and liquid oxygen, fed by pressurized tanks. The engine produced about 90 pounds of thrust and flew for 2.5 seconds, reaching an altitude of 41 feet. This modest flight demonstrated the feasibility of liquid propulsion and highlighted challenges such as combustion instability and efficient propellant feed.
Example: V-2 Engine Innovations
The V-2 engine used a turbopump driven by a steam generator to feed propellants into the combustion chamber at high pressure. This allowed for a much higher thrust (~25 tons) compared to earlier engines. The engine also used regenerative cooling, circulating propellant around the nozzle to prevent overheating. These features became standard in later liquid engine designs.
Best Practices Illustrated
- Incremental Testing: Goddard’s approach of small-scale, controlled tests helped identify combustion and feed system challenges early.
- Subsystem Integration: The V-2 combined turbopumps, cooling, and combustion in a coordinated system, showing the importance of integrating components.
- Material Selection: Early engines revealed the need for materials that withstand high temperatures and pressures, influencing metallurgy in engine design.
This historical overview shows how liquid propellant engines evolved from theoretical ideas to complex systems capable of powering space exploration. Each step involved solving practical problems through experimentation and engineering refinement.
1.3 Classification of Launch Vehicles
Launch vehicles are the workhorses that carry payloads from Earth’s surface into space. Classifying them helps engineers, mission planners, and operators understand their capabilities, limitations, and appropriate applications. The classification is based on several criteria including payload capacity, orbit type, propulsion type, and reusability. Each classification provides a different lens to evaluate the vehicle’s design and mission fit.
Payload Capacity
Payload capacity is one of the most straightforward ways to categorize launch vehicles. It refers to the maximum mass a vehicle can deliver to a specific orbit, usually Low Earth Orbit (LEO). This classification helps match payloads with suitable launch vehicles.
- Small-Lift Launch Vehicles: Capable of delivering up to 2,000 kg to LEO. Examples include Rocket Lab’s Electron and Virgin Orbit’s LauncherOne.
- Medium-Lift Launch Vehicles: Deliver between 2,000 kg and 20,000 kg to LEO. Examples include SpaceX’s Falcon 9 (partially reusable) and the Russian Soyuz.
- Heavy-Lift Launch Vehicles: Deliver between 20,000 kg and 50,000 kg to LEO. Examples are the Delta IV Heavy and the Ariane 5.
- Super Heavy-Lift Launch Vehicles: Deliver more than 50,000 kg to LEO. Examples include the Saturn V and SpaceX’s Starship (planned).
Orbit Type Capability
Launch vehicles are also classified by the orbits they can reach, which depends on their velocity and trajectory capabilities.
- LEO Launchers: Designed primarily for low Earth orbit missions, typically for Earth observation, communication satellites, or crewed missions to the ISS.
- GTO Launchers: Capable of sending payloads to Geostationary Transfer Orbit, which requires higher energy and precise insertion.
- Interplanetary Launchers: Vehicles or configurations capable of sending probes beyond Earth orbit, often requiring additional upper stages.
Example: The Ariane 5 is optimized for GTO missions, while the Falcon 9 can deliver payloads to LEO, GTO, and even interplanetary trajectories with proper upper stages.
Propulsion Type
Launch vehicles can be grouped by the type of propulsion they use, which affects complexity, cost, and performance.
- Solid Propellant Vehicles: Use solid fuel; simpler and reliable but less controllable. Example: Pegasus rocket.
- Liquid Propellant Vehicles: Use liquid fuel and oxidizer; offer throttle control and restart capability. Example: Falcon 9.
- Hybrid Propellant Vehicles: Combine solid fuel with liquid oxidizer or vice versa, aiming to balance simplicity and control.
Example: The Virgin Galactic SpaceShipTwo uses a hybrid engine for suborbital flights.
Reusability
Reusability affects operational cost and turnaround time.
- Expendable Launch Vehicles (ELVs): Used once and discarded. Most traditional rockets fall here.
- Partially Reusable Vehicles: Recover and reuse some components, usually first stages or boosters. Falcon 9’s first stage is a prime example.
- Fully Reusable Vehicles: Designed for complete recovery and reuse of all stages. Currently experimental or in development.
Example: SpaceX’s Falcon 9 first stage routinely lands and is reused, reducing launch costs.
Example: Matching a Payload to a Launch Vehicle
Suppose a satellite weighs 1,500 kg and needs to be placed into a Sun-synchronous orbit (a type of LEO). A small-lift vehicle like Electron could handle this mission efficiently. If the payload were 10,000 kg headed to GTO, a medium-lift vehicle like Falcon 9 or Ariane 5 would be more appropriate.
Best Practice: Selecting a Launch Vehicle
When selecting a launch vehicle, consider payload mass, target orbit, mission complexity, and budget. Using classification criteria helps narrow choices and align mission requirements with vehicle capabilities. For example, avoid over-specifying a heavy-lift vehicle for a small payload to save costs.
In summary, classifying launch vehicles by payload capacity, orbit capability, propulsion type, and reusability provides a structured way to understand their roles and select the right tool for the mission. The mind maps above offer a visual summary to keep these categories clear and accessible.
1.4 Basic Principles of Rocket Propulsion
Rocket propulsion is fundamentally about producing thrust by expelling mass at high velocity in the opposite direction of desired travel. This principle follows Newton’s Third Law: for every action, there is an equal and opposite reaction. In rockets, the action is the high-speed ejection of propellant mass; the reaction is the forward push on the rocket.
Key Concepts
- Thrust (F): The force generated by the rocket engine to propel the vehicle.
- Mass Flow Rate (ṁ): The amount of propellant mass expelled per unit time.
- Exhaust Velocity (vₑ): The speed at which propellant gases leave the nozzle.
- Specific Impulse (Iₛₚ): A measure of engine efficiency, defined as thrust per unit weight flow of propellant.
Basic Thrust Equation
The thrust produced by a rocket engine can be expressed as:
\[ F = \dot{m} v_e + (P_e - P_a) A_e \]
Where:
- \( \dot{m} \) = mass flow rate of the propellant
- \( v_e \) = effective exhaust velocity
- \( P_e \) = pressure at the nozzle exit
- \( P_a \) = ambient pressure
- \( A_e \) = nozzle exit area
The first term \( \dot{m} v_e \) represents momentum thrust, and the second term \( (P_e - P_a) A_e \) is the pressure thrust. In vacuum, \( P_a \) is zero, maximizing thrust.
Mind Map: Basic Rocket Propulsion Principles
Propellant Ejection and Momentum
The rocket engine burns propellants, producing hot gases at high pressure. These gases expand through the nozzle, converting thermal energy into kinetic energy. The high-speed exhaust gases carry momentum backward, and by conservation of momentum, the rocket gains forward momentum.
Example: Calculating Thrust for a Simple Engine
Suppose a rocket engine expels propellant at a mass flow rate of 10 kg/s with an exhaust velocity of 3000 m/s. The nozzle exit pressure equals ambient pressure, so pressure thrust is zero.
Calculate the thrust:
\[ F = \dot{m} v_e = 10 \times 3000 = 30,000 \text{ N} \]
This means the engine produces 30,000 newtons of thrust.
Specific Impulse (Iₛₚ)
Specific impulse is a common way to compare engine efficiency. It is defined as:
\[ I_{sp} = \frac{F}{\dot{m} g_0} = \frac{v_e}{g_0} \]
Where \( g_0 \) is standard gravity (9.81 m/s²). Using the previous example:
\[ I_{sp} = \frac{3000}{9.81} \approx 306 \text{ seconds} \]
This means the engine produces 306 seconds of thrust per unit weight of propellant consumed per second.
Mind Map: Specific Impulse and Efficiency
Nozzle Role and Expansion
The nozzle shapes the flow, accelerating gases from high pressure and temperature to high velocity. The ideal nozzle converts all thermal energy into kinetic energy. The nozzle exit area and shape affect exhaust velocity and pressure thrust.
If the nozzle exit pressure is higher than ambient, the rocket experiences a net pressure force pushing backward, reducing thrust. Conversely, if exit pressure is lower, the pressure thrust adds to the total thrust.
Example: Pressure Thrust Contribution
Consider a nozzle with exit area \( A_e = 0.5 \text{ m}^2 \), exit pressure \( P_e = 150,000 \text{ Pa} \), and ambient pressure \( P_a = 100,000 \text{ Pa} \). Calculate pressure thrust:
\[ (P_e - P_a) A_e = (150,000 - 100,000) \times 0.5 = 25,000 \text{ N} \]
This 25,000 N adds to the momentum thrust, increasing total thrust.
Summary
Rocket propulsion depends on ejecting mass at high speed to generate thrust. The thrust comes from momentum change and pressure differences at the nozzle exit. Specific impulse measures how efficiently the engine uses propellant. Nozzle design plays a critical role in maximizing exhaust velocity and managing pressure thrust.
Understanding these principles is the foundation for designing and analyzing liquid propellant engines and launch vehicles.
1.5 Best Practices: Understanding Engine Performance Metrics with Practical Examples
Rocket engine performance metrics are the backbone of design, testing, and operational decisions. Grasping these metrics helps engineers optimize engines for thrust, efficiency, and mission requirements. This section breaks down key performance parameters, illustrates their relationships, and provides practical examples to clarify their use.
Key Performance Metrics Mind Map
Understanding Thrust and Specific Impulse
Thrust (F) is the raw push your engine delivers. It depends directly on how much propellant you burn and how fast you eject it. The basic thrust equation is:
\[ F = \dot{m} \times V_e + (P_e - P_a) A_e \]
Where:
- \( \dot{m} \) = mass flow rate
- \( V_e \) = exhaust velocity
- \( P_e \) = pressure at nozzle exit
- \( P_a \) = ambient pressure
- \( A_e \) = exit area
The second term accounts for pressure thrust, which can be positive or negative depending on altitude.
Specific Impulse (Isp) measures how efficiently an engine uses propellant. It is thrust divided by the weight flow rate of propellant:
\[ I_{sp} = \frac{F}{\dot{m} g_0} \]
Where \( g_0 \) is standard gravity (9.81 m/s²). Higher Isp means more thrust per unit propellant weight, which translates to better fuel economy.
Practical Example 1: Calculating Thrust and Isp for a Simple Engine
Consider a liquid engine consuming propellant at 5 kg/s with an exhaust velocity of 3000 m/s. Assume sea level ambient pressure \( P_a = 101325 \) Pa, nozzle exit pressure \( P_e = 90000 \) Pa, and exit area \( A_e = 0.1 \) m².
- Calculate the pressure thrust term:
\[ (P_e - P_a) A_e = (90000 - 101325) \times 0.1 = -1132.5 \text{ N} \]
- Calculate momentum thrust:
\[ \dot{m} V_e = 5 \times 3000 = 15000 \text{ N} \]
- Total thrust:
\[ F = 15000 - 1132.5 = 13867.5 \text{ N} \]
- Specific impulse:
\[ I_{sp} = \frac{13867.5}{5 \times 9.81} = \frac{13867.5}{49.05} \approx 282.7 \text{ s} \]
This example shows how ambient pressure affects thrust and why engines perform differently at sea level versus vacuum.
Practical Example 2: Effect of Nozzle Expansion Ratio on Performance
Increasing the nozzle expansion ratio \( \varepsilon = A_e / A_t \) improves exhaust velocity in vacuum but can cause flow separation at sea level. Suppose an engine has a throat area of 0.05 m² and exit area of 0.2 m² (expansion ratio 4). If the exit pressure drops below ambient, thrust decreases.
Mind map for nozzle impact:
Best Practices Summary
- Always consider ambient pressure when calculating thrust. Engines optimized for vacuum differ from sea-level engines.
- Use specific impulse to compare efficiency between different engines or propellants, but remember it doesn’t tell the whole story about thrust.
- Calculate both momentum and pressure thrust to get accurate thrust values.
- Understand the trade-offs of nozzle design for your mission environment.
- Validate calculations with test data to catch assumptions that don’t hold in practice.
This section provides a foundation for interpreting engine performance data and making informed design choices. The examples demonstrate how straightforward calculations reveal the nuances behind raw numbers.
2. Fundamentals of Liquid Propellant Rocket Engines
2.1 Propellant Types and Characteristics
Rocket propellants are the substances burned or decomposed to produce thrust in liquid rocket engines. Their choice directly impacts engine performance, reliability, handling, and mission design. Propellants are broadly categorized into liquid and solid types, but this section focuses on liquid propellants, specifically their types and key characteristics.
Classification of Liquid Propellants
Liquid propellants are typically divided into two main categories:
- Cryogenic Propellants: Stored at very low temperatures to remain liquid.
- Hypergolic Propellants: Ignite spontaneously upon contact with each other.
Additionally, propellants can be:
- Monopropellants: Single-component fuels decomposed by a catalyst.
- Bipropellants: Separate fuel and oxidizer components mixed in the combustion chamber.
Common Liquid Propellants and Their Properties
| Propellant Type | Examples | Storage Temperature | Density (kg/m³) | Specific Impulse (s) | Handling Notes |
|---|---|---|---|---|---|
| Cryogenic Fuel | Liquid Hydrogen (LH2) | ~20 K | 70 | 380-450 | Low density, requires insulation |
| Cryogenic Oxidizer | Liquid Oxygen (LOX) | ~90 K | 1140 | - | Supports combustion, oxidizing agent |
| Hypergolic Fuel | Unsymmetrical Dimethylhydrazine (UDMH) | Ambient | 791 | 280-320 | Toxic, storable at room temp |
| Hypergolic Oxidizer | Nitrogen Tetroxide (N2O4) | Ambient | 1440 | - | Corrosive, storable at room temp |
| Monopropellant | Hydrazine (N2H4) | Ambient | 1010 | 220-230 | Requires catalyst for decomposition |
| Storable Bipropellant | Aerozine 50 (fuel) + N2O4 (oxidizer) | Ambient | ~880 (fuel) + 1440 (oxidizer) | 290-320 | Used in long-duration missions |
Key Characteristics to Consider
-
Density: Higher density means smaller tanks and lower vehicle volume. For example, LOX is much denser than LH2, making it easier to store in compact tanks.
-
Specific Impulse (Isp): Measures efficiency; higher Isp means more thrust per unit of propellant. LH2/LOX combinations typically yield the highest Isp.
-
Storage and Handling: Cryogenics require complex insulation and refrigeration, while hypergolics are toxic and corrosive but storable at room temperature.
-
Ignition: Hypergolic propellants ignite on contact, simplifying engine start but requiring careful handling. Non-hypergolic propellants need ignition systems.
-
Temperature and Pressure Requirements: Cryogenic propellants must be kept cold and often at low pressure, while storable propellants can be stored at ambient conditions.
Mind Map: Liquid Propellant Types
Practical Example: Choosing Propellants for a Satellite Launch Vehicle
Suppose you are designing a launch vehicle for a low Earth orbit satellite. You need high performance but also manageable storage complexity.
-
Option 1: LH2/LOX
- Pros: Highest specific impulse (~450 s), efficient.
- Cons: Very low density, bulky tanks, complex cryogenic systems.
-
Option 2: UDMH/N2O4
- Pros: Storable at room temperature, simpler tank design.
- Cons: Lower specific impulse (~300 s), toxic handling.
If the mission prioritizes payload mass and efficiency, LH2/LOX is preferred despite complexity. For simpler ground operations and storability, UDMH/N2O4 might be chosen.
Best Practices in Propellant Selection
- Match propellant choice to mission requirements: performance, duration, and operational constraints.
- Consider the trade-off between engine complexity and propellant handling.
- Account for environmental and safety regulations related to toxic or cryogenic propellants.
- Use density and Isp values to estimate vehicle size and mass early in design.
Mind Map: Propellant Selection Criteria
This section provides a foundation for understanding the trade-offs and characteristics of liquid propellants, setting the stage for engine cycle design and performance analysis.
2.2 Engine Cycle Types: Pressure-fed, Gas Generator, Staged Combustion, Expander Cycle
Rocket engines rely on different cycles to feed propellants into the combustion chamber and extract energy to drive pumps or other components. Each cycle has trade-offs in complexity, efficiency, and applicability. Here, we explore four common liquid propellant engine cycles: pressure-fed, gas generator, staged combustion, and expander cycle.
Pressure-fed Cycle
In a pressure-fed cycle, the propellant tanks are pressurized to push the fuel and oxidizer into the combustion chamber without the use of turbopumps. This simplicity reduces mechanical complexity and cost but limits achievable chamber pressure and engine size.
- How it works: Tanks are pressurized with an inert gas (often helium) to force propellants through feed lines.
- Advantages: Simple design, fewer moving parts, easier to test and maintain.
- Limitations: Tank mass increases due to need for high-pressure vessels; limited chamber pressure reduces thrust and efficiency.
Mind Map: Pressure-fed Cycle
Example:
Consider a small satellite thruster using a pressure-fed hydrazine monopropellant system. The tanks are pressurized to about 300 psi with helium. This setup avoids turbopumps, making it lightweight and reliable for attitude control, though it cannot produce high thrust.
Gas Generator Cycle
The gas generator cycle uses a small combustion chamber (gas generator) to burn a portion of propellant and produce hot gas that drives turbopumps. The exhaust from the gas generator is then dumped overboard, not contributing to main thrust.
- How it works: Propellant flow splits; some goes to the gas generator to power turbopumps, the rest to the main combustion chamber.
- Advantages: Higher chamber pressures and thrust than pressure-fed; relatively simpler than staged combustion.
- Limitations: Some propellant energy is lost in gas generator exhaust, reducing efficiency.
Mind Map: Gas Generator Cycle
Example:
The SpaceX Merlin engine uses a gas generator cycle. It burns a small fraction of RP-1 and LOX in the gas generator to spin turbopumps, then exhausts the gas. This allows the engine to reach chamber pressures around 100 bar with manageable complexity.
Staged Combustion Cycle
Staged combustion burns all propellants in preburners to drive turbopumps, then feeds the resulting hot gas into the main combustion chamber. This cycle recycles all propellant energy, resulting in high efficiency and chamber pressures.
- How it works: Fuel-rich or oxidizer-rich preburners partially combust propellants; the hot gas powers turbopumps and then enters the main chamber for complete combustion.
- Advantages: High performance, high chamber pressure, better propellant utilization.
- Limitations: Complex design, high thermal and mechanical stresses.
Mind Map: Staged Combustion Cycle
Example:
The RD-180 engine uses an oxygen-rich staged combustion cycle. It burns LOX and kerosene in a preburner with excess oxygen, driving turbopumps. The hot gas then enters the main chamber for full combustion, achieving chamber pressures above 250 bar and high specific impulse.
Expander Cycle
The expander cycle uses heat from the engine’s combustion chamber and nozzle to vaporize and expand the fuel, which then drives the turbopumps before entering the combustion chamber.
- How it works: Liquid fuel (usually hydrogen) is routed through cooling channels around the chamber and nozzle, absorbing heat and turning into high-pressure gas that powers turbines.
- Advantages: Clean cycle with no hot gas from combustion driving turbines; good efficiency.
- Limitations: Limited to lower thrust engines because turbine power depends on heat transfer surface area.
Mind Map: Expander Cycle
Example:
The RL10 upper stage engine uses an expander cycle with liquid hydrogen. Hydrogen absorbs heat from the nozzle, vaporizes, and spins the turbine before entering the combustion chamber. This limits thrust but yields high efficiency and reliability for upper stage applications.
Summary Table
| Cycle Type | Complexity | Efficiency | Thrust Capability | Key Feature | Typical Use Cases |
|---|---|---|---|---|---|
| Pressure-fed | Low | Low | Low | Pressurized tanks, no turbopumps | Small thrusters, upper stages |
| Gas Generator | Medium | Medium | Medium | Gas generator exhaust dumped | First stages, medium engines |
| Staged Combustion | High | High | High | Preburner drives turbopumps, exhaust to main chamber | High-performance engines |
| Expander | Medium | High | Low to Medium | Fuel heated to drive turbines | Upper stages, cryogenic fuels |
This overview clarifies how different engine cycles balance complexity, performance, and application. Each cycle suits particular mission needs and engineering constraints.
2.3 Combustion Processes and Thermodynamics
Combustion in liquid propellant rocket engines is the chemical reaction where fuel and oxidizer combine to release energy, producing hot gases that generate thrust. Understanding the combustion process and its thermodynamics is essential for designing efficient and reliable engines.
Combustion Fundamentals
At its core, combustion is an exothermic reaction between a fuel and an oxidizer. In liquid engines, these are typically injected separately and mixed in the combustion chamber. The reaction converts chemical potential energy into thermal energy, increasing the temperature and pressure of the gases.
Key points:
- Stoichiometry: The ideal fuel-to-oxidizer ratio where all reactants are consumed without excess.
- Equivalence ratio (ϕ): Actual fuel-to-oxidizer ratio divided by stoichiometric ratio; ϕ < 1 means fuel-lean, ϕ > 1 means fuel-rich.
- Reaction kinetics: Speed of chemical reactions, influenced by temperature, pressure, and mixture composition.
Thermodynamics of Combustion
Thermodynamics describes how energy transforms during combustion. The main goal is to maximize the conversion of chemical energy into kinetic energy of exhaust gases.
Important thermodynamic concepts:
- Enthalpy (H): Total heat content; combustion raises enthalpy of the gas mixture.
- Internal energy (U): Energy stored within molecules.
- Specific heat capacities (Cp, Cv): Heat required to raise temperature; varies with temperature and gas composition.
- Adiabatic flame temperature: Theoretical maximum temperature if no heat is lost.
Combustion Chamber Conditions
The combustion chamber is designed to sustain high pressure and temperature to maximize thrust. Typical chamber pressures range from 3 MPa to over 20 MPa, depending on engine design.
Higher chamber pressure improves performance by increasing exhaust velocity but demands stronger materials and cooling.
Combustion Stability
Stable combustion avoids oscillations that can damage the engine. Instabilities arise from interactions between pressure waves and heat release.
Common types:
- Chugging: Low-frequency oscillations.
- Buzzing: Mid-frequency.
- Screeching: High-frequency, potentially destructive.
Designing injectors and chamber geometry carefully helps mitigate these.
Mind Map: Combustion Processes Overview
Example 1: Calculating Adiabatic Flame Temperature
Consider a simple hydrogen-oxygen combustion at stoichiometric ratio. Using standard enthalpies of formation and assuming no heat loss, the adiabatic flame temperature can be estimated by balancing the enthalpy of reactants and products.
- Reactants: H2 and O2 at ambient temperature.
- Products: H2O vapor at high temperature.
By applying the first law of thermodynamics and using tabulated thermodynamic data, the flame temperature typically reaches around 3500 K.
This temperature sets the upper limit for chamber design and material selection.
Mind Map: Thermodynamic Calculation Steps
Example 2: Effect of Equivalence Ratio on Performance
Running a rocket engine fuel-rich (ϕ > 1) can lower flame temperature but increase specific impulse by producing lighter exhaust species like H2 and CO instead of heavier H2O.
For example, the Space Shuttle Main Engine operated fuel-rich to optimize performance and reduce thermal loads.
This trade-off illustrates how combustion chemistry directly influences engine efficiency and durability.
Mind Map: Equivalence Ratio Impact
Summary
Combustion in liquid propellant engines is a balance of chemical reaction rates, thermodynamic efficiency, and mechanical constraints. Understanding the interplay between stoichiometry, temperature, pressure, and stability is critical. Practical engine design involves adjusting mixture ratios, chamber conditions, and injector patterns to achieve desired performance while maintaining structural integrity and operational safety.
2.4 Injector Design and Mixing Techniques
Injectors in liquid propellant rocket engines serve a critical role: they introduce and mix fuel and oxidizer in the combustion chamber to ensure efficient and stable combustion. The design of injectors directly affects combustion efficiency, thrust stability, and engine lifespan.
Injector Functions
- Deliver propellants at the correct flow rates and pressures
- Atomize liquids into fine droplets for rapid vaporization
- Mix fuel and oxidizer uniformly to avoid hot spots or incomplete combustion
- Control combustion chamber pressure and temperature distribution
Types of Injectors
Injectors vary widely, but the main categories include:
- Impinging Jet Injectors: Streams of fuel and oxidizer collide, breaking into droplets.
- Splash Plate Injectors: Propellants hit a plate, spreading and atomizing.
- Pintle Injectors: A central pintle controls flow, enabling throttling and good mixing.
- Showerhead Injectors: Arrays of small orifices spray propellants in a pattern.
- Coaxial Injectors: Fuel and oxidizer flow concentrically, mixing at the interface.
Each type has trade-offs in complexity, mixing quality, and susceptibility to combustion instabilities.
Key Design Considerations
- Droplet Size: Smaller droplets vaporize faster, improving combustion efficiency.
- Spray Pattern: Uniform distribution prevents localized hot spots.
- Flow Rate Ratio: Precise control of fuel-to-oxidizer ratio is essential.
- Pressure Drop: Sufficient pressure drop across the injector ensures good atomization.
Mind Map: Injector Design Overview
Mixing Techniques
Effective mixing of fuel and oxidizer is vital for stable combustion. The main mixing mechanisms include:
- Jet Impingement: High-velocity jets collide, breaking into fine droplets.
- Shear Mixing: Velocity differences between streams cause turbulence and mixing.
- Swirl Injection: Imparting swirl to propellant streams enhances mixing by centrifugal forces.
- Film Injection: Thin films of one propellant spread over surfaces to mix with the other.
Each technique influences combustion stability and efficiency differently.
Practical Example: Impinging Jet Injector
Consider a simple impinging jet injector with two fuel jets and two oxidizer jets arranged in a cross pattern. The jets collide at the center, atomizing the liquids. This design is straightforward and provides good mixing but can be prone to combustion instability if not carefully tuned.
- Design Step: Calculate jet velocities to achieve desired atomization.
- Example: For kerosene and liquid oxygen, jet velocities might be 30 m/s to ensure fine droplets.
- Outcome: The collision breaks droplets to around 100 microns, suitable for combustion.
Mind Map: Mixing Techniques
Best Practices in Injector Design
- Balance Between Atomization and Pressure Loss: Excessive pressure drop wastes energy; insufficient atomization reduces combustion efficiency.
- Avoid Sharp Edges: To reduce erosion and flow disturbances.
- Use Computational Fluid Dynamics (CFD): To predict spray patterns and optimize injector geometry.
- Test with Cold-Flow Models: Before hot-fire testing, verify flow distribution and mixing.
Practical Example: Pintle Injector Throttling
A pintle injector allows throttling by moving the pintle to vary the annular gap. For example, the Apollo Lunar Module used a pintle injector to modulate thrust from 10% to 100%. This design simplified throttling without complex valve arrangements.
- Design Consideration: Ensure smooth flow changes to prevent combustion instability.
- Result: Reliable thrust control with stable combustion.
Summary
Injector design is a balance of fluid mechanics, combustion chemistry, and mechanical engineering. Understanding the trade-offs between injector types and mixing methods helps engineers optimize engine performance. Practical testing combined with simulation refines designs to meet mission requirements.
2.5 Cooling Methods: Regenerative, Film, and Radiative Cooling
Rocket engines operate under extreme thermal conditions. The combustion chamber and nozzle experience temperatures that can exceed the melting points of their materials. Without effective cooling, these components would fail rapidly. This section covers three primary cooling methods used in liquid propellant engines: regenerative cooling, film cooling, and radiative cooling. Each method balances thermal protection, complexity, and efficiency differently.
Regenerative Cooling
Regenerative cooling is the most common cooling technique in liquid rocket engines. It involves circulating one of the propellants—usually the fuel—through channels or jackets surrounding the combustion chamber and nozzle before it enters the injector. This flow absorbs heat from the engine walls, lowering their temperature, while simultaneously preheating the propellant, which can improve combustion efficiency.
Key points:
- Uses propellant as coolant, eliminating the need for separate coolant fluids.
- Requires intricate channel design to maximize heat transfer without excessive pressure drop.
- Preheating the propellant can enhance combustion but risks coking or decomposition if temperatures get too high.
Mind map:
Example: Consider a liquid hydrogen-fueled engine. Liquid hydrogen flows through narrow channels wrapped around the combustion chamber. Hydrogen’s high specific heat capacity and low density make it an excellent coolant. As it absorbs heat, it warms up but remains below its boiling point, preventing phase change inside the channels. This warmed hydrogen then enters the combustion chamber, improving combustion efficiency.
Film Cooling
Film cooling involves injecting a thin layer of coolant fluid—usually the fuel or an inert gas—along the inner walls of the combustion chamber or nozzle. This layer forms a protective film that insulates the wall from the hot combustion gases.
Key points:
- Creates a physical barrier between hot gases and the wall.
- Can be used in combination with regenerative cooling.
- Reduces heat transfer but can slightly reduce engine performance due to mixing of cooler film with hot gases.
Mind map:
Example: In the Space Shuttle Main Engine (SSME), film cooling is used in the nozzle extension. A small amount of hydrogen is injected along the nozzle walls, forming a thin, cooler layer that shields the metal from the hot exhaust gases. This allows the nozzle extension to be made from thinner material, saving weight.
Radiative Cooling
Radiative cooling relies on the engine components emitting heat as infrared radiation to the surroundings. This method is passive and requires materials with high emissivity and surfaces designed to maximize radiative heat loss.
Key points:
- Effective mainly in vacuum or near-vacuum conditions where convection is minimal.
- Typically used for ablative or nozzle extensions exposed to space.
- Limited cooling capacity compared to regenerative or film cooling.
Mind map:
Example: A nozzle extension on a small upper-stage engine might be coated with a high-emissivity ceramic paint. As the engine operates in space, the nozzle radiates heat away, preventing overheating. Since there is no atmosphere, convective cooling is negligible, making radiation the primary heat loss mechanism.
Summary Comparison
| Cooling Method | Mechanism | Advantages | Disadvantages | Typical Use Cases |
|---|---|---|---|---|
| Regenerative Cooling | Propellant flows through channels absorbing heat | Efficient cooling, preheats propellant | Complex channel design, pressure losses | Main combustion chamber and nozzle walls |
| Film Cooling | Thin coolant layer along walls | Additional protection, protects hot spots | Slight performance loss, injector complexity | Nozzle extensions, hot spots |
| Radiative Cooling | Heat emitted as infrared radiation | Passive, simple design | Low heat removal, limited to vacuum | Nozzle extensions in space |
Effective cooling is critical to engine longevity and performance. Often, engineers combine these methods to optimize thermal management. For example, regenerative cooling handles the bulk heat load, while film cooling protects localized hot spots, and radiative cooling manages heat in vacuum-exposed components.
Understanding the trade-offs and practical implementation of each method is essential for designing reliable liquid propellant engines.
2.6 Practical Example: Designing a Simple Pressure-fed Engine
Designing a pressure-fed liquid rocket engine is a good starting point for understanding liquid propulsion basics. This example breaks down the process into manageable steps, focusing on key design decisions and calculations. We’ll keep it straightforward, using water as a stand-in propellant for simplicity, but the principles apply broadly.
Step 1: Define Engine Requirements
- Thrust: 500 N (about 50 kgf)
- Chamber Pressure: 1 MPa (10 bar)
- Propellant: Water (simplified for example)
- Nozzle Expansion Ratio: 10
- Burn Time: 30 seconds
These parameters set the foundation. Thrust and chamber pressure are typical starting points. Water is not a real rocket propellant, but it simplifies thermodynamics and fluid properties for this example.
Step 2: Understand Pressure-fed Cycle Basics
Pressure-fed engines use tank pressure to push propellants into the combustion chamber, avoiding turbopumps. This simplifies design but limits chamber pressure and thus performance.
Mind map of pressure-fed engine components:
Step 3: Calculate Mass Flow Rate
Thrust (F) relates to mass flow rate (ṁ) and exhaust velocity (v_e):
\[ F = \dot{m} \times v_e \]
Exhaust velocity depends on chamber pressure and propellant properties. For water steam, approximate exhaust velocity is around 800 m/s at 1 MPa.
Calculate mass flow rate:
\[ \dot{m} = \frac{F}{v_e} = \frac{500}{800} = 0.625 \text{ kg/s} \]
This means 0.625 kg of propellant must flow through the engine every second.
Step 4: Determine Propellant Volume Flow Rate
Water density is about 1000 kg/m³.
\[ Q = \frac{\dot{m}}{\rho} = \frac{0.625}{1000} = 6.25 \times 10^{-4} \text{ m}^3/\text{s} = 0.625 \text{ L/s} \]
The tank and feed system must supply this volume continuously.
Step 5: Design the Nozzle
The nozzle expands hot gases to convert pressure into velocity. For a simple design, use isentropic flow relations.
Key parameters:
- Chamber pressure (P_c): 1 MPa
- Exit pressure (P_e): 0.1 MPa (ambient)
- Expansion ratio (ε): 10
Calculate throat area \(A_t\) from mass flow rate and chamber conditions. For water steam, assume gas constant R = 461.5 J/kg·K, chamber temperature T_c = 1000 K, and specific heat ratio γ = 1.3.
Using the choked flow equation:
\[ \dot{m} = A_t P_c \sqrt{\frac{\gamma}{RT_c}} \left( \frac{2}{\gamma+1} \right)^{\frac{\gamma+1}{2(\gamma-1)}} \]
Rearranged for throat area A_t:
\[ A_t = \frac{\dot{m}}{P_c} \sqrt{\frac{RT_c}{\gamma}} \left( \frac{\gamma+1}{2} \right)^{\frac{\gamma+1}{2(\gamma-1)}} \]
Plugging in values:
\[ A_t = \frac{0.625}{1 \times 10^{6}} \times \sqrt{\frac{461.5 \times 1000}{1.3}} \times \left( \frac{2.3}{2} \right)^{\frac{2.3}{0.6}} \approx 1.2 \times 10^{-4} \text{ m}^2 \]
This corresponds to a throat diameter of about 12.4 mm.
Exit area A_e = ε × A_t = 10 × 1.2×10⁻⁴ = 1.2×10⁻³ m², or about 39 mm diameter.
Step 6: Tank and Pressurization Design
The tank must hold enough propellant for 30 seconds:
\[ m_{total} = \dot{m} \times t = 0.625 \times 30 = 18.75 \text{ kg} \]
Volume:
\[ V = \frac{m}{\rho} = \frac{18.75}{1000} = 0.01875 \text{ m}^3 = 18.75 \text{ L} \]
Add margin for ullage (space for pressurant gas), say 20%, so tank volume ≈ 22.5 L.
Pressurization gas (helium) must maintain 1 MPa in the tank as propellant drains. Design involves calculating required helium volume and pressure, but for this example, assume a separate high-pressure helium bottle.
Step 7: Feed System and Valves
Feed lines must handle 1 MPa pressure and 0.625 kg/s flow rate. Use pipes with low pressure drop to maintain chamber pressure.
Valves control propellant flow. For a simple engine, a manual or solenoid valve upstream of the combustion chamber suffices.
Step 8: Assembly and Operation Sequence
- Fill tank with propellant.
- Pressurize tank with helium to 1 MPa.
- Open valve to start flow.
- Propellant flows into combustion chamber, vaporizes, and expands through nozzle.
- Engine produces 500 N thrust for 30 seconds.
- Close valve to shut down.
Summary Mind Map
This example illustrates the core steps in designing a simple pressure-fed engine. Real engines require more detailed thermodynamics, materials considerations, and safety factors, but this exercise captures the essential workflow and calculations.
2.7 Best Practices: Material Selection for Engine Components with Case Studies
Material selection for liquid propellant engine components is a critical step that directly influences engine performance, reliability, and lifespan. The choice depends on mechanical properties, thermal resistance, corrosion behavior, manufacturability, and cost. This section breaks down the key considerations and illustrates them with practical examples and mind maps.
Key Considerations in Material Selection
- Mechanical Strength: Components like combustion chambers and turbopump shafts must withstand high stresses.
- Thermal Resistance: High temperatures in combustion chambers and nozzles demand materials with excellent thermal stability.
- Corrosion and Oxidation Resistance: Propellants and combustion products can be chemically aggressive.
- Manufacturability: Complex geometries and tight tolerances require materials amenable to machining, welding, or forming.
- Weight: Lightweight materials improve thrust-to-weight ratio but must not compromise strength.
- Cost and Availability: Budget constraints and supply chain impact choices.
Mind Map: Material Selection Factors
Common Materials and Their Uses
- Nickel-based Superalloys: Used in combustion chambers and turbine blades due to high strength at elevated temperatures and oxidation resistance.
- Stainless Steels (e.g., 300 series): Employed in propellant feed lines and valves for corrosion resistance and good strength.
- Aluminum Alloys: Used in structural components where weight savings are critical but temperatures are moderate.
- Copper Alloys: Often used in combustion chamber liners and nozzle throats for high thermal conductivity aiding cooling.
- Titanium Alloys: Selected for components requiring high strength-to-weight ratio and moderate temperature resistance.
Case Study 1: Combustion Chamber Material Selection for a High-Performance Engine
A combustion chamber experiences temperatures exceeding 3,000 K and pressures above 10 MPa. The material must tolerate thermal shock, oxidation, and mechanical stress.
- Initial Choice: Stainless steel for ease of manufacturing.
- Problem: Excessive thermal fatigue and oxidation after repeated cycles.
- Solution: Switch to a nickel-based superalloy (e.g., Inconel 718) with regenerative cooling channels.
- Result: Improved lifespan and performance stability.
This example highlights the trade-off between manufacturability and thermal/mechanical performance.
Case Study 2: Turbopump Shaft Material Selection
The turbopump shaft must endure high rotational speeds and cyclic loading.
- Material Requirements: High tensile strength, fatigue resistance, and corrosion resistance.
- Material Chosen: Maraging steel, known for excellent strength and toughness.
- Manufacturing Consideration: Requires precise heat treatment to achieve desired properties.
The case illustrates the importance of matching material processing to performance needs.
Practical Example: Material Selection for Injector Plate
The injector plate faces hot combustion gases and propellant exposure. It needs good thermal conductivity and corrosion resistance.
- Option 1: Copper alloy for thermal conductivity.
- Option 2: Stainless steel for corrosion resistance.
Best Practice: Use a copper alloy with a corrosion-resistant coating or bimetallic construction to balance thermal and chemical demands.
Mind Map: Material Selection Workflow
Summary
Material selection in liquid propellant engines is a balancing act. No single material excels in all areas, so engineers must prioritize based on component function and operating environment. Case studies demonstrate how choices evolve from initial assumptions to optimized solutions. Using structured workflows and mind maps helps organize the decision process and avoid overlooking critical factors.
3. Liquid Rocket Engine Components and Subsystems
3.1 Propellant Feed Systems: Pumps and Turbines
Liquid propellant rocket engines rely on precise and reliable feed systems to deliver fuel and oxidizer from storage tanks to the combustion chamber at the required pressure and flow rate. The propellant feed system is a critical component that influences engine performance, stability, and safety.
Overview of Propellant Feed Systems
Propellant feed systems can be broadly categorized into two types: pressure-fed and pump-fed systems. Pressure-fed systems use tank pressure to push propellants into the combustion chamber, suitable for small engines and simple designs. Pump-fed systems employ turbopumps to increase propellant pressure, enabling higher thrust and efficiency.
This section focuses on pump-fed systems, specifically the pumps and turbines that make up turbopumps.
Components of Pump-Fed Propellant Feed Systems
- Pumps: Devices that increase propellant pressure and flow rate.
- Turbines: Power the pumps by extracting energy from high-pressure gases or propellants.
- Shaft: Connects turbine and pump, transmitting mechanical power.
- Bearings and Seals: Support the shaft and prevent leaks.
Types of Pumps Used
- Centrifugal Pumps: Use a rotating impeller to add velocity to the fluid, converting it to pressure in a diffuser. Common in rocket engines due to high flow rates and moderate pressure rise.
- Axial Flow Pumps: Propel fluid parallel to the shaft, suitable for very high flow rates but lower pressure increases.
- Reciprocating Pumps: Use pistons or diaphragms; rare in rocket propulsion due to complexity and weight.
Turbines in Turbopumps
Turbines extract energy from hot gases or propellants to drive the pump. Common types include:
- Gas Generator Turbines: Use combustion gases from a gas generator.
- Expander Cycle Turbines: Use heated propellant vapor.
- Staged Combustion Turbines: Use partially combusted propellants.
Mind Map: Propellant Feed System Components
How Pumps and Turbines Work Together
The turbine extracts energy from a working fluid, spinning the shaft connected to the pump. The pump then pressurizes the propellant and sends it to the combustion chamber. The design must balance power output, efficiency, and mechanical reliability.
Example: Simple Centrifugal Pump Operation
Imagine water flowing into the center of a spinning impeller. The impeller blades push the water outward by centrifugal force, increasing its velocity. This velocity converts to pressure in the diffuser, allowing the pump to push water against higher pressure.
In a rocket engine, the same principle applies but with cryogenic propellants and much higher rotational speeds.
Mind Map: Centrifugal Pump Flow Path
Practical Example: Turbopump Power Balance
Suppose a turbopump must deliver 100 kg/s of liquid oxygen at 20 MPa pressure. The pump requires a certain power input to achieve this. The turbine must extract at least this power from the gas generator exhaust to drive the pump.
Calculating power:
- Pump power \( P_p = \frac{\Delta p \times \dot{V}}{\eta_p} \)
Where:
- \( \Delta p \) = pressure increase
- \( \dot{V} \) = volumetric flow rate
- \( \eta_p \) = pump efficiency
This power sets the minimum turbine power output.
Best Practices in Pump and Turbine Design
- Material Selection: Use materials resistant to cryogenic temperatures and corrosion.
- Dynamic Balancing: Minimize vibrations by balancing rotating components.
- Bearing Design: Choose appropriate bearings (ball, journal) to handle loads and temperatures.
- Sealing: Prevent propellant leaks with reliable seals.
- Thermal Management: Account for heat transfer to avoid thermal stresses.
Mind Map: Best Practices in Turbopump Design
Troubleshooting Example: Cavitation in Pumps
Cavitation occurs when local pressure drops below vapor pressure, causing vapor bubbles that damage impeller blades.
Symptoms: Noise, vibration, reduced performance.
Mitigation: Increase inlet pressure, reduce pump speed, or redesign impeller.
This section covered the fundamental components and operation of liquid propellant feed systems focusing on pumps and turbines. Understanding these elements is essential for designing reliable and efficient rocket engines.
3.2 Valves and Actuators
Valves and actuators are critical components in liquid propellant rocket engines. They regulate the flow of propellants, control pressures, and enable precise engine operation. Without reliable valves and actuators, controlling the complex fluid dynamics inside an engine would be impossible.
Types of Valves
Valves in rocket engines generally fall into a few categories based on their function and operation:
- Shutoff Valves: Used to start or stop propellant flow completely.
- Control Valves: Regulate flow rate or pressure continuously.
- Check Valves: Allow flow in one direction only, preventing backflow.
- Relief Valves: Protect systems by releasing excess pressure.
Each valve type must be designed to withstand extreme temperatures, pressures, and corrosive propellants.
Valve Actuation Methods
Actuators move valves between positions. Common actuation methods include:
- Hydraulic Actuators: Use pressurized fluid to move the valve.
- Pneumatic Actuators: Use compressed gas for movement.
- Electric Actuators: Employ electric motors or solenoids.
- Pyrotechnic Actuators: Use a small controlled explosion for rapid valve opening or closing.
The choice depends on response time, reliability, weight, and complexity.
Mind Map: Valve Types and Actuators
Valve Design Considerations
- Leak Tightness: Preventing propellant leaks is essential for safety and performance.
- Response Time: Fast actuation can be crucial during engine start or shutdown.
- Material Compatibility: Valves must resist corrosion from propellants like liquid oxygen or hydrazine.
- Thermal Resistance: Components must tolerate cryogenic or high-temperature environments.
- Redundancy: Critical valves often have backups to ensure mission success.
Example: Engine Start Sequence Valve Operation
During engine start, shutoff valves open to allow propellant flow to the combustion chamber. Actuators must open these valves quickly and reliably. A typical sequence might involve:
- Command sent to electric actuator.
- Actuator drives valve stem to open position.
- Propellant begins flowing through the valve.
- Sensors confirm valve position.
- Engine ignition proceeds.
If the valve fails to open fully, the engine may not ignite or could run improperly.
Mind Map: Valve Operation in Engine Start
Actuator Control and Feedback
Modern launch vehicles use closed-loop control systems. Valve actuators receive commands from flight computers and provide feedback on position and status. This feedback allows the system to adjust valve positions dynamically, maintaining optimal engine conditions.
Practical Example: Troubleshooting a Stuck Valve
Imagine a control valve that fails to modulate propellant flow during a test. Steps to diagnose might include:
- Checking actuator power supply and signal integrity.
- Inspecting valve for mechanical obstruction or corrosion.
- Verifying sensor feedback accuracy.
- Testing actuator independently from the valve.
Resolving such issues often involves coordinated mechanical and electrical checks.
Best Practices Summary
- Select valve and actuator types based on mission requirements and environment.
- Design for redundancy where failure is not an option.
- Use materials compatible with propellants and temperature extremes.
- Implement reliable position feedback for closed-loop control.
- Test valves and actuators extensively under simulated operating conditions.
Valves and actuators may be small components, but their role in controlling propellant flow is fundamental. Understanding their types, operation, and design challenges is key to building dependable liquid propellant engines.
3.3 Combustion Chamber and Nozzle Design
The combustion chamber and nozzle are the heart of a liquid propellant rocket engine. Their design directly influences engine performance, efficiency, and structural integrity. This section covers the fundamental principles, design considerations, and practical examples to clarify how these components work together.
Combustion Chamber
The combustion chamber is where propellants mix and burn, producing high-temperature, high-pressure gases. These gases expand and accelerate through the nozzle to generate thrust.
Key considerations in combustion chamber design include:
- Pressure and Temperature: The chamber must withstand extreme pressures (often tens of megapascals) and temperatures (up to 3500 K or more).
- Material Selection: High-temperature alloys or regenerative cooling are necessary to prevent structural failure.
- Geometry: The chamber shape affects combustion efficiency and flow stability. Typically, a cylindrical or slightly tapered shape is used.
- Combustion Stability: Avoiding oscillations or combustion instabilities is critical to prevent damage.
Mind Map: Combustion Chamber Design
Example:
Consider a chamber operating at 7 MPa with a combustion temperature of 3200 K. The chamber wall is made of a copper alloy with regenerative cooling channels. The cooling fluid (fuel) absorbs heat, maintaining wall temperature below 800 K. This design balances thermal protection with weight constraints.
Nozzle Design
The nozzle converts the thermal energy of combustion gases into kinetic energy, producing thrust. It accelerates gases from subsonic speeds inside the chamber to supersonic speeds at the exit.
Important aspects of nozzle design include:
- Nozzle Types: Convergent, convergent-divergent (de Laval), and expansion-deflection nozzles.
- Expansion Ratio: Ratio of exit area to throat area; affects exhaust velocity and efficiency.
- Flow Regimes: Ideally, the nozzle expands gases to ambient pressure for maximum efficiency.
- Material and Cooling: Similar to the chamber, the nozzle must handle high temperatures and stresses.
Mind Map: Nozzle Design
Example:
A de Laval nozzle with a throat diameter of 0.1 m and an exit diameter of 0.3 m has an expansion ratio of 9. This ratio is chosen to optimize performance at sea level, balancing between underexpanded and overexpanded flow conditions.
Integration of Combustion Chamber and Nozzle
The chamber and nozzle must be designed as a system:
- The chamber pressure sets the throat conditions.
- The throat area controls mass flow rate.
- The expansion ratio determines exhaust velocity and thrust.
Mind Map: Combustion Chamber & Nozzle Integration
Example:
For a target thrust of 500 kN at sea level, the chamber pressure is set at 8 MPa. The throat area is calculated to maintain the required mass flow. The nozzle expansion ratio is chosen to maximize thrust without causing flow separation at ambient pressure.
Practical Example: Designing a Simple Combustion Chamber and Nozzle
Suppose you need to design a combustion chamber and nozzle for a small liquid oxygen (LOX) and kerosene engine producing 100 kN thrust.
- Set chamber pressure: 5 MPa (typical for small engines).
- Calculate throat area: Using mass flow rate and chamber conditions.
- Select chamber geometry: Cylindrical with length-to-diameter ratio around 1.5.
- Choose materials: Copper alloy with regenerative cooling.
- Design nozzle: De Laval nozzle with expansion ratio ~7 for sea level operation.
- Check thermal loads: Ensure cooling channels remove heat efficiently.
This stepwise approach ensures each design choice supports overall engine performance and reliability.
Best Practices Summary
- Design the combustion chamber to handle peak pressures and temperatures with appropriate materials and cooling.
- Use a de Laval nozzle for supersonic expansion, selecting expansion ratio based on operating altitude.
- Integrate chamber and nozzle design to optimize mass flow and thrust.
- Include combustion stability analysis early to avoid costly redesigns.
- Use examples and calculations to validate design choices.
This section provides a foundation for understanding how combustion chambers and nozzles work together to convert chemical energy into thrust efficiently and reliably.
3.4 Thrust Vector Control Mechanisms
Thrust vector control (TVC) is the method by which a rocket engine directs its thrust to control the vehicle’s attitude and trajectory. Since rockets operate in a near-frictionless environment once airborne, steering relies heavily on adjusting the direction of the thrust rather than aerodynamic surfaces. TVC is essential for maintaining stability, performing maneuvers, and achieving precise orbital insertion.
Overview of Thrust Vector Control
TVC systems manipulate the engine’s thrust direction by physically changing the nozzle orientation or by altering the flow of propellant within the engine. The goal is to generate a torque about the vehicle’s center of mass, enabling pitch, yaw, and sometimes roll control.
Common Thrust Vector Control Methods
-
Gimbaled Nozzles
- The entire engine or nozzle is mounted on a pivot and can be tilted in one or two axes.
- Actuators (hydraulic, electric, or pneumatic) move the nozzle to vector thrust.
- Provides precise control and is widely used in large liquid engines.
-
Jet Vanes or Jet Deflectors
- Small aerodynamic surfaces or vanes placed in the exhaust flow to deflect the thrust.
- Common in solid rocket motors or early liquid engines.
- Introduces some performance loss due to flow obstruction.
-
Secondary Injection Thrust Vector Control (SITVC)
- Injection of fluid (usually inert gas or propellant) into the exhaust stream to change flow direction.
- Used in some solid motors and hybrid engines.
-
Differential Thrust
- Using multiple engines and varying their thrust levels to create torque.
- Common in multi-engine configurations.
-
Nozzle Fluidic Control
- Using fluidic devices inside the nozzle to alter flow patterns without moving parts.
Mind Map: Thrust Vector Control Methods
Gimbaled Nozzle: The Workhorse of TVC
Gimbaled nozzles are the most common TVC mechanism in liquid rocket engines. The nozzle or entire engine is mounted on a gimbal, allowing it to pivot about one or two axes. Actuators move the nozzle to vector the thrust. This method provides a wide range of motion and precise control.
Example: The Space Shuttle Main Engine (SSME) uses a two-axis gimbal system to steer the vehicle during ascent. The gimbal angles are controlled by the flight computer to maintain the desired trajectory.
Best Practice: When designing a gimbaled system, ensure the actuators have sufficient torque margin and response speed to handle dynamic flight conditions. Also, consider the mechanical loads on the gimbal bearings and the effect of nozzle movement on propellant feed lines.
Jet Vanes: Simplicity at a Cost
Jet vanes are small surfaces inserted into the exhaust flow to deflect the thrust vector. They are simple and robust but cause a reduction in engine efficiency because they partially obstruct the exhaust.
Example: The V-2 rocket used graphite jet vanes to control its flight path. Despite the performance penalty, this method was effective for early rockets.
Best Practice: Use jet vanes only when simplicity and reliability outweigh the need for maximum efficiency. Materials must withstand high temperatures and erosion from the exhaust gases.
Secondary Injection Thrust Vector Control (SITVC)
SITVC involves injecting a fluid into the exhaust stream to create asymmetric flow and thus vector thrust. This method avoids moving parts in the nozzle but requires a supply of injection fluid.
Example: Some solid rocket motors use nitrogen injection to deflect the exhaust flow and control the vehicle.
Best Practice: Carefully size the injection system to balance control authority and propellant consumption. The injection fluid should be compatible with the exhaust environment.
Differential Thrust
In vehicles with multiple engines, varying the thrust levels between engines can produce a torque to steer the vehicle. This method is often combined with other TVC methods.
Example: The Falcon 9 first stage uses differential throttling of its nine Merlin engines to control pitch and yaw during ascent.
Best Practice: Ensure engine throttling can be controlled precisely and rapidly. Consider the impact on vehicle stability and structural loads.
Mind Map: Design Considerations for TVC
Practical Example: Designing a Gimbaled Nozzle System
Suppose you are tasked with designing a gimbaled nozzle for a 500 kN thrust engine. The vehicle requires a maximum pitch/yaw deflection of ±5 degrees to maintain control authority.
- Calculate the torque needed to rotate the nozzle against the thrust force.
- Select actuators capable of providing this torque with a safety margin.
- Design flexible propellant lines or swivel joints to accommodate nozzle movement.
- Analyze structural loads on the gimbal bearings during maximum deflection.
- Implement sensors to provide feedback on nozzle position for closed-loop control.
This example highlights the interplay between mechanical design, control requirements, and system integration.
Summary
Thrust vector control is a critical subsystem in launch vehicle design. The choice of TVC method depends on engine type, vehicle configuration, performance requirements, and reliability considerations. Gimbaled nozzles offer precise control but add mechanical complexity. Jet vanes and SITVC provide alternatives with different trade-offs. Differential thrust is effective in multi-engine setups. Understanding these methods and their design implications helps engineers create stable, controllable launch vehicles.
3.5 Engine Start-up and Shutdown Procedures
The start-up and shutdown of a liquid propellant rocket engine are critical phases that require precise control and coordination. These procedures ensure the engine reaches stable combustion and shuts down safely without causing damage to the engine or the vehicle.
Engine Start-up Procedure
Start-up involves several sequential steps to transition from a non-operational state to full thrust. The process typically includes:
- Pre-start Checks: Verify all systems are nominal, including propellant feed lines, valves, sensors, and control systems.
- Ignition Sequence Initiation: Activate igniters or spark devices to initiate combustion.
- Propellant Flow Ramp-up: Gradually open valves to introduce fuel and oxidizer into the combustion chamber.
- Combustion Stabilization: Monitor chamber pressure and temperature to ensure stable combustion.
- Throttle to Desired Thrust: Adjust propellant flow to reach the required thrust level.
Each step must be timed and controlled carefully to avoid combustion instability, overpressure, or hardware damage.
Engine Shutdown Procedure
Shutting down the engine is equally important and involves:
- Throttle Down: Reduce propellant flow gradually to avoid thermal shock.
- Close Propellant Valves: Shut off fuel and oxidizer supply to stop combustion.
- Purge Lines: Use inert gases to clear residual propellants and prevent combustion in feed lines.
- Cool-down Monitoring: Ensure temperatures decrease within safe limits.
Proper shutdown prevents damage from thermal stresses and residual combustion.
Mind Map: Engine Start-up Procedure
Mind Map: Engine Shutdown Procedure
Example: Start-up of a Pressure-fed Engine
Consider a small pressure-fed engine designed for a sounding rocket. The start-up sequence begins with pre-start checks confirming tank pressures and valve readiness. The ignition system activates a spark igniter inside the combustion chamber. Fuel and oxidizer valves open slowly, allowing propellants to mix and ignite. Chamber pressure rises steadily, and once stable combustion is confirmed, the engine reaches full thrust.
If the valves open too quickly, the sudden influx of propellants can cause combustion instability or overpressure. Conversely, opening too slowly risks flameout. The example highlights the importance of valve timing and flow control.
Example: Shutdown of a Staged Combustion Engine
In a staged combustion engine, shutdown involves throttling down the turbopumps before closing propellant valves. This prevents pressure spikes in the feed lines. After valves close, inert gas purges the lines to remove unburned propellants. Temperature sensors monitor the combustion chamber and nozzle to ensure they cool at a controlled rate, avoiding thermal stress.
This example shows how shutdown procedures vary with engine complexity and the need to protect sensitive components.
Best Practices Summary
- Sequence Control: Follow a strict sequence for valve operation and ignition to prevent transient instabilities.
- Monitoring: Use real-time data from pressure, temperature, and flow sensors to adjust the process dynamically.
- Gradual Transitions: Avoid abrupt changes in propellant flow during start-up and shutdown to reduce mechanical and thermal stress.
- Purge Lines: Always purge feed lines after shutdown to prevent residual combustion or corrosion.
- Redundancy: Design ignition and valve systems with redundancy to increase reliability.
Understanding and applying these principles ensures safe and efficient engine operation during the most critical phases of flight.
3.6 Practical Example: Troubleshooting Pump Cavitation Issues
Pump cavitation is a common and critical problem in liquid propellant rocket engines. It occurs when the local pressure in the pump inlet drops below the vapor pressure of the propellant, causing vapor bubbles to form. These bubbles collapse violently when they move to higher-pressure regions, damaging the pump and reducing performance.
Understanding Cavitation
To troubleshoot cavitation, first understand its causes and symptoms. Here’s a mind map to organize the key factors:
Pump Cavitation Mind Map
Step-by-Step Troubleshooting Example
Imagine a liquid oxygen (LOX) pump in a rocket engine exhibiting unusual vibration and a drop in flow rate during a test. The following steps illustrate a practical approach to diagnosing and fixing cavitation.
-
Confirm Symptoms: Check vibration data and pressure readings at the pump inlet and outlet. If inlet pressure is near or below LOX vapor pressure at operating temperature, cavitation is likely.
-
Analyze Operating Conditions: Review pump speed and propellant temperature. High speed or elevated temperature reduces the margin against cavitation.
-
Inspect Inlet Conditions: Look for flow disturbances such as sharp bends, restrictions, or air entrainment upstream of the pump.
-
Calculate Net Positive Suction Head (NPSH):
\[ NPSH = P_{inlet} - P_{vapor} + \frac{\rho v^2}{2} \]
Where:
- \(P_{inlet}\) is the absolute pressure at pump inlet
- \(P_{vapor}\) is vapor pressure of the propellant
- \(\rho\) is fluid density
- \(v\) is velocity at inlet
If NPSH available is less than NPSH required by the pump, cavitation will occur.
-
Implement Solutions:
- Increase inlet pressure by raising tank pressure or reducing elevation difference.
- Lower pump speed to reduce pressure drop.
- Add an inducer stage to the pump to boost inlet pressure.
- Modify inlet piping to smooth flow and reduce turbulence.
Example Calculation
Suppose:
- LOX vapor pressure at -183°C = 0.15 bar absolute
- Pump inlet pressure = 0.3 bar absolute
- Fluid density = 1140 kg/m³
- Velocity at inlet = 10 m/s
Calculate NPSH:
\[ NPSH = 0.3 - 0.15 + \frac{1140 \times 10^2}{2 \times 10^5} = 0.15 + 0.57 = 0.72 \text{ bar} \]
If the pump requires 1 bar NPSH, cavitation will occur. Increasing inlet pressure or reducing velocity can help.
Mind Map: Remedies and Their Impact
Cavitation Remedies Mind Map
Practical Considerations
- Always monitor vibration and pressure sensors during tests.
- Use high-speed cameras or transparent test sections if possible to observe cavitation bubbles.
- Remember that cavitation damage accumulates; early detection prevents costly repairs.
- Balance between performance and cavitation risk is key; sometimes accepting a slightly lower flow rate avoids damage.
This example shows how a systematic approach using measurements, calculations, and design adjustments can effectively troubleshoot and mitigate pump cavitation in liquid propellant rocket engines.
3.7 Best Practices: Integration of Subsystems for Reliability
Integrating subsystems in a liquid propellant rocket engine is a complex task that requires careful coordination to ensure the entire system functions reliably under extreme conditions. Each subsystem—propellant feed, combustion, cooling, control, and structural components—must work seamlessly with the others. Failure in one area can cascade, causing mission failure or damage.
Key Principles of Subsystem Integration
- Interface Definition: Clearly define mechanical, electrical, and fluid interfaces between subsystems. Ambiguity leads to mismatches and integration errors.
- Modularity: Design subsystems to be as independent as possible, allowing easier testing and replacement.
- Redundancy: Incorporate backup components or pathways where failure risk is high.
- Communication: Maintain clear data and control signal pathways, ensuring subsystems respond correctly to commands and status updates.
- Testing at Interfaces: Test not just individual subsystems but also their interfaces early and often.
Mind Map: Subsystem Integration Overview
Example 1: Propellant Feed and Combustion Chamber Integration
The propellant feed system delivers fuel and oxidizer at precise pressures and flow rates to the combustion chamber. If the feed system’s pressure fluctuates or pulsates, it can cause combustion instability, leading to engine damage or shutdown.
Best Practice: Use dampeners or accumulators in the feed lines to smooth pressure variations. Validate flow rates with flowmeters and pressure sensors during subsystem testing before integration.
Example Detail: In a test engine, engineers noticed pressure spikes causing combustion roughness. Adding a small volume accumulator downstream of the turbopump outlet stabilized the flow, reducing pressure oscillations by 30%. This simple addition improved engine reliability without major redesign.
Mind Map: Propellant Feed and Combustion Chamber Integration
Example 2: Cooling System and Structural Integration
The regenerative cooling jacket surrounds the combustion chamber and nozzle, circulating cryogenic propellant to absorb heat. The cooling channels must be integrated without compromising structural integrity.
Best Practice: Use finite element analysis (FEA) to model thermal stresses and optimize channel geometry. Ensure welds and joints between cooling channels and structural walls are robust and leak-proof.
Example Detail: During prototype testing, a cooling channel weld showed micro-cracks under thermal cycling. Redesigning the weld geometry and switching to a more ductile alloy eliminated the cracks, preventing coolant leaks and maintaining structural strength.
Mind Map: Cooling and Structural Integration
Example 3: Control System and Actuator Integration
Thrust vector control (TVC) uses actuators to gimbal the engine nozzle. The control system must send precise commands, and actuators must respond reliably under vibration and temperature extremes.
Best Practice: Implement closed-loop control with position feedback sensors. Use vibration-isolated mounts for actuators. Conduct hardware-in-the-loop (HIL) testing to simulate flight conditions.
Example Detail: In a test campaign, actuator response lag caused control oscillations. Adding a predictive filter in the control algorithm reduced lag effects, smoothing nozzle movement and improving stability.
Mind Map: Control and Actuator Integration
General Tips for Reliable Subsystem Integration
- Documentation: Maintain detailed interface control documents (ICDs) to track requirements and changes.
- Cross-Disciplinary Reviews: Hold regular meetings with teams from different subsystems to catch integration issues early.
- Incremental Integration: Integrate and test subsystems step-by-step rather than all at once.
- Use of Simulators: Employ software and hardware simulators to validate subsystem interactions before physical assembly.
- Failure Mode Analysis: Perform Failure Mode and Effects Analysis (FMEA) focusing on interface points.
Integrating subsystems is less about perfecting each part in isolation and more about ensuring they work together smoothly. Small mismatches at interfaces can cause big problems. Careful design, thorough testing, and clear communication are the best tools to build reliable engines.
4. Performance Analysis and Testing of Liquid Propellant Engines
4.1 Performance Parameters: Thrust, Specific Impulse, Efficiency
Rocket engine performance is primarily evaluated through three key parameters: thrust, specific impulse, and efficiency. Each offers a different perspective on how well the engine converts propellant into useful force and motion.
Thrust
Thrust is the force generated by the rocket engine to propel the vehicle forward. It is measured in newtons (N) or pounds-force (lbf). The fundamental equation for thrust (F) is:
\[ F = \dot{m} \cdot v_e + (p_e - p_a) A_e \]
where:
- \( \dot{m} \) = mass flow rate of the propellant (kg/s)
- \( v_e \) = effective exhaust velocity (m/s)
- \( p_e \) = exhaust pressure at the nozzle exit (Pa)
- \( p_a \) = ambient pressure (Pa)
- \( A_e \) = nozzle exit area (m²)
The first term represents momentum thrust, and the second term is pressure thrust. In vacuum conditions, \( p_a \) approaches zero, increasing the pressure thrust contribution.
Example:
Consider a rocket engine with a propellant mass flow rate of 100 kg/s and an exhaust velocity of 3000 m/s. The nozzle exit area is 1 m², exhaust pressure is 100,000 Pa, and ambient pressure is 50,000 Pa.
Calculate thrust:
\[ F = 100 \times 3000 + (100,000 - 50,000) \times 1 = 300,000 + 50,000 = 350,000 \text{ N} \]
This means the engine produces 350 kN of thrust.
Specific Impulse (Isp)
Specific impulse measures how effectively a rocket engine uses propellant. It is the impulse (thrust integrated over time) delivered per unit weight of propellant consumed, expressed in seconds:
\[ I_{sp} = \frac{F}{\dot{m} g_0} \]
where:
- \( F \) = thrust (N)
- \( \dot{m} \) = mass flow rate (kg/s)
- \( g_0 \) = standard gravity (9.80665 m/s²)
Specific impulse can also be interpreted as the effective exhaust velocity divided by standard gravity:
\[ I_{sp} = \frac{v_e}{g_0} \]
Higher Isp means more thrust per unit propellant weight, indicating better fuel efficiency.
Example:
Using the previous engine with \( F = 350,000 \) N and \( \dot{m} = 100 \) kg/s:
\[ I_{sp} = \frac{350,000}{100 \times 9.80665} = \frac{350,000}{980.665} \approx 357 \text{ s} \]
This engine has a specific impulse of about 357 seconds, typical for a high-performance liquid oxygen/liquid hydrogen engine.
Efficiency
Efficiency in rocket engines can be considered from multiple angles:
- Thermal Efficiency: How well chemical energy in propellants converts to kinetic energy of exhaust gases.
- Propulsive Efficiency: How effectively exhaust kinetic energy translates into useful thrust.
Thermal Efficiency (\( \eta_{thermal} \)) is given by:
\[ \eta_{thermal} = \frac{\frac{1}{2} \dot{m} v_e^2}{\dot{m} \Delta h} = \frac{v_e^2}{2 \Delta h} \]
where \( \Delta h \) is the specific enthalpy drop of the propellant combustion.
Propulsive Efficiency (\( \eta_p \)) depends on vehicle velocity (\( v_0 \)) and exhaust velocity (\( v_e \)):
\[ \eta_p = \frac{2 v_0}{v_0 + v_e} \]
This shows that propulsive efficiency improves when exhaust velocity is close to vehicle velocity.
Example:
If a rocket travels at 2000 m/s with an exhaust velocity of 3000 m/s:
\[ \eta_p = \frac{2 \times 2000}{2000 + 3000} = \frac{4000}{5000} = 0.8 \text{ or } 80\% \]
This means 80% of the exhaust kinetic energy contributes to propelling the vehicle.
Mind Maps
Mind Map 1: Thrust Components
Mind Map 2: Specific Impulse
Mind Map 3: Efficiency Types
Summary
Thrust quantifies the raw force a rocket engine produces, combining momentum and pressure effects. Specific impulse translates that force into a measure of propellant efficiency, showing how long a unit weight of propellant can produce thrust. Efficiency breaks down how well energy converts through the engine and how effectively that energy propels the vehicle. Understanding these parameters together provides a comprehensive picture of engine performance.
Each parameter interacts with the others. For example, increasing exhaust velocity raises specific impulse but may reduce propulsive efficiency if the vehicle speed is low. Balancing these factors is key to optimizing rocket engine design.
4.2 Analytical Methods for Performance Prediction
Predicting the performance of liquid propellant rocket engines is a critical step in design and testing. Analytical methods provide a way to estimate key parameters such as thrust, specific impulse, and efficiency before physical tests. These methods rely on thermodynamics, fluid mechanics, and combustion chemistry principles.
Key Performance Parameters
- Thrust (F): The force produced by the engine, usually measured in newtons (N).
- Specific Impulse (Isp): A measure of engine efficiency, defined as thrust per unit weight flow of propellant, typically in seconds.
- Characteristic Velocity (c):* A combustion performance parameter independent of nozzle design.
- Thrust Coefficient (Cf): Ratio of actual thrust to the ideal thrust based on chamber pressure and nozzle throat area.
Analytical Approach Overview
Step 1: Combustion Thermodynamics
Start by determining the combustion chamber conditions. Use chemical equilibrium calculations to find the temperature and composition of combustion products. This involves:
- Defining propellant mixture ratio (oxidizer to fuel).
- Calculating adiabatic flame temperature.
- Estimating molecular weight of exhaust gases.
Example: For a LOX/RP-1 engine at a mixture ratio of 2.5, the adiabatic flame temperature might be around 3500 K, with an average molecular weight of about 22 g/mol.
Step 2: Characteristic Velocity (c*) Calculation
The characteristic velocity is given by:
\[ c^* = \frac{p_c A_t}{\dot{m}} \]
where:
- \(p_c\) = chamber pressure
- \(A_t\) = throat area
- \(\dot{m}\) = mass flow rate
Alternatively, it can be derived from combustion properties:
\[ c^* = \sqrt{\frac{R T_c}{\gamma} \left( \frac{2}{\gamma + 1} \right)^{\frac{\gamma + 1}{\gamma - 1}}} \]
where:
- \(R\) = specific gas constant
- \(T_c\) = chamber temperature
- \(\gamma\) = ratio of specific heats
Example: Using \(T_c = 3500 K\), \(\gamma = 1.22\), and \(R = 355 J/kg\cdot K\), calculate \(c^*\).
Step 3: Nozzle Flow and Thrust Coefficient (Cf)
The nozzle converts thermal energy into kinetic energy. The thrust coefficient accounts for nozzle expansion and pressure differences:
\[ C_f = \frac{F}{p_c A_t} = \sqrt{\frac{2 \gamma^2}{\gamma - 1} \left( \frac{2}{\gamma + 1} \right)^{\frac{\gamma + 1}{\gamma - 1}} \left( 1 - \left( \frac{p_e}{p_c} \right)^{\frac{\gamma - 1}{\gamma}} \right)} + \frac{(p_e - p_a) A_e}{p_c A_t} \]
where:
- \(p_e\) = exit pressure
- \(p_a\) = ambient pressure
- \(A_e\) = exit area
Example: For a nozzle with expansion ratio \(\epsilon = A_e / A_t = 10\), chamber pressure \(p_c = 7 MPa\), and ambient pressure at sea level \(p_a = 0.1 MPa\), calculate \(C_f\).
Step 4: Thrust and Specific Impulse Calculation
Thrust is:
\[ F = C_f p_c A_t \]
Specific impulse is:
\[ I_{sp} = \frac{F}{\dot{m} g_0} = \frac{c^* C_f}{g_0} \]
where \(g_0 = 9.81 m/s^2\) is standard gravity.
Example: With \(c^* = 1600 m/s\), \(C_f = 1.5\), and \(g_0 = 9.81 m/s^2\), calculate \(I_{sp}\).
Step 5: Incorporating Real-World Effects
Analytical methods assume ideal conditions. Adjustments include:
- Accounting for pressure losses in feed systems.
- Considering combustion inefficiencies.
- Including nozzle non-idealities such as boundary layer effects.
These corrections typically reduce predicted performance by a few percent.
Practical Example: Predicting Performance for a Simple Engine
Suppose you have a small LOX/LH2 engine with:
- Chamber pressure \(p_c = 3 MPa\)
- Throat diameter \(d_t = 0.1 m\) (calculate \(A_t\))
- Mixture ratio 6
- Chamber temperature \(T_c = 3500 K\)
- \(\gamma = 1.22\)
- Exit pressure \(p_e = 0.1 MPa\)
- Ambient pressure \(p_a = 0.1 MPa\)
Step 1: Calculate throat area:
\[ A_t = \pi \times (0.1/2)^2 = 0.00785 m^2 \]
Step 2: Calculate \(c^*\) using the formula above.
Step 3: Calculate \(C_f\) assuming an expansion ratio of 15.
Step 4: Calculate thrust and \(I_{sp}\).
This process yields a first-order estimate of engine performance, guiding design decisions before testing.
Summary Mind Map
Analytical methods provide a structured way to estimate engine performance. They combine fundamental physics with practical adjustments, enabling engineers to predict how design choices affect thrust and efficiency. While not a substitute for testing, these calculations form the backbone of early-stage engine design.
4.3 Ground Testing Techniques and Instrumentation
Ground testing is a critical phase in liquid propellant engine development. It verifies engine performance, identifies issues before flight, and ensures safety. Testing replicates operational conditions as closely as possible, measuring thrust, temperature, pressure, and other parameters. This section covers common testing methods and the instrumentation used to gather reliable data.
Types of Ground Tests
- Cold Flow Tests: Propellants flow through the engine without ignition. These tests verify feed system integrity, valve operation, and flow rates.
- Ignition and Start-up Tests: Focus on engine ignition sequence, combustion stability, and transient behavior during start-up.
- Steady-State Firing: The engine runs at a fixed thrust level to measure performance and thermal behavior.
- Throttle and Transient Tests: Evaluate engine response to thrust changes and shutdown procedures.
- Endurance Tests: Long-duration firings to assess durability and component wear.
Key Instrumentation Categories
- Pressure Sensors: Measure chamber pressure, feed line pressure, and turbopump inlet/outlet pressures.
- Temperature Sensors: Thermocouples and RTDs monitor combustion chamber walls, nozzle, and propellant temperatures.
- Thrust Measurement: Load cells or thrust stands quantify engine thrust output.
- Flow Measurement: Flowmeters track propellant mass flow rates.
- Vibration Sensors: Accelerometers detect mechanical vibrations and potential resonances.
- Acoustic Sensors: Microphones monitor combustion noise and detect instabilities.
- High-Speed Cameras: Visualize combustion and plume behavior.
Mind Map: Ground Testing Techniques
Mind Map: Instrumentation for Engine Testing
Practical Example: Static Fire Test Setup
Imagine testing a small liquid engine designed for a university project. The test stand includes a thrust frame with load cells calibrated to measure thrust up to 10 kN. Pressure transducers are installed at the combustion chamber and propellant inlet lines. Thermocouples are embedded in the nozzle wall to monitor temperature gradients.
Before ignition, a cold flow test runs propellants through the engine to check for leaks and verify flow rates. Data from flowmeters confirm expected mass flow. Ignition proceeds with careful monitoring of chamber pressure and temperature rise. The engine holds steady at 80% thrust for 30 seconds, while vibration sensors detect no abnormal oscillations.
Data acquisition systems record all sensor outputs at high sampling rates, allowing post-test analysis to identify any anomalies or performance deviations.
Best Practices in Ground Testing
- Redundancy in Instrumentation: Use multiple sensors for critical parameters to cross-verify data.
- Calibration: Regularly calibrate sensors to maintain measurement accuracy.
- Data Synchronization: Ensure all instruments are time-synchronized for coherent analysis.
- Safety Protocols: Implement automated shutdown triggers based on sensor thresholds.
- Environmental Controls: Account for ambient temperature and pressure variations during testing.
Ground testing is a balance between thorough data collection and operational safety. Proper instrumentation and methodical test planning reduce risks and provide the data needed to refine engine designs.
4.4 Data Acquisition and Analysis
Data acquisition and analysis form the backbone of understanding liquid propellant engine performance during testing. Without accurate data collection and systematic analysis, it’s impossible to verify design assumptions or identify issues early. This section breaks down the key components, methods, and examples involved in gathering and interpreting engine test data.
Key Elements of Data Acquisition
- Sensors and Instrumentation: Measure parameters such as pressure, temperature, thrust, vibration, and flow rates.
- Signal Conditioning: Amplify, filter, and convert sensor outputs into usable signals.
- Data Logging: Capture and store data in real-time for post-test analysis.
- Synchronization: Ensure all data streams are time-aligned for accurate correlation.
Mind Map: Data Acquisition Components
Sensor Selection and Placement
Choosing the right sensor depends on the parameter measured, expected range, accuracy, and environmental conditions. For example, pressure transducers near the combustion chamber must withstand high temperatures and vibrations. Thermocouples placed along the nozzle wall provide temperature gradients critical for cooling system validation.
Example: During a static fire test, pressure sensors are installed at the injector face, combustion chamber, and nozzle exit. This spatial distribution helps identify pressure drops or anomalies in combustion stability.
Sampling Rate and Resolution
Sampling rate must be high enough to capture transient events like engine start-up or combustion instabilities. For instance, a 10 kHz sampling rate might be necessary to observe rapid pressure oscillations. Resolution affects the smallest detectable change; a 16-bit ADC offers finer detail than 12-bit.
Example: If a pressure sensor outputs a 0-1000 psi range, a 16-bit ADC can detect changes as small as approximately 0.015 psi, enabling detection of subtle fluctuations.
Data Logging and Storage
Data logging systems must handle large volumes of data without loss. Real-time monitoring allows engineers to observe test progress and abort if unsafe conditions arise. Data is typically stored in formats compatible with analysis software.
Example: A test might generate gigabytes of data in minutes. Engineers use RAID storage arrays to ensure redundancy and prevent data loss.
Data Synchronization
Correlating data from multiple sensors requires precise time stamping. Synchronization allows matching thrust measurements with pressure and temperature data to understand cause-effect relationships.
Example: During a transient event, a spike in combustion chamber pressure coincides with a drop in turbine speed, indicating a possible fuel flow disruption.
Data Analysis Techniques
- Statistical Analysis: Mean, standard deviation, and trend analysis to identify normal operation and anomalies.
- Frequency Analysis: Fourier transforms to detect oscillations or instabilities.
- Correlation Analysis: Relate different parameters to understand system behavior.
- Visualization: Graphs and plots to reveal patterns and outliers.
Mind Map: Data Analysis Workflow
Practical Example: Analyzing a Static Fire Test
During a static fire test of a liquid engine, data acquisition captured the following:
- Combustion chamber pressure at 5 kHz
- Turbine inlet temperature at 1 kHz
- Thrust via load cell at 2 kHz
Step 1: Preprocessing
- Apply low-pass filters to remove high-frequency noise from pressure data.
- Remove outliers caused by sensor glitches.
Step 2: Statistical Analysis
- Calculate average chamber pressure during steady-state burn.
- Determine standard deviation to assess combustion stability.
Step 3: Frequency Analysis
- Perform FFT on pressure data to identify any oscillations near 100 Hz, which could indicate combustion instability.
Step 4: Correlation
- Cross-correlate turbine temperature and chamber pressure to see if temperature spikes precede pressure fluctuations.
Step 5: Visualization
- Plot thrust over time to confirm steady increase and plateau.
- Overlay pressure and temperature plots to visualize relationships.
Outcome: The analysis revealed a small oscillation at 95 Hz, prompting a review of injector design to improve stability.
Best Practices Summary
- Use redundant sensors for critical parameters to cross-verify data.
- Calibrate sensors before and after tests to ensure accuracy.
- Maintain high sampling rates during transient phases.
- Implement real-time monitoring with automated alerts.
- Document all sensor configurations and data acquisition settings.
- Use consistent data formats to streamline analysis.
Data acquisition and analysis are not just about collecting numbers but about turning raw signals into actionable insights. Precise measurement, careful synchronization, and systematic analysis together build confidence in engine performance and safety.
4.5 Practical Example: Conducting a Static Fire Test and Data Interpretation
A static fire test is a fundamental step in validating a liquid propellant rocket engine’s performance and reliability before flight. It involves firing the engine while it is securely held in place, allowing engineers to collect performance data and observe behavior under controlled conditions.
Planning the Static Fire Test
Before the test, several preparatory steps are essential:
- Test Objectives: Define what you want to measure (e.g., thrust, chamber pressure, temperature, vibration).
- Test Setup: Secure engine on a test stand with instrumentation.
- Safety Measures: Establish emergency shutdown procedures and safe zones.
- Instrumentation Calibration: Ensure sensors are accurate and synchronized.
Key Parameters to Monitor
- Thrust (N)
- Chamber Pressure (Pa)
- Propellant Flow Rates (kg/s)
- Temperature at critical points (°C)
- Vibration and Acoustic Levels
- Mixture Ratio
Mind Map: Static Fire Test Workflow
Conducting the Test
- Pre-ignition Checks: Confirm propellant loading, valve positions, and sensor functionality.
- Ignition Sequence: Initiate engine start-up sequence, monitor ignition transient.
- Steady-State Operation: Maintain engine at target thrust and mixture ratio.
- Shutdown: Execute controlled engine shutdown.
- Post-Test Inspection: Check for leaks, component wear, or anomalies.
Example Data Set (Simplified)
| Time (s) | Thrust (kN) | Chamber Pressure (MPa) | Oxidizer Flow Rate (kg/s) | Fuel Flow Rate (kg/s) | Temperature (°C) |
|---|---|---|---|---|---|
| 0 | 0 | 0 | 0 | 0 | 25 |
| 1 | 50 | 3.5 | 2.0 | 1.0 | 150 |
| 5 | 150 | 7.0 | 5.0 | 2.5 | 650 |
| 10 | 150 | 7.0 | 5.0 | 2.5 | 650 |
| 15 | 0 | 0 | 0 | 0 | 25 |
Mind Map: Data Interpretation Process
Interpreting the Data
- Thrust Curve: The thrust rises quickly after ignition and stabilizes, indicating steady combustion.
- Chamber Pressure: Should remain stable during steady-state; fluctuations may suggest combustion instability.
- Flow Rates: Consistent oxidizer and fuel flow rates confirm proper feed system operation.
- Temperature: Expected to rise rapidly and stabilize; excessive temperature may indicate cooling issues.
Example Interpretation
In the example data, thrust reaches 150 kN by 5 seconds and holds steady until shutdown at 15 seconds. Chamber pressure follows a similar trend, stabilizing at 7 MPa. Flow rates are consistent, matching the expected mixture ratio of 2:1 oxidizer to fuel. Temperature stabilizes at 650°C, within design limits. No abrupt spikes or drops are observed, suggesting stable combustion and proper engine function.
Troubleshooting Using Test Data
If, for instance, chamber pressure oscillated significantly, it could point to combustion instability. Engineers might then examine injector design or propellant mixing. A drop in thrust with constant flow rates might indicate nozzle erosion or blockage.
Best Practices for Static Fire Testing
- Use redundant sensors to cross-verify data.
- Conduct multiple tests to confirm repeatability.
- Maintain detailed logs of test conditions and observations.
- Perform thorough post-test inspections to catch mechanical issues early.
- Analyze data promptly to identify trends or emerging problems.
Summary
A static fire test is a controlled, data-rich event that provides critical insight into engine performance. Careful planning, precise execution, and thorough data interpretation together ensure that the engine meets design expectations before flight. The example and mind maps here illustrate how to approach this process systematically, making the complex task manageable and informative.
4.6 Best Practices: Ensuring Safety and Accuracy in Engine Testing
Ensuring safety and accuracy during liquid propellant engine testing is a critical step in rocket propulsion development. The process involves careful planning, rigorous procedures, and thorough data analysis. This section outlines best practices that help maintain a safe environment and produce reliable results.
Safety Planning and Risk Assessment
Before any test, conduct a detailed risk assessment. Identify potential hazards such as propellant leaks, high-pressure failures, and fire risks. Assign likelihood and severity to each hazard to prioritize mitigation efforts.
- Mind Map: Safety Planning
Example: Before a static fire test, the team identified that a potential failure in the turbopump could cause a high-pressure rupture. They installed pressure relief valves and established a remote shutdown procedure to mitigate this risk.
Test Stand Design and Setup
The test stand must be designed to contain failures and protect personnel. Use blast shields, remote control rooms, and clear evacuation routes. Ensure all instrumentation is calibrated and positioned to capture critical data without interfering with safety zones.
- Mind Map: Test Stand Setup
Example: A test stand was equipped with a remote control room located 300 meters away, with redundant communication lines and automatic fire suppression triggered by flame detectors.
Pre-Test Procedures
Conduct thorough checklists covering hardware integrity, propellant loading, instrumentation calibration, and communication protocols. Verify that all safety interlocks and emergency shutdown systems are functional.
Example: Prior to engine ignition, technicians performed a step-by-step checklist that included verifying valve positions, confirming sensor calibrations, and ensuring the emergency stop button was accessible and operational.
Real-Time Monitoring and Data Validation
During the test, continuously monitor sensor outputs and system status. Use redundant sensors where possible to cross-check data. Watch for anomalies such as unexpected pressure spikes or temperature deviations.
- Mind Map: Real-Time Monitoring
Example: During a test, a sudden drop in chamber pressure triggered an automated shutdown. The redundant sensors confirmed the anomaly, preventing damage and allowing the team to investigate the cause.
Post-Test Analysis and Reporting
After the test, analyze the data for consistency and accuracy. Compare measured values against expected performance. Document any deviations and possible causes. Conduct a debrief to discuss lessons learned and update procedures accordingly.
Example: Post-test data revealed a slight oscillation in thrust. The team traced it to injector design and modified the injector pattern for the next test.
Personnel Training and Communication
Ensure all team members understand safety protocols and test procedures. Regular drills and clear communication channels improve response times and reduce errors.
Example: A weekly safety briefing included scenario-based drills for emergency shutdowns, improving team readiness.
Summary Mind Map: Best Practices in Engine Testing
By integrating these practices, teams can maintain a safe environment and obtain accurate, reliable data from liquid propellant engine tests. The key is a systematic approach that combines technical rigor with clear communication and preparedness.
5. Orbital Mechanics Fundamentals
5.1 Basic Concepts: Reference Frames and Coordinate Systems
Understanding reference frames and coordinate systems is fundamental in orbital mechanics and launch vehicle engineering. These concepts allow engineers to describe the position, velocity, and acceleration of objects in space relative to a chosen viewpoint.
Reference Frames
A reference frame is essentially a perspective or viewpoint from which measurements are made. It consists of an origin and a set of axes. The choice of reference frame affects how motion is described and analyzed.
- Inertial Frames: These frames are not accelerating; objects obey Newton’s laws without fictitious forces. For example, a frame fixed relative to distant stars is considered inertial for most practical purposes.
- Non-Inertial Frames: These frames accelerate or rotate relative to inertial frames. Observers in such frames must account for fictitious forces like the Coriolis force.
Mind Map: Types of Reference Frames
Coordinate Systems
Coordinate systems provide a way to specify the position of an object within a reference frame. Common coordinate systems in orbital mechanics include:
- Cartesian Coordinates (x, y, z): Positions are given by distances along three perpendicular axes. Useful for local or small-scale problems.
- Polar Coordinates (r, θ): Position is described by a radius and an angle in a plane. Handy for circular or planar motion.
- Spherical Coordinates (r, θ, φ): Extends polar coordinates into three dimensions with radius, polar angle, and azimuthal angle.
- Geocentric Equatorial Coordinates: Earth-centered inertial frame using right ascension and declination, common for satellite orbits.
Mind Map: Coordinate Systems
Example 1: Position of a Satellite in Cartesian and Spherical Coordinates
Suppose a satellite is 7000 km from Earth’s center, located 45° above the equatorial plane and 60° east of the prime meridian.
-
In spherical coordinates:
- r = 7000 km
- θ (polar angle from z-axis) = 45°
- φ (azimuthal angle in x-y plane) = 60°
-
To convert to Cartesian coordinates:
- x = r * sin(θ) * cos(φ) = 7000 * sin(45°) * cos(60°) ≈ 2475 km
- y = r * sin(θ) * sin(φ) = 7000 * sin(45°) * sin(60°) ≈ 4280 km
- z = r * cos(θ) = 7000 * cos(45°) ≈ 4950 km
This conversion helps engineers visualize and calculate trajectories in different frames.
Earth-Centered Inertial (ECI) vs Earth-Centered Earth-Fixed (ECEF) Frames
- ECI Frame: Non-rotating frame centered at Earth’s center, fixed relative to distant stars. Used for describing satellite orbits.
- ECEF Frame: Rotates with Earth, fixed relative to the surface. Useful for ground station tracking.
Mind Map: Earth Reference Frames
Example 2: Tracking a Launch Vehicle
A launch vehicle’s position is often calculated in the ECI frame to predict its orbit, but ground control uses ECEF coordinates to track its location relative to the launch site. Transformations between these frames involve accounting for Earth’s rotation angle at the given time.
Transformations Between Frames
Coordinate transformations involve rotation matrices or quaternions. For example, converting from ECI to ECEF requires rotating by Earth’s sidereal time angle.
Practical Example: Rotation Matrix for ECI to ECEF
If θ is Earth’s rotation angle at time t,
\[ \begin{bmatrix} x_{ECEF} \\ y_{ECEF} \\ z_{ECEF} \end{bmatrix} = \begin{bmatrix} \cos \theta & \sin \theta & 0 \\ -\sin \theta & \cos \theta & 0 \\ 0 & 0 & 1 \end{bmatrix} \begin{bmatrix} x_{ECI} \\ y_{ECI} \\ z_{ECI} \end{bmatrix} \]
This matrix rotates the coordinate vector about the z-axis by angle θ.
Summary
- Reference frames define the viewpoint for measurements; inertial frames simplify physics by avoiding fictitious forces.
- Coordinate systems specify positions within frames; Cartesian and spherical are most common.
- Earth-centered frames (ECI and ECEF) are essential for satellite and launch vehicle tracking.
- Transformations between frames use rotation matrices, crucial for converting data between ground and space perspectives.
Understanding these concepts lays the groundwork for analyzing trajectories, designing guidance systems, and interpreting sensor data in launch vehicle engineering.
5.2 Kepler’s Laws of Planetary Motion
Johannes Kepler formulated three fundamental laws that describe how planets move around the Sun. These laws are essential for understanding orbital mechanics and are directly applicable to launch vehicle trajectories and satellite orbits.
Kepler’s First Law: The Law of Ellipses
Statement: Every planet moves along an elliptical orbit with the Sun at one of the two foci.
This means orbits are not perfect circles but ellipses, which look like stretched circles. The Sun is not at the center but at a focus point inside the ellipse.
Mind Map:
Example:
Consider Earth’s orbit, which is nearly circular but slightly elliptical. The distance from Earth to the Sun varies between about 147 million km (perihelion) and 152 million km (aphelion). This variation affects solar radiation and seasons.
Kepler’s Second Law: The Law of Equal Areas
Statement: A line segment joining a planet and the Sun sweeps out equal areas during equal intervals of time.
This means a planet moves faster when it is closer to the Sun and slower when it is farther away, ensuring the area covered over a fixed time is constant.
Mind Map:
Example:
If a satellite orbits Earth in an elliptical path, it will speed up as it approaches perigee (closest point) and slow down near apogee (farthest point). For instance, a satellite in a highly elliptical orbit might spend most of its time far from Earth moving slowly, then whip around quickly when close.
Kepler’s Third Law: The Law of Harmonies
Statement: The square of the orbital period of a planet is proportional to the cube of the semi-major axis of its orbit.
Mathematically, \( T^2 \propto a^3 \), where \( T \) is the orbital period and \( a \) is the semi-major axis.
This law links the size of the orbit to how long it takes to complete one orbit.
Mind Map:
Example:
If a satellite orbits Earth at twice the distance of another satellite, its orbital period will be longer. Specifically, if satellite A orbits at 7000 km from Earth’s center and satellite B at 14000 km, satellite B’s period will be about \( \sqrt{(2^3)} = \sqrt{8} \approx 2.83 \) times longer than satellite A’s.
Summary Mind Map for Kepler’s Laws
Practical Example: Applying Kepler’s Laws to a Satellite Orbit
Suppose you want to design a satellite orbit with a semi-major axis of 10,000 km around Earth. Using Kepler’s Third Law, you can estimate the orbital period.
Earth’s gravitational parameter \( \mu = 3.986 \times 10^{14} \ m^3/s^2 \).
Orbital period formula:
\[ T = 2\pi \sqrt{\frac{a^3}{\mu}} \]
Calculate \( T \):
\[ a = 10,000,000 \ m \]
\[ T = 2\pi \sqrt{\frac{(10,000,000)^3}{3.986 \times 10^{14}}} = 2\pi \sqrt{2.51 \times 10^{7}} \approx 2\pi \times 5010 = 31,500 \ s \approx 8.75 \ hours \]
This tells you the satellite will take about 8.75 hours to complete one orbit.
Kepler’s laws provide the foundation for understanding how objects move in space. They guide the design of launch trajectories, satellite orbits, and mission planning. Each law connects geometry, time, and motion in a way that remains valid for any object orbiting under gravity, including artificial satellites and launch vehicles.
5.3 Orbital Elements and Their Determination
Orbital elements are a set of parameters that uniquely describe the size, shape, and orientation of an orbit, as well as the position of a satellite along that orbit at a given time. Understanding these elements is essential for predicting satellite trajectories, planning maneuvers, and designing launch trajectories.
The Six Classical Orbital Elements
-
Semi-major axis (a): Defines the size of the orbit. For elliptical orbits, it is half the longest diameter of the ellipse. It directly relates to the orbital period through Kepler’s third law.
-
Eccentricity (e): Describes the shape of the orbit, ranging from 0 (perfect circle) to values approaching 1 (highly elongated ellipse). It is a dimensionless number.
-
Inclination (i): The tilt of the orbit’s plane relative to the reference plane (usually the Earth’s equator). It is measured in degrees from 0° to 180°.
-
Right Ascension of the Ascending Node (RAAN, Ω): The angle from a fixed reference direction (usually the vernal equinox) to the point where the satellite crosses the reference plane going northward.
-
Argument of Perigee (ω): The angle from the ascending node to the orbit’s point of closest approach to Earth (perigee), measured along the orbit plane.
-
True Anomaly (ν): The satellite’s position along the orbit at a specific time, measured from perigee.
These six elements fully describe the orbit in three-dimensional space and the satellite’s location on it.
Mind Map: Classical Orbital Elements
Determining Orbital Elements from State Vectors
Orbital elements can be computed from the satellite’s position and velocity vectors at a given instant. This process involves several vector operations and the application of orbital mechanics formulas.
Step 1: Calculate specific angular momentum vector (h):
\[ \mathbf{h} = \mathbf{r} \times \mathbf{v} \]
This vector is perpendicular to the orbital plane and its magnitude relates to the orbit’s size and shape.
Step 2: Compute the node vector (n):
\[ \mathbf{n} = \mathbf{k} \times \mathbf{h} \]
where \(\mathbf{k}\) is the unit vector along the reference z-axis (usually Earth’s rotational axis). The node vector points toward the ascending node.
Step 3: Calculate eccentricity vector (e):
\[ \mathbf{e} = \frac{1}{\mu} \left[ (v^2 - \frac{\mu}{r}) \mathbf{r} - (\mathbf{r} \cdot \mathbf{v}) \mathbf{v} \right] \]
where \(\mu\) is the standard gravitational parameter, \(r\) and \(v\) are the magnitudes of position and velocity vectors.
The magnitude of \(\mathbf{e}\) gives the eccentricity.
Step 4: Calculate semi-major axis (a):
Using the vis-viva equation:
\[ \frac{1}{a} = \frac{2}{r} - \frac{v^2}{\mu} \]
Step 5: Determine inclination (i):
\[ i = \cos^{-1} \left( \frac{h_z}{|\mathbf{h}|} \right) \]
Step 6: Calculate RAAN (Ω):
\[ \Omega = \cos^{-1} \left( \frac{n_x}{|\mathbf{n}|} \right) \]
If \(n_y < 0\), then \(\Omega = 2\pi - \Omega\).
Step 7: Calculate argument of perigee (ω):
\[ \omega = \cos^{-1} \left( \frac{\mathbf{n} \cdot \mathbf{e}}{|\mathbf{n}| |\mathbf{e}|} \right) \]
If \(e_z < 0\), then \(\omega = 2\pi - \omega\).
Step 8: Calculate true anomaly (ν):
\[ \nu = \cos^{-1} \left( \frac{\mathbf{e} \cdot \mathbf{r}}{|\mathbf{e}| |\mathbf{r}|} \right) \]
If \(\mathbf{r} \cdot \mathbf{v} < 0\), then \(\nu = 2\pi - \nu\).
Mind Map: Orbital Elements Determination Process
Example: Calculating Orbital Elements from State Vectors
Suppose a satellite’s position and velocity vectors relative to Earth’s center are:
\[ \mathbf{r} = [7000, 0, 0] \text{ km} \]
\[ \mathbf{v} = [0, 7.5, 1] \text{ km/s} \]
Given Earth’s gravitational parameter \(\mu = 398600 \text{ km}^3/\text{s}^2\), calculate the orbital elements.
Step 1: Angular momentum
\[ \mathbf{h} = \mathbf{r} \times \mathbf{v} \]
\[ = \begin{vmatrix} \mathbf{i} & \mathbf{j} & \mathbf{k} \\ 7000 & 0 & 0 \\ 0 & 7.5 & 1 \end{vmatrix} \]
\[ = (0*1 - 0*7.5)\mathbf{i} - (7000*1 - 0*0)\mathbf{j} + (7000*7.5 - 0*0)\mathbf{k} = [0, -7000, 52500] \text{ km}^2/\text{s} \]
Magnitude:
\[ \text{}|\mathbf{h}| = \sqrt{0^2 + (-7000)^2 + 52500^2} \approx 53096 \text{ km}^2/\text{s} \]
Step 2: Node vector
\[ \mathbf{k} = [0, 0, 1] \]
\[ \mathbf{n} = \mathbf{k} \times \mathbf{h} \]
\[ = \begin{vmatrix} \mathbf{i} & \mathbf{j} & \mathbf{k} \\ 0 & 0 & 1 \\ 0 & -7000 & 52500 \end{vmatrix} \]
\[ = (0*52500 - 1*(-7000))\mathbf{i} - (0*52500 - 1*0)\mathbf{j} + (0*(-7000) - 0*0)\mathbf{k} = [7000, 0, 0] \]
Magnitude:
\[ \text{}|\mathbf{n}| = 7000 \]
Step 3: Eccentricity vector
Calculate magnitudes:
\[ r = |\mathbf{r}| = 7000 \text{ km} \]
\[ v = |\mathbf{v}| = \sqrt{0^2 + 7.5^2 + 1^2} = \sqrt{56.25 + 1} = 7.57 \text{ km/s} \]
Calculate dot product:
\[ \mathbf{r} \cdot \mathbf{v} = 7000*0 + 0*7.5 + 0*1 = 0 \]
Now:
\[ \mathbf{e} = \frac{1}{398600} \left[ (7.57^2 - \frac{398600}{7000}) \mathbf{r} - 0 \cdot \mathbf{v} \right] \]
Calculate terms:
\[ 7.57^2 = 57.3 \]
\[ \frac{398600}{7000} = 56.94 \]
\[ (57.3 - 56.94) = 0.36 \]
Thus:
\[ \mathbf{e} = \frac{0.36}{398600} \times [7000, 0, 0] = [0.0063, 0, 0] \]
Eccentricity magnitude:
\[ \text{}|\mathbf{e}| = 0.0063 \]
Step 4: Semi-major axis
\[ \frac{1}{a} = \frac{2}{7000} - \frac{7.57^2}{398600} = 0.0002857 - 0.0001437 = 0.000142 \]
\[ a = 1 / 0.000142 = 7042 \text{ km} \]
Step 5: Inclination
\[ i = \cos^{-1} \left( \frac{h_z}{|\mathbf{h}|} \right) = \cos^{-1} \left( \frac{52500}{53096} \right) = \cos^{-1}(0.988) = 8.5^\circ \]
Step 6: RAAN
\[ \Omega = \cos^{-1} \left( \frac{n_x}{|\mathbf{n}|} \right) = \cos^{-1} \left( \frac{7000}{7000} \right) = 0^\circ \]
Since \(n_y = 0\), no adjustment needed.
Step 7: Argument of perigee
\[ \omega = \cos^{-1} \left( \frac{\mathbf{n} \cdot \mathbf{e}}{|\mathbf{n}| |\mathbf{e}|} \right) = \cos^{-1} \left( \frac{7000*0.0063}{7000*0.0063} \right) = 0^\circ \]
Since \(e_z = 0\), no adjustment.
Step 8: True anomaly
\[ \nu = \cos^{-1} \left( \frac{\mathbf{e} \cdot \mathbf{r}}{|\mathbf{e}| |\mathbf{r}|} \right) = \cos^{-1} \left( \frac{0.0063*7000}{0.0063*7000} \right) = 0^\circ \]
Since \(\mathbf{r} \cdot \mathbf{v} = 0\), true anomaly remains 0°.
This example shows a nearly circular, low-inclination orbit with the satellite currently at perigee.
Best Practice: Verifying Orbital Elements
- Always check vector magnitudes and units before calculations.
- Confirm angles are within expected ranges (0° to 360°).
- Use cross and dot products carefully to determine quadrant corrections.
- Validate results by reconstructing position and velocity vectors from calculated orbital elements.
This approach ensures consistency and helps catch errors early.
Summary
Orbital elements provide a compact and intuitive way to describe orbits. Calculating them from position and velocity vectors involves vector algebra and trigonometry, with attention to sign and quadrant conventions. Mastery of this process is fundamental for anyone working with satellite trajectories or launch vehicle design.
5.4 Types of Orbits: LEO, MEO, GEO, and Transfer Orbits
Orbits are paths that satellites follow around Earth or other celestial bodies, defined by altitude, shape, and purpose. Understanding the main types of orbits is essential for launch vehicle design and mission planning. Here, we focus on Low Earth Orbit (LEO), Medium Earth Orbit (MEO), Geostationary Orbit (GEO), and Transfer Orbits, explaining their characteristics, uses, and practical examples.
Low Earth Orbit (LEO)
- Altitude: Approximately 160 km to 2,000 km above Earth’s surface.
- Orbital Period: About 90 to 120 minutes.
- Characteristics:
- High orbital velocity (~7.8 km/s).
- Short orbital period means satellites pass over ground stations frequently.
- Atmosphere still exerts drag, requiring occasional reboost.
- Uses: Earth observation, scientific missions, communication constellations (e.g., Starlink), and the International Space Station (ISS).
Example: The ISS orbits at roughly 420 km altitude, completing about 15.5 orbits per day. Its low altitude allows for detailed Earth imaging and quick communication but requires regular altitude boosts to counteract drag.
Mind Map: LEO Characteristics
Medium Earth Orbit (MEO)
- Altitude: Roughly 2,000 km to 35,786 km.
- Orbital Period: Between about 2 to 24 hours.
- Characteristics:
- Less atmospheric drag than LEO.
- Longer orbital periods.
- Commonly used for navigation and communication satellites.
- Uses: Global Navigation Satellite Systems (GNSS) like GPS, GLONASS, and Galileo.
Example: GPS satellites orbit at approximately 20,200 km altitude with an orbital period of about 12 hours. This altitude balances coverage area and signal delay.
Mind Map: MEO Characteristics
Geostationary Orbit (GEO)
- Altitude: Exactly 35,786 km above the equator.
- Orbital Period: 24 hours, matching Earth’s rotation.
- Characteristics:
- Satellite appears stationary relative to a point on Earth.
- Requires orbit to be circular and equatorial.
- Large coverage area, ideal for communication and weather satellites.
- Uses: Television broadcasting, weather monitoring, and telecommunications.
Example: A weather satellite in GEO continuously monitors the same region, providing real-time data without the need for tracking antennas.
Mind Map: GEO Characteristics
Transfer Orbits
Transfer orbits are used to move a spacecraft from one orbit to another, typically from LEO to GEO or beyond. The most common is the Hohmann transfer orbit.
- Hohmann Transfer Orbit:
- An elliptical orbit used to transfer between two circular orbits of different radii.
- Requires two engine impulses: one to leave the initial orbit and one to circularize at the target orbit.
- Characteristics:
- Energy-efficient but not the fastest.
- Used extensively in satellite deployment.
Example: A satellite launched into LEO uses a Hohmann transfer to reach GEO. After initial insertion into LEO, the upper stage fires to enter an elliptical transfer orbit. At apogee (near GEO altitude), a second burn circularizes the orbit.
Mind Map: Transfer Orbits
Summary Table of Orbit Types
| Orbit Type | Altitude (km) | Orbital Period | Key Features | Common Uses |
|---|---|---|---|---|
| LEO | 160 - 2,000 | ~90-120 min | Low altitude, atmospheric drag present | Earth observation, ISS, communication constellations |
| MEO | 2,000 - 35,786 | 2 - 24 hours | Medium altitude, navigation satellites | GPS, GLONASS, Galileo |
| GEO | 35,786 | 24 hours | Stationary relative to Earth, large coverage | Communications, weather satellites |
| Transfer Orbit | Variable | Variable | Elliptical, used for orbit changes | Orbit raising, interplanetary missions |
Each orbit type presents unique challenges and advantages. Launch vehicle design must account for the required altitude, velocity, and mission duration associated with the target orbit. Transfer orbits add complexity but enable efficient use of propellant and mission flexibility.
5.5 Practical Example: Calculating Orbital Parameters for a Satellite
Calculating orbital parameters is a fundamental task in orbital mechanics. It helps determine the satellite’s path around Earth and predict its position at any given time. Let’s walk through a clear example using a low Earth orbit (LEO) satellite.
Step 1: Define Known Quantities
- Earth’s gravitational parameter, \( \mu = 3.986 \times 10^{14} ; m^3/s^2 \)
- Earth’s radius, \( R_E = 6,371 ; km \)
- Satellite altitude, \( h = 500 ; km \)
From these, we can calculate the orbital radius \( r \):
\[ r = R_E + h = 6,371 + 500 = 6,871 ; km = 6.871 \times 10^6 ; m \]
Step 2: Calculate Orbital Velocity for a Circular Orbit
For a circular orbit, velocity \( v \) is given by:
\[ v = \sqrt{\frac{\mu}{r}} \]
Plugging in values:
\[ v = \sqrt{\frac{3.986 \times 10^{14}}{6.871 \times 10^6}} \approx 7,615 ; m/s \]
This is the speed the satellite must maintain to stay in a stable 500 km altitude orbit.
Step 3: Calculate Orbital Period
The orbital period \( T \) is the time it takes to complete one orbit:
\[ T = 2 \pi \sqrt{\frac{r^3}{\mu}} \]
Calculating:
\[ T = 2 \pi \sqrt{\frac{(6.871 \times 10^6)^3}{3.986 \times 10^{14}}} \approx 5,670 ; s \approx 94.5 ; minutes \]
So the satellite completes an orbit roughly every hour and a half.
Step 4: Determine Orbital Energy
Total specific orbital energy \( \epsilon \) (energy per unit mass) is:
\[ \epsilon = -\frac{\mu}{2r} \]
Calculating:
\[ \epsilon = -\frac{3.986 \times 10^{14}}{2 \times 6.871 \times 10^6} \approx -2.9 \times 10^7 ; J/kg \]
Negative energy confirms a bound orbit.
Step 5: Mind Map - Key Orbital Parameters
Orbital Parameters Mind Map
Step 6: Example with an Elliptical Orbit
Suppose the satellite’s orbit is elliptical with:
- Perigee altitude \( h_p = 500 ; km \)
- Apogee altitude \( h_a = 1,000 ; km \)
Calculate:
- Perigee radius \( r_p = R_E + h_p = 6,871 ; km \)
- Apogee radius \( r_a = R_E + h_a = 7,371 ; km \)
Semi-major axis \( a \):
\[ a = \frac{r_p + r_a}{2} = \frac{6,871 + 7,371}{2} = 7,121 ; km = 7.121 \times 10^6 ; m \]
Eccentricity \( e \):
\[ e = \frac{r_a - r_p}{r_a + r_p} = \frac{7,371 - 6,871}{7,371 + 6,871} \approx 0.035 \]
Orbital period \( T \):
\[ T = 2 \pi \sqrt{\frac{a^3}{\mu}} = 2 \pi \sqrt{\frac{(7.121 \times 10^6)^3}{3.986 \times 10^{14}}} \approx 6,000 ; s = 100 ; minutes \]
Velocity at perigee \( v_p \):
\[ v_p = \sqrt{\mu \left( \frac{2}{r_p} - \frac{1}{a} \right)} \]
\[ v_p = \sqrt{3.986 \times 10^{14} \left( \frac{2}{6.871 \times 10^6} - \frac{1}{7.121 \times 10^6} \right)} \approx 7,800 ; m/s \]
Velocity at apogee \( v_a \):
\[ v_a = \sqrt{\mu \left( \frac{2}{r_a} - \frac{1}{a} \right)} \]
\[ v_a = \sqrt{3.986 \times 10^{14} \left( \frac{2}{7.371 \times 10^6} - \frac{1}{7.121 \times 10^6} \right)} \approx 7,300 ; m/s \]
Step 7: Mind Map - Elliptical Orbit Parameters
Step 8: Summary
By calculating these parameters, engineers can predict satellite behavior, plan maneuvers, and design launch profiles. The circular orbit example shows the basics, while the elliptical orbit introduces real-world complexity. Both require the gravitational parameter and orbital radii as starting points.
Understanding these calculations is essential for anyone working in satellite mission design or launch vehicle trajectory planning.
5.6 Best Practices: Using Orbital Mechanics Software Tools Effectively
Using orbital mechanics software tools effectively requires a clear understanding of both the software capabilities and the underlying physics. These tools are designed to assist with orbit determination, trajectory simulation, mission planning, and visualization. To get the most out of them, it’s important to approach their use systematically and with attention to detail.
Mind Map: Key Aspects of Using Orbital Mechanics Software Tools
Understand the Input Requirements
Orbital mechanics software typically requires initial conditions such as position and velocity vectors, orbital elements, or time-tagged state vectors. Ensure that these inputs are accurate and consistent in units and reference frames. For example, mixing Earth-Centered Inertial (ECI) coordinates with Earth-Centered Earth-Fixed (ECEF) without proper transformation will lead to errors.
Example: When simulating a low Earth orbit (LEO) satellite, input the orbital elements in the standard Keplerian form (semi-major axis, eccentricity, inclination, right ascension of ascending node, argument of perigee, true anomaly) and confirm the epoch time matches the simulation start.
Familiarize Yourself with the Software’s Propagation Models
Different tools use various propagation methods: two-body, J2-perturbed, numerical integration with atmospheric drag, solar radiation pressure, etc. Select the model appropriate for your mission’s accuracy requirements.
Example: For a short-duration LEO mission, a J2-perturbed model may suffice. For a geostationary transfer orbit, include higher-order gravitational terms and perturbations for precision.
Use Visualization Features to Validate Trajectories
Visualizing orbits in 2D and 3D helps catch input errors and understand orbital behavior. Check for anomalies like unexpected orbit decay or unrealistic maneuvers.
Example: Plotting the ground track of a satellite can reveal if the orbit crosses restricted zones or if the inclination matches mission requirements.
Perform Sensitivity Analysis
Change input parameters slightly to see how the orbit or mission outcome varies. This helps identify critical parameters and assess robustness.
Example: Adjusting the initial velocity by a few meters per second and observing the resulting change in apogee altitude can highlight how sensitive the mission is to launch vehicle injection accuracy.
Validate Results Against Analytical Solutions or Alternative Tools
Where possible, compare software outputs with hand calculations or results from other trusted software. This step builds confidence in the simulation.
Example: Calculate the orbital period analytically for a circular orbit and compare it with the software’s output.
Document Assumptions and Parameters Clearly
Keep a record of all inputs, assumptions, and software settings. This practice aids reproducibility and troubleshooting.
Example: Note the gravitational model used, atmospheric density model, and any simplifications applied.
Mind Map: Workflow for Effective Use
Practical Example: Planning a Hohmann Transfer
Suppose you want to simulate a Hohmann transfer from a 700 km circular orbit to a 35,786 km geostationary orbit. Input the initial orbit parameters and set the target orbit. Use the software to calculate the delta-v required and the timing of the two engine burns.
- Enter initial orbit elements for 700 km altitude.
- Define the target orbit elements for GEO.
- Select a two-impulse maneuver model.
- Run the simulation to get burn times and delta-v values.
- Visualize the transfer orbit to confirm the trajectory.
Adjust parameters such as the timing of burns or the spacecraft mass to see how the mission profile changes. This hands-on approach builds intuition and highlights the software’s capabilities.
Summary
Effective use of orbital mechanics software tools depends on careful preparation of inputs, understanding of propagation models, validation of results, and thorough documentation. Visualization and sensitivity analysis are key to catching errors and gaining insight. By following a structured workflow, you can leverage these tools to support reliable mission design and analysis.
6. Launch Vehicle Trajectory Design and Optimization
6.1 Gravity Turn Maneuver and Its Importance
The gravity turn is a fundamental trajectory maneuver used during the ascent phase of most launch vehicles. It efficiently guides the rocket from a vertical liftoff to a horizontal orbital insertion with minimal steering effort and fuel consumption. The maneuver leverages Earth’s gravity to naturally curve the flight path, reducing the need for active control inputs.
What is a Gravity Turn?
At liftoff, the rocket points straight up to clear the dense lower atmosphere. Shortly after, the vehicle begins a gradual pitch-over maneuver, tilting its thrust vector slightly away from vertical. Instead of fighting gravity, the rocket allows gravity to pull its trajectory downward, creating a curved path that transitions from vertical to nearly horizontal as the vehicle gains altitude and velocity.
This controlled fall under gravity’s influence is why the maneuver is called a “gravity turn.”
Why Use a Gravity Turn?
- Fuel Efficiency: By minimizing lateral thrust, the rocket avoids wasting propellant on steering.
- Structural Simplicity: Reduced aerodynamic loads and steering forces lower structural stress.
- Simplified Guidance: The vehicle’s path follows a natural curve, easing navigation and control.
Key Phases of the Gravity Turn
- Vertical Ascent: The rocket climbs straight up to clear the thick atmosphere.
- Pitch-Over Initiation: A small, controlled tilt begins, typically a few seconds after liftoff.
- Gravity-Driven Arc: Gravity gradually bends the trajectory toward horizontal.
- Orbital Insertion: The vehicle achieves the required horizontal velocity for orbit.
Mind Map: Gravity Turn Overview
Practical Example: Pitch-Over Timing
Consider a launch vehicle that initiates pitch-over 10 seconds after liftoff. If the pitch-over is too early, the rocket may encounter excessive aerodynamic forces due to a lower altitude and denser atmosphere. If too late, the vehicle wastes fuel climbing vertically without gaining horizontal velocity.
By timing the pitch-over correctly, the rocket balances atmospheric drag and gravity losses, optimizing the ascent.
Mind Map: Pitch-Over Timing Considerations
Steering During Gravity Turn
During the gravity turn, the rocket’s thrust vector is aligned closely with its velocity vector. Small adjustments correct deviations caused by wind or engine thrust variations. Excessive steering can increase aerodynamic loads and fuel consumption.
Example: Steering Correction
If a crosswind pushes the vehicle off course, the guidance system applies minor thrust vectoring to realign the trajectory. These corrections are subtle, preserving the gravity turn’s efficiency.
Mind Map: Steering in Gravity Turn
Gravity Turn in Multi-Stage Rockets
Each stage follows the gravity turn trajectory, with staging events timed to maintain the optimal flight path. The gravity turn simplifies the transition between stages by keeping the vehicle on a smooth curve.
Summary
The gravity turn is a natural, efficient way to transition from vertical launch to horizontal orbit insertion. It reduces fuel consumption, structural stress, and guidance complexity by using Earth’s gravity as a steering force. Proper timing of pitch-over and minimal steering corrections are key to a successful gravity turn.
This maneuver is a staple in launch vehicle design, demonstrating how understanding and working with natural forces can lead to elegant engineering solutions.
6.2 Staging Strategies and Mass Optimization
Staging is a fundamental concept in launch vehicle design. It involves dividing the rocket into multiple sections, or stages, each with its own engines and propellant. The goal is to discard empty mass as the vehicle ascends, improving overall efficiency and payload capacity. Mass optimization, closely tied to staging, focuses on minimizing the inert mass while maximizing propellant and payload mass.
Why Staging Matters
A single-stage rocket must carry all its propellant and structure from liftoff to orbit, which leads to diminishing returns due to the rocket equation. By shedding empty tanks and engines after their fuel is spent, multistage rockets reduce the mass that needs to be accelerated, improving the mass fraction and thus the payload delivered.
Common Staging Strategies
- Serial Staging: Stages are stacked vertically and ignited sequentially. After a stage burns out, it is jettisoned.
- Parallel Staging: Boosters attached to the core stage ignite at liftoff and drop off when empty.
- Drop Tanks: Additional propellant tanks are dropped but engines remain active.
Each strategy has trade-offs in complexity, cost, and performance.
Key Parameters in Staging Design
- Mass Ratio (MR): Ratio of initial mass to final mass of a stage.
- Structural Mass Fraction: The fraction of the stage mass that is inert (structure, engines, tanks).
- Payload Fraction: The fraction of the total vehicle mass that is payload.
Optimizing these parameters improves the overall vehicle efficiency.
Mind Map: Staging Strategies Overview
Mass Optimization Principles
- Maximize Propellant Mass Fraction: More propellant means more delta-v, but adding propellant increases structural mass.
- Minimize Structural Mass: Use lightweight materials and efficient designs to reduce inert mass.
- Optimize Stage Mass Ratios: Each stage should have an optimal mass ratio balancing propellant and structure.
- Payload Integration: Design stages to protect and efficiently deliver payload mass.
Mind Map: Mass Optimization Factors
Example: Two-Stage Rocket Mass Budget
Consider a two-stage rocket aiming to deliver a 1,000 kg payload to low Earth orbit (LEO). Assume the following:
- Stage 1 mass ratio (MR1): 8 (initial mass/final mass)
- Stage 2 mass ratio (MR2): 6
- Structural mass fraction: 10% for both stages
Step 1: Calculate propellant and structure masses for each stage.
-
For Stage 1:
- Let final mass after burnout be M1f
- Initial mass M1i = MR1 * M1f
- Structural mass = 0.10 * M1i
- Propellant mass = M1i - M1f - structural mass
-
For Stage 2:
- Payload + Stage 2 structure + Stage 2 propellant = M1f
Step 2: Iteratively solve for masses to meet payload and mass ratio constraints.
This example shows how mass ratios and structural fractions influence the total vehicle mass.
Best Practices in Staging and Mass Optimization
- Balance Stage Sizes: Avoid overly large or small stages; each should contribute efficiently.
- Use High Thrust-to-Weight Engines in Lower Stages: To overcome gravity losses.
- Optimize Stage Separation Timing: Early separation reduces dead weight but requires reliable mechanisms.
- Incorporate Margin for Uncertainties: Account for manufacturing tolerances and operational variances.
Practical Example: Serial vs Parallel Staging
Imagine a launch vehicle with a core stage and two strap-on boosters.
- Serial Staging: The core stage ignites first, then the second stage after separation.
- Parallel Staging: Boosters ignite with the core, drop off when empty.
Parallel staging provides higher initial thrust, useful for heavy payloads, but adds complexity in structural loads and separation events. Serial staging is simpler but may require more powerful engines on the core stage.
In summary, staging strategies and mass optimization are intertwined. Effective design requires careful trade-offs between structural mass, propellant load, engine performance, and mission requirements. Using mind maps can help visualize these relationships and guide design decisions.
6.3 Trajectory Constraints: Atmospheric, Structural, and Thermal
When designing a launch vehicle trajectory, engineers must navigate a complex set of constraints that arise from the vehicle’s interaction with the atmosphere, its structural limits, and thermal environment. These constraints shape the path the vehicle can safely and efficiently follow from ground to orbit.
Atmospheric Constraints
The atmosphere is a dense, dynamic medium that imposes aerodynamic forces and heating on the vehicle. Key atmospheric constraints include:
- Dynamic Pressure (q): The product of air density and the square of velocity, dynamic pressure peaks during ascent and can stress the vehicle’s structure. Trajectories often include a “max q” limit to avoid structural damage.
- Aerodynamic Loads: Lift, drag, and side forces must be managed to prevent excessive bending or twisting.
- Atmospheric Density Variation: Changes with altitude affect drag and heating rates.
Mind Map: Atmospheric Constraints
Example:
Consider a vehicle ascending through the atmosphere. At around 11 km altitude, dynamic pressure reaches its maximum. If velocity increases too quickly before this point, the vehicle experiences excessive aerodynamic loads. To avoid this, the trajectory is designed to throttle down the engine or adjust pitch to keep dynamic pressure below a safe limit.
Structural Constraints
The vehicle’s structure can only withstand certain loads without failure. These loads come from aerodynamic forces, inertial effects during acceleration, and vibrations.
- Load Factor (g-load): The ratio of the vehicle’s acceleration to gravity. High g-loads can damage payloads and vehicle components.
- Bending Moments: Caused by aerodynamic forces and thrust misalignment.
- Vibration and Acoustic Loads: Generated by engines and aerodynamic flow, potentially causing fatigue.
Mind Map: Structural Constraints
Example:
During a gravity turn, the vehicle pitches over to gain horizontal velocity. If the pitch rate is too aggressive, bending moments increase sharply. The trajectory must limit pitch rate to keep bending within structural limits, ensuring the vehicle frame and payload remain intact.
Thermal Constraints
Thermal loads arise from aerodynamic heating and engine operation. Managing these is critical to prevent material degradation.
- Aerodynamic Heating: Friction and compression of air heat the vehicle surface, especially at high speeds in dense atmosphere.
- Thermal Protection Systems (TPS): Designed to absorb or deflect heat.
- Engine Thermal Limits: Engines have maximum operating temperatures.
Mind Map: Thermal Constraints
Example:
A vehicle accelerating too rapidly at low altitude may experience excessive heating on the nose cone and leading edges. To prevent TPS damage, the trajectory can include a controlled acceleration profile and a shallower ascent angle to reduce heating rates.
Integrating Constraints in Trajectory Design
Trajectory design is a balancing act. For instance, minimizing time in the dense atmosphere reduces aerodynamic and thermal loads but may increase structural loads due to higher acceleration. Engineers use simulations to find a trajectory that respects all constraints simultaneously.
Mind Map: Trajectory Constraints Integration
Example:
A typical gravity turn starts with a vertical ascent to clear dense lower atmosphere, then gradually pitches over to build horizontal velocity. The pitch schedule is designed to keep dynamic pressure below max q, limit bending moments, and control heating. Engine throttling may be used near max q to reduce loads.
In summary, trajectory constraints from atmosphere, structure, and thermal effects are interdependent. Successful launch vehicle design requires careful planning to navigate these limits, ensuring safety and efficiency throughout ascent.
6.4 Numerical Methods for Trajectory Simulation
Trajectory simulation is a core part of launch vehicle design, allowing engineers to predict the path a rocket will follow from liftoff to orbit insertion. Because the equations governing motion in a gravitational field with atmospheric drag and thrust are nonlinear and coupled, analytical solutions are rare. Instead, numerical methods approximate the solution by breaking the problem into small steps and iterating forward in time.
Key Concepts in Numerical Trajectory Simulation
- Equations of Motion: Typically expressed as a set of ordinary differential equations (ODEs) describing position, velocity, and acceleration.
- Forces: Gravity, aerodynamic drag, thrust, and sometimes perturbations like wind or Earth’s oblateness.
- State Vector: A collection of variables representing the vehicle’s current position, velocity, mass, and sometimes orientation.
- Time Step: The increment of time over which the state is updated.
Common Numerical Methods
-
Euler Method
- Simplest approach.
- Updates state using current derivative values.
- Low accuracy; errors accumulate quickly.
-
Runge-Kutta Methods (RK4)
- More accurate than Euler.
- Uses intermediate calculations within each time step.
- Widely used in trajectory simulation.
-
Predictor-Corrector Methods
- Predicts the next state, then corrects it using derivative estimates.
-
Adaptive Step Size Methods
- Adjust time step based on error estimates.
- Balances accuracy and computational cost.
Mind Map: Numerical Methods Overview
Step-by-Step Example: Simulating a Simple Vertical Launch
Scenario: Simulate a rocket ascending vertically under constant thrust, gravity, and drag.
Equations:
- \( \frac{dv}{dt} = \frac{T}{m} - g - \frac{1}{2} \frac{C_d \rho A}{m} v^2 \)
- \( \frac{dh}{dt} = v \)
Where:
- \(v\) is velocity (m/s)
- \(h\) is altitude (m)
- \(T\) is thrust (N)
- \(m\) is mass (kg)
- \(g\) is gravitational acceleration (9.81 m/s²)
- \(C_d\) is drag coefficient
- \(\rho\) is air density (kg/m³)
- \(A\) is cross-sectional area (m²)
Parameters:
- \(T = 50000\) N
- \(m = 1000\) kg
- \(C_d = 0.5\)
- \(\rho = 1.225\) kg/m³ (sea level)
- \(A = 1\) m²
Initial Conditions:
- \(v_0 = 0\) m/s
- \(h_0 = 0\) m
Time Step: 0.1 seconds
Using RK4 Method:
- Calculate derivatives at current state.
- Estimate intermediate slopes (k1, k2, k3, k4).
- Update velocity and altitude.
- Repeat until desired altitude or time.
Sample Calculation for First Step:
-
\(k1_v = dv/dt\) at \(v_0, h_0\)
-
\(k1_h = v_0\)
-
\(k2_v = dv/dt\) at \(v_0 + k1_v \frac{dt}{2}, h_0 + k1_h \frac{dt}{2}\)
-
\(k2_h = v_0 + k1_v \frac{dt}{2}\)
-
\(k3_v = dv/dt\) at \(v_0 + k2_v \frac{dt}{2}, h_0 + k2_h \frac{dt}{2}\)
-
\(k3_h = v_0 + k2_v \frac{dt}{2}\)
-
\(k4_v = dv/dt\) at \(v_0 + k3_v dt, h_0 + k3_h dt\)
-
\(k4_h = v_0 + k3_v dt\)
-
Update velocity: \[ v_1 = v_0 + \frac{dt}{6} (k1_v + 2k2_v + 2k3_v + k4_v) \]
-
Update altitude: \[ h_1 = h_0 + \frac{dt}{6} (k1_h + 2k2_h + 2k3_h + k4_h) \]
This process repeats for each time step.
Mind Map: RK4 Calculation Steps
Practical Considerations
- Step Size Selection: Smaller steps improve accuracy but increase computation time.
- Atmospheric Models: Air density \(\rho\) changes with altitude; incorporating this improves realism.
- Mass Variation: Fuel consumption reduces mass over time; including this affects acceleration.
- Drag Coefficient Variability: \(C_d\) can change with velocity and Mach number.
Example: Adaptive Step Size Concept
Suppose the rocket is moving slowly near the ground, where forces change rapidly, then faster at higher altitudes with smoother dynamics. An adaptive method reduces the time step when the solution changes quickly and increases it when changes are gradual, optimizing accuracy and efficiency.
Mind Map: Adaptive Step Size Workflow
Numerical methods form the backbone of trajectory simulation. Understanding their strengths and limitations helps engineers choose the right approach for their mission. Simple methods like Euler are good for quick, rough estimates or educational purposes. More robust methods like RK4 and adaptive algorithms provide the precision needed for real-world launch vehicle design.
6.5 Practical Example: Designing a Multi-stage Launch Trajectory
Designing a multi-stage launch trajectory involves planning the path a rocket takes from ground level to orbit, while managing the transitions between stages. The goal is to maximize payload delivery efficiency, minimize fuel consumption, and respect structural and environmental constraints.
Step 1: Define Mission Parameters
- Target orbit: Low Earth Orbit (LEO) at 200 km altitude, 28.5° inclination.
- Payload mass: 1000 kg.
- Launch site latitude: 28.5° N (e.g., Kennedy Space Center).
Step 2: Understand Vehicle Configuration
- Stage 1: First stage with high-thrust engines, designed to lift the vehicle out of the dense atmosphere.
- Stage 2: Upper stage optimized for vacuum operation, smaller engines, higher specific impulse.
Step 3: Gravity Turn Maneuver
The gravity turn is the standard method to transition from vertical ascent to horizontal orbital velocity.
- Start vertical to clear the launch pad.
- Begin pitching over gradually after clearing the tower.
- Use gravity to naturally curve the trajectory.
This reduces aerodynamic stress and fuel consumption.
Step 4: Staging Events
- Stage separation: Occurs when the first stage runs out of fuel.
- Ignition of upper stage: Must be timed precisely to maintain velocity and trajectory.
Step 5: Trajectory Constraints
- Max dynamic pressure (Max Q): Avoid structural damage.
- Thermal limits: Manage heating during atmospheric flight.
- Structural loads: Limit acceleration and vibration.
Step 6: Numerical Simulation Setup
- Use a simple 2D model considering altitude, velocity, flight path angle.
- Equations of motion include thrust, drag, gravity.
Mind Map: Multi-stage Launch Trajectory Design
Example Calculation: Simplified Gravity Turn
Assume initial vertical ascent for 10 seconds, then a pitch-over rate of 0.5° per second.
- At t=10s, flight path angle = 90° (vertical).
- After 10s, pitch angle reduces by 0.5°/s × 20s = 10°.
- So at t=30s, flight path angle = 80°.
This gradual pitch reduces aerodynamic loads.
Step 7: Staging Mass and Velocity Budget
Calculate velocity increments (Δv) required:
- Total Δv to LEO ~ 9.4 km/s (including gravity and drag losses).
- Allocate Δv per stage:
- Stage 1: ~5.5 km/s
- Stage 2: ~3.9 km/s
Using the rocket equation:
\[ \Delta v = I_{sp} \cdot g_0 \cdot \ln \left( \frac{m_0}{m_f} \right) \]
Where:
- \( I_{sp} \) is specific impulse,
- \( g_0 = 9.81 \ m/s^2 \),
- \( m_0 \) initial mass,
- \( m_f \) final mass after burn.
Example:
- Stage 1 \( I_{sp} = 300 \ s \)
- Stage 2 \( I_{sp} = 450 \ s \)
Calculate mass ratios for each stage accordingly.
Mind Map: Velocity Budget and Staging
Step 8: Trajectory Optimization Considerations
- Minimize gravity losses by optimizing pitch-over timing.
- Avoid exceeding Max Q by controlling acceleration and velocity profile.
- Adjust throttle settings to manage structural loads.
Step 9: Example Trajectory Profile Summary
| Time (s) | Altitude (km) | Velocity (m/s) | Flight Path Angle (°) | Stage |
|---|---|---|---|---|
| 0 | 0 | 0 | 90 | 1 |
| 10 | 1.5 | 150 | 90 | 1 |
| 30 | 10 | 800 | 80 | 1 |
| 60 | 40 | 2000 | 60 | 1 |
| 120 | 100 | 4000 | 40 | 1 |
| 150 | 150 | 5500 | 20 | 1 |
| 160 | 160 | 5800 | 15 | 1 |
| 161 | 161 | 5900 | 15 | Stage 2 ignition |
| 200 | 200 | 7500 | 0 | 2 |
| 300 | 300 | 7800 | 0 | 2 |
| 400 | 400 | 7800 | 0 | 2 |
Final Notes
This example simplifies many aspects but captures key steps: defining mission goals, understanding vehicle staging, applying gravity turn principles, calculating velocity budgets, and respecting constraints. Real-world trajectory design involves iterative simulation and refinement, but this framework provides a solid starting point.
The mind maps help organize the process, and the numerical examples illustrate how to apply theory to practice.
6.6 Best Practices: Balancing Performance and Structural Integrity
Balancing performance and structural integrity in launch vehicle design is a core challenge. Maximizing payload capacity and engine efficiency often pushes structural limits, while overdesigning adds weight and reduces performance. The key is to find an equilibrium where the structure is strong enough to withstand loads but light enough to not penalize performance.
Key Considerations
- Load Identification: Understand all loads the vehicle will face, including aerodynamic pressure, inertial forces during acceleration, vibration, and thermal stresses.
- Material Selection: Choose materials that offer the best strength-to-weight ratio for the expected environment.
- Structural Configuration: Design the shape and layout to distribute loads efficiently.
- Safety Margins: Apply realistic safety factors to account for uncertainties without excessive conservatism.
- Iterative Optimization: Use computational tools to refine designs balancing weight and strength.
Mind Map: Balancing Performance and Structural Integrity
Example 1: Optimizing an Interstage Structure
An interstage connects rocket stages and must handle axial loads during ascent. Initially, a thick aluminum shell was used, ensuring strength but adding 15% to vehicle dry mass. By analyzing load paths and switching to a carbon fiber composite with strategically placed stringers, the mass was reduced by 40% without compromising strength.
This required detailed finite element analysis (FEA) to confirm stress distributions and buckling resistance. The composite’s anisotropic properties allowed tailoring stiffness where needed. The design also incorporated a modest factor of safety of 1.25, balancing risk and weight.
Mind Map: Interstage Structural Optimization
Example 2: Thrust Structure Design
The thrust structure transfers engine forces to the vehicle. Overdesigning leads to heavy frames; underdesigning risks failure. A best practice is to model the thrust loads as concentrated forces and moments, then design a truss structure that channels these loads efficiently.
Using topology optimization software, engineers identified unnecessary material and removed it, resulting in a lattice-like structure that maintained stiffness and strength. The final design reduced mass by 25% compared to a solid frame.
Mind Map: Thrust Structure Design Process
Practical Tips
- Always start with a clear understanding of all loads, including transient and off-nominal conditions.
- Use materials with high specific strength but consider manufacturability and cost.
- Apply safety factors appropriate to the mission criticality and confidence in load data.
- Employ iterative design with simulation tools to identify weak points and overdesign.
- Consider manufacturing constraints early to avoid late-stage redesigns.
- Document assumptions and decisions to support verification and future modifications.
Balancing performance and structural integrity is a continuous trade-off. The best designs emerge from careful analysis, realistic assumptions, and iterative refinement rather than one-off guesses or overcautious conservatism.
7. Structural Design and Materials for Launch Vehicles
7.1 Load Analysis: Aerodynamic, Inertial, and Thermal Loads
Load analysis is a fundamental step in launch vehicle structural design. It ensures that the vehicle can withstand the forces and environmental conditions encountered during all phases of flight. This section breaks down the three primary load categories: aerodynamic, inertial, and thermal loads, explaining their origins, characteristics, and how they affect the vehicle.
Aerodynamic Loads
Aerodynamic loads arise from the interaction between the vehicle and the surrounding atmosphere as it moves through it. These loads vary with velocity, altitude, vehicle shape, and atmospheric conditions.
- Pressure Distribution: When air flows over the vehicle, pressure differences develop between the windward and leeward sides. These differences create forces and moments on the structure.
- Drag Force: Acts opposite to the direction of motion, increasing with velocity squared.
- Lift Force: For non-symmetrical shapes or during maneuvers, lift can generate bending moments.
- Dynamic Pressure (q): Defined as \( q = \frac{1}{2} \rho V^2 \), where \( \rho \) is air density and \( V \) is velocity. It is a key parameter for estimating aerodynamic loads.
Example: During max Q (maximum dynamic pressure), the vehicle experiences the highest aerodynamic stress. For a vehicle traveling at 1,000 m/s at 10 km altitude (where air density is approximately 0.41 kg/m³), dynamic pressure is:
\[ q = \frac{1}{2} \times 0.41 \times (1000)^2 = 205,000 \text{ Pa} = 205 \text{ kPa} \]
This pressure acts over the vehicle’s surface, causing structural loads.
Mind Map: Aerodynamic Loads
Inertial Loads
Inertial loads result from the vehicle’s acceleration, rotation, and mass distribution. They include:
- Axial Loads: Due to acceleration along the vehicle’s longitudinal axis, primarily from engine thrust.
- Lateral Loads: From vehicle maneuvers or wind gusts causing side accelerations.
- Bending Moments: Created by offset forces or uneven mass distribution.
- Vibrations and Acoustic Loads: Induced by engine operation and aerodynamic buffeting.
Example: Consider a 50,000 kg launch vehicle accelerating at 3 g (where 1 g = 9.81 m/s²). The axial inertial load is:
\[ F = m \times a = 50,000 \times 3 \times 9.81 = 1,471,500 \text{ N} \]
This load compresses the structure along its length and must be accounted for in design.
Mind Map: Inertial Loads
Thermal Loads
Thermal loads come from temperature variations and gradients experienced during flight, affecting material properties and structural integrity.
- Aerodynamic Heating: Friction between air and vehicle surface generates heat, especially at hypersonic speeds.
- Cryogenic Propellant Temperatures: Tanks and feed lines experience very low temperatures, causing thermal contraction.
- Thermal Gradients: Uneven heating or cooling leads to differential expansion, inducing stress.
Example: The nose cone of a vehicle re-entering the atmosphere may reach temperatures exceeding 1,500 °C due to aerodynamic heating, requiring heat-resistant materials and thermal protection systems.
Mind Map: Thermal Loads
Integrating Load Types
Load cases for structural design combine aerodynamic, inertial, and thermal loads to simulate realistic flight conditions. For example, during max Q, the vehicle experiences peak aerodynamic and inertial loads simultaneously, while thermal loads may be moderate. During re-entry, thermal loads dominate, but inertial loads from deceleration are also significant.
Example: A load case might include:
- Axial thrust load of 1.5 MN
- Dynamic pressure of 200 kPa acting laterally
- Thermal gradient causing 100 °C temperature difference across a panel
The structural engineer uses these combined loads to size components and select materials.
Summary
Understanding aerodynamic, inertial, and thermal loads is essential for designing a launch vehicle that can survive its mission. Each load type has distinct origins and effects, but they interact during flight. Accurate load analysis, supported by examples and clear parameters, guides engineers in creating safe, efficient, and reliable structures.
7.2 Material Selection: Metals, Composites, and Alloys
Material selection for launch vehicle structures is a balancing act between strength, weight, thermal resistance, manufacturability, and cost. Each material type brings a distinct set of properties that influence design choices. Understanding these properties helps engineers pick the right material for specific components.
Metals
Metals have been the backbone of aerospace structures for decades due to their well-understood mechanical properties and manufacturing processes.
-
Aluminum Alloys: Lightweight and corrosion-resistant, aluminum alloys like 2024 and 7075 are common in launch vehicle structures. They offer a good strength-to-weight ratio but have relatively low melting points (~660°C), which limits their use near hot engine sections.
-
Titanium Alloys: Titanium alloys (e.g., Ti-6Al-4V) provide higher strength and better corrosion resistance than aluminum, with a melting point around 1660°C. They are used in areas requiring high strength and moderate temperature resistance but come with higher cost and machining difficulty.
-
Stainless Steel: Known for excellent strength and thermal resistance, stainless steel is heavier but can withstand high temperatures and stresses. It is often used in engine components and recently gained attention for reusable launch vehicles due to its durability.
-
Copper Alloys: Copper alloys are primarily used in thermal management components like combustion chamber liners because of their high thermal conductivity.
Example: Choosing Aluminum 7075 for a Payload Fairing
A payload fairing requires a lightweight material with moderate strength and good corrosion resistance. Aluminum 7075 fits this role well because it balances weight and strength, is easy to machine, and resists environmental degradation during ground handling and ascent.
Composites
Composite materials combine fibers (carbon, glass, aramid) with a matrix (usually epoxy) to achieve high strength-to-weight ratios and tailor properties to specific needs.
-
Carbon Fiber Reinforced Polymers (CFRP): CFRPs are popular for their exceptional stiffness and low density. They excel in structural components like interstages and payload adapters.
-
Glass Fiber Composites: Less stiff and strong than carbon fiber but more cost-effective. Used in secondary structures or where impact resistance is prioritized.
-
Aramid Fiber Composites: Known for toughness and impact resistance, often used in protective layers or insulation.
Composite materials can be designed with anisotropic properties, meaning strength and stiffness vary with direction. This allows engineers to optimize load paths but requires careful analysis.
Example: Using CFRP for an Interstage Structure
An interstage must be lightweight yet strong enough to handle axial loads during staging. CFRP allows weight reduction compared to metals while maintaining structural integrity. The directional nature of carbon fibers can be aligned with expected load directions to maximize efficiency.
Alloys
Alloys are mixtures of metals designed to improve specific properties. Aerospace alloys are engineered to enhance strength, corrosion resistance, or temperature tolerance.
-
Aluminum-Lithium Alloys: Lighter and stiffer than traditional aluminum alloys, used in advanced aerospace applications.
-
Nickel-Based Superalloys: These alloys maintain strength at very high temperatures (above 1000°C), making them essential for turbine blades and combustion chambers.
-
Copper-Nickel Alloys: Used in heat exchangers and cooling channels due to good thermal conductivity and corrosion resistance.
Example: Nickel Superalloy in Rocket Engine Turbines
Rocket engine turbines operate under extreme thermal and mechanical stress. Nickel superalloys retain strength at high temperatures and resist creep, making them suitable for turbine blades that spin at high RPMs and face hot gases.
Mind Map: Material Selection Factors
Mind Map: Metals vs Composites
Practical Considerations
-
Corrosion Resistance: Aluminum alloys can corrode in salty or humid environments, so protective coatings or anodizing are often applied.
-
Thermal Expansion: Differences in thermal expansion between materials in a joint can cause stress during temperature changes, especially in composite-metal interfaces.
-
Damage Tolerance: Metals tend to deform plastically before failure, providing warning signs. Composites may fail suddenly, so non-destructive evaluation is critical.
-
Repairability: Metals can often be repaired by welding or machining, while composites require specialized repair techniques.
Summary
Material selection in launch vehicles requires weighing multiple factors. Metals offer reliability and ease of manufacture but can be heavier. Composites provide weight savings and tailored properties but add complexity. Alloys extend the capabilities of base metals, especially for high-temperature applications. The right choice depends on the component’s function, environment, and performance requirements.
7.3 Structural Configurations and Lightweight Design
Structural design in launch vehicles is a balancing act between strength, stiffness, and weight. Every kilogram saved in structure can translate into increased payload capacity or fuel efficiency. This section focuses on common structural configurations and strategies to reduce mass without compromising integrity.
Structural Configurations
Launch vehicle structures typically fall into a few broad categories based on their load-bearing approach:
- Monocoque: The outer skin carries most of the loads. This design reduces internal framing but requires a strong, often thicker, skin.
- Semi-monocoque: Combines a load-bearing skin with internal frames and stringers. This is common in rockets because it balances weight and strength.
- Truss Structures: Frameworks of interconnected struts and beams. They are lightweight and stiff but can be complex to manufacture and assemble.
Each configuration suits different parts of the vehicle. For example, tanks often use semi-monocoque shells, while interstages might use truss structures to minimize weight.
Lightweight Design Strategies
- Material Selection: Using high-strength alloys or composites reduces thickness and weight.
- Optimized Geometry: Shapes like cylinders and cones efficiently handle pressure and axial loads.
- Load Path Efficiency: Designing the structure so loads travel through the shortest, stiffest paths.
- Minimizing Stress Concentrations: Avoiding sharp corners or abrupt changes in cross-section to prevent weak points.
- Use of Sandwich Panels: Layers of thin face sheets bonded to a lightweight core increase stiffness without much added mass.
Mind Map: Structural Configurations
Mind Map: Lightweight Design Strategies
Example 1: Semi-monocoque Fuel Tank
A typical liquid oxygen tank uses a semi-monocoque design. The tank wall acts as the pressure boundary, while internal frames and stringers prevent buckling under compressive loads. The skin is thin aluminum alloy, supported by regularly spaced frames. This configuration keeps weight low while maintaining structural integrity under internal pressure and launch loads.
Example 2: Truss Interstage
The interstage connecting the first and second stages often uses a truss structure. This framework of aluminum or composite struts carries bending and torsional loads while minimizing mass. The open lattice design also facilitates access for wiring and plumbing. Though more complex to build, the weight savings justify the effort.
Example 3: Sandwich Panel Application
Some payload fairings use sandwich panels made of carbon fiber face sheets bonded to a honeycomb core. This design offers high stiffness and strength at a fraction of the weight of solid panels. The sandwich structure resists bending loads encountered during ascent and aerodynamic pressure.
Summary
Choosing the right structural configuration depends on the load environment, manufacturing capabilities, and weight targets. Semi-monocoque designs dominate where pressure loads are significant, while truss structures excel in non-pressurized sections needing minimal weight. Lightweight design is a combination of smart material use, geometry, and load management. Each kilogram saved here directly benefits the mission’s overall performance.
7.4 Vibration and Acoustic Environment Considerations
Vibration and acoustic environments pose significant challenges in launch vehicle structural design. These forces arise primarily during engine ignition, liftoff, and atmospheric flight phases. Understanding their sources, effects, and mitigation strategies is essential to ensure vehicle integrity and payload safety.
Sources of Vibration and Acoustic Loads
- Engine-Induced Vibrations: Turbomachinery, combustion instability, and mechanical imbalances generate vibrations transmitted through the vehicle structure.
- Aerodynamic Loads: As the vehicle ascends, airflow turbulence and shock waves create fluctuating pressures causing structural vibrations.
- Acoustic Noise: High-intensity sound waves from engine exhaust and plume interactions induce acoustic pressure fluctuations on vehicle surfaces.
Effects on Launch Vehicle Components
- Structural fatigue and potential cracking
- Loosening or failure of fasteners and joints
- Damage to sensitive payloads and avionics
- Increased risk of resonance leading to amplified responses
Mind Map: Vibration and Acoustic Environment Overview
Vibration Types and Characteristics
- Random Vibration: Irregular, broadband frequency vibrations typical during liftoff and ascent.
- Sinusoidal Vibration: Single-frequency vibrations, often from rotating machinery.
- Shock: Sudden, high-magnitude transient loads, such as stage separation or engine ignition.
Acoustic Environment Details
Sound pressure levels near rocket engines can exceed 180 decibels. This intense noise can cause structural vibrations and damage to delicate components. Acoustic loads are typically characterized by frequency spectra and spatial distribution around the vehicle.
Mind Map: Vibration Types and Acoustic Characteristics
Mitigation Strategies
- Structural Damping: Use materials and design features that absorb and dissipate vibrational energy.
- Isolation Mounts: Decouple sensitive components from vibration sources using elastomeric or spring mounts.
- Acoustic Liners: Install sound-absorbing materials in engine nozzles or fairings to reduce acoustic energy.
- Tuned Mass Dampers: Add masses tuned to counteract specific vibration frequencies.
Practical Example: Designing for Acoustic Loads on a Payload Fairing
Consider a payload fairing exposed to engine noise during liftoff. The fairing must withstand high acoustic pressures without transmitting damaging vibrations to the payload. Engineers select composite materials with inherent damping properties and incorporate acoustic liners inside the fairing. Vibration isolators are used to mount the payload, reducing transmitted accelerations. Testing with acoustic simulators verifies that the design meets vibration limits.
Mind Map: Mitigation Techniques
Testing and Validation
Vibration and acoustic testing replicates launch conditions to validate design robustness. Shaker tables simulate random and sinusoidal vibrations, while acoustic chambers reproduce engine noise spectra. Data from tests inform design adjustments and confirm compliance with payload requirements.
Summary
Vibration and acoustic environments are complex but manageable aspects of launch vehicle design. Identifying sources, understanding their effects, and applying targeted mitigation techniques help maintain structural integrity and protect payloads throughout the mission.
7.5 Practical Example: Designing a Lightweight Interstage Structure
The interstage structure connects two stages of a launch vehicle, transmitting loads while minimizing mass. Designing it requires balancing strength, stiffness, and weight. This example walks through key considerations and design steps for a lightweight interstage.
Step 1: Define Requirements and Constraints
- Load cases: axial compression during launch, bending from aerodynamic forces, torsion from thrust vectoring.
- Interfaces: attachment points to upper and lower stages.
- Mass budget: typically a small fraction of total vehicle mass.
- Environmental factors: thermal gradients, vibration, acoustic loads.
Step 2: Select Structural Configuration
Common interstage types:
- Cylindrical shell: simple, easy to manufacture, but can be heavy.
- Truss structure: lighter, allows for easier integration of systems but more complex.
- Ring frames with stringers: combines stiffness with weight savings.
For this example, choose a ring-frame and stringer design to balance weight and stiffness.
Step 3: Material Selection
- Aluminum alloys: good strength-to-weight, easy to machine.
- Titanium alloys: higher strength, corrosion resistance, but heavier and costlier.
- Composite materials: excellent strength-to-weight, but require careful fabrication.
Select aluminum 7075-T6 for its balance of strength, cost, and manufacturability.
Step 4: Preliminary Sizing and Load Analysis
Calculate axial loads from vehicle mass and acceleration:
Mind Map: Load Analysis
Example:
- Vehicle mass above interstage: 10,000 kg
- Max acceleration: 5 g
- Axial load = 10,000 kg * 5 * 9.81 m/s² = 490,500 N
Use this load to size ring frames and stringers.
Step 5: Structural Layout
- Ring frames spaced evenly along interstage length.
- Stringers run longitudinally, connecting rings.
- Skin panels cover the structure to transfer shear.
Mind Map: Structural Components
Step 6: Buckling and Stability Checks
Thin-walled structures are prone to buckling. Calculate critical buckling loads for stringers and skin panels.
Example:
- Use classical formulas or finite element analysis (FEA) to check buckling.
- Increase thickness or add stiffeners if needed.
Step 7: Weight Estimation
Sum masses of all components:
- Ring frames: number × mass per frame
- Stringers: length × cross-sectional area × density
- Skin panels: surface area × thickness × density
Example:
- 6 ring frames, each 15 kg = 90 kg
- 12 stringers, each 3 m long, cross-section 2 cm², aluminum density 2700 kg/m³:
- Volume = 12 × 3 × 0.0002 m² = 0.0072 m³
- Mass = 0.0072 × 2700 = 19.44 kg
- Skin panels: 10 m² area, 2 mm thickness:
- Volume = 10 × 0.002 = 0.02 m³
- Mass = 0.02 × 2700 = 54 kg
Total interstage mass ≈ 90 + 19.44 + 54 = 163.44 kg
Step 8: Integration and Interfaces
Design attachment points with load paths in mind. Include provisions for wiring, plumbing, and access.
Mind Map: Integration Considerations
Step 9: Validation and Testing
- Perform FEA to verify stress and deformation under load cases.
- Conduct vibration and acoustic testing to simulate launch environment.
- Prototype critical components for physical testing.
Summary
Designing a lightweight interstage involves understanding loads, selecting materials and structure types, sizing components to resist buckling and deformation, estimating mass, and ensuring integration with vehicle systems. This example used a ring-frame and stringer layout with aluminum alloy, balancing weight and strength. The process is iterative, requiring analysis and testing to meet mission requirements while keeping mass low.
7.6 Best Practices: Testing and Validation of Structural Components
Testing and validation of structural components in launch vehicles is a critical step to ensure safety, reliability, and performance under the demanding conditions of flight. This process involves a combination of analytical methods, physical testing, and iterative refinement. The goal is to confirm that the structure can withstand expected loads without excessive weight or unnecessary conservatism.
Key Areas in Structural Testing and Validation
- Load Testing: Verifying that components can handle static and dynamic loads.
- Fatigue Testing: Assessing durability over repeated stress cycles.
- Material Testing: Confirming material properties match design assumptions.
- Environmental Testing: Simulating thermal, vibration, and acoustic conditions.
- Non-Destructive Evaluation (NDE): Detecting flaws without damaging parts.
Mind Map: Structural Testing and Validation Workflow
Load Testing
Load testing confirms that structural components can sustain the forces they will encounter during launch and flight. Static load tests apply forces gradually to simulate maximum expected loads. Dynamic load tests replicate transient forces such as vibrations and shocks.
Example: A rocket interstage section undergoes a static axial compression test to 1.5 times the maximum predicted launch load. Strain gauges monitor deformation. The test confirms the structure remains elastic and no buckling occurs.
Fatigue Testing
Repeated stress cycles can cause cracks and eventual failure. Fatigue testing simulates these cycles to estimate component life.
Example: A propellant tank flange is subjected to cyclic pressure loading to mimic pressurization during multiple engine starts. Crack initiation and growth are monitored to determine safe operational limits.
Material Testing
Material properties must be verified to ensure they meet design specifications. Tests include tensile strength, hardness, and impact resistance.
Example: Samples from a batch of aluminum alloy used for the launch vehicle skin are tested for tensile strength and compared against supplier data. Any deviation triggers further investigation.
Environmental Testing
Launch vehicles face extreme temperatures, vibrations, and acoustic loads. Environmental testing replicates these to validate structural integrity.
Example: A payload fairing section is placed in a thermal chamber cycling between -70°C and +60°C while subjected to vibration profiles matching launch conditions. Post-test inspections check for cracks or delamination.
Non-Destructive Evaluation (NDE)
NDE methods detect internal or surface defects without damaging the component.
Example: Ultrasonic testing is used on welds in the engine thrust chamber to identify voids or cracks before assembly.
Data Analysis and Interpretation
Test data must be carefully analyzed to identify failure modes and validate safety margins. Stress-strain curves help confirm material behavior, while fracture analysis pinpoints weak spots.
Example: After a burst test on a composite tank, the failure pattern is studied to improve ply orientation and resin selection for future designs.
Integrated Example: Testing a Composite Interstage Structure
- Material Testing: Verify tensile and compressive strength of composite laminates.
- Load Testing: Apply combined axial and bending loads representative of flight conditions.
- Fatigue Testing: Simulate multiple launch cycles with cyclic loading.
- Environmental Testing: Subject the structure to thermal cycles and vibration.
- NDE: Use radiography and ultrasonic scans to detect internal defects.
- Data Analysis: Compare test results with finite element model predictions.
This integrated approach ensures the structure meets performance requirements without excess weight.
Summary
Testing and validation of structural components is a multi-faceted process combining physical experiments and analytical evaluation. Each step provides data that refine design assumptions and improve reliability. The best practice is to plan tests that closely replicate operational conditions and to use multiple complementary methods to build confidence in the structure’s performance.
8. Propellant Management and Tank Design
8.1 Propellant Storage Requirements and Challenges
Storing propellants for liquid rocket engines involves more than just filling a tank and sealing it. The nature of the propellant—whether cryogenic, hypergolic, or storable—dictates specific requirements and challenges that engineers must address to maintain performance, safety, and reliability.
Key Requirements for Propellant Storage
- Containment Integrity: The tank must prevent leaks and withstand internal pressures and external loads without failure.
- Thermal Control: Many propellants require temperature regulation to prevent boiling, freezing, or decomposition.
- Material Compatibility: Tank materials must resist corrosion or chemical reactions with the propellant.
- Pressure Management: Tanks must maintain appropriate pressure levels to ensure steady flow and avoid cavitation.
- Mass Efficiency: The tank structure should be as light as possible without compromising strength.
Common Challenges
- Cryogenic Propellants: Liquid oxygen (LOX) and liquid hydrogen (LH2) are stored at extremely low temperatures (LOX at about -183°C, LH2 at -253°C). This requires insulation and materials that can handle thermal contraction and prevent heat leaks.
- Boil-off and Venting: Heat ingress causes propellant to vaporize, increasing tank pressure. Controlled venting or refrigeration systems are necessary to manage this.
- Slosh Dynamics: Movement of liquid inside the tank during launch can affect vehicle stability and structural loads.
- Pressure Fluctuations: Changes in temperature or propellant consumption alter tank pressure, requiring pressurization systems.
- Chemical Reactivity: Some propellants, like hypergolic fuels, are highly reactive and require special handling and tank coatings.
Mind Map: Propellant Storage Requirements
Mind Map: Challenges in Propellant Storage
Examples
Example 1: LOX Tank Insulation Liquid oxygen tanks are often wrapped with multi-layer insulation (MLI) blankets to reduce heat transfer. MLI consists of alternating layers of reflective foils and spacer materials that limit radiative and conductive heat flow. Without MLI, the boil-off rate would increase significantly, leading to higher venting losses and potential safety hazards.
Example 2: Slosh Mitigation in LH2 Tanks Liquid hydrogen tanks often include internal baffles—structures that break up fluid movement—to reduce slosh. During launch, the vehicle experiences acceleration and vibration, causing the liquid to move and potentially destabilize the vehicle. Baffles help dampen these motions, improving control.
Example 3: Pressure Control in Storable Propellant Tanks Storable propellants like nitrogen tetroxide (N2O4) require pressurization to maintain flow to the engine. Helium is commonly used as a pressurant gas. The tank design includes a pressurant inlet and pressure regulators to keep the tank pressure within safe and operational limits.
Example 4: Material Compatibility with Hypergolic Fuels Hypergolic propellants ignite on contact, so tank materials must resist corrosion and chemical attack. For example, tanks storing hydrazine-based fuels often use stainless steel or titanium alloys with special coatings to prevent degradation and leaks.
In summary, propellant storage is a complex balance of mechanical, thermal, chemical, and operational factors. Each propellant type brings its own set of demands, and successful tank design requires addressing these systematically to ensure safe, efficient engine operation.
8.2 Tank Pressurization and Pressurant Systems
Tank pressurization is a critical aspect of liquid propellant rocket design. It ensures that propellants flow smoothly from the tanks to the engine, maintaining the required pressure to avoid cavitation in pumps or flow interruptions in pressure-fed systems. Without proper pressurization, the engine performance can degrade or the system can fail entirely.
Why Pressurize Tanks?
Liquid propellants are stored at relatively low pressure to minimize tank mass and structural requirements. However, during engine operation, propellants must be delivered at higher pressures. Pressurization compensates for the drop in propellant level and maintains a steady flow rate.
Common Pressurization Methods
- Helium Pressurization: Helium is the most common pressurant gas due to its inertness and low molecular weight.
- Autogenous Pressurization: Using gaseous forms of the propellants themselves (e.g., gaseous oxygen or hydrogen) to pressurize their respective tanks.
- Blowdown Systems: Simple systems where pressurant gas is stored at high pressure and allowed to expand into the tank, causing pressure to drop over time.
Pressurant System Components
- High-Pressure Gas Storage: Typically composite or metal cylinders storing helium or other gases at very high pressures (up to 3000 bar).
- Pressure Regulators: Reduce the high storage pressure to the desired tank pressurization level.
- Check Valves and Isolation Valves: Prevent backflow and allow system control.
- Heaters: In cryogenic systems, heaters warm the pressurant gas to prevent condensation and maintain pressure stability.
Pressurization Control Strategies
Maintaining a stable tank pressure requires careful control. Over-pressurization risks structural damage; under-pressurization risks flow interruption.
- Closed-Loop Control: Uses pressure sensors and valves to regulate gas flow dynamically.
- Open-Loop Control: Pre-set valve openings with no feedback, simpler but less precise.
Mind Map: Tank Pressurization System Overview
Example: Helium Pressurization in a Cryogenic LOX Tank
A liquid oxygen (LOX) tank in a cryogenic rocket stage is pressurized using helium gas stored at 3000 bar. The helium passes through a pressure regulator reducing pressure to about 20 bar, suitable for the LOX tank. To prevent the helium from cooling and liquefying inside the tank, it is routed through a heater before entering the tank ullage (the gas space above the liquid). This maintains stable pressure and prevents vapor lock.
Mind Map: Helium Pressurization Flow
Autogenous Pressurization Example
In some systems, gaseous oxygen boiled off from the LOX tank is routed back into the tank ullage to maintain pressure. This reduces the need for separate pressurant gas storage but requires careful thermal management to avoid excessive tank temperature rise.
Pressurant System Design Considerations
- Mass and Volume: Pressurant gas storage adds mass; optimizing pressure and storage volume is essential.
- Thermal Effects: Gas temperature affects pressure; heaters or heat exchangers may be required.
- Safety: High-pressure gas systems must include relief valves and robust structural design.
- Compatibility: Pressurant gas must not react with propellants or tank materials.
Troubleshooting Example: Pressure Drop During Flight
If a tank pressure drops unexpectedly during flight, possible causes include leaks, regulator malfunction, or heater failure causing gas liquefaction. Checking sensor data and valve status helps isolate the issue.
Mind Map: Troubleshooting Tank Pressurization
In summary, tank pressurization and pressurant systems are vital for stable propellant delivery. Their design balances complexity, reliability, and mass. Understanding the interplay of gas properties, thermal effects, and control methods helps engineers build efficient and safe launch vehicles.
8.3 Thermal Control of Propellants
Thermal control of propellants is a critical aspect of launch vehicle design. Propellants, especially cryogenic ones like liquid oxygen (LOX) and liquid hydrogen (LH2), require precise temperature management to maintain their physical state and performance. Improper thermal control can lead to vaporization, pressure build-up, or even loss of propellant, which affects engine performance and vehicle safety.
Why Thermal Control Matters
- Phase Stability: Many propellants must remain liquid to be pumped efficiently. If they warm up and vaporize, the resulting gas can cause cavitation in pumps or pressure spikes.
- Density Maintenance: Temperature changes affect propellant density, altering mass flow rates and thrust.
- Structural Integrity: Temperature gradients can induce thermal stresses in tanks and piping.
Methods of Thermal Control
Thermal control strategies generally fall into passive and active categories.
- Passive Thermal Control: Uses insulation, reflective coatings, and tank design to minimize heat transfer.
- Active Thermal Control: Involves refrigeration, chilldown procedures, and sometimes propellant recirculation to maintain temperature.
Mind Map: Thermal Control of Propellants
Passive Thermal Control
Multi-layer insulation (MLI) is the most common method for cryogenic tanks. It consists of alternating layers of reflective foils and spacer materials that reduce radiative heat transfer. For example, the Space Shuttle’s external tank used MLI blankets to reduce heat ingress and limit boil-off.
Foam insulation is another approach, often sprayed directly onto tanks. It provides both thermal insulation and mechanical protection. The foam on the external tank also prevented ice formation, which could damage the vehicle during launch.
Tank shape and surface treatments also influence thermal control. Spherical tanks minimize surface area for a given volume, reducing heat leak. Reflective coatings on tanks can reduce solar heating during ground hold or ascent.
Example: Insulating a LOX Tank
A LOX tank at 90 K is surrounded by ambient air at 300 K. Without insulation, heat leaks cause rapid boil-off. Applying MLI reduces radiative heat transfer by a factor of 10 or more, extending hold time and reducing propellant loss.
Active Thermal Control
Active methods are necessary when passive insulation alone cannot maintain temperature, especially during long holds or in space.
Chilldown procedures cool the feed lines and engine components before propellant flow begins to prevent thermal shock and vapor formation. This is done by flowing cold propellant through the lines at low rates.
Propellant recirculation involves circulating propellant within the tank or feed system to maintain uniform temperature and prevent stratification. This helps avoid localized warming and gas pockets.
Some systems use cryocoolers or refrigeration units to remove heat continuously, but these add complexity and weight.
Example: Chilldown of LH2 Lines
Before engine start, LH2 at 20 K is slowly flowed through the feed lines to cool them from ambient temperature. This prevents rapid boiling and pressure spikes when full flow begins.
Challenges in Thermal Control
- Heat Leak: Despite insulation, some heat always enters the system, causing boil-off.
- Boil-off Management: Boil-off gases increase tank pressure and must be vented or reliquefied.
- Thermal Stratification: Temperature gradients within the tank can cause density variations, affecting flow stability.
Mind Map: Challenges and Solutions
Practical Example: Managing Boil-off in a Cryogenic Tank
Consider a LOX tank on the launch pad with a small heat leak causing 0.5 kg/hr boil-off. Without venting, pressure would rise rapidly. A vent valve opens to release gas, maintaining safe pressure. However, this results in propellant loss. To reduce losses, engineers improve insulation and schedule launch to minimize hold time.
In summary, thermal control of propellants combines insulation, active cooling, and operational procedures to maintain propellant quality and vehicle safety. Each method has trade-offs in complexity, weight, and effectiveness. Understanding these helps engineers design reliable launch systems.
8.4 Slosh Dynamics and Mitigation Techniques
Slosh dynamics refers to the movement of liquid propellant inside a partially filled tank during vehicle acceleration, deceleration, or vibration. This fluid motion can generate forces and moments that affect the stability and control of the launch vehicle. Understanding and controlling slosh is essential to maintain accurate guidance and prevent structural issues.
What Causes Slosh?
When a launch vehicle accelerates, the liquid inside the tank does not instantaneously move with the tank walls. Instead, it shifts, creating waves and oscillations. These movements can resonate with the vehicle’s natural frequencies, amplifying forces unpredictably.
Why Slosh Matters
- Control System Impact: Slosh-induced forces can interfere with the vehicle’s attitude control system, causing unwanted oscillations or control errors.
- Structural Loads: The shifting mass changes load distributions, potentially stressing tank walls or vehicle structure.
- Propellant Management: Slosh can affect propellant feed stability, risking engine performance.
Mind Map: Slosh Dynamics Overview
Key Parameters Influencing Slosh
- Tank Geometry: Cylindrical, spherical, or conical shapes influence wave patterns and frequencies.
- Fill Level: Partially filled tanks exhibit more pronounced slosh; full or empty tanks have minimal fluid movement.
- Fluid Properties: Density, viscosity, and surface tension affect wave damping and oscillation frequencies.
Slosh Modes
Slosh can be described by different modes, primarily:
- Pendulum Mode: The fluid moves as a single mass swinging inside the tank.
- Wave Modes: Surface waves oscillate with nodes and antinodes, similar to waves in a pond.
Each mode has a characteristic frequency, which can interact with vehicle dynamics.
Mind Map: Slosh Modes and Effects
Mitigation Techniques
Baffles
Baffles are internal structures placed inside tanks to disrupt fluid motion. They break up large waves into smaller, less harmful oscillations and increase fluid damping.
- Types: Perforated plates, screens, or radial vanes.
- Example: A cylindrical tank fitted with radial baffles reduces slosh amplitude by interrupting fluid flow paths.
Bladders and Diaphragms
Flexible membranes separate propellant from pressurant gases, preventing free surface movement.
- Benefit: Eliminates free surface slosh by physically restraining fluid.
- Example: A bladder tank in a satellite propulsion system ensures stable propellant feed during attitude maneuvers.
Anti-Slosh Devices
Specialized devices like foam inserts or honeycomb structures increase damping.
- Trade-off: Added mass and complexity versus improved stability.
Control System Tuning
Adjusting control algorithms to account for slosh-induced forces can mitigate their impact.
- Example: Implementing notch filters in control loops to suppress slosh frequencies.
Practical Example: Baffle Design in a Cylindrical Tank
Consider a cylindrical liquid oxygen tank partially filled to 70%. Without baffles, slosh during a gravity turn causes oscillations at approximately 1.5 Hz, disturbing vehicle pitch control.
Adding three evenly spaced radial baffles reduces wave amplitude by 40%, lowering the slosh frequency and damping oscillations. This modification improves control system stability and reduces structural loads.
Mind Map: Slosh Mitigation Techniques
Summary
Slosh dynamics can significantly affect launch vehicle stability and control. By understanding the fluid motion inside tanks and employing mitigation strategies such as baffles, bladders, and control system adjustments, engineers can reduce slosh effects. Practical design choices depend on tank geometry, fill level, and mission requirements. Incorporating these techniques early in the design process helps ensure smoother launches and safer missions.
8.5 Practical Example: Designing a Cryogenic Propellant Tank
Designing a cryogenic propellant tank involves balancing thermal, structural, and fluid management requirements. Let’s walk through the key considerations and steps with concrete examples and mind maps to clarify the process.
Step 1: Define Requirements
- Propellant Type: Liquid Oxygen (LOX) or Liquid Hydrogen (LH2)
- Tank Volume: Based on required propellant mass and density
- Operating Temperature: LOX ~90 K, LH2 ~20 K
- Pressure: Typically slightly above atmospheric to prevent cavitation
- Mass Constraints: Minimize tank weight while ensuring safety
Example: Designing a LOX tank for a 10,000 kg propellant load.
Step 2: Calculate Tank Volume
Use the density of LOX (~1140 kg/m³) to find volume:
\[ V = \frac{m}{\rho} = \frac{10,000 \text{ kg}}{1140 \text{ kg/m}^3} \approx 8.77 \text{ m}^3 \]
Assuming a cylindrical tank with hemispherical ends, volume is:
\[ V = \pi r^2 h + \frac{4}{3} \pi r^3 \]
Choose a radius to balance length and diameter. For example, ( r = 1.2 , m ):
\[ h = \frac{V - \frac{4}{3} \pi r^3}{\pi r^2} \approx \frac{8.77 - 7.24}{4.52} \approx 0.33 , m \]
So, the tank would be roughly 1.2 m radius and 0.33 m cylindrical length plus hemispherical ends.
Step 3: Material Selection
Materials must withstand low temperatures without becoming brittle and have low thermal conductivity.
- Common choices: Aluminum alloys (e.g., 2219), stainless steel, or composites
- Aluminum 2219 is often used for LOX tanks due to good strength and weldability at cryogenic temperatures
Step 4: Structural Design
The tank must resist internal pressure and external loads during launch.
- Pressure Vessel Design: Use thin-wall pressure vessel theory for initial thickness estimate:
\[ t = \frac{P r}{\sigma_{allow}} \]
Where:
- \( P \) = design pressure (e.g., 0.5 MPa)
- \( r \) = tank radius
- \( \sigma_{allow} \) = allowable stress of material (e.g., 300 MPa for aluminum alloy)
Example:
\[ t = \frac{0.5 \times 10^6 \times 1.2}{300 \times 10^6} = 0.002 , m = 2 , mm \]
Add corrosion and manufacturing margins, so final thickness might be 3–4 mm.
- Reinforcements: Include stiffening rings or stringers to prevent buckling under axial loads.
Step 5: Thermal Insulation
Minimize heat leak to reduce boil-off.
- Use multilayer insulation (MLI) blankets
- Vacuum-jacketed tank design
Example Mind Map :
Step 6: Propellant Management
Manage fluid behavior in microgravity and during acceleration.
- Baffles: Reduce sloshing
- Venting System: Maintain pressure and remove boil-off gases
- Pressure Control: Use helium pressurization or autogenous pressurization
Example Mind Map :
Step 7: Integration and Testing
- Perform finite element analysis (FEA) on tank structure
- Conduct thermal vacuum tests
- Validate insulation performance and structural integrity
Summary Mind Map :
This example demonstrates how to approach cryogenic tank design methodically. Each step involves trade-offs and requires iteration. The goal is a lightweight, safe, and efficient tank that meets mission needs.
8.6 Best Practices: Ensuring Propellant Stability and Safety
Ensuring propellant stability and safety is a critical aspect of launch vehicle design and operation. Propellants, especially liquid ones, are often volatile, reactive, or cryogenic, which demands careful handling and system design to prevent accidents and maintain performance.
Key Factors for Propellant Stability and Safety
- Chemical Stability: Propellants must resist decomposition or unwanted reactions under storage and operational conditions.
- Thermal Management: Temperature control prevents phase changes or pressure build-up that could lead to tank rupture or combustion instability.
- Contamination Control: Foreign particles or incompatible materials can trigger reactions or clog feed systems.
- Pressure Control: Maintaining tank pressure within design limits avoids structural failure.
- Leak Prevention: Proper sealing and monitoring prevent hazardous leaks.
Mind Map: Propellant Stability and Safety Considerations
Chemical Stability
Propellants like hydrazine or liquid oxygen can degrade or react if exposed to impurities or unsuitable temperatures. For example, hydrazine slowly decomposes in the presence of metals like copper or brass, so tanks and lines must use compatible materials such as stainless steel or aluminum alloys.
Example: A launch vehicle team noticed unexpected pressure spikes in a hydrazine feed line. Investigation revealed copper contamination from a previous system. Switching to stainless steel piping and rigorous cleaning eliminated the issue.
Thermal Management
Cryogenic propellants such as liquid hydrogen and liquid oxygen require constant cooling to stay in liquid form. Insufficient insulation or cooling can cause boil-off, increasing tank pressure and risking venting or structural damage.
Example: A liquid oxygen tank equipped with multilayer insulation and active cooling loops maintained stable temperatures during a long hold period. Without these measures, the tank would have vented excess gas, wasting propellant and risking mission delays.
Contamination Control
Particles, moisture, or incompatible fluids can cause blockages or chemical reactions. Cleanroom assembly, filtered propellant transfer, and strict handling protocols reduce contamination risks.
Example: During engine testing, a filter clogged due to dust ingress, causing a drop in performance. Implementing a double-filter system and improved cleanroom procedures prevented recurrence.
Pressure Control
Tanks are pressurized using inert gases or autogenous pressurization to ensure steady propellant flow. Pressure relief valves prevent overpressure but must be carefully calibrated.
Example: A pressure relief valve set too high on a kerosene tank caused a minor rupture during a thermal spike. Adjusting the valve to open at a lower pressure prevented further incidents.
Leak Prevention
Seals and gaskets must be compatible with propellants and temperature ranges. Leak detection systems using sensors or pressure decay tests identify breaches early.
Example: A helium leak detection system identified a slow leak in a liquid hydrogen line during pre-launch checks, allowing repairs before fueling.
Mind Map: Best Practices Summary
Practical Example: Designing a Cryogenic Propellant Tank for Stability and Safety
- Material Selection: Use aluminum-lithium alloys for the tank body for strength and low weight, with stainless steel valves to resist corrosion.
- Thermal Insulation: Apply multilayer insulation blankets and vacuum jackets to reduce heat ingress.
- Pressure Control: Integrate helium pressurization with pressure relief valves set slightly above nominal operating pressure.
- Contamination Prevention: Assemble the tank in a clean environment; use filtered propellant transfer lines.
- Leak Detection: Install hydrogen sensors around critical joints and perform helium mass spectrometry leak checks before launch.
This approach minimizes boil-off, prevents contamination, and ensures safe pressure levels, demonstrating how multiple safety aspects integrate.
In summary, propellant stability and safety depend on a combination of chemical, thermal, mechanical, and procedural controls. Applying these best practices reduces risks and supports reliable launch vehicle operation.
9. Guidance, Navigation, and Control (GNC) Systems
9.1 Fundamentals of Guidance and Navigation
Guidance and navigation are two core functions that ensure a launch vehicle follows its intended path from liftoff to orbit insertion. While often mentioned together, they serve distinct roles: navigation determines the vehicle’s current position and velocity, and guidance decides how to adjust the vehicle’s trajectory to reach the target orbit.
Navigation: Knowing Where You Are
Navigation answers the question, “Where am I?” It involves measuring the vehicle’s position, velocity, and attitude relative to a reference frame. For launch vehicles, navigation relies on a combination of sensors and algorithms to estimate these parameters in real time.
Key navigation components include:
- Inertial Measurement Units (IMUs): These contain accelerometers and gyroscopes that measure linear acceleration and angular velocity. IMUs provide continuous data but suffer from drift over time.
- Global Navigation Satellite Systems (GNSS): Systems like GPS provide position and velocity updates to correct IMU drift.
- Radar and Optical Sensors: Used in some launch vehicles for altitude and velocity measurements, especially during ascent.
The navigation system fuses sensor data using filtering techniques, commonly the Kalman filter, to produce the best estimate of the vehicle’s state.
Guidance: Deciding Where to Go
Guidance answers, “Where should I go next?” It computes the desired trajectory and generates commands to steer the vehicle accordingly. Guidance algorithms take the current state from navigation and compare it to the target trajectory, then calculate control inputs to minimize the difference.
Common guidance methods include:
- Pre-programmed Trajectories: Fixed flight paths defined before launch.
- Command Guidance: Real-time updates based on navigation data.
- Optimal Control: Algorithms that minimize fuel consumption or time while meeting constraints.
Guidance outputs commands to actuators such as thrust vector control systems or engine throttles.
Mind Map: Guidance and Navigation Overview
Example: Navigation with IMU and GPS Fusion
Consider a launch vehicle equipped with an IMU and GPS receiver. The IMU provides high-frequency acceleration and rotation data but accumulates errors over time. GPS offers accurate position and velocity updates but at a lower rate and with possible signal delays.
A Kalman filter combines these inputs. It predicts the vehicle’s state using IMU data and corrects it when GPS data arrives. This fusion maintains accurate navigation information throughout ascent.
Example: Guidance via Gravity Turn
A common guidance strategy during launch is the gravity turn. Initially, the vehicle ascends vertically, then gradually pitches over to follow a curved trajectory shaped by gravity and thrust.
The guidance system calculates the pitch angle commands to keep the vehicle on the gravity turn path. It adjusts these commands based on navigation feedback to correct deviations caused by atmospheric disturbances or engine performance variations.
Mind Map: Navigation Data Fusion Process
Summary
Guidance and navigation work hand in hand: navigation tells the vehicle where it is, and guidance tells it where to go next. Together, they enable precise control of launch vehicles through complex trajectories. Understanding the sensors, algorithms, and control methods involved is essential for designing reliable flight systems.
9.2 Sensors and Actuators for Launch Vehicles
Sensors and actuators form the nervous system and muscles of a launch vehicle’s guidance, navigation, and control (GNC) system. Sensors gather data about the vehicle’s state and environment, while actuators execute commands to adjust trajectory, orientation, or engine thrust. Both must work reliably under extreme conditions such as vibration, temperature swings, and acceleration.
Sensors in Launch Vehicles
Sensors measure physical quantities essential for flight control. They can be broadly categorized as:
- Inertial sensors: Measure acceleration and angular velocity.
- Position and velocity sensors: Determine location and speed relative to Earth or other reference frames.
- Environmental sensors: Monitor external conditions like pressure and temperature.
Mind Map: Sensor Types and Functions
Inertial Measurement Units (IMUs): These combine accelerometers and gyroscopes to provide continuous data on the vehicle’s acceleration and rotation. For example, a launch vehicle’s IMU tracks pitch, yaw, and roll rates to maintain orientation.
Accelerometers measure linear acceleration. A simple example is a piezoelectric accelerometer that produces a voltage proportional to acceleration. This data helps detect changes in velocity and is crucial during engine ignition and staging.
Gyroscopes measure angular velocity. Modern launch vehicles often use ring laser or fiber optic gyros for their precision and lack of moving parts. For instance, the Space Shuttle used gyros to maintain stable attitude during ascent.
GPS Receivers provide position and velocity data by triangulating signals from satellites. Although GPS signals can be weak or unavailable during certain phases, they supplement inertial data to reduce drift errors.
Radar Altimeters measure altitude above ground by timing radar pulses. This is especially useful during launch pad operations and early ascent.
Environmental Sensors like pressure transducers and thermocouples monitor ambient conditions. For example, pressure sensors in the propellant tanks ensure safe operating pressures.
Example: Combining Sensor Data for Reliable Navigation
A launch vehicle’s flight computer fuses IMU data with GPS inputs using a Kalman filter. This approach compensates for IMU drift by correcting position and velocity estimates with GPS fixes. The result is a more accurate and robust navigation solution.
Actuators in Launch Vehicles
Actuators convert control commands into physical actions. They adjust engine thrust direction, control aerodynamic surfaces, or manage valve positions.
Mind Map: Common Actuator Types
Thrust Vector Control (TVC) Actuators: These adjust the angle of the engine nozzle or gimbals to steer the vehicle. Hydraulic actuators are common due to their high force output. For example, the Saturn V’s F-1 engines used hydraulic TVC to maintain trajectory.
Electric actuators are increasingly used for their precision and lower maintenance but must be designed to withstand launch vibrations.
Valve actuators regulate propellant flow. Solenoid valves offer fast response times, while motor-driven valves provide fine control. For instance, during engine start-up, valves open in a precise sequence to avoid combustion instability.
Reaction Control System (RCS) Thrusters use small rocket engines to control attitude in space or during atmospheric flight. Their actuators control propellant flow to these thrusters.
Control Surface Actuators operate fins or canards on some launch vehicles. Servo motors adjust these surfaces to influence aerodynamic forces.
Example: Hydraulic TVC Actuator Operation
A hydraulic pump pressurizes fluid that moves a piston connected to the engine nozzle mount. By varying fluid flow to different sides of the piston, the nozzle tilts. Sensors provide feedback on nozzle angle, enabling closed-loop control.
Integration and Challenges
Sensors and actuators must be tightly integrated with the flight computer. Timing and reliability are critical; delays or failures can cause loss of control.
Redundancy is a key best practice. Multiple sensors of the same type or different types provide backup and cross-checking. For example, three gyros arranged in a triad can detect faults by comparing outputs.
Calibration ensures sensor accuracy before and during flight. For instance, accelerometers are calibrated on the ground to account for bias and scale factors.
Environmental Hardening: Sensors and actuators must tolerate vibration, shock, temperature extremes, and electromagnetic interference. For example, accelerometers are mounted on vibration-isolating mounts.
Mind Map: Sensor and Actuator Integration Considerations
In summary, sensors provide the vehicle’s situational awareness, while actuators execute the commands that keep it on course. Understanding their types, functions, and integration challenges is essential for designing reliable launch vehicle control systems.
9.3 Control Algorithms and Flight Software
Control algorithms and flight software form the brain and nervous system of a launch vehicle’s guidance, navigation, and control (GNC) system. Their job is to process sensor data, compute control commands, and send those commands to actuators to keep the vehicle on its intended path. This section breaks down the core control algorithms, their implementation in flight software, and practical examples illustrating their use.
Core Control Algorithms
Control algorithms regulate the vehicle’s attitude, trajectory, and engine thrust. The most common types include:
- Proportional-Integral-Derivative (PID) Control: A feedback control loop that adjusts control inputs based on the error between desired and actual states.
- State-Space Control: Uses a mathematical model of the system’s dynamics to compute control inputs.
- Optimal Control: Minimizes a cost function (like fuel consumption or deviation from trajectory) subject to system constraints.
- Adaptive Control: Adjusts control parameters in real-time to handle changes in system behavior.
Mind Map: Control Algorithm Types
PID Control in Launch Vehicles
PID controllers are widely used because of their simplicity and effectiveness. Each term serves a purpose:
- Proportional (P): Corrects error proportionally to its size.
- Integral (I): Eliminates steady-state error by integrating past errors.
- Derivative (D): Predicts future error trends to dampen oscillations.
Example: Controlling thrust vector angle to maintain pitch during ascent.
Suppose the desired pitch angle is 10°, but sensors report 8°. The PID controller calculates the error (2°) and adjusts the actuator to increase the thrust vector deflection. If the error persists, the integral term accumulates, increasing the correction. If the error changes rapidly, the derivative term tempers the response to avoid overshoot.
Mind Map: PID Control Components
State-Space Control
State-space methods model the vehicle as a set of linear differential equations:
\[ \dot{x} = Ax + Bu \]
\[ y = Cx + Du \]
where \(x\) is the state vector, \(u\) the control input, and \(y\) the output. Feedback control uses the current state to compute control inputs:
\[ u = -Kx \]
with \(K\) as the feedback gain matrix.
Example: Stabilizing roll and yaw angles by measuring angular velocities and applying control torques.
Mind Map: State-Space Control
Flight Software Architecture
Flight software implements these algorithms in real-time, handling sensor inputs, running control loops, and commanding actuators. Key elements include:
- Sensor Data Processing: Filtering and validating measurements.
- Control Loop Execution: Running control algorithms at fixed intervals.
- Fault Detection: Monitoring system health and switching to safe modes if needed.
- Command Interface: Communicating with actuators and higher-level systems.
Example: A flight computer running a 100 Hz control loop that reads gyroscope data, computes PID corrections, and sends commands to gimbal motors.
Mind Map: Flight Software Components
Practical Example: Implementing a PID Controller for Thrust Vectoring
- Define the control objective: Maintain pitch angle at 10°.
- Measure current pitch angle: Use onboard inertial measurement unit (IMU).
- Calculate error: \( e(t) = 10° - \text{measured pitch} \).
- Compute PID output: \[ u(t) = K_p e(t) + K_i \int e(t) dt + K_d \frac{de(t)}{dt} \]
- Send command to actuator: Adjust thrust vector gimbal angle accordingly.
- Loop at fixed frequency: Repeat steps 2-5 every 10 ms.
This simple loop keeps the vehicle’s pitch stable despite disturbances like wind or engine thrust variations.
Best Practices
- Tune PID gains carefully: Use methods like Ziegler-Nichols or trial-and-error with simulations.
- Implement sensor filtering: Kalman filters reduce noise and improve state estimates.
- Modular software design: Separate sensor processing, control logic, and actuator commands for easier debugging.
- Real-time constraints: Ensure control loops run within timing budgets to avoid delays.
- Fault tolerance: Include watchdog timers and fallback modes to handle unexpected failures.
Control algorithms and flight software are the linchpins of launch vehicle stability and accuracy. Understanding their structure and implementation helps engineers design systems that respond predictably and safely during the intense conditions of launch.
9.4 Fault Detection and Redundancy
Fault detection and redundancy are critical components of guidance, navigation, and control (GNC) systems in launch vehicles. Their purpose is to identify failures early and maintain system functionality despite faults, ensuring mission success and vehicle safety.
Fault Detection
Fault detection involves monitoring system parameters and behaviors to spot deviations from expected performance. This process relies on sensors, data analysis, and comparison against known baselines or models.
Common fault detection techniques include:
- Threshold Checking: Simple limits are set for sensor readings or system variables. If a value crosses a threshold, a fault is flagged.
- Consistency Checks: Cross-verifying data from multiple sensors measuring the same parameter to identify discrepancies.
- Model-Based Detection: Using mathematical models of system behavior to predict expected outputs and comparing them with actual measurements.
- Signal Processing Methods: Filtering and analyzing sensor signals to detect anomalies such as spikes, drifts, or noise patterns.
Mind Map: Fault Detection Techniques
Example: Threshold Checking in a Gyroscope
A launch vehicle’s inertial measurement unit (IMU) includes gyroscopes to measure angular velocity. If the angular velocity reading suddenly exceeds a physically plausible limit (e.g., 1000 degrees per second when maximum expected is 500), the system flags a fault. This simple check prevents the GNC from acting on erroneous data.
Example: Consistency Check Between Redundant Accelerometers
If three accelerometers measure acceleration along the same axis, and one reading differs significantly from the other two, the system can identify the outlier as faulty. This method helps isolate sensor failures.
Redundancy
Redundancy means having multiple instances of critical components or systems so that if one fails, others can take over. Redundancy can be implemented at hardware, software, or functional levels.
Types of redundancy include:
- Hardware Redundancy: Duplicate or triplicate physical components, such as multiple sensors or processors.
- Software Redundancy: Multiple algorithms or software modules performing the same function independently.
- Information Redundancy: Using different data sources or sensor types to measure the same parameter.
Mind Map: Redundancy Types
Example: Triple Modular Redundancy (TMR)
In TMR, three identical processors run the same computations in parallel. A voting system compares outputs; if one processor disagrees, its output is discarded, and the other two determine the correct result. This approach is common in flight control computers.
Example: Redundant Valve Actuators
A launch vehicle may have two actuators controlling a critical valve. If one actuator fails, the other can operate the valve, maintaining control over propellant flow.
Integration of Fault Detection and Redundancy
Fault detection and redundancy work together. Detection identifies which component has failed, and redundancy provides backup components or systems to maintain operation.
Mind Map: Fault Detection and Redundancy Integration
Example: Fault Isolation and Recovery in a Launch Vehicle
Suppose a sensor in the navigation system fails. Fault detection flags the anomaly through consistency checks. The system isolates the faulty sensor by ignoring its data. Redundancy allows the navigation computer to rely on backup sensors. The vehicle continues its flight path without interruption.
Practical Considerations
- Latency: Fault detection must be fast enough to allow timely corrective actions.
- False Positives/Negatives: Systems must balance sensitivity to faults without triggering unnecessary alarms.
- Complexity vs. Reliability: Adding redundancy increases system complexity and weight but improves reliability.
- Testing: Fault detection and redundancy mechanisms require thorough testing under simulated fault conditions.
Summary
Fault detection identifies problems by monitoring system behavior, while redundancy provides backup components or methods to maintain function. Together, they form the backbone of reliable GNC systems, enabling launch vehicles to handle unexpected failures gracefully.
This combination ensures that a single failure does not cascade into mission failure, making fault detection and redundancy indispensable in launch vehicle engineering.
9.5 Practical Example: Implementing a PID Controller for Thrust Vectoring
Thrust vector control (TVC) is a key method for steering a rocket by changing the direction of the engine’s thrust. A common approach to managing TVC is using a PID (Proportional-Integral-Derivative) controller. This example explains how to implement a PID controller for controlling the gimbal angle of a rocket engine nozzle.
Overview of PID Control in Thrust Vectoring
A PID controller adjusts the control input based on three terms:
- Proportional (P): Responds to the current error (difference between desired and actual angle).
- Integral (I): Accounts for the accumulation of past errors to eliminate steady-state offset.
- Derivative (D): Predicts future error based on its rate of change, helping to dampen oscillations.
In thrust vectoring, the controller outputs a command to the actuator that moves the nozzle to the desired angle.
Mind Map: PID Controller Components for Thrust Vectoring
Step 1: Define the Control Problem
- Objective: Maintain the nozzle gimbal angle at a target value to steer the rocket.
- Input: Desired gimbal angle (setpoint).
- Feedback: Actual gimbal angle from sensors (e.g., potentiometer or encoder).
- Output: Actuator command (voltage or current) to move the nozzle.
Step 2: Establish the PID Control Law
The control signal ( u(t) ) is computed as:
\[ u(t) = K_p e(t) + K_i \int_0^t e(\tau) d\tau + K_d \frac{de(t)}{dt} \]
where:
- \( e(t) = \theta_{desired}(t) - \theta_{actual}(t) \)
- \( K_p, K_i, K_d \) are the proportional, integral, and derivative gains.
Step 3: Example Parameters and Simulation Setup
- Desired angle: 5 degrees (converted to radians for calculations).
- Initial actual angle: 0 degrees.
- Gains (example values):
- \( K_p = 2.0 \)
- \( K_i = 0.5 \)
- \( K_d = 0.1 \)
- Sampling time: 0.01 seconds.
Step 4: Implementing the Controller Logic (Pseudocode)
initialize integral = 0
initialize previous_error = 0
loop every sampling_time:
  error = desired_angle - actual_angle
  integral += error * sampling_time
  derivative = (error - previous_error) / sampling_time
  output = Kp * error + Ki * integral + Kd * derivative
  output = clamp(output, min_command, max_command)  # prevent actuator saturation
  send output to actuator
  previous_error = error
  measure actual_angle from sensor
end loop
Mind Map: PID Control Loop Execution
Step 5: Example Walkthrough
At time zero, the nozzle is at 0 degrees, but the desired angle is 5 degrees. The error is 5 degrees. The proportional term produces a command proportional to 5 degrees, pushing the actuator to move the nozzle. The integral term starts accumulating error, helping to correct any persistent offset. The derivative term initially is large because the error changes quickly, which helps prevent overshoot.
As the nozzle angle approaches 5 degrees, the error decreases, reducing the proportional term. The derivative term also decreases as the error change slows, and the integral term helps fine-tune the position to maintain the angle precisely.
Step 6: Handling Practical Considerations
- Actuator Saturation: Limit the control output to the actuator’s physical capabilities to avoid commanding impossible movements.
- Sensor Noise: Derivative term can amplify noise; applying a low-pass filter or using a derivative on measurement rather than error can help.
- Integral Windup: Prevent integral term from accumulating excessively when actuator is saturated by implementing anti-windup schemes.
Mind Map: Practical Issues and Solutions
Step 7: Summary
Implementing a PID controller for thrust vectoring involves measuring the nozzle angle, computing the error relative to the desired angle, and applying a control output based on proportional, integral, and derivative terms. Tuning the gains is critical to balance responsiveness and stability. Practical issues like actuator limits and sensor noise require careful handling to maintain control performance.
This example provides a foundation for understanding how PID control can be applied to rocket thrust vectoring, a fundamental task in launch vehicle guidance and stability.
9.6 Best Practices: Testing and Validation of GNC Systems
Testing and validation of Guidance, Navigation, and Control (GNC) systems are critical steps to ensure launch vehicle stability, accuracy, and safety during flight. These systems integrate sensors, actuators, and software to maintain the vehicle’s trajectory and orientation. A structured approach to testing reduces risks and uncovers issues early.
Key Areas in GNC Testing and Validation
- Sensor Calibration and Verification: Confirming sensors like gyroscopes, accelerometers, and star trackers provide accurate data under expected conditions.
- Actuator Response Testing: Ensuring control surfaces, thrusters, or gimbals respond correctly to commands.
- Software-in-the-Loop (SIL) Testing: Running flight software in a simulated environment to verify logic and algorithms.
- Hardware-in-the-Loop (HIL) Testing: Integrating real hardware components with simulation to test real-time responses.
- End-to-End System Testing: Validating the entire GNC chain from sensor input to actuator output.
- Fault Injection and Recovery: Introducing faults deliberately to test system robustness and fail-safe mechanisms.
Mind Map: GNC Testing and Validation Components
Sensor Calibration and Verification
Sensors must be calibrated to ensure accurate measurements. For example, a gyroscope’s bias and scale factor are determined by rotating it at known rates and comparing outputs. Environmental tests simulate temperature and vibration to confirm sensor stability. A practical example is calibrating an inertial measurement unit (IMU) by placing it on a precision turntable and comparing angular velocity outputs against known rotation rates.
Actuator Response Testing
Actuators translate control commands into physical movements. Testing involves measuring response time, accuracy, and repeatability. For instance, a thrust vector control gimbal is commanded to move to specific angles, and its actual position is measured with encoders. Any lag or overshoot is noted and corrected. Redundancy checks ensure backup actuators engage properly if the primary fails.
Software-in-the-Loop (SIL) Testing
SIL testing runs the GNC software on a computer simulating sensor inputs and actuator outputs. This method verifies algorithms without hardware risk. An example is simulating a pitch maneuver and checking if the software commands the correct control inputs. It allows rapid iteration and debugging before hardware integration.
Hardware-in-the-Loop (HIL) Testing
HIL testing connects real hardware components to a simulation environment. For example, the flight computer and actuators are connected to a simulator that feeds sensor data and receives control commands in real time. This tests timing, communication, and hardware-software interaction under near-flight conditions.
End-to-End System Testing
This comprehensive test validates the entire GNC system. A typical example is a closed-loop simulation where sensor data is generated, processed by the flight computer, and control commands are sent to actuators. The system’s ability to maintain a desired trajectory or attitude is evaluated.
Fault Injection and Recovery
To ensure robustness, faults such as sensor dropout or actuator failure are deliberately introduced. For example, disabling a gyroscope input during a simulation tests if the system can switch to backup sensors or enter a safe mode. This practice confirms that the system handles anomalies gracefully.
Mind Map: Fault Injection Testing
Practical Example: PID Controller Validation for Thrust Vectoring
Consider a PID controller managing thrust vectoring to maintain vehicle pitch. Testing begins with SIL to tune PID gains using simulated disturbances. Next, HIL testing integrates the actual controller hardware with actuator simulators. Step inputs are applied, and the system’s response is recorded. Overshoot, settling time, and steady-state error are analyzed. Adjustments are made to improve stability and responsiveness.
Documentation and Traceability
Every test must be documented with clear test plans, procedures, and results. Traceability links test cases to requirements, ensuring coverage. Issue tracking helps manage defects and verify fixes. This documentation supports certification and future maintenance.
Summary
Testing and validation of GNC systems require a layered approach covering sensors, actuators, software, and system integration. Using SIL and HIL simulations alongside real hardware tests uncovers issues early. Fault injection confirms system resilience. Clear documentation ensures traceability and continuous improvement. Applying these best practices leads to reliable and safe launch vehicle guidance and control.
10. Launch System Integration and Ground Support
10.1 Vehicle Assembly and Integration Processes
Vehicle assembly and integration is the stage where individual components and subsystems of a launch vehicle come together to form a complete, functional rocket. This process requires careful planning, coordination, and quality control to ensure that all parts fit and work together as intended. The goal is to produce a reliable vehicle ready for testing and launch.
Key Steps in Assembly and Integration
-
Component Receipt and Inspection: Every part, from engines to avionics, arrives at the assembly facility and undergoes inspection for damage, conformity to specifications, and cleanliness.
-
Subassembly Construction: Smaller units such as engine modules, avionics bays, and propellant lines are assembled independently before being integrated into larger sections.
-
Stage Assembly: The vehicle’s stages—first, second, and sometimes third—are assembled separately. This includes attaching engines, tanks, and structural elements.
-
Integration of Stages: Once individual stages are complete, they are stacked and connected through mechanical, electrical, and fluid interfaces.
-
System Integration: Electrical wiring, telemetry, propulsion feed lines, and control systems are interconnected across stages.
-
Functional Testing: Integrated systems undergo tests to verify electrical continuity, fluid flow, and mechanical integrity.
-
Final Assembly: Payload fairings and any final components are installed.
-
Pre-Launch Checks: The fully assembled vehicle is inspected and prepared for transport to the launch pad.
Mind Map: Vehicle Assembly and Integration Processes
Example: Assembling a Two-Stage Launch Vehicle
Imagine a two-stage rocket where the first stage houses the main engines and large propellant tanks, and the second stage contains a smaller engine and the payload adapter.
-
First Stage Assembly: The structural frame is built, and propellant tanks are installed. Engines are mounted and connected to feed lines. Wiring for sensors and actuators is routed.
-
Second Stage Assembly: The smaller engine is installed along with its propellant tanks. Avionics and control systems are integrated.
-
Stage Integration: The second stage is carefully lowered onto the first stage using cranes. Mechanical latches and electrical connectors are engaged.
-
System Integration: Electrical harnesses connecting both stages are secured. Propellant lines that transfer pressurant gases or enable stage separation are connected.
-
Functional Testing: Electrical tests confirm signal continuity. Pressure tests verify the integrity of propellant lines. Leak checks ensure no fluid escapes.
-
Final Assembly: The payload fairing is attached atop the second stage.
-
Pre-Launch Preparation: The vehicle is inspected for any assembly defects and prepared for transport.
Best Practices in Assembly and Integration
-
Maintain Cleanliness: Contamination can cause failures in propulsion or avionics. Clean rooms or controlled environments are used during critical assembly steps.
-
Use Detailed Assembly Procedures: Step-by-step instructions reduce errors and ensure consistency.
-
Implement Quality Control Checks: Inspections at every stage catch defects early.
-
Document Every Step: Traceability helps diagnose issues and supports certification.
-
Coordinate Teams Effectively: Mechanical, electrical, and propulsion teams must communicate to avoid interface mismatches.
-
Plan for Accessibility: Design assemblies so that critical components can be accessed for inspection or repair.
-
Perform Incremental Testing: Testing subsystems before full integration reduces troubleshooting complexity.
Mind Map: Best Practices for Assembly
Example: Troubleshooting an Electrical Interface Issue
During integration, a continuity test between the first and second stage avionics bays reveals an open circuit. The assembly team traces wiring harness connectors and discovers a misaligned pin in a multi-pin connector. Correcting the alignment restores continuity. This example highlights the importance of careful connector mating and testing at each integration step.
In summary, vehicle assembly and integration is a methodical process that transforms individual parts into a working rocket. Attention to detail, thorough testing, and clear communication are essential to avoid costly errors and ensure mission success.
10.2 Ground Support Equipment and Infrastructure
Ground Support Equipment (GSE) and infrastructure form the backbone of any launch operation. They provide the necessary physical and technical support to assemble, test, fuel, transport, and launch the vehicle safely and efficiently. Without well-designed and maintained GSE, even the best rocket can’t leave the pad.
Key Categories of Ground Support Equipment
- Vehicle Assembly and Integration Tools: Cranes, platforms, and specialized tooling for stacking stages and installing payloads.
- Propellant Handling Systems: Pumps, transfer lines, storage tanks, and safety valves for loading and unloading cryogenic and hypergolic propellants.
- Launch Pad Infrastructure: Flame trenches, hold-down arms, umbilical towers, and lightning protection.
- Electrical and Data Systems: Power supplies, communication links, and telemetry ground stations.
- Environmental Control Systems: Thermal conditioning, clean rooms, and humidity control for sensitive components.
- Safety and Emergency Systems: Fire suppression, gas detection, and evacuation routes.
Mind Map: Ground Support Equipment Overview
Vehicle Assembly and Integration Tools
Assembly requires precise alignment and secure handling of heavy and delicate components. Cranes must have sufficient capacity and reach, while platforms provide safe access at multiple heights. Specialized tooling ensures that stages mate correctly and payloads are installed without damage.
Example: At the Kennedy Space Center, the Vehicle Assembly Building (VAB) uses massive cranes capable of lifting the entire Saturn V first stage. The tooling includes alignment pins and hydraulic actuators to ensure tight stage connections.
Propellant Handling Systems
Propellant loading is one of the most critical and hazardous operations. Systems must maintain propellant purity, prevent leaks, and control flow rates. Cryogenic propellants like liquid oxygen require insulated transfer lines and controlled venting to manage boil-off.
Example: The SpaceX Falcon 9 uses automated propellant loading systems with sensors to monitor pressure and temperature, reducing manual intervention and improving safety.
Launch Pad Infrastructure
The launch pad supports the vehicle structurally and provides interfaces for fueling, power, and data. Flame trenches direct exhaust away to prevent damage. Hold-down arms secure the vehicle until liftoff, releasing at the precise moment. Umbilical towers connect ground systems to the vehicle and retract at launch.
Example: The flame trench at the Baikonur Cosmodrome is designed to withstand the intense heat and acoustic energy of the Soyuz rocket exhaust, protecting both the vehicle and ground equipment.
Electrical and Data Systems
Reliable power and communication links are essential for monitoring vehicle health and controlling countdown sequences. Telemetry ground stations receive data streams during pre-launch and flight.
Example: NASA’s launch complexes use redundant power feeds and fiber optic communication lines to ensure uninterrupted data flow.
Environmental Control Systems
Sensitive electronics and propellants require stable environmental conditions. Clean rooms prevent contamination during payload integration. Thermal conditioning prevents ice formation on cryogenic tanks.
Example: The payload fairing integration area is maintained at controlled humidity and particulate levels to protect satellite components.
Safety and Emergency Systems
Fire suppression systems use water deluge or foam to control fires. Gas detectors monitor for leaks of toxic or flammable substances. Clearly marked evacuation routes and emergency shelters protect personnel.
Example: The launch pad at Vandenberg Air Force Base includes automated fire suppression triggered by heat sensors and manual override capabilities.
Mind Map: Propellant Handling System Details
Practical Example: Coordinating Propellant Loading
Consider a launch vehicle using liquid oxygen (LOX) and RP-1 kerosene. The LOX is stored in a cryogenic tank with vacuum insulation. Before loading, the transfer lines are purged with gaseous nitrogen to prevent oxygen condensation. Pumps maintain flow rates, and pressure sensors monitor for anomalies. The system includes emergency vent valves that open if pressure exceeds safe limits. Operators follow a checklist to verify each step, ensuring no steps are skipped.
This example highlights the importance of integrating mechanical systems with procedural controls to maintain safety and efficiency.
Summary
Ground Support Equipment and Infrastructure are complex but essential. Each subsystem—from cranes to communication lines—must work together seamlessly. Understanding their roles and interactions helps engineers design launch operations that are safe, reliable, and repeatable.
10.3 Pre-launch Checkout and Countdown Procedures
Pre-launch checkout and countdown procedures are critical steps that ensure a launch vehicle is ready for flight. These processes verify the functionality of all systems, confirm safety protocols, and coordinate the timing of events leading up to liftoff. The goal is to identify and resolve any issues before launch to minimize risk and maximize mission success.
Overview of Pre-launch Checkout
Pre-launch checkout involves a series of systematic tests and verifications on the vehicle and ground support equipment. This includes electrical systems, propulsion, avionics, telemetry, and communication links. The process typically starts days before launch and intensifies as the launch window approaches.
Countdown Procedures
The countdown is a timed sequence of operations culminating in engine ignition and liftoff. It is carefully choreographed to synchronize vehicle readiness, ground support, and weather conditions. The countdown clock may be held at specific points to address issues or wait for optimal conditions.
Mind Map: Pre-launch Checkout Components
Mind Map: Countdown Sequence
Detailed Steps and Examples
System Activation and Verification
Early in the countdown, vehicle systems are powered on and checked. For example, avionics computers run self-tests to confirm sensor and actuator functionality. Communication links between the vehicle and ground control are tested to ensure telemetry data flows correctly.
Example: During a recent launch campaign, a communication link test revealed intermittent data loss. The issue was traced to a faulty cable connection and resolved before proceeding.
Propellant Loading
Fuel and oxidizer loading is a carefully controlled process. Cryogenic propellants like liquid oxygen require precise temperature and pressure management to prevent boil-off or over-pressurization.
Example: In one case, the LOX loading was paused due to a temperature sensor reading outside acceptable limits. The team adjusted the cooling system and resumed loading once conditions stabilized.
Engine Chilldown
Before ignition, engine components are chilled with cryogenic propellants to prevent thermal shock and ensure proper flow characteristics. This step is crucial for engine longevity and performance.
Example: For a staged combustion engine, chilldown involved flowing liquid oxygen through the turbopump and combustion chamber walls. Monitoring temperature sensors ensured the process was complete before ignition.
Pressurization
Tanks and feed lines are pressurized to flight conditions. This step ensures propellants flow correctly during engine start and maintains structural integrity.
Example: Pressurization of helium gas in the propellant tanks was monitored closely. A slight pressure drop triggered a hold in the countdown while the leak was identified and sealed.
Final Go/No-Go Poll
Just before ignition, the launch director polls all teams to confirm readiness. Each team reports ‘go’ or ‘no-go’ based on their system status.
Example: A ‘no-go’ from the telemetry team due to a software glitch delayed the countdown. The issue was fixed within minutes, and the countdown resumed.
Ignition and Liftoff
Once all systems are confirmed ready, the ignition sequence starts. Engines ramp up to full thrust, and the vehicle lifts off.
Example: During a recent launch, the ignition sequence proceeded nominally, and liftoff occurred at T-0 with all systems performing within expected parameters.
Best Practices Embedded in Procedures
-
Redundancy in Critical Systems: Multiple sensors and communication paths reduce the risk of single-point failures during checkout.
-
Clear and Detailed Checklists: Structured checklists ensure no step is overlooked, and responsibilities are clearly assigned.
-
Real-time Monitoring and Data Logging: Continuous data collection during checkout and countdown allows quick diagnosis of anomalies.
-
Flexible Countdown Holds: Built-in hold points provide time to address issues without rushing, improving safety.
-
Effective Communication Protocols: Standardized terminology and clear reporting lines prevent misunderstandings during high-pressure moments.
Summary
Pre-launch checkout and countdown procedures are a blend of rigorous testing, precise timing, and coordinated teamwork. Each step, from system activation to liftoff, is designed to confirm readiness and manage risk. Examples from actual launches highlight how attention to detail and adherence to best practices keep launches on track and safe.
10.4 Safety Protocols and Risk Management
Safety protocols and risk management are foundational to any launch operation. They ensure the protection of personnel, equipment, and the environment while maintaining mission success. This section covers the key components of safety planning, risk assessment, and mitigation strategies specific to launch vehicle operations.
Key Elements of Safety Protocols
- Hazard Identification: Recognizing potential sources of danger such as propellant leaks, high-pressure systems, and explosive materials.
- Risk Assessment: Evaluating the likelihood and impact of identified hazards.
- Control Measures: Implementing engineering controls, administrative procedures, and personal protective equipment.
- Emergency Response Planning: Preparing for incidents with clear roles, communication channels, and evacuation procedures.
- Training and Drills: Ensuring all personnel understand safety procedures and can execute them under pressure.
Risk Management Process
- Identify Risks: List all possible hazards related to launch vehicle operations.
- Analyze Risks: Determine the probability and severity of each risk.
- Evaluate Risks: Prioritize risks based on their potential impact.
- Treat Risks: Apply controls to reduce risk to acceptable levels.
- Monitor and Review: Continuously check the effectiveness of controls and update as needed.
Mind Map: Safety Protocols Overview
Example: Propellant Handling Safety
Handling liquid propellants involves risks such as toxic exposure, fire, and explosion. A best practice is to use remote handling systems to minimize human contact. For example, during fueling operations, operators monitor remotely via cameras and sensors. Emergency shutoff valves are installed to isolate leaks quickly.
Mind Map: Risk Management Cycle
Example: Launch Pad Fire Risk Mitigation
A launch pad fire could result from fuel leaks or electrical faults. Risk mitigation includes installing fire suppression systems such as water deluge and foam systems. Regular inspections and maintenance reduce the chance of equipment failure. Additionally, strict no-smoking policies and controlled access limit ignition sources.
Emergency Response Planning
An effective emergency response plan defines clear roles for personnel, communication protocols, and evacuation procedures. For instance, during a countdown hold due to a detected leak, the launch director initiates evacuation of non-essential personnel while safety teams isolate the hazard.
Mind Map: Emergency Response Components
Example: Countdown Abort Procedure
If an anomaly is detected during countdown, an abort procedure is triggered. This includes immediate engine shutdown, venting of propellants, and securing the vehicle. Personnel follow pre-planned evacuation routes. The procedure is rehearsed regularly to ensure smooth execution.
Training and Drills
Regular training ensures personnel are familiar with safety protocols and emergency procedures. Drills simulate scenarios such as fire, toxic gas release, or explosion risk. For example, a mock propellant leak drill tests communication, evacuation, and containment actions.
Summary
Safety protocols and risk management are continuous, integrated processes. They require attention to detail, clear communication, and disciplined execution. By combining thorough hazard identification, risk evaluation, and practical control measures, launch operations can proceed with minimized risk to people and assets.
10.5 Practical Example: Coordinating a Launch Campaign
Coordinating a launch campaign involves managing a complex sequence of activities and stakeholders to ensure a successful vehicle launch. This practical example breaks down the key steps, responsibilities, and timing considerations, supported by mind maps to visualize the workflow.
Overview of Launch Campaign Coordination
A launch campaign typically spans several weeks to months and includes vehicle assembly, testing, integration, rehearsals, and final countdown operations. The goal is to align technical, logistical, and operational tasks while maintaining safety and schedule discipline.
Mind Map: Launch Campaign Major Phases
Vehicle Assembly
This phase involves assembling the launch vehicle components, including stages, engines, avionics, and payload. Coordination here requires:
- Scheduling facility availability
- Ensuring parts and tooling readiness
- Managing workforce shifts
- Quality control inspections
Example: The first stage is assembled in a cleanroom environment. A delay in receiving a turbopump requires rescheduling the assembly timeline and notifying downstream teams.
Testing and Checkout
Subsystems undergo functional and environmental tests to verify readiness. This includes:
- Engine static fire tests
- Avionics system checks
- Propellant loading system tests
Example: A static fire test reveals a sensor anomaly. The engineering team must diagnose and fix the issue without delaying the campaign.
Mind Map: Testing and Checkout Activities
Integration
Integrating the payload with the launch vehicle involves:
- Mechanical mating
- Electrical and data connections
- Environmental sealing
- Final inspections
Example: Payload integration requires coordination with the satellite team to schedule cleanroom access and verify electrical interfaces.
Rehearsals
Simulated countdowns and emergency drills prepare the team for launch day. Key points include:
- Verifying communication protocols
- Practicing abort scenarios
- Confirming timing sequences
Example: A rehearsal identifies a communication gap between the launch control center and range safety officers, leading to protocol adjustments.
Mind Map: Rehearsal Focus Areas
Final Countdown
The final hours before launch demand strict adherence to procedures:
- Propellant loading
- System arming
- Weather monitoring
- Go/no-go polls
Example: Weather conditions deteriorate during countdown. The launch director must decide whether to hold or proceed based on predefined criteria.
Launch and Post-Launch Operations
During launch, coordination focuses on:
- Monitoring vehicle telemetry
- Range safety enforcement
- Tracking and telemetry handover
Post-launch includes:
- Data analysis
- Vehicle and payload status confirmation
- Debrief and documentation
Example: Telemetry indicates a minor deviation in trajectory. Flight dynamics teams assess whether it affects mission success.
Mind Map: Launch Day Coordination
Communication and Documentation
Clear communication channels and thorough documentation are vital. Daily status meetings, issue tracking, and decision logs keep everyone aligned.
Example: A shared digital dashboard displays real-time status updates, enabling remote teams to stay informed and respond quickly.
Summary
Coordinating a launch campaign requires detailed planning, flexibility, and clear communication. Breaking down the campaign into phases with defined tasks and responsibilities helps manage complexity. Practical examples show how issues are handled without derailing the schedule. Mind maps clarify the relationships between activities, aiding in understanding and execution.
10.6 Best Practices: Effective Communication and Documentation
Effective communication and documentation are cornerstones of successful launch vehicle projects. They ensure that complex technical information flows smoothly between teams, reduce errors, and preserve institutional knowledge. This section outlines best practices for communication and documentation tailored to the demanding environment of launch system engineering.
Clear Communication Channels
Establishing clear, consistent communication channels is essential. Teams should know who to contact for specific issues and how to escalate problems. For example, a propulsion engineer should have a direct line to the test operations team to quickly resolve anomalies during engine testing.
Mind Map: Communication Channels
Use of Standardized Documentation
Documentation should follow standardized templates and formats. This consistency helps readers find information quickly and reduces misunderstandings. For instance, engine test reports should consistently include sections on test objectives, setup, results, anomalies, and conclusions.
Example: Standardized Test Report Structure
- Title and Date
- Test Objectives
- Test Setup Description
- Instrumentation and Data Collected
- Results and Analysis
- Anomalies and Issues
- Conclusions and Recommendations
Version Control and Traceability
Maintaining version control on documents and drawings is critical. It prevents confusion over which document is current and allows tracking of changes over time. Using tools like document management systems or version-controlled repositories helps maintain traceability.
Mind Map: Documentation Management
Clear and Concise Writing
Technical documents should be clear and concise. Avoid jargon where possible and explain necessary technical terms. For example, instead of saying “utilize,” say “use.” Instead of “propellant feed system,” briefly define it when first mentioned.
Example: Writing Improvement
- Before: “The propellant feed system utilizes a turbopump to facilitate the delivery of oxidizer and fuel into the combustion chamber.”
- After: “The propellant feed system uses a turbopump to deliver oxidizer and fuel into the combustion chamber.”
Visual Aids and Diagrams
Including diagrams, flowcharts, and tables can clarify complex information. For example, a flowchart showing the engine start-up sequence helps readers understand the process better than text alone.
Mind Map: Documentation Elements
Regular Reviews and Updates
Documentation should be reviewed regularly and updated to reflect changes. This practice prevents outdated information from causing errors. For example, after a design change in the thrust vector control system, all related documents must be revised promptly.
Example: Document Review Process
- Draft Creation
- Peer Review
- Incorporation of Feedback
- Approval by Lead Engineer
- Distribution and Archiving
Meeting Documentation
Minutes should be taken during meetings, capturing decisions, action items, and responsible parties. This record keeps everyone accountable and informed.
Mind Map: Meeting Documentation
Encouraging Open Feedback
Create an environment where team members feel comfortable providing feedback or raising concerns. This openness can catch issues early and improve overall quality.
Example: Feedback Mechanism
- Anonymous suggestion boxes
- Regular retrospectives
- Open-door policy with project leads
Summary
Effective communication and documentation require deliberate structure, clarity, and upkeep. By establishing clear channels, using standardized formats, maintaining version control, writing clearly, supporting text with visuals, and fostering open feedback, teams can reduce errors and improve collaboration. These practices are not just bureaucratic necessities but practical tools that keep complex projects on track.
11. Environmental and Regulatory Considerations
11.1 Environmental Impact of Launch Vehicles
Launch vehicles, while essential for space access, interact with the environment in several measurable ways. Understanding these impacts is crucial for engineers and planners aiming to balance mission success with environmental responsibility.
Emissions from Propellants
Liquid propellant engines release combustion products that vary depending on the fuel and oxidizer combination. Common propellants include combinations like liquid oxygen with kerosene (RP-1), liquid hydrogen, or hypergolic fuels such as nitrogen tetroxide and hydrazine.
- Carbon Dioxide (CO2) and Water Vapor (H2O): Hydrocarbon fuels produce CO2 and H2O. While water vapor is a natural atmospheric component, its injection at high altitudes can affect local atmospheric chemistry.
- Nitrogen Oxides (NOx): High-temperature combustion generates NOx, which can contribute to ozone layer depletion and smog formation.
- Aluminum Oxide (Al2O3): Solid rocket motors, though outside the liquid propellant focus, produce aluminum oxide particles that persist in the stratosphere.
Example: The use of RP-1/LOX engines, like those on the Falcon 9, results in CO2 and water vapor emissions primarily in the lower atmosphere, where they disperse relatively quickly. In contrast, hydrogen/LOX engines emit mostly water vapor, which has different atmospheric effects.
Ozone Layer Effects
Certain exhaust constituents, especially chlorine and nitrogen compounds from some solid and hypergolic propellants, can catalyze ozone destruction. Liquid propellant engines generally have a smaller direct impact on ozone compared to solid motors but can still contribute through NOx emissions.
Acoustic and Vibrational Impact
Launches generate intense noise and vibrations, which can affect local wildlife and human populations near launch sites. These effects are transient but significant during launch windows.
Ground Contamination
Handling and storage of propellants pose risks of soil and water contamination. For example, hydrazine is highly toxic and requires careful management to prevent leaks.
Debris and Physical Impact
Stages and hardware discarded during flight can impact the environment if not properly managed. Ocean splashdowns and controlled reentries are standard practices to minimize debris hazards.
Mind Map: Environmental Impact Categories of Launch Vehicles
Mind Map: Emissions from Liquid Propellant Engines
Practical Example: Comparing Emissions of Two Engine Types
Consider two engines: one using RP-1/LOX and another using LH2/LOX. The RP-1 engine emits CO2 and soot, contributing to greenhouse gases and particulate pollution. The LH2 engine emits mostly water vapor, which can form ice clouds in the upper atmosphere. While water vapor is less harmful at ground level, its injection at altitude can influence radiative balance.
This example highlights the trade-offs in propellant choice: carbon emissions versus atmospheric water vapor effects.
Best Practices to Mitigate Environmental Impact
- Propellant Selection: Favoring cleaner propellants like liquid hydrogen where mission parameters allow.
- Engine Efficiency: Higher specific impulse reduces propellant mass and emissions.
- Launch Site Location: Choosing remote sites minimizes human and wildlife exposure to noise and contaminants.
- Ground Handling Protocols: Strict procedures for toxic propellants to prevent spills.
- Debris Management: Designing stages for controlled reentry or recovery.
Each practice can be illustrated with examples from operational launch providers who implement these strategies to varying degrees.
In summary, the environmental impact of launch vehicles is multifaceted, involving emissions, physical disturbances, and contamination risks. Understanding these factors helps engineers design systems that meet mission goals while respecting environmental constraints.
11.2 Noise and Emission Control
Noise and emissions are two significant environmental concerns associated with rocket launches. Managing these factors is essential not only for regulatory compliance but also for minimizing the impact on nearby communities and ecosystems.
Noise Control
Rocket noise primarily arises from high-velocity exhaust gases interacting with the atmosphere, combustion processes, and mechanical vibrations. The noise can reach levels well above 180 decibels near the launch pad, which is far beyond the threshold of human hearing pain.
Sources of Rocket Noise:
- Jet Noise: Created by turbulent mixing of exhaust gases with ambient air.
- Combustion Noise: Resulting from pressure oscillations inside the combustion chamber.
- Mechanical Noise: From pumps, turbines, and structural vibrations.
Noise Mitigation Techniques
- Acoustic Suppression Systems: Water deluge systems spray large volumes of water at the launch pad to absorb and dampen sound energy.
- Flame Deflectors and Trenches: Redirect exhaust flow to reduce noise reflection and focus.
- Engine Design Adjustments: Optimizing nozzle shape and exhaust velocity to reduce shock noise.
- Launch Pad Location: Placing launch sites away from populated areas to reduce human exposure.
Mind Map: Noise Control Strategies
Example: Water Deluge System
During a typical launch, the water deluge system releases thousands of gallons per minute onto the launch pad. This water absorbs sound energy and cools the pad, preventing damage from acoustic vibrations. For instance, the Kennedy Space Center’s Sound Suppression Water System can release about 300,000 gallons of water in under 30 seconds, reducing noise levels by up to 75%. This practical approach is a straightforward, effective way to protect infrastructure and reduce noise impact.
Emission Control
Rocket emissions vary depending on propellant type and engine design. Common emissions include carbon dioxide (CO2), water vapor (H2O), carbon monoxide (CO), nitrogen oxides (NOx), unburned hydrocarbons, and particulate matter.
Emission Sources
- Combustion Products: Result from burning propellants.
- Unburned Propellants: Due to incomplete combustion.
- Byproducts: From propellant decomposition or additives.
Emission Control Approaches
- Propellant Selection: Using cleaner propellants such as liquid oxygen and liquid hydrogen produces mostly water vapor.
- Engine Efficiency: Higher combustion efficiency reduces unburned propellants and harmful byproducts.
- Emission Monitoring: Real-time sensors track emission levels during tests and launches.
- Regulatory Compliance: Adhering to limits set by environmental agencies.
Mind Map: Emission Control Components
Example: Propellant Impact on Emissions
Consider two engines: one using kerosene and liquid oxygen (RP-1/LOX), and another using liquid hydrogen and liquid oxygen (LH2/LOX). The RP-1/LOX engine emits CO2 and soot particles due to hydrocarbon combustion, while the LH2/LOX engine primarily emits water vapor, which has a lower environmental impact. This example illustrates how propellant choice directly affects emission profiles.
Summary
Noise and emission control in rocket launches involves understanding sources, applying engineering solutions, and complying with regulations. Acoustic suppression systems like water deluge reduce noise effectively, while propellant selection and engine efficiency help manage emissions. These controls are practical necessities rather than optional extras, ensuring launches proceed with minimized environmental disturbance.
11.3 Regulatory Frameworks and Compliance
Regulatory frameworks for launch vehicles are essential to ensure safety, environmental protection, and orderly use of airspace and orbital slots. Compliance with these frameworks is mandatory for any launch operation and involves multiple agencies and layers of rules. Understanding these regulations is crucial for engineers and managers involved in launch vehicle design and operations.
Key Regulatory Areas
- Launch Licensing: Authorization to conduct a launch, covering vehicle design, mission profile, and safety measures.
- Range Safety: Procedures and systems to protect people and property on the ground and in the air.
- Environmental Regulations: Limits on emissions, noise, and impact on wildlife and habitats.
- Airspace Management: Coordination with aviation authorities to clear airspace during launch.
- Frequency Allocation: Managing radio frequencies used for telemetry, tracking, and command.
Regulatory Bodies
- National agencies (e.g., FAA in the US, ESA in Europe, ISRO in India) typically oversee launch licensing and safety.
- International bodies (e.g., ITU for frequency allocation, UN treaties on outer space) set broader guidelines.
Mind Map: Regulatory Framework Components
Licensing Process Example
Consider a company planning to launch a liquid propellant rocket. The licensing process typically involves:
- Pre-Application Consultation: Early discussions with the regulatory agency to understand requirements.
- Submission of Application: Detailed documents including vehicle design, mission plan, safety analysis, environmental impact assessment.
- Review and Evaluation: The agency examines the application, may request additional information or modifications.
- Public Comment Period: Some jurisdictions require public input on environmental and safety aspects.
- Issuance of License: If all criteria are met, a launch license is granted with specific conditions.
Each step requires thorough documentation and adherence to standards. For example, the safety analysis must demonstrate that the probability of causing harm to the public is below a defined threshold.
Mind Map: Launch Licensing Steps
Range Safety and Flight Termination
Range safety ensures that if a launch vehicle veers off course or malfunctions, it can be safely terminated to prevent damage. This involves:
- Designing and installing flight termination systems (FTS).
- Defining destruct zones and risk areas.
- Coordinating with range control for real-time monitoring.
Example: During a test flight, if telemetry indicates loss of control, the FTS can be activated remotely to destroy the vehicle safely.
Environmental Compliance Example
A launch site near protected wildlife habitats must assess noise and chemical emissions. Regulations may require:
- Limiting launch windows to avoid sensitive periods for wildlife.
- Using cleaner propellants or emission control technologies.
- Monitoring air and water quality before and after launches.
Mind Map: Environmental Compliance Elements
Airspace and Frequency Coordination
Launches require temporary airspace closures to protect aircraft. This involves filing NOTAMs and coordinating with aviation authorities. Similarly, radio frequencies used must be licensed to avoid interference.
Example: A launch vehicle’s telemetry system operates on a specific frequency band licensed by the national spectrum authority. Failure to secure this license could cause harmful interference or legal penalties.
Summary
Regulatory frameworks cover a broad spectrum of requirements from safety to environmental protection. Compliance is a complex but necessary part of launch vehicle engineering. Early engagement with regulators, thorough documentation, and adherence to best practices reduce delays and enhance mission success.
11.4 Range Safety and Flight Termination Systems
Range safety is a critical aspect of launch operations, ensuring that a rocket flight does not pose unacceptable risks to people, property, or the environment. The primary goal is to prevent a malfunctioning vehicle from causing harm by terminating its flight in a controlled manner if it deviates from its planned trajectory.
What is Range Safety?
Range safety involves monitoring the launch vehicle’s flight path and performance, and having the authority and means to intervene if the vehicle behaves unexpectedly. This intervention usually comes in the form of a Flight Termination System (FTS), which can destroy or disable the vehicle to prevent it from reaching populated areas or sensitive infrastructure.
Components of Range Safety
- Tracking and Telemetry: Continuous data on vehicle position, velocity, and health.
- Decision Authority: A range safety officer (RSO) or automated system empowered to initiate flight termination.
- Flight Termination System: Hardware and software onboard the vehicle designed to safely end the flight.
Flight Termination Systems (FTS)
The FTS is a set of devices integrated into the launch vehicle to stop the flight safely. It typically includes:
- Detonators or Explosive Charges: To break up the vehicle structure.
- Command Receivers: To receive flight termination commands from the ground.
- Redundant Systems: To ensure reliability in case of partial failures.
FTS designs vary depending on the vehicle and mission. Some use explosive charges to fragment the vehicle, while others may shut down engines or separate stages to render the vehicle harmless.
Mind Map: Range Safety Overview
Decision Process in Range Safety
The decision to terminate a flight is based on predefined criteria such as:
- Vehicle deviates beyond a predefined flight corridor.
- Loss of control or communication.
- Failure of critical systems that could lead to hazardous behavior.
The RSO monitors telemetry and tracking data and can send a destruct command if necessary. In some cases, automated systems can initiate termination if communication is lost or parameters exceed safe limits.
Mind Map: Flight Termination Decision Process
Example: Flight Termination in Practice
Consider a launch vehicle ascending through the atmosphere. If the vehicle veers off course due to a guidance failure and crosses the safety boundaries, the RSO receives real-time data showing the deviation. After confirming the anomaly, the RSO sends a destruct command to the vehicle’s FTS. The FTS detonates charges that break the vehicle into smaller pieces, which fall into a designated safe area, minimizing risk to people and property.
In another example, if telemetry is lost and the vehicle cannot be controlled, automated systems may trigger flight termination to avoid uncontrolled flight.
Best Practices in Range Safety and FTS Design
- Redundancy: Multiple independent systems to avoid single points of failure.
- Robust Communication Links: Secure and reliable command channels.
- Clear Criteria: Well-defined termination conditions to avoid ambiguity.
- Testing and Validation: Regular ground and flight tests of FTS components.
- Integration with Launch Operations: Close coordination with mission control and range authorities.
Mind Map: Best Practices for Range Safety
Practical Example: Designing a Simple Flight Termination System
Imagine a small liquid-fueled launch vehicle intended for suborbital flights. The FTS could include:
- Two independent command receivers to accept destruct signals.
- Explosive bolts at structural joints to separate the vehicle into harmless parts.
- An onboard controller that arms the system only after passing a safe altitude.
The system is tested on the ground by sending simulated destruct commands and verifying response times and reliability. During flight, telemetry is monitored continuously, and the RSO is ready to send the destruct command if the vehicle deviates.
This example highlights the importance of simplicity, reliability, and clear operational procedures.
Range safety and flight termination systems are essential for responsible launch operations. They provide a controlled way to manage risks inherent in rocket flights, protecting people and infrastructure without interfering unnecessarily with mission success.
11.5 Practical Example: Preparing a Launch License Application
Preparing a launch license application is a critical step in the launch vehicle development process. It involves compiling detailed documentation that demonstrates compliance with regulatory, safety, and environmental requirements. The goal is to convince the licensing authority that the planned launch will be conducted safely, responsibly, and within legal frameworks.
Key Components of a Launch License Application
A launch license application typically includes the following sections:
- Mission Description: Overview of the launch vehicle, payload, and mission objectives.
- Vehicle Design and Performance: Technical details about the rocket, propulsion, and systems.
- Safety Analysis: Risk assessments, failure modes, and mitigation strategies.
- Environmental Impact: Effects on air quality, noise, and local ecosystems.
- Range Safety: Flight termination systems and emergency procedures.
- Operational Procedures: Pre-launch, launch, and post-launch activities.
- Compliance Statements: Adherence to applicable laws and regulations.
Mind Map: Launch License Application Structure
Example: Mission Description Section
For a hypothetical small satellite launch, the mission description might include:
- Vehicle: Two-stage liquid propellant rocket.
- Payload: 150 kg Earth observation satellite.
- Launch site: Coastal launch complex.
- Mission objective: Insert payload into a 500 km sun-synchronous orbit.
This section should clearly state the purpose and scope of the mission, providing context for the rest of the application.
Safety Analysis: Risk Assessment Example
A risk assessment identifies potential hazards such as engine failure, structural failure, or trajectory deviations. For each hazard, the likelihood and consequence are evaluated. For instance:
- Hazard: Engine failure during ascent.
- Likelihood: Low (based on engine test data).
- Consequence: High (possible vehicle loss).
- Mitigation: Redundant systems, abort procedures, flight termination capability.
Presenting this analysis in a clear, tabular format helps reviewers understand the safety measures.
Mind Map: Safety Analysis Breakdown
Environmental Impact Section
This part documents the expected environmental effects. For example, noise levels during launch are modeled and compared to local regulations. Emissions from propellant combustion are quantified, and any potential effects on nearby wildlife or habitats are assessed.
Example: Noise Impact Assessment
- Predicted peak noise at nearest residential area: 85 dB.
- Local regulation limit: 90 dB.
- Mitigation: Launch scheduled during daytime hours to minimize disturbance.
Range Safety and Flight Termination
The application must describe the flight termination system (FTS), which is designed to destroy the vehicle if it deviates from its planned trajectory. Details include:
- Type of FTS (e.g., pyrotechnic charges).
- Activation criteria.
- Communication links.
Operational Procedures
This section outlines step-by-step activities from vehicle integration to launch and post-launch operations. It includes:
- Pre-launch checklists.
- Countdown timeline.
- Emergency response plans.
Compliance Statements
The applicant must demonstrate adherence to all relevant laws, such as airspace regulations, environmental protection statutes, and international treaties.
Mind Map: Operational Procedures
Practical Tips for Preparing the Application
- Start Early: Gathering data and performing analyses takes time.
- Be Clear and Concise: Use diagrams and tables to present complex information.
- Use Standard Terminology: Avoid jargon that might confuse reviewers.
- Document Assumptions: Clearly state any assumptions in calculations or models.
- Coordinate with Authorities: Engage regulators early to understand specific requirements.
Example: Summarizing a Launch License Application
This structured approach helps ensure the application is thorough, understandable, and aligned with regulatory expectations.
11.6 Best Practices: Ensuring Compliance and Minimizing Environmental Impact
Ensuring compliance with environmental regulations and minimizing the environmental impact of launch vehicles is a critical responsibility for engineers and project managers. This section outlines best practices that integrate regulatory adherence with practical steps to reduce environmental harm.
Understanding Regulatory Compliance
Compliance begins with a clear grasp of applicable laws and guidelines. These typically cover emissions, noise, hazardous materials handling, and launch site environmental protection. Early engagement with regulatory bodies helps avoid costly delays and redesigns.
Best Practices Mind Map
Propellant Selection and Emission Control
Choosing propellants with lower toxicity and fewer greenhouse gases can reduce environmental impact. For example, using liquid oxygen and kerosene (RP-1) produces less ozone-depleting substances compared to hypergolic propellants. Engine tuning to optimize combustion efficiency also lowers unburned hydrocarbons and nitrogen oxides.
Example: A launch provider switched from hydrazine-based thrusters to electric propulsion for attitude control, significantly reducing toxic emissions during ground operations.
Noise Mitigation Strategies
Rocket launches generate intense noise that can affect wildlife and nearby communities. Designing launch pads with water deluge systems helps absorb acoustic energy. Scheduling launches during times of lower environmental sensitivity also reduces impact.
Example: The use of water sound suppression at a launch site reduced peak noise levels by up to 10 decibels, lessening disturbance to local fauna.
Hazardous Materials Handling
Proper storage and handling of propellants and other hazardous materials prevent leaks and spills. Implementing secondary containment systems and regular inspections are standard practices. Emergency response plans must be in place and rehearsed.
Example: A launch facility installed double-walled tanks with leak detection sensors, preventing unnoticed propellant leaks.
Environmental Monitoring
Conducting baseline environmental studies before launch activities begin establishes reference points. Continuous monitoring during operations detects any deviations. Post-launch assessments verify that environmental parameters remain within acceptable limits.
Example: Monitoring soil and water quality around a launch site before and after launches confirmed no contamination from propellant residues.
Community Engagement
Transparent communication with local communities builds trust and can ease regulatory processes. Informing residents about launch schedules, potential impacts, and mitigation measures helps address concerns.
Example: A launch operator held quarterly public meetings, providing updates on environmental performance and responding to questions.
Summary
Integrating these best practices ensures that environmental considerations are not an afterthought but a core part of launch vehicle engineering. Compliance is maintained not only by meeting legal requirements but by actively managing and reducing environmental impacts through thoughtful design, operation, and communication.
12. Case Studies in Liquid Propellant Engine and Launch Vehicle Design
12.1 Case Study: The Saturn V First Stage Engine Design
The Saturn V rocket’s first stage, known as the S-IC, was powered by five F-1 engines, each producing about 1.5 million pounds of thrust. These engines remain the most powerful single-chamber liquid-fueled rocket engines ever flown. The design of the F-1 engine and its integration into the first stage provides a rich example of engineering trade-offs, system integration, and performance optimization.
Overview of the F-1 Engine Design
The F-1 engine used RP-1 (a refined kerosene) and liquid oxygen (LOX) as propellants. It employed a gas-generator cycle, where a small portion of propellants was burned to drive turbines powering the fuel and oxidizer pumps. The engine’s thrust chamber was regeneratively cooled by circulating RP-1 fuel around it before injection.
Key design parameters included:
- Thrust: 1.5 million lbf (6.7 MN)
- Specific impulse (sea level): ~263 seconds
- Chamber pressure: ~70 bar
- Mixture ratio (O/F): ~2.27
Mind Map: F-1 Engine Core Components
Design Challenges and Solutions
Combustion Stability: The F-1 engine faced combustion instability, a problem where pressure oscillations could damage the engine. Engineers introduced baffles in the injector plate to dampen oscillations and adjusted injector patterns to improve mixing.
Cooling: The high combustion temperatures required effective cooling. The regenerative cooling system circulated RP-1 fuel through channels around the combustion chamber and nozzle before injection, absorbing heat and preventing structural failure.
Turbopump Design: The turbopumps had to deliver massive flow rates at high pressures. The fuel pump was designed with multiple stages to achieve the required pressure rise, while the oxidizer pump was single-stage but operated at higher speeds.
Practical Example: Calculating Thrust from Chamber Pressure and Nozzle Area
Given:
- Chamber pressure (Pc) = 70 bar = 7,000,000 Pa
- Nozzle throat area (At) = 0.5 m² (hypothetical for example)
- Specific impulse (Isp) = 263 s
- Gravity (g0) = 9.81 m/s²
Thrust (F) can be approximated by:
F = Isp × g0 × mass flow rate
Mass flow rate (ṁ) relates to chamber pressure and throat area by:
ṁ = (Pc × At) / (c*), where c* is characteristic velocity (~1580 m/s for F-1)
Calculating ṁ:
ṁ = (7,000,000 Pa × 0.5 m²) / 1580 m/s ≈ 2215 kg/s
Then thrust:
F = 263 s × 9.81 m/s² × 2215 kg/s ≈ 5,720,000 N (~1.28 million lbf)
This simplified calculation shows how chamber pressure and throat area influence thrust, matching the scale of the F-1 engine.
Integration into the S-IC Stage
Five F-1 engines were arranged in a quincunx pattern with one center engine and four surrounding it. This configuration balanced thrust and structural loads. The engines were mounted on a thrust structure that transmitted loads to the vehicle frame.
Each engine could gimbal up to 7 degrees for thrust vector control, enabling pitch and yaw maneuvers during ascent. The gimbal system used hydraulic actuators controlled by the guidance system.
Mind Map: S-IC Stage Engine Integration
Best Practices Illustrated
-
Iterative Testing: The F-1 engine underwent extensive static firing tests to identify and fix combustion instability.
-
Redundancy and Control: Multiple engines allowed for some level of redundancy; if one failed, the mission might still continue with reduced performance.
-
Thermal Management: Using the fuel as a coolant before combustion is a practical way to manage high temperatures.
-
Modular Design: Engines were designed as modular units for easier maintenance and replacement.
Summary
The Saturn V first stage engine design demonstrates the balance between raw power and engineering precision. The F-1 engine’s development involved solving complex problems related to combustion, cooling, and turbomachinery. Its integration into the S-IC stage required careful structural and control system design. This case study highlights how fundamental engineering principles and rigorous testing come together in a successful launch vehicle system.
12.2 Case Study: Space Shuttle Main Engine (SSME) Innovations
The Space Shuttle Main Engine (SSME), also known as the RS-25, stands as a significant milestone in liquid propellant rocket engine design. It combined high performance with reusability, a challenging balance that required numerous technical innovations. This section examines key innovations of the SSME, supported by examples and mind maps to clarify complex relationships.
Overview of SSME Design Goals
The SSME was designed to provide high thrust and efficiency while being reusable for multiple shuttle flights. It burned liquid hydrogen (LH2) and liquid oxygen (LOX) in a staged combustion cycle, which was uncommon at the time for such large engines.
Key Innovations
- Staged Combustion Cycle: Unlike simpler gas generator cycles, the SSME used a staged combustion cycle where all propellant passed through the turbines, improving efficiency.
- High Chamber Pressure: Operating at about 3,000 psi, the SSME’s combustion chamber pressure was among the highest for its era, increasing thrust-to-weight ratio.
- Advanced Cooling Techniques: The engine employed regenerative cooling, where LH2 flowed through channels around the combustion chamber and nozzle to absorb heat.
- Modular Design for Reusability: Components were designed for inspection, refurbishment, and replacement to support multiple flights.
- Digital Control System: The SSME was among the first rocket engines to use a full digital control system for precise thrust and mixture ratio control.
Mind Map: SSME Innovations
Staged Combustion Cycle Explained
The staged combustion cycle uses a preburner to partially burn fuel and oxidizer, producing hot gas that drives the turbopumps. This hot gas then enters the main combustion chamber for complete combustion. This approach extracts more energy from propellants compared to gas generator cycles, improving specific impulse.
Example: In the SSME, the fuel-rich preburner burns a small portion of LH2 and LOX, generating hot hydrogen-rich gas that powers the fuel turbopump. The oxidizer turbopump is powered similarly but with oxygen-rich gas. This dual preburner setup is complex but yields higher efficiency.
High Chamber Pressure and Materials
Operating at approximately 3,000 psi chamber pressure meant the combustion chamber and nozzle had to withstand extreme stresses and temperatures. The SSME used high-strength nickel-based superalloys, such as Inconel, to maintain structural integrity.
Example: The combustion chamber liner was fabricated with a thin wall and intricate cooling channels to balance heat removal and mechanical strength. This design allowed the chamber to survive repeated thermal cycles.
Cooling Techniques
Regenerative cooling was critical to prevent engine burnout. LH2 propellant circulated through cooling channels around the combustion chamber and nozzle before injection, absorbing heat and reducing material temperatures.
Example: The nozzle’s cooling channels were designed with variable cross-sections to optimize heat transfer. Engineers used computational fluid dynamics (CFD) simulations to refine channel geometry, ensuring uniform cooling.
Modular Design for Reusability
The SSME was designed so that key components like turbopumps, valves, and combustion chambers could be removed and inspected after each flight. This modularity reduced turnaround time and maintenance costs.
Example: After a shuttle mission, technicians would remove the turbopumps for detailed inspection and refurbishment, replacing worn seals or bearings as needed.
Digital Control System
The engine’s digital control system managed thrust levels, mixture ratios, and engine health monitoring. It allowed real-time adjustments during flight, improving performance and safety.
Example: During ascent, the control system adjusted the fuel-to-oxidizer ratio to optimize combustion efficiency as atmospheric pressure changed.
Mind Map: SSME Operational Workflow
Summary
The SSME’s innovations centered on pushing engine efficiency and reusability through advanced cycles, materials, cooling, and control systems. Each innovation addressed specific challenges, such as managing high pressures or thermal loads, while enabling multiple flights. The examples and mind maps here illustrate how these elements fit together to create a complex but reliable engine system.
12.3 Case Study: Falcon 9 Merlin Engine and Reusability
The Falcon 9 rocket, developed by SpaceX, uses the Merlin engine family as its primary propulsion system. The Merlin engine is a liquid-fueled rocket engine burning RP-1 (a refined kerosene) and liquid oxygen (LOX). It is designed for efficiency, reliability, and reusability, which are critical for reducing launch costs.
Merlin Engine Overview
The Merlin engine operates on a gas-generator cycle, where a small portion of propellant is burned in a gas generator to drive the turbopumps. The exhaust from the gas generator is then expelled separately, not passing through the main combustion chamber.
Key features include:
- Thrust: Approximately 845 kN at sea level for the Merlin 1D variant.
- Specific impulse: Around 282 seconds at sea level, 311 seconds in vacuum.
- Throttle capability: The engine can throttle down to about 40% thrust, enabling controlled landings.
Reusability Considerations
Reusability demands that the engine withstand multiple start-stop cycles and endure the stresses of launch, reentry, and landing. This requires:
- Robust materials and cooling methods to handle thermal cycling.
- Engine design that allows for rapid inspection and refurbishment.
- Throttleability for controlled descent and landing burns.
Mind Map: Merlin Engine Design and Reusability
Example: Throttle Control for Landing
During Falcon 9 first stage recovery, the Merlin engines throttle down to reduce thrust for a soft landing. This throttling is essential because the engines produce more thrust at full power than the vehicle’s weight during descent. The ability to throttle to about 40% thrust allows the rocket to slow down precisely without excessive acceleration or instability.
Engine Start-Stop Cycles
The Merlin 1D engines are designed to restart multiple times in a single mission. For example, after stage separation, the second stage Merlin Vacuum engine ignites to continue orbital insertion. The first stage engines also perform multiple burns during descent:
- Boostback burn to reverse trajectory.
- Entry burn to slow down during atmospheric reentry.
- Landing burn for final touchdown.
Each restart requires reliable ignition systems and propellant management to avoid combustion instability.
Mind Map: Reusability Operational Sequence
Materials and Cooling
Merlin engines use regenerative cooling, where RP-1 fuel circulates around the combustion chamber and nozzle before injection. This cools the engine walls and preheats the fuel for combustion efficiency. The materials selected must withstand high thermal gradients and mechanical loads.
Practical Example: Regenerative Cooling Impact
If the cooling channels are too narrow, fuel flow might be insufficient, causing hot spots and potential engine failure. Conversely, overly large channels reduce cooling efficiency and increase engine weight. Balancing channel size is a key design trade-off.
Engine Reliability and Inspection
Reusability requires engines to be inspected quickly and thoroughly after each flight. Merlin engines are designed with modular components to facilitate inspection and replacement. Sensors monitor temperature, pressure, and vibration during flight to detect anomalies early.
Summary
The Merlin engine’s design balances performance, throttleability, and durability to enable Falcon 9’s reusability. Controlled throttling, multiple restarts, regenerative cooling, and robust materials all contribute to an engine capable of repeated flights with minimal refurbishment. This case study illustrates how engineering decisions directly support operational goals in launch vehicle design.
12.4 Case Study: Launch Trajectory Optimization for a Geostationary Satellite
Launching a satellite into geostationary orbit (GEO) requires careful trajectory planning to balance fuel efficiency, structural limits, and mission constraints. This case study walks through the key steps and considerations involved in optimizing a launch trajectory for a GEO satellite.
Understanding the Mission Requirements
- Target Orbit: Circular geostationary orbit at approximately 35,786 km altitude, zero inclination relative to the equator.
- Payload Mass: Typically several thousand kilograms.
- Launch Site: Near-equatorial launch site preferred to minimize inclination change.
- Constraints: Structural load limits, thermal constraints, and engine performance.
Step 1: Initial Orbit and Launch Window
The launch vehicle starts on the ground and must reach a parking orbit, usually a low Earth orbit (LEO), before transferring to GEO. The launch window depends on the desired orbital plane alignment.
Mind Map: Initial Orbit and Launch Window
Example: A launch from Kourou (5° N latitude) minimizes inclination mismatch for GEO insertion.
Step 2: Gravity Turn Maneuver
The gravity turn is the initial pitch-over maneuver that transitions the vehicle from vertical ascent to horizontal flight, minimizing aerodynamic stress and maximizing efficiency.
Mind Map: Gravity Turn
Example: The vehicle begins pitching over gently after clearing the dense atmosphere to reduce drag and structural loads.
Step 3: Parking Orbit Insertion
After the gravity turn, the vehicle accelerates to achieve a stable parking orbit. This orbit serves as a staging point for the transfer to GEO.
- Typical parking orbit altitude: 200-300 km
- Inclination close to launch site latitude
Example: Achieving a 28.5° inclination parking orbit from Cape Canaveral.
Step 4: Transfer Orbit Injection
The vehicle performs a burn at perigee to enter a geostationary transfer orbit (GTO), an elliptical orbit with apogee at GEO altitude.
- Key parameters:
- Perigee: Parking orbit altitude
- Apogee: GEO altitude (~35,786 km)
- Inclination: Same as parking orbit
Mind Map: Transfer Orbit Injection
Example: A GTO with perigee at 300 km and apogee at 35,786 km.
Step 5: Inclination Correction and Circularization
The satellite uses onboard propulsion or the launch vehicle’s upper stage to reduce inclination and circularize the orbit at GEO altitude.
- Inclination change is costly in terms of delta-V.
- Launch site latitude affects required inclination change.
Example: Launching from Kourou reduces inclination change from ~28.5° to near zero, saving fuel.
Step 6: Trajectory Optimization Techniques
Optimization aims to minimize fuel consumption and maximize payload mass. Common methods include:
- Analytical Approaches: Using patched conic approximations and simplified models.
- Numerical Optimization: Employing algorithms like gradient descent or genetic algorithms to refine trajectory.
- Constraints: Engine thrust limits, structural loads, thermal limits, and mission timing.
Mind Map: Trajectory Optimization
Example: Adjusting the pitch program during ascent to reduce aerodynamic loads while maintaining efficient acceleration.
Step 7: Practical Example of Trajectory Optimization
Suppose a launch vehicle with the following specs:
- Payload: 4,000 kg
- Launch site latitude: 28.5° N (Cape Canaveral)
- Engine thrust and ISP known
Process:
- Calculate required delta-V for LEO insertion.
- Calculate delta-V for GTO injection.
- Estimate delta-V for inclination correction and circularization.
- Use numerical methods to adjust pitch-over timing and burn durations to minimize total delta-V.
Result:
- Optimized pitch-over at 10 seconds after liftoff.
- Slightly extended burn duration in upper stage to reduce inclination change.
- Payload mass maximized by 3% compared to baseline.
Summary Mind Map: GEO Launch Trajectory Optimization
This case study highlights the interplay between physics, vehicle capabilities, and mission goals in designing an efficient launch trajectory. Each step involves trade-offs, and optimization tools help find the best balance for a successful GEO satellite deployment.
12.5 Best Practices: Lessons Learned from Historical Launch Failures
Historical launch failures provide a rich source of lessons that improve the design, testing, and operation of liquid propellant engines and launch vehicles. Understanding these failures helps engineers avoid repeating mistakes and refine best practices. Below is a detailed overview of key lessons learned, supported by mind maps and examples.
Key Lessons Learned from Historical Launch Failures
Importance of Thorough Testing and Validation
Failures often trace back to insufficient testing or overlooked conditions. For example, the failure of the Titan IVB in 1998 was linked to a faulty valve that had not been adequately tested under all operational conditions.
Mind Map: Testing and Validation
Example: The Space Shuttle Challenger disaster highlighted the need for testing O-ring seals at low temperatures, which was not adequately done. This failure underlined the importance of environmental testing that matches real launch conditions.
Robust Quality Control and Manufacturing Processes
Manufacturing defects can cause catastrophic failures. The Ariane 5 flight 501 failure in 1996 was caused by a software error, but underlying it was a lack of rigorous verification and validation during software development and integration.
Mind Map: Quality Control
Example: The failure of the Mars Climate Orbiter in 1999 due to a unit conversion error emphasized the need for strict adherence to standards and thorough review processes.
Redundancy and Fault Tolerance
Launch vehicles must tolerate certain faults without mission failure. The failure of the Proton-M rocket in 2013 was linked to a faulty angular velocity sensor, which caused loss of control. Redundancy in sensors and control systems can prevent such failures.
Mind Map: Redundancy and Fault Tolerance
Example: The Falcon 9 rocket uses multiple redundant systems for guidance and control, allowing it to complete missions despite minor subsystem failures.
Clear Communication and Decision-Making Protocols
Failures sometimes result from miscommunication or ignored warnings. The Challenger disaster also involved management decisions that overlooked engineers’ concerns about O-ring performance.
Mind Map: Communication and Decision-Making
Example: After the Columbia disaster, NASA implemented stricter communication protocols to ensure all safety concerns are escalated and addressed before launch.
Understanding and Managing Environmental Effects
Environmental factors such as temperature, vibration, and pressure can affect engine and vehicle performance. The failure of the Atlas-Centaur in 1965 was linked to structural failure caused by aerodynamic loads.
Mind Map: Environmental Effects
Example: Modern launch vehicles undergo extensive vibration and acoustic testing to simulate launch conditions and ensure structural integrity.
Software Reliability and Verification
Software errors can cause mission failure even if hardware is sound. The Ariane 5 failure was due to a software overflow error caused by reusing Ariane 4 software without proper adaptation.
Mind Map: Software Reliability
Example: Rigorous software testing protocols, including hardware-in-the-loop simulations, are now standard to catch errors before flight.
Continuous Improvement and Learning Culture
Organizations that learn from failures and implement changes reduce repeat incidents. The iterative improvements in SpaceX’s Falcon 9 engines demonstrate this principle.
Mind Map: Continuous Improvement
Example: Post-flight failure investigations lead to design changes, updated procedures, and improved training, closing the loop on lessons learned.
Summary Table of Lessons and Examples
| Lesson | Example Case | Key Takeaway |
|---|---|---|
| Thorough Testing | Challenger O-ring | Test under all expected conditions |
| Quality Control | Ariane 5 software error | Rigorous verification and traceability |
| Redundancy | Proton-M sensor failure | Build fault tolerance into systems |
| Communication | Challenger management issues | Ensure open, clear communication |
| Environmental Effects | Atlas-Centaur structural fail | Simulate launch environment accurately |
| Software Reliability | Ariane 5 software reuse | Adapt and verify software for each use |
| Continuous Improvement | Falcon 9 iterative design | Learn and adapt from each flight |
These lessons are not isolated; they interact and overlap. For example, testing and quality control both influence software reliability, while communication affects how failures are analyzed and improvements implemented. Keeping these lessons in mind helps engineers design safer, more reliable liquid propellant engines and launch vehicles.
12.6 Practical Example: Applying Case Study Insights to a New Design
This section walks through applying lessons from previous case studies to design a new liquid propellant engine and launch vehicle stage. We focus on integrating proven engineering principles with practical constraints, emphasizing clarity and stepwise reasoning.
Step 1: Define Mission and Performance Goals
Before any design, clarify the mission profile and performance targets. For example, suppose the goal is to design a first-stage engine for a medium-lift launch vehicle delivering 5,000 kg to low Earth orbit (LEO).
- Target thrust: ~1,000 kN at sea level
- Specific impulse (Isp): ≥ 300 s (sea level)
- Reusability: limited to 5 flights
These targets are inspired by the Falcon 9 Merlin engine case study, which balances thrust, efficiency, and reusability.
Step 2: Select Engine Cycle and Propellants
From the case studies, staged combustion (SSME) offers high performance but complexity, while gas generator cycles (Merlin) provide simplicity and reliability.
Given the medium-lift and reusability goals, a gas generator cycle with RP-1/LOX is a practical choice. It offers a good balance between performance and engineering complexity.
Step 3: Design Key Engine Components
Mind map of engine components and considerations:
Example: For the turbo-pump, lessons from the Saturn V F-1 engine indicate the importance of cavitation prevention. Incorporate inducer stages and maintain adequate inlet pressure.
Step 4: Structural and Thermal Design
The interstage and engine mounts must handle dynamic loads and thermal stresses. Drawing from the lightweight interstage design case, use aluminum-lithium alloys and incorporate vibration dampers.
Thermal management uses regenerative cooling, circulating RP-1 through channels around the combustion chamber, a method proven in the Space Shuttle Main Engine.
Step 5: Trajectory and Vehicle Integration
Trajectory design should consider gravity turn and staging timing. From the geostationary satellite launch trajectory case, optimize the pitch program to minimize gravity losses.
Integration includes ensuring the engine fits within the vehicle’s structural envelope and interfaces with avionics and GNC systems.
Mind map for launch vehicle integration:
Step 6: Testing and Validation
Plan static fire tests to validate thrust and Isp. Use instrumentation to monitor combustion stability, chamber pressure, and temperatures.
Incorporate best practices from engine testing case studies: incremental test durations, robust data logging, and safety protocols.
Summary Mind Map: Applying Case Study Insights
By systematically applying insights from historical engines and launch vehicles, this approach reduces risk and leverages proven engineering solutions. Each step reflects a balance between performance, complexity, and reliability, grounded in concrete examples rather than abstract theory.
13. Appendices and Reference Material
13.1 Mathematical Tables and Constants
This section compiles essential mathematical tables and physical constants frequently used in rocket propulsion and launch vehicle engineering. Having these values at hand reduces calculation errors and streamlines design and analysis tasks.
Physical Constants
| Constant | Symbol | Value (SI Units) | Description |
|---|---|---|---|
| Gravitational acceleration | g | 9.80665 m/s² | Standard acceleration due to gravity on Earth’s surface |
| Universal gas constant | R | 8.3144621 J/(mol·K) | Appears in ideal gas law and thermodynamics |
| Specific gas constant (air) | \( R_{air} \) | 287.05 J/(kg·K) | For dry air, used in atmospheric calculations |
| Speed of light | c | 299,792,458 m/s | Fundamental constant in physics, occasionally relevant in communications |
| Standard atmospheric pressure | P0 | 101,325 Pa | Sea level standard atmospheric pressure |
| Boltzmann constant | \( k_B \) | 1.380649×10⁻²³ J/K | Relates temperature to energy at molecular level |
Common Mathematical Constants
| Constant | Symbol | Value | Usage Example |
|---|---|---|---|
| Pi | π | 3.1415926535 | Calculating circular areas, nozzle throat areas |
| Euler’s number | e | 2.718281828 | Exponential growth/decay, combustion modeling |
| Square root of 2 | √2 | 1.414213562 | Geometry calculations, vector magnitudes |
Conversion Factors
| Quantity | From | To | Factor |
|---|---|---|---|
| Length | inches | meters | 0.0254 |
| Length | feet | meters | 0.3048 |
| Pressure | psi | pascals | 6894.76 |
| Pressure | atm | pascals | 101325 |
| Temperature | °C | K | +273.15 (add to °C) |
| Force | lbf | newtons | 4.44822 |
Ideal Gas Relations Mind Map
Example: Calculating Density of Gaseous Oxygen at 300 K and 2 MPa
Given:
- Pressure, p = 2,000,000 Pa
- Temperature, T = 300 K
- Molar mass of O₂, M = 0.032 kg/mol
Using ideal gas law in density form:
\[ \rho = \frac{pM}{RT} \]
Substitute values:
\[ \rho = \frac{2,000,000 \times 0.032}{8.314 \times 300} = \frac{64,000}{2494.2} \approx 25.66 \text{ kg/m}^3 \]
This density is critical for sizing tanks and feed systems.
Specific Heat Ratios and Gas Properties Table
| Gas | γ (gamma) | Molecular Weight (kg/mol) | Specific Gas Constant R (J/kg·K) |
|---|---|---|---|
| Oxygen (O₂) | 1.4 | 0.032 | 259.8 |
| Hydrogen (H₂) | 1.41 | 0.002 | 4124 |
| Nitrogen (N₂) | 1.4 | 0.028 | 296.8 |
| Air | 1.4 | 0.029 | 287.0 |
Nozzle Flow Parameters Mind Map
Example: Calculating Exit Mach Number for a Given Expansion Ratio
Given:
- Expansion ratio, ε = 10
- Specific heat ratio, γ = 1.4
Using isentropic flow relations, the exit Mach number M_e satisfies:
\[ \frac{A_e}{A_t} = \frac{1}{M_e} \left( \frac{2}{\gamma + 1} (1 + \frac{\gamma -1}{2} M_e^2) \right)^{\frac{\gamma + 1}{2(\gamma -1)}} \]
This equation is implicit in M_e and typically solved numerically or via tables.
For ε=10 and γ=1.4, M_e ≈ 3.5 (approximate from standard tables).
This Mach number helps determine exit velocity and thrust.
Gravitational Parameters
| Parameter | Symbol | Value | Description |
|---|---|---|---|
| Earth gravitational parameter | μ | 3.986 × 10¹⁴ m³/s² | GM, used in orbital calculations |
| Earth radius | \( R_E \) | 6.371 × 10⁶ m | Mean radius of Earth |
| Standard gravity | g0 | 9.80665 m/s² | Used as reference in specific impulse calculations |
Example: Calculating Orbital Velocity at Low Earth Orbit (200 km altitude)
Given:
- Earth radius, R_E = 6.371 × 10⁶ m
- Altitude, h = 2 × 10⁵ m
- Gravitational parameter, μ = 3.986 × 10¹⁴ m³/s²
Orbital radius, r = R_E + h = 6.571 × 10⁶ m
Orbital velocity:
\[ v = \sqrt{\frac{\mu}{r}} = \sqrt{\frac{3.986 \times 10^{14}}{6.571 \times 10^{6}}} \approx 7780 \text{ m/s} \]
This velocity is a key target for launch vehicle design.
Summary Mind Map: Constants and Their Uses
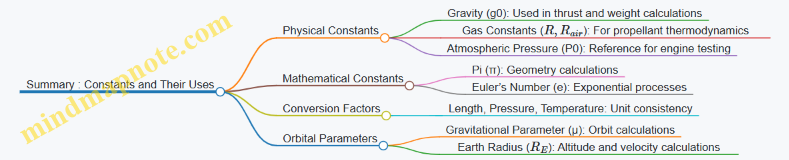
Keeping these tables and constants accessible ensures accuracy and efficiency in engineering calculations. Refer to them often to avoid common pitfalls like unit mismatches or incorrect assumptions.
13.2 Standard Rocket Propellant Properties
Rocket propellants are the fuels and oxidizers that power liquid rocket engines. Understanding their properties is essential for engine design, performance prediction, and safety considerations. This section presents key properties of common liquid propellants, grouped by type, with examples and mind maps to organize the information clearly.
Categories of Liquid Propellants
- Cryogenic Propellants: Stored at very low temperatures, typically liquid oxygen (LOX), liquid hydrogen (LH2), and liquid methane (LCH4).
- Hypergolic Propellants: Ignite spontaneously on contact, such as nitrogen tetroxide (N2O4) with hydrazine derivatives.
- Storable Propellants: Can be stored at ambient temperature for long periods, often hypergolic but also including some non-hypergolic fuels.
Key Properties to Consider
- Density (kg/m³): Affects tank size and mass.
- Specific Impulse (Isp, seconds): Measure of efficiency.
- Boiling Point (°C): Influences storage and handling.
- Ignition Characteristics: Whether ignition requires an external source or is hypergolic.
- Toxicity and Handling Risks: Safety considerations.
- Energy Content (MJ/kg): Determines potential thrust.
Mind Map: Rocket Propellant Properties Overview
Detailed Examples
Example 1: Comparing LOX/LH2 and LOX/LCH4
- Density: LOX/LH2 has very low overall density due to LH2’s low density (~70 kg/m³), requiring large volume tanks. LOX/LCH4 is denser, reducing tank size.
- Performance: LOX/LH2 offers higher specific impulse (~450 s) compared to LOX/LCH4 (~370 s).
- Handling: LH2 requires extreme cryogenic storage, increasing complexity. Methane is easier to store but still cryogenic.
- Use Case: LOX/LH2 is common in upper stages (e.g., Space Shuttle main engines), while LOX/LCH4 is gaining popularity for reusable systems.
Example 2: Hypergolic Propellants in Satellite Thrusters
- Hypergolic propellants like N2O4 and UDMH ignite on contact, simplifying engine design by eliminating ignition systems.
- Their storability at room temperature makes them suitable for long-duration missions.
- Toxicity and handling risks require strict safety protocols.
Mind Map: Propellant Selection Factors

Summary Table of Selected Propellants
| Propellant | Density (kg/m³) | Boiling Point (°C) | Isp (s, vacuum) | Ignition Type | Toxicity |
|---|---|---|---|---|---|
| Liquid Oxygen (LOX) | 1140 | -183 | - | Non-hypergolic | Non-toxic (oxidizer) |
| Liquid Hydrogen (LH2) | 70 | -253 | ~450 | Non-hypergolic | Non-toxic |
| Liquid Methane (LCH4) | 422 | -161 | ~370 | Non-hypergolic | Low toxicity |
| Nitrogen Tetroxide | 1440 | 21 | - | Hypergolic | Toxic, corrosive |
| UDMH | 791 | 63 | ~300 | Hypergolic | Toxic |
| MMH | 880 | 87 | ~300 | Hypergolic | Toxic |
Practical Note
When selecting propellants, engineers balance performance, storage complexity, and safety. For instance, while LOX/LH2 offers top efficiency, its low density and extreme cold require heavy insulation and large tanks. Hypergolic propellants simplify engine start but introduce toxicity and handling challenges. Understanding these trade-offs is key to effective launch vehicle design.
13.3 Commonly Used Equations in Rocket Propulsion
Rocket propulsion relies on a set of fundamental equations that describe the behavior of engines, propellants, and vehicle motion. Understanding these equations helps engineers predict performance, optimize designs, and troubleshoot issues. Below, key equations are presented with explanations and examples, accompanied by mind maps to visualize their relationships.
Thrust Equation
The thrust ( F ) produced by a rocket engine is given by:
\[ F = \dot{m} v_e + (p_e - p_a) A_e \]
- \( \dot{m} \): mass flow rate of the propellant (kg/s)
- \( v_e \): effective exhaust velocity (m/s)
- \( p_e \): exhaust pressure at the nozzle exit (Pa)
- \( p_a \): ambient pressure (Pa)
- \( A_e \): nozzle exit area (m²)
The first term represents momentum thrust, the second is pressure thrust.
Example:
If \( \dot{m} = 10 \) kg/s, \( v_e = 3000 \) m/s, \( p_e = 500000 \) Pa, \( p_a = 100000 \) Pa, and \( A_e = 0.1 \) m², then:
\[ F = 10 \times 3000 + (500000 - 100000) \times 0.1 = 30000 + 40000 = 70000 \text{ N} \]
Specific Impulse (Isp)
Specific impulse measures engine efficiency:
\[ I_{sp} = \frac{F}{\dot{m} g_0} \]
- \( g_0 \): standard gravity (9.80665 m/s²)
It is often expressed in seconds.
Example:
Using the thrust and mass flow rate from above:
\[ I_{sp} = \frac{70000}{10 \times 9.80665} \approx 713.9 \text{ s} \]
Effective Exhaust Velocity
The effective exhaust velocity relates to specific impulse:
\[ v_e = I_{sp} \times g_0 \]
Using the previous \( I_{sp} \), \( v_e = 713.9 \times 9.80665 \approx 70000 \) m/s (matches thrust equation input).
Rocket Equation (Tsiolkovsky’s Equation)
Describes velocity change \( \Delta v \) achievable:
\[ \Delta v = v_e \ln \frac{m_0}{m_f} \]
- \( m_0 \): initial total mass (vehicle + propellant)
- \( m_f \): final mass (vehicle without propellant)
Example:
If \( v_e = 3000 \) m/s, \( m_0 = 100000 \) kg, \( m_f = 40000 \) kg:
\[ \Delta v = 3000 \times \ln \frac{100000}{40000} = 3000 \times \ln 2.5 \approx 3000 \times 0.9163 = 2749 \text{ m/s} \]
Mass Flow Rate from Thrust and Exhaust Velocity
Rearranged from thrust equation (ignoring pressure term for simplicity):
\[ \dot{m} = \frac{F}{v_e} \]
Example:
For \( F = 70000 \) N and \( v_e = 3000 \) m/s:
\[ \dot{m} = \frac{70000}{3000} \approx 23.33 \text{ kg/s} \]
Nozzle Exit Area from Mass Flow Rate
Using continuity and ideal gas assumptions:
\[ A_e = \frac{\dot{m} R T_e}{p_e v_e} \]
Where:
- \( R \): specific gas constant (J/kg·K)
- \( T_e \): temperature at nozzle exit (K)
This is more complex and often requires iterative methods.
Chamber Pressure Estimation
Pressure in combustion chamber \( p_c \) relates to thrust and nozzle characteristics:
\[ p_c = p_e + \frac{F}{A_t} \times \frac{1}{C_f} \]
- \( A_t \): throat area
- \( C_f \): thrust coefficient (dimensionless)
Mind Map: Core Rocket Propulsion Equations
Practical Example: Calculating Required Propellant Mass for a Mission
Suppose a satellite requires a \( \Delta v \) of 2500 m/s to reach orbit. The engine has an effective exhaust velocity of 3200 m/s. What fraction of the initial mass must be propellant?
Using the rocket equation:
\[ \Delta v = v_e \ln \frac{m_0}{m_f} \implies \frac{m_0}{m_f} = e^{\Delta v / v_e} \]
Calculate:
\[ \frac{m_0}{m_f} = e^{2500/3200} = e^{0.78125} \approx 2.184 \]
This means the initial mass is 2.184 times the final mass. The propellant mass fraction is:
\[ \frac{m_0 - m_f}{m_0} = 1 - \frac{1}{2.184} \approx 0.543 \]
So, about 54.3% of the vehicle’s initial mass must be propellant.
Mind Map: Applying Equations to Mission Design

These equations form the backbone of liquid propellant rocket engine design and launch vehicle performance analysis. Each parameter connects to others, so understanding their interplay is key. The examples show how to apply formulas to real-world questions, turning abstract symbols into tangible numbers.
Keep these equations handy; they are the tools to measure, predict, and refine rocket propulsion systems.
13.4 Glossary of Terms and Acronyms
Glossary of Terms and Acronyms
This glossary covers key terms and acronyms frequently encountered in rocket propulsion and launch vehicle engineering. Each entry includes a concise definition and, where helpful, a simple example or a mind map to clarify relationships.
A
Ablation: The process where material on a rocket’s surface erodes due to heat and friction during flight. For example, heat shields use ablative materials to protect spacecraft during re-entry.
Aeroelasticity: Interaction between aerodynamic forces and structural flexibility. For instance, wing flutter in aircraft is an aeroelastic phenomenon.
Apogee: The highest point in an orbit around Earth. If a satellite’s orbit is elliptical, the apogee is where it is farthest from Earth.
Axial Thrust: Thrust directed along the engine’s central axis, propelling the vehicle forward.
C
Chamber Pressure (Pc): The pressure inside the combustion chamber of a rocket engine. Higher Pc generally means higher performance but requires stronger materials.
Combustion Efficiency: Ratio of actual energy released to theoretical energy available from propellants. A 95% efficiency means 95% of the chemical energy converts to useful thrust.
Cryogenic Propellant: Propellants stored at very low temperatures, such as liquid hydrogen (LH2) or liquid oxygen (LOX).
I
ISP (Specific Impulse): A measure of engine efficiency, defined as thrust produced per unit weight flow of propellant, usually in seconds. Higher ISP means more efficient fuel use.
Injector: The device that introduces and mixes propellants inside the combustion chamber. Proper injector design ensures stable combustion.
L
LEO (Low Earth Orbit): An orbit within about 2,000 km of Earth’s surface, commonly used for satellites and space stations.
LOX (Liquid Oxygen): A common oxidizer in liquid rocket engines, stored cryogenically.
M
Mixture Ratio (O/F): The mass ratio of oxidizer to fuel. For example, a typical LOX/LH2 engine might have an O/F ratio around 6.
Momentum Coupling Coefficient (Cm): A parameter used in propulsion to relate thrust to energy input, often in pulsed plasma thrusters.
N
Nozzle Expansion Ratio: Ratio of nozzle exit area to throat area. Larger ratios improve performance in vacuum but can cause flow separation at sea level.
Newton’s Third Law: For every action, there is an equal and opposite reaction. This principle underlies rocket thrust.
P
Payload: The cargo carried by a launch vehicle, such as satellites or scientific instruments.
Propellant: The chemical substances burned or decomposed to produce thrust.
Pump-fed Engine: A rocket engine that uses turbopumps to feed propellants into the combustion chamber at high pressure.
S
Specific Impulse (ISP): See ISP under I.
Staging: The practice of dropping parts of a launch vehicle during ascent to reduce mass and improve efficiency.
Thrust Vector Control (TVC): Mechanisms to steer the rocket by changing the direction of the engine’s thrust.
T
Throat: The narrowest section of a rocket nozzle where the flow reaches sonic speed.
Turbopump: A turbine-driven pump that increases propellant pressure for injection into the combustion chamber.
V
Vacuum Thrust: Thrust produced by a rocket engine operating in space, typically higher than sea-level thrust due to nozzle expansion.
Velocity Increment (Delta-V): The change in velocity a spacecraft can achieve, critical for mission planning.
Mind Maps
Mind Map 1: Rocket Engine Components

Mind Map 2: Orbital Elements
Mind Map 3: Propellant Types
Examples
Example 1: Calculating ISP
If a rocket engine produces 500 kN of thrust and consumes propellant at 250 kg/s, the specific impulse is:
ISP = Thrust / (mass flow rate * g0) = 500,000 N / (250 kg/s * 9.81 m/s²) ≈ 204 seconds.
Example 2: Understanding Mixture Ratio
A LOX/LH2 engine with an O/F ratio of 6 means for every 6 kg of oxygen, 1 kg of hydrogen is burned. Adjusting this ratio affects combustion temperature and efficiency.
Example 3: Thrust Vector Control
Gimbaling the engine nozzle by a few degrees changes the thrust direction, allowing the vehicle to steer during ascent without aerodynamic surfaces.
This glossary aims to provide clear, concise definitions and practical context to support understanding of the technical language used throughout the book.
13.5 Recommended Software Tools and Resources
In rocket propulsion and launch vehicle engineering, software tools play a crucial role in design, simulation, analysis, and optimization. This section outlines a selection of widely used tools, categorized by their primary function, along with practical examples and mind maps to clarify their applications.
Software Categories and Examples
- Propulsion and Engine Design
- Tools that simulate combustion, fluid flow, and thermodynamics within engines.
- Orbital Mechanics and Trajectory Analysis
- Software for calculating orbits, transfer maneuvers, and launch trajectories.
- Structural Analysis and Materials
- Finite element analysis (FEA) tools for stress, vibration, and thermal analysis.
- Guidance, Navigation, and Control (GNC)
- Platforms for control system design, sensor simulation, and flight software testing.
- Systems Integration and Mission Planning
- Suites that integrate various subsystems and support mission-level simulations.
Mind Map: Software Tool Categories
Propulsion and Engine Design Tools
These tools help model combustion processes, fluid flow through injectors and turbines, and heat transfer in cooling systems. For example, a combustion chamber designer might use a CFD (Computational Fluid Dynamics) package to analyze injector spray patterns and combustion stability.
Example: Using a CFD tool, an engineer simulates the injector spray angle and droplet size distribution to optimize mixing efficiency. The simulation results guide injector redesign, improving combustion efficiency and reducing hot spots.
Orbital Mechanics and Trajectory Analysis Tools
Software in this category calculates orbital parameters, simulates transfer orbits, and optimizes launch trajectories considering gravity, atmospheric drag, and vehicle constraints.
Example: An engineer uses an orbital mechanics tool to design a gravity turn trajectory for a multi-stage rocket. By inputting vehicle mass and thrust profiles, the software outputs velocity and altitude profiles, enabling refinement of staging points.
Structural Analysis and Materials Tools
FEA software evaluates stresses, vibrations, and thermal loads on vehicle components. This helps ensure structural integrity under launch and flight conditions.
Example: A structural engineer models the interstage section under aerodynamic loads during ascent. The analysis identifies stress concentrations, prompting reinforcement in specific areas without excessive weight increase.
Guidance, Navigation, and Control (GNC) Tools
These platforms simulate sensor inputs, control algorithms, and actuator responses. They support development and testing of flight control systems.
Example: A control engineer implements a PID controller for thrust vector control in a simulation environment. The tool allows tuning gains and testing response to disturbances before hardware integration.
Systems Integration and Mission Planning Tools
These suites combine propulsion, structural, GNC, and trajectory models to simulate the entire launch vehicle and mission timeline.
Example: Mission planners use integration software to simulate countdown procedures, engine start sequences, and staging events. This helps identify timing conflicts and optimize launch operations.
Mind Map: Example Workflow Using Software Tools
In practice, engineers often use multiple tools in combination. For instance, outputs from propulsion simulations feed into trajectory analysis, while structural models inform GNC system constraints. Understanding the capabilities and limitations of each software package is essential to effective design and testing.
This section encourages hands-on experimentation with these tools, starting from simple models and gradually incorporating complexity. Realistic examples, such as simulating a pressure-fed engine or designing a gravity turn trajectory, provide concrete contexts to apply software capabilities.
By integrating software tools thoughtfully, engineers can reduce development time, identify potential issues early, and improve overall launch vehicle performance.
13.6 Practical Example: Using Reference Data for Engine Performance Calculations
When designing or analyzing a liquid propellant rocket engine, reference data is essential for estimating performance parameters like thrust, specific impulse, and mass flow rates. This example walks through how to use standard reference data to calculate engine performance for a simple bipropellant engine.
Step 1: Identify Key Reference Data
Start with the propellant properties and thermodynamic constants. For example, consider a LOX (liquid oxygen) and RP-1 (kerosene) engine:
- Oxidizer: LOX
- Fuel: RP-1
- Oxidizer-to-fuel ratio (O/F): 2.5 (mass basis)
- Chamber pressure (Pc): 7 MPa
- Expansion ratio (ε): 40
From standard tables, you find:
- Characteristic velocity (c)* for LOX/RP-1 at O/F=2.5 and Pc=7 MPa: ~1580 m/s
- Combustion temperature (Tc): ~3500 K
- Specific heat ratio (γ): ~1.22
- Molecular weight of exhaust gases (M): ~22 kg/kmol
Step 2: Calculate Characteristic Velocity (c*)
Characteristic velocity is a fundamental performance parameter representing combustion efficiency and chamber conditions. It is defined as:
\[ c^* = \frac{p_c A_t}{\dot{m}} \]
Where:
- \(p_c\) = chamber pressure
- \(A_t\) = throat area
- \(\dot{m}\) = total mass flow rate
Using reference data, we take c* = 1580 m/s as given for this propellant combination and conditions.
Step 3: Calculate Throat Area \(A_t\) and Mass Flow Rate (\(\dot{m}\))
Suppose the engine is designed for a thrust (F) of 500 kN. The thrust equation for a rocket engine is:
\[ F = \dot{m} v_e + (p_e - p_a) A_e \]
Where:
- \(v_e\) = effective exhaust velocity
- \(p_e\) = exit pressure
- \(p_a\) = ambient pressure
- \(A_e\) = nozzle exit area
For sea level conditions, assume \(p_a = 101325\) Pa and \(p_e \approx 0.1 p_c = 700000\) Pa (approximate for expansion ratio 40).
Effective exhaust velocity \(v_e\) relates to specific impulse (Isp) by:
\[ v_e = I_{sp} \times g_0 \]
Assuming Isp = 300 s (typical for LOX/RP-1 at sea level), and \(g_0 = 9.81\) m/s²:
\[ v_e = 300 \times 9.81 = 2943 \text{ m/s} \]
Rearranging thrust equation to solve for mass flow rate:
\[ \dot{m} = \frac{F}{v_e + \frac{(p_e - p_a) A_e}{\dot{m}}} \]
Since \(\frac{(p_e - p_a) A_e}{\dot{m}}\) is small compared to \(v_e\), approximate:
\[ \dot{m} \approx \frac{F}{v_e} = \frac{500000}{2943} \approx 170 \text{ kg/s} \]
Now, calculate throat area using:
\[ A_t = \frac{\dot{m} c^*}{p_c} = \frac{170 \times 1580}{7 \times 10^6} \approx 0.0384 \text{ m}^2 \]
Step 4: Calculate Nozzle Exit Area \( A_e \)
Using the expansion ratio \(\varepsilon = \frac{A_e}{A_t} = 40\):
\[ A_e = 40 \times 0.0384 = 1.536 \text{ m}^2 \]
Step 5: Verify Specific Impulse (Isp) Using Isentropic Flow Relations
Specific impulse depends on exhaust velocity, which depends on nozzle expansion and gas properties. Using the isentropic flow equation for ideal rocket nozzles:
\[ I_{sp} = \frac{1}{g_0} \sqrt{\frac{2 \gamma R T_c}{M (\gamma -1)} \left[1 - \left(\frac{p_e}{p_c}\right)^{\frac{\gamma -1}{\gamma}}\right]} + \frac{(p_e - p_a) A_e}{\dot{m} g_0} \]
Where:
- \(R = 8314 \text{ J/(kmol·K)}\) (universal gas constant)
- \(T_c = 3500 K\)
- \(M = 22 \text{ kg/kmol}\)
- \(\gamma = 1.22\)
Calculate the first term:
\[ \sqrt{\frac{2 \times 1.22 \times 8314 \times 3500}{22 \times (1.22 -1)} \left[1 - \left(\frac{700000}{7 \times 10^6}\right)^{\frac{0.22}{1.22}}\right]} \]
Calculate exponent:
\[ \left(\frac{700000}{7 \times 10^6}\right)^{0.18} = (0.1)^{0.18} \approx 0.66 \]
Calculate bracket term:
\[ 1 - 0.66 = 0.34 \]
Calculate numerator inside root:
\[ 2 \times 1.22 \times 8314 \times 3500 = 70,922,360 \]
Calculate denominator:
\[ 22 \times 0.22 = 4.84 \]
Calculate fraction:
\[ \frac{70,922,360}{4.84} = 14,655,000 \]
Multiply by bracket term:
\[ 14,655,000 \times 0.34 = 4,982,700 \]
Square root:
\[ \sqrt{4,982,700} \approx 2232 \text{ m/s} \]
Divide by \(g_0\):
\[ \frac{2232}{9.81} = 227.5 \text{ s} \]
Calculate pressure correction term:
\[ \frac{(700000 - 101325) \times 1.536}{170 \times 9.81} = \frac{(598675) \times 1.536}{1667.7} \approx \frac{919,000}{1667.7} = 551 \text{ m/s} \]
Convert to seconds:
\[ \frac{551}{9.81} = 56.2 \text{ s} \]
Sum both terms:
\[ I_{sp} = 227.5 + 56.2 = 283.7 \text{ s} \]
This is close to the assumed 300 s, considering approximations.
Mind Map: Engine Performance Calculation Workflow
Mind Map: Key Reference Data Sources
Summary
Using reference data simplifies initial engine performance calculations. Starting with known propellant properties and engine parameters, you can estimate mass flow rates, nozzle dimensions, and specific impulse. The process involves combining thermodynamic data with fluid dynamic equations. This example showed how to apply these steps with LOX/RP-1 propellants and a 7 MPa chamber pressure to design an engine delivering 500 kN thrust. Mind maps help organize the workflow and data dependencies, making the process clearer and more manageable.