The Hydrogen Aviation Era
1. Foundations of Hydrogen for Aviation
1.1 Hydrogen Properties Relevant to Aircraft Systems
Hydrogen behaves like a “small molecule with big consequences.” For aircraft systems, its key properties determine how you store it, move it through plumbing, detect leaks, and manage safety. The goal is not memorizing numbers; it’s connecting each property to a design decision.
Core Physical Properties That Drive Design
Density and Energy per Volume
Hydrogen has low density as a gas, so storing it as a compressed gas requires large tanks and creates high pressure loads. Liquid hydrogen increases usable density dramatically, but introduces cryogenic engineering and boil-off management. For system sizing, engineers track both gravimetric energy (per kilogram) and volumetric energy (per liter), because aircraft volume is often the limiting factor.
Example: If two storage options provide the same total energy, the one with lower volumetric energy forces larger tank volume. That can cascade into wing or fuselage packaging changes and affect center-of-gravity limits.
Molecular Weight and Diffusion
Hydrogen’s small molecular size makes it diffuse quickly compared with many other gases. This matters for leak detection and ventilation: a tiny leak can spread into areas you didn’t expect, especially in enclosed compartments.
Example: A seal that would be “good enough” for a heavier gas may still allow hydrogen to reach an ignition-relevant location before sensors and ventilation can respond.
Flammability Range and Ignition Sensitivity
Hydrogen can form flammable mixtures across a wide concentration range in air, and it has low ignition energy. That combination means you design to prevent both accumulation and ignition sources near potential leak paths.
Example: A vent outlet that is safe for a less flammable gas might still require strict placement and interlocks for hydrogen because the mixture can ignite more easily.
Thermal Conductivity and Heat Transfer
Hydrogen conducts heat well. In cryogenic systems, this affects cooldown behavior, heat exchanger performance, and how quickly temperatures equalize after valve operations.
Example: During a controlled cooldown, a component that warms or cools faster than expected can create thermal gradients. Those gradients can stress materials and seals.
Chemical and Material Interaction Properties
Reactivity and Oxidation
Hydrogen itself is not “corrosive” in the way some chemicals are, but it can accelerate degradation mechanisms indirectly. In the presence of oxygen, it forms water; in the presence of contaminants, it can create conditions that harm catalysts, seals, or metal surfaces.
Example: A small amount of moisture in a fuel cell system can change water management and affect stack performance. In a cryogenic tank, contaminants can also influence thermal behavior and valve reliability.
Hydrogen Embrittlement Risk
Hydrogen can enter metals and weaken them, especially under stress and cycling. This is why material selection and heat treatment matter, and why welds and high-stress regions get extra attention.
Example: Two tanks made from different alloys may pass pressure tests, but only one survives repeated thermal cycles without cracking at weld-adjacent zones.
Thermodynamic Properties for Cryogenic Flight Systems
Boiling, Vapor Pressure, and Boil-Off
Liquid hydrogen boils at cryogenic temperatures. Its vapor pressure rises with temperature, so heat leak directly increases pressure and boil-off rate. That links insulation quality to tank pressure management and venting strategy.
Example: If insulation performance degrades, boil-off increases. Higher boil-off can force more frequent venting or change operating pressure margins.
Phase Change and Two-Phase Flow
Hydrogen systems often experience two-phase behavior: liquid, vapor, and sometimes stratification. Two-phase flow complicates valve control, fuel metering, and sensor interpretation.
Example: A level sensor might read “full” while the outlet line still contains vapor pockets, causing engine fuel starvation or unstable flow.
Operational Properties for Detection and Control
Permeation and Seal Behavior
Even when a system is sealed, hydrogen can permeate through some elastomers and thin materials. Permeation is slow but persistent, so it affects long-duration ground holds and maintenance intervals.
Example: A component that seems leak-tight during short tests may still contribute to gradual hydrogen accumulation over hours.
Compatibility with Sensors and Instrumentation
Hydrogen detection systems rely on sensor chemistry and placement. Because hydrogen diffuses quickly, sensor location and airflow patterns determine whether the sensor sees the mixture early enough.
Example: Mounting a sensor where stagnant air forms can delay detection, even if the sensor itself is accurate.
Mind Map: Hydrogen Properties to Aircraft System Impacts
Practical Integration Check
When you review a hydrogen aircraft subsystem, ask four property-driven questions: What storage form is used, what heat leak and phase behavior follow, how quickly hydrogen can reach detection or ignition-relevant zones, and which materials are exposed to stress plus hydrogen. If those answers are consistent, the rest of the design usually stops being a guessing game and starts being engineering.
1.2 Energy Accounting for Fuel Cells and Combustion Engines
Energy accounting answers a simple question: where does the chemical energy of hydrogen go, and how much becomes useful work? The trick is to define “useful” consistently for both fuel cells and combustion engines, then track losses with the same bookkeeping rules.
Core Accounting Framework
Start with hydrogen’s lower heating value (LHV) as the baseline for aircraft fuel comparisons. LHV counts energy that would otherwise leave as water vapor in exhaust. For a fuel cell, the electrical output is the primary useful product. For a combustion engine, useful output is shaft power, which may later be converted to electricity by a generator.
A practical accounting chain looks like this:
- Fuel energy in: \(E_{fuel} = m_{H2} \cdot LHV\).
- Conversion stage: fuel cell or engine turns fuel energy into an intermediate form.
- Useful output: electricity or shaft work.
- Losses: heat rejected, incomplete conversion, auxiliary loads, and inefficiencies in conditioning systems.
Define efficiencies so they match the stage. For a fuel cell, use \(\eta_{FC} = P_{elec}/\dot{m}*{H2}LHV\). For an engine, use \(\eta*{eng} = P_{shaft}/\dot{m}_{H2}LHV\). Then include system-level effects: pumps, compressors, cooling, and controls.
Mind Map: Energy Flows and Loss Buckets
Fuel Cell Energy Accounting
A fuel cell’s electrical efficiency is not constant; it depends on operating voltage. The cell voltage drops from its ideal value due to three main loss mechanisms: activation losses at low current, ohmic losses through membranes and conductors, and concentration losses at high reactant utilization.
A clean way to account for this is to compute power from measured electrical variables: \(P_{elec} = V \cdot I\). Then compare to fuel energy in using the measured hydrogen flow rate. If you also measure stack temperature and coolant flow, you can estimate heat rejected: \(P_{heat} \approx \dot{m}*{coolant} c_p \Delta T\). This lets you check closure: \(P*{elec} + P_{heat} + P_{other} \approx \dot{m}_{H2}LHV\). “Other” includes small parasitics and measurement uncertainty.
Example: Suppose a fuel cell draws 0.8 kg/h of hydrogen. With LHV about 120 MJ/kg, fuel energy is 96 MJ/h, or 26.7 kW. If the stack produces 18 kW electrical, then \(\eta_{FC} \approx 18/26.7 = 0.67\). If coolant measurements show 7 kW of heat rejection, the remaining 1.7 kW can be attributed to auxiliary loads and unmeasured losses.
Combustion Engine Energy Accounting
For a hydrogen combustion engine, the useful output is shaft power. The energy accounting must include how much energy leaves with exhaust and how much is lost to heat transfer.
A useful decomposition is:
- Fuel energy in: \(\dot{m}_{H2}LHV\)
- Brake power: measured at the shaft
- Exhaust energy loss: captured indirectly through exhaust enthalpy and mass flow
- Cooling losses: heat carried by engine cooling system
- Auxiliary loads: compressors, oil pumps, and control power
Example: An engine consumes 1.2 kg/h hydrogen. Fuel energy is 1.2 × 120 MJ/h = 144 MJ/h = 40 kW. If brake power is 26 kW, then \(\eta_{eng} \approx 0.65\). If cooling and exhaust measurements indicate 12 kW of heat-related losses, the remaining 2 kW aligns with parasitics and unaccounted terms.
System-Level Comparison Rules
To compare fuel cells and combustion engines fairly, apply the same system boundary:
- Include fuel conditioning energy for cryogenic hydrogen handling.
- Include auxiliary power needed to run pumps, compressors, and thermal management.
- Convert shaft power to electricity with the same generator efficiency if you compare to electrical output.
A common mistake is comparing stack efficiency to engine brake efficiency without accounting for the electrical conversion and cooling power. When you do the full boundary accounting, the “winner” can change because the loss locations differ: fuel cells tend to concentrate losses in electrochemical and thermal management, while combustion engines distribute losses across exhaust enthalpy and heat transfer.
Practical Measurement Checklist
For both propulsion types, energy accounting becomes reliable when you measure:
- Hydrogen mass flow or a calibrated proxy
- Electrical voltage and current for fuel cells
- Shaft power for engines
- Coolant flow and temperature rise
- Key pressures and temperatures to interpret losses
When these are consistent, the numbers stop being vibes and start being arithmetic—exactly what you want before you trust any design decision.
1.3 Hydrogen Storage Forms and Their Aviation Implications
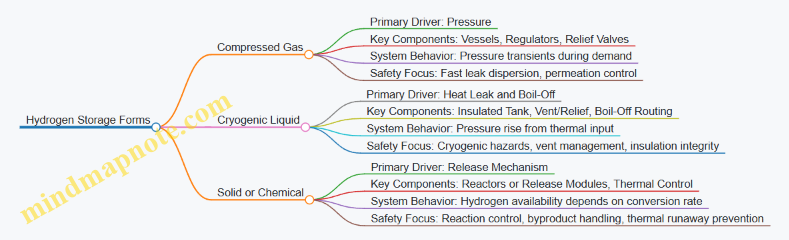
Hydrogen can be stored in several physical forms, and each form changes the aircraft design in predictable ways: where the mass goes, how heat is managed, how pressure varies, and how safety systems must behave. The main storage options are compressed gas, cryogenic liquid, and solid or chemical storage. In aviation, the first two dominate because they map cleanly to aircraft plumbing, controllable pressure, and measurable boil-off or pressure-rise behavior.
Compressed Hydrogen Gas
Compressed hydrogen is stored as a gas at high pressure, typically in composite overwrapped pressure vessels. The aircraft implication is mostly about pressure management rather than extreme thermal management.
A practical way to think about it is: the tank is a pressure container first, and a “fuel” second. That means the fuel system needs regulators, pressure sensors, and relief paths sized for rapid transients. For example, if an engine demands flow quickly, the regulator must prevent the tank pressure from dropping too fast, which would starve the injector or fuel cell.
Safety design follows the same logic. A leak from a high-pressure tank can release hydrogen quickly, so the ventilation and detection strategy must assume fast dispersion. Also, material choice matters because hydrogen can permeate through seals and embrittle certain metals; composite tanks reduce some embrittlement concerns but introduce their own inspection and aging requirements.
Cryogenic Liquid Hydrogen
Liquid hydrogen is stored at cryogenic temperatures in insulated tanks. The aircraft implication shifts from pressure-first to thermal-first: heat leak drives boil-off, and boil-off drives pressure rise.
A useful mental model is a “thermal budget.” Heat leaks in through insulation and supports, then turns liquid into gas. If the tank is vented, the aircraft loses fuel; if the tank is not vented, pressure rises and relief systems must be ready. Therefore, the fuel system and the tank vent/relief system are tightly coupled.
Consider a simple operational example: during a long ground hold, the tank warms slightly, producing boil-off gas. If the aircraft has a way to route that gas to an engine or fuel cell, the system can reduce vent losses. If not, the vent system becomes the primary control method. Either way, the design must ensure that pressure stays within allowable limits across the full range of ambient conditions.
Solid and Chemical Storage
Solid or chemical storage binds hydrogen in materials or compounds. The aviation implication is that the release mechanism becomes part of the fuel system, not just the tank.
In these systems, the key engineering question is not “how do we keep it cold or pressurized,” but “how do we release hydrogen at the right rate and temperature without creating unacceptable byproducts or control delays.” That typically requires additional components such as heat exchangers, catalysts, or reaction control hardware. Even when the storage mass is attractive on paper, the aircraft must still carry the thermal and control infrastructure needed to convert stored hydrogen into usable flow.
A concrete example: if hydrogen is released by heating a material, the aircraft must supply that heat. If the heat comes from waste heat, the integration can be efficient; if it requires dedicated heating, the energy balance can become less favorable. Either way, the storage form changes the energy flow path through the aircraft.
Mind Map: Storage Forms and Aviation Implications
Example: Choosing a Storage Form by System Priorities
Suppose an aircraft mission emphasizes short turnaround times and frequent starts. Compressed storage can simplify thermal handling because the tank does not rely on cryogenic insulation performance to prevent fuel loss; instead, the design focuses on pressure regulation and rapid response.
Now suppose the mission emphasizes long range with fewer starts. Cryogenic liquid can be advantageous because it stores more hydrogen per unit volume, but the aircraft must manage boil-off during both flight and ground operations. The fuel system design then centers on thermal management, vent strategy, and the ability to use boil-off when it is available.
Example: How Storage Form Shapes Safety Logic
A compressed-gas system can use leak detection to trigger ventilation and isolation quickly, because the hazard is dominated by rapid release and dispersion. A cryogenic liquid system adds another layer: insulation damage or unexpected heat ingress can change boil-off rates, so the safety logic must monitor temperatures and pressures together, not pressure alone.
In both cases, the storage form determines what “normal” looks like. Normal is not just a number on a gauge; it is the coupled behavior of tank conditions, fuel demand, and the aircraft’s ability to control heat and pressure at the same time.
1.4 Safety Principles for Flammable Gas Environments
Hydrogen safety starts with a simple idea: you manage three things—fuel (hydrogen), ignition sources, and the conditions that let the mixture burn. In flammable gas environments, the “conditions” part is usually the hardest, because it depends on concentration, ventilation, and how the gas disperses.
Core Hazard Model for Hydrogen
Hydrogen is flammable over a wide concentration range and disperses quickly, which means a small leak can create a flammable cloud near a release point. The practical safety goal is to prevent the system from producing a flammable mixture in the first place, or to ensure that if a mixture forms, it cannot ignite.
A useful way to reason about this is to treat every scenario as a chain:
- A leak occurs.
- Hydrogen mixes with air to reach a flammable concentration.
- An ignition source is present.
- The mixture ignites and energy propagates.
Safety measures break one or more links in the chain. For example, a leak detection system breaks link 1 by triggering isolation quickly; ventilation breaks link 2 by reducing concentration; ignition control breaks link 3 by preventing sparks or hot surfaces from being effective.
Managing Fuel Release and Concentration
The first line of defense is to reduce the probability and size of leaks. That means robust sealing, controlled assembly practices, and materials that tolerate cryogenic cycling without creating new leak paths. But even with good hardware, leaks are treated as credible.
When a leak is credible, concentration control becomes the next layer. Ventilation is the most direct tool: it dilutes hydrogen below flammable levels. The design logic is to avoid stagnant pockets where gas can accumulate. In aircraft-relevant spaces, this often means routing airflow so that any released gas is carried away from likely ignition zones.
Example: If a small valve weeps during a ground maintenance task, the safety approach is not “assume it won’t happen.” Instead, you ensure that the local ventilation pattern moves gas away from electrical equipment and that the detection system can trigger a safe state before the leak persists.
Ignition Source Control
Even if hydrogen reaches flammable concentration, ignition requires an effective source. Ignition control is therefore about preventing ignition sources from being present where hydrogen could accumulate, and about limiting their energy.
Common ignition categories include:
- Electrical sparks from switching or damaged wiring
- Hot surfaces from equipment that can exceed safe temperatures
- Static discharge from handling or rapid flow
- Mechanical sparks from friction or impact
A practical best practice is to define “hazard zones” around potential release points and then apply ignition control measures consistently within those zones. For instance, if a component is near a vent outlet where hydrogen could be present, you treat nearby electrical devices and wiring as part of the same safety boundary.
Detection, Isolation, and Safe State Logic
Detection turns safety from passive to active. The key is response time and correct action. A detection system should not only alarm; it should drive isolation and ventilation actions that reduce hydrogen concentration and stop the release.
Integrated logic typically includes:
- Sensor placement that matches expected dispersion patterns
- Thresholds that distinguish normal operation from credible release
- Interlocks that close valves, inhibit ignition-prone operations, and command ventilation
- Fail-safe behavior when sensors disagree or fail
Example: During a refueling coupling, if a hydrogen sensor near the connection detects an abnormal rise, the system can close upstream valves and stop further flow while maintaining ventilation. The goal is to prevent the release from continuing long enough to build a flammable mixture.
Venting and Dispersion as a Safety Function
Venting is not just “getting rid of gas.” It is a controlled engineering function that shapes where hydrogen goes and how quickly it dilutes. Discharge direction, exit geometry, and placement relative to air intakes and ignition sources matter.
A good rule of thumb is to design venting so that the highest hydrogen concentration occurs in a region where ignition sources are excluded and where airflow carries gas away. If vent discharge is near a location where electrical equipment or hot surfaces exist, you have to treat that as a combined hazard.
Mind Map: Hydrogen Flammable Gas Safety
Systematic Safety Verification
Safety principles become real only when verified. Verification should check that each layer performs under realistic conditions: sensor coverage matches dispersion, isolation valves can close within required time, ventilation provides enough dilution, and ignition-prone equipment is controlled in the relevant zones.
Example: A practical test scenario is a controlled small leak in a representative compartment layout. You measure whether the sensor detects quickly enough, whether the isolation action reduces flow, and whether the ventilation prevents concentration from reaching flammable levels near ignition-controlled equipment.
Human Factors That Actually Matter
Even with strong engineering controls, procedures influence outcomes. Crew and maintenance steps should avoid creating ignition sources during potential releases and should ensure that ventilation and detection are active when they need to be. The simplest example is ensuring that electrical equipment is not energized during a known leak investigation step, and that the system is in its intended safe state before coupling or uncoupling operations.
In flammable gas environments, safety is not a single device or a single rule. It is a structured set of barriers that interrupt the hazard chain, supported by verification and procedures that keep the barriers aligned with how the system is actually used.
1.5 Standards Terminology for Aviation Fuel and Cryogenic Systems
Standards terminology is the shared language that keeps design, testing, and certification from turning into a game of telephone. In hydrogen aviation, the vocabulary spans aircraft fuel systems, cryogenic engineering, and flammable-gas safety. This section builds a practical glossary and shows how terms map to real hardware decisions.
Core Fuel System Terms You Will See Everywhere
Fuel is the energy-carrying substance delivered to an engine or power unit. In hydrogen aircraft, “fuel” can mean liquid hydrogen (LH2) in the tank, gaseous hydrogen (GH2) in lines, or conditioned hydrogen at the injector.
Fuel system is the complete path from storage to the point of use, including valves, regulators, filters, sensors, and venting interfaces. A common best practice is to define system boundaries in drawings using consistent line labels, so a leak test plan matches the physical layout.
Pressure boundary is the set of components designed to contain hydrogen under specified pressures. For example, a relief valve is not part of the pressure boundary in the same way as a tank wall, because its job is to open under defined conditions.
Conditioning means changing hydrogen state to meet the requirements of the next component. A simple example is warming LH2 to reduce vapor fraction before it reaches a regulator.
Cryogenic Terminology That Drives Design
Cryogenic generally refers to very low temperatures where normal material behavior changes and heat transfer dominates. For LH2 systems, the key engineering consequence is that heat leak becomes a primary “load,” not a side effect.
Boil-off is hydrogen vapor generated when heat enters the tank. Engineers treat boil-off as both an energy loss and a pressure management driver.
Heat leak is the unwanted energy flow into the cryogenic space. In practice, you quantify it to size insulation and to predict tank pressure rise.
Vapor space is the region above the liquid in a tank. It matters because pressure, temperature, and gas composition in that space influence venting and regulator behavior.
Cooldown is the controlled reduction of temperature in lines and components before operation. A good example is pre-cooling a fuel line to avoid thermal shock and to reduce transient two-phase flow.
Safety Terminology for Flammable Gas Systems
Hazard is a source of potential harm, such as a hydrogen leak. Risk combines hazard likelihood and severity.
Consequence is what happens if the hazard occurs, like ignition leading to overpressure or fire.
Ignition source is any mechanism that can ignite hydrogen, including hot surfaces or electrical arcs. A practical approach is to classify ignition sources by location and energy, then align detector placement and isolation logic accordingly.
Vent is a controlled release path. Relief is a safety function that prevents overpressure by discharging at defined setpoints.
Dispersion is how released hydrogen mixes with air. Engineers use dispersion terminology to connect release geometry and airflow to flammability limits.
Standards-Style Definitions and How They Affect Documentation
Standards often define terms with precision so that requirements can be traced. When you write a requirement, you should use the same term the standard uses, not a casual synonym.
Example: If a document says “relief valve discharge,” your test plan should measure discharge conditions at the relief outlet, not at a downstream manifold.
Another example: If a document distinguishes “fuel line” from “fuel manifold,” your leak detection coverage should match that boundary. Otherwise, you end up with a test that proves the wrong thing.
Mind Map: Terminology Map for Hydrogen Fuel and Cryogenic Systems
Example: Turning Definitions into a Simple Requirement Set
Suppose a system requirement states: “The fuel system shall limit overpressure by using relief devices with defined setpoints.” To implement this without ambiguity:
- Identify the pressure boundary components that must be protected.
- Specify the relief setpoints and confirm they are measured at the correct outlet.
- Define the vent routing so discharge does not create an unacceptable ignition environment.
- Use dispersion terminology in the safety analysis so release location and airflow assumptions match the physical installation.
This is the quiet power of standards terminology: it forces your design, tests, and safety evidence to talk about the same physical reality.
2. Cryogenic Storage Engineering for Aircraft
2.1 Liquid Hydrogen Thermodynamics and Heat Leak Management
Liquid hydrogen (LH2) is mostly a heat-transfer problem wearing a thermodynamics hat. The core goal is simple: keep the tank cold enough that hydrogen stays liquid long enough for mission needs, while managing the inevitable heat that leaks in from the environment.
Core Thermodynamics for Cryogenic Storage
Start with the phase-change anchor: at a given pressure, hydrogen has a saturation temperature where liquid and vapor coexist. If the tank pressure rises, the saturation temperature rises too, which can increase boil-off. If the tank pressure is controlled, the saturation temperature is effectively set by that control strategy.
Heat leak into LH2 mainly causes vapor generation. The energy required to convert liquid to vapor is the latent heat of vaporization. A useful mental model is that every joule that reaches the liquid either warms it slightly or, once near saturation, turns into vapor. In well-managed cryogenic tanks, the liquid is kept close to saturation, so most incoming heat becomes boil-off.
A second anchor is sensible heating: before significant boiling, incoming heat can raise the liquid temperature. In practice, the tank design aims to minimize both the initial warm-up and the ongoing boil-off by reducing heat transfer paths.
Heat Leak Paths and Where They Matter
Heat reaches the tank through three main routes: conduction through supports and penetrations, radiation across the vacuum gap, and convection or gas conduction if vacuum quality degrades.
Conduction dominates through solid interfaces. A support strut that seems “small” can still carry meaningful heat because thermal conductivity and cross-sectional area matter. Penetrations for wiring, plumbing, and instrumentation are often the real villains because they create long, unavoidable paths.
Radiation dominates when surfaces “see” each other across vacuum. The trick is to reduce radiative heat transfer by using multilayer insulation (MLI) and low-emissivity surfaces. MLI works by increasing the number of thermal “stops” that radiation must traverse.
Convection is usually suppressed by vacuum, but it returns if the vacuum degrades. Even a modest pressure in the insulation space can increase gas conduction enough to change the boil-off rate noticeably.
Boil-Off Rate Reasoning with a Practical Example
Assume a tank with an effective heat leak power \(\dot Q\) into the liquid. If the liquid is near saturation, the boil-off mass flow \(\dot m\) is approximately:
\[\dot m \approx \frac{\dot Q}{h_{fg}}\]
where \(h_{fg}\) is the latent heat of vaporization.
Example: if the effective heat leak is 50 W and \(h_{fg}\) is about 445 kJ/kg (order-of-magnitude for LH2 near its boiling point), then:
\[\dot m \approx \frac{50\ \text{J/s}}{445000\ \text{J/kg}} \approx 1.1\times10^{-4}\ \text{kg/s}\]
That is about 0.40 kg/hour. If your mission requires, say, 10 hours of usable liquid, you can see how quickly small changes in \(\dot Q\) become operationally significant.
Managing Heat Leak Through Design Choices
Heat leak management is not one knob; it is a set of coordinated constraints.
1. Reduce conduction. Use low-conductivity support materials, minimize cross-sectional area, and increase thermal intercept lengths where feasible. A thermal intercept stage can “catch” heat at an intermediate temperature so less reaches the LH2.
2. Reduce radiation. Use MLI with appropriate layer density and maintain clean, well-aligned surfaces. Surface finish and emissivity matter because radiation transfer scales with temperature differences and emissivity.
3. Protect vacuum integrity. Design for leak tightness, avoid sharp thermal cycling that can open microcracks, and ensure that insulation space is not contaminated during assembly.
4. Control tank pressure strategy. Pressure control affects saturation temperature and therefore the driving temperature difference for heat transfer. A stable pressure approach reduces oscillations that can increase thermal stress and complicate boil-off behavior.
Instrumentation and What to Watch
Heat leak management becomes measurable when you track both thermal state and mass state.
- Temperature sensors near the liquid region and at key structural interfaces reveal whether heat is mostly reaching the liquid or being intercepted earlier.
- Pressure sensors indicate saturation conditions and help interpret whether boil-off is consistent with expected \(\dot Q\).
- Level or mass estimation (via boil-off rate, tank mass balance, or level sensing where available) lets you convert thermal behavior into usable fuel time.
A good operational check is to compare observed boil-off against the predicted \(\dot Q\). If the numbers disagree, the likely causes are vacuum degradation, unexpected conduction paths, or insulation performance loss.
Mind Map: Liquid Hydrogen Heat Leak Management
Example: Interpreting a Heat Leak Spike
Suppose measured boil-off increases from 0.40 kg/hour to 0.60 kg/hour while tank pressure control remains steady. Because \(\dot m\) scales with \(\dot Q\), the effective heat leak rose by about 50%. With stable pressure, the most common explanations are increased conduction through a support or a penetration, or reduced insulation effectiveness due to vacuum loss. Temperature sensors at structural interfaces can help localize the change: if interface temperatures rise while liquid temperature stays near saturation, the heat is arriving earlier in the structure; if liquid temperature deviates, the system may be losing saturation control or encountering a different heat-transfer regime.
2.2 Insulation Strategies and Vacuum Jacket Design
Cryogenic hydrogen tanks lose energy mainly through heat leak, and heat leak is what drives boil-off. Insulation and vacuum jackets are the tools that slow that leak down by reducing three pathways: conduction through supports, radiation across the vacuum gap, and convection in any trapped gas. A good design treats all three as separate problems with separate fixes.
Core Concepts That Drive Insulation Choices
Vacuum Jacket Function
A vacuum jacket is a double-wall structure where the space between walls is evacuated. With a strong vacuum, gas conduction and convection collapse, leaving radiation and solid conduction as the dominant mechanisms.
Heat Leak Budget
Start with a simple accounting mindset: total heat leak equals conduction through structural elements plus radiation through the vacuum plus any residual gas effects. Even if you cannot compute everything perfectly early on, you can still rank contributors and design to reduce the largest ones first.
Radiation Is Usually the Big Remaining Player
In vacuum, radiation dominates because it does not require a medium. Lowering radiative heat transfer typically means using low-emissivity surfaces and controlling view factors between hot and cold regions.
Insulation Materials and How They Behave
Perlite and Powder Insulation
Powder insulation fills the space between inner and outer shells. It reduces conduction by interrupting heat flow paths, but it can settle and create density gradients. For aircraft tanks, designers often pair powder with structural features that limit movement and maintain predictable thermal performance.
Multilayer Insulation
Multilayer insulation uses many thin layers to reduce radiative transfer. Each layer acts like a small barrier to radiation, and the overall effect depends on layer count, spacing, and surface properties. The practical constraint is that too much layering can increase trapped moisture risk and complicate assembly.
Foam Insulation
Foams can be convenient and robust, but their performance depends on thermal conductivity at cryogenic temperatures and on whether the foam absorbs moisture. Moisture turns insulation into a heat-leak amplifier because it increases effective thermal conductivity.
Vacuum Jacket Design Details That Matter
Jacket Geometry and Thermal Contraction
The inner tank and outer jacket contract differently as temperature drops. If the vacuum jacket is too rigidly constrained, stresses can distort clearances, damage seals, or create unintended thermal bridges. Design for controlled contraction using compliant supports and predictable attachment points.
Support Structures and Thermal Bridges
Supports hold the inner vessel in place. Every support is a conduction path, so the goal is to minimize cross-sectional area, choose low-conductivity materials, and use geometry that reduces effective conduction length. A common best practice is to use multiple small supports rather than a few large ones, because it can reduce local heat flow while maintaining stability.
Low-Emissivity Surfaces and View Control
Radiation reduction improves when the inner surface is low emissivity and when the geometry limits direct line-of-sight between warm and cold surfaces. Designers often use reflective foils or coated surfaces and add shields where the view factor is high.
Seal Integrity and Vacuum Lifetime
Vacuum jackets rely on seals that survive thermal cycling and mechanical loads. A small leak can turn a low-conduction vacuum into a high-conduction gas environment. Best practice is to design seals with redundancy and to include a way to monitor vacuum quality so maintenance can be targeted.
Systematic Design Workflow
- Define operating temperatures and allowable boil-off so you know the maximum acceptable heat leak.
- Estimate conduction paths through supports, penetrations, and wiring harnesses.
- Model radiation using emissivity values and approximate view factors.
- Select insulation type based on assembly constraints, moisture sensitivity, and expected thermal cycling.
- Design the vacuum jacket for contraction, support strategy, and seal robustness.
- Prototype and instrument to validate heat leak under representative conditions.
Example: Choosing Between Powder and Multilayer Insulation
Suppose you have two candidate designs for the same tank geometry.
- Powder insulation reduces conduction effectively but still leaves radiation as a major contributor unless surfaces are treated.
- Multilayer insulation targets radiation directly, but it requires careful assembly and stable spacing.
A practical approach is to combine them: use powder or foam to manage conduction and add multilayer insulation where radiation view factors are highest. This avoids relying on a single mechanism to do all the work.
Mind Map: Insulation and Vacuum Jacket Design
Example: Support Geometry as a Heat Leak Lever
If you reduce support cross-sectional area by half while keeping the same number of supports, conduction heat leak through supports drops roughly in proportion to area, assuming similar materials and temperature gradients. The trade is stiffness and vibration behavior, so the design should check both thermal and mechanical requirements together rather than treating insulation as a purely thermal problem.
2.3 Boil Off Control Methods for Onboard Tanks
Boil-off is the inevitable heat leak into a cryogenic liquid hydrogen tank, turning some liquid into gas. The gas then raises tank pressure, which is not automatically bad—pressure is a tool—but uncontrolled boil-off can force frequent venting, waste usable fuel, and complicate safety margins. The goal is to manage heat ingress and convert boil-off into predictable, controllable behavior.
Core Mechanisms and What We Can Control
Boil-off rate is driven by heat transfer into the tank and by how that heat is removed or absorbed. In practice, you manage three levers: reduce heat leak, control how the tank handles the resulting vapor, and decide what to do with excess pressure.
A simple mental model helps: if heat leak is constant, boil-off is roughly proportional to the energy entering the tank. If you can lower heat leak by improving insulation or thermal shielding, boil-off drops. If you cannot, you can still reduce operational impact by using pressure management strategies that avoid unnecessary venting.
Insulation and Thermal Shielding
The first line of defense is minimizing heat transfer through the tank wall. Vacuum insulation reduces conduction and convection, while multilayer insulation (MLI) reduces radiative heat transfer. A practical best practice is to treat insulation quality as a system property, not a material property: vacuum integrity, MLI compression during assembly, and surface cleanliness all affect performance.
Example: during integration, a technician installs a vacuum jacket and then checks for leaks. If the vacuum degrades, radiative and conductive paths increase, and boil-off rises even if the tank geometry is unchanged. The tank “works,” but it works harder.
Thermal shielding can further reduce radiative load by intercepting heat before it reaches the inner vessel. Shield effectiveness depends on maintaining low-emissivity surfaces and avoiding thermal bridges through supports.
Pressure Management Without Venting
If boil-off increases tank pressure, you can manage it by allowing controlled pressure rise while keeping the tank within allowable limits. This is not the same as “do nothing.” You still need a control strategy that defines acceptable pressure bands and ensures the tank relief system remains a last resort.
Common onboard approaches include:
- Vapor routing and controlled consumption: route boil-off gas to an engine or fuel cell system when conditions allow. This turns boil-off into useful flow rather than vented loss.
- Pressure setpoint control: use valves and regulators to maintain pressure within a target range, balancing fuel demand and tank pressure.
- Staged relief strategy: design relief devices so that small deviations are handled by controlled pathways before reaching higher-pressure venting.
Example: suppose the aircraft is on the ground with low fuel demand. If the system can route boil-off to a controlled burner or to a regulated consumption path, tank pressure can be stabilized without venting. If consumption is unavailable, pressure will rise until the relief system activates.
Controlled Venting and Its Engineering Rules
Vent systems are not a failure; they are a designed safety function. The engineering challenge is to vent in a way that is predictable, minimized, and compatible with aircraft operations.
Key rules include:
- Vent only when necessary: venting should occur at defined pressure thresholds, not continuously.
- Minimize vent duration: use control logic that anticipates boil-off trends based on tank temperature and pressure rate-of-change.
- Route discharge safely: vent outlets must consider ignition sources, airflow patterns, and ground handling conditions.
Example: if sensors show tank pressure rising faster than expected, the control system can open a small vent path earlier rather than waiting for a larger relief event. The total vented mass may be similar, but the operational impact is reduced because the system avoids abrupt high-flow relief.
Active Cooling and Heat Removal Options
Active cooling uses external power or onboard energy to remove heat from the cryogenic system. It can reduce boil-off further than passive insulation alone, but it adds complexity: additional hardware, control loops, and energy consumption.
A practical way to think about active cooling is to compare “energy spent” versus “fuel saved.” If the cooling system consumes significant electrical power, you must ensure the net effect is beneficial for mission needs.
Example: an active cooling loop might circulate a cold working fluid through a heat exchanger to absorb heat from the tank. The control system would modulate cooling based on measured tank temperature and pressure, preventing overcooling that could create operational issues such as excessive thermal gradients.
Control Logic That Makes Boil-Off Predictable
Boil-off control is ultimately a control problem: sensors measure state, logic estimates boil-off behavior, and actuators respond.
A robust approach uses multiple signals rather than a single trigger. Pressure alone can lag temperature changes, and temperature alone can be slow to respond. Combining them improves stability.
Mind Map: Boil Off Control Methods
A Systematic Example Workflow
- Measure tank pressure and temperature, plus sensor health status.
- Estimate boil-off trend using pressure rate-of-change and thermal state.
- Prioritize vapor usage paths if propulsion or power systems can accept boil-off.
- Adjust regulators and valves to keep pressure within the operational band.
- Escalate to controlled venting only when consumption cannot keep up.
- Protect with relief devices as the final safety layer.
This workflow keeps boil-off from becoming a surprise. It also makes the system easier to reason about during troubleshooting because each action corresponds to a specific measured condition.
2.4 Tank Materials Compatibility and Weld Integrity Considerations
Hydrogen tanks fail in predictable ways: materials lose strength, seals leak, and welds crack under thermal cycling. Compatibility work is therefore less about “finding the right metal” and more about controlling interactions between hydrogen, cryogenic temperatures, and the manufacturing process. A practical approach starts with baseline material behavior, then checks weld metallurgy, then verifies the whole assembly with targeted tests.
Core Compatibility Concepts
Hydrogen can affect metals through two main mechanisms. First, it can reduce ductility and toughness, making cracks easier to start and grow. Second, it can change how stress is distributed around defects, especially in and near welds where microstructure varies. Cryogenic service adds another layer: thermal contraction creates residual stresses, and repeated cooldown cycles can concentrate strain at weld toes and heat-affected zones.
A useful mental model is to treat the tank as three coupled regions: base metal, heat-affected zone, and weld metal. Each region can respond differently to hydrogen and temperature. If you only qualify the base metal, you may still end up with a weld that is “fine on paper” but brittle in service.
Material Selection with Hydrogen and Cryogenic Constraints
Start with a short list of candidate alloys and then filter by properties that matter at cryogenic temperatures: fracture toughness, yield strength, and resistance to hydrogen-assisted cracking. For cryogenic hydrogen tanks, the goal is not just strength at low temperature, but stable toughness after exposure and after welding.
Compatibility checks should include:
- Hydrogen exposure behavior: how toughness changes after hydrogen contact.
- Microstructure stability: whether welding creates brittle phases or coarse grains.
- Permeation and embrittlement risk: how fast hydrogen can move through the material and how it accumulates at stress concentrators.
A concrete example: suppose two steels have similar room-temperature strength. If one forms a less favorable microstructure after welding, its weld region may show lower fracture toughness at cryogenic temperatures even though the base metal looks acceptable.
Weld Integrity Fundamentals
Welds are where geometry, metallurgy, and residual stress meet. Three defects are especially relevant for cryogenic hydrogen tanks:
- Lack of fusion: creates planar defects that can link under cyclic loading.
- Porosity: provides crack initiation sites and can trap hydrogen.
- Undercut and sharp weld toes: raise local stress intensity.
Weld integrity is not only about visual quality. The weld must meet acceptance criteria for geometry and internal soundness, and it must preserve toughness in the heat-affected zone.
Key best practices include:
- Control heat input to avoid overly coarse microstructures.
- Minimize weld toe sharpness through proper bead profile.
- Use qualified procedures that specify parameters, filler selection, and preheat/interpass controls.
- Perform post-weld treatments when specified to reduce residual stress and improve toughness.
Hydrogen-Specific Weld Metallurgy Checks
Weld metal and heat-affected zones can differ in composition and grain structure from the base metal. That matters because hydrogen-assisted cracking often initiates where toughness is lowest. Therefore, qualification should include tests that target the weld region, not just the base material.
A systematic qualification plan typically includes:
- Procedure qualification using representative joint geometry.
- Mechanical testing that includes fracture toughness or crack growth resistance at relevant temperatures.
- Hydrogen exposure testing where specimens are exposed to hydrogen conditions representative of service.
- Non-destructive inspection to confirm internal soundness.
Concrete example: if a weld procedure produces acceptable tensile strength but fails a toughness test after hydrogen exposure, the procedure is not compatible even if it “passes” a standard strength check.
Mind Map: Compatibility and Weld Integrity
Example: Weld Qualification Workflow for a Cryogenic Tank Joint
- Define the joint design and weld procedure: include joint type, thickness range, filler, and parameter windows.
- Produce representative weld coupons: match weld toe geometry and heat input targets.
- Inspect for internal defects: use appropriate non-destructive methods to confirm soundness.
- Test mechanical performance at cryogenic temperature: confirm toughness and ductility in the weld-influenced region.
- Run hydrogen exposure testing: expose specimens under conditions representative of tank service, then repeat the critical mechanical checks.
- Document acceptance criteria: tie pass/fail to weld-region performance, not only base metal strength.
This workflow prevents a common failure mode: approving a weld procedure based on base-metal tensile strength while ignoring that the heat-affected zone may be the weak link.
Practical Checklist for Engineers and Fabricators
- Confirm material toughness at cryogenic temperature after welding.
- Ensure weld procedures control heat input and bead profile.
- Treat the heat-affected zone as a first-class design region.
- Inspect for lack of fusion, porosity, and undercut.
- Qualify with hydrogen exposure tests where required.
- Keep documentation traceable from procedure parameters to test results.
When these steps are followed, weld integrity becomes measurable rather than hopeful. The tank then has a coherent story: materials resist hydrogen effects, welds avoid common defect pathways, and qualification proves the weakest region can survive the service conditions.
2.5 Venting and Relief System Design for Aircraft Use
Venting and relief systems exist for one job: keep pressure and hydrogen concentration within safe limits when normal control fails or when thermal transients create excess boil-off. In cryogenic hydrogen aircraft, the system must handle both steady conditions (like a controlled vent during ground operations) and fast events (like a relief opening after a valve sticks). The design starts with clear boundaries: what pressure is allowed in each tank and manifold, what hydrogen concentration is acceptable in occupied or equipment areas, and what ignition sources must be avoided during discharge.
Core Requirements and Design Logic
A practical design uses three layers. First, prevent overpressure through normal regulation and controlled boil-off consumption. Second, provide relief paths that limit peak pressure when prevention fails. Third, ensure discharge locations and routing keep flammable mixtures away from ignition sources and sensitive structures.
A helpful way to reason about sizing is to treat venting as a mass-flow problem driven by pressure difference. Relief valves and burst devices are sized so that, for the worst credible heat leak or blocked outlet scenario, the tank pressure does not exceed the set limit. For example, if a tank experiences a sudden heat input that increases boil-off faster than the normal regulator can remove it, the relief system must pass the extra mass flow until the heat source is reduced or the event ends.
Relief Devices and Setpoints
Relief devices typically include pressure relief valves (PRVs) and, where appropriate, rupture disks for backup. PRVs are favored when reseating and repeat operation are acceptable. Rupture disks provide a simple, predictable burst pressure and can be paired with a PRV to reduce leakage risk.
Setpoints should be coordinated across the system. The tank relief setpoint must be high enough to avoid nuisance openings during normal thermal cycling, but low enough to protect tank design margins. Downstream components also need protection: if a vent line sees backpressure, the effective relieving pressure changes, which can cause either under-relief or excessive discharge.
A concrete example: if a vent outlet is partially obstructed by ice or debris, backpressure rises. The relief valve may open earlier than expected, increasing venting frequency. That’s why discharge routing, outlet geometry, and drainage paths matter as much as the valve rating.
Vent Line Routing and Discharge Management
Venting lines should minimize liquid hydrogen carryover into the outlet. Liquid carryover can cause two problems: it can flash downstream and create a localized high-momentum jet, and it can deposit cryogenic material that later warms and releases gas unpredictably.
Routing choices reduce these risks. Lines are commonly arranged with slopes that encourage vapor-dominant flow and avoid traps. Where liquid might collect, designers include provisions for drainage or controlled vaporization before discharge. Outlet placement is selected to promote rapid dilution by ambient air and to keep the jet away from inlets, doors, and hot surfaces.
Discharge management also includes controlling where the hydrogen goes during ground handling. A vent that discharges near a service area can create a flammable pocket even if the total mass released is small. The system should therefore include operational logic that aligns venting with safe ventilation conditions and crew procedures.
Backpressure, Flow Regimes, and Sizing
Sizing must account for two realities: hydrogen is compressible, and cryogenic hydrogen can be two-phase near relief conditions. Relief flow can transition between choked and unchoked behavior depending on upstream pressure and downstream resistance.
Designers typically use conservative assumptions for worst-case backpressure and include a margin for uncertainties in heat leak, valve performance, and discharge coefficient. A simple example of the margin concept: if calculations predict a relief valve will pass 100% of required mass flow at the set pressure, the design might still select a larger capacity to cover valve degradation, sensor error in control logic, and imperfect flow conditions.
Controls, Interlocks, and Indication
Even a well-sized relief system benefits from control logic. Interlocks can prevent ignition sources from being energized during vent events and can inhibit certain operations when hydrogen concentration sensors indicate unsafe levels.
Indication is part of safety, not decoration. The crew should receive clear status: which vent path is active, whether a relief event occurred, and whether the system is returning to normal. For example, a latched “relief opened” flag helps maintenance decide whether to inspect the valve, check for blockage, and verify that the vent line is clear.
Mind Map: Venting and Relief System Design
Example: Coordinated Relief and Vent Outlet Behavior
Consider a tank with a normal regulator that can remove boil-off during steady operation. If the regulator outlet becomes blocked, tank pressure rises due to continued heat leak. The PRV opens at its setpoint and routes flow into a vent line that slopes upward to prevent liquid pooling. The vent outlet is located so the jet dilutes rapidly in the airflow pattern and does not impinge on nearby equipment.
To validate the design, engineers check three things in sequence. First, the PRV capacity covers the required mass flow under the blocked-outlet scenario. Second, the vent line does not create excessive backpressure that would shift the effective relieving behavior. Third, the discharge location keeps hydrogen concentration below the threshold in relevant zones during the expected duration of the relief event. If any step fails, the fix is targeted: increase relief capacity, adjust outlet geometry, or revise routing to reduce backpressure and liquid carryover.
Design Checklist for Practical Implementation
A reliable vent and relief system is built from decisions that are easy to verify. Confirm setpoint coordination across tank and downstream components. Verify vent line routing avoids liquid traps and supports vapor-dominant flow. Ensure outlet placement supports dilution and avoids ignition-adjacent areas. Validate sizing against worst credible heat leak and blocked-outlet cases with conservative margins. Finally, implement interlocks and clear indications so the system behaves predictably when something goes wrong.
3. Fuel System Architecture and Integration
3.1 Tank to Engine Fuel Path Layout and Component Selection
A hydrogen aircraft fuel path is a chain of responsibilities: keep cryogenic conditions long enough, deliver the right pressure and temperature to the engine or fuel cell, and fail safely when something goes wrong. The layout starts at the tank outlet and ends at the engine inlet with a clear boundary for each function—phase control, pressure conditioning, metering, and isolation.
Foundational Layout Principles
Begin with a functional block view before choosing hardware. A practical path usually includes: tank outlet, shutoff/isolation, phase management, filtration/particulate control, pressure regulation or conditioning, flow metering, and engine interface fittings. Each block exists to solve a specific failure mode. For example, if a regulator sticks open, the system needs isolation upstream so the engine doesn’t receive uncontrolled flow.
Next, map the expected operating envelope. Cryogenic hydrogen can enter the engine path as a mix of liquid and vapor depending on tank pressure, heat leak, and cooldown state. Your component selection must therefore handle both phases without creating unstable oscillations or starving the engine. A simple rule of thumb: design the path so that phase changes occur in controlled locations, not randomly at valves or fittings.
Finally, plan for serviceability and leak containment. Component placement should allow inspection and replacement without disturbing critical seals. Use double containment where feasible: for instance, route leak-prone lines through a controlled vented cavity rather than letting any leak migrate into occupied compartments.
Component Selection by Function
Isolation and Shutoff. Place a primary shutoff valve as close to the tank outlet as practical. This reduces the volume of hydrogen that can escape during a leak or maintenance action. Choose actuation that supports the required fail state. For an aircraft fuel path, “fail closed” is often the safer default because it limits both flow and dispersion.
Phase Management. If the engine requires a specific inlet condition, add a phase control element such as a vapor-liquid separator or a controlled mixing/conditioning section. The goal is to prevent liquid slugs from reaching metering devices. A concrete example: if a mass flow controller is sensitive to liquid, you can place a separator upstream so only vapor reaches the controller during steady operation.
Filtration and Particulate Control. Use filters upstream of regulators and metering elements. Particles can cause regulator drift or valve scoring, which then changes flow calibration. Size filters for cryogenic compatibility and ensure they can be serviced or replaced without contaminating the system.
Pressure Conditioning. Engines and fuel cells typically need a stable pressure range. A regulator or pressure conditioning stage should be selected for cryogenic operation, low hysteresis, and predictable response to transient tank pressure changes. If the tank pressure varies during climb, the conditioning stage should smooth that variation so the engine control system doesn’t chase it.
Flow Metering. Metering should match the control strategy. If the engine control uses commanded mass flow, select metering that provides stable readings across expected phase conditions. If the system uses pressure-based control, ensure the metering element doesn’t introduce phase-dependent bias.
Engine Interface. Use standardized cryogenic-compatible fittings and ensure thermal contraction is accounted for in installation. Provide strain relief so vibration doesn’t fatigue lines or loosen connections.
Layout Logic from Tank Outlet to Engine Inlet
A systematic layout follows a “protect the sensitive parts” order. Put isolation first, then phase control, then filtration, then pressure conditioning, then metering, and finally the engine interface. This order reduces the chance that a failure in a downstream component forces you to treat the entire upstream system as compromised.
Also consider thermal and mechanical routing. Keep long runs insulated and minimize sharp bends that can trap gas pockets or create local heat transfer hotspots. Route lines so that any vented or leaked hydrogen has a predictable path to a safe discharge location.
Mind Map: Tank to Engine Fuel Path
Example: Choosing a Safe Order for a Two-Phase Path
Suppose the engine inlet needs vapor-phase hydrogen at a controlled pressure. If you place metering before phase management, liquid can reach the metering element during cooldown, causing reading errors and control oscillations. Instead, place a separator or conditioning section before metering. Then add filtration before the regulator so that any debris doesn’t change regulator behavior over time.
A simple check during design reviews: identify which component is most sensitive to liquid. If it’s the metering device, ensure every credible operating state routes liquid away from it. That single decision often determines the entire physical layout.
Example: Component Selection Criteria You Can Actually Verify
For each component, define measurable acceptance criteria. For instance, for a shutoff valve you can verify closure time and leakage rate at cryogenic temperature. For a regulator you can verify outlet pressure stability under simulated tank pressure steps. For a filter you can verify pressure drop limits and cryogenic flow resistance. When these criteria are written early, the layout stops being a guess and becomes a set of testable requirements.
Integrated Summary
A good tank-to-engine fuel path is not just a list of parts. It is an ordered system that controls phase, protects sensitive components, conditions pressure for stable engine control, and limits the consequences of leaks through isolation and containment. When the layout follows the logic—protect first, condition next, meter last—the design becomes easier to test and easier to maintain, which is the kind of “simple” that actually survives real operations.
3.2 Valves Regulators and Flow Control for Cryogenic Hydrogen
Cryogenic hydrogen flow control is mostly about managing two enemies: temperature change and pressure change. Valves and regulators must move fluid while keeping the system within safe operating envelopes, even when the tank is warming, the engine is demanding different flow rates, or a line is partially filled with two-phase hydrogen.
Core Concepts for Cryogenic Flow Control
A cryogenic hydrogen line rarely behaves like a simple pipe. As heat leaks in, liquid can partially vaporize, creating a mixture whose density and compressibility differ from either pure liquid or pure gas. That mixture affects pressure drop, valve response, and the accuracy of flow estimates.
Start with three foundational ideas:
- Phase awareness: A valve that works smoothly for gas may chatter or stall when fed with two-phase flow. Design choices should assume the line can be in mixed-phase conditions during transients.
- Thermal coupling: Components near warm structure absorb heat, which changes local saturation conditions. Flow control must tolerate these gradients without forcing the system into unstable oscillations.
- Pressure conditioning: Many downstream devices need a stable pressure range. Regulators and control valves should be selected to maintain that range despite upstream boil-off and varying demand.
Valve Selection Logic
Valves in cryogenic hydrogen service are typically chosen by three criteria: sealing performance at low temperature, acceptable pressure drop, and predictable behavior during two-phase flow.
- Shutoff valves: Use them to isolate sections for maintenance and fault containment. They should have clear open/closed position feedback and a design that minimizes trapped volume.
- Control valves: Use them to modulate flow. For two-phase hydrogen, prioritize designs with stable throttling characteristics and robust actuation that can handle changing fluid properties.
- Check valves: Prevent backflow during engine off-nominal conditions. Ensure cracking pressure and hysteresis are compatible with the expected pressure swings.
A practical rule of thumb: if you cannot explain how the valve behaves when the line is partially liquid, you are relying on luck rather than engineering.
Regulator Roles and Control Objectives
Regulators translate upstream pressure into a controlled downstream pressure. In cryogenic systems, they also influence thermal behavior because pressure reduction can promote flashing.
Common objectives include:
- Downstream pressure stability: Keep fuel supply within the engine or fuel cell inlet requirement band.
- Controlled flashing: Avoid sudden vapor generation that can cause flow surges or sensor confusion.
- Fail-safe behavior: Define what happens on power loss, sensor failure, or actuator faults.
A useful mental model is a “pressure spring” between upstream and downstream. The regulator must be sized so that the spring effect is strong enough to resist upstream disturbances, but not so stiff that it forces large oscillations.
Flow Control Architecture
A typical architecture uses a combination of isolation, regulation, and measurement:
- Isolation: Shutoff valves upstream and downstream of critical sections.
- Regulation: One or more regulators to set a baseline pressure.
- Fine control: A control valve or metering valve to match demand.
- Sensing: Pressure sensors at strategic points and temperature sensors to infer phase conditions.
- Logic: Control laws that limit valve movement rates and enforce safe operating constraints.
To keep control stable, include rate limits on valve commands and use measured pressure and temperature to adjust control gains when conditions shift.
Mind Map: Cryogenic Hydrogen Valves and Flow Control
Example: Designing a Regulated Supply for Variable Demand
Assume an engine requires a near-constant inlet pressure while its flow demand changes during throttle transitions.
- Set the regulation target: Choose a downstream pressure that stays within engine limits across expected upstream pressures.
- Estimate pressure drop budget: Allocate allowable pressure loss across filters, lines, and valves so the regulator has authority.
- Select valve type for fine control: Use a control valve sized so that, at typical operating flow, it operates in a region with smooth flow coefficient behavior.
- Add sensor placement: Put pressure sensors upstream and downstream of the regulator to detect when the regulator is saturating.
- Implement command limiting: Limit valve opening/closing rates to reduce oscillations caused by two-phase flashing.
A quick sanity check: if the regulator must constantly “fight” large pressure disturbances, the system will likely become noisy and hard to control. In that case, revisit line sizing, valve authority, or the regulation target.
Example: Valve Behavior During Two-Phase Transients
Consider a line that starts mostly liquid and warms as the system runs. As vapor fraction increases, the same valve opening can produce a different mass flow.
A robust approach is to control using mass-flow-relevant signals rather than only position. If you only close-loop on downstream pressure, the controller may interpret vapor-driven pressure changes as demand changes. Adding temperature-informed logic helps distinguish “pressure changed because phase changed” from “pressure changed because demand changed.”
Practical Validation Steps
- Cold-flow test with representative thermal conditions: Confirm valve response and regulator stability when mixed-phase is present.
- Step-change tests: Apply demand steps and verify that pressure overshoot and valve oscillations stay within limits.
- Fault injection: Simulate sensor dropouts and actuator faults to confirm isolation logic and safe positions.
The goal is not just to make the system work once, but to ensure it behaves predictably across the range of conditions it will actually see.
3.3 Pressure Management and Conditioning for Fuel Delivery
Pressure management is the job of turning “what the tank can provide” into “what the engine or fuel cell can accept” at the right flow rate, with the right stability, and with predictable behavior during transients. For cryogenic hydrogen, the challenge is that pressure, temperature, and phase are tightly coupled: a small change in heat leak or valve timing can shift the system from “liquid-rich” to “vapor-rich,” changing both delivered mass flow and mixture quality.
Core Concepts That Drive Design
Start with three quantities: tank pressure, delivered pressure, and delivered mass flow. Tank pressure is influenced by boil-off and venting strategy; delivered pressure is set by regulators and control valves; delivered mass flow depends on both pressure differential and the state of hydrogen at the inlet (liquid, two-phase, or vapor).
Conditioning means shaping the fuel stream so the downstream device sees a stable inlet. In practice, conditioning includes pressure regulation, flow control, phase management, and sometimes temperature conditioning. A useful mental model is a “pressure ladder”: tank pressure feeds a regulator stage, which feeds a control stage, which feeds the engine inlet. Each rung reduces variability and isolates disturbances.
Pressure Regulation Architecture
A typical architecture uses a primary regulator to set a target intermediate pressure, followed by a secondary regulator or control valve to meet the commanded flow. The primary stage handles large disturbances like tank pressure drift; the secondary stage handles fast changes like power demand.
For cryogenic hydrogen, regulators must be chosen with attention to two things: inlet conditions and dynamic response. If the inlet is two-phase, the regulator can experience shifting effective density and flashing at restrictions. That can cause oscillations or slow recovery after a step change. The best practice is to ensure the regulator inlet sees a controlled phase condition, often by using a settling volume or a phase separator upstream of the regulator.
Phase Management for Stable Mass Flow
If the downstream system requires a predictable mass flow, you must control what portion of the stream is vapor. Two-phase flow is not “bad,” but it is variable. A settling volume acts like a buffer: it allows stratification and reduces the chance that a valve opening immediately exposes the regulator to a vapor slug.
A practical example: during takeoff power increase, the control valve commands higher flow. Without a buffer, the inlet to the regulator may briefly become vapor-rich, reducing mass flow even though pressure looks acceptable. With a buffer, the system draws from a more consistent liquid inventory, so the regulator sees steadier inlet conditions.
Flow Control and Pressure-Flow Coupling
Flow control is usually implemented with a valve plus feedback. The key is to avoid fighting the physics. If you regulate pressure tightly at the same time you command flow aggressively, the valve may hunt as it compensates for flashing and density changes.
A systematic approach is to choose one “dominant” control objective per time scale. For example, use the primary regulator to hold intermediate pressure within a narrow band, then use the downstream valve to track commanded mass flow. During transients, allow a controlled amount of intermediate pressure movement rather than forcing perfect stability. That reduces valve oscillation and improves delivered mass flow tracking.
Conditioning Components and Their Roles
- Heat Exchangers or Vaporizers: Convert liquid to vapor when the downstream device cannot tolerate two-phase inlet. The design goal is repeatable outlet temperature and phase fraction.
- Filters and Strainers: Prevent debris from damaging small orifice regulators. For cryogenic systems, ensure the filter does not become a thermal bottleneck that changes local flashing behavior.
- Check Valves and Isolation Valves: Provide directional control and isolate sections during maintenance or fault states.
- Pressure Sensors at Multiple Points: Measure tank pressure, intermediate pressure, and inlet pressure to the engine or fuel cell so the control system can distinguish “supply problem” from “demand problem.”
Mind Map: Pressure Management and Conditioning
Example: Two-Stage Regulation with Phase Buffer
Assume the tank can vary between 1.5 and 2.5 bar equivalent during a mission segment. The engine inlet requires 1.2 bar with tight control, but it can tolerate vapor only. The solution is:
- Use a phase buffer at the tank outlet so the primary regulator inlet is liquid-rich during valve openings.
- Use a primary regulator to hold an intermediate pressure (for example, 1.6 bar) that is safely above the vaporizer operating pressure.
- Use a vaporizer to ensure single-phase vapor at the engine inlet.
- Use a downstream control valve with mass-flow feedback to track commanded power.
During a power step, the buffer reduces the chance of vapor slugs reaching the primary regulator. The primary stage absorbs tank pressure drift, while the downstream valve corrects flow. The vaporizer then removes phase uncertainty so the engine sees a consistent inlet.
Example: Avoiding Regulator Hunting
If intermediate pressure is held too tightly while the valve also tries to correct mass flow, the system can oscillate. A simple mitigation is to widen the intermediate pressure deadband slightly and rely on the downstream valve for fast correction. Another mitigation is to tune valve gain lower during conditions where flashing is likely, such as near the end of a tank segment when liquid inventory is reduced. The goal is not maximum stiffness; it is stable delivery.
Practical Design Checks
Before finalizing the design, verify that the pressure ladder behaves correctly under three conditions: tank pressure drift, valve step commands, and two-phase inlet variability. A good sign is when delivered mass flow tracks the command smoothly even if intermediate pressure moves within an acceptable band. That’s the system telling you it’s managing pressure and conditioning in the same direction as the physics, not against it.
3.4 Leak Detection and Isolation Logic in Fuel Manifolds
Hydrogen leaks in a fuel manifold are tricky because the system can be pressurized, cryogenic, or both, and the leak may start small. The goal of leak detection and isolation logic is simple: detect early enough to prevent unsafe accumulation, identify the likely leak location, and isolate the smallest practical section without starving the engine.
Foundational Concepts for Manifold Leak Logic
A manifold is a network of segments connected by valves, fittings, and flexible interfaces. Logic should treat each segment as a “zone” with its own sensors and isolation capability. In practice, zones are defined by where you can close valves to separate flow paths.
Leak detection relies on three signals that complement each other:
- Mass balance signals: compare commanded flow to measured flow or pressure decay.
- Thermal and pressure transients: a leak often changes local temperature and pressure faster than normal control actions.
- Direct sensing: hydrogen detectors, pressure sensors, and sometimes flow meters.
Isolation logic then maps detected anomalies to valve actions. The key design choice is whether to isolate immediately or to confirm first. Confirmation reduces nuisance trips, but immediate isolation reduces hazard exposure. A good system uses a staged response.
System Architecture and Signal Conditioning
Start with sensor placement that matches the physics. Pressure sensors should be near zone boundaries so that a leak produces a measurable pressure drop in the affected zone. Hydrogen detectors should be placed where gas would accumulate, typically near potential release points and in enclosed or semi-enclosed bays.
Raw sensor signals need conditioning:
- Filtering: use time windows aligned with expected control dynamics. For example, a valve command might cause a pressure change within seconds; a leak signature may persist or accelerate beyond that window.
- Rate-of-change features: compute derivatives like dP/dt and dT/dt. A leak often creates a consistent trend rather than a single spike.
- Plausibility checks: if two sensors disagree beyond a threshold, treat the anomaly as “sensor fault” rather than “leak.”
Staged Detection Strategy
A staged approach prevents both unsafe delays and excessive shutdowns.
Stage 1: Advisory detection
- Trigger when mass balance residuals exceed a mild threshold or when pressure decay rate increases above baseline.
- Action: log the event, alert the crew, and increase monitoring sensitivity.
Stage 2: Confirmed leak suspicion
- Trigger when advisory conditions persist for a defined duration and at least one additional indicator supports the leak hypothesis, such as a hydrogen detector reading above a low alarm level.
- Action: close the smallest isolation valves that reduce leak flow while maintaining engine supply if possible.
Stage 3: Hazard response
- Trigger when hydrogen concentration crosses a high alarm threshold, when pressure drops rapidly in a zone, or when multiple zones show consistent anomalies.
- Action: isolate the affected zone fully, depressurize it through a controlled path, and shift to a safe operating mode.
Isolation Logic That Minimizes Impact
Isolation is not just “close everything.” It should be topology-aware.
A practical rule set:
- Close upstream valves first to stop the leak source from receiving fresh hydrogen.
- Keep downstream valves open only if they prevent unsafe venting and do not increase leak exposure.
- Use interlocks so that closing one valve does not force another valve into an unsafe pressure differential.
Example: if a leak is suspected in Zone B between Valve B1 and Valve B2, the logic closes B1 to cut supply and keeps B2 open only if the downstream pressure can be maintained within limits. If pressure continues to decay, B2 closes as well.
Mind Map: Leak Detection and Isolation Logic
Example: Pressure-Decay Confirmation in One Zone
Assume Zone C is bounded by Valve C1 upstream and Valve C2 downstream. The controller commands a steady flow, so normal operation maintains pressure within a narrow band.
- Normal: pressure oscillates slightly due to control actions, but dP/dt stays near zero over a 10-second window.
- Leak: pressure decays with a consistent negative dP/dt over the same window, and the decay rate increases after the last valve adjustment.
Logic behavior:
- Stage 1 triggers when dP/dt magnitude exceeds a mild threshold for 10 seconds.
- Stage 2 triggers if the decay continues for another 5 seconds and a nearby hydrogen detector shows a low alarm.
- Stage 3 triggers if the detector reaches a high alarm or if pressure drops below a hazard threshold faster than expected.
Isolation behavior:
- Stage 2: closes C1 to stop supply.
- If pressure continues to fall, Stage 3 closes C2 and routes the zone to a controlled vent path.
Example: Sensor Fault Versus Leak
If a pressure sensor fails, it may report a sudden drop that looks like a leak. The logic should avoid false isolation by cross-checking:
- If hydrogen detectors remain at baseline and other sensors in the same zone show no matching trend, classify as sensor fault.
- If multiple sensors disagree, prefer the hypothesis with the most consistent physical indicators, such as matching pressure decay plus rising detector concentration.
This approach keeps the system responsive to real leaks while reducing unnecessary valve cycling, which also helps maintain long-term reliability.
3.5 Maintenance Access Routing and Serviceability Requirements
Maintenance access is not an afterthought in cryogenic hydrogen systems; it is part of the system design. If a technician cannot reach a valve, inspect a seal, or verify a sensor without removing half the airplane, the “maintenance” becomes a scheduled guessing game. The goal is to route access so that routine tasks are repeatable, inspections are visible, and repairs are possible without creating new hazards.
Core Principles for Access Routing
Start with the maintenance tasks that actually happen: leak checks, filter inspections, sensor calibration, valve functional checks, and replacement of wear items like gaskets or relief devices. For each task, define the minimum access geometry: reach distance, tool clearance, visibility line-of-sight, and whether the task requires isolation and depressurization.
Next, map access to safety functions. A maintenance panel that blocks a vent path or forces technicians to work near a relief discharge is not “convenient”; it is a safety risk. Access routes should keep maintenance work outside hazardous zones and preserve the integrity of venting, shielding, and insulation.
Finally, design for repeatability. If two different technicians can’t perform the same inspection the same way, the maintenance record becomes inconsistent. Use consistent panel locations, labeling, and fastener types so the procedure is stable across the fleet.
Serviceability Requirements by Subsystem
Tank and insulation interfaces. Provide removable access to any region where insulation integrity must be inspected or where a sensor is mounted. Keep access panels large enough for a visual check and for replacement of a sensor without disturbing surrounding insulation more than necessary.
Fuel manifolds and valves. Route access so that isolation valves can be operated and verified without reaching across sharp edges or through tight bends. Provide clear access to leak detection ports and ensure that any test fittings are reachable with standard tools.
Relief devices and vent interfaces. Relief valves and their discharge paths must be inspectable without blocking airflow or creating obstructions. Access should allow verification of correct installation and unobstructed discharge, including checks after any maintenance that touches adjacent structure.
Sensors and wiring. Place sensors where connectors can be inspected and replaced without removing structural members. Route wiring harnesses so that connector replacement does not require cutting or re-terminating, and so that strain relief remains intact after panel removal.
Mind Map: Access Planning Logic
Example: Access Panel Placement for a Fuel Manifold
Imagine a cryogenic hydrogen manifold with two isolation valves, a leak detection port, and a pressure conditioning component. A common mistake is placing the panel directly above the manifold but too small for a leak detector probe and too offset for a wrench swing. The fix is to size the panel for the largest tool envelope used in the procedure and align it with the valve handwheel and the leak detection port.
Also, keep the panel edges away from insulation seams that must remain continuous. If insulation must be disturbed, require a controlled rework step: mark insulation boundaries, specify replacement materials, and include a post-maintenance inspection that confirms insulation continuity and sensor mounting integrity.
Example: Serviceability for Relief and Vent Verification
Relief devices often sit near structural members and vent ducting. If the only access requires removing a vent duct cover, technicians will skip inspection steps because the effort is too high. Instead, provide a dedicated inspection opening that allows verification of the relief device condition and the absence of obstructions in the discharge path.
Label the inspection opening with the exact check to perform: “Confirm discharge path unobstructed” and “Verify relief device fastener integrity.” Pair that with a simple visual indicator such as a witness mark on fasteners, so the inspection is objective rather than interpretive.
Validation and Documentation Alignment
Access design is only “real” when the maintenance procedure matches the physical layout. Run a dry procedure using the intended tools and a representative technician. Confirm that each step can be completed without improvisation, and that any required isolation steps are feasible from the same access route.
Finally, ensure documentation references the physical access points consistently. If the procedure says “open panel A-12,” the panel must be labeled the same way in the aircraft and in the maintenance manual, and the panel must be reachable without removing unrelated components.
Practical Checklist for Designers
- Panels sized for tool envelopes and probe reach
- Clear line-of-sight for inspection steps
- No access route blocks vent discharge or safety shielding
- Connectors reachable without harness cutting
- Standard fasteners and consistent labeling
- Dry-run procedure validation with representative tools
- Post-maintenance checks that confirm insulation and sensor integrity
4. Hydrogen Combustion and Engine Adaptation
4.1 Combustion Chemistry and Emissions Formation Mechanisms
Hydrogen combustion is chemically simple in outline—hydrogen reacts with oxygen to form water—but emissions behavior depends on how the reaction is mixed, heated, and stabilized. In aircraft engines, the practical question is not “Does it burn?” but “Which reactions dominate under real flow, temperature, and turbulence conditions?”
Core Reaction Pathways
At the highest level, hydrogen oxidation proceeds through a chain mechanism. The key early step is hydrogen splitting into radicals (H and H2 species), which then react with oxygen-containing radicals to form hydroxyl (OH) and eventually water (H2O). A helpful way to think about it is as a relay race: radicals pass energy and reactivity forward until stable molecules—mostly water—finish the job.
The main products are:
- Water vapor from H2 + 1/2 O2 → H2O (dominant)
- Small amounts of hydrogen peroxide and other intermediates in cooler or transient regions
- Trace nitrogen oxides when high temperatures and nitrogen chemistry overlap
Even when the fuel contains no carbon, the engine can still produce nitrogen oxides because air provides nitrogen. That is the first “gotcha” for emissions accounting.
Temperature, Residence Time, and Mixing
Emissions formation is governed by three coupled factors:
- Peak temperature: higher temperatures increase reaction rates for nitrogen chemistry.
- Residence time: how long hot gases remain in the reaction zone.
- Mixture formation: how quickly hydrogen and oxygen reach a reactive composition.
A concrete example: imagine two combustor regions with the same total fuel flow. In one region, hydrogen mixes gradually, so the flame temperature rises smoothly and the hot zone is relatively short. In the other, mixing is fast and localized, creating a hotter pocket with longer exposure. The second region tends to generate more NOx even if the overall fuel-to-air ratio is identical.
Nitrogen Oxides Mechanisms
In hydrogen-air combustion, NOx typically forms through two mechanisms:
- Thermal NOx: nitrogen and oxygen react at high temperatures via radical pathways.
- Prompt NOx: fast reactions involving hydrocarbon-like intermediates are less central for hydrogen-only chemistry, but nitrogen can still be driven by radicals in the early flame zone.
The practical implication is that NOx control is mostly about controlling temperature and the radical environment, not about fuel composition.
Water Formation and Its Side Effects
Because the dominant product is water, the exhaust has high humidity and strong temperature dependence. Water affects emissions indirectly:
- It changes heat capacity and flame temperature profiles.
- It influences OH availability, which can alter both oxidation completeness and nitrogen chemistry.
A simple example: if the combustor operates with a different cooling strategy that lowers peak temperature, OH levels and reaction rates shift. That can reduce NOx while still maintaining complete hydrogen oxidation.
Incomplete Combustion and Trace Species
Hydrogen is often described as “clean,” but incomplete combustion can still occur near quenching boundaries, during transients, or where mixing is poor. The trace emissions depend on where the flame is extinguished:
- Unburned hydrogen (UHC-H2) can appear if local equivalence ratios are too lean or if quenching occurs before radicals recombine.
- Small amounts of oxygenated intermediates can persist in cooler zones.
A concrete diagnostic example: if exhaust measurements show low NOx but elevated UHC-H2, the engine may be running with effective temperature suppression yet still suffering from local mixing or quench issues.
Emissions Summary Map
Mind Map: Hydrogen Combustion and Emissions Formation
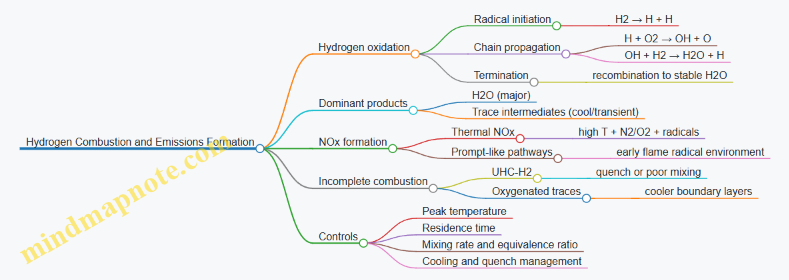
Putting It Together with a System View
A combustor can be viewed as three interacting zones: a mixing zone, a reaction zone, and a quench zone. Hydrogen chemistry is fast, so the reaction zone forms where radicals and oxygen meet in the right proportions. The quench zone then decides whether radicals have time to finish converting to water or whether some hydrogen survives.
If you want a single engineering lever to remember, it’s this: temperature control and mixing control are the two knobs that most directly determine NOx and unburned hydrogen at the same time. Adjusting one without watching the other can trade NOx reduction for higher UHC-H2, or improve completeness while raising peak temperatures.
Example: Equivalence Ratio Shift
Consider a combustor that gradually shifts from slightly lean to slightly richer hydrogen-air mixture. As richness increases, the flame can become hotter because more fuel participates in the reaction zone before quenching. That typically raises thermal NOx. If the mixture becomes too rich locally, oxygen availability drops in parts of the flow, increasing the chance of unburned hydrogen near quench boundaries.
The emissions outcome is therefore not a single monotonic curve; it’s a balance between radical-driven completion and temperature-driven nitrogen chemistry, both shaped by mixing and residence time.
4.2 Engine Cycle Integration for Hydrogen Fueled Propulsion
Hydrogen-fueled propulsion can use either a hydrogen combustion engine or a hydrogen fuel-cell powertrain. In both cases, “cycle integration” means matching the engine’s energy conversion timeline to the aircraft’s fuel, thermal, and control constraints. The goal is simple: deliver the right hydrogen mass flow at the right pressure and temperature, while keeping ignition, efficiency, and safety behavior predictable.
Core Cycle Building Blocks
Start with three coupled loops.
-
Fuel loop: tank pressure, cryogenic boil-off or supply pressure, conditioning to the required injector or stack inlet conditions, and leak detection isolation.
-
Energy conversion loop: combustion chemistry and air-path dynamics, or fuel-cell electrochemistry and power electronics.
-
Thermal loop: heat rejection, cooldown, and transient heat storage that prevents components from drifting outside allowable ranges.
A useful mental model is to treat the engine as a set of “demand signals” (fuel flow, mixture ratio or stack current, and allowable temperatures). The fuel system and thermal system then act as “supply systems” that must respond fast enough without overshoot.
Combustion Cycle Integration
For a hydrogen combustion engine, integration begins with the air-path cycle. Hydrogen has a wide flammability range and fast flame propagation, so the engine’s cycle control must manage ignition timing and mixture formation carefully.
Step 1: Define the required fuel-to-air ratio. In practice, the controller targets a commanded equivalence ratio or a mass-based fuel flow that corresponds to thrust demand. A straightforward example: if the engine controller requests a 10% increase in thrust, it typically increases the air mass flow first (spool or compressor response), then schedules hydrogen injection to reach the new target fuel flow as the combustor conditions stabilize.
Step 2: Choose an injection and mixing strategy. Common approaches include port injection for more uniform mixing or direct injection for more localized control. The integration detail that matters is how injection timing relates to combustor residence time. If injection occurs too early, the mixture can form hot spots; too late, it can reduce combustion completeness and increase unburned hydrogen.
Step 3: Couple ignition and stability to operating point. Hydrogen ignition is sensitive to local conditions. A practical best practice is to tie ignition control to measured combustor pressure and temperature rather than only to throttle position. Example: during a rapid power increase, the controller can temporarily adjust ignition energy or timing based on combustor pressure rise rate, because that rise rate indicates how quickly the mixture is forming.
Step 4: Manage emissions and efficiency through mixture control. Even when the primary objective is thrust, mixture control affects efficiency and thermal load. A simple example is leaner operation at part power to reduce heat release rate, which can lower peak temperatures and thermal stress, but it requires careful monitoring to avoid misfire-like behavior.
Fuel-Cell Cycle Integration
For fuel-cell propulsion, the “cycle” is electrical and thermal rather than purely thermodynamic. Integration means translating aircraft power demand into stack current and managing hydrogen utilization.
Step 1: Convert power demand into stack current. Power electronics and the fuel-cell stack voltage determine the current. Example: if the aircraft demands an additional 50 kW, the controller increases stack current while monitoring voltage sag. Voltage sag is a clue that either hydrogen supply is insufficient, reactant distribution is uneven, or thermal limits are being approached.
Step 2: Control hydrogen utilization with supply pressure and flow. Hydrogen utilization is the fraction consumed relative to what is supplied. Too high utilization can starve downstream cells; too low wastes fuel and can complicate thermal management. A practical integration tactic is to regulate inlet pressure and flow using a feedback loop that references stack temperature gradients.
Step 3: Couple thermal management to electrochemical load. Heat generation in the stack rises with current. The thermal loop must remove that heat without causing large temperature swings that stress materials. Example: during takeoff power, the system can allow a controlled temperature rise while ensuring that coolant flow and heat exchanger effectiveness remain within validated bounds.
Unified Control Integration Logic
Regardless of engine type, integration benefits from a consistent control structure.
- Feedforward from demand: compute a baseline fuel flow or stack current from thrust or power request.
- Feedback from measured states: correct using combustor pressure/temperature or stack voltage/temperature.
- Constraint handling: enforce limits on maximum injection rate, allowable hydrogen partial pressure, and thermal thresholds.
A concrete example for combustion: if the combustor temperature approaches a limit, the controller can reduce hydrogen injection rate while maintaining air flow, shifting toward a safer mixture and preventing runaway heat release. For fuel cells: if stack temperature rises faster than expected, the controller can increase hydrogen flow (lower utilization) and adjust coolant flow to restore the temperature trajectory.
Mind Map: Engine Cycle Integration
Worked Integration Example: Power Step Event
Consider a power step from cruise to a higher thrust setting. In a combustion system, the air-path responds first, raising combustor pressure and changing residence time. The fuel controller then schedules hydrogen injection to reach the new fuel flow target as the combustor conditions approach the expected operating point. Ignition control uses pressure and temperature measurements to avoid mis-timed ignition during the transient.
In a fuel-cell system, the power electronics request higher current immediately. The hydrogen supply loop responds by increasing inlet flow and pressure to prevent voltage sag and excessive temperature gradients. The thermal loop simultaneously adjusts coolant flow so the stack temperature follows an allowable trajectory rather than a purely electrical response.
In both cases, the integration success criterion is the same: the system reaches the new operating point without violating constraints, and the measured states converge to expected values with minimal overshoot.
4.3 Fuel Injection Strategies and Atomization Alternatives
Hydrogen injection is less about “making droplets” and more about controlling where the energy goes and how quickly the fuel mixes with air. In cryogenic systems, the fuel arrives cold and often partially vaporizing, so the injector must manage phase change, pressure drop, and ignition-ready mixture formation without creating unsafe local concentrations.
Core Mixing Problem and What Injection Must Solve
A hydrogen engine needs a mixture that is flammable where it matters and lean enough where it doesn’t. Because hydrogen has a wide flammability range and fast diffusion, small timing or geometry errors can shift combustion from stable to noisy or from complete to incomplete.
Injection strategies therefore target four measurable outcomes:
- Spray or jet coherence: how long the fuel stream stays concentrated before mixing.
- Evaporation and cooling: how much the fuel cools the surrounding charge and walls.
- Ignition location control: where the mixture reaches the right equivalence ratio.
- Wall interaction: how much hydrogen impinges on surfaces that can cause quenching or unwanted heat transfer.
A practical way to think about it is to treat the injector as a “mixing timing device.” The injector doesn’t just deliver fuel; it sets the spatial and temporal pattern of fuel concentration.
Injection Approaches by Phase and Hardware
Hydrogen can be injected as gaseous, liquid, or two-phase (often liquid with rapid flashing). Each approach changes the dominant physics.
-
Gaseous Injection
- The jet is already vapor, so atomization is not the goal.
- The main levers are orifice diameter, injection pressure, jet momentum, and swirl or tumble in the intake.
- Example: If you reduce orifice diameter while keeping pressure constant, you increase jet velocity and penetration, which can improve mixing near the spark but may increase wall impingement at low engine speeds.
-
Liquid Hydrogen Injection
- Atomization matters, but “droplet size” is not the only metric because flashing dominates.
- The injector must withstand cryogenic temperatures and avoid clogging from contaminants.
- Example: A multi-hole injector can distribute jets to reduce local equivalence ratio peaks, but it also increases the number of potential leak paths and requires careful material compatibility.
-
Two-Phase Injection
- This is common when liquid hydrogen flashes during injection due to pressure drop and heat transfer.
- The injector design focuses on controlling flashing rate and limiting coherent liquid cores.
- Example: If the pressure drop is too aggressive, you get rapid flashing that can create a dense vapor pocket, delaying mixing with the bulk air and increasing the risk of misfire.
Atomization Alternatives That Still Work
Traditional atomization aims to break liquid into small droplets. With hydrogen, the more useful concept is controlling the transition from liquid or dense vapor to a well-mixed gas.
- Flash-Driven Disintegration: Use pressure drop and injector geometry to encourage controlled flashing. The “atomization” is effectively the phase change.
- Impinging Jet Mixing: Direct two jets toward each other so the collision disrupts coherence and accelerates mixing. This can reduce wall contact compared with a single high-penetration jet.
- Swirl-Assisted Mixing: Combine injection with intake swirl so the fuel is stretched into thin sheets or filaments. Hydrogen’s fast diffusion then completes the mixing quickly.
- Staged Injection: Split fuel into two pulses. The first pulse sets mixture preparation, and the second fine-tunes equivalence ratio near ignition.
A simple example of staged injection: at a given load, inject 60% early to establish a baseline mixture and 40% later to correct for cylinder-to-cylinder variation. The second pulse can be timed to avoid over-rich pockets.
Mind Map: Injection Strategy Decision Logic
Design Workflow with Concrete Checks
A systematic workflow keeps the design from becoming “trial and error with expensive parts.”
- Choose the injection state based on engine cycle and available cryogenic supply. If the system can reliably deliver two-phase at controlled conditions, two-phase injection can reduce hardware complexity compared with fully vaporizing upstream.
- Set the jet momentum target so penetration matches the ignition zone. A quick check is to compare jet penetration trends with engine speed: if penetration grows too much at low speed, expect wall interaction.
- Select geometry for mixing. For gaseous injection, prioritize swirl and jet angle. For liquid or two-phase injection, prioritize orifice design that moderates flashing.
- Plan staged injection timing if the engine shows sensitivity to equivalence ratio. Use timing offsets to correct mixture distribution rather than changing total fuel mass every time.
- Verify with instrumentation. Use cylinder pressure traces for combustion stability and temperature or heat flux proxies for wall interaction. If wall interaction rises, reduce penetration or adjust injection timing before changing hardware.
Example: Orifice Choice and Its Side Effects
Suppose you need more fuel delivery at the same overall equivalence ratio. Increasing injection pressure can raise jet momentum and improve mixing, but it also increases the risk of wall contact and can intensify flashing in two-phase systems. Alternatively, increasing orifice area can reduce pressure drop and soften flashing, but it may lower jet velocity and weaken penetration. The “best” choice is the one that keeps the ignition zone supplied without creating a rich pocket or a cold wall film.
In hydrogen engines, the injector is a mixing instrument. When you design it around phase behavior and mixture formation—rather than droplet size alone—you get a system that behaves predictably across operating points.
4.4 Ignition Stability and Combustion Control Methods
Hydrogen ignition stability is about two things happening reliably: the fuel must reach a flammable mixture state at the right time, and an ignition source must create a flame that can survive the local flow and temperature conditions. In practice, “stable” means repeatable across small variations in tank pressure, fuel temperature, inlet conditions, and engine wear.
Core Concepts for Stable Ignition
Hydrogen has a wide flammability range and fast flame propagation, which helps ignition, but it also makes the system sensitive to mixture formation. If the mixture is too lean or too rich locally, the flame can fail or flash back toward upstream components.
A useful mental model is a three-step chain: mixing → ignition → flame holding.
- Mixing: The fuel must be distributed so that a region near the igniter reaches a target equivalence ratio. For cryogenic hydrogen, the injection event also cools the local gas, which can slow chemical reactions if the mixture is marginal.
- Ignition: The igniter must provide enough energy and the right location. With hydrogen, the required energy is often lower than for many hydrocarbons, but the placement still matters because the flame kernel must form where the mixture is within the flammable range.
- Flame holding: After the kernel forms, the flow must not blow it out. Flame holding depends on residence time, turbulence intensity, and local equivalence ratio.
Ignition Stability Metrics and What They Mean
Engine teams typically track stability using metrics that connect directly to control decisions:
- Ignition delay: Time from commanded ignition to sustained combustion. Shorter delay reduces the chance of accumulating an overly large combustible cloud.
- Misfire rate: Fraction of attempts that fail to establish a stable flame. This is usually tied to mixture formation and igniter effectiveness.
- Combustion oscillation tendency: Hydrogen can support strong coupling between heat release and pressure waves. Control aims to avoid conditions that amplify oscillations.
A practical example: during start, if ignition delay increases slightly due to colder inlet air, the controller may inject more fuel before the flame establishes. That can shift the local mixture toward rich, increasing soot-free but potentially unstable heat release and pressure oscillations.
Combustion Control Methods That Support Ignition
Ignition stability improves when the controller manages mixture formation and timing rather than relying only on the igniter.
Fuel Injection Timing and Shaping
For hydrogen, injection timing is tightly linked to ignition delay. A common approach is to use a staged strategy:
- Pilot injection creates a small, controllable region near the igniter.
- Main injection follows once the flame is confirmed.
Example: if the engine uses a pilot to establish a flammable pocket, the controller can keep the main injection off until sensors indicate stable combustion. This reduces the risk of a large premixed cloud forming before ignition.
Mixture Ratio Control with Local Awareness
Even if the average equivalence ratio is correct, local deviations can cause misfire or flashback. Control systems therefore use fast feedback and conservative limits during ignition transients.
Example: during throttle changes, the controller may temporarily restrict maximum injection rate so that the mixture near the igniter remains within a safe flammability window.
Igniter Energy and Placement Strategy
Igniter energy must be sufficient to form a kernel that survives local quenching. Placement affects whether the kernel forms in a region with adequate mixture and temperature.
Example: if the igniter is positioned where the injected hydrogen jet tends to be too cold, the kernel may form but fail to grow. Adjusting injection angle or using a slightly higher pilot mass can restore kernel growth without increasing igniter energy indefinitely.
Feedback Signals for Combustion Confirmation
Controllers need a fast way to decide whether ignition has succeeded. Typical signals include:
- Pressure rise rate: A sustained combustion event produces a characteristic pressure signature.
- Exhaust temperature trend: A stable flame leads to a measurable temperature increase after a short lag.
- Vibration or acoustic indicators: Combustion instability often leaves a signature in the frequency content of engine vibration.
Example: after a commanded ignition, the controller waits for a pressure-rise threshold rather than a fixed time. This makes the logic robust to variations in inlet temperature.
Mind Map: Ignition Stability and Combustion Control
Example: A Systematic Ignition Control Sequence
A coherent control sequence ties together timing, injection staging, and confirmation:
- Pre-ignition conditioning: Set injection limits based on inlet temperature and tank pressure so the local mixture near the igniter is likely to be flammable.
- Pilot injection and ignition command: Inject a small pilot mass, then trigger the igniter at a fixed offset relative to pilot start.
- Combustion confirmation window: Monitor pressure rise rate. If the threshold is reached, transition to main injection.
- Failure handling: If confirmation is not reached, stop main injection and retry with adjusted pilot mass or timing, while keeping within safety limits.
- Stability enforcement: Once running, apply mixture ratio and injection rate constraints to avoid conditions that increase oscillation tendency.
This sequence prevents the most common control mistake: treating ignition as a single event. In hydrogen engines, ignition is a short control problem—mixing and timing decide whether the igniter gets a fair chance.
4.5 Engine Health Monitoring Using Hydrogen Specific Parameters
Hydrogen propulsion systems fail in ways that are partly familiar and partly unique. The familiar parts are mechanical wear, sensor drift, and control instability. The unique parts come from hydrogen’s fast diffusion, cryogenic handling, and combustion behavior that changes with mixture formation. Engine health monitoring should therefore track both general propulsion indicators and hydrogen-specific signals, then connect them to actionable maintenance decisions.
Core Monitoring Goals
Start with three goals: detect abnormal operation early, identify the likely subsystem, and quantify remaining performance margin. For hydrogen engines, “abnormal” often shows up as mixture quality shifts, fuel delivery irregularities, or ignition stability changes. A good monitoring design makes these visible through parameters that respond quickly and measurably.
Hydrogen Specific Parameter Set
Use a layered parameter set.
- Fuel Delivery Quality
- Hydrogen mass flow estimate error: compare commanded flow to measured flow (from a cryogenic-to-delivery conditioning section). Example: if the controller requests 20 g/s but the measured value trends 10% low during steady throttle, suspect valve leakage, regulator drift, or sensor bias.
- Line pressure oscillation: monitor pressure ripple near the injector manifold. Example: a growing oscillation amplitude at constant throttle can indicate cavitation-like behavior in a regulator or partial blockage that changes local flow resistance.
- Mixture Formation and Combustion Stability
- Ignition timing sensitivity: track how much ignition advance is required to maintain stable combustion. Example: if the engine needs progressively more advance at the same operating point, combustion may be weakening due to injector fouling or altered spray/atomization.
- Combustion stability index: compute a normalized metric from pressure rise rate or combustion chamber pressure variance. Example: a sudden increase in variance during the same power setting can indicate injector spray pattern changes or a transient hydrogen concentration stratification.
- Hydrogen Leak and Vent Interaction Indicators
- Fuel system temperature anomalies: monitor temperatures around seals, manifolds, and vent interfaces. Hydrogen’s small molecule size can cause subtle cooling patterns near leaks. Example: a gradual drop in a local seal-region temperature without a corresponding change in commanded flow suggests increased heat sink from escaping hydrogen.
- Vent event correlation: log vent valve activations and compare them to combustion stability. Example: if vent events become more frequent and coincide with unstable ignition, the system may be losing usable fuel before it reaches the injector.
- Thermal and Mechanical Health Context Hydrogen monitoring should not ignore the basics. Track turbine inlet temperature margin, vibration, and oil system parameters. The hydrogen-specific signals help explain why a general parameter is changing.
Signal Processing and Decision Logic
Hydrogen systems benefit from monitoring that separates “fast” and “slow” changes.
- Fast layer: detect transients using short windows (seconds). Use it for ignition stability and pressure ripple.
- Slow layer: detect drift using longer windows (minutes). Use it for sensor bias, regulator wear, and gradual injector performance loss.
A practical approach is a rule-based diagnostic overlay on top of model-based estimates.
- Example rule: “If commanded flow is within ±3% of measured flow, but ignition timing required increases by more than 2 degrees over 10 minutes at constant power, flag injector spray degradation.”
- Example rule: “If pressure ripple amplitude increases by 30% while mean manifold pressure stays constant, flag regulator flow instability or partial restriction.”
Mind Map: Hydrogen Engine Health Monitoring
Example: Building a Fault Isolation Chain
Consider a scenario at steady cruise power.
- Observation A: measured hydrogen mass flow is 8% low versus commanded.
- Observation B: manifold pressure mean is unchanged, but pressure ripple amplitude increases.
- Observation C: ignition timing required increases gradually over 10 minutes.
A coherent diagnosis chain is:
- Low delivered flow plus increased ripple points to a delivery component with unstable flow resistance, such as a regulator or valve seat wear.
- The gradual ignition timing increase links the delivery change to mixture quality degradation, not just sensor error.
- If seal-region temperatures remain normal and vent events are unchanged, a leak is less likely than internal flow instability.
The monitoring output should therefore isolate the likely subsystem (fuel conditioning/regulation) and recommend a targeted inspection (valve seat condition, regulator calibration, injector spray verification) rather than a blanket overhaul.
Evidence Quality and Operational Use
Health monitoring is only useful if it produces evidence that matches maintenance reality. Record the operating point, the parameter window used, and the diagnostic rule that triggered. Example: “At 85% power, within 2–3 minutes of steady state, ignition timing sensitivity exceeded threshold while pressure ripple rose; diagnostic confidence high for regulator instability.” This keeps the system understandable to both engineers and technicians, and it prevents “mystery alarms” from becoming routine.
Finally, ensure the monitoring logic accounts for normal operating transitions. Hydrogen engines often experience controlled cooldown and conditioning phases; the monitoring system should treat those periods as expected, so it flags faults based on deviations from the known sequence rather than on raw parameter values alone.
5. Hydrogen Fuel Cells for Aircraft Power
5.1 Fuel Cell Types and Operating Principles for Aviation
Fuel cells convert hydrogen and oxygen into electricity, with water as the main product. In aviation, the key question is not just “does it make power,” but “does it make the right power at the right time, with the right thermal and safety behavior.” The main fuel cell types differ in how they conduct ions, what temperatures they run at, and how they handle start-up and water.
Core Operating Principle
A fuel cell is an electrochemical device with an anode, a cathode, and an electrolyte. Hydrogen reaches the anode and splits into protons and electrons. Protons move through the electrolyte, while electrons travel through an external circuit, producing usable current. At the cathode, oxygen combines with protons and electrons to form water.
A useful mental model is to separate the system into three layers:
- Electrochemistry: the reactions at anode and cathode.
- Transport: moving hydrogen, oxygen, and water to where they are needed.
- Controls: regulating pressure, flow, and temperature so the cell stays within safe operating limits.
If you’ve ever watched a kettle, you already understand the importance of water management. In a fuel cell, water is both a product and a potential problem: too little water dries the membrane or electrolyte; too much water floods flow channels and blocks reactants.
Proton Exchange Membrane Fuel Cells
PEM fuel cells use a polymer membrane that conducts protons. They operate at relatively low temperatures compared with many other types, which makes them responsive to power changes.
Why PEM is attractive for aviation
- Fast response: power can track load changes more quickly than high-temperature designs.
- Compact thermal behavior: heat removal is manageable with appropriate heat exchangers.
What must be controlled
- Membrane hydration: the membrane needs water to conduct protons.
- Water balance: water produced at the cathode must be removed without drying the membrane.
Simple example Imagine a short climb where electrical demand rises quickly. A PEM system typically increases hydrogen and oxygen flow, adjusts stack temperature, and manages water so the membrane stays conductive. If water removal is too aggressive, performance drops because the membrane dries.
Phosphoric Acid Fuel Cells
Phosphoric acid fuel cells use an acid electrolyte that conducts ions. They operate at higher temperatures than PEM, which can help with certain water and contamination issues.
Key characteristics
- More tolerant operation than very low-temperature designs in some respects.
- Different thermal profile: heat management and start-up behavior differ.
What must be controlled
- Acid retention and corrosion: materials must resist chemical attack.
- Water and heat removal: the system still needs careful thermal design, just with different constraints.
Simple example During a longer steady segment, the system can maintain stable operation with less sensitivity to rapid transients. The trade is that start-up and power ramping are not as immediate as PEM.
Solid Oxide Fuel Cells
Solid oxide fuel cells use a ceramic electrolyte that conducts oxygen ions at high temperatures. They can achieve high efficiency in the right operating conditions, but the high temperature changes the engineering priorities.
Key characteristics
- High operating temperature: requires robust thermal insulation and careful warm-up.
- Different water behavior: water management is tied to high-temperature gas-phase processes.
What must be controlled
- Thermal cycling: repeated heating and cooling can stress ceramic components.
- Fuel and oxygen utilization: operating points must avoid damaging conditions.
Simple example If the aircraft needs power after a long ground period, a solid oxide system must reach operating temperature before it can deliver full performance. That warm-up time affects how you plan electrical load sharing with other power sources.
Alkaline Fuel Cells
Alkaline fuel cells use an alkaline electrolyte. They can be efficient and have distinct material and water-handling behavior.
Key characteristics
- Ion transport via hydroxide in the electrolyte.
- Water and CO2 sensitivity: alkaline systems can be affected by contaminants that change electrolyte chemistry.
What must be controlled
- Gas purity: contaminants can reduce performance.
- Electrolyte stability: maintaining consistent ionic conductivity.
Simple example If oxygen supply quality varies, the system may need additional conditioning or control logic to keep performance stable. The control system must treat water and gas composition as first-class variables.
Mind Map: Fuel Cell Types and Operating Principles
Operating Principle to Aviation Integration
Regardless of type, aviation fuel cell stacks are rarely “standalone.” They require a balance-of-plant that conditions reactants, manages water and heat, and monitors electrical and thermal limits. The operating principle stays the same, but the engineering emphasis shifts with electrolyte behavior: PEM focuses on hydration and rapid response, solid oxide focuses on thermal management, phosphoric acid focuses on chemical stability, and alkaline focuses on purity and electrolyte chemistry.
A practical way to compare types is to map each one to three aviation questions: How quickly can it reach usable power? How does it handle water without flooding or drying? How does it behave when the thermal environment changes? The answers follow directly from the electrolyte and operating temperature, which is why those two design choices dominate the rest of the system architecture.
5.2 Stack Design Considerations for Vibration and Thermal Loads
Fuel cell stacks in aircraft live a double life: they must survive vibration like a well-behaved mechanical assembly, and they must manage temperature like a careful thermal engineer. The stack is a layered system—cells, bipolar plates, gaskets, manifolds, current collectors, and end hardware—so vibration and thermal loads interact through contact pressure, material properties, and fluid distribution.
Foundational Load Paths and Why They Matter
Start with the mechanical load path. During operation, the stack experiences axial forces from clamping, bending from mounting, and local stresses from uneven thermal expansion. Vibration adds cyclic shear and micro-slips at interfaces. Thermal loads add expansion mismatch between plates, frames, and seals. If clamping force is too low, cyclic motion reduces contact pressure and increases electrical resistance. If it is too high, seals can creep and plates can warp, both of which degrade performance.
A practical way to reason about this is to treat the stack as a set of springs in series: the clamping hardware provides stiffness, the gaskets provide compliance, and the plates provide bending resistance. Vibration tends to move the system at its natural frequencies; thermal gradients tend to change the stiffness and preload over time.
Vibration Design: From Mounting to Interface Friction
Vibration control begins at the mounting interface. Use a mounting scheme that limits bending moments into the stack. For example, if the stack is mounted on two points, ensure the support geometry constrains rotation so the stack does not “see” a twisting moment during engine harmonics.
Next, manage relative motion at interfaces. Many degradation mechanisms are friction-related: micro-slips can fretting-corrode contact surfaces, and they can pump reactant gases through unintended paths if gaskets lose compression. Design choices that help include:
- Clamping strategy: distribute preload across the stack face so local hotspots do not become local slip zones.
- Surface finish and coatings: keep contact surfaces consistent so friction coefficients are predictable.
- Damping: add constrained-layer damping where it does not interfere with service access or airflow.
A simple check is to compare expected vibration-induced displacement at the interface to the allowable slip before contact pressure drops below a target. If you can’t measure displacement directly, use a conservative stiffness model and verify with a modal test.
Thermal Load Design: Gradients, Expansion, and Water Management
Thermal design is not just “keep it cool.” The stack experiences gradients across plates and along flow channels. Those gradients drive differential expansion, which changes gasket compression and can distort flow fields.
Key practices include:
- Uniform temperature distribution: balance coolant or reactant flow so the plate-to-plate temperature spread stays within a range that seals can tolerate.
- Controlled cooldown and startup: avoid steep temperature ramps that create transient stress peaks.
- Water and heat coupling: water production and removal affect local temperatures and membrane hydration, so thermal design must be consistent with humidification and drainage.
A useful mental model is to separate steady-state thermal stress from transient thermal stress. Steady-state stress is mostly about mismatch under stable gradients. Transient stress is about ramp rates and how quickly each component reaches its operating temperature.
Integrated Design: How Vibration and Thermal Loads Team Up
Vibration can worsen thermal effects by changing contact pressure and altering thermal contact resistance. Thermal cycling can worsen vibration effects by relaxing clamping force through gasket creep and by changing friction conditions at interfaces.
To integrate the two, design around the worst combined condition: high vibration plus high thermal gradient, or high vibration plus reduced preload after thermal soak. In practice, that means:
- Preload margin: choose clamping force that remains adequate after thermal relaxation.
- Seal selection and compression targets: ensure gasket materials maintain compression under both temperature and cyclic loading.
- Flow-field stability: verify that thermal expansion does not shift manifold alignment enough to create uneven reactant distribution.
Example: A Stack Interface Stress Check
Suppose a gasket stack-up is designed for a target compression of 20% at nominal temperature. During a thermal cycle, the gasket relaxes by 30% of that compression. Now consider vibration: if the interface experiences cyclic shear that causes micro-slip, the effective contact area can shrink, raising local current density and heat generation. The integrated check is to confirm that even with reduced compression and increased local resistance, the peak temperature stays below the membrane and plate limits and the contact pressure stays above the threshold needed for sealing.
Mind Map: Vibration and Thermal Stack Design
Verification Approach That Actually Connects to Failure Modes
Use tests that measure the things that fail. Modal testing confirms where the stack moves; thermal cycling confirms how preload and temperatures evolve; post-test inspection confirms whether fretting, seal deformation, or manifold misalignment occurred. Then tie those observations back to performance metrics like voltage stability under load and reactant distribution uniformity. If the stack survives vibration and thermal cycling but performance drifts, the likely culprit is contact resistance changes or flow-field distortion—both are interface problems, not just “thermal problems.”
5.3 Balance of Plant Components for Cryogenic Hydrogen Supply
A cryogenic hydrogen fuel cell system is more than a tank and a stack. The balance of plant (BoP) is the set of components that turns “cold liquid hydrogen exists” into “the fuel cell receives the right hydrogen conditions at the right time.” The goal is consistent delivery with predictable transients, while keeping leaks, thermal losses, and control complexity under control.
Core Functions of the Cryogenic Hydrogen BoP
First, the BoP must manage phase and temperature. Liquid hydrogen arriving at the wrong pressure or with the wrong heat history can flash into vapor, changing flow rates and stressing downstream regulators.
Second, the BoP must condition pressure and flow. Fuel cells prefer stable inlet conditions because stack voltage and current draw respond to hydrogen availability.
Third, the BoP must handle byproducts and recovery. In a fuel cell system, you must manage water removal, purge behavior, and any hydrogen recirculation or venting paths.
Fourth, the BoP must provide sensing and control. Without good measurements, you end up tuning by guesswork, which is expensive and unreliable.
Mind Map: Cryogenic Hydrogen Supply BoP
Tank Outlet and Isolation
Start at the tank outlet. A practical BoP uses an isolation valve close to the tank so maintenance and fault response do not require draining the entire system. A small strainer upstream of sensitive regulators prevents debris from causing sticking or seat damage. A simple example: if a coupling introduces particulate during service, a downstream regulator can oscillate or fail to hold pressure; the strainer turns that into a manageable maintenance item.
Phase and Thermal Conditioning
Cryogenic hydrogen can arrive as liquid, vapor, or a mixture depending on boil-off, line heat leak, and cooldown history. The BoP typically includes a vapor-liquid management approach so the regulator sees a predictable inlet state. One common method is to use a controlled “conditioning volume” or a geometry that promotes separation before pressure reduction.
Example: imagine a regulator fed by a two-phase mixture. If the vapor fraction changes with small temperature shifts, the regulator inlet pressure can fluctuate, causing downstream flow to hunt. Adding a separation volume reduces sensitivity by letting the mixture settle into a more stable condition.
Pressure Conditioning with Redundancy
Pressure conditioning is usually staged. A primary regulator reduces tank pressure to an intermediate level, and a secondary regulator trims to the fuel cell inlet setpoint. Staging improves controllability and reduces the chance that a single component failure drives the system out of limits.
Example: during a rapid load increase, the fuel cell draws more hydrogen. A single regulator may momentarily saturate, leading to inlet pressure sag. With two stages, the primary stage handles larger pressure swings while the secondary stage maintains tighter control.
Relief and burst paths must be designed as independent protective layers. A relief valve is not a control valve. It should open when pressure exceeds safe limits, not when the controller asks for more flow.
Flow Conditioning and Measurement
Flow control is where “it works on the bench” becomes “it works in flight.” Mass flow measurement is preferred because it directly relates to hydrogen availability for the stack. A control valve then adjusts flow to match the fuel cell demand.
Example: if you control using only pressure, you can get the right pressure but the wrong flow when line conditions change. Adding a mass flow sensor lets the controller correct for those changes.
Damping elements such as calibrated orifices or flow restrictors can reduce oscillations. They act like the system’s shock absorbers, especially when valves are fast and the thermal system is slow.
Safety and Leak Management Integration
Leak detection sensors should be placed where hydrogen is most likely to accumulate, typically near low points and around potential release paths. Shutoff valves and control logic must be coordinated so that a detected leak triggers isolation quickly.
Example: if a leak sensor triggers but the isolation valve is downstream of the leak location, hydrogen can continue feeding the leak area. Placing isolation valves upstream of likely leak points ensures the response actually stops the source.
Venting routes must avoid creating ignition-prone zones. Even when hydrogen is vented safely, the system must ensure that vent discharge does not interfere with sensors or create backpressure that affects regulators.
Fuel Cell Interface and Manifold Distribution
At the fuel cell interface, the BoP delivers hydrogen to an inlet manifold that distributes flow evenly across the stack. Uneven distribution can create local starvation or excess, which shows up as voltage non-uniformity.
Example: if one manifold branch has a longer path or different restriction, it can lag during transients. Matching branch lengths and using consistent flow resistances helps keep the stack operating conditions uniform.
Instrumentation and Control Signals
Temperature and pressure sensors at key nodes let the controller distinguish between “not enough hydrogen” and “hydrogen is present but too warm or too two-phase.” This matters because the same inlet pressure can correspond to different hydrogen states.
A practical control approach uses measured inlet pressure and mass flow as primary feedback, with temperature as a constraint. If temperature indicates excessive flashing, the controller can adjust valve commands to protect the stack from unstable supply conditions.
Worked Example: Load Step Response
Consider a step from low to higher electrical load. The controller increases the flow valve opening. The primary regulator responds to tank pressure changes, while the secondary regulator maintains inlet pressure. Mass flow feedback confirms that the hydrogen rate matches demand. If inlet temperature rises, indicating increased flashing, the controller limits valve opening to prevent oscillatory two-phase behavior.
The result is not just “reaching the setpoint,” but staying there without hunting, overshoot, or repeated safety trips. That stability is the practical definition of a well-integrated BoP.
5.4 Water and Heat Management in Fuel Cell Systems
Fuel cells turn hydrogen and oxygen into electricity, water, and heat. In an aircraft system, the tricky part is that water and heat are coupled: the same reactions that produce electricity also create water and thermal loads that affect humidity, membrane hydration, and stack efficiency. Good management keeps the membrane hydrated without flooding, keeps temperatures uniform enough to avoid stress, and routes water so it can be removed safely.
Core Mechanisms That Set the Water Balance
Start with what the stack needs. The proton-conducting membrane requires a stable hydration level to maintain conductivity. If the membrane dries, resistance rises and voltage drops. If the membrane is too wet, liquid water can block gas pathways in the flow fields and diffusion layers.
Water appears in two main ways. First, the electrochemical reaction produces water at the cathode. Second, water can enter from humidification hardware or from condensation when cooling surfaces are below the dew point. A practical design treats water as a flow problem: generation, transport through porous media, phase change, and removal.
A simple example: imagine the cathode channel as a hallway. Gas is the crowd, and liquid water is a spilled puddle. If the puddle grows, fewer people can pass through the doorway openings, so oxygen supply drops and the cell voltage falls. The goal is to keep puddles small and mobile enough to be carried out.
Thermal Loads and Why Temperature Uniformity Matters
Heat comes from two sources: reaction enthalpy and electrical losses. Even when average stack temperature looks acceptable, local hot spots can occur due to uneven current distribution, nonuniform reactant flow, or differences in cooling contact. Hot spots accelerate membrane aging and can worsen water transport by changing local saturation conditions.
A useful rule of thumb for system thinking is to separate “average temperature control” from “local temperature control.” Average control is handled by the cooling loop setpoint and flow rate. Local control depends on stack design, coolant plate contact, and how water affects thermal conductivity and contact resistance.
Humidity Control Strategy Using Condensation Logic
Many systems use humidification and/or rely on water produced in the stack. Either way, the key variable is relative humidity at the membrane interface. Engineers often manage humidity indirectly by controlling cathode inlet conditions and by designing the cooling loop so that surfaces do not repeatedly cross the dew point.
Consider a concrete scenario. If the cathode inlet air is too dry, the membrane dries during high power demand. If it is too humid, liquid water forms in the cathode and can flood the diffusion layer. A practical approach is to use sensors for inlet humidity and stack outlet water indicators, then adjust humidification or air flow to keep the membrane in a target hydration band.
Water Removal Paths and Component Roles
Water removal is not one action; it is a chain. In the cathode, liquid water must be transported from the reaction sites into channels and then out of the stack. Downstream, separators and drains manage collected water so it does not re-enter the stack.
Typical roles:
- Flow fields distribute reactants and provide pathways for water to move.
- Diffusion layers balance gas diffusion and liquid transport.
- Separators reduce liquid carryover into downstream piping.
- Drains and low points collect water without trapping it.
A practical example: if a drain line has no slope, water can pool and later release in a slug. That slug can momentarily flood the stack, causing a short voltage sag. Routing with consistent low points and controlled drain valves avoids this “water seesaw.”
Cooling Loop Design for Coupled Water and Heat
The cooling loop must remove heat while avoiding conditions that promote unwanted condensation. Coolant temperature setpoints, flow distribution, and heat exchanger sizing determine both thermal performance and water behavior.
A systematic design approach:
- Define allowable stack temperature range and maximum allowable gradients.
- Model heat generation versus current density to estimate peak loads.
- Choose coolant flow control that can respond to power changes without overshoot.
- Ensure coolant passages do not create stagnant regions where local boiling or excessive condensation could occur.
Example: during a climb, power increases and heat generation rises. If coolant flow lags too much, the stack temperature rises and the membrane may dry or overheat depending on humidity conditions. If coolant flow overshoots, surfaces may cool below dew point, increasing condensation and flooding risk. The control system should coordinate coolant response with cathode air and humidification settings.
Instrumentation That Actually Guides Decisions
Water and heat management needs measurements that map to the physical problems.
Recommended signals:
- Stack inlet and outlet temperatures for thermal gradients.
- Cathode inlet humidity or dew point proxy.
- Pressure drop across stack and manifolds as an indirect flooding indicator.
- Water accumulation indicators at separators and drains.
- Cell voltage distribution or proxy for local hot spots.
A simple diagnostic example: if pressure drop rises while outlet humidity increases, the system may be accumulating liquid water in the cathode. If temperatures rise without a corresponding pressure drop change, the issue may be heat removal capacity or local contact.
Mind Map: Water and Heat Management in Fuel Cell Systems
Integrated Example Workflow for a Steady Power Segment
- Set target stack temperature range and allowable gradient.
- Establish cathode inlet humidity and flow to keep membrane hydration within a stable band.
- Run coolant flow control to remove expected heat generation at the current power level.
- Monitor pressure drop and outlet humidity to detect early flooding or drying.
- If pressure drop rises and outlet humidity increases, reduce humidification or increase gas flow to improve water removal.
- If temperatures rise while pressure drop stays stable, increase coolant flow or check heat exchanger effectiveness.
This workflow keeps water and heat management as one coordinated system rather than two separate checklists. The stack stays hydrated, the cathode stays clear, and the thermal field stays even enough that the membrane and materials can do their job without unnecessary stress.
5.5 Electrical Integration with Propulsion and Auxiliary Loads
Electrical integration in a hydrogen aircraft is mostly about making power behave: delivering the right voltage and current to propulsion and auxiliaries, while keeping cryogenic fuel systems, safety sensors, and thermal management from getting surprised. The key is to treat the electrical system as a set of coordinated control loops rather than a pile of wires.
Core Power Architecture
Start with the propulsion power path. In a fuel-cell or hybrid-electric setup, electrical generation typically produces DC that must be conditioned for motor drives (or for DC bus loads). A practical architecture uses one or more DC buses, then distributes power through controlled contactors and fuses to propulsion inverters and auxiliary converters.
A good integration practice is to define three layers of responsibility:
- Energy conversion: fuel cell stack to DC bus, DC bus to motor drive input.
- Power distribution: bus bars, breakers, fuses, contactors, and current sensing.
- Control and protection: supervisory controllers, fast protection hardware, and fault isolation logic.
Example: if the auxiliary system draws 20 kW for cabin and avionics cooling, the propulsion controller should know whether that load is “firm” (must be supplied) or “shed-able” (can be reduced) during a transient like a fuel conditioning event.
Bus Voltage Selection and Load Segmentation
Bus voltage affects current, cable mass, and how easily you can isolate faults. Higher bus voltage reduces current for the same power, which helps with conductor sizing and losses. But higher voltage also increases insulation and arc-management requirements.
Segment loads by criticality and by their tolerance to brief interruptions. Propulsion-critical loads get the most robust supply path; auxiliary loads can be grouped into tiers with staged shedding.
A simple rule of thumb for integration: propulsion and flight-critical avionics should share the “least interruptible” bus, while non-critical loads connect through controlled converters that can ramp down gracefully.
Propulsion Drive Integration
Motor drives are where electrical integration becomes real engineering. The drive needs stable DC input, predictable current limits, and clear fault signals. The propulsion controller also needs feedback from the drive and from the hydrogen system.
Integrated control practice:
- Current limiting coordination: the propulsion controller sets torque demand; the drive enforces current limits; the energy source controller ensures the DC bus can support the demanded power.
- Bus voltage droop handling: if the DC bus sags during a high torque step, the drive should request reduced torque rather than tripping immediately.
Example: during takeoff power, a sudden auxiliary compressor start can cause a short bus droop. With coordinated droop logic, the propulsion controller can momentarily reduce motor torque by a small amount while the auxiliary converter soft-starts.
Auxiliary Loads and Power Quality
Auxiliary loads include pumps, valves, compressors, avionics power supplies, lighting, and thermal management components. Many of these are not purely resistive; they can create ripple currents and transient demands.
Power quality integration focuses on:
- Converter control stability: ensure auxiliary converters do not fight the propulsion converters.
- Inrush management: use pre-charge circuits for capacitive loads and controlled enable sequences for motor starters.
- Harmonic and ripple containment: place filtering where it reduces stress on the DC bus and on sensitive sensors.
Example: a cryogenic hydrogen system may use electrically driven valves and pump motors. If those loads are enabled simultaneously at high bus impedance, you can get oscillations in converter control loops. Staggering enable timing by a few hundred milliseconds often prevents the “everyone starts at once” problem.
Protection, Isolation, and Safety Signaling
Protection must be fast, selective, and understandable. Electrical faults can be hard to localize, so design for isolation: fuses and contactors should clear faults without collapsing the entire bus.
A robust integration set includes:
- Overcurrent protection at each branch.
- Bus overvoltage and undervoltage detection with defined response actions.
- Ground fault monitoring appropriate to the system grounding scheme.
- Emergency power paths for flight-critical avionics and controls.
Safety signaling practice: the hydrogen safety controller should receive clear electrical status signals such as “fuel pump enabled,” “vent valve armed,” or “bus fault active.” In return, the propulsion controller should receive “hydrogen system inhibited” signals so it can reduce torque demand rather than continuing to request power that cannot be safely delivered.
Example: if a leak detection channel triggers an isolation state, the electrical system should automatically prevent non-essential loads from restarting, while allowing flight-critical control power to remain stable.
System-Level Control Coordination
At the system level, integration means defining who commands whom. A common approach is a supervisory power manager that arbitrates between propulsion torque demand, auxiliary load requests, and energy source limits.
Key coordination signals:
- Torque demand and current limits from propulsion control.
- Power availability and ramp constraints from the energy source controller.
- Load shedding commands and priority levels from the power manager.
- Fault states from protection hardware.
Example: during a cooldown phase, thermal loads may increase while propulsion demand is low. The power manager can prioritize maintaining stable bus voltage for avionics while allowing non-critical thermal pumps to run at reduced speed.
Mind Map: Electrical Integration with Propulsion and Auxiliary Loads
Worked Example: Coordinated Start Sequence
Assume propulsion is idling with a stable DC bus. The auxiliary system requests a pump start and a valve actuation sequence.
- The power manager checks bus voltage headroom and verifies no active fault state.
- It enables the auxiliary converter with pre-charge, then waits for bus ripple to settle.
- It commands the pump motor drive to ramp current within the propulsion-aligned limit.
- If a bus droop threshold is crossed, it reduces pump torque demand before any protective trip.
- It logs the event and sets a short inhibit timer for non-critical loads, preventing a second “stacked transient.”
This sequence keeps propulsion stable, prevents unnecessary trips, and ensures the hydrogen system receives consistent electrical conditions for safe operation.
6. Thermal Management and Cryogenic Heat Transfer
6.1 Heat Transfer Modes in Cryogenic Aircraft Environments
Cryogenic hydrogen systems lose energy mainly through heat transfer into the tank and associated lines. In an aircraft, the “environment” is not just ambient air; it includes vibration-driven convection, radiation exchange with nearby structures, and transient conditions during cooldown, taxi, climb, and cruise. A useful way to design is to treat heat ingress as the sum of distinct modes, then decide which mode dominates for each component and operating phase.
Core Heat Transfer Modes
Conduction moves heat through solids by molecular interactions. In aircraft tanks, conduction matters in tank walls, support struts, insulation layers, and mounting brackets. A practical example: if a support strut bridges the insulation, it becomes a thermal shortcut. Even if the insulation is excellent, the strut can carry a surprising fraction of heat because its cross-sectional area is not tiny.
Convection transfers heat between a surface and a moving fluid. For cryogenic tanks, convection can occur in two places: residual gas in the vacuum space and hydrogen boil-off interacting with internal surfaces. In a vacuum-jacketed tank, convection in the annulus is usually minimized by lowering pressure, but it never becomes perfectly zero. During aircraft vibration, tiny changes in gas distribution and surface temperatures can slightly alter the effective convection coefficient.
Radiation transfers heat via electromagnetic waves and does not require a medium. Radiation is often the “quiet” contributor in vacuum spaces because it can bypass insulation that blocks conduction and convection. A practical example: a shiny inner surface reduces radiative heat transfer compared with a dull one, not because it is magical, but because emissivity drops.
How Modes Combine in Real Hardware
In many cryogenic components, heat transfer is a network: conduction through materials, then convection or radiation across gaps, then conduction again. The tank wall is a layered stack, so the overall heat leak behaves like resistors in series. If one layer has much higher thermal resistance, it dominates; if multiple layers are comparable, you must model them together.
A systematic approach:
- Identify the dominant path for each phase. During steady cruise, radiation and residual-gas effects may dominate; during cooldown, conduction through structures and transient gradients can dominate.
- Estimate each mode’s contribution using geometry and material properties.
- Validate with instrumentation that can separate “where” heat enters, not just “how much.”
Mind Map: Heat Transfer in Cryogenic Systems
Examples That Tie Modes to Design Choices
Example: Vacuum Jacket Heat Leak Breakdown Assume a tank with a vacuum annulus and an inner radiation shield. If you improve insulation thickness but leave a high-emissivity shield, radiation can remain a large fraction of the total heat leak. Conversely, if emissivity is reduced but a support strut is thick and conductive, conduction through the strut can dominate. The lesson is not “pick one lever,” but “match the lever to the dominant mode.”
Example: Thermal Bridge in a Mounting Bracket A bracket that holds a line or tank support may look structurally necessary and thermally minor. Yet conduction scales with cross-sectional area and inversely with length. If the bracket is short, heat has an easy path. Designers often introduce low-conductivity inserts or increase effective length while preserving mechanical requirements.
Example: External Convection During Flight Even if the tank is well insulated, external airflow can increase heat transfer to outer surfaces. If the outer surface temperature rises, the temperature difference driving radiation and conduction also changes. This is why the external convective coefficient matters for the outer skin and why surface finish and airflow shielding can affect the total heat leak.
Advanced Detail Without the Math Panic
For radiation, geometry matters through view factors: a surface “sees” other surfaces, not the whole world equally. For conduction, contact resistance at interfaces can be significant, especially where parts are bolted or clamped. For convection, the effective coefficient in a vacuum annulus depends on residual pressure and gas composition, so “vacuum quality” is not a single number you can ignore.
A final practical note: when you instrument a cryogenic tank, place sensors where they can inform mode separation. For instance, measuring temperatures at multiple layers helps distinguish conduction-dominated behavior from radiation-dominated behavior, because each mode produces different temperature gradients across the stack.
6.2 Cooldown Procedures and Thermal Soak Control
Cooldown is the controlled reduction of cryogenic hydrogen temperature before the system is asked to do real work. The goal is simple: avoid large temperature gradients that stress tanks, seals, and heat exchangers, while ensuring the fuel path reaches a stable operating state. Thermal soak control is the part people tend to treat as “wait time,” but it is actually a measurable phase where temperatures, pressures, and flow conditions settle into predictable behavior.
Core Principles for Cooldown
Start with the heat path. During cooldown, heat leaks into the tank through insulation imperfections and into the plumbing through supports, penetrations, and instrumentation lines. That incoming heat drives boil-off and changes hydrogen quality at interfaces. A good procedure therefore manages three things together: (1) how quickly temperature drops, (2) how much hydrogen is allowed to flash and vent, and (3) how long the system is held near key thresholds so components stop chasing each other thermally.
A practical way to think about it is “gradient first, flow second.” If the tank wall cools much faster than the internal liquid level and ullage, the result is uneven contraction and higher seal stress. If the fuel line cools faster than the downstream regulator or heat exchanger, you can get transient pressure drops and unstable valve behavior.
Stepwise Cooldown Workflow
A systematic cooldown sequence usually follows five phases.
-
Pre-checks and configuration: Verify insulation integrity indicators, confirm valve positions, and ensure vent paths are clear. Example: if a vent valve is left partially closed, the system may reach a higher pressure during cooldown, increasing boil-off and stressing relief devices.
-
Controlled initial cooling: Introduce cryogenic hydrogen to the coldest part of the fuel path first, typically the tank outlet region or the inlet manifold, using a low flow rate. Example: start with a small mass flow so the line cools without forcing a large fraction of hydrogen to flash.
-
Stabilization at intermediate thresholds: Hold until temperatures at representative sensors converge within a defined band. Example: if tank bulk temperature is still dropping while the line temperature has already leveled, you’re likely creating a steep gradient at a junction; extend the hold or reduce flow.
-
Approach to operating condition: Increase flow only after key components show stable thermal behavior. Example: if the heat exchanger outlet temperature is still drifting, raising flow can push the system into oscillations where the regulator repeatedly corrects.
-
Thermal soak for readiness: Maintain conditions long enough for slow-moving thermal masses—tank structure, thick-walled fittings, and certain instrumentation mounts—to reach a steady state.
Thermal Soak Control Logic
Thermal soak is controlled waiting with instrumentation. The procedure should define measurable criteria rather than a single fixed time.
Use three categories of criteria:
- Temperature convergence: Multiple sensors should show reduced rate of change. Example: require that the maximum absolute temperature slope across selected points falls below a threshold for a continuous interval.
- Pressure and valve behavior: Regulator outlet pressure should remain within a band without frequent corrective cycling. Example: if the control valve hunts during soak, the system is not thermally settled even if temperatures look close.
- Flow stability: Mass flow should match the commanded profile without sudden changes in flash fraction. Example: if vent flow spikes during soak, the system is still generating excess vapor due to ongoing cooldown.
A simple operational rule is to soak longer when gradients are larger. If the tank-to-line temperature difference at the start of soak is high, the system needs more time for the slowest component to catch up.
Mind Map: Cooldown and Soak Control
Example: Cooldown with a Junction Gradient
Assume the tank bulk temperature reaches the target early, but the line near a manifold junction remains warmer. During the intermediate stabilization phase, the temperature difference grows rather than shrinks. The procedure should respond by reducing flow rate and extending the hold until the junction temperature slope decreases and the inter-sensor delta falls within the defined band. This prevents a situation where the regulator sees a changing vapor fraction while the manifold is still contracting.
Example: Soak Criteria That Prevent Regulator Hunting
During thermal soak, the regulator outlet pressure stays within a band, but the control valve position oscillates. That indicates the system is still thermally active, even if bulk temperatures appear steady. The correct action is to extend soak and, if needed, slightly reduce commanded flow so the heat exchange rate drops and the system can settle without control chasing its own tail.
6.3 Heat Exchanger Design for Hydrogen and Associated Streams
Cryogenic hydrogen systems rarely move heat in only one direction. A heat exchanger has to handle the hydrogen stream’s low temperature, the pressure level, and the fact that other streams—cooling loops, purge gases, and sometimes water or air—may be at very different temperatures. The design goal is simple to state and tricky to execute: transfer the required heat with controlled pressure drop, safe materials compatibility, and predictable performance across cooldown and steady operation.
Core Design Inputs
Start with the duty and the boundaries. Define the required heat transfer rate (Q), inlet and outlet temperatures for each side, allowable pressure drops, and maximum and minimum operating pressures. For hydrogen, also specify whether the stream is liquid, two-phase, or gaseous at the exchanger inlet. A practical example: if liquid hydrogen must be warmed before entering a regulator, the exchanger must avoid excessive vapor generation that would destabilize downstream control.
Next, decide the exchanger type. Plate-fin units can be compact but require careful sealing and leak-tightness verification. Shell-and-tube units are robust and easier to inspect, but they can be bulkier. For cryogenic aircraft packaging, compactness often wins, yet the best choice is the one that meets leak and serviceability requirements without forcing unrealistic maintenance access.
Heat Transfer Fundamentals That Actually Matter
Hydrogen heat transfer is dominated by phase behavior. In single-phase liquid regions, convection coefficients depend on flow regime and surface condition. In two-phase regions, the effective heat transfer can be high but less predictable, because vapor quality changes along the length.
A useful rule of thumb for early sizing is to treat the exchanger as a set of segments: liquid heating, possible two-phase transition, and gas warming. This segmentation prevents the common mistake of using one average heat transfer coefficient for the entire temperature range.
Temperature Driving Force and Pinch Points
Use the log mean temperature difference (LMTD) method for counterflow or the appropriate method for your configuration. The key risk is the pinch point, where the temperature approach becomes too small. Pinch points increase required area and can push the design into a regime where small fouling or measurement errors cause large performance loss.
Example: suppose hydrogen warms from 20 K to 80 K while a helium-like coolant warms from 90 K to 110 K. If the coolant outlet temperature is too close to hydrogen outlet temperature, the LMTD collapses and the exchanger becomes oversized. The fix is not “add more area” blindly; it is to adjust operating temperatures, flow rates, or choose a different exchanger staging strategy.
Pressure Drop and Control Stability
Pressure drop affects more than pump power. It changes the hydrogen saturation margin and can shift where boiling starts. For systems with valves and regulators, pressure drop interacts with control logic.
Example: if a control valve expects a certain upstream pressure to maintain a stable vapor fraction, an exchanger that adds unexpected pressure drop during cooldown can cause oscillations. Therefore, include pressure drop in the same model used for thermal sizing, and verify behavior at both nominal and off-nominal flow rates.
Materials, Seals, and Leak Tightness
Hydrogen service demands attention to permeation, embrittlement, and seal performance at cryogenic temperatures. Select materials based on compatibility with hydrogen and the thermal cycling profile. For seals, consider elastomer limitations and the need for low-permeation designs.
A practical best practice is to define allowable leak rates per subsystem requirement and then map those limits to exchanger construction choices. If the exchanger is part of a safety-critical boundary, design for double containment or equivalent mitigation rather than relying on “good enough” sealing.
Two-Phase Handling and Flow Arrangement
If the exchanger may see two-phase hydrogen, design for stable distribution. Uneven flow can create local dry-out or hotspots. Use flow straighteners, proper manifold design, and conservative assumptions for vapor quality distribution.
Example: in a counterflow arrangement, vapor generation can migrate toward one end if inlet conditions are not uniform. That can reduce effective heat transfer and increase pressure drop. The fix is to ensure uniform inlet conditions and to confirm that the exchanger’s geometry supports stable phase distribution.
Instrumentation and Verification Plan
Thermal performance must be measurable. Place temperature sensors where they inform control-relevant decisions: hydrogen inlet, hydrogen outlet, and at least one intermediate location if two-phase behavior is expected. Pressure taps should be placed to measure drop across the exchanger, not just absolute values.
Example: during cooldown, compare measured temperature profiles against the segmented model. If the measured curve shows an earlier-than-predicted boiling onset, update the model inputs for heat transfer and pressure drop rather than forcing the design to “fit” the data.
Mind Map: Heat Exchanger Design for Hydrogen and Associated Streams
Example: Staged Warming with a Pinch-Safe Strategy
Consider warming liquid hydrogen before a downstream regulator while also recovering some heat from a warmer hydrogen return stream. A staged design uses two exchangers: the first warms hydrogen to a temperature safely above the expected saturation boundary, and the second performs final warming with a larger temperature approach margin.
This avoids the pinch point that would occur if a single exchanger tried to cover the entire temperature range with tight approaches. It also reduces the chance that a small deviation in flow rate shifts the boiling onset into a region where control becomes sensitive.
Design Checklist for Practical Build Readiness
Confirm that the thermal model is segmented for phase behavior, that pinch points are explicitly checked, and that pressure drop is included in the same operating envelope as the control system. Verify materials and seals for cryogenic hydrogen exposure, and ensure instrumentation can distinguish thermal underperformance from hydraulic underperformance. If the exchanger can be tested and instrumented during cooldown, the design becomes easier to trust—because the data will tell you where the heat actually went.
6.4 Condensation Control and Ice Management on Interfaces
Condensation control starts with one simple question: where can water appear, and what surface will it meet first? On cryogenic hydrogen aircraft systems, the “interfaces” are the boundaries between cold hydrogen components and warmer air, wiring bays, cabin-adjacent spaces, or purge flows. If moisture-laden gas reaches a surface below its dew point, it condenses; if the surface is cold enough, it freezes. Ice then blocks flow paths, increases thermal resistance, and can interfere with seals and sensors.
Foundational Concepts for Interface Moisture
Moisture sources are usually not mysterious. They come from ambient air leakage, desiccated-but-not-dry purge streams, humid maintenance environments, and trapped moisture in hoses or manifolds. The key engineering move is to treat interfaces as controlled atmospheres rather than passive boundaries.
Two temperatures matter. The dew point is where water vapor becomes liquid; the frost point is where it becomes ice. In practice, you control condensation by preventing either (1) moisture from reaching the cold surface or (2) the cold surface from dropping below the relevant threshold during the time window when moisture is present.
A practical example: during a tank cooldown, the coldest surfaces are exposed while purge flow is stabilizing. If purge flow is delayed by even a few minutes, humid air can diffuse into the bay and condense on the first cold metal it encounters. The fix is not “more insulation”; it is timing and atmosphere control.
Interface Design Moves That Reduce Condensation
Start with flow discipline. Use directed purge paths that sweep moisture away from cold zones. Avoid stagnant pockets where air can linger and cool. A good rule is to create a clear “from warm to cold” path for any gas that must be present, so it doesn’t reverse direction near the interface.
Next, manage thermal gradients. Interfaces often include mounting brackets, sensor bosses, and electrical feedthroughs that conduct heat into the cold region. If a bracket bridges warm and cold surfaces, it can become an ice-forming fin. Design for controlled conduction: use thermal breaks where appropriate, and keep conductive paths short and predictable.
Then, choose surface treatments and materials with predictable wetting behavior. Hydrophilic surfaces can spread condensate into thin films that freeze into stubborn layers. Hydrophobic or engineered surface finishes can encourage droplet formation and shedding, but they must be compatible with cleaning procedures and cryogenic cycling.
Cooldown and Warmup Timing as a Control Lever
Condensation is time-dependent. During cooldown, surfaces pass through dew and frost thresholds. During warmup, ice can sublimate or loosen, but only if the interface is accessible to a dry gas environment.
Operational best practice is to coordinate purge start, cooldown ramp rate, and sensor readiness. For example, if a temperature sensor is located near a feedthrough, it may reach frost conditions earlier than the rest of the interface. That sensor can become the first ice nucleation site, causing measurement bias. A mitigation is to ensure the local purge flow is established before the sensor sees its coldest operating temperature.
Ice Formation Mechanisms and Where It Shows Up
Ice tends to form where three conditions overlap: moisture availability, low surface temperature, and a geometry that traps condensate. Common trouble spots include:
- Feedthroughs and cable penetrations where small gaps allow humid air ingress.
- Flange edges where crevices create microclimates with slower gas exchange.
- Valve bodies and actuator housings where moving parts create intermittent exposure to humid air.
Ice also grows by two pathways. First is direct deposition from vapor onto a cold surface. Second is growth from liquid condensate that freezes after it accumulates. The second pathway often produces thicker, more obstructive layers because the liquid can pool.
Measurement and Verification for Condensation Control
You can’t manage what you can’t observe. Use temperature mapping at representative interfaces and pair it with humidity or dew point monitoring in the surrounding bay or purge stream. If you only measure cold-surface temperature, you may miss the fact that moisture arrival is the limiting factor.
A simple verification approach is to define an “interface dew risk window” during which purge conditions must remain within limits. For instance, if the interface surface temperature crosses the frost point at minute 6 of cooldown, then purge flow and dryness must already be stable by minute 5. That turns a vague requirement into a testable sequence.
Mind Map: Condensation Control and Ice Management
Example: Preventing Ice at a Sensor Feedthrough
Assume a sensor feedthrough sits near a cold hydrogen line. During cooldown, the feedthrough housing cools faster than the surrounding bay air. If purge flow is started after the bay begins cooling, humid air can enter the small gap around the feedthrough and freeze on the first cold surface.
A systematic fix uses three steps. First, start purge flow before the feedthrough housing reaches the frost point. Second, route purge so it flows across the feedthrough gap region rather than only around the main bay volume. Third, add a thermal break or reduce conductive bridging so the housing temperature tracks the intended profile rather than dropping early.
The result is measurable: the sensor temperature curve no longer shows abrupt offsets associated with ice growth, and the bay humidity monitor confirms that moisture conditions stayed outside the condensation risk window.
Example: Designing a Flange to Avoid Crevice Ice
Consider a flange where a gasketed joint meets a cold component. Crevice ice forms when gas exchange is slow and moisture can linger. The best practice is to reduce stagnant volumes and improve purge access.
One concrete approach is to add a small purge channel that communicates with the crevice region, ensuring that any leaked moisture is swept away before it can freeze. Another is to adjust the flange face geometry so the crevice volume is minimized and the coldest surface is not hidden inside a pocket. These changes reduce both the residence time of humid air and the likelihood of liquid pooling.
When condensation control is treated as a system behavior—moisture supply, thermal history, and interface geometry—ice becomes a predictable engineering outcome rather than a surprise guest.
6.5 Instrumentation for Temperatures and Heat Flux Verification
Cryogenic hydrogen systems live and die by heat transfer. Instrumentation is how you prove that your insulation, cooldown, and heat exchanger assumptions match reality. The goal is simple: measure temperatures where gradients matter, measure heat flux where you can, and connect both to a defensible uncertainty budget.
Temperature Measurements That Actually Explain Heat Transfer
Start with sensor placement. For tank insulation verification, you need at least three temperature “anchors”: bulk liquid, vapor space, and the insulation boundary near the cold side. Add a fourth point on the warm side of the insulation stack to quantify the gradient driving conduction. A practical rule is to place sensors so that each major heat path has a temperature drop you can observe.
Choose sensor types based on temperature range and environment. For cryogenic liquid and near-liquid interfaces, resistance temperature detectors with stable calibration are common. For fast transients during cooldown, use sensors with low thermal mass and good mounting repeatability. For surfaces, consider thin-film or surface-mounted RTDs that minimize contact resistance; otherwise, the sensor becomes the bottleneck and you end up measuring “sensor behavior” more than system behavior.
Wiring and mounting matter as much as the sensor. Use strain relief to prevent micro-movements from changing contact pressure. Route leads to reduce heat conduction along the wire bundle, and keep lead lengths consistent across test articles so your calibration assumptions stay valid.
Heat Flux Measurement with Sensible Constraints
Heat flux sensors are powerful but picky. They require intimate thermal contact and careful calibration, and they can disturb the very field you want to measure. Use heat flux gauges only where you can maintain stable contact and where the sensor’s thermal resistance is small compared to the insulation path.
A common approach is to mount a calibrated heat flux gauge at an insulation interface and pair it with nearby temperatures. This lets you cross-check: if the measured heat flux implies a temperature gradient that contradicts your temperature sensors, you know you have a contact or wiring issue.
When heat flux sensors are not feasible, infer heat flux from the measured temperature gradient and a validated thermal model. In that case, your instrumentation job is to measure the temperatures that define the model inputs, not just “some temperatures.”
Mind Map: Temperature and Heat Flux Verification
Example: Verifying Tank Heat Leak During Cooldown
Assume you have a tank with an insulation stack and you want to verify heat leak. During a controlled cooldown, record temperatures at bulk liquid, vapor space, cold-side boundary, and warm-side boundary. If the model predicts a certain boil-off rate, the insulation heat leak should track the temperature gradient across the insulation.
Add a heat flux gauge at the cold-side boundary if contact can be maintained. Then compute heat flux two ways: directly from the gauge and indirectly from the measured gradient using the thermal model’s effective conductivity. Agreement within uncertainty is your evidence that the insulation behavior matches assumptions.
If the two methods disagree, use the temperature anchors to localize the problem. A mismatch that grows as the tank approaches saturation suggests contact resistance changes or sensor self-heating. A mismatch that appears immediately suggests wiring errors, calibration offsets, or a mounting thermal short.
Example: Heat Flux Cross-Check Using Local Gradients
Suppose a heat flux gauge reads 12 W/m² while the nearby cold-side and warm-side temperatures imply only 8 W/m² through your insulation model. Before blaming the model, check three things in order: (1) sensor contact quality, (2) synchronization and time alignment between temperature and heat flux channels, and (3) whether the gauge calibration was performed under similar boundary conditions. Often, the “missing” 4 W/m² is explained by a small thermal short at the mounting interface.
Uncertainty Handling That Keeps Results Defensible
Verification fails when uncertainty is treated like paperwork. Instead, propagate uncertainty from sensor calibration, placement repeatability, and data acquisition resolution into the final heat leak or heat flux estimate. Use synchronized sampling so transient comparisons are meaningful, and document filtering choices so they can be reproduced.
A good test report ends with a residual check: compare measured and predicted heat flux or boil-off over the same time window, then quantify the spread. If residuals correlate with a specific temperature region, you likely have a placement or contact issue rather than a fundamental physics mismatch.
7. Materials Compatibility and Structural Design
7.1 Hydrogen Embrittlement Mechanisms and Material Selection
Hydrogen embrittlement is the set of material failures that happen when hydrogen atoms enter a metal and change how it bears stress. In cryogenic hydrogen systems, the risk is not just “hydrogen is present,” but “hydrogen can reach the stressed microstructure and stay there long enough to matter.” The practical goal is to prevent hydrogen ingress, reduce hydrogen concentration at critical locations, and choose alloys and heat treatments that tolerate whatever hydrogen does arrive.
Core Mechanisms That Make Metals Misbehave
Start with the simplest picture: hydrogen atoms are small, diffuse quickly, and can accumulate at defects. Once hydrogen is near a crack tip or a highly stressed region, it can lower the energy barrier for damage. Three mechanisms dominate engineering discussions.
- Hydrogen-enhanced localized plasticity: Under stress, dislocations move. Hydrogen makes it easier for slip to localize, so a crack can grow even when the bulk metal still looks “strong.”
- Hydrogen-induced decohesion: Hydrogen reduces the cohesion between atoms at grain boundaries or interfaces. The result is intergranular cracking, which can be sudden and hard to detect early.
- Hydride formation: In some metals, hydrogen can combine into brittle hydrides. This is especially relevant when the alloy chemistry and temperature allow stable hydrides.
A useful engineering habit is to map “where hydrogen goes” to “where stress concentrates.” For example, a weld toe and a heat-affected zone often combine high residual stress with microstructural changes, making them prime locations for hydrogen-assisted cracking.
Material Selection Logic That Actually Works
Material choice is a chain of decisions: base metal chemistry, microstructure, heat treatment, joining method, surface condition, and seal design. Each link affects hydrogen solubility, diffusion, and trapping.
- Choose alloys with lower susceptibility: Some steels and nickel-based alloys resist embrittlement better than others because their microstructures and trapping behavior reduce harmful hydrogen mobility.
- Control microstructure through heat treatment: Tempering and stress-relief can change dislocation density and precipitate distribution, which alters how hydrogen is trapped and released.
- Prefer designs that avoid high tensile stress at critical surfaces: If a component must be stressed, keep the highest tensile stresses away from welds, notches, and thin sections.
- Treat surfaces and coatings as part of the hydrogen barrier: Surface roughness, machining marks, and coating defects can become pathways or local sites for hydrogen uptake.
Hydrogen Trapping and Why It’s Not Always Bad
Hydrogen does not move freely forever. It can be trapped at microstructural features such as dislocations, vacancies, and precipitates. Trapping can be protective if it holds hydrogen in less harmful locations, but it can also be harmful if traps concentrate hydrogen near crack tips.
A practical example: two heat-treated steels with the same bulk chemistry can behave differently because one has precipitates that trap hydrogen uniformly, while the other has a distribution that leaves more hydrogen mobile near grain boundaries.
Joining and Residual Stress Control
Welds and brazes are common trouble spots because they combine:
- altered microstructure,
- residual tensile stress,
- and sometimes different hydrogen uptake behavior.
Best practice is to treat joining as a hydrogen-management step. That means specifying welding procedures that limit hydrogen introduction, performing appropriate post-weld heat treatment when compatible with the design, and verifying that the weld region meets mechanical and toughness requirements under hydrogen-relevant conditions.
Example: Selecting a Steel for a Cryogenic Hydrogen Fuel Line
Suppose you need a pressure-bearing line with welded joints. A systematic selection approach:
- Start with candidate alloys known for good hydrogen resistance in relevant strength ranges.
- Choose a heat treatment that produces a stable microstructure and reduces residual tensile stress.
- Use a joining procedure that minimizes hydrogen input and includes post-weld treatment where required by the alloy and design.
- Inspect weld geometry to avoid sharp notches at the weld toe.
- Validate with mechanical testing appropriate to the expected stress state and hydrogen exposure conditions.
If the design requires high strength, the selection becomes more sensitive: higher strength often means higher dislocation density and different trapping behavior, so the same alloy family may not be equally safe across strength levels.
Mind Map: Hydrogen Embrittlement Pathway and Selection Controls
Example: Reading a Failure Mode Like a Map
If a component shows cracking that follows grain boundaries, it points toward decohesion or grain-boundary-assisted damage. If cracks appear to initiate at slip bands or localized deformation zones, localized plasticity is more likely. If brittle plate-like features appear and the alloy system supports hydrides, hydride formation becomes a prime suspect. The key is to connect the observed fracture morphology to the mechanism, then adjust material choice, heat treatment, or stress distribution accordingly.
Practical Checklist for Material Selection
- Confirm the alloy’s embrittlement susceptibility for the relevant strength and microstructure.
- Ensure heat treatment supports stable trapping and reduces residual tensile stress.
- Treat welds as hydrogen-sensitive regions with controlled procedures and inspections.
- Design to minimize tensile stress at weld toes, notches, and interfaces.
- Use surface condition and coatings as part of the hydrogen barrier strategy.
This approach keeps the focus on controllable variables: hydrogen access, hydrogen behavior inside the metal, and the stress geometry that turns hydrogen presence into cracking.
7.2 Elastomers Seal Design and Permeation Control
Elastomer Seal Design and Permeation Control
Elastomer seals in cryogenic hydrogen systems have two jobs that fight each other: they must stay flexible at low temperature, and they must resist hydrogen molecules that are small enough to slip through many polymers. A good design starts with the seal’s environment map—temperature range, pressure cycles, fuel chemistry, and allowable leakage—then turns that into material choices, geometry, and verification tests.
Foundational Concepts That Drive Seal Choices
Hydrogen permeation is driven by a concentration gradient across the elastomer. In practice, that means the seal sees higher hydrogen activity on the fuel side and lower activity on the outside, so molecules dissolve into the polymer, diffuse through it, and desorb on the other side. The permeation rate depends on the polymer’s permeability, the seal thickness, and the time the seal has been exposed.
A second constraint is elastomer mechanical behavior. At cryogenic temperatures, many elastomers stiffen, which can reduce sealing force and increase microleak paths. Designers therefore treat “seal performance” as a combination of compression retention, extrusion resistance, and permeation resistance.
Material Selection with Cryogenic Reality
Start by choosing elastomers that maintain usable modulus and resilience at the lowest expected temperature. Then check compatibility with hydrogen and any adjacent fluids, such as lubricants, cleaning agents, or thermal interface materials. Even if hydrogen is the main permeant, swelling from other chemicals can change compression set and create leakage channels.
A practical rule: if a material’s compression set rises sharply after cold exposure, permeation control becomes harder because the seal relaxes and the effective contact area shrinks. That turns a “diffusion-limited” problem into a “gap-limited” problem.
Seal Geometry That Reduces Both Leakage Paths
Permeation through the elastomer scales strongly with thickness, so you generally want the thinnest elastomer section that still survives extrusion and mechanical loading. For O-rings, that often means selecting a cross-section that provides enough sealing force without excessive bulk.
Extrusion resistance matters because cryogenic systems can see pressure differentials and transient pressure spikes during cooldown or valve operations. If the seal extrudes into a clearance, the contact becomes irregular and permeation can increase due to edge leakage and damaged surfaces.
Design the gland to support the seal under compression. Use appropriate squeeze and gland fill so the elastomer deforms predictably rather than “finding its own way” into gaps. A quick sanity check is to compare expected compression at operating temperature with the material’s known compression set behavior.
Permeation Control Strategies That Work Together
Permeation control is rarely one trick. Use a layered approach:
- Reduce permeation path length by minimizing effective elastomer thickness.
- Maintain sealing contact by controlling compression and gland geometry.
- Limit exposure time by ensuring the system’s venting and isolation logic minimizes long dwell at high hydrogen activity.
- Use barrier concepts where appropriate, such as coatings or multilayer seal stacks, but only after confirming adhesion and thermal contraction behavior.
A simple example: if a seal is exposed to high-pressure hydrogen during servicing, permeation can accumulate even if the seal never leaks by bulk flow. Shortening the high-activity dwell time can reduce total permeated mass without changing the elastomer.
Mind Map: Elastomer Seal Design and Permeation Control
Example: O-Ring Gland Tuning for Cryogenic Hydrogen
Assume you have an O-ring seal between a cryogenic hydrogen tank fitting and a structural interface. The initial design uses a standard gland with a target squeeze at room temperature. During cooldown, the elastomer stiffens and the compression force drops, so the seal’s contact area becomes patchy.
A systematic fix is to adjust gland geometry so that the seal still achieves adequate squeeze at the minimum operating temperature. Then verify extrusion resistance by checking the clearance under the maximum pressure differential. Finally, measure permeation rate for the selected elastomer thickness and compare it to the allowable leakage budget.
If permeation is too high, do not immediately change materials. First confirm whether the elastomer thickness is larger than necessary and whether the seal is over-compressed, which can increase stress and accelerate surface degradation. Only after those checks should you consider a different elastomer or a barrier approach.
Example: Permeation Budget with Exposure Time
Consider two operating procedures that both keep the seal “not leaking” by bulk flow. Procedure A isolates hydrogen quickly after a test, while Procedure B leaves the seal exposed to high pressure for longer during troubleshooting. Even if the seal contact remains intact, permeation accumulates over time.
You can treat the permeated mass as a time-weighted exposure problem: the longer the seal experiences high hydrogen activity, the more permeant dissolves and diffuses through the elastomer. That means operational discipline—venting and isolation timing—directly affects permeation outcomes, not just mechanical leakage.
Verification That Closes the Loop
Verification should cover both mechanics and transport. Compression tests at relevant temperatures confirm retention and recovery. Extrusion checks under pressure differentials confirm gland support. Permeation measurements quantify hydrogen transmission through the elastomer under representative conditions. When these results agree with the leakage budget, the design is coherent rather than lucky.
A seal that passes only one category is a common trap: a material can look great on permeation but fail mechanically after cycling, or it can stay mechanically sound but still exceed permeation limits during long exposure. The integrated approach prevents both.
7.3 Metal Joining Techniques for Cryogenic Hydrogen Systems
Cryogenic hydrogen systems rely on joints that stay tight at low temperature, resist hydrogen-driven degradation, and survive thermal cycling without creating leak paths. Joining is not just “welding or not welding”; it is a chain of choices that starts with material compatibility and ends with inspection evidence.
Joining Requirements That Actually Matter
Start with three practical constraints. First, the joint must maintain leak tightness under pressure and temperature gradients, including cooldown and warm-up. Second, the joint must avoid microstructures that accelerate hydrogen embrittlement or reduce fracture toughness. Third, the joint must be manufacturable with repeatable quality so inspection can confirm what the design assumes.
A useful mental model is to treat the joint as two materials plus an interface. The base materials bring their own toughness and ductility, the filler or interlayer adds its own properties, and the interface region often becomes the weak link if heat input or surface preparation is careless.
Material Compatibility and Surface Preparation
Hydrogen can diffuse into metals and concentrate damage at defects. That means surface condition is not cosmetic. Oxides, machining debris, and moisture can create inclusions or porosity that later become crack starters.
Best practice example: when preparing stainless steel for cryogenic service, use controlled cleaning (solvent degrease, then dry handling) and avoid touching prepared surfaces with bare gloves. If a joint is assembled after cleaning, minimize dwell time before welding or bonding so contamination does not reappear.
For dissimilar metal joints, compatibility is even more sensitive. Choose filler and process so the interface does not form brittle phases or excessive hardness. If you must join different alloys, plan the joint design so the interface region is small and inspectable.
Welding Processes and How to Choose Them
Three welding families dominate cryogenic hydrogen hardware: fusion welding, solid-state welding, and brazing. Each changes the interface microstructure differently.
Fusion welding (common for pressure vessels) melts base metal and filler. The risk is heat-affected zone (HAZ) toughness loss and hydrogen-related cracking if the process introduces diffusible hydrogen. Mitigations include low-hydrogen consumables, controlled preheat when appropriate, and strict cleanliness.
Solid-state welding (such as friction welding) avoids melting, which can reduce HAZ issues. It can be attractive for certain geometries, but it requires tooling and alignment control.
Brazing joins by melting a filler with a lower melting point than the base metal. It can be useful for complex shapes, but the joint relies on capillary flow and wetting; poor surface preparation can create voids that are hard to detect.
Example: for a thin-walled cryogenic line, fusion welding may risk distortion and excessive HAZ. A design review might instead choose a process that limits heat input or uses a joint geometry that reduces filler volume.
Joint Design for Leak Tightness and Inspection
Joint geometry determines both stress distribution and what you can inspect. A full-penetration butt joint often provides a continuous load path and clear inspection targets. Fillet welds can be practical but create crevices that trap contaminants and complicate leak testing.
A practical rule: design the joint so the inspection method can “see” the critical region. If you plan to use radiography or ultrasonic testing, ensure access, thickness, and surface finish support the technique.
Example: if a weld will be inspected by ultrasonic testing, avoid weld profiles that create strong scattering features. A small change in groove angle can improve signal clarity without changing the structural intent.
Managing Hydrogen During Joining
Hydrogen embrittlement is driven by hydrogen availability, stress state, and susceptible microstructures. Joining adds hydrogen through consumables, moisture, and process conditions.
Best practice example: store welding consumables in controlled conditions and use them within specified time windows. For cryogenic stainless steels, even small moisture exposure can matter because it increases diffusible hydrogen and promotes cracking in constrained regions.
Also manage residual stress. Excessive restraint during welding can lock in high tensile stress near the weld toe or HAZ. Use fixturing that supports alignment but allows controlled contraction, and follow approved welding sequences.
Post-Weld Treatments and Their Purpose
Post-weld heat treatment (PWHT) can reduce residual stress and temper microstructures, but it must be chosen carefully because it can also change toughness. For some alloys, PWHT is essential; for others, it may be harmful.
Example: if a procedure specifies a stress-relief cycle, treat it as part of the joining process, not an optional add-on. Record furnace loading, temperature uniformity, and cool-down method because these affect the final microstructure.
Inspection and Acceptance Evidence
Inspection should confirm both geometry and integrity. Typical evidence includes visual and dimensional checks, surface and volumetric nondestructive testing, and leak testing.
A systematic approach is to align inspection with failure modes. If the concern is lack of fusion, volumetric methods help. If the concern is microcracks or porosity, surface methods and leak testing provide complementary coverage.
Example: for a critical tank-to-line interface, combine weld profile verification with a leak test that matches the expected leak rate sensitivity. A joint that passes dimensional checks can still fail leak tightness if internal voids exist.
Mind Map: Metal Joining Techniques for Cryogenic Hydrogen Systems
Example: Selecting a Joining Method for a Cryogenic Line-to-Fitting Joint
Assume a stainless steel cryogenic line must connect to a fitting with tight leak requirements. Start by choosing a joint geometry that supports full penetration and inspection access. Then select a welding procedure that uses low-hydrogen consumables and controls heat input to protect HAZ toughness. Finally, verify the weld with dimensional checks, volumetric NDT, and a leak test sensitive enough to detect the expected failure mode. If any step fails, treat it as a process issue, not a “rework and hope” situation.
7.4 Stress Corrosion and Fatigue Considerations Under Cryogenic Cycling
Cryogenic hydrogen tanks and piping see repeated temperature swings: cool-down, steady operation, and warm-up. Those cycles change more than temperature; they change stress distribution, material microstructure, and the chemistry at surfaces. The practical goal is to prevent cracks from starting and growing, even when the system experiences both mechanical cycling and corrosive assistance.
Foundational Mechanisms That Matter
Stress corrosion cracking (SCC) needs three ingredients: a susceptible material, an aggressive environment, and sustained tensile stress. Cryogenic cycling can supply the stress through thermal contraction mismatch between components, welds, and supports. It can also concentrate moisture or contaminants at interfaces during warm-up, when surfaces pass through temperature ranges where condensation is likely. Fatigue, in contrast, is driven by cyclic stress amplitude; corrosion can still accelerate fatigue crack growth by reducing the material’s resistance at the crack tip.
A useful way to think about it: fatigue is the drummer, corrosion is the cymbal effect that makes cracks propagate faster. Under cryogenic cycling, both can show up in the same crack path.
Stress Sources During Cryogenic Cycling
Thermal stress comes from constrained contraction. If a tank shell is rigidly supported while its temperature drops, the structure wants to shrink but cannot freely do so. Weld regions often become stress concentrators because their geometry and residual stresses differ from the base metal. Pressure changes during boil-off control and fuel conditioning add mechanical stress on top of thermal stress.
A simple example: imagine a support ring that is slightly misaligned. During cool-down, one side of the ring contacts earlier, creating a local tensile region in the adjacent weld. That local region becomes a prime candidate for crack initiation.
Environment Control and Why Warm-Up Is Tricky
Even when hydrogen itself is not the corrosive agent, the system can carry trace impurities: water, oxygen, and hydrocarbons from handling. During cool-down, the cold surfaces can reduce reaction rates, but during warm-up they can reintroduce mobility for species and allow condensation. Condensed water can form thin liquid films that enable SCC or corrosion-assisted fatigue.
Operational best practice: treat warm-up as a “chemistry event,” not just a thermal event. If you keep purge gas composition stable and avoid air ingress, you reduce the chance of forming a liquid film on susceptible surfaces.
Material Susceptibility and Weld Effects
Materials differ in how they respond to hydrogen exposure, low temperatures, and cyclic loading. Some alloys are more sensitive to SCC under specific environments, and weld metal can be more susceptible than base metal due to microstructure differences. Residual tensile stresses from welding can provide the sustained stress SCC prefers.
Example: a circumferential weld with high residual tension plus a thin moisture film during warm-up can create a scenario where small surface flaws grow slowly but persistently. Fatigue then takes over when pressure cycles increase stress amplitude.
Mind Map: Failure Path Logic
Integrated Design Practices That Reduce Both Risks
-
Minimize restraint and stress concentration. Use support designs that allow controlled thermal movement. If you must constrain, distribute loads and avoid sharp transitions near weld toes.
-
Control weld quality and residual stress. Weld toe grinding, appropriate filler selection, and post-weld heat treatment can reduce residual tensile stress and improve fatigue performance. The goal is not perfection; it is to keep the tensile component below thresholds where SCC becomes plausible.
-
Manage thermal gradients. Large gradients increase local stress. Insulation and heat leak paths should be designed to reduce uneven cooling, especially near attachments.
-
Keep surfaces dry and protected. Leak-tightness and purge procedures matter most during warm-up. A small amount of moisture can be harmless if it never forms a persistent film on stressed metal.
Example: Weld Toe Geometry Meets Warm-Up Chemistry
Consider a tank with a circumferential weld and a support bracket near the weld toe. During cool-down, the bracket constrains the shell, creating tensile stress at the weld toe. During warm-up, a thin condensed film forms briefly on the same region. If the weld toe is sharp, it increases local stress intensity. The combined effect is crack initiation at the toe, followed by faster growth when pressure cycles resume.
A mitigation package is straightforward: improve weld toe profile, ensure bracket alignment to avoid local restraint, and tighten purge control so warm-up does not allow moisture to persist.
Verification Through Evidence, Not Assumptions
Verification should connect stress state, environment exposure, and crack growth behavior. Use fracture mechanics to evaluate how small flaws could grow under combined thermal and pressure cycles. Then confirm with representative testing that includes realistic cycling and controlled impurity levels. The point is to show that the system stays away from crack growth regimes that require both tensile stress and an aggressive environment.
Quick Checklist for Engineering Reviews
- Are tensile stresses highest at weld toes or constrained interfaces?
- Does the design reduce thermal gradients near critical welds?
- Are purge and servicing procedures robust against air ingress and moisture retention?
- Are weld residual stresses addressed through process control?
- Do fatigue and SCC risk assessments use consistent assumptions about environment and stress?
When these items line up, the system is less likely to produce a crack that starts small and grows quietly—then suddenly becomes a problem.
7.5 Structural Integration of Tanks and Load Paths
A cryogenic hydrogen tank is not just a pressure vessel bolted into an airframe. It becomes part of the aircraft’s primary load path, meaning the structure must carry flight loads, manage cryogenic thermal contraction, and keep the tank’s stress state within allowable limits. The goal is simple: the tank should see predictable loads from the airframe, and the airframe should not be surprised by tank behavior.
Foundational Concepts for Load Path Thinking
Start by separating forces into three categories. First are global loads from lift, drag, and inertia that travel through wings, fuselage frames, and longerons. Second are local loads at the tank supports, such as shear and bending from engine thrust or maneuvering. Third are thermal loads caused by cooldown and heat leak, which create contraction and differential movement between tank and surrounding structure.
A practical best practice is to define a “support intent” for each interface: is it meant to carry axial load, resist shear, allow controlled movement, or provide damping? For example, if a support is intended to carry shear while allowing axial slip, the design should include a low-friction feature or a compliant element so the tank can contract without prying on adjacent structure.
Support Layout and Interface Roles
Most tank installations use a combination of support types. Commonly, you’ll see:
- Primary supports that carry the majority of axial and bending loads.
- Secondary supports that prevent excessive motion and limit misalignment.
- Guides or restraints that control degrees of freedom during thermal cycling.
- Soft interfaces that reduce stress concentration where the tank shell meets brackets.
A concrete example: imagine a tank mounted along the fuselage centerline. Primary supports near the midspan can carry bending moments, while end supports manage axial loads during acceleration and braking. Between them, guides can keep the tank from shifting laterally, but still allow the tank to shorten during cooldown.
Load Transfer Mechanics at the Bracket Level
Load transfer is where many designs quietly go wrong. Brackets and lugs must distribute forces into the airframe without creating local overstress. That means checking bearing stress under pins or bolts, shear flow in the surrounding skin, and bending in the bracket itself.
A systematic approach is to model the interface as a small structural “system” rather than a single fastener. For instance, if a bracket uses two bolts in shear, the load path includes bolt shear, bracket bending, and skin shear flow. If the tank is also thermally contracting, the bracket may experience changing contact pressure, which alters the effective stiffness and can shift load sharing between fasteners.
Thermal Contraction and Differential Movement
Cryogenic cooldown can shrink the tank relative to the airframe. If the supports are too rigid, the tank shell can pick up unintended bending stress. If supports are too free, the tank can move into contact or create fatigue from repeated micro-motions.
A good design balances stiffness and freedom. One method is to use a kinematic support concept: constrain the tank in the directions that must be controlled, while allowing predictable movement in the directions that thermal contraction demands. For example, a support set might fully constrain vertical translation and rotation but allow axial slip through a sliding interface.
Stress Management Through Allowable Limits
Structural integration must respect both pressure vessel requirements and airframe structural limits. The tank shell sees combined stresses from internal pressure, external loads, and bending from support reactions. The airframe sees reaction forces that must not exceed local allowables for frames, stringers, and skins.
A practical check is to compute support reactions for representative flight cases and then superimpose thermal-induced loads. If the design uses finite element analysis, validate the model with simplified hand checks for boundary conditions. For example, treat the tank as a beam on supports and confirm that the reaction forces scale reasonably with load case magnitude before trusting detailed stress plots.
Fatigue and Fretting at Interfaces
Even when peak stresses are acceptable, fatigue can be driven by cyclic support loads and small relative motion. Fretting occurs when surfaces experience repeated micro-sliding under load. That’s why surface finish, contact pressure, and the presence of slip-limiting features matter.
A concrete example: if a guide uses a metal-on-metal contact, the contact pressure must be high enough to prevent chatter but not so high that it accelerates wear. If the design uses a polymer or composite insert, it must be compatible with hydrogen environment requirements and temperature cycling.
Verification Through Test-Backed Evidence
Structural integration is not complete until the support behavior is verified. Ground tests can include instrumented load application to measure reaction forces at supports, plus cooldown tests to observe movement and strain in the tank and brackets.
A useful instrumentation plan measures at least three things: tank support reactions (via strain gauges on brackets), tank shell strain near support regions, and airframe strain in the adjacent frames or longerons. If cooldown causes unexpected strain spikes, the design likely has an unintended constraint path.
Mind Map: Structural Integration of Tanks and Load Paths
Example: Designing a Two-Support Installation
Assume a tank supported by two primary brackets spaced along the fuselage. Choose the midspan bracket to carry most bending reaction, and the forward bracket to manage axial thrust loads. Add a lateral guide near the aft bracket to prevent side-to-side motion.
Then run a structured check:
- Compute support reactions for a representative maneuver load case.
- Apply a cooldown contraction model to estimate relative tank-to-airframe displacement.
- Confirm that the guide allows the required axial slip while preventing lateral translation.
- Evaluate bracket bearing stress and bracket bending stress under the measured reaction forces.
- Assess fatigue risk by checking cyclic load ranges at the bracket and guide contact points.
If the tank shell strain near the brackets increases sharply during cooldown, the most likely issue is an overconstraint path. The fix is usually to adjust constraint directionality or introduce a controlled compliance element, not to “stiffen everything” and hope the math forgives it.
8. Venting Dispersion and Environmental Controls
8.1 Vent System Routing and Discharge Conditions
Hydrogen venting is mostly about controlling where the gas goes and what it does when it gets there. Routing determines dilution and ignition risk, while discharge conditions determine whether the vent behaves like a gentle leak or a jet that can carry hydrogen farther than expected.
Vent System Routing Foundations
Start with the physical goal: keep vented hydrogen away from ignition sources and away from areas where it can accumulate. In practice, routing is designed around three zones: (1) the tank bay and immediate structure, (2) the engine and auxiliary bay, and (3) the crew and passenger compartments. Each zone has different tolerances for hydrogen concentration and different access for maintenance.
A good routing plan uses these principles:
- Shortest safe path: Route vent lines with minimal bends to reduce trapped volumes and condensation-related issues.
- High points for gas, low points for drainage: Hydrogen is gas, but vent lines can still collect moisture or contaminants; provide drainage where appropriate.
- Avoid recirculation paths: Do not route vents so that discharged flow can be drawn back by inlets or cooling fans.
- Thermal separation from hot surfaces: Keep vent outlets away from exhaust components and electrical hot spots.
Example: If a tank bay vent outlet is near a cooling air inlet, a crosswind during ground operations can push the discharge toward the inlet. Even if the outlet is “upwind” most of the time, the system should be designed so that worst-case airflow still prevents re-ingestion.
Discharge Conditions That Matter
Discharge conditions describe the jet behavior at the outlet. The key variables are mass flow rate, upstream pressure, line diameter, outlet geometry, and ambient pressure and wind. These determine jet momentum, mixing rate, and the distance to flammable concentrations.
Engineers typically evaluate discharge conditions using a conservative chain:
- Assume the vent reaches a credible maximum flow based on relief sizing and control logic.
- Model or estimate jet expansion from the outlet to the near-field region.
- Check dilution against flammability limits at locations of interest, such as near inlets, doors, and service panels.
Example: A small outlet with high upstream pressure can create a narrow, fast jet that penetrates farther before mixing. A larger outlet may reduce jet velocity but can increase total flow area coverage. Both can be safe, but only if the outlet placement and mixing assumptions match the actual geometry.
Outlet Placement and Geometry
Outlet placement is where routing and discharge conditions meet. The outlet should be positioned so that the discharge plume disperses into open air rather than into enclosed or semi-enclosed cavities.
Common geometry choices include:
- Directional outlets that aim the jet away from inlets and toward regions with better natural dilution.
- Standoff distance from surfaces that could trap gas in boundary layers.
- Outlet elevation that reduces the chance of hydrogen pooling under the aircraft.
Example: If the vent outlet is under a fairing, the fairing can act like a partial enclosure. Even with correct vent sizing, the local mixing can be worse than expected, so the outlet may need to be moved or the fairing redesigned to prevent stagnation.
Control of Venting Modes
Vent systems often have multiple modes: normal venting during servicing, relief venting during abnormal pressure rise, and purge or cooldown-related venting. Routing must support all modes without creating new hazards.
A practical approach is to map each mode to a discharge condition envelope:
- Normal servicing vent: lower flow, predictable duration, often during controlled ground operations.
- Relief vent: higher flow, shorter duration, less predictable timing.
- Cooldown or conditioning vent: may involve temperature differences that affect buoyancy and mixing.
Example: During cooldown, colder hydrogen can initially behave differently than warm vent gas. If the outlet is positioned to rely on buoyant rise, a colder discharge may linger longer near the outlet region, so the routing should not assume “it will just rise away” without checking.
Integrated Example Workflow
- Identify critical locations: inlets, doors, service panels, and likely ignition sources.
- Define vent modes and their maximum credible flow rates.
- Choose routing that minimizes trapped volumes and avoids recirculation.
- Select outlet geometry and placement to promote dilution into open air.
- Evaluate discharge conditions at critical locations using conservative near-field assumptions.
- Confirm that each mode routes to the same safe outlet region or that mode-specific outlets are independently safe.
Example: If relief venting is routed to a different outlet than normal servicing venting, verify that the relief outlet is not closer to an inlet than the normal outlet. “Different outlet” is not automatically “safer”; it just means you must re-check the discharge conditions for each path.
8.2 Hydrogen Dispersion Modeling Inputs for Engineering Design
Hydrogen dispersion modeling starts with a simple goal: predict where hydrogen concentration could exceed a chosen flammability threshold, under realistic release and ventilation conditions. The model is only as good as its inputs, so the engineering workflow focuses on building an input set that is traceable, testable, and consistent with the physical release.
Core Modeling Inputs
Release Source Definition
A release model needs a source term that describes how hydrogen enters the air. For engineering design, treat the source as one of these categories:
- Jet release from a high-pressure line through a small orifice.
- Spray-like release from a ruptured fitting where momentum dominates.
- Passive leak from a small gap where flow is low and diffusion matters.
For each category, specify:
- Location and geometry of the release point.
- Release rate as a function of time, including whether it ramps up or starts instantly.
- Initial conditions such as temperature and pressure at the release.
Example: If a valve seat leak is assumed to be continuous, use a constant mass flow rate and a short time window for worst-case accumulation. If a line rupture is assumed, use a time-varying release rate based on upstream pressure decay.
Hydrogen Thermophysical Properties
Hydrogen’s behavior depends on density, viscosity, diffusivity, and buoyancy effects. Use consistent property models across the entire input set so the solver does not mix assumptions.
Practical practice: keep a single property source for density and diffusivity, then apply it to both the near-field jet and the far-field dilution. If you change property assumptions, you must rerun the full case set.
Environmental and Boundary Conditions
Dispersion is strongly affected by the surrounding air and enclosure geometry.
Specify:
- Ambient temperature and pressure.
- Wind speed and direction for outdoor or semi-enclosed spaces.
- Ventilation rates for hangars, bays, and compartments.
- Wall roughness and surface effects if your model supports them.
- Obstacles such as beams, ducts, and landing gear bays.
Example: In a hangar with a strong supply jet, the same leak can produce a very different concentration field than in still air. Model the ventilation flow direction explicitly rather than relying on “average” conditions.
Turbulence and Mixing Parameters
Most dispersion solvers require turbulence inputs or turbulence closure assumptions.
Engineering practice:
- Use turbulence intensity and length scale values that match the facility type.
- If you have no facility data, choose conservative turbulence parameters and document the basis.
Example: A small leak in a well-mixed compartment can still create localized pockets if the ventilation jet forms recirculation zones. Turbulence settings determine whether the model predicts those pockets.
Advanced Inputs That Prevent Common Failure Modes
Release Duration and Time Windows
Hydrogen concentration can peak early or later depending on ventilation and mixing. Choose time windows that capture both:
- Near-field peak during the first seconds to minutes.
- Accumulation peak if ventilation is weak.
Example: For a continuous leak, the peak may occur after the flow establishes and the plume reaches steady mixing. For a short burst, the peak may occur before the plume fully disperses.
Flammability Threshold Selection
Model outputs are concentration fields; design decisions require a threshold. Use a threshold that matches the intended safety criterion and the modeling basis.
Practice: apply the same threshold consistently across all cases, and ensure the threshold definition (volume fraction vs. molar fraction) matches the solver output.
Grid Resolution and Numerical Settings
Even with perfect physics, coarse grids can smear jets and underpredict peak concentrations.
Engineering practice:
- Refine the grid near the release point.
- Check grid independence by comparing peak concentration and location across at least two grid densities.
Example: If the peak concentration drops sharply when you refine the grid, the coarse grid was likely overmixing. If the peak stays stable, the grid is probably adequate.
Mind Map: Hydrogen Dispersion Modeling Inputs
Example Input Set for an Enclosure Leak
Assume a small continuous leak from a fitting inside a ventilated bay.
- Release type: passive leak with a fixed mass flow rate.
- Source location: measured from bay walls and floor.
- Time profile: constant for the full simulation window.
- Ambient conditions: specified temperature and pressure for the bay.
- Ventilation: supply and exhaust directions with flow rates.
- Turbulence: facility-appropriate intensity and length scale.
- Numerics: refined grid around the fitting and a grid-independence check.
- Design criterion: apply a single flammability threshold to the solver’s concentration output.
The key is consistency: the same units, property models, and threshold definition must be used from source term through final exceedance evaluation. If you do that, the model becomes a reliable engineering tool rather than a collection of plausible numbers that happen to run.
8.3 Ignition Source Control and Hot Surface Management
Hydrogen ignition is mostly about three things lining up: a flammable mixture, an ignition source, and the right timing. In aircraft cryogenic systems, the “timing” part is often the easiest to manage because you can control when hydrogen is present and when components are energized. The “ignition source” part is the one that deserves the most disciplined engineering.
Foundational Concepts for Ignition Source Control
Start by classifying ignition sources by how they can create energy in a hydrogen atmosphere:
- Electrical sparks from switching, arcing, or damaged insulation.
- Hot surfaces from resistive heating, friction, or localized overheating.
- Mechanical impact that can generate sparks, especially if metal-to-metal contact occurs.
- Static discharge from charge buildup on hoses, fittings, or during flow.
- Flame or hot exhaust from any adjacent combustion equipment.
A practical best practice is to treat every potential source as a “candidate” and then prove it cannot reach the ignition-relevant energy level under normal operation and credible malfunctions. For example, if a valve motor can stall, you design so that stall current does not create a hot spot near a vent outlet.
Hot Surface Management Principles
Hot surface control is not only about average temperature. Hydrogen can ignite from localized heating where airflow is poor or where a surface is insulated from heat sinking.
Key practices:
- Limit surface temperatures at the location of possible hydrogen accumulation. If hydrogen leaks into a pocket, the pocket’s geometry matters more than the component’s datasheet headline temperature.
- Use thermal barriers and spacing. A small standoff between a heater element and a nearby vent duct can prevent a hot surface from being exposed to a flammable mixture.
- Avoid hot spots caused by poor contact. Loose clamps, worn thermal interfaces, and misaligned mounting can raise local temperatures. A simple example is a clamp that is “almost” tight: it may pass inspection at room temperature but overheat under cryogenic cycling and vibration.
- Control friction and motion. Bearings, sliding seals, and moving linkages should be designed to avoid metal-to-metal contact. If you must use a friction element, include a failure mode that defaults to reduced motion rather than increased rubbing.
Control Strategy by System State
Ignition source control becomes easier when you tie it to system states: pressurized but sealed, cooldown, venting, refueling coupling, and shutdown with residual hydrogen.
- Pressurized but sealed: minimize switching events and ensure electrical components are protected from arcing and moisture ingress.
- Cooldown: watch for condensation and ice that can change airflow and heat transfer, potentially creating hot spots on heaters or sensors.
- Venting: treat venting as the highest-risk state because hydrogen concentration near discharge can be high. Keep electrical switching limited and ensure any energized equipment is either thermally isolated or located where hydrogen cannot reach it.
- Refueling coupling: the connection process can create transient leaks. Use procedures that minimize time with fittings open and ensure bonding/grounding to reduce static discharge.
- Shutdown with residual hydrogen: even after valves close, residual gas can remain in lines. Hot surfaces must remain controlled until the system is verified safe.
Engineering Controls and Verification
A robust approach uses layered controls:
- Physical separation: route vents away from electrical boxes, motor housings, and hot components.
- Enclosure and barriers: use sealed housings for electrical parts and thermal barriers for heaters.
- Electrical design: select components and wiring practices that reduce arcing risk, including proper fusing, shielding, and strain relief.
- Grounding and bonding: ensure conductive paths for static charge during coupling and hose handling.
- Temperature monitoring: place sensors where hydrogen could realistically contact surfaces, not just where it is convenient.
Verification should include both analysis and tests. For instance, if you rely on thermal barriers, test with representative airflow and mounting conditions, then confirm that the barrier prevents hydrogen-exposed surfaces from exceeding the design limit.
Mind Map: Ignition Source Control and Hot Surface Management
Example: Vent Outlet Near an Electrical Box
Suppose a vent outlet discharges near an electrical junction box. A straightforward failure is that the vent plume recirculates into the box’s intake path, creating a hydrogen-rich region around a component that can become warm during normal operation.
Integrated fix:
- Re-route the vent so discharge is directed away from the box intake.
- Add a thermal barrier between any warm component and the vent plume region.
- Limit electrical switching during venting by using a control interlock that keeps nonessential circuits de-energized.
- Place a temperature sensor on the warmest relevant surface that could be exposed to hydrogen, then set a conservative threshold that triggers a safe state.
This example shows the core idea: you don’t just “keep things cool,” you ensure that the system state, geometry, and control logic prevent hydrogen from meeting an ignition-capable surface.
Example: Valve Motor Stall and Hot Spot Prevention
A valve motor can stall if a linkage binds. If the motor keeps drawing current, a nearby surface can exceed safe limits. The best practice is to design the control system so that stall is detected quickly and power is removed.
Integrated fix:
- Current monitoring with a short detection window.
- Power cut and safe positioning on stall.
- Thermal design that assumes worst-case stall duration up to detection.
- Mechanical design that reduces binding risk, such as alignment features and robust bearings.
The result is a system that fails “quietly”: it stops energizing the motor rather than continuing to heat the neighborhood.
8.4 Ground Handling Venting Procedures and Interlocks
Ground handling venting is where cryogenic hydrogen systems meet real-world constraints: hoses, couplings, ground power, and people who want the job done safely and on time. The goal is simple—control where hydrogen goes, when it goes, and how the system prevents venting from happening in the wrong place or at the wrong time.
Foundational Concepts for Venting Control
Start with three facts that drive every procedure. First, hydrogen disperses quickly but can still form ignitable mixtures near sources, especially in enclosed or semi-enclosed areas. Second, venting can create local cooling and icing effects on nearby surfaces, which can change valve behavior and sensor readings. Third, venting is not just a plumbing decision; it is a control-system decision that must coordinate tank pressure, valve states, and ignition risk.
A practical way to think about venting is as a controlled “pressure relief path” with an additional “intent path.” The relief path handles unexpected overpressure. The intent path handles planned venting during cooldown, maintenance, or refueling. Procedures must clearly separate these paths so interlocks can enforce the right behavior.
Venting Hardware Layout and Functional Roles
Design the vent system so each component has a clear job. A typical layout includes a vent valve, a vent manifold, a discharge duct or outlet, and a flame arresting element where appropriate. The discharge outlet should be positioned to reduce the chance of hydrogen entering air intakes, service bays, or low-lying equipment compartments.
For ground operations, add a ground-side interface that supports safe connection and disconnection. Example: a quick-connect vent line that only mates when the aircraft-side valve is in a “safe” state, preventing accidental venting during coupling.
Interlock Logic That Prevents Wrong-Time Venting
Interlocks should be layered: hardware permissives, control permissions, and procedural confirmations.
- Hardware permissives ensure the system is in a state where venting is physically safe. Examples include tank pressure within a defined window, vent outlet not obstructed, and valves confirmed closed before any coupling change.
- Control permissions ensure the control computer agrees with the hardware. Examples include “vent command allowed” only when the vent outlet temperature is within a range that avoids brittle behavior in nearby materials.
- Procedural confirmations ensure humans and equipment align. Examples include requiring a ground operator key switch to be in the correct position and a checklist step that confirms area ventilation status.
A useful rule: if any permissive fails, the system should default to the most conservative safe state—often “no vent command,” with relief protection still active.
Ground Handling Venting Procedure Flow
Use a stepwise flow that can be trained and audited.
- Pre-vent area check: confirm the vent outlet is unobstructed and that nearby equipment intakes are in the correct configuration.
- System state verification: confirm tank pressure and temperature are within the planned venting envelope.
- Interlock check: verify all permissives are true, including any ground interface status.
- Command vent mode: select the intended vent mode (planned vent vs relief-only). Planned vent should open the vent valve to a controlled setpoint.
- Monitor and stabilize: watch vent flow indicators, pressure decay rate, and any temperature sensors near the outlet.
- Terminate and confirm: close the vent valve, verify closure feedback, and confirm no residual venting is occurring.
Example: During a controlled cooldown, the system opens the vent valve to maintain pressure below a target. If pressure decay is slower than expected, the procedure pauses and requires a permissive re-check rather than continuing blindly.
Mind Map: Ground Venting and Interlocks
Example: Interlock Set for Planned Vent During Refueling
Assume planned venting is used to manage pressure during a refueling connection. The interlock set can be expressed as permissives:
- Vent outlet obstruction sensor indicates clear.
- Vent valve feedback confirms closed before coupling.
- Tank pressure is above a minimum threshold to avoid unstable venting.
- Ground ventilation status is “enabled.”
- Hydrogen leak detection channels show no alarm.
If any permissive fails, the system blocks the planned vent command and allows only relief protection. This prevents a common failure mode: venting that starts while the outlet is blocked or while a coupling is mid-change.
Example: Termination Criteria That Avoid Residual Venting
Termination should not be “time-based only.” Use criteria such as:
- Vent valve closure command issued.
- Valve position feedback confirms closed.
- Pressure reaches a target band and remains stable for a short verification window.
- No continued rise in vent-line temperature or flow indicator.
This keeps the procedure from ending while hydrogen is still escaping through a partially seated valve—an issue that can look harmless until it isn’t.
8.5 Environmental and Operational Constraints for Vent Operations
Vent operations for cryogenic hydrogen are less about “letting gas out” and more about controlling where energy goes, how quickly it disperses, and what ignition sources might be present. The constraints below are written for engineering and operations teams who need repeatable procedures, not one-off heroics.
Environmental Constraints That Shape Venting
Ambient temperature and wind determine how fast a hydrogen cloud dilutes. Hydrogen rises and disperses differently than heavier gases, so a vent that seems safe in still air can become unsafe when wind shifts and carries the cloud toward a protected area.
Humidity and precipitation affect condensation and surface wetting on nearby structures. Even though hydrogen itself does not condense like water, cold vent plumes can chill surfaces enough to change how air mixes near the discharge, which in turn changes local concentration gradients.
Ground surface conditions matter because cold plumes can cool pavement and create thermal stratification. Stratification can slow mixing near the ground, increasing the time window where concentrations remain elevated.
Altitude and atmospheric pressure influence gas expansion and buoyancy. A vent that produces a certain jet momentum at one pressure can behave differently at another, so discharge assumptions must match the operational envelope.
Operational Constraints That Shape Venting
Crew and equipment proximity is a hard constraint. Venting should be planned so that personnel are outside the expected flammable region during the entire discharge and decay period.
Vent duration and duty cycle are constrained by tank boil-off behavior and by how quickly the system can return to a stable state. A long vent can cool components excessively, while frequent short vents can create thermal cycling that stresses seals and fittings.
Interlock logic and mode selection must prevent venting during incompatible aircraft states. For example, venting should not occur when a fuel cell purge or engine start sequence is in progress if the discharge could interfere with sensors or create unexpected local concentrations.
Maintenance status is operationally relevant. A vent valve that was recently serviced might have different response times, and a partially inhibited system can lead to incomplete discharge clearing.
Constraint Mind Map
Mind Map: Environmental and Operational Constraints for Vent Operations
Integrated Operational Logic for Venting
A practical way to keep constraints from becoming a checklist that nobody trusts is to structure venting as a sequence of decisions.
- Confirm environmental inputs: record wind direction and speed, ambient temperature, and pressure/altitude category. If wind direction is unstable, delay venting until it meets the procedure’s stability criterion.
- Confirm aircraft state compatibility: verify that the aircraft is in a mode where venting will not conflict with ignition-related operations, sensor calibration states, or fuel system conditioning.
- Select discharge profile: choose vent duration and flow regime consistent with the thermal limits of the tank and downstream components. If the system supports staged venting, use it to reduce peak local concentration.
- Enforce exclusion zones: establish access control for the full discharge and a defined post-vent decay period. The decay period should reflect the time for dilution to fall below the operational threshold.
- Verify clearing: confirm that the vent path is not obstructed and that the system returns to a stable pressure/temperature state before releasing personnel.
Example: Wind Shift During Ground Venting
Suppose a ground team begins a planned vent to reduce tank pressure. Midway through the discharge, wind direction shifts toward the service corridor. The procedure should require an immediate stop or a controlled transition to a safer discharge profile, followed by a re-check of exclusion zone boundaries. The key is that the decision is based on measured wind, not on “it seems fine,” because hydrogen concentration is sensitive to mixing direction.
Example: Short Vent Bursts and Thermal Cycling
Consider a scenario where operators repeatedly vent in short bursts to avoid exceeding a pressure limit. Even if each burst is individually acceptable, the cumulative thermal cycling can increase seal leakage risk and degrade valve performance. The constraint here is duty cycle: the procedure should limit the number of bursts within a time window and require a cooldown or stabilization period between bursts.
Example: Interlock Conflict with Sensor Conditioning
During a preflight sequence, some systems may be warming sensors or conditioning measurement circuits. If venting occurs simultaneously, the cold plume can bias readings and cause the control system to misinterpret system state. A robust interlock prevents venting when sensor conditioning is active, or it schedules venting only after the sensors report stable values.
Operational Acceptance Criteria
Vent operations should be considered acceptable only when environmental conditions are within the defined envelope, aircraft mode compatibility is confirmed, exclusion zones are maintained for the full discharge plus decay time, and the system returns to stable parameters without abnormal valve behavior or persistent indications of leakage.
9. Safety Engineering and Certification Evidence
9.1 Hazard Identification Methods for Hydrogen Aircraft Systems
Hazard identification is the step where you stop trusting “it should be fine” and start listing what can go wrong, where, and why. For hydrogen aircraft systems, the goal is not to predict every accident; it is to build a complete enough hazard inventory that later analyses have something solid to work with.
Core Concepts and Boundaries
Start by defining the system boundary in plain terms: tanks, fuel lines, valves, regulators, fuel cells or engines, venting, sensors, and controls. Then define operating modes that change the hazard picture, such as ground handling, taxi, climb, cruise, descent, and shutdown. A useful practice is to write one-sentence “mode descriptions” for each mode, like “venting active during cooldown” or “fuel conditioning at steady delivery pressure.” This prevents mixing assumptions later.
Next, decide the hazard “viewpoints” you will use. Hydrogen hazards are often multi-mechanism: a leak can become a flammable cloud, which can become an ignition event, which can become a fire or explosion, which can damage adjacent systems. If you only list “fire,” you miss the earlier chain.
Structured Hazard Identification Workflow
Use a repeatable workflow so the team does not rely on memory.
- Create a system map: break the system into functions (store, transfer, condition, meter, vent, detect, shut down). For each function, list components.
- Perform hazard brainstorming with constraints: require each hazard statement to include a cause and a consequence. Example format: “Valve fails open due to stuck actuator, causing uncontrolled release.”
- Cross-check with energy and release mechanisms: hydrogen hazards often start with stored energy (pressure, cryogenic temperature) and release mechanisms (leak, rupture, vent discharge).
- Group hazards into scenarios: combine related hazards into credible chains (release → dispersion → ignition → escalation).
- Validate completeness: compare your list against failure categories (leak, overpressure, wrong configuration, loss of detection, incorrect vent routing, thermal mismatch).
- Record evidence needs: for each hazard, note what later analysis or testing must confirm.
A practical “no gaps” check is to ensure every function has at least one hazard for each of these buckets: unintended release, inability to stop release, inability to detect release, and inability to mitigate release.
Mind Map: Hydrogen Hazard Identification
Example Hazard Statements and How They Evolve
A good hazard statement is specific enough to guide later work.
Example 1: Unintended Release
- Hazard statement: “A cryogenic line connection leaks during taxi, releasing hydrogen that forms a flammable mixture near ignition-capable equipment.”
- What it triggers next: identify likely leak points, estimate release rate ranges, and define ignition sources in the same zone.
Example 2: Inability to Stop Release
- Hazard statement: “A stuck-open isolation valve prevents rapid shutdown after a detected leak.”
- What it triggers next: analyze valve failure modes, confirm control logic behavior, and check whether alternate isolation paths exist.
Example 3: Detection Gaps
- Hazard statement: “Sensor placement misses a low-velocity leak region, delaying crew awareness.”
- What it triggers next: review sensor coverage assumptions, consider airflow effects, and define alarm thresholds that match credible leak scenarios.
Example 4: Venting as a Hazard Source
- Hazard statement: “A vent discharge is routed into an area with ignition-capable components during cooldown.”
- What it triggers next: verify vent routing geometry, discharge conditions, and interlocks that prevent unsafe vent states.
Advanced Details Without Getting Lost
To move from “list of hazards” to “usable hazard inventory,” add two layers of structure.
First, attach a zone to each hazard chain: tank bay, equipment compartment, wheel well area, cockpit-adjacent space, or service access area. Hydrogen behavior depends on local airflow and geometry, so zones prevent generic conclusions.
Second, attach a barrier view: detection barrier, isolation barrier, ignition prevention barrier, and mitigation barrier. For instance, a leak may be controlled by isolation valves, but if detection is slow, the mitigation barrier must handle the longer exposure.
Finally, keep the records consistent. Use the same naming for components and the same mode labels across the team. When hazard statements are comparable, later analyses stop fighting paperwork and start doing engineering.
9.2 Quantitative Risk Assessment for Flammable Gas Scenarios
Quantitative Risk Assessment (QRA) turns “something could go wrong” into numbers you can compare, prioritize, and defend. For hydrogen flammability, the goal is not to predict a single exact outcome; it is to estimate risk with transparent assumptions, then show which design choices reduce it.
Core Concepts and Inputs
Start by defining the scenario boundaries. A flammable gas scenario usually includes: a release location, a release rate profile, a dispersion outcome, an ignition possibility, and a consequence model. For example, consider a cryogenic tank vent line that fails at a ground stand. The scenario boundary might include only the vent discharge zone and nearby equipment, not the entire airport.
Next, define the event tree structure. Typical branches are: (1) release occurs, (2) hydrogen concentration reaches a flammable range at some location, (3) an ignition source is present and effective, and (4) the release leads to a fire or explosion consequence. Each branch gets a probability or conditional probability.
Finally, define consequence metrics. For aircraft safety work, you might use: hazard distance to critical zones, thermal dose to materials or occupants, overpressure thresholds for structural components, or expected damage categories. Pick metrics that map to acceptance criteria used elsewhere in the safety case.
Step 1: Hazard Identification to Scenario Selection
Use the system hazard analysis outputs to select scenarios that are both credible and decision-relevant. Credible means the initiating event frequency is not negligible; decision-relevant means the scenario outcome changes with design choices.
A practical selection method is to rank scenarios by a rough risk score: frequency × plausible consequence severity. Then keep the top set for full QRA. For instance, a small leak with rapid dispersion might be less important than a medium leak that persists near a vent outlet where ignition sources are more likely.
Step 2: Release Frequency and Initiating Event Modeling
Quantify release frequency using component failure data and operational context. You combine: component failure rate, exposure time, and conditional probabilities of failure mode.
Example: If a valve has a failure rate of 1×10^-6 per flight hour and it is exposed for 0.5 flight hours during a typical mission phase, the baseline release frequency is 5×10^-7 per mission hour for that failure mode. Then adjust for whether the failure leads to a leak versus a catastrophic rupture.
Keep the model auditable. If you assume “leak probability equals 0.7,” state what that 0.7 represents (e.g., fraction of failures that are leaks rather than breaks).
Step 3: Release Rate and Duration Profiles
Hydrogen release rate depends on phase, pressure, orifice size, and whether the release is flashing. For cryogenic systems, a common approach is to model a range of release sizes: small, medium, and large. Each size gets a release rate curve and a duration.
Example: A stuck-open relief valve might produce a sustained discharge for minutes. A seal leak might produce a lower rate but longer duration. Both can be important: sustained releases can increase the chance of flammable concentration lingering near ignition sources.
Step 4: Dispersion and Flammability Envelope
Dispersion modeling estimates hydrogen concentration versus time and space. You need inputs such as wind or ventilation conditions, release momentum, and geometry around the aircraft.
A useful simplification is to define “relevant locations” where ignition would matter: near electrical equipment, hot surfaces, or vent outlet structures. Then compute whether concentration exceeds the flammability limits at those locations.
Example: If the flammability limit is treated as 4–75% hydrogen in air, you evaluate whether the modeled concentration at a relevant location crosses that band. If it never crosses, the ignition branch probability becomes effectively zero for that scenario.
Step 5: Ignition Probability and Effective Ignition
Ignition probability is not just “an ignition source exists.” It must be effective given the concentration, energy, and distance from the release.
A structured way is to define ignition source categories: electrical sparks, hot surfaces, static discharge, and mechanical impact. For each category, estimate the conditional probability of ignition given flammable mixture presence.
Example: If a hot surface is present but typically below the minimum ignition temperature for hydrogen under expected conditions, its effective ignition probability is low even when the concentration is flammable.
Step 6: Consequence Modeling
Consequences depend on whether the event is a jet fire, flash fire, or explosion-like behavior. For many hydrogen releases, flash fire and jet fire dominate the safety picture.
Example: For a jet fire, estimate heat flux at critical zones and compare to thresholds for component damage or survivability. For flash fire, use thermal dose over a time window. For explosion-like scenarios, use overpressure or impulse thresholds and consider confinement or obstruction effects.
Step 7: Integrate the Event Tree into Risk Numbers
Compute scenario risk as the sum over event tree paths:
- Path probability = release frequency × conditional flammable presence × conditional ignition effectiveness × conditional consequence occurrence.
- Risk metric = Σ(path probability × consequence severity measure).
Then compare against acceptance criteria. If you have multiple scenarios, you can also compute cumulative risk for a subsystem, such as “fuel venting and relief.”
Mind Map: Quantitative Risk Assessment Flow
Worked Example: Medium Leak Near a Vent Outlet
Assume a medium leak from a seal during ground turnaround. Let the initiating release frequency be 2×10^-6 per turnaround. Dispersion modeling shows flammable concentration at a relevant hot surface location for 30% of the release duration, so the conditional flammable presence probability is 0.3. The hot surface ignition effectiveness given flammable mixture is 0.05.
If the consequence model indicates that ignition leads to a flash fire with probability 0.6 (versus a localized burn that does not reach critical zones), then the path probability is:
2×10^-6 × 0.3 × 0.05 × 0.6 = 1.8×10^-8 per turnaround.
You then convert that into the chosen risk metric using the consequence severity measure, such as expected thermal dose exceeding a threshold. If the dose is below threshold, you set consequence occurrence probability lower or severity to zero for that metric.
Sensitivity Checks Without Hand-Waving
After computing baseline risk, vary the most influential assumptions: release size, duration, dispersion conditions, and ignition effectiveness. If risk changes by orders of magnitude when you adjust one parameter, that parameter becomes a priority for design verification or testing.
A simple sensitivity table can be enough:
- Release frequency: ×0.5 and ×2
- Flammable presence probability: 0.2 and 0.4
- Ignition effectiveness: 0.02 and 0.1
- Consequence occurrence: 0.3 and 0.9
If the ranking of scenarios flips under reasonable bounds, you revisit scenario selection or refine modeling inputs.
Documentation That Holds Up Under Review
A QRA is only as useful as its traceability. Record: assumptions, data sources used for failure rates, modeling boundary conditions, and how each branch probability was obtained. Include uncertainty handling in a way that supports consistent decisions, not just a final number.
For hydrogen flammability, the most common failure mode in QRA is treating dispersion and ignition as independent without checking geometry and time overlap. Keep the event tree time-consistent: flammable presence must coincide with ignition effectiveness for the path to count.
9.3 Failure Mode Analysis for Fuel and Vent Components
Failure Mode Analysis (FMA) for cryogenic hydrogen fuel and vent components answers a simple question: if something goes wrong, what exactly goes wrong, how does it show up, and what prevents it from becoming hazardous. The goal is not to list every possible mishap; it is to connect component-level failures to system-level effects using repeatable logic.
Start with Boundaries and Interfaces
Define the analysis scope so the results stay usable. For fuel and vent components, boundaries typically include tank outlets, valves, regulators, manifolds, relief devices, vent lines, and any associated sensors and control logic. Interfaces include:
- Mechanical interfaces: couplings, welds, supports, and thermal breaks.
- Fluid interfaces: liquid hydrogen, gaseous hydrogen, and any purge or inerting streams.
- Control interfaces: valve commands, pressure setpoints, and interlock signals.
A practical habit: write one “normal flow” paragraph for fuel and one for venting. When you later analyze failures, you can compare each failure mode to the expected flow and identify what changed.
Choose a Failure Lens
Use a structured lens that covers both hardware and behavior. A common approach is to categorize failure modes by how they affect function:
- Stuck in position: valve fails open or closed.
- Loss of actuation: command issued but no movement.
- Degraded capacity: reduced flow, increased pressure drop, or delayed response.
- Leakage: external leak to the bay or internal leak between compartments.
- Incorrect sensing: sensor drift or wrong signal scaling.
- Incorrect control response: interlock logic triggers at the wrong time.
Example: a vent valve that “fails open” can create a continuous discharge path. Even if the vent line is correctly routed, the system may exceed allowable discharge rates and create persistent ignition risk.
Build a Component-to-Effect Map
For each component, list failure modes and translate them into effects on the fuel/vent system. Keep the translation concrete: effects should be measurable (pressure, temperature, flow, discharge duration) rather than vague (“unsafe”).
A useful template for each failure mode:
- Failure mode: what fails.
- Immediate effect: what changes first.
- Propagated effect: what changes next in the system.
- Hazardous condition: what safety-relevant state can occur.
- Detection: what sensor or observation would indicate it.
- Mitigation: what design feature or procedure limits the outcome.
Example: regulator diaphragm rupture.
- Immediate effect: loss of pressure regulation.
- Propagated effect: downstream pressure rises, increasing flow through relief devices.
- Hazardous condition: elevated vent discharge and potential accumulation in low-vent areas.
- Detection: pressure sensor overshoot and relief activation pattern.
- Mitigation: relief capacity sizing, vent routing, and control logic that commands safe valve positions.
Mind Map of Fuel and Vent Failure Modes
Mind Map: Fuel and Vent Failure Modes
Detection and Mitigation Must Be Paired
A failure mode without detection is just a surprise waiting for a schedule. Pair each failure mode with at least one credible detection path and one mitigation path.
-
Detection examples:
- Relief device activation frequency that deviates from expected cooldown behavior.
- Pressure sensor overshoot rate during commanded valve transitions.
- Hydrogen concentration rise near vent outlets during ground handling.
-
Mitigation examples:
- Isolation valves that close on loss of signal.
- Control logic that inhibits venting when certain conditions are not met.
- Vent line design that prevents pooling and directs discharge to safe zones.
Use Examples to Stress the Logic
Example 1: Vent line blockage during a cooldown.
- Immediate effect: backpressure increases.
- Propagated effect: tank pressure rises; relief devices may cycle.
- Detection: repeated relief activations with rising upstream pressure.
- Mitigation: control logic commands isolation and limits further cooldown flow; maintenance flags the event.
Example 2: External leak at a cryogenic fitting.
- Immediate effect: localized hydrogen release.
- Propagated effect: concentration increases in the bay; ignition risk depends on ventilation.
- Detection: hydrogen sensors and pressure/temperature anomalies.
- Mitigation: rapid isolation, controlled venting of remaining inventory, and procedural removal from service.
Close the Loop with Verification
After listing failure modes, verify that the analysis is consistent with system behavior. Cross-check that:
- Every hazardous condition has at least one detection and one mitigation.
- Mitigations are not mutually dependent on the same single component that could fail.
- The analysis uses the same assumptions for flow direction, vent routing, and sensor placement.
A small but effective check: pick the top three hazardous conditions and trace backward to confirm which component failures can cause them and which safeguards prevent escalation.
9.4 Safety Interlocks and Protective Control System Design
Safety interlocks are the aircraft’s “do not proceed” logic. They prevent unsafe states by forcing the system into a safe configuration when conditions drift outside allowed envelopes. Protective control systems go one step further: they actively manage power, flow, and venting so the system returns to a safe state rather than simply shutting down.
Core Concepts and Design Goals
Start with three foundational ideas: (1) interlocks must be deterministic, (2) protective actions must be traceable to specific hazards, and (3) the system must fail safe. Deterministic means the same inputs produce the same outputs, even under sensor noise. Traceable means each interlock maps to a hazard scenario and a defined safe state. Fail safe means that loss of power, loss of signal, or internal faults lead to conservative actuation.
A practical way to keep this grounded is to define a small set of safe states for the cryogenic hydrogen subsystem. For example: “Fuel isolated and depressurized,” “Fuel isolated with controlled vent,” and “Fuel allowed with verified conditions.” Each interlock then targets one of these states.
Interlock Architecture from Sensors to Actuators
Design the chain in layers.
-
Sensing and validation: Each critical measurement (tank pressure, line pressure, temperature, leak detector status, vent valve position feedback) is checked for plausibility. A simple plausibility check can be: if pressure jumps by more than a threshold within a short time window, treat it as invalid and trigger a conservative mode.
-
Decision logic: Interlocks should use clear boolean conditions derived from validated signals. Example: “If line pressure exceeds limit AND vent valve feedback indicates closed, then command vent open.” This avoids ambiguous “maybe” logic.
-
Actuation and feedback: Commands to valves and pumps must be verified by position or current feedback. If the commanded state is not reached within a time budget, the system should escalate to a higher-consequence safe state.
-
Escalation ladder: Not every fault should immediately trigger the most severe action. A ladder reduces unnecessary shutdowns while still protecting safety. For instance, a single sensor disagreement might cause “fuel allowed only at reduced flow,” while multiple independent disagreements trigger “fuel isolated.”
Protective Control Actions That Match the Hazard
Interlocks stop progression; protective control manages the transition.
- Overpressure: If tank or line pressure exceeds limits, the system should open the appropriate vent path and close upstream isolation valves to prevent feeding the overpressure source.
- Leak indication: If leak detectors indicate hydrogen in a compartment, the system should isolate fuel, inhibit ignition sources in the affected area, and route ventilation to maintain dilution.
- Thermal excursions: If temperatures indicate abnormal heat leak or cooldown failure, the system should reduce or stop fuel delivery and move to a controlled vent or safe depressurization.
A useful example is the “vent open with confirmation” rule. If the vent command is issued but the vent valve feedback does not confirm open, the controller should not keep feeding fuel. It should isolate fuel and switch to a secondary vent path if available.
Mind Map: Safety Interlocks and Protective Control
Example Interlock Set with Clear Reasoning
Example: Line Pressure High With Vent Feedback Mismatch
- Inputs: line pressure (validated), vent valve command, vent valve position feedback.
- Interlock rule: If line pressure > P_high_limit for longer than T_hold AND vent valve feedback is not “open,” then command fuel isolation valves closed.
- Protective control: Simultaneously command vent open on the primary vent path. If feedback still does not confirm open within T_vent_confirm, command the secondary vent path if installed.
- Escalation: If both vent paths fail confirmation, transition to “fuel isolated and depressurized” by inhibiting fuel delivery and allowing controlled pressure decay.
This example shows why feedback matters. Without it, the controller could keep issuing commands while the system remains in an unsafe configuration.
Example: Leak Detection with Compartment-Specific Logic
Assume leak detectors are grouped by compartment. The interlock should not treat every leak detector the same.
- If a detector in the fuel compartment indicates leak, isolate fuel and open ventilation for that compartment.
- If a detector in a non-fuel compartment indicates leak, isolate only the relevant distribution segment and adjust ventilation routing accordingly.
This compartment-specific approach reduces collateral shutdown while still matching the hazard to the protective action.
Verification and Evidence Within the System Design
Verification should include both nominal and fault cases. For each interlock, test at least: sensor stuck at a limit, sensor disagreement across redundant channels, feedback mismatch, and simultaneous faults that could otherwise create conflicting commands. During testing, log the exact condition that triggered the interlock and the time to reach the safe state.
A good design produces a clean story: hazard condition occurs, validation passes or fails in a defined way, interlock triggers, protective control transitions to a defined safe state, and feedback confirms completion. If any step is missing, the system is not just “less safe”; it is harder to certify and harder to operate under stress.
9.5 Test Evidence Planning for System Level Safety Demonstration
A system-level safety demonstration needs evidence that is traceable, technically credible, and consistent across test types. The goal is not to “prove nothing can go wrong,” but to show that identified hazards are controlled to an acceptable level with measurable support. A practical plan starts with the safety requirements, then maps them to verification methods, and finally defines how results become certification-ready evidence.
Evidence Planning Foundations
Begin by turning the safety case into testable claims. Each claim should state what is being controlled (for example, “hydrogen concentration remains below ignition-relevant thresholds during credible vent failures”) and under what conditions (altitude, tank temperature, flight phase, maintenance state). Then derive verification objectives from those claims.
A useful rule: every verification objective must have a measurable acceptance criterion. If the criterion is qualitative, rewrite it into a measurable form. For instance, replace “leak detection works” with “the system detects a manifold leak within X seconds and commands isolation valves within Y seconds under specified sensor and flow conditions.”
Coverage Mapping from Hazards to Tests
Create a coverage matrix that links hazards and safety functions to evidence sources. Evidence sources typically include analysis, inspection, test, and demonstration. For system-level safety, tests usually cover dynamic behavior and interactions that analysis alone cannot fully capture.
A coverage matrix should include:
- Hazard or safety function ID
- Verification objective
- Test type (component, integrated subsystem, system-in-the-loop, full system)
- Scenario definition (inputs, initial conditions, failure triggers)
- Acceptance criteria
- Evidence artifacts (data sets, reports, calibration records)
This prevents the common failure mode where tests exist but do not clearly support the safety claim.
Scenario Selection and Credible Boundaries
Test scenarios must be credible and bounded. Credible means they represent failure modes and operating conditions that can occur. Bounded means they are limited to a defined envelope so results are interpretable.
For cryogenic hydrogen systems, define scenario envelopes such as:
- Tank temperature range and allowable cooldown state
- Pressure and flow ranges at the fuel conditioning stage
- Vent valve response times and discharge conditions
- Sensor operating ranges and fault injection modes
Example: For a “vent valve fails to open” scenario, set initial tank pressure and insulation heat leak conditions so the resulting pressure rise rate is representative. Then define the time window in which the safety control must act.
Test Levels and What Each Proves
System-level safety evidence is strongest when it combines levels in a deliberate chain:
- Component tests prove individual performance limits (valve actuation, sensor response, relief behavior).
- Subsystem tests prove interactions (fuel manifold with leak detection and isolation logic).
- System-in-the-loop tests prove control behavior with realistic timing and interfaces.
- Integrated system tests prove end-to-end behavior under representative thermal and pressure dynamics.
A slightly playful but serious point: if a control law depends on multiple sensor signals, you cannot validate it using only one sensor’s standalone response. The timing and cross-signal consistency matter.
Acceptance Criteria and Measurement Integrity
Acceptance criteria should include both functional and quantitative constraints:
- Functional: correct isolation command, correct vent routing, correct shutdown mode
- Quantitative: detection latency, valve travel time, pressure overshoot limits, concentration thresholds
Measurement integrity requires calibration traceability and uncertainty handling. For each key measurement, define:
- Sensor type and calibration status
- Sampling rate and filtering
- Uncertainty budget and how it affects pass/fail
If uncertainty is large, tighten the test setup or adjust the criterion with justified margins.
Evidence Artifacts and Traceability
Plan evidence artifacts so they can be audited. Typical artifacts include:
- Test procedures and configuration control records
- Data acquisition logs and raw data retention plan
- Calibration certificates and traceability statements
- Failure injection documentation
- Results summary with pass/fail rationale
- Deviations log with impact assessment
Traceability should be end-to-end: from safety requirement to verification objective to test procedure to acceptance criteria to recorded results.
Mind Map: System-Level Safety Demonstration Evidence
Example: Evidence Plan for a Fuel Manifold Leak Scenario
Safety claim: “A credible manifold leak is detected and isolated before it reaches ignition-relevant conditions in the protected compartment.”
Verification objectives:
- Detection latency ≤ X seconds from leak onset.
- Isolation valves close within Y seconds after detection.
- Hydrogen concentration at the ignition-relevant location remains below Z during the isolation window.
Test approach:
- Component tests validate sensor response and valve actuation limits.
- Subsystem tests validate manifold flow dynamics and leak detection thresholds.
- System-in-the-loop tests validate control logic timing with realistic sensor update rates.
- Integrated system test validates thermal and pressure coupling effects.
Acceptance criteria are applied consistently across levels, with uncertainty accounted for in Z.
Example: Evidence Plan for a Vent Relief Misbehavior Scenario
Safety claim: “Relief and vent pathways prevent unsafe pressure rise and avoid uncontrolled discharge into ignition-prone zones under credible misbehavior.”
Verification objectives:
- Pressure overshoot does not exceed the defined structural and control limits.
- Vent routing commands match the required discharge path.
- Hot surface exposure is prevented by interlocks within a defined time.
Scenario envelope defines tank temperature, pressure rise rate, and the specific misbehavior trigger (for example, stuck valve position or delayed command). Evidence artifacts include raw pressure traces, valve position logs, and interlock state transitions.
A complete plan ends with a traceability check: every safety claim has at least one evidence-backed verification objective, and every verification objective has a defined scenario, acceptance criterion, and recorded result. When that chain is intact, the safety demonstration becomes something you can actually review, not just something you can say you did.
10. Flight Operations and Ground Turn Procedures
10.1 Preflight Checks for Cryogenic Fuel Systems
Preflight checks for cryogenic hydrogen systems aim to answer three questions: Is the fuel system ready to deliver hydrogen at the right conditions, is it safe if something is wrong, and will the aircraft behave predictably during the first minutes after start. The checks below move from basic verification to subsystem-level confirmation, then to crew-facing readiness.
Mind Map: Preflight Checks Flow
System Readiness
Start by confirming the aircraft is in the correct configuration for cryogenic operations. Verify that the fuel system control mode matches the planned propulsion configuration and that any maintenance tags or deferred items are cleared for flight. A practical example is a “valve inhibit” flag left active after a ground test; the aircraft may refuse to open a delivery valve even though the hardware is fine. Confirm that the electrical power quality is within limits for the sensors and actuators, because weak power can produce misleading readings from cryogenic temperature sensors.
Next, check that the data system is recording the parameters required for the start sequence. If the log is missing a key channel, you lose the ability to verify that cooldown and pressure conditioning behaved as expected during the first phase.
Cryogenic Tank Condition
Cryogenic tanks are not just containers; they are dynamic thermal systems. Verify tank temperature and pressure against the aircraft’s allowable pre-start window. Look for trends, not single values. For example, a tank that is “within limits” but rising quickly may indicate abnormal heat leak or a sensor offset. Confirm that insulation-related indicators, such as vacuum gauge readings or boil-off rate proxies, are consistent with the expected thermal state.
A simple reasoning check helps: if the tank pressure is high while temperature is low, suspect a measurement mismatch or a regulator-related backpressure effect rather than assuming the tank is “overfilled.”
Fuel Supply Path
Move to the fuel supply path and confirm that valves and actuators are in their commanded pre-start positions. Verify actuator health by checking that position feedback matches the expected state. A common easy-to-miss issue is a valve that is mechanically free but electrically miscalibrated, leading to a “closed” command that still reports partial opening.
Inspect and verify the status of filters or strainers in the delivery path. If the system uses differential pressure indicators, confirm they are within limits. Example: a clogged strainer can cause delayed pressure rise during start, which may trigger protective logic even though the tank condition is normal.
Conditioning and Delivery
Cryogenic hydrogen often requires conditioning before it reaches the engine or fuel cell system. Confirm that the vaporizer or heat exchanger is in a safe state for start, including any required preheat conditions. If the system uses a heat exchanger with a controlled thermal interface, verify that the interface temperature is within the expected range for stable operation.
Then verify pressure conditioning components. Check regulator setpoints and ensure that any pressure relief or bypass paths are correctly configured. A practical example is a regulator that is set correctly but has a stuck bypass valve; the system may show stable tank pressure while delivery pressure fails to track during the first seconds of demand.
Safety and Venting
Safety checks should be concrete and observable. Confirm vent routing and discharge clearance so that vent outlets are not blocked by ground equipment or covers. Verify that relief valve inspection status is current and that any vent system isolation devices are in the correct pre-start state.
Leak detection sensors require both hardware and logic verification. Confirm sensor health indicators and that the fault annunciation logic is active. Example: a sensor can be physically connected but disabled in software due to a prior maintenance action; the aircraft then lacks the ability to trigger the correct isolation response.
Start Sequence Readiness
Finally, confirm that the system is ready for the planned start sequence. Verify that pre-start purge and cooldown steps are permitted by the inhibit logic. Check that any expected transient behavior is consistent with the aircraft’s normal start window.
Crew-facing readiness means the crew can interpret what they see. Ensure the checklist includes the specific annunciations and parameter thresholds that indicate “go,” “hold,” or “abort.” For instance, if the system detects a mismatch between commanded and actual valve positions, the crew should know whether the correct action is to reattempt a command cycle or to stop and troubleshoot.
A good preflight ends with a single integrated question: are tank condition, supply path readiness, conditioning state, and safety logic all aligned for the first delivery event? If any one of these is inconsistent, treat it as a system-level issue, not a minor nuisance.
10.2 Refueling Operations and Coupling Procedures
Refueling a cryogenic hydrogen aircraft is mostly about controlling interfaces: temperature, pressure, flow, and contamination. The goal is to move hydrogen from a ground source into the aircraft tank without creating unsafe leaks, excessive boil-off, or unstable pressure transients. A good procedure treats the coupling as a system, not a single connector.
Foundational Concepts for Safe Coupling
Start with the two constraints that drive everything else. First, liquid hydrogen is cold enough to cause rapid heat transfer if the interface is exposed to warmer surfaces. Second, hydrogen’s small molecule size makes sealing and leak detection a constant concern.
Practical implication: every step should either (1) keep the coupling surfaces at controlled temperature, (2) manage pressure gradients, or (3) verify that the system is in the expected state before the next action.
Pre-Refueling Verification
Before any connection, confirm that the aircraft and ground equipment agree on basic parameters. Verify tank status indicators, confirm the aircraft is in the correct operational mode for refueling, and check that the fueling panel shows no active faults. On the ground side, confirm the hose condition, coupling gasket integrity, and that the supply pressure and flow capability match the planned fueling profile.
A simple example: if the aircraft tank is already warm from recent operations, the same fueling flow rate can produce higher boil-off and a different final pressure. The procedure should therefore include a “state check” step that informs the planned flow and cooldown behavior.
Coupling Sequence and Interface Control
The coupling sequence should be ordered to prevent trapped gas pockets and to avoid sudden thermal shocks.
- Establish safe area and grounding: confirm bonding/grounding continuity to reduce static risk during cryogenic transfer.
- Position and inspect the coupling: ensure alignment marks match and that the connector face is clean and dry where required.
- Pre-chill or condition the interface: if the system uses a controlled pre-chill step, apply it before introducing liquid. This reduces the chance of rapid vapor formation at the interface.
- Connect with controlled pressure: engage the coupling while both sides are within the allowed pressure window.
- Perform leak checks at the coupling: use the specified method (for example, pressure decay or sensor-based detection) before opening full flow.
A practical example: if leak detection indicates a small coupling leak, the procedure should stop before full flow. Continuing would increase the leak rate and can also contaminate nearby seals, making the next attempt worse.
Flow Initiation and Stabilization
Once the coupling passes leak checks, begin flow using a staged approach. Start with a low flow to stabilize pressure and temperature, then ramp toward the target rate.
Why staging matters: cryogenic transfer can create oscillations if the tank pressure control and the supply flow are not synchronized. A staged ramp gives the tank control system time to settle.
Example workflow: ramp to 20% flow for a short stabilization interval, confirm tank pressure rise rate is within limits, then proceed to the planned flow profile.
Pressure Management and Vent Handling
During refueling, the aircraft may vent to manage boil-off and maintain tank pressure within limits. The procedure must specify how vent discharge is handled, including ensuring that vent outlets are unobstructed and that venting does not interfere with sensors.
A concrete check: confirm that the vent line temperature and pressure readings are consistent with expected boil-off behavior. If vent behavior deviates, stop and troubleshoot before continuing.
Monitoring During Refueling
Monitoring should be continuous and tied to decision points. Track coupling leak indicators, tank pressure, tank temperature, and flow rate. The key is to define what “normal” looks like for each parameter and what triggers an abort.
Example decision rule: if coupling leak sensor output crosses the threshold for more than a defined time window, terminate flow and follow the safe shutdown steps.
Completion, Decoupling, and Post-Transfer Steps
When the target fill level or pressure condition is reached, stop flow in a controlled manner. Then allow a short stabilization period so that pressure equalizes and residual liquid/vapor conditions settle.
Decoupling should avoid pulling the connector while residual pressure or temperature gradients remain extreme. Follow the specified sequence: close valves, confirm pressure equalization, perform final leak check if required, then disconnect.
A practical example: disconnecting immediately after flow stop can leave a warmer connector face that increases subsequent boil-off and makes the next coupling attempt less reliable.
Mind Map: Refueling Operations and Coupling Procedures
Example: End-to-End Coupling Walkthrough
Assume the aircraft is ready for refueling and the ground supply is prepared. The crew verifies aircraft mode and checks for active faults. The coupling is aligned and connected only after interface conditioning and a pressure window check. A coupling leak test is performed before opening flow. Flow begins at a low rate, stabilizes, then ramps to the planned profile while monitoring tank pressure rise rate and vent behavior. When the target condition is reached, flow is stopped, valves are closed in order, and a short stabilization interval is observed. A final coupling verification is completed before disconnecting, followed by post-transfer checks to confirm the system is left in a safe, serviceable state.
10.3 Startup and Shutdown Sequences for Engines and Fuel Cells
Startup and shutdown are where hydrogen systems prove they can behave predictably under real constraints: cryogenic temperatures, pressure conditioning, ignition or electrochemical start-up, and the need to keep crews informed without drowning them in alarms. A good sequence is built around three ideas: (1) establish safe states first, (2) bring reactants and power systems online in the smallest sensible steps, and (3) verify each step with measurements that actually reflect the physics.
Core Sequence Principles
-
Start from a known safe configuration. Fuel valves default closed, vent paths verified open where required, and ignition sources inhibited until hydrogen concentration and system conditions are acceptable. A practical example is the “two-confirm rule”: the controller requires both a valve position feedback and a pressure/flow indication before it allows the next stage.
-
Use staged energy and staged exposure. For engines, ignition is the final step after fuel delivery is stable. For fuel cells, electrical load application is gradual so the stack sees controlled current and thermal conditions. A practical example is ramping: instead of jumping from idle to full power, the sequence increases command in small increments while monitoring stack voltage and fuel utilization.
-
Tie every transition to a measurable criterion. “Ready” should mean something like “tank pressure within band,” “manifold temperature above minimum,” “no detected leak in the last interval,” or “hydrogen partial pressure at inlet within target.”
Engine Startup Sequence
A hydrogen combustion engine startup typically follows this order.
-
Pre-vent and purge verification. Confirm vent routing and purge capability. If the engine has a purge line, run it long enough to clear residual air or inert gas from the intake and fuel rail. Example: purge until a differential pressure sensor indicates stable flow, then hold for a short dwell to let the mixture homogenize.
-
Fuel system conditioning. Open the tank-to-manifold path only when the downstream regulator and heat exchanger are within their operating envelope. Example: if the regulator inlet temperature is too low, the controller delays hydrogen flow to prevent regulator instability.
-
Ignition inhibition until mixture readiness. Enable ignition only after the system confirms hydrogen flow is established and the mixture is within the allowed range. Example: the controller checks both commanded fuel flow and measured manifold pressure rise rate.
-
Light-off and stabilization. Start with a low fuel command, then increase gradually while monitoring combustion stability indicators such as pressure oscillation metrics, exhaust temperature rise rate, and engine speed response.
-
Transition to normal control. Once stable combustion is confirmed, hand control from startup logic to the standard engine control law. Example: when exhaust temperature and speed reach steady-state within tolerances, the sequence exits startup mode.
Fuel Cell Startup Sequence
Fuel cells require careful sequencing because the stack is sensitive to current, temperature, and water management.
-
Pre-checks and inerting where applicable. Verify valves, sensors, and purge paths. If the system uses an inert purge to protect the stack from unwanted mixtures, confirm purge completion using pressure decay or flow confirmation.
-
Hydrogen supply ramp with thermal awareness. Open hydrogen valves to bring inlet conditions to target without overshooting. Example: ramp hydrogen flow to achieve a stable inlet pressure while keeping stack temperature rise within a controlled slope.
-
Air or oxidant readiness. Start oxidant flow to match hydrogen supply so the stack sees balanced reactant conditions. Example: the controller uses a ratio controller that limits current if oxidant pressure lags.
-
Initial current application. Apply a small electrical load or command a low current setpoint. Monitor stack voltage, temperature gradients, and water management indicators. Example: if voltage drops faster than a threshold, the sequence reduces current and rechecks inlet conditions.
-
Power ramp to operational mode. Increase current in steps, each followed by a short stabilization window. Example: after each step, require that voltage recovery occurs before proceeding.
Shutdown Sequence Design
Shutdown should remove energy and reactants in a controlled order.
-
Engine shutdown. Reduce fuel command to idle, then inhibit ignition, then close hydrogen valves. Keep purge active long enough to clear the manifold and prevent residual hydrogen from lingering near ignition-capable components.
-
Fuel cell shutdown. Reduce current to a low safe level first, then stop hydrogen flow while maintaining oxidant purge as needed to manage water and protect the stack. Finally, close oxidant and vent to a safe configuration.
-
Post-shutdown verification. Confirm pressures decay as expected, vent flow status is correct, and no unexpected valve positions are detected.
Mind Map: Startup and Shutdown Logic
Example: Unified Controller State Machine
The same structure can govern both engine and fuel cell modes by swapping the activation criteria.
stateDiagram-v2
  [*] --> SafeState
  SafeState --> PreVent: Vent verified
  PreVent --> Condition: Purge complete
  Condition --> ReactantRamp: Regulators ready
  ReactantRamp --> Activation: Criteria met
  Activation --> Stabilize: Output stable
  Stabilize --> NormalControl: Tolerances satisfied
  NormalControl --> Shutdown: Commanded stop
  Shutdown --> PostVent: Reactants closed
  PostVent --> SafeState: Pressure decay OK
Example: Practical Criteria Set
A workable criteria set for a startup controller includes: valve feedback within tolerance, manifold pressure rise rate within a band, inlet temperature above a minimum for stable regulation, and a “no leak alarm” window that must remain clear for a defined interval before ignition or current application.
Operational Notes for Crew and Maintenance
Crew procedures should mirror the controller’s logic so that “what you do” matches “what the system expects.” For example, if the sequence requires a purge dwell, the checklist should state the dwell explicitly and tie it to a sensor confirmation. Maintenance notes should record which sensors and valves are used for each gate so troubleshooting can focus on the exact transition that failed.
10.4 In Flight Monitoring and Crew Alerting Logic
In-flight monitoring for cryogenic hydrogen systems has one job: help the crew notice what matters before it matters. The logic should be built around system states, not isolated sensor readings. A good starting point is to define “what good looks like” for each phase—climb, cruise, descent, and approach—because the same temperature or pressure can mean different things depending on tank heat leak, engine demand, and ventilation conditions.
Phase-Based Monitoring Model
During climb, fuel demand rises and the tank may experience faster boil-off due to increased heat input from airflow and system operation. In cruise, demand stabilizes, so monitoring focuses on drift: slow changes in tank pressure, outlet temperature, and regulator behavior. During descent and approach, the crew typically reduces power, which can cause pressure recovery and different valve duty cycles. The alerting system should therefore use phase tags to select thresholds and timing windows.
A practical rule: treat each alert as a question with a single intended answer. For example, “Is the fuel supply pressure adequate for commanded power?” should map to a specific action such as verifying valve positions, checking regulator mode, and confirming no isolation event occurred.
Signal Conditioning and Health Checks
Before any threshold logic, sensors need sanity checks. Use plausibility rules such as range limits, rate-of-change limits, and cross-sensor consistency. For instance, if tank pressure indicates a boil-off increase but the tank temperature sensor is flat, the system should flag a sensor disagreement rather than a true physical event.
Rate-of-change checks are especially useful for cryogenic systems because many failures show up as abnormal dynamics. A stuck valve might cause outlet pressure to lag commanded changes, while a leaking line might show a persistent mismatch between predicted and measured pressure decay.
Alert Levels and Timing
Alert levels should be layered so the crew is not forced to react to every transient. Use at least three tiers:
- Advisory for conditions that are abnormal but not immediately unsafe, such as mild regulator deviation.
- Caution for conditions that require crew awareness and likely troubleshooting.
- Warning for conditions that demand immediate protective action.
Timing windows prevent nuisance alerts. A short spike in outlet temperature during a valve transition should not trigger a warning; the logic should require persistence or a pattern consistent with the failure mode.
Core Monitored Variables
Monitor variables that connect directly to propulsion and safety:
- Tank pressure and ullage pressure trend to detect boil-off control issues.
- Outlet temperature and fuel conditioning outlet pressure to confirm the supply is within engine or fuel-cell requirements.
- Valve position feedback and commanded state to catch actuator failures.
- Leak detection indicators such as pressure decay in isolated segments or detector signals.
- Vent system status including valve position and any evidence of unintended venting.
Each variable should feed a small set of derived indicators. Derived indicators reduce alert clutter. Example: “Supply Adequacy” can combine outlet pressure, outlet temperature, and commanded power to decide whether the propulsion controller is likely to derate.
Crew Alerting Logic Flow
The alerting system should follow a consistent order: validate signals, determine phase, compute derived indicators, then select alert level and recommended crew actions.
Example: Suppose tank pressure rises faster than expected during cruise.
- First, plausibility checks confirm the pressure sensor is healthy.
- Next, phase-based expected heat leak is applied.
- Then, derived “Boil-Off Control Deviation” is computed.
- If deviation persists beyond the caution timing window, the system issues a caution with a single action: verify regulator mode and confirm no unintended venting.
- If warning timing is reached and supply adequacy drops, the system escalates to warning and prompts protective action such as reducing commanded power to match available supply.
Mind Map: In Flight Monitoring and Crew Alerting Logic
Example: Disagreement Between Pressure and Temperature
If tank pressure increases while tank temperature remains constant, the logic should not jump straight to “high boil-off.” Instead, it should raise a sensor disagreement advisory and switch to a conservative interpretation for derived indicators. The crew then gets a clear, non-panicky instruction: confirm sensor indications and compare with outlet behavior. If outlet pressure also behaves normally, the system can keep the alert at advisory rather than escalating.
Example: Unintended Venting During Cruise
Unintended venting often shows up as a pressure drop that does not match expected boil-off control. The logic should correlate vent valve feedback with pressure trend. If the vent valve is commanded closed but vent evidence appears, the system issues a caution with a single action: verify vent valve feedback and check for isolation events. If supply adequacy falls below the warning threshold, the system escalates to warning and prompts immediate power reduction to maintain stable fuel delivery.
Practical Design Principle
Every alert should be traceable to a specific condition, a specific confidence level, and a specific crew action. When the logic is built this way, the crew sees fewer messages, but each message carries a decision.
10.5 Post Flight Servicing and Residual Hydrogen Management
After landing, the aircraft’s hydrogen system is still doing “after-hours work”: temperatures drift, pressures settle, and small leaks can become noticeable if you wait too long. Post-flight servicing aims to (1) make the system safe, (2) capture useful condition data, and (3) leave the aircraft in a known state for the next turnaround.
Residual State Fundamentals
Residual hydrogen management starts with three facts. First, liquid hydrogen does not stop boiling just because the flight ended; heat leak continues until the tank is warmed or vented. Second, pressure in a cryogenic tank is governed by boil-off and venting history, so the same flight profile can yield different post-flight pressures if ground conditions differ. Third, any servicing action changes the thermal and pressure balance, so procedures should be ordered to minimize unnecessary cycling.
A practical way to think about the residual state is to separate it into: tank thermal state (how cold the tank remains), tank pressure state (how much vapor is present), and system configuration state (which valves are open, which are isolated, and what the control system commanded).
Immediate Landing Actions
Begin with actions that reduce risk without altering the system more than necessary.
- Stabilize and record: Log tank temperature sensors, tank pressure, manifold pressure, and any leak detector readings. If the aircraft has a “last known good” snapshot, use it as the baseline for comparison.
- Confirm safe configuration: Verify that the propulsion fuel path is isolated as designed for post-flight. If the system uses automatic isolation valves, confirm their commanded positions match actual indications.
- Avoid unnecessary cooldown or warm-up: Do not start auxiliary cooling or rapid venting unless the procedure calls for it. Rapid changes can stress seals and create transient flow paths.
Residual Hydrogen Venting and Purge Logic
Venting is not just “release gas until it’s low.” It is a controlled process that accounts for vent rate, discharge location, and ignition control.
- Choose the vent target: The procedure should specify a pressure or boil-off condition that defines “servicing-ready.” For example, a common approach is to vent until tank pressure falls below a threshold that allows safe coupling during the next refuel.
- Use stepwise venting: Instead of one long vent, use short intervals with monitoring. A short interval lets you observe whether pressure drops as expected; if it doesn’t, you have a clue about insulation performance or valve behavior.
- Purge only when required: If the system has sections that must be gas-free for maintenance access, purge those sections after isolation. Purging the entire system can waste hydrogen and increase time spent in flammable concentration risk windows.
Serviceability Checks Before Maintenance
Before opening anything, confirm that the system is in a state that makes maintenance predictable.
- Residual pressure verification: Check that manifold and service ports are at the specified residual pressure. If a port is higher than expected, treat it as a sign of trapped vapor or a valve not fully isolating.
- Residual temperature awareness: If a component is still near cryogenic temperatures, avoid actions that could cause thermal shock. A simple example is waiting for a specified surface temperature before removing a cover near a seal.
- Leak detector interpretation: A “no alarm” reading is not the same as “no leak.” Use the recorded baseline from the flight and compare it to post-flight readings to detect drift.
Example: Turnaround Workflow with Residual Targets
Scenario: The aircraft lands with tank pressure above the refuel-coupling limit.
- Record temperatures and pressures.
- Confirm fuel path isolation valves are closed.
- Vent in two steps: first to an intermediate pressure, then to the final target.
- After each step, verify pressure response matches expectation and that vent valve position indications are consistent.
- Once at target, perform maintenance access checks and document the final residual state.
This workflow prevents “vent until it feels right,” which is how you end up with mystery residuals and longer ground time.
Mind Map: Post Flight Servicing Flow
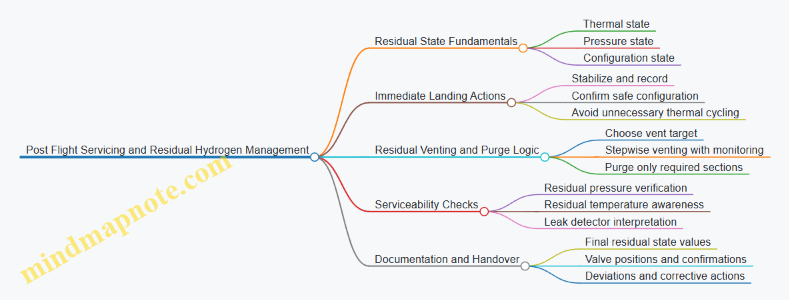
Documentation and Handover
Good servicing ends with a clear record. Document the final residual pressure and temperatures, the venting steps performed (including durations or step counts), and the valve positions confirmed at each stage. If any readings deviate from expected patterns, record the exact values and the action taken, not just the conclusion. That level of detail makes the next turnaround faster and reduces the odds of repeating the same troubleshooting loop.
Common Pitfalls and How to Avoid Them
- Pitfall: Venting without monitoring response. Fix it by using stepwise venting and checking that pressure trends match the procedure.
- Pitfall: Opening access ports while components are still too cold. Fix it by using the specified surface temperature criteria.
- Pitfall: Treating “isolated” as “safe”. Fix it by verifying indications and residual pressures at service points.
Summary of the Systematic Order
Record first, isolate second, vent in monitored steps third, verify serviceability fourth, then document. This order keeps the system as stable as possible while still making it ready for the next set of hands.
11. Instrumentation Data Acquisition and Performance Verification
11.1 Sensor Selection for Cryogenic and High Pressure Environments
Sensor selection for cryogenic hydrogen systems is mostly an exercise in matching physics to constraints. You’re measuring temperatures, pressures, flows, and compositions while the environment punishes common electronics: low temperatures, high pressures, fast transients, vibration, and strict safety expectations. The goal is not just “it works,” but “it works predictably, fails safely, and can be trusted during certification evidence.”
Core Measurement Goals
Start by listing what the control and safety functions need. Typical targets include tank temperature gradients, ullage pressure, line pressure drop, mass flow for energy accounting, valve position feedback, and leak detection support signals. For each target, define the required accuracy, response time, and operating range. A practical example: if a controller must close a valve within 200 ms of a pressure anomaly, a slow pressure sensor that averages over seconds is a design mismatch, even if it is accurate.
Environment Constraints That Drive Selection
Cryogenic hydrogen introduces three recurring problems.
- Thermal contraction and mounting stress: Sensors must survive differential contraction between sensor body, wiring, and mounting hardware. A simple check is to compare material coefficients of thermal expansion and ensure the mechanical design allows strain without cracking.
- Condensation and frost on interfaces: Even when the sensor is inside a controlled enclosure, nearby cold surfaces can cause condensation on external connectors or housings. Choose sealed connectors and plan for thermal isolation where needed.
- Hydrogen permeation and embrittlement risks: Materials near seals and sensor diaphragms must resist hydrogen effects. If a sensor uses elastomers, verify permeation limits and compatibility with hydrogen at cryogenic temperatures.
Sensor Types and Where They Fit
Temperature Sensors
Use resistance temperature detectors (RTDs) for stable, traceable measurements. Place them to capture both bulk temperature and gradients: one near the tank wall, another in the region representing ullage or line fluid. For cryogenic surfaces, ensure the sensor bead is thermally bonded but mechanically protected from shear.
Example: In a tank with insulation, a wall-mounted RTD can show heat leak trends, while a second RTD near the inner surface helps detect insulation degradation or unexpected heat paths.
Pressure Sensors
For high pressure, select sensors with diaphragms rated for hydrogen service and with overload margins above worst-case relief conditions. Consider whether you need absolute or differential pressure. Differential pressure across a filter or heat exchanger can reveal clogging or performance drift without relying on flow estimation alone.
Example: If flow is inferred from pressure drop, you still need a direct pressure measurement to validate that the drop is caused by the intended restriction, not a sensor drift.
Flow Measurement
Cryogenic hydrogen flow is tricky because density varies with temperature and pressure. If you need mass flow, use approaches that reduce dependence on uncertain fluid properties. Options include Coriolis meters where feasible, or carefully calibrated differential pressure flow elements paired with temperature compensation.
Example: A differential pressure flow element with a temperature sensor upstream can compute density-corrected mass flow, improving energy accounting compared to using pressure-only.
Valve and Actuator Feedback
Position sensors for valves should be chosen for the same environment as the valve body. If you use electrical feedback, ensure wiring routes avoid thermal hotspots and that connector seals remain intact through cooldown.
Example: A valve commanded closed must report “closed” reliably; otherwise, the safety logic may either block normal operation or fail to detect a stuck-open condition.
Mind Map: Sensor Selection Logic
Integration Checks That Prevent Late Surprises
Before finalizing parts, run a short “system fit” checklist.
- Electrical interface compatibility: Confirm signal conditioning can operate at the sensor output level and withstand the environment. A sensor that needs a special bridge excitation might be fine in a lab but awkward in a sealed aircraft bay.
- Calibration and uncertainty: Define how calibration uncertainty affects control margins. If your controller tolerates ±1% pressure error but the sensor plus temperature compensation yields ±2%, you need either a different sensor or a different control strategy.
- Failure behavior: Decide what the system does when a sensor fails. For example, a pressure sensor stuck at a plausible value can be more dangerous than one that goes out of range and triggers a fault.
Example: Choosing Temperature and Pressure Sensors Together
Suppose you’re designing a cooldown sequence. You need tank temperature to manage heat transfer and pressure to ensure venting stays within limits. Select RTDs with known stability at cryogenic temperatures, and pressure sensors with hydrogen-rated diaphragms. Then verify that the temperature sensor’s placement reflects the control variable you actually use. If the controller uses “bulk tank temperature” but the RTD measures only the wall, you may see correct readings during steady state and wrong behavior during transients.
Summary
Sensor selection in cryogenic, high-pressure hydrogen systems is a chain: measurement needs define performance requirements; environment constraints define survivability; sensor technology defines achievable accuracy and response; integration defines calibration quality and safe failure behavior. When these links are explicit, the design stops being a guessing game and becomes a testable engineering decision.
11.2 Data Acquisition Architecture for Fuel and Thermal Systems
A fuel-and-thermal data acquisition architecture has one job: turn fast, noisy physical signals into time-aligned measurements you can trust. In cryogenic hydrogen systems, “trust” means you can explain how each sensor signal was conditioned, sampled, synchronized, and validated.
Core Architecture Goals
Start with four practical goals. First, time alignment: fuel flow, tank pressure, and heat flux must share a common time base so you can correlate cause and effect. Second, signal integrity: cryogenic temperatures and high-pressure lines create electrical noise paths, so wiring and conditioning matter as much as the sensor. Third, traceability: every channel needs a defined scaling from engineering units to raw counts. Fourth, graceful degradation: if one sensor fails, the system should still provide enough information for safe operation and maintenance.
Signal Chain from Sensor to Storage
Use a consistent signal chain for both fuel and thermal channels.
- Sensing: pressure transducers, temperature sensors, flow meters, and heat flux sensors. Choose sensor types that match the expected range and environment.
- Excitation and conditioning: constant-current excitation for RTDs, bridge completion for strain-based devices, and amplification for low-level thermocouple signals.
- Filtering and anti-aliasing: apply analog filtering before sampling to prevent high-frequency noise from folding into the measured band.
- Analog-to-digital conversion: select ADC resolution and input range so quantization noise stays below your measurement uncertainty.
- Time stamping: attach a hardware time stamp at the sampling moment, not after the fact.
- Digital processing: convert counts to engineering units, apply calibration coefficients, and compute derived values like mass flow from pressure and temperature.
- Storage and transmission: log locally with checksums and transmit only what is needed for monitoring.
A simple example: a tank temperature RTD produces a resistance change. The conditioning module converts resistance to voltage, the ADC samples it, and the software applies a calibration curve to output temperature in kelvin. If you skip time stamping at the sampling moment, you can still get correct temperatures, but you lose the ability to correlate them with valve events.
Channel Taxonomy for Fuel and Thermal
Organize channels by behavior so sampling and filtering match reality.
- Slow thermal states: tank bulk temperature and insulation interface temperatures. These change over seconds to minutes.
- Fast thermal transients: cooldown steps, valve opening events, and heat exchanger inlet changes. These can shift within tens to hundreds of milliseconds.
- Pressure dynamics: tank pressure and manifold pressure. Expect both steady behavior and rapid steps during venting or flow changes.
- Flow and consumption: mass flow or inferred consumption. Flow signals often include turbulence and switching noise.
This taxonomy drives sampling rates. For instance, if valve events create 100 ms transients, a 10 Hz sample rate is not “more data later,” it is missing the event entirely.
Synchronization and Time Base
Use one timing reference for the whole acquisition system. A typical approach is a central clock feeding all acquisition modules, with per-channel time stamps derived from that clock. For multi-module systems, verify synchronization by injecting a known step signal into multiple channels and checking that the measured step times match within your tolerance.
Calibration, Scaling, and Validation
Calibration is not a one-time ceremony; it is a repeatable mapping.
- Scaling: define linear or piecewise conversion from raw ADC counts to engineering units.
- Calibration coefficients: store them with versioning so you can reproduce logged results.
- Uncertainty budgeting: include sensor accuracy, conditioning gain error, ADC quantization, and temperature effects on electronics.
- Plausibility checks: implement range checks and rate-of-change checks. Example: if a temperature sensor jumps by 50 K in 10 ms while the tank bulk temperature is stable, flag it as a likely wiring or sensor fault.
Data Logging Strategy
Log at the native sampling rate for critical channels and at reduced rates for slow channels. Use event-triggered logging around known operations like refueling coupling, startup, and shutdown. A practical example: store full-rate thermal transient data for 30 seconds around a valve opening, but store bulk thermal trends every second for the rest of the flight.
Mind Map: Data Acquisition Architecture
Example Channel Set and Sampling Choices
Consider a minimal set for a cryogenic fuel subsystem: tank pressure, tank bulk temperature, manifold pressure, and fuel flow. Sample pressure and manifold pressure fast enough to capture valve steps, sample bulk temperature slower but still frequently enough to observe cooldown trends, and sample flow at a rate that resolves switching noise.
A concrete rule of thumb for design reviews: if a control action changes a valve state at time t, you should see the corresponding pressure step within one or two sample intervals. If the step appears smeared over many intervals, the sampling rate or filtering is too aggressive.
Implementation Checklist
Before commissioning, verify wiring continuity, shielding effectiveness, sensor mounting integrity, and grounding scheme. Then run a structured test: apply known steps to a subset of channels, confirm time alignment, confirm scaling against calibration references, and confirm that plausibility checks flag injected faults without nuisance alarms.
11.3 Calibration Methods and Uncertainty Handling
Calibration turns “what the sensor says” into “what the system actually experiences.” Uncertainty handling then explains how confident you can be in that translation. In cryogenic hydrogen systems, both steps matter because small measurement errors can become big energy, safety, and performance errors.
Calibration Foundations for Cryogenic and High Pressure Measurements
Start with a measurement model: the sensor output equals a true quantity passed through gains, offsets, and nonlinearities. For example, a temperature sensor reading might follow a curve fit rather than a straight line, while a pressure transducer might drift with time and thermal cycling.
A practical calibration plan defines three things: the measurand (temperature, pressure, mass flow, hydrogen concentration), the operating range (including extremes like tank cooldown), and the calibration method (traceable reference, transfer standard, or in-situ comparison). If you calibrate only at room temperature, you have not calibrated the part of the system that matters most.
Calibration Methods That Actually Work
Reference Standards and Traceability. Use instruments with known accuracy and calibration certificates. The key is matching the reference to the measurand: a pressure gauge with a different pressure medium or mounting geometry can introduce bias.
Two-Point and Multi-Point Calibration. Two-point calibration is quick but assumes linearity. Multi-point calibration maps curvature. For instance, a flow measurement chain may be linear in differential pressure only over a limited Reynolds range; calibrate across the expected operating points.
Thermal Cycling and Cooldown Calibration. Cryogenic systems stress sensors. A good approach is to calibrate at multiple thermal states: warm baseline, intermediate temperature, and near operating temperature. If the sensor response changes during cooldown, you want to measure that change rather than hope it stays small.
Zeroing and Span Checks. Before a test run, perform a zero check (e.g., verify pressure transducer output at a known reference) and a span check (verify response at a second known point). This catches wiring swaps, connector issues, and gross drift.
Uncertainty Handling from First Principles
Uncertainty is not a single number; it’s a budget. Build it from components: reference uncertainty, sensor resolution, repeatability, calibration fit error, and environmental effects.
Type A Uncertainty. This comes from statistics of repeated measurements. If you record ten cooldown temperature readings at the same condition, the spread contributes Type A uncertainty.
Type B Uncertainty. This comes from non-statistical sources like certificate accuracy, manufacturer specs, or assumptions about distribution. For example, if a reference instrument has an accuracy of ±0.2% and you assume a rectangular distribution, you convert that into a standard uncertainty.
Combining Uncertainties. Combine independent components using root-sum-of-squares to get a combined standard uncertainty. Then apply a coverage factor to express an expanded uncertainty. The result should be tied to the measurand and the operating condition, not just the sensor model.
Worked Example Temperature Calibration with Uncertainty
Assume a cryogenic temperature sensor is calibrated against a reference at three points: 20 K, 80 K, and 120 K. You fit a calibration curve and then evaluate uncertainty at 80 K.
- Reference standard uncertainty at 80 K: 0.15 K (Type B)
- Sensor repeatability at 80 K: standard deviation 0.10 K (Type A)
- Calibration fit residual contribution: 0.08 K (Type B)
Combined standard uncertainty:
- u_c = sqrt(0.15^2 + 0.10^2 + 0.08^2) = 0.21 K
If you use a coverage factor k = 2, expanded uncertainty is about 0.42 K. That means when the system reports 80 K, you can state the true temperature is 80 K ± 0.42 K under the stated conditions. The “±” is doing real work: it informs how tight your control limits can be.
Mind Map: Calibration and Uncertainty Workflow
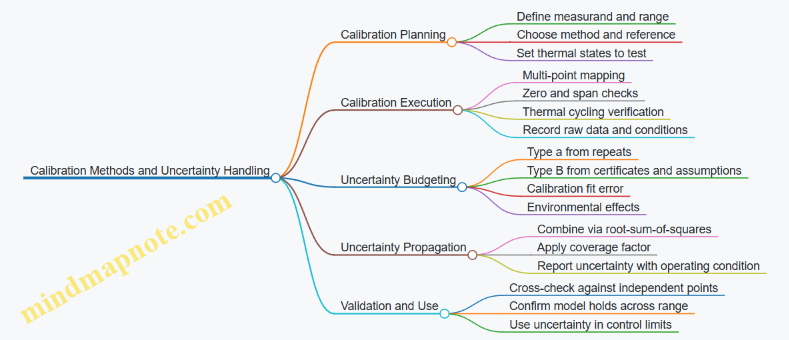
Practical Validation Checks That Prevent Silent Errors
After calibration, validate the model at points you did not fit. If you calibrated at 20 K, 80 K, and 120 K, then test at 60 K and 100 K. A model that fits perfectly at calibration points but misses between them is a classic “looks fine on paper” failure.
Finally, propagate uncertainty into any derived quantity you compute. If temperature feeds a heat leak estimate, the uncertainty in temperature expands into uncertainty in heat leak through the sensitivity of the calculation. A simple way to keep this honest is to compute the derived quantity at the upper and lower bounds of the input uncertainty and compare the spread.
Example Uncertainty Budget Table for a Pressure Transducer
| Component | Basis | Standard Uncertainty |
|---|---|---|
| Reference pressure uncertainty | Certificate | 0.6 kPa |
| Repeatability | 10 repeats at setpoint | 0.4 kPa |
| Fit residual | Calibration curve error | 0.3 kPa |
| Temperature effect | Measured sensitivity | 0.2 kPa |
| Combined standard uncertainty | RSS combine | 0.8 kPa |
Use the combined uncertainty to set acceptance criteria for test runs. If your control logic requires pressure within a tight band, you should know whether the band is narrower than your measurement uncertainty. Otherwise, the system will “hunt” because the data can’t justify the control action.
11.4 Performance Metrics for Range Endurance and Energy Efficiency
Range and endurance metrics for hydrogen aircraft are easiest to use when they are tied to measurable quantities: energy in the tank, energy delivered to propulsion and auxiliaries, and the aircraft’s drag and lift behavior. The trick is to define metrics so they remain comparable across different mission profiles, tank conditions, and propulsion architectures.
Core Energy Accounting
Start with a single energy ledger. For a mission segment, define:
- Usable energy: energy available to produce thrust or electrical power after accounting for unusable reserves (e.g., minimum tank pressure, thermal limits, and safety margins).
- Delivered energy: energy actually converted into useful output (shaft power, thrust, or electrical bus power).
- Loss energy: energy lost to heat rejection, pressure drops, conversion inefficiencies, and control overhead.
A practical example: if liquid hydrogen enters the fuel system at a known temperature and pressure, you can estimate usable energy by combining latent heat effects and sensible heat relative to the minimum delivery condition. Then you compare that to the integrated power draw from propulsion and auxiliaries over the segment.
Range Metrics That Don’t Lie
Use range metrics that separate aerodynamic performance from energy availability.
- Energy-limited range: range computed from usable energy divided by average energy consumption per distance.
- Specific energy consumption per distance: average of propulsion and auxiliary power divided by true airspeed, integrated over the mission.
- Segment range: computed for each phase (climb, cruise, descent) using phase-specific power and speed.
Concrete example: during climb, power demand spikes while distance gain per minute is smaller. If you compute range using only cruise efficiency, you’ll overestimate. Segment range forces you to include climb penalties explicitly.
Endurance Metrics That Match Real Time
Endurance should be computed from time-integrated power draw, not from distance.
- Energy-limited endurance: usable energy divided by average total power over the mission.
- Time-in-phase endurance: endurance allocated to climb, loiter, and descent with their own power profiles.
Example: a loiter segment at lower speed often increases drag-related power demand per unit time. If you only look at distance-based efficiency, loiter can quietly dominate the energy budget.
Energy Efficiency Metrics That Are Comparable
For hydrogen aircraft, “efficiency” must specify the boundary.
- Propulsion conversion efficiency: fraction of fuel energy converted to useful thrust or shaft power.
- System efficiency: fraction of fuel energy converted to all required outputs, including electrical loads and thermal management.
- Overall energy efficiency: system efficiency averaged over the mission with phase weighting.
A helpful rule: if two designs claim better efficiency, verify whether they use the same boundary. A fuel cell system can have high conversion efficiency but still lose energy in cryogenic conditioning and power electronics.
Mission Phase Modeling
To avoid gaps, compute metrics phase by phase.
- Climb: model power as a function of weight, altitude, and airspeed schedule; include additional losses from fuel conditioning.
- Cruise: use drag polar and lift-to-drag ratio to relate required thrust to airspeed; convert thrust to power.
- Descent: include whether the system recovers energy (e.g., via generator operation) or simply reduces power draw.
Example: if the cryogenic system requires periodic heat rejection bursts, treat those as power adders during the phase rather than smearing them into a single constant.
Mind Map: Metrics and How They Connect
Worked Example: From Tank Energy to Range
Assume a mission segment where usable hydrogen energy is 1200 MJ. Total average power over the segment is 250 kW. Convert power to energy over time: time = energy / power = 1200 MJ / 250 kW = 1200,000 kJ / 250 kJ/s = 4800 s ≈ 1.33 hours. If average true airspeed is 140 m/s, distance = speed × time = 140 × 4800 ≈ 672,000 m = 672 km.
Now add realism: if climb consumes 20% more power than cruise and lasts 15% of the segment time, recompute using phase-weighted average power. The result will shift, and that shift is the point: the metric reflects operational reality instead of a single “best case” cruise number.
Practical Measurement and Validation
Metrics become trustworthy when they are tied to instrumentation:
- Validate tank state inputs used for usable energy estimation with measured temperatures and pressures.
- Validate power draw with bus power and propulsion power measurements.
- Validate phase segmentation with flight data timestamps.
Example: if measured auxiliary power is consistently higher than modeled by 10%, range and endurance should shift by roughly the same fraction in an energy-limited framework. That proportionality is a quick sanity check that catches modeling mistakes early.
11.5 Ground Test Campaign Planning and Acceptance Criteria
A ground test campaign is a sequence of experiments designed to prove specific claims: the system works, stays within limits, and fails safely. Planning starts by translating requirements into measurable acceptance criteria, then choosing test steps that isolate variables so you can explain results without guesswork.
Start with Claims, Not Activities
Write each test objective as a claim with a measurable boundary. For example: “During a 30-minute tank cooldown, heat leak does not exceed the predicted boil-off rate by more than 10%.” This prevents the common trap of running a “full system test” without a clear pass/fail definition.
A practical way to structure objectives is to group them into four layers:
- Functional behavior: valves open/close correctly, fuel conditioning reaches target pressure.
- Thermal behavior: temperatures and heat flux remain inside limits.
- Safety behavior: no uncontrolled venting, correct interlock response.
- Data quality: sensors are calibrated and uncertainties are known.
Build a Test Matrix That Covers the Real Envelope
Use a matrix that spans the operating envelope you must prove on the ground. Include at least:
- Initial tank state: warm soak vs. partially cooled conditions.
- Operating mode: steady flow vs. transient demand.
- Configuration: different valve lineups and isolation states.
- Environmental condition: representative ambient temperature and airflow.
Example acceptance criteria for a cryogenic hydrogen fuel subsystem:
- Pressure delivery: downstream pressure stays within ±5% of commanded setpoint during a defined flow profile.
- Temperature limits: no component exceeds its maximum allowable temperature during cooldown and steady operation.
- Leak tightness: leak rate remains below the specified threshold under pressurization and thermal cycling.
- Interlock timing: protective shutdown occurs within the specified response window after a defined fault.
Plan Test Steps with Isolation and Escalation
A good campaign escalates from simple to integrated. Each step should either validate a model, verify a component, or confirm system-level behavior.
- Component characterization: measure valve response time, sensor offsets, regulator behavior.
- Subsystem functional tests: confirm correct sequencing and stable operating points.
- Thermal and fluid dynamics tests: verify cooldown, heat exchanger performance, and boil-off control.
- Safety and fault tests: inject faults in a controlled way and verify interlock logic.
- Integrated endurance runs: repeat key profiles long enough to expose drift and wear-out mechanisms.
A small but effective practice: define a “stop rule” for each step. For instance, if a temperature rises faster than the model allows, you pause and investigate rather than letting the test continue until something fails.
Instrumentation Readiness and Uncertainty Budget
Acceptance criteria are only as strong as the measurement system. Before the first run, confirm:
- sensor calibration dates and traceability,
- sampling rates adequate for transients,
- data logging integrity and time synchronization,
- an uncertainty budget that maps sensor uncertainty to acceptance margins.
Example: if downstream pressure acceptance is ±5%, and sensor uncertainty is ±1%, you still need margin for control oscillations. You can then set a tighter control target during tests to avoid ambiguous outcomes.
Define Acceptance Criteria as Pass/Fail with Evidence
For each objective, specify:
- What to measure: signals, derived metrics, and thresholds.
- When to measure: time windows and steady-state definitions.
- How to judge: statistical rules, filtering approach, and handling of outliers.
- What evidence to store: raw data, plots, configuration logs, and fault records.
A clean approach is to use three tiers:
- Hard limits: must never be exceeded (e.g., relief valve setpoint behavior).
- Performance targets: expected to meet thresholds under nominal conditions.
- Quality checks: data completeness and sensor health.
Mind Map for Campaign Planning and Acceptance
Example Run Card Outline with Acceptance Hooks
A run card should be short enough to follow under pressure, but specific enough to reproduce results. Include:
- pre-run checks (sensor health, valve positions, leak test status),
- the exact flow and pressure profile,
- cooldown duration and hold points,
- fault injection timing and expected interlock response,
- acceptance criteria references for each phase.
Example acceptance hooks embedded in the run card:
- “During the hold segment, downstream pressure must remain within ±5% for the full 120 seconds.”
- “If tank pressure exceeds the relief threshold, the system must vent and enter safe state within 2 seconds.”
Evidence Review and Final Determination
After each run, perform a structured review: confirm data completeness, verify sensor calibration status, check that the test reached the intended operating state, then apply acceptance criteria exactly as written. If a result is borderline, the uncertainty budget decides whether it is a pass with margin or a fail requiring corrective action.
A campaign is “complete” only when every claim has an evidence record that meets its acceptance criteria. That’s the boring part—also the part that keeps the rest of the engineering honest.
12. Practical System Design Examples and Integration Workflows
12.1 Example: Tank Insulation and Heat Leak Calculation Workflow
Goal and Inputs
This workflow estimates the steady heat leak into a liquid hydrogen tank so you can size insulation, predict boil-off, and set cooldown and venting expectations. Start with a clear input list:
- Tank geometry: inner radius or diameter, tank length, and whether you model endcaps separately.
- Operating temperatures: liquid hydrogen temperature (near saturation) and allowable outer surface temperature limits.
- Ambient conditions: external air temperature, wind speed, and whether the tank is in a nacelle or exposed bay.
- Insulation stack: layers (e.g., multilayer insulation), thickness, emissivity assumptions, and any radiation shields.
- Heat transfer coefficients: conduction paths through supports, plus convective coefficients outside.
A practical rule: treat heat leak as the sum of independent paths. If you can’t separate them cleanly, you’ll end up “averaging away” the biggest contributor.
Mind Map: Heat Leak Workflow
Step 1: Compute Surface Areas
Model the tank as a cylinder plus endcaps. For a cylinder of radius \(r\) and length \(L\):
- Lateral area: \(A_{cyl}=2\pi rL\)
- Endcap area (two ends): \(A_{end}=2\pi r^2\) Total area \(A_{tot}=A_{cyl}+A_{end}\).
Example: if \(r=0.8,m\) and \(L=3.2,m\), then \(A_{cyl}=2\pi(0.8)(3.2)=16.08,m^2\) and \(A_{end}=2\pi(0.8)^2=4.02,m^2\). Total is \(20.10,m^2\).
Step 2: Split Heat Transfer Paths
For cryogenic tanks, three terms usually dominate:
- Radiation through insulation (especially MLI).
- Conduction through structural supports.
- Convection outside the outer shell. Penetrations (instrument leads, plumbing) are often smaller but can matter if they’re numerous or poorly thermally anchored.
Write the total steady heat leak as: \[ \dot Q_{total}=\dot Q_{rad}+\dot Q_{cond}+\dot Q_{conv}+\dot Q_{pen} \]
Step 3: Radiation Through MLI
A common engineering approach uses an effective radiative heat transfer coefficient \(h_{rad,eff}\) so you can keep the math manageable: \[ \dot Q_{rad}=h_{rad,eff},A_{rad},(T_{in}-T_{out}) \] Here \(A_{rad}\) is the area participating in radiation exchange, often close to \(A_{tot}\) for a first pass.
Example: assume \(h_{rad,eff}=0.35,W/(m^2,K)\), \(A_{rad}=20.10,m^2\), \(T_{in}=20,K\), \(T_{out}=300,K\). Then \(\Delta T=280,K\) and \(\dot Q_{rad}=0.35\times 20.10\times 280\approx 1967,W\).
If your model predicts radiation dominating by an order of magnitude, that’s not a surprise; it’s a sign you should verify MLI assumptions like layer count and effective emissivity.
Step 4: Conduction Through Supports
Treat each support strut as a thermal conduction path. For one strut: \[ \dot Q_{cond,1}=k,A_s,\frac{(T_{hot}-T_{cold})}{L_s} \] Then multiply by the number of supports \(N\) and add any intermediate thermal intercepts if present.
Example: four supports, each with cross-sectional area \(A_s=2.0\times10^{-4},m^2\), length \(L_s=0.25,m\), and an average effective conductivity \(k=0.08,W/(m,K)\). With \(T_{hot}=300,K\), \(T_{cold}=20,K\): \(\dot Q_{cond,1}=0.08\times2.0\times10^{-4}\times(280)/0.25\approx 0.018,W\). Total \(\dot Q_{cond}=4\times0.018\approx 0.072,W\).
That tiny number is a useful sanity check: if conduction is not small, your support design or anchoring assumptions are likely off.
Step 5: Convection Outside the Outer Shell
Use a convective heat transfer coefficient \(h_{conv}\): \[ \dot Q_{conv}=h_{conv},A_{out},(T_{outer}-T_{amb}) \] For calm air, \(h_{conv}\) might be around \(5,W/(m^2,K)\); with airflow it can be higher. Choose \(T_{outer}\) based on your insulation performance target or an outer surface limit.
Example: let \(h_{conv}=8,W/(m^2,K)\), \(A_{out}=20.10,m^2\), \(T_{outer}=120,K\), \(T_{amb}=300,K\). Then \(\Delta T=180,K\) and \(\dot Q_{conv}=8\times20.10\times180\approx 28944,W\).
If this looks huge, it usually means you misapplied \(T_{outer}\) or you’re double-counting radiation effects. In many tank models, the outer shell temperature is not free; it is constrained by the insulation stack, so you should solve for \(T_{outer}\) consistently rather than picking it arbitrarily.
Step 6: Convert Heat Leak to Boil-Off Rate
Once you have \(\dot Q_{total}\), compute mass boil-off: \[ \dot m=\frac{\dot Q_{total}}{h_{vap}} \] Use latent heat of vaporization for hydrogen at the relevant saturation temperature.
Example: if \(\dot Q_{total}=2.0,kW\) and \(h_{vap}=4.5\times10^5,J/kg\), then \(\dot m\approx 2000/450000\approx 0.0044,kg/s\) or about \(15.8,kg/hr\).
Step 7: Add Uncertainty and Iterate
Apply a margin to the dominant term (often radiation) and re-check outer surface temperature constraints. If the result violates a boil-off or temperature limit, iterate in the order that usually gives the biggest payoff:
- Improve MLI effectiveness assumptions (layer count, spacing, shield quality).
- Reduce conduction through supports or add thermal intercepts.
- Revisit convection boundary conditions and outer shell temperature consistency.
This workflow is intentionally modular: you can swap in a more detailed radiation correlation later without rewriting the conduction and boil-off conversion steps.
12.2 Example: Fuel Manifold Layout With Isolation And Leak Detection
A cryogenic hydrogen fuel manifold has one job that never takes a day off: deliver the right flow to the right consumer while keeping leaks small, detectable, and controllable. This example walks through a practical layout that supports both propulsion and auxiliary loads, using isolation valves and leak detection that are easy to reason about during design reviews.
Foundational Layout Choices
Start with a simple topology: one tank outlet header feeds a manifold “distribution spine,” and each consumer taps from the spine through its own isolation valve and sensor set. The spine is kept short to reduce pipe length, fittings, and heat leak surfaces.
Use three pressure levels in the mental model:
- Tank pressure at the outlet of the cryogenic tank.
- Conditioned pressure after pressure regulation and any required vapor management.
- Delivery pressure at each consumer inlet.
A good manifold layout makes these levels visible in the hardware naming and in the wiring diagrams, so troubleshooting doesn’t require guesswork.
Isolation Strategy That Actually Helps
Isolation is not just “a valve somewhere.” It is a set of boundaries that define what happens when something goes wrong.
Recommended boundaries for this example:
- Tank isolation valve: closes the entire manifold from the tank.
- Spine isolation valve: separates the distribution spine from downstream branches.
- Branch isolation valves: one per consumer (e.g., propulsion fuel control unit, fuel cell reactant supply, or test ports).
- Vent and purge isolation: prevents unintended venting paths from becoming leak paths.
Concrete example: If a branch leak is detected at the propulsion inlet, the system closes the propulsion branch valve and the spine isolation valve, while leaving the tank isolation valve open only if the leak is confirmed downstream of the spine. That reduces the amount of hydrogen that can escape during the response window.
Leak Detection Architecture
Leak detection works best when it is placed where it can “see” the leak and when it can distinguish leak from normal operation.
Use a two-layer approach:
- Direct leak sensing near likely leak points (valve stems, flange joints, quick disconnects).
- Indirect sensing using pressure/flow trends in the manifold volume.
For cryogenic hydrogen, a common practical method is to create a monitored interspace around seals or within a small enclosure. If hydrogen escapes into that interspace, sensors detect it without requiring the entire aircraft bay to be the detector.
Concrete example: Place a small vented enclosure around a branch isolation valve. Route its vent to a controlled exhaust path and monitor the enclosure with a hydrogen sensor. If the sensor triggers, you know the leak is near that valve, not somewhere else on the spine.
Step-by-Step Example Layout
-
Tank outlet to tank isolation valve
- Include a strainer upstream of the manifold to protect regulators.
- Add a temperature sensor near the outlet to support cooldown and detect abnormal heat leak.
-
Tank isolation valve to conditioned manifold spine
- Add a regulator or pressure conditioning stage at the start of the spine.
- Include a pressure sensor at the spine inlet to establish the baseline for indirect leak detection.
-
Spine to each consumer branch
- Each branch has: branch isolation valve, branch inlet pressure sensor, and a monitored seal enclosure.
- Keep branch lengths consistent to simplify thermal and pressure modeling.
-
Vent and purge integration
- Provide a dedicated vent line with its own isolation valves.
- Ensure the vent line cannot backflow into the manifold by using check logic appropriate to the system design.
Mind Map: Manifold Isolation and Leak Detection
Fuel Manifold Isolation and Leak Detection Mind Map
Response Logic Example with Clear Rules
Define triggers and actions so the crew and the control system share the same mental model.
-
Trigger A: Hydrogen sensor in a branch seal enclosure exceeds threshold.
- Action: Close the branch isolation valve.
- Action: Close the spine isolation valve if the enclosure sensor remains above threshold for a defined confirmation interval.
-
Trigger B: Indirect pressure trend indicates unexpected loss of pressure on the spine.
- Action: Close the spine isolation valve.
- Action: Keep tank isolation open only if system design allows safe continued monitoring; otherwise close tank isolation to stop the source.
-
Trigger C: Vent line pressure indicates abnormal backflow.
- Action: Close vent isolation valve and branch valves associated with the affected pressure domain.
This example layout stays systematic: isolation boundaries limit what can escape, direct sensors localize where it escaped, and indirect sensors confirm that the overall manifold behavior matches the expected physics.
12.3 Example: Engine Fuel Control Logic for Hydrogen Injection
Hydrogen injection control has one job that never changes: deliver the right amount of hydrogen to the combustor (or fuel cell reformer, if applicable) at the right time, while respecting cryogenic realities like temperature, pressure, and boil-off. In this example, the engine uses a cryogenic liquid hydrogen tank feeding a vaporizer and a metering valve that supplies hydrogen to an injector rail.
Core Control Variables
Start with a clear set of targets and measurements.
- Target fuel flow: derived from commanded thrust or power demand.
- Injector rail pressure: maintained to keep injector behavior predictable.
- Hydrogen temperature: used to prevent phase surprises at the injector.
- Mixture quality proxy: often inferred from exhaust temperature trends or combustion stability metrics.
A practical approach is to run two nested loops: an outer loop that decides the required hydrogen mass flow, and an inner loop that drives the metering valve to hit that flow while holding pressure and temperature constraints.
Signal Conditioning and State Estimation
Before control, the system needs sanity checks.
- Sensor plausibility: reject readings that jump beyond physically reasonable rates.
- Phase-aware estimation: if rail temperature drops below a threshold, treat the system as “risk of two-phase” and tighten valve slew limits.
- Tank condition estimation: use tank pressure and tank temperature to estimate available liquid fraction, which affects how much vaporizer duty is needed.
A simple rule that works well in practice: if the estimated liquid fraction falls, the controller should reduce requested liquid-side flow and increase vapor-side compensation, rather than forcing the metering valve to “fight” the phase change.
Outer Loop Fuel Demand to Mass Flow Command
The outer loop converts pilot demand into a mass flow setpoint.
- Compute power or thrust demand.
- Apply engine efficiency mapping to convert demand into required hydrogen energy.
- Convert energy to mass flow setpoint using the current hydrogen lower heating value and measured conditions.
Then apply constraint shaping:
- Pressure constraint: if rail pressure is below minimum, cap mass flow.
- Thermal constraint: if vaporizer outlet temperature is too low, cap mass flow and request more vaporizer heat.
- Stability constraint: if combustion stability margin is low, reduce ramp rate even if demand is high.
Inner Loop Valve Control with Feedforward
The inner loop controls the metering valve position (or current to an actuator) to achieve the commanded mass flow.
Feedforward reduces the work the feedback loop must do.
- Use a valve flow model:
- estimated flow ≈ function(valve position, pressure drop, fluid density).
- Update density using measured rail temperature and pressure.
Feedback corrects for model error.
- Measure actual mass flow (or infer it from differential pressure and valve position if direct metering is unavailable).
- Use a PI controller with anti-windup.
A key best practice: limit valve movement rate during phase-risk conditions. For example, if rail temperature indicates two-phase risk, halve the maximum valve slew rate and increase controller damping. This prevents oscillations caused by delayed flashing.
Mode Logic for Startup, Steady Operation, and Transients
The controller should behave differently depending on engine phase.
- Startup mode: preheat vaporizer, establish stable rail pressure, then enable injection with a short “stabilization dwell.”
- Steady mode: run both loops normally with standard slew limits.
- Transient mode: when demand changes quickly, prioritize rail pressure and combustion stability, even if mass flow lags slightly.
A concrete example: if thrust command steps up by 10%, the controller first ramps vaporizer duty to prevent rail temperature from sagging, then ramps mass flow setpoint, and only then opens the metering valve. This ordering reduces the chance of injecting colder hydrogen that changes injector spray and ignition behavior.
Mind Map: Engine Fuel Control Logic
Example: Step-Up Injection Sequence
Assume the engine is at steady cruise and the pilot commands a rapid thrust increase.
- Demand change detected: compute new mass flow setpoint, but apply a ramp limiter based on stability margin.
- Vaporizer duty increase: raise vaporizer heat request to keep outlet temperature above the minimum.
- Rail pressure check: if rail pressure is trending low, cap mass flow setpoint until pressure recovers.
- Valve feedforward update: compute new valve position target using the pressure drop and updated density.
- Feedback correction: PI loop trims valve position to match actual mass flow.
- Phase-risk handling: if rail temperature crosses the threshold, reduce valve slew rate and temporarily bias toward pressure stabilization.
The result is a controlled ramp where the system avoids the classic failure mode: opening the valve too fast, causing flashing delays, which then show up as oscillatory flow and unstable combustion.
Example: Constraint Shaping Rules
Use explicit, testable rules rather than hidden magic.
- If rail pressure < Pmin, set mass flow setpoint = min(requested, flow_cap(Pmin)).
- If vaporizer outlet temperature < Tmin, set mass flow setpoint = min(requested, flow_cap(Tmin)).
- If stability margin < Smin, set mass flow setpoint ramp rate = reduced_rate.
These rules make the controller predictable during verification: you can reproduce the same inputs and expect the same capped outputs, which is exactly what you want when debugging a cryogenic fuel system.
12.4 Example: Fuel Cell Power Management With Thermal Constraints
Fuel cell power management is mostly about keeping three things inside safe limits: stack temperature, reactant temperatures, and balance-of-plant component temperatures. The “thermal constraints” part matters because hydrogen supply and cooling capacity are not infinitely adjustable. When you treat thermal limits as hard boundaries, the control logic becomes simpler and more reliable.
Foundational Model of What Must Be Controlled
Start with a compact mental model: electrical demand sets the required stack current; stack current sets heat generation; heat must be removed by cooling and by sensible heat carried in the reactant streams. If heat removal lags heat generation, stack temperature rises until a limit is reached.
A practical way to express this is with a heat balance:
- Heat generated in the stack increases with current and with inefficiencies.
- Heat removed equals cooling heat transfer plus enthalpy carried away by hydrogen and air.
In an aircraft system, you typically don’t measure “heat generated” directly. You measure temperatures and infer whether the system is on track.
Constraint Set and What Each Limit Prevents
Use a constraint list that maps to physical failure modes:
- Stack temperature upper limit: prevents accelerated degradation and protects seals.
- Coolant outlet temperature upper limit: prevents boiling or loss of heat transfer margin.
- Compressor or pump temperature limits: prevents damage from high bearing or fluid temperatures.
- Reactant inlet temperature limits: avoids condensation or icing in relevant subsystems.
A useful best practice is to define each limit with a warning threshold and a hard threshold. Example: if stack temperature warning is 80°C and hard limit is 85°C, the controller should reduce power well before 85°C.
Control Strategy That Works in Real Hardware
A robust approach is layered control:
- Primary power request tracking: follow requested electrical power as closely as possible.
- Thermal governor: if any temperature approaches a limit, cap the allowable stack current.
- Actuator allocation: decide how to reduce heat generation or increase heat removal.
Actuator allocation is where thermal constraints become concrete. You usually have three levers:
- Reduce stack current (reduces heat generation).
- Increase cooling flow or cooling effectiveness (increases heat removal).
- Adjust reactant conditions within allowable ranges (changes how much heat leaves with the streams).
Example Scenario with Step-by-Step Reasoning
Assume a fuel cell system is operating at steady cruise power. Then the aircraft demands a higher electrical load for a short period.
- The power management unit receives a new electrical power request.
- It converts requested power to a target stack current using a calibrated power-current map.
- It checks predicted stack temperature rise using recent temperature trends and estimated thermal response.
- If predicted stack temperature would cross the warning threshold, it reduces the target current.
- If predicted stack temperature would still cross the hard limit, it also increases coolant flow and, if available, increases reactant flow rates within compressor limits.
A simple “if-then” example for the thermal governor:
- If stack temperature is between warning and hard thresholds, cap current to a value that keeps the temperature slope negative.
- If stack temperature is at or above the hard threshold, immediately cap current to the maximum safe value and prioritize cooling.
This is not just theory. The key is using temperature slope as well as absolute value, because a system can be near a limit but cooling is already improving.
Mind Map: Fuel Cell Thermal Power Management
Concrete Example of a Thermal Governor Table
Use a small rule table that engineers can verify quickly during testing.
| Condition | Action | Why It Works |
|---|---|---|
| Stack temp below warning | Track requested power | Heat margin is available |
| Stack temp near warning and rising | Reduce current cap | Prevents crossing the hard limit |
| Stack temp near warning and falling | Allow higher current within cap | Cooling trend indicates recovery |
| Stack temp at hard limit | Immediate current cap and max safe cooling | Stops heat accumulation |
| Coolant outlet near hard limit | Increase coolant flow first | Improves heat removal directly |
Practical Integration Notes
A best practice is to ensure sensor plausibility checks before using temperatures in control. Example: if a stack temperature sensor reading jumps by 10°C in one control cycle, the governor should ignore that value and fall back to a conservative current cap.
Another best practice is to log the governor’s limiting reason. Example: “limited by stack temperature warning” is more useful than a generic “limited power,” because it tells maintenance whether the cooling loop or the stack thermal behavior needs attention.
12.5 Example: Safety Case Assembly for a Cryogenic Hydrogen Subsystem
A safety case is a structured argument that the subsystem is acceptably safe for its intended use. For a cryogenic hydrogen subsystem, the argument usually starts with clear boundaries, then connects hazards to requirements, then shows evidence that those requirements hold in real operation. The goal is not to list everything that could go wrong; it’s to show that the important ways it could go wrong are controlled.
Step 1: Define Scope and Operational Boundaries
Start by stating what the safety case covers and what it doesn’t. For example, define the subsystem boundary as: onboard liquid hydrogen tank, insulation interfaces, fuel valves, pressure relief devices, vent routing up to the discharge outlet, and the associated sensors and control logic. Exclude cabin ventilation design if it is handled elsewhere.
Then specify operational modes: preflight coupling, tank cooldown, steady cruise fuel supply, transient maneuvers, shutdown, and post-flight servicing. A simple checklist helps prevent “scope drift,” like when a hazard analysis quietly starts assuming ground equipment behavior.
Step 2: Identify Hazards and Select Credible Scenarios
Use a hazard identification method that produces scenarios, not just hazards. For instance:
- Cryogenic exposure: liquid hydrogen contact causing embrittlement or frostbite risk.
- Overpressure: blocked vent path leading to relief activation.
- Flammable release: leak in a manifold creating a hydrogen cloud near an ignition source.
- Ignition source coupling: hot surfaces or electrical arcing near vent discharge.
- Control failure: valve stuck open during a fault, increasing release duration.
A practical rule: each scenario should have a cause, a release mechanism (liquid, vapor, or both), and a potential ignition pathway.
Step 3: Build the Safety Argument Structure
A clean structure is: Hazard → Safety Objective → Requirement → Verification Evidence.
Example safety objectives for a cryogenic hydrogen subsystem:
- Prevent hazardous hydrogen accumulation in occupied or service areas.
- Limit overpressure to within tank and line design margins.
- Ensure relief and venting behave predictably under fault conditions.
- Detect leaks early enough to trigger safe isolation.
Step 4: Translate Objectives into Requirements
Requirements should be testable and tied to system design features.
Overpressure control example
- Requirement: relief devices must open within specified pressure bands and discharge to the designated outlet.
- Verification: bench testing of relief setpoints and flow capacity; installation inspection criteria for vent routing.
Leak detection and isolation example
- Requirement: manifold leak detection must trigger isolation valves within a defined time window.
- Verification: sensor response tests using representative hydrogen concentrations and temperatures; fault-injection tests for control logic.
Thermal and cooldown example
- Requirement: cooldown sequence must prevent excessive thermal gradients that could stress seals or joints.
- Verification: thermal cycling tests and cooldown procedure validation using measured temperatures and allowable ramp rates.
Step 5: Evidence Planning and Traceability
Evidence is strongest when it is traceable. Create a trace matrix that links each safety objective to requirements and then to evidence artifacts:
- analysis reports (e.g., heat leak and boil-off modeling)
- component test results (relief valves, sensors)
- integration tests (valve timing, vent discharge behavior)
- inspection records (materials, weld quality, installation torque)
A useful habit: include “negative evidence” where appropriate, such as demonstrating that a specific failure mode does not bypass isolation logic.
Step 6: Assemble the Safety Case Narrative
Write the narrative so a reviewer can follow the chain without guessing. Keep the language concrete: what the system does, what limits it enforces, and what tests prove it.
Include a short section on assumptions. For example, assume vent outlet geometry and discharge conditions are verified by the subsystem installation standard, not by the safety case itself.
Mind Map: Safety Case Assembly Flow
Example: Mini Trace Matrix for One Scenario
Scenario: Manifold leak during steady supply.
- Safety objective: prevent hazardous hydrogen accumulation near ignition sources.
- Requirements:
- leak sensor threshold and sampling rate
- isolation valve closure time limit
- vent routing maintains discharge away from ignition-relevant zones
- Evidence:
- sensor calibration at relevant temperatures
- control logic timing test with fault injection
- vent discharge flow test confirming outlet conditions
This is the essence of a safety case: each link is explicit, and each requirement has a way to be checked.