Financial Markets Structure Instruments and Trading Fundamentals
1. Introduction to Financial Markets
1.1 Overview of Financial Markets: Definition and Importance
Financial markets are platforms or systems that facilitate the buying and selling of financial instruments such as stocks, bonds, currencies, and derivatives. They play a vital role in the global economy by enabling capital allocation, price discovery, liquidity provision, and risk management.
What Are Financial Markets?
- Definition: Financial markets are marketplaces where participants trade financial assets, either through exchanges or over-the-counter (OTC) mechanisms.
- Purpose: They connect savers who supply capital with borrowers who demand capital.
Importance of Financial Markets
- Capital Allocation: Efficiently channel funds from investors to businesses and governments.
- Price Discovery: Help determine the fair value of financial instruments based on supply and demand.
- Liquidity: Provide the ability to quickly buy or sell assets without causing significant price changes.
- Risk Management: Enable participants to hedge or transfer risk using derivatives and insurance.
- Economic Growth: Support entrepreneurship, innovation, and infrastructure development.
Mind Map: Core Functions of Financial Markets
Types of Financial Markets (Brief Overview)
- Capital Markets: Equity and debt instruments for long-term funding.
- Money Markets: Short-term debt instruments.
- Derivatives Markets: Futures, options, swaps.
- Foreign Exchange Markets: Currency trading.
Mind Map: Types of Financial Markets
Example 1: Capital Allocation in Action
Consider a startup company seeking funds to expand. Through the financial markets, it can issue shares (equity) or bonds (debt) to investors. Investors analyze the company’s prospects and decide whether to invest. This process enables the startup to access capital while investors seek returns.
Example 2: Price Discovery
The price of a publicly traded stock is determined by the collective buying and selling decisions of market participants. For instance, if positive earnings reports are released, demand for the stock may increase, pushing the price higher. Conversely, negative news can cause prices to fall.
Example 3: Liquidity Provision
An investor holding shares of a large-cap company like Apple can sell their shares quickly on the stock exchange due to high liquidity. In contrast, selling shares of a small private company may take longer and at a less favorable price.
Best Practice: Understanding Market Role Through Real-World Context
Finance professionals should always contextualize market activities by linking them to their core functions. For example, when analyzing a bond issuance, consider how it affects capital allocation and risk management for both issuer and investor.
Summary
Financial markets are indispensable for economic vitality. They facilitate the flow of capital, enable price formation, provide liquidity, and allow risk transfer. A solid grasp of their structure and functions is foundational for any finance professional or investment analyst.
For further reading, explore the subsequent sections on market types and instruments to deepen your understanding of how these markets operate in practice.
1.2 Types of Financial Markets: Capital, Money, Derivatives, and Forex
Financial markets are diverse and can be broadly categorized into several types based on the instruments traded and the purpose they serve. Understanding these types is fundamental for finance professionals and investment analysts to navigate the markets effectively. Below, we explore the four primary types of financial markets: Capital Markets, Money Markets, Derivatives Markets, and Foreign Exchange (Forex) Markets.
Capital Markets
Capital markets are venues where long-term securities are issued and traded. These markets facilitate the raising of capital by companies and governments to fund operations, expansions, and projects.
- Instruments Traded: Stocks (equities), bonds (debt securities), and other long-term securities.
- Sub-markets: Primary market (new issues) and secondary market (trading of existing securities).
Example: A company issuing new shares through an Initial Public Offering (IPO) on the stock exchange is operating in the primary capital market. Investors buying and selling these shares afterward participate in the secondary capital market.
Mind Map:
Money Markets
Money markets deal with short-term debt instruments and provide liquidity for governments, financial institutions, and corporations.
- Instruments Traded: Treasury bills, commercial paper, certificates of deposit, repurchase agreements.
- Maturity: Typically less than one year.
Example: A corporation issues commercial paper to finance its short-term operational needs. Investors purchase these instruments for short-term, low-risk returns.
Mind Map:
Derivatives Markets
Derivatives markets trade financial contracts whose value is derived from underlying assets such as stocks, bonds, commodities, currencies, or interest rates.
- Instruments Traded: Futures, options, swaps, forwards.
- Purpose: Hedging risk, speculation, arbitrage.
Example: An airline company uses fuel futures contracts to hedge against the risk of rising fuel prices, locking in costs for future deliveries.
Mind Map:
Foreign Exchange (Forex) Markets
Forex markets facilitate the trading of currencies and are the largest and most liquid financial markets globally.
- Instruments Traded: Spot transactions, forwards, swaps, currency options.
- Participants: Central banks, commercial banks, corporations, hedge funds, retail traders.
Example: A multinational corporation converts USD to EUR in the spot forex market to pay European suppliers.
Mind Map:
Integrated Example: How Different Markets Interact
Consider a global manufacturing company:
- It raises capital by issuing bonds in the capital market to fund expansion.
- It manages short-term cash needs by issuing commercial paper in the money market.
- To protect against currency fluctuations when paying foreign suppliers, it uses currency forwards in the forex market.
- To hedge interest rate risk on its bonds, it enters into interest rate swaps in the derivatives market.
This example highlights how understanding each market type and their instruments enables effective financial management and risk mitigation.
Best Practice Tip:
Diversify your knowledge and trading strategies across multiple market types. For instance, an investment analyst should not only evaluate equity performance in capital markets but also understand how derivatives can hedge risks or how forex fluctuations impact multinational portfolios.
By mastering the characteristics, instruments, and participants of these financial markets, finance professionals can better strategize investments, manage risks, and capitalize on market opportunities.
1.3 Market Participants: Roles of Investors, Brokers, Dealers, and Regulators
Financial markets are ecosystems composed of various participants, each playing a critical role in ensuring efficient capital flow, liquidity, and market integrity. Understanding these roles is fundamental for finance professionals and investment analysts to navigate and leverage market dynamics effectively.
Key Market Participants
Investors
Investors provide the capital that fuels financial markets. They can be broadly categorized into retail and institutional investors.
- Retail Investors: Individual investors who buy and sell securities for personal accounts.
- Institutional Investors: Entities such as mutual funds, pension funds, insurance companies, and hedge funds that invest large sums of money on behalf of others.
Best Practice: Retail investors should diversify portfolios to manage risk, while institutional investors often employ sophisticated strategies including algorithmic trading and derivatives for hedging.
Example:
- A retail investor purchasing shares of a technology company through an online brokerage.
- A pension fund allocating assets across equities, bonds, and alternative investments to meet long-term liabilities.
Brokers
Brokers act as intermediaries between investors and the markets. They facilitate trade execution but do not hold inventory.
- Full-Service Brokers: Offer a wide range of services including investment advice, portfolio management, and research.
- Discount Brokers: Provide execution services with minimal advisory support, often at lower fees.
Best Practice: Choose brokers based on trading needs; active traders may prefer discount brokers for cost efficiency, while long-term investors might benefit from full-service brokers’ advisory.
Example:
- An investment analyst using a discount broker platform to execute frequent trades with low commissions.
- A finance professional consulting a full-service broker for tailored portfolio advice.
Dealers
Dealers buy and sell securities for their own accounts, providing liquidity and market making.
- Market Makers: Dealers who continuously quote buy and sell prices, ensuring market liquidity.
- Proprietary Traders: Dealers trading with their own capital to profit from market movements.
Best Practice: Understanding the role of market makers helps investors optimize order types and timing to achieve better execution prices.
Example:
- A market maker in the NASDAQ maintaining bid-ask spreads for a popular stock.
- A proprietary trading desk executing high-frequency trades to capitalize on short-term price inefficiencies.
Regulators
Regulators oversee market operations to protect investors, ensure transparency, and maintain fair trading practices.
- Government Agencies: Such as the Securities and Exchange Commission (SEC) in the U.S., Financial Conduct Authority (FCA) in the UK.
- Self-Regulatory Organizations (SROs): Like FINRA, which enforce rules among members.
Best Practice: Staying informed about regulatory changes is crucial for compliance and strategic planning.
Example:
- The SEC enforcing rules against insider trading to maintain market integrity.
- FINRA conducting audits of brokerage firms to ensure adherence to trading regulations.
Integrated Example: How Participants Interact in a Trade
Scenario: A retail investor places a buy order for shares via a discount broker. The broker routes the order to a market maker who fills the order by selling from their inventory. Regulators monitor the trade to ensure it complies with market rules.
Summary
Understanding the distinct roles of investors, brokers, dealers, and regulators provides a comprehensive view of market mechanics. Each participant contributes to the market’s efficiency, liquidity, and fairness, and recognizing these roles enables finance professionals to make informed decisions and adopt best practices in trading and investment strategies.
1.4 Best Practices: Understanding Market Dynamics Through Real-World Examples
Understanding market dynamics is crucial for finance professionals and investment analysts to make informed decisions. Market dynamics refer to the forces that impact prices, trading volumes, liquidity, and overall market behavior. This section explores best practices to grasp these dynamics effectively, supported by real-world examples and mind maps.
Best Practice 1: Analyze Supply and Demand Forces
Markets move primarily due to changes in supply and demand. Recognizing how these forces interact helps anticipate price movements.
Example: During the 2020 oil price crash, oversupply combined with a sudden drop in demand due to COVID-19 lockdowns led to historic negative prices for WTI crude futures.
Best Practice 2: Monitor Market Sentiment and Behavioral Factors
Market sentiment, driven by investor psychology, news, and events, can cause price swings beyond fundamental values.
Example: The GameStop short squeeze in early 2021 demonstrated how retail investor sentiment and social media coordination can dramatically impact stock prices.
Best Practice 3: Understand Market Microstructure and Order Flow
Examining how orders are placed, matched, and executed provides insights into short-term price movements and liquidity.
Example: High-frequency trading firms exploit microsecond-level order book changes to profit from bid-ask spread inefficiencies.
Best Practice 4: Incorporate Macroeconomic Indicators
Macroeconomic data such as GDP growth, inflation, and employment figures influence market trends and investor expectations.
Example: The U.S. Federal Reserve’s interest rate decisions often trigger significant moves in equity and bond markets.
Best Practice 5: Use Historical Data and Scenario Analysis
Studying past market events and running scenario analyses help anticipate potential market reactions under different conditions.
Example: Analysts use historical volatility patterns to model risk and set stop-loss levels during turbulent periods.
Summary
By integrating these best practices—analyzing supply and demand, monitoring sentiment, understanding microstructure, incorporating macroeconomic data, and leveraging historical analysis—finance professionals can develop a holistic understanding of market dynamics. Real-world examples like the 2020 oil crash and the GameStop saga illustrate the practical importance of these concepts.
Additional Example: The 2008 Financial Crisis
- Supply and Demand: Excessive mortgage lending increased supply of mortgage-backed securities.
- Market Sentiment: Overconfidence and underestimation of risk led to inflated asset prices.
- Microstructure: Liquidity dried up as counterparties withdrew, exacerbating price declines.
- Macroeconomic Indicators: Rising default rates and economic slowdown signaled trouble.
- Historical Analysis: Post-crisis reforms focused on improving transparency and risk management.
This comprehensive approach equips finance professionals to navigate complex market environments effectively.
1.5 Case Study: How Market Structure Influenced the 2008 Financial Crisis
The 2008 Financial Crisis stands as one of the most significant economic events in recent history, deeply influenced by the underlying structure of financial markets. Understanding how market structure contributed to the crisis provides valuable lessons for finance professionals and investment analysts.
Overview of Market Structure Factors in 2008 Crisis
The financial markets in 2008 were characterized by complex interconnections, opaque instruments, and fragmented trading venues. These factors amplified systemic risk and contributed to the rapid spread of financial distress.
Key Market Structure Elements That Influenced the Crisis:
- Securitization and Complex Instruments
- Over-the-Counter (OTC) Market Dominance
- Interconnectedness of Financial Institutions
- Lack of Transparency and Information Asymmetry
- Role of Rating Agencies and Market Participants
Mind Map: Market Structure Factors in the 2008 Crisis
Detailed Explanation with Examples:
-
Securitization and Complex Instruments
Financial institutions pooled mortgages into Mortgage-Backed Securities (MBS) and further repackaged them into Collateralized Debt Obligations (CDOs). These instruments were divided into tranches with varying risk levels.
-
Example: An investment analyst buying a AAA-rated tranche of a CDO might believe it to be low risk, but the underlying mortgages could be subprime, increasing default risk.
-
Best Practice: Always perform due diligence beyond credit ratings by analyzing the underlying asset quality.
-
-
Over-the-Counter (OTC) Market Dominance
Many derivatives, especially Credit Default Swaps (CDS), were traded OTC without centralized clearing, increasing counterparty risk.
-
Example: When Lehman Brothers collapsed, counterparties holding CDS contracts faced uncertainty about payments, triggering a liquidity crunch.
-
Best Practice: Favor transparent trading venues and use central clearinghouses to mitigate counterparty risk.
-
-
Interconnectedness of Financial Institutions
Large banks and financial institutions were highly interconnected through lending and derivative contracts, creating systemic risk.
-
Example: The failure of one major institution could cascade, impacting others due to shared exposures.
-
Best Practice: Monitor counterparty exposures and diversify to reduce systemic risk.
-
-
Lack of Transparency and Information Asymmetry
The complexity and opacity of instruments led to information gaps between sellers and buyers.
-
Example: Investors were unaware of the true risk embedded in MBS and CDOs, leading to mispricing.
-
Best Practice: Demand transparency and standardized reporting to improve market efficiency.
-
-
Role of Rating Agencies and Market Participants
Inflated credit ratings misled investors about the safety of structured products.
-
Example: AAA ratings on subprime mortgage tranches gave a false sense of security.
-
Best Practice: Use multiple sources for credit assessment and conduct independent analysis.
-
Mind Map: Lessons Learned and Best Practices
Summary
The 2008 Financial Crisis was not just a failure of individual institutions but a systemic failure deeply rooted in the structure of financial markets. Complex instruments traded largely in opaque OTC markets, combined with interconnected institutions and flawed risk assessments, created a fragile environment. By understanding these structural issues and applying best practices such as transparency, rigorous risk management, and regulatory oversight, finance professionals can better navigate and mitigate future market disruptions.
2. Market Structure and Trading Venues
2.1 Primary vs Secondary Markets: Functions and Examples
Introduction
Financial markets are broadly categorized into primary and secondary markets, each serving distinct but complementary functions in the capital formation and trading ecosystem. Understanding the differences between these markets is fundamental for finance professionals and investment analysts to navigate investment opportunities effectively.
Primary Market
The primary market is where new securities are created and sold for the first time. It is the market for new issues of stocks, bonds, or other financial instruments. Companies, governments, or entities raise capital by issuing securities directly to investors.
Functions of the Primary Market:
- Capital Raising: Enables issuers to raise funds for expansion, projects, or debt refinancing.
- Price Discovery: Initial pricing of securities is determined through underwriting and book-building processes.
- Regulatory Compliance: Securities issued must comply with regulatory requirements and disclosures.
Examples of Primary Market Activities:
- Initial Public Offering (IPO): A private company offers shares to the public for the first time.
- Follow-on Public Offering (FPO): An already public company issues additional shares.
- Bond Issuance: Governments or corporations issue bonds to raise debt capital.
Best Practice:
Before investing in a primary market offering, analysts should carefully review the prospectus and assess the issuer’s fundamentals, growth prospects, and market conditions.
Mind Map: Primary Market Overview
Example: IPO of Company XYZ
Company XYZ, a tech startup, decides to go public to raise $100 million for product development. They hire underwriters who help price the shares at $20 each. Investors subscribe to the IPO, and shares are allocated accordingly. The funds raised go directly to XYZ for business use.
Secondary Market
The secondary market is where previously issued securities are bought and sold among investors. It provides liquidity and enables price discovery based on supply and demand dynamics.
Functions of the Secondary Market:
- Liquidity Provision: Investors can easily buy or sell securities without affecting the issuer.
- Price Discovery: Continuous trading reflects changing market perceptions and information.
- Risk Transfer: Investors can adjust their portfolios by trading securities.
Examples of Secondary Market Activities:
- Trading of shares on stock exchanges like NYSE or NASDAQ.
- Bond trading in over-the-counter (OTC) markets.
- ETF and mutual fund share trading.
Best Practice:
Investment analysts should monitor secondary market liquidity and trading volumes to assess the ease of entering or exiting positions.
Mind Map: Secondary Market Overview
Example: Trading Shares of Company XYZ
After the IPO, shares of Company XYZ are listed on NASDAQ. An investor who missed the IPO can buy shares from another investor through the exchange. The price fluctuates based on market demand, news, and company performance.
Key Differences Between Primary and Secondary Markets
| Aspect | Primary Market | Secondary Market |
|---|---|---|
| Purpose | Issuance of new securities | Trading of existing securities |
| Participants | Issuers, underwriters, initial investors | Investors, brokers, market makers |
| Price Determination | Set during issuance (IPO pricing) | Determined by supply and demand |
| Capital Flow | Funds flow to issuer | Funds flow between investors |
| Examples | IPO, bond issuance | Stock exchange trading, bond OTC trading |
Integrated Example: Lifecycle of a Stock
- Primary Market: Company ABC issues 1 million shares at $15 each in an IPO, raising $15 million.
- Secondary Market: Post-IPO, investors trade ABC shares on the NYSE. The price moves based on earnings reports, market sentiment, and macroeconomic factors.
Summary
Understanding the primary and secondary markets is crucial for finance professionals to evaluate how securities are created, priced, and traded. The primary market focuses on capital formation, while the secondary market provides liquidity and continuous price discovery. Both markets are interdependent and vital for efficient capital markets.
Additional Mind Map: Primary vs Secondary Markets Comparison
2.2 Exchange-Traded vs Over-the-Counter (OTC) Markets
Financial markets facilitate the buying and selling of financial instruments, and understanding the distinction between Exchange-Traded and Over-the-Counter (OTC) markets is fundamental for finance professionals and investment analysts. This section delves into the characteristics, advantages, disadvantages, and practical examples of both market types, complemented by mind maps to visualize their structures.
Overview
| Feature | Exchange-Traded Markets | Over-the-Counter (OTC) Markets |
|---|---|---|
| Trading Venue | Centralized exchanges (e.g., NYSE, NASDAQ) | Decentralized network of dealers and brokers |
| Regulation | Highly regulated | Less regulated, depending on jurisdiction |
| Transparency | High transparency with public order books | Lower transparency, private negotiations |
| Standardization | Standardized contracts and instruments | Customized contracts |
| Liquidity | Generally higher liquidity | Can vary; often lower liquidity |
| Examples | Stocks, futures, options on exchanges | Forex spot, swaps, corporate bonds, derivatives |
Mind Map: Exchange-Traded Markets
Mind Map: Over-the-Counter (OTC) Markets
Key Differences Explained with Examples
Trading Venue and Transparency
- Exchange-Traded: Trades occur on centralized platforms with visible order books.
- Example: Buying shares of Apple Inc. on NASDAQ involves placing an order that is matched with sellers in a transparent order book.
- OTC: Trades are negotiated directly between parties, often via phone or electronic systems without a public order book.
- Example: Two banks agreeing on an interest rate swap customized to their needs.
Standardization vs Customization
- Exchange-Traded: Instruments have standardized contract sizes, expiration dates, and terms.
- Example: Futures contracts on the Chicago Mercantile Exchange (CME) have fixed sizes and expiration cycles.
- OTC: Contracts can be tailored to specific requirements.
- Example: A corporation entering a forward contract to buy foreign currency at a specific rate and date customized to its cash flow needs.
Regulation and Counterparty Risk
- Exchange-Traded: Strict regulatory oversight and clearinghouses reduce counterparty risk.
- Example: The clearinghouse guarantees settlement even if one party defaults.
- OTC: Less regulation and no central clearinghouse increase counterparty risk.
- Example: The 2008 financial crisis highlighted risks in OTC derivatives due to lack of transparency and clearing.
Best Practices for Market Selection
- Assess Instrument Needs: Use exchange-traded markets for standardized, liquid instruments; OTC for customized solutions.
- Evaluate Counterparty Risk: OTC trades require thorough credit risk assessment and possibly collateral agreements.
- Consider Transparency Requirements: For strategies needing real-time price discovery, exchanges are preferable.
- Regulatory Compliance: Ensure adherence to relevant regulations, especially for OTC derivatives post-Dodd-Frank and EMIR reforms.
Practical Example: Trading a Corporate Bond
- Exchange-Traded Scenario: Some corporate bonds are listed on exchanges, offering transparent prices and standardized settlement.
- OTC Scenario: Most corporate bonds trade OTC, negotiated between dealers and investors, with prices not publicly displayed.
Example: An investment analyst seeking a specific maturity and coupon structure might negotiate directly with a dealer OTC to obtain a bond matching the portfolio’s risk profile.
Summary Table
| Aspect | Exchange-Traded Market | OTC Market |
|---|---|---|
| Venue | Centralized exchange | Decentralized network |
| Instrument Standardization | High (fixed contract specs) | Low (customized contracts) |
| Transparency | High (public order books) | Low (private negotiation) |
| Regulation | High | Variable |
| Counterparty Risk | Low (clearinghouse guarantees) | Higher (bilateral risk) |
| Liquidity | Generally high | Varies, often lower |
Understanding the nuances between exchange-traded and OTC markets empowers finance professionals to make informed decisions about instrument selection, risk management, and trading strategies. By integrating these best practices and examples, analysts can better navigate the complex landscape of financial markets.
2.3 Electronic Trading Platforms and Dark Pools: Benefits and Risks
Electronic trading platforms and dark pools have transformed the landscape of financial markets, offering new ways to execute trades beyond traditional exchanges. Understanding their benefits and risks is essential for finance professionals and investment analysts aiming to optimize trade execution and manage market impact.
What Are Electronic Trading Platforms?
Electronic trading platforms are computerized systems that facilitate the buying and selling of financial instruments. They provide a digital marketplace where orders are matched and executed efficiently.
- Examples include:
- NASDAQ (fully electronic stock exchange)
- Eurex (derivatives trading platform)
- Electronic Communication Networks (ECNs) like Instinet and BATS
Benefits:
- Speed and Efficiency: Trades are executed in milliseconds, reducing latency.
- Transparency: Real-time price quotes and order book visibility.
- Accessibility: Market access for a broader range of participants globally.
- Lower Costs: Reduced transaction fees compared to traditional floor trading.
Risks:
- System Failures: Technical glitches can halt trading or cause erroneous trades.
- Algorithmic Trading Risks: Automated strategies may exacerbate volatility.
- Cybersecurity Threats: Vulnerability to hacking and data breaches.
What Are Dark Pools?
Dark pools are private, non-transparent trading venues where large blocks of securities are traded anonymously, away from public exchanges.
- Examples of dark pools include:
- Liquidnet
- ITG POSIT
- Credit Suisse Crossfinder
Benefits:
- Reduced Market Impact: Large orders can be executed without revealing intentions, minimizing price slippage.
- Anonymity: Protects trading strategies from competitors.
- Potentially Better Prices: Matching large orders internally can lead to improved execution prices.
Risks:
- Lack of Transparency: Price discovery can be impaired, affecting market fairness.
- Information Asymmetry: Some participants may have better access or information.
- Regulatory Scrutiny: Dark pools face increasing oversight due to concerns about market integrity.
Mind Map: Electronic Trading Platforms
Mind Map: Dark Pools
Integrated Example: Trading a Large Block of Shares
Scenario: An institutional investor wants to sell 1 million shares of a mid-cap stock without causing the price to drop significantly.
-
Traditional Exchange: Placing such a large sell order openly could signal market participants, leading to a price decline (market impact).
-
Using a Dark Pool: The investor routes the order to a dark pool, where the trade is matched anonymously with a buyer. The transaction occurs without alerting the broader market, preserving the stock price.
-
Best Practice: Combining dark pool usage with smart order routing algorithms to balance execution speed, price, and market impact.
Best Practices Summary
-
For Electronic Trading Platforms:
- Ensure robust IT infrastructure to minimize downtime.
- Monitor algorithmic trading strategies to avoid unintended market disruptions.
- Implement strong cybersecurity protocols.
-
For Dark Pools:
- Evaluate the dark pool’s liquidity and counterparty quality.
- Use dark pools as part of a diversified execution strategy, not exclusively.
- Stay informed on regulatory developments affecting dark pool operations.
By understanding the nuanced benefits and risks of electronic trading platforms and dark pools, finance professionals can better navigate modern trading environments, optimize execution, and manage associated risks effectively.
2.4 Best Practices: Choosing the Right Trading Venue for Different Instruments
Selecting the appropriate trading venue is a critical decision that can significantly impact execution quality, costs, liquidity, and risk management. Different financial instruments thrive in different venues due to their unique characteristics, market participants, and regulatory environments. This section outlines best practices for choosing the right trading venue, supported by mind maps and practical examples.
Key Factors to Consider When Choosing a Trading Venue
- Instrument Type: Equities, bonds, derivatives, forex, etc.
- Liquidity: Depth and breadth of market participants.
- Transparency: Level of price and order book visibility.
- Costs: Transaction fees, spreads, and hidden costs.
- Speed and Technology: Execution speed and platform reliability.
- Regulatory Environment: Compliance requirements and protections.
- Market Hours: Alignment with trading strategy and time zones.
Mind Map: Factors Influencing Trading Venue Selection
Best Practice 1: Match Instrument to Venue Type
- Equities: Typically traded on centralized exchanges (e.g., NYSE, NASDAQ) for transparency and liquidity. Dark pools may be used for large block trades to minimize market impact.
- Fixed Income: Often traded OTC due to less standardized instruments and lower liquidity. Some bonds trade on electronic platforms (e.g., TRACE in the US).
- Derivatives: Futures and options are mostly exchange-traded (e.g., CME, ICE) for standardized contracts and clearing benefits. Customized swaps are OTC.
- Forex: Primarily OTC, decentralized market with interbank platforms and electronic communication networks (ECNs).
Example: An institutional investor seeking to buy a large block of shares in a mid-cap stock may use a dark pool to avoid moving the market price, whereas a retail investor buying a few shares would use a public exchange.
Mind Map: Instrument-to-Venue Mapping
Best Practice 2: Evaluate Liquidity and Execution Quality
- Choose venues with sufficient liquidity to minimize slippage.
- Consider venues with advanced order types and execution algorithms.
- For illiquid instruments, OTC markets or specialized platforms may be better.
Example: Trading a highly liquid blue-chip stock on NYSE ensures tight spreads and fast execution, whereas trading a corporate bond with low daily volume might require negotiation with dealers in the OTC market.
Best Practice 3: Consider Cost Structures and Hidden Fees
- Exchanges charge explicit fees (commissions, exchange fees).
- OTC trading may have wider bid-ask spreads and dealer markups.
- Dark pools may offer lower explicit fees but can have less price transparency.
Example: A high-frequency trader prefers venues with low latency and minimal fees, such as direct market access to electronic exchanges, while a buy-side fund might accept slightly higher fees for better price improvement in dark pools.
Best Practice 4: Align Trading Hours and Time Zones
- Match venue hours with your trading strategy and risk tolerance.
- Forex markets offer 24/5 trading, suitable for global currency exposure.
- Some bond markets have limited hours, affecting liquidity.
Example: A trader focusing on Asian equities should consider exchanges like the Tokyo Stock Exchange or Hong Kong Stock Exchange to align with local market hours.
Best Practice 5: Regulatory and Compliance Considerations
- Ensure the venue complies with relevant regulations.
- Consider investor protections and reporting requirements.
Example: European investors trading equities must consider venues compliant with MiFID II regulations, which affect transparency and best execution obligations.
Integrated Example: Choosing a Venue for a Multi-Asset Trade
A portfolio manager wants to rebalance a portfolio by:
- Buying 10,000 shares of a large-cap US stock.
- Selling $5 million face value of corporate bonds.
- Hedging currency risk with FX forwards.
Venue Selection:
- Equities: Use NYSE for transparent, liquid trading; consider dark pools if concerned about market impact.
- Corporate Bonds: Trade OTC via a bond dealer or electronic bond platform like MarketAxess.
- FX Forwards: Execute via interbank OTC platforms or a prime broker’s FX desk.
This approach balances liquidity, cost, and execution quality across instruments.
Summary
Choosing the right trading venue requires a holistic assessment of the instrument characteristics, liquidity, costs, technology, regulatory environment, and trading hours. By applying these best practices, finance professionals can optimize execution, reduce costs, and manage risks effectively.
For further reading, refer to:
- “Trading and Exchanges” by Larry Harris
- Market-specific venue guides (e.g., NYSE, CME, MarketAxess websites)
- Regulatory frameworks such as MiFID II and Dodd-Frank
2.5 Example: Navigating the NYSE vs NASDAQ for Equity Trading
When trading equities, understanding the differences between major trading venues like the New York Stock Exchange (NYSE) and NASDAQ is crucial for finance professionals and investment analysts. Both exchanges have unique structures, trading mechanisms, and participant behaviors that can impact execution quality, liquidity, and pricing.
Overview Mind Map: NYSE vs NASDAQ
Structural Differences
-
NYSE: Operates as an auction market where buyers and sellers interact directly. The Designated Market Makers (DMMs) facilitate liquidity and maintain orderly markets by matching orders and stepping in during volatility.
-
NASDAQ: Functions as a dealer market with multiple competing market makers quoting bid and ask prices electronically. It is fully automated and known for its speed and efficiency.
Trading Mechanisms Mind Map
Practical Example: Choosing Between NYSE and NASDAQ for a Trade
Scenario: An investment analyst wants to buy 10,000 shares of a large-cap tech company listed on NASDAQ and 10,000 shares of a blue-chip industrial company listed on NYSE.
-
NASDAQ Trade:
- Since NASDAQ is fully electronic with multiple market makers, the analyst can expect tighter spreads on highly liquid tech stocks.
- The analyst places a limit order to buy at a price slightly below the current ask to avoid paying the spread.
- The order is routed electronically and may be filled partially or fully depending on liquidity.
-
NYSE Trade:
- The blue-chip industrial stock benefits from the DMM’s role in maintaining price stability.
- The analyst can use a market order during regular trading hours, relying on the DMM to execute at the best available price.
- Alternatively, a limit order can be placed to control execution price, with the DMM helping to fill the order.
Best Practices for Navigating NYSE vs NASDAQ
-
Understand the stock’s listing venue: Knowing where the stock trades helps anticipate liquidity and execution nuances.
-
Use limit orders to control price: Especially on NASDAQ, where multiple market makers compete, limit orders can help avoid paying wide spreads.
-
Leverage DMM support on NYSE: For large orders, working with the DMM can reduce market impact.
-
Monitor market hours and volatility: Both exchanges have similar hours, but volatility and liquidity can vary by venue and stock.
-
Example Mind Map: Best Practices
Additional Example: Impact of Market Structure on Execution
- A trader places a market order for 5,000 shares of a mid-cap stock listed on NASDAQ during high volatility.
- Due to multiple market makers, the order may execute at varying prices across different venues, potentially causing slippage.
- Conversely, a similar order on NYSE might be handled by the DMM who can smooth execution and reduce price impact.
Summary
Navigating the NYSE and NASDAQ requires understanding their distinct market structures and trading mechanisms. By applying best practices such as using appropriate order types, leveraging liquidity providers, and considering market conditions, finance professionals can optimize equity trade execution.
This knowledge empowers investment analysts to make informed decisions that balance speed, cost, and risk when trading across these major U.S. equity markets.
3. Financial Instruments: An In-Depth Overview
3.1 Equity Instruments: Stocks, ETFs, and Mutual Funds
Equity instruments represent ownership in a company or a pool of assets, allowing investors to participate in the growth and profits of the underlying entities. This section explores the primary equity instruments: Stocks, Exchange-Traded Funds (ETFs), and Mutual Funds, highlighting their characteristics, benefits, risks, and practical examples.
Stocks
Stocks, also known as shares or equities, represent fractional ownership in a corporation. When you buy a stock, you become a shareholder and own a portion of the company.
-
Types of Stocks:
- Common Stock: Grants voting rights and potential dividends.
- Preferred Stock: Priority on dividends but usually no voting rights.
-
Key Features:
- Dividends: Periodic payments from company profits.
- Capital Gains: Profit from selling stock at a higher price.
- Voting Rights: Influence on corporate decisions.
-
Example:
- Buying 100 shares of Apple Inc. (AAPL) means you own a small part of Apple and can benefit from its growth and dividends.
Mind Map: Stocks
Exchange-Traded Funds (ETFs)
ETFs are investment funds traded on stock exchanges, holding a diversified portfolio of assets such as stocks, bonds, or commodities.
-
Characteristics:
- Traded like stocks throughout the day.
- Typically track an index (e.g., S&P 500).
- Lower expense ratios compared to mutual funds.
-
Benefits:
- Diversification reduces individual stock risk.
- Transparency of holdings.
- Flexibility in trading.
-
Example:
- SPDR S&P 500 ETF Trust (SPY) tracks the S&P 500 index, allowing investors to gain exposure to 500 large U.S. companies with a single trade.
Mind Map: ETFs
Mutual Funds
Mutual funds pool money from multiple investors to invest in a diversified portfolio managed by professional fund managers.
-
Characteristics:
- Priced once daily at Net Asset Value (NAV).
- Can be actively or passively managed.
- Minimum investment requirements.
-
Benefits:
- Professional management.
- Diversification.
- Accessibility for small investors.
-
Example:
- Vanguard 500 Index Fund (VFIAX) is a mutual fund that passively tracks the S&P 500, offering broad market exposure.
Mind Map: Mutual Funds
Best Practices for Selecting Equity Instruments
- Assess Investment Goals: Determine if you seek growth, income, or capital preservation.
- Understand Risk Tolerance: Stocks are generally higher risk; ETFs and mutual funds offer diversification.
- Consider Costs: Look at expense ratios, commissions, and fees.
- Evaluate Liquidity Needs: Stocks and ETFs offer intraday liquidity; mutual funds trade once daily.
Example: Constructing a Balanced Equity Portfolio
An investment analyst wants to build a portfolio with moderate risk:
- 40% individual stocks in stable, dividend-paying companies (e.g., Johnson & Johnson).
- 40% ETFs tracking broad market indices (e.g., Vanguard Total Stock Market ETF).
- 20% mutual funds with active management focusing on growth sectors.
This blend offers ownership, diversification, and professional management.
Summary
| Instrument Type | Trading Frequency | Management Style | Diversification | Typical Costs | Example |
|---|---|---|---|---|---|
| Stocks | Intraday | Self-managed | Low (single stock) | Commissions, spreads | Apple Inc. (AAPL) |
| ETFs | Intraday | Passive/Active | High | Low expense ratios | SPDR S&P 500 ETF (SPY) |
| Mutual Funds | Once daily (NAV) | Active/Passive | High | Expense ratios, loads | Vanguard 500 Index Fund |
By understanding these equity instruments, finance professionals can tailor investment strategies that align with client objectives and market conditions.
3.2 Debt Instruments: Bonds, Notes, and Commercial Paper
Debt instruments are financial assets that represent a loan made by an investor to a borrower. They are essential components of capital markets, providing issuers with capital and investors with income and relative safety compared to equities. This section explores the key types of debt instruments — bonds, notes, and commercial paper — with detailed explanations, mind maps, and practical examples.
Overview of Debt Instruments
- Bonds: Long-term debt securities with maturities typically over one year.
- Notes: Medium-term debt instruments, usually with maturities between one and ten years.
- Commercial Paper: Short-term unsecured promissory notes issued by corporations, typically with maturities up to 270 days.
Mind Map: Types of Debt Instruments
Bonds
Definition: Bonds are fixed-income securities where the issuer borrows capital from investors and agrees to pay interest (coupon) periodically and repay the principal at maturity.
Key Features:
- Coupon Rate: The interest rate paid on the bond’s face value.
- Maturity Date: When the principal amount is repaid.
- Face Value (Par): The amount the issuer agrees to repay at maturity.
Example: A corporation issues a 10-year bond with a face value of $1,000 and a 5% annual coupon. Investors receive $50 annually and $1,000 at maturity.
Best Practice: When investing in bonds, consider credit ratings and interest rate environment to manage risk.
Notes
Definition: Notes are debt instruments with maturities shorter than bonds but longer than commercial paper, often used by governments and corporations.
Example: The U.S. Treasury issues 5-year Treasury Notes with semi-annual coupon payments. Investors use these as benchmarks for medium-term interest rates.
Best Practice: Use notes for intermediate-term investment horizons and to balance portfolio duration.
Commercial Paper
Definition: Commercial paper is an unsecured, short-term debt instrument issued by corporations to finance working capital needs.
Key Characteristics:
- Maturity ranges from a few days up to 270 days.
- Usually issued at a discount to face value (no coupon).
- Typically issued by companies with high credit ratings.
Example: A corporation issues $1 million of commercial paper at a discount price of $995,000 maturing in 30 days. The investor earns $5,000 as interest.
Best Practice: Commercial paper is ideal for short-term liquidity management but carries credit risk; always assess issuer creditworthiness.
Mind Map: Debt Instrument Features and Uses
Integrated Example: Portfolio Construction Using Debt Instruments
Imagine an investment analyst constructing a fixed income portfolio:
- 40% in Government Bonds: For safety and steady income.
- 30% in Corporate Notes: To capture higher yields with moderate risk.
- 20% in Commercial Paper: For liquidity and short-term cash management.
- 10% in Municipal Bonds: For tax advantages.
This diversified approach balances risk, return, and liquidity.
Summary
Understanding the distinctions among bonds, notes, and commercial paper is critical for finance professionals. Each instrument serves different financing needs and investment horizons. By integrating credit risk assessment, maturity considerations, and market conditions, investors can optimize their fixed income strategies effectively.
3.3 Derivatives: Futures, Options, Swaps, and Forwards
Derivatives are financial instruments whose value is derived from the price of an underlying asset, index, or rate. They are widely used for hedging, speculation, and arbitrage. This section explores the four primary types of derivatives: futures, options, swaps, and forwards, with detailed explanations, mind maps, and practical examples.
What Are Derivatives?
- Financial contracts linked to underlying assets like stocks, bonds, commodities, currencies, or interest rates.
- Enable risk management by transferring risk from one party to another.
Mind Map: Overview of Derivatives
Futures
Definition: Standardized contracts traded on exchanges obligating the buyer to purchase, and the seller to sell, an asset at a predetermined price and date.
Key Features:
- Standardized contract terms
- Marked to market daily
- Regulated exchange trading
Example: Imagine an airline company wants to hedge against rising fuel prices. It buys crude oil futures contracts at $70 per barrel for delivery in 6 months. If prices rise to $80, the airline gains on the futures contract, offsetting higher fuel costs.
Mind Map: Futures
Options
Definition: Contracts giving the buyer the right, but not the obligation, to buy (call) or sell (put) an asset at a specified price before or on a certain date.
Key Features:
- Right without obligation
- Premium paid upfront
- Can be American (exercise anytime before expiry) or European (exercise only at expiry)
Example: An investor buys a call option on stock XYZ with a strike price of $50, paying a $3 premium. If XYZ rises to $60, the investor can exercise the option, buy at $50, and sell at $60, profiting $7 per share ($10 gain minus $3 premium).
Mind Map: Options
Swaps
Definition: Customized contracts between two parties to exchange cash flows or financial instruments over a period.
Common Types:
- Interest Rate Swaps: Exchange fixed interest payments for floating rate payments.
- Currency Swaps: Exchange principal and interest payments in different currencies.
Example: A company with a floating rate loan prefers fixed payments. It enters an interest rate swap to pay fixed and receive floating, stabilizing its interest expenses.
Mind Map: Swaps
Forwards
Definition: Customized contracts between two parties to buy or sell an asset at a specified price on a future date, traded over-the-counter (OTC).
Key Features:
- Non-standardized
- No daily settlement
- Counterparty risk present
Example: An exporter agrees to sell €1 million to a US importer in 3 months at a forward rate of 1.10 USD/EUR. This locks in the exchange rate, protecting against currency fluctuations.
Mind Map: Forwards
Best Practices for Using Derivatives
- Understand the underlying asset and market conditions before entering derivative contracts.
- Use derivatives primarily for hedging risk rather than speculation unless you have a strong risk appetite and expertise.
- Monitor counterparty risk especially in OTC derivatives like forwards and swaps.
- Keep track of margin requirements and potential liquidity needs in futures trading.
- Combine derivatives with other instruments to build diversified and risk-managed portfolios.
Summary Table
| Derivative | Trading Venue | Standardization | Obligation | Use Case Example |
|---|---|---|---|---|
| Futures | Exchange | Standardized | Obligation | Airline hedging fuel prices |
| Options | Exchange/OTC | Standardized | Right, no obligation | Investor buying call option on stock |
| Swaps | OTC | Customized | Obligation | Company swapping floating for fixed rate |
| Forwards | OTC | Customized | Obligation | Exporter locking currency rate |
This comprehensive understanding of derivatives equips finance professionals and investment analysts to effectively incorporate these instruments into their risk management and trading strategies.
3.4 Hybrid Instruments: Convertible Bonds and Preferred Stocks
Hybrid instruments combine features of both debt and equity, offering investors unique risk-return profiles and issuers flexible financing options. Two of the most common hybrid instruments are convertible bonds and preferred stocks. This section explores their structure, benefits, risks, and practical examples to help finance professionals and investment analysts understand their role in portfolio construction and corporate finance.
Convertible Bonds
Convertible bonds are debt securities that can be converted into a predetermined number of the issuer’s equity shares, usually at the discretion of the bondholder. They provide downside protection through fixed interest payments while offering upside potential via conversion.
Key Features:
- Fixed coupon payments until conversion or maturity.
- Conversion ratio: number of shares received per bond.
- Conversion price: implied price per share at conversion.
- Maturity date: bond redemption if not converted.
Mind Map: Convertible Bonds
Example:
A company issues a convertible bond with a face value of $1,000, a 5% annual coupon, and a conversion ratio of 20 shares per bond. The implied conversion price is $50 ($1,000 / 20). If the stock price rises above $50, investors may convert to equity to benefit from capital appreciation. If the stock remains below $50, investors retain the bond and receive coupon payments.
Best Practice: When evaluating convertible bonds, analysts should assess the bond’s yield relative to comparable straight bonds, the likelihood of conversion based on stock price forecasts, and the potential dilution impact on existing shareholders.
Preferred Stocks
Preferred stocks are equity instruments with fixed dividends and priority over common stock in dividend payments and liquidation. They often have features similar to bonds but carry equity characteristics.
Key Features:
- Fixed dividend payments, often cumulative.
- Preference over common stock for dividends and liquidation.
- May be callable or convertible.
- Typically no voting rights.
Mind Map: Preferred Stocks
Example:
An investor buys preferred shares paying a 6% fixed dividend on a $100 par value. If the company skips a dividend, cumulative preferred stockholders are entitled to receive missed dividends before common shareholders get any. Preferred shares may also be callable at $105 after five years, allowing the issuer to redeem them early.
Best Practice: Investment analysts should evaluate the creditworthiness of the issuer, dividend coverage ratios, and the terms of convertibility or callability to understand the instrument’s risk and return profile.
Comparative Summary Mind Map
Integrated Example: Portfolio Application
Consider a portfolio manager aiming to balance income and growth. They allocate 10% to convertible bonds of a technology company, which offers steady coupons plus upside if the stock performs well. Another 5% is allocated to preferred stocks of a utility company, providing stable dividends with priority over common shares.
This hybrid approach allows the portfolio to benefit from fixed income characteristics while maintaining exposure to equity appreciation and dividend preference, enhancing diversification and risk management.
Summary
Hybrid instruments like convertible bonds and preferred stocks offer nuanced investment opportunities blending debt and equity traits. Understanding their structures, benefits, and risks through examples and mind maps equips finance professionals and investment analysts to make informed decisions tailored to client needs and market conditions.
3.5 Best Practices: Instrument Selection Based on Risk Appetite and Investment Goals
Selecting the right financial instruments is critical for aligning your portfolio with your risk tolerance and investment objectives. This section explores best practices for instrument selection, supported by clear examples and mind maps to simplify decision-making.
Understanding Risk Appetite and Investment Goals
Before choosing instruments, it’s essential to define:
- Risk Appetite: The level of risk an investor is willing and able to take.
- Investment Goals: Objectives such as capital preservation, income generation, growth, or speculation.
These two factors guide the selection process and help balance potential returns against acceptable risk.
Mind Map: Instrument Selection Framework
Step 1: Assess Your Risk Appetite
- Conservative: Prioritize capital preservation and low volatility.
- Moderate: Willing to accept some volatility for better returns.
- Aggressive: Comfortable with high volatility and potential losses for maximum growth.
Step 2: Define Your Investment Goals
- Capital Preservation: Protect principal; minimize losses.
- Income Generation: Focus on steady cash flows (dividends, coupons).
- Capital Growth: Maximize appreciation over time.
- Speculation: Seek short-term profits, often with higher risk.
Step 3: Match Instruments to Profiles
| Risk Appetite | Investment Goal | Suitable Instruments | Example |
|---|---|---|---|
| Conservative | Capital Preservation | Government Bonds, High-Grade Corporate Bonds | Buying 10-year U.S. Treasury bonds to preserve principal with minimal risk |
| Moderate | Income Generation | Dividend-paying Stocks, Investment-Grade Bonds | Investing in blue-chip stocks like Johnson & Johnson for dividends and moderate growth |
| Aggressive | Capital Growth | Growth Stocks, Small Caps, Sector ETFs | Purchasing tech sector ETFs focusing on emerging companies for higher capital appreciation |
| Aggressive | Speculation | Options, Futures, High-Yield Bonds | Using call options on volatile stocks to leverage potential short-term gains |
Example 1: Conservative Investor Seeking Capital Preservation
Scenario: Jane, age 55, plans to retire in 10 years and wants to protect her savings.
Instrument Selection:
- Allocate 70% to U.S. Treasury bonds and high-grade corporate bonds.
- Allocate 20% to dividend-paying blue-chip stocks for modest income.
- Allocate 10% to cash or money market funds for liquidity.
Rationale: Low-risk bonds ensure principal safety, dividend stocks provide income, and cash offers flexibility.
Example 2: Moderate Investor Focused on Income Generation
Scenario: Mark, age 40, wants steady income and some growth.
Instrument Selection:
- 50% dividend-paying equities (e.g., utilities, consumer staples).
- 30% investment-grade corporate bonds.
- 20% balanced mutual funds or ETFs.
Rationale: Diversification balances income and moderate growth with manageable risk.
Example 3: Aggressive Investor Targeting Capital Growth
Scenario: Lisa, age 30, has a high risk tolerance and a long investment horizon.
Instrument Selection:
- 70% growth stocks and sector-specific ETFs (technology, biotech).
- 20% small-cap stocks.
- 10% speculative instruments like options for tactical plays.
Rationale: High-growth instruments maximize appreciation potential, while options provide leverage opportunities.
Mind Map: Risk vs Instrument Characteristics
Additional Best Practices
- Diversification: Spread investments across different instruments to reduce risk.
- Regular Review: Periodically reassess risk appetite and goals to adjust instrument allocation.
- Understand Instrument Features: Know liquidity, maturity, credit risk, and tax implications.
- Use Professional Advice: Consult financial advisors for complex instruments or strategies.
Summary
Instrument selection is a dynamic process that hinges on clearly understanding your risk tolerance and investment goals. By using structured frameworks and examples, finance professionals can tailor portfolios that optimize returns while managing risk effectively.
3.6 Example: Constructing a Balanced Portfolio Using Multiple Instrument Types
Constructing a balanced portfolio is a fundamental practice for finance professionals and investment analysts aiming to optimize returns while managing risk. This example will guide you through the process of building a diversified portfolio using multiple financial instrument types, emphasizing best practices and practical considerations.
Step 1: Define Investment Objectives and Risk Appetite
Before selecting instruments, clarify the investor’s goals and risk tolerance.
- Objective: Capital appreciation with moderate income
- Risk Appetite: Moderate
Step 2: Asset Allocation Across Instrument Types
A balanced portfolio typically includes equities, fixed income, and alternative instruments to diversify risk.
Step 3: Selecting Instruments Within Each Asset Class
Equities:
- Large-cap stocks for stability (e.g., Apple, Microsoft)
- Sector ETFs for diversification (e.g., Technology ETF, Healthcare ETF)
Fixed Income:
- Government bonds for safety (e.g., 10-year US Treasury)
- Investment-grade corporate bonds for yield (e.g., bonds from IBM)
Alternatives:
- REITs for real estate exposure (e.g., Vanguard Real Estate ETF)
- Commodities like gold as a hedge against inflation
Cash & Cash Equivalents:
- Money market funds for liquidity
Step 4: Portfolio Construction Example
| Asset Class | Instrument Type | Allocation (%) | Example Instrument | Rationale |
|---|---|---|---|---|
| Equities | Large-cap Stocks | 35 | Apple (AAPL), Microsoft (MSFT) | Growth potential with moderate risk |
| Equities | Sector ETFs | 15 | Technology ETF (XLK) | Diversification across sectors |
| Fixed Income | Government Bonds | 25 | 10-year US Treasury | Capital preservation and stability |
| Fixed Income | Corporate Bonds | 10 | IBM Corporate Bonds | Higher yield with moderate credit risk |
| Alternatives | REITs | 10 | Vanguard Real Estate ETF | Income and inflation hedge |
| Cash & Cash Equivalents | Money Market Funds | 5 | Vanguard Prime Money Market | Liquidity and safety |
Step 5: Monitoring and Rebalancing
Regularly review portfolio performance and rebalance to maintain target allocations.
Practical Example: How Diversification Reduces Risk
Consider two portfolios:
- Portfolio A: 100% invested in a single technology stock.
- Portfolio B: Balanced portfolio as above.
Outcome:
- Portfolio A is highly volatile and vulnerable to sector-specific risks.
- Portfolio B benefits from diversification, reducing overall volatility and smoothing returns.
Summary
Constructing a balanced portfolio involves:
- Defining clear investment objectives
- Allocating assets across multiple instrument types
- Selecting specific instruments based on risk and return profiles
- Regularly monitoring and rebalancing
This approach helps finance professionals and investment analysts build resilient portfolios tailored to client needs.
Additional Resources
- Modern Portfolio Theory (MPT)
- ETF Investing Basics
- Bond Basics
4. Equity Markets Fundamentals
4.1 Stock Market Indices: Purpose and Construction
Introduction
Stock market indices are essential tools in financial markets, serving as barometers of market performance and economic health. They aggregate the prices of selected stocks to provide a single, representative value reflecting the overall market or a specific sector.
Purpose of Stock Market Indices
- Market Performance Benchmark: Indices provide a snapshot of how a market or sector is performing over time.
- Investment Benchmark: Fund managers and investors use indices to compare portfolio returns.
- Economic Indicator: Movements in indices often reflect broader economic trends.
- Basis for Financial Products: Many derivatives, ETFs, and mutual funds track indices.
Example: The S&P 500 index is widely used as a benchmark for U.S. large-cap equities. If a mutual fund returns 8% in a year while the S&P 500 returns 10%, the fund underperformed its benchmark.
Construction of Stock Market Indices
Indices are constructed using different methodologies that affect their behavior and interpretation.
Price-Weighted Indices
- Definition: Stocks are weighted according to their share price.
- Example: Dow Jones Industrial Average (DJIA).
- Implication: Higher-priced stocks have more influence regardless of company size.
Market Capitalization-Weighted Indices
- Definition: Stocks are weighted based on their total market capitalization (share price × number of shares outstanding).
- Examples: S&P 500, NASDAQ Composite.
- Implication: Larger companies have more impact on the index.
Equal-Weighted Indices
- Definition: All stocks have equal weight regardless of price or size.
- Example: S&P 500 Equal Weight Index.
- Implication: Smaller companies have the same influence as large companies.
Fundamentally Weighted Indices
- Definition: Weighting based on fundamental metrics like earnings, dividends, or book value.
- Example: FTSE RAFI Index Series.
- Implication: Reflects company fundamentals rather than market price.
Mind Map: Types of Stock Market Indices
How Indices Are Calculated: A Simple Example
Price-Weighted Index Example:
| Stock | Price | Weight Impact |
|---|---|---|
| A | $100 | High |
| B | $50 | Medium |
| C | $10 | Low |
If Stock A increases by $1, the index moves more than if Stock C increases by $1.
Market Cap-Weighted Index Example:
| Stock | Price | Shares Outstanding (millions) | Market Cap (Price × Shares) |
|---|---|---|---|
| A | $100 | 10 | $1,000 million |
| B | $50 | 20 | $1,000 million |
| C | $10 | 100 | $1,000 million |
All stocks have equal market cap, so equal weight in the index.
If Stock A’s price rises to $110, its market cap becomes $1,100 million, increasing its weight and pushing the index up.
Best Practices for Using Indices
- Understand Index Methodology: Know how the index is constructed to interpret movements correctly.
- Use Appropriate Benchmarks: Match your portfolio style with the right index (e.g., large-cap fund vs. S&P 500).
- Consider Sector and Style Exposure: Indices may have sector biases; diversify accordingly.
- Be Aware of Rebalancing: Indices periodically rebalance which can affect returns.
Example: Comparing DJIA and S&P 500
- DJIA: Price-weighted, 30 large U.S. companies, influenced heavily by high-priced stocks like Goldman Sachs.
- S&P 500: Market cap-weighted, 500 large U.S. companies, more representative of the overall market.
Scenario: If a high-priced stock in DJIA rises sharply but a large-cap stock in S&P 500 with lower price remains stable, DJIA might show a bigger gain even if overall market movement is modest.
Summary
Stock market indices are vital tools that summarize market performance through different construction methodologies. Understanding their purpose and how they are built enables finance professionals to use them effectively for benchmarking, analysis, and investment decisions.
4.2 Order Types and Execution: Market, Limit, Stop, and Stop-Limit Orders
Understanding order types is fundamental for finance professionals and investment analysts to execute trades effectively and manage risk. This section explores the primary order types used in equity markets, their execution mechanics, and best practices illustrated with practical examples.
Overview of Order Types
- Market Order: An order to buy or sell immediately at the best available current price.
- Limit Order: An order to buy or sell at a specified price or better.
- Stop Order (Stop-Loss Order): An order that becomes a market order once a specified stop price is reached.
- Stop-Limit Order: An order that becomes a limit order once a stop price is reached.
Mind Map: Order Types and Their Characteristics
Market Orders
Definition: Market orders instruct the broker to buy or sell immediately at the best available price.
Best Practices:
- Use when immediate execution is more important than price.
- Avoid in illiquid stocks to prevent large price slippage.
Example: You want to buy 1,000 shares of XYZ Corp immediately. The current best ask price is $50.05. Placing a market order will execute at $50.05 or close to it, depending on market depth.
Mind Map:
Limit Orders
Definition: Limit orders specify the maximum price to buy or minimum price to sell.
Best Practices:
- Use to control entry or exit price.
- Can remain unfilled if market price does not reach limit.
Example: You want to buy 500 shares of ABC Inc. but only if the price drops to $45.00 or lower. You place a buy limit order at $45.00. The order will only execute if the price hits $45.00 or less.
Mind Map:
Stop Orders (Stop-Loss)
Definition: A stop order becomes a market order once the stop price is triggered.
Best Practices:
- Use to limit losses or protect profits.
- Be aware of potential price gaps causing execution at unfavorable prices.
Example: You own 200 shares of DEF Ltd. currently trading at $60. To limit losses, you place a stop order at $55. If the price falls to $55, your stop order triggers a market sell.
Mind Map:
Stop-Limit Orders
Definition: A stop-limit order triggers a limit order once the stop price is reached.
Best Practices:
- Use to control execution price after stop triggers.
- Risk of non-execution if limit price is not met.
Example: You hold 300 shares of GHI Co. at $80. To protect gains but avoid selling too low, you set a stop-limit order with a stop price of $75 and a limit price of $74. If the price hits $75, a limit sell order at $74 is placed.
Mind Map:
Integrated Example: Using Multiple Order Types
Imagine you are an investment analyst managing a volatile stock:
- Current price: $100
- You want to buy if price dips to $95 (limit order)
- You want to sell to limit losses if price falls below $90 (stop order)
- You want to sell to take profits if price rises above $110 (stop-limit order with stop $110, limit $109)
This strategy uses different order types to manage entry, risk, and profit-taking effectively.
Summary Table
| Order Type | Execution Timing | Price Control | Risk of Non-Execution | Use Case Example |
|---|---|---|---|---|
| Market Order | Immediate | None | Low | Buying liquid stock quickly |
| Limit Order | When price meets limit | High | High | Buying dips or selling at target price |
| Stop Order | When stop price hit | None (becomes market) | Low | Stop-loss to limit downside |
| Stop-Limit Order | When stop price hit | High (limit order) | High | Protect profits with price control |
Mastering these order types and their execution nuances allows finance professionals to optimize trade outcomes, manage risk, and adapt to market conditions effectively.
4.3 Market Makers and Liquidity Providers: Roles and Impact
Introduction
Market makers and liquidity providers are essential components of financial markets, ensuring smooth and efficient trading by continuously offering buy and sell prices for securities. Their activities reduce price volatility, enhance market depth, and facilitate trade execution.
What is a Market Maker?
A market maker is a firm or individual that quotes both a buy (bid) and a sell (ask) price for a financial instrument, committing to buy and sell at those prices to provide liquidity.
- Key Functions:
- Provide continuous quotes
- Facilitate trade execution
- Narrow bid-ask spreads
What is a Liquidity Provider?
Liquidity providers can be market makers or other entities (like high-frequency traders or institutional investors) that supply liquidity by placing limit orders or engaging in trades that increase market depth.
Mind Map: Roles of Market Makers and Liquidity Providers
Impact on Market Quality
- Tighter Bid-Ask Spreads: Market makers reduce transaction costs for traders.
- Improved Liquidity: Easier to buy or sell without causing large price changes.
- Faster Execution: Orders are filled promptly due to available counterparties.
- Price Stability: Absorb shocks from large orders, reducing volatility.
Example 1: Market Maker in Equity Trading
Consider a market maker for a stock XYZ:
- Quotes a bid price of $49.95 and an ask price of $50.05.
- A trader wants to buy 100 shares; the market maker sells at $50.05.
- Another trader wants to sell 100 shares; the market maker buys at $49.95.
By continuously providing these quotes, the market maker ensures traders can transact quickly without waiting for a counterparty.
Mind Map: Market Maker Profit and Risk Management
Example 2: Liquidity Provider in FX Market
In the foreign exchange market, large banks act as liquidity providers:
- They continuously quote bid and ask prices for currency pairs.
- When a client wants to exchange USD for EUR, the bank provides liquidity by selling EUR at the ask price.
- If the market moves quickly, the bank adjusts quotes to manage risk.
This continuous quoting helps maintain a liquid and efficient FX market.
Best Practices for Market Makers and Liquidity Providers
- Maintain Competitive Spreads: Balance between profitability and attractiveness to traders.
- Use Technology: Employ algorithmic quoting and risk management tools.
- Monitor Market Conditions: Adjust quotes dynamically during volatility or news events.
- Inventory Management: Keep positions balanced to avoid excessive risk.
- Compliance: Adhere to market regulations to avoid conflicts of interest.
Example 3: Impact of Market Makers During Volatility
During a sudden market drop, market makers may widen spreads to manage risk. For instance, if stock ABC normally trades with a $0.05 spread, during a volatile event it might widen to $0.20.
- This protects market makers from rapid adverse price moves.
- Traders face higher transaction costs but benefit from continued liquidity.
Summary
Market makers and liquidity providers play a pivotal role in ensuring market efficiency, liquidity, and stability. Their continuous quoting and risk management activities enable smoother price discovery and better trading experiences for all market participants.
4.4 Best Practices: Effective Order Placement Strategies with Illustrative Examples
Effective order placement is critical for optimizing trade execution, managing risk, and achieving desired investment outcomes. This section explores best practices for placing orders in equity markets, supported by illustrative examples and mind maps to clarify concepts.
Key Order Types and Their Strategic Uses
- Market Orders: Immediate execution at the best available price.
- Limit Orders: Execution at a specified price or better.
- Stop Orders: Trigger a market order once a specified price is reached.
- Stop-Limit Orders: Trigger a limit order once a specified price is reached.
Mind Map: Order Types and Strategic Applications
Best Practice 1: Use Limit Orders to Control Entry and Exit Prices
Example:
An investor wants to buy shares of XYZ Corp currently trading at $50 but believes $48 is a better entry point. Placing a limit buy order at $48 ensures the order only executes at $48 or lower, avoiding overpaying.
Benefit: Protects against paying more than intended, especially in volatile markets.
Caution: The order may not execute if the price never reaches $48.
Best Practice 2: Employ Stop-Loss Orders to Manage Downside Risk
Example:
An investor holds shares of ABC Inc. purchased at $100. To limit losses, they place a stop-loss order at $90. If the price falls to $90, a market order triggers to sell, limiting further losses.
Benefit: Automates risk management and removes emotional decision-making.
Caution: In fast markets, execution price may be below stop price (slippage).
Mind Map: Risk Management via Order Placement
Best Practice 3: Use Stop-Limit Orders to Balance Risk and Price Control
Example:
An investor sets a stop-limit sell order on DEF Corp at a stop price of $75 and a limit price of $73. If the stock falls to $75, a limit order to sell at $73 or better is placed.
Benefit: Limits downside while avoiding selling at prices too low.
Caution: Order may not execute if the price gaps below $73, exposing the investor to further losses.
Best Practice 4: Consider Time-in-Force Instructions to Optimize Execution
- Day Orders: Cancel if not executed by market close.
- Good-Till-Canceled (GTC): Remain active until executed or canceled.
- Immediate or Cancel (IOC): Execute immediately any portion possible, cancel remainder.
Example:
A trader places a limit buy order for 1,000 shares of GHI Inc. at $30 with IOC. If only 600 shares are available at $30 immediately, those 600 shares execute and the remaining 400 shares are canceled.
Benefit: Avoids partial fills lingering in the market.
Mind Map: Time-in-Force Options
Best Practice 5: Use Iceberg Orders for Large Trades to Minimize Market Impact
Example:
A fund manager wants to sell 100,000 shares of JKL Corp without signaling large volume to the market. An iceberg order reveals only 5,000 shares at a time, hiding the full size.
Benefit: Reduces price impact and information leakage.
Caution: Not all trading venues support iceberg orders.
Summary Table: Order Types, Uses, and Risks
| Order Type | Primary Use | Key Benefit | Risk/Consideration |
|---|---|---|---|
| Market Order | Immediate execution | Quick fills | Price slippage in volatile markets |
| Limit Order | Price control | Avoid overpaying | May not fill if price not reached |
| Stop Order | Trigger market order on price | Risk management, entry triggers | Slippage possible on execution |
| Stop-Limit Order | Trigger limit order on price | Price control on stop orders | May not fill if limit price missed |
| Iceberg Order | Large order execution stealth | Minimize market impact | Limited availability |
Final Illustrative Example: Combining Strategies
An investor wants to buy 500 shares of MNO Inc., currently at $40, but only if the price drops to $38 or lower. They place a limit buy order at $38 with a GTC time-in-force. To protect against sudden drops after purchase, they also set a stop-loss order at $35.
- If the price falls to $38, the limit order executes.
- If the price then falls to $35, the stop-loss triggers a market sell order to limit losses.
This combined approach balances price control, patience, and risk management.
By understanding and applying these order placement best practices, finance professionals and investment analysts can enhance trade execution quality, manage risk effectively, and optimize portfolio performance.
4.5 Example: How Limit Orders Can Protect Against Market Volatility
In volatile markets, prices can swing rapidly within seconds or minutes, leading to unexpected execution prices if traders use market orders. Limit orders provide a way to control the price at which a trade is executed, helping investors protect themselves from adverse price movements.
What is a Limit Order?
A limit order is an order to buy or sell a security at a specified price or better. It guarantees the price but not the execution.
- Buy Limit Order: Executes at the limit price or lower.
- Sell Limit Order: Executes at the limit price or higher.
Why Use Limit Orders in Volatile Markets?
- Prevents buying at unexpectedly high prices.
- Avoids selling at unexpectedly low prices.
- Provides control over trade execution price.
- Helps manage risk during rapid price fluctuations.
Mind Map: Limit Orders in Volatile Markets
Example Scenario 1: Protecting a Buy Order
Imagine a stock currently trading at $50, but due to market volatility, the price can spike to $55 within seconds.
- Market Order: You place a market buy order and end up buying at $54.80 due to rapid price increase.
- Limit Order: You place a buy limit order at $50.50. Your order will only execute if the price drops to $50.50 or below, protecting you from paying too much.
Outcome: The limit order prevents overpaying during a sudden price spike.
Example Scenario 2: Protecting a Sell Order
A stock you own is trading at $100 but is expected to be volatile due to an upcoming earnings report.
- Market Order: You place a market sell order and get executed at $95 due to a sudden price drop.
- Limit Order: You place a sell limit order at $98. Your order will only execute if the price is $98 or higher.
Outcome: The limit order prevents selling at a steep discount during a flash drop.
Mind Map: Comparing Market vs Limit Orders During Volatility
Best Practices When Using Limit Orders in Volatile Markets
- Set realistic limit prices: Avoid setting limits too far from current prices to increase execution probability.
- Monitor market conditions: Adjust limit orders as volatility evolves.
- Combine with stop-loss orders: To manage risk if the price moves against your position.
- Use partial fills awareness: Be prepared that limit orders might fill partially if liquidity is low.
Summary
Limit orders are essential tools for finance professionals and investment analysts to manage execution risk during volatile market conditions. By specifying the maximum purchase price or minimum sale price, limit orders help avoid unexpected losses due to rapid price swings while maintaining control over trade execution.
Additional Resources
- Investopedia: Limit Order
- SEC: Order Types
This example highlights how integrating limit orders into your trading strategy can safeguard investments and improve execution quality during turbulent market phases.
5. Fixed Income Markets and Instruments
5.1 Bond Pricing and Yield Concepts: Coupon, Yield to Maturity, and Duration
Understanding bond pricing and yield concepts is fundamental for finance professionals and investment analysts to evaluate fixed income securities effectively. This section breaks down the core components: coupon, yield to maturity (YTM), and duration, supplemented with mind maps and practical examples.
Bond Pricing Basics
A bond is essentially a loan made by an investor to a borrower (typically a corporation or government). The price of a bond is the present value of its future cash flows, which include periodic coupon payments and the repayment of the principal at maturity.
Key components:
- Face Value (Par): The amount paid back at maturity, usually $1,000.
- Coupon Rate: The annual interest rate paid on the face value.
- Coupon Payment: Coupon Rate × Face Value.
- Maturity: The time when the bond principal is repaid.
Mind Map: Bond Pricing Components
Coupon
The coupon is the fixed interest payment the bondholder receives periodically, usually annually or semi-annually.
Example:
- Face Value: $1,000
- Coupon Rate: 5%
- Coupon Payment: 5% × $1,000 = $50 per year
If the bond pays semi-annually, each payment is $25 every six months.
Yield to Maturity (YTM)
YTM is the internal rate of return (IRR) earned by an investor who buys the bond at the current market price and holds it until maturity, assuming all payments are made as scheduled.
It accounts for:
- Coupon payments
- Capital gain or loss (difference between purchase price and face value)
- Time value of money
YTM Formula (conceptual):
\[ Price = \sum_{t=1}^{N} \frac{C}{(1+YTM)^t} + \frac{F}{(1+YTM)^N} \]
Where:
- \(C\) = coupon payment
- \(F\) = face value
- \(N\) = number of periods
Example:
Suppose a bond with:
- Face Value = $1,000
- Coupon Rate = 6% (annual coupon = $60)
- Maturity = 5 years
- Current Price = $950
To find YTM, solve for the rate \(r\) in:
\[ 950 = \frac{60}{(1+r)^1} + \frac{60}{(1+r)^2} + \frac{60}{(1+r)^3} + \frac{60}{(1+r)^4} + \frac{60 + 1000}{(1+r)^5} \]
This requires iterative methods or financial calculators. The YTM will be higher than the coupon rate since the bond price is below par.
Mind Map: Yield to Maturity
Duration
Duration measures the sensitivity of a bond’s price to changes in interest rates, expressed in years. It can be thought of as the weighted average time to receive the bond’s cash flows.
Types:
- Macaulay Duration: Weighted average time until cash flows are received.
- Modified Duration: Approximate percentage price change for a 1% change in yield.
Formula for Macaulay Duration:
\[ D = \frac{\sum_{t=1}^N t \times \frac{C}{(1+y)^t} + N \times \frac{F}{(1+y)^N}}{Price} \]
Where:
- \(t\) = time period
- \(C\) = coupon payment
- \(F\) = face value
- \(y\) = yield per period
- \(N\) = total number of periods
Example:
Consider a 3-year bond with:
- Face Value = $1,000
- Coupon Rate = 5% (annual coupon = $50)
- YTM = 4%
Calculate present value of each cash flow and weight by time, then sum and divide by price to get Macaulay Duration.
Interpretation:
- A duration of 2.8 years means if interest rates rise by 1%, bond price will fall approximately 2.8%.
Mind Map: Duration
Practical Example: Putting It All Together
Bond Details:
- Face Value: $1,000
- Coupon Rate: 6% (annual $60)
- Maturity: 4 years
- Market Price: $980
Step 1: Calculate YTM
Using a financial calculator or Excel RATE function:
=RATE(nper=4, pmt=60, pv=-980, fv=1000)
Yields approximately 6.5%.
Step 2: Calculate Duration
Calculate present values of each coupon and principal, multiply by time, sum, then divide by price.
| Year | Cash Flow | Present Value (6.5%) | Time × PV |
|---|---|---|---|
| 1 | $60 | $56.34 | 56.34 |
| 2 | $60 | $52.87 | 105.74 |
| 3 | $60 | $49.60 | 148.80 |
| 4 | $1,060 | $832.37 | 3,329.48 |
Sum PV = $991.18 (close to market price)
Sum Time × PV = 3,640.36
Macaulay Duration = 3,640.36 / 991.18 ≈ 3.67 years
Modified Duration = 3.67 / (1 + 0.065) ≈ 3.44 years
Interpretation:
- For a 1% increase in interest rates, bond price will drop approximately 3.44%.
Best Practices
- Always compare YTM to coupon rate to understand if a bond is trading at a discount or premium.
- Use duration to manage interest rate risk in fixed income portfolios.
- Utilize financial calculators or spreadsheet software for precise YTM and duration calculations.
- Consider bond features such as callability or convertibility, which affect pricing and yield.
This foundational knowledge equips finance professionals to evaluate bonds accurately, manage risk, and make informed investment decisions.
5.2 Credit Ratings and Their Impact on Bond Pricing
Introduction
Credit ratings are assessments provided by specialized agencies that evaluate the creditworthiness of bond issuers. These ratings play a crucial role in bond pricing because they influence the perceived risk of default and thus the yield investors demand.
What Are Credit Ratings?
Credit ratings are letter grades assigned to bonds or issuers indicating their ability to meet financial obligations. The most common agencies are Standard & Poor’s (S&P), Moody’s, and Fitch.
- Investment Grade: Ratings from AAA to BBB- (S&P) indicate relatively low risk.
- Non-Investment Grade (High Yield or Junk): Ratings below BBB- indicate higher risk.
Mind Map: Credit Rating Agencies and Scales
How Credit Ratings Impact Bond Pricing
-
Risk Premium and Yield:
- Bonds with lower credit ratings are perceived as riskier.
- Investors demand higher yields (risk premium) to compensate for increased default risk.
-
Price and Yield Relationship:
- When credit ratings are downgraded, bond prices typically fall, and yields rise.
- Conversely, upgrades can increase bond prices and reduce yields.
-
Liquidity Impact:
- Higher-rated bonds tend to be more liquid, attracting more investors.
- Lower-rated bonds may have wider bid-ask spreads and less market depth.
Mind Map: Impact of Credit Ratings on Bond Pricing
Example 1: Comparing Two Bonds with Different Credit Ratings
| Bond | Credit Rating | Coupon Rate | Yield to Maturity (YTM) | Price (per $100 face) |
|---|---|---|---|---|
| A | AAA | 3.0% | 3.1% | 100.5 |
| B | BB | 5.5% | 7.0% | 92.0 |
Explanation:
- Bond A is highly rated (AAA), so it offers a lower coupon and yield, and trades slightly above par.
- Bond B has a lower rating (BB), reflecting higher credit risk, so it offers a higher coupon and yield but trades below par to compensate investors.
Best Practice: Incorporating Credit Ratings into Investment Decisions
- Always review the credit rating alongside other financial metrics.
- Monitor rating changes as they can significantly affect bond prices.
- Diversify bond holdings across different ratings to balance risk and return.
Example 2: Effect of a Credit Rating Downgrade
Scenario: A company’s bond is rated A by S&P. Due to deteriorating financials, it is downgraded to BBB.
- Before Downgrade: Bond price = $102, YTM = 3.5%
- After Downgrade: Bond price = $97, YTM = 4.5%
Interpretation: The downgrade increases perceived risk, causing the bond price to drop and yield to rise, reflecting higher risk premium demanded by investors.
Summary
Credit ratings are a vital tool for assessing bond risk and directly influence bond pricing through yield adjustments and liquidity effects. Understanding these dynamics helps finance professionals and investment analysts make informed decisions about bond investments.
Additional Resources
- S&P Global Ratings: https://www.spglobal.com/ratings/en/
- Moody’s Investors Service: https://www.moodys.com/
- Fitch Ratings: https://www.fitchratings.com/
5.3 Trading Bonds: Auction vs Secondary Market
Understanding the mechanisms through which bonds are traded is crucial for finance professionals and investment analysts. Bonds can be acquired either directly from the issuer through auctions or bought and sold on the secondary market. Each method has its own characteristics, advantages, and best practices.
Bond Auctions
Bond auctions are the primary market mechanism where new bonds are issued and sold to investors. Governments and corporations use auctions to raise capital.
Types of Bond Auctions:
- Competitive Bidding: Investors specify the yield or price they are willing to accept. The bonds are awarded to the highest bidders until the entire offering is allocated.
- Non-Competitive Bidding: Investors agree to accept the yield determined by the auction. This guarantees allocation but at the market-clearing price.
Best Practices:
- Understand auction calendars and deadlines.
- Analyze historical auction results to anticipate pricing.
- Use non-competitive bids for guaranteed allocation in volatile markets.
Example: The U.S. Treasury regularly auctions 10-year Treasury notes. An institutional investor may submit a competitive bid specifying a yield of 3.5%, while a retail investor might submit a non-competitive bid to ensure allocation at the winning yield.
Secondary Bond Market
The secondary market is where previously issued bonds are traded between investors. This market provides liquidity and price discovery.
Characteristics:
- Bonds trade over-the-counter (OTC) or on electronic platforms.
- Prices fluctuate based on interest rates, credit risk, and market demand.
- Investors can buy or sell bonds before maturity.
Best Practices:
- Monitor bid-ask spreads to assess liquidity.
- Use limit orders to control purchase or sale prices.
- Analyze yield curves and credit ratings to identify value.
Example: An investment analyst wants to sell corporate bonds before maturity. They check the current market price on an electronic trading platform and place a limit order to sell at a price that reflects the bond’s credit rating and prevailing interest rates.
Mind Map: Bond Trading Overview
Mind Map: Auction Process Flow
Example Scenario: Choosing Between Auction and Secondary Market
Scenario: A portfolio manager wants to add government bonds to the portfolio.
-
Option 1: Auction
- Pros: Buy at issuance price, potentially better yields.
- Cons: Competitive bidding risk, timing constraints.
-
Option 2: Secondary Market
- Pros: Immediate availability, price flexibility.
- Cons: Potentially higher prices, bid-ask spreads.
Decision: If the manager can participate in a non-competitive auction and secure allocation, this may be preferable for cost efficiency. Otherwise, the secondary market offers flexibility to buy bonds anytime.
Summary
| Aspect | Auction (Primary Market) | Secondary Market |
|---|---|---|
| Purpose | Issuance of new bonds | Trading existing bonds |
| Participants | Issuers, institutional and retail investors | Investors, dealers, brokers |
| Pricing | Determined by bids during auction | Market-driven, fluctuates with supply/demand |
| Liquidity | Limited to issuance period | Continuous trading, higher liquidity |
| Best Practice Example | Use non-competitive bids to guarantee allocation | Use limit orders to manage trade execution |
Understanding these two trading venues enables finance professionals to optimize bond acquisition strategies, manage risks, and enhance portfolio performance.
5.4 Best Practices: Assessing Credit Risk with Practical Scenarios
Assessing credit risk is a fundamental skill for finance professionals and investment analysts, especially when dealing with fixed income instruments such as bonds and loans. Credit risk refers to the possibility that a borrower will default on their obligations, leading to financial loss for the lender or investor.
Key Steps in Assessing Credit Risk
- Analyze Borrower’s Financial Health: Review financial statements, cash flows, and profitability.
- Evaluate Credit Ratings: Use ratings from agencies like Moody’s, S&P, and Fitch as a benchmark.
- Consider Industry and Economic Environment: Understand sector-specific risks and macroeconomic factors.
- Assess Collateral and Covenants: Check for secured assets and protective clauses.
- Monitor Market Indicators: Credit spreads, bond yields, and CDS (Credit Default Swap) prices.
Mind Map: Credit Risk Assessment Framework
Practical Scenario 1: Evaluating a Corporate Bond Issuer
Background: You are considering investing in a 5-year corporate bond issued by XYZ Corp. The bond offers a 6% coupon rate, and the current market yield for similar bonds is 5.5%.
Step 1: Review Financial Health
- XYZ Corp’s latest financial statements show steady revenue growth but increasing debt levels.
- Interest coverage ratio (EBIT/Interest Expense) is 2.5, indicating moderate ability to service debt.
Step 2: Check Credit Ratings
- Moody’s rates XYZ Corp as Baa2 (investment grade but lower medium grade).
Step 3: Industry and Economic Environment
- XYZ operates in the automotive sector, currently facing supply chain disruptions.
Step 4: Collateral and Covenants
- The bond is unsecured with no special covenants.
Step 5: Market Indicators
- Credit spreads have widened recently due to sector uncertainty.
Assessment: Given the moderate interest coverage, unsecured status, and sector risks, the 6% coupon may be justified as compensation for credit risk. However, the widening spreads suggest increased market concern.
Best Practice Tip: Always compare issuer metrics against industry peers to contextualize risk.
Mind Map: Corporate Bond Credit Risk Example
Practical Scenario 2: Assessing Sovereign Credit Risk
Background: You are evaluating a 10-year government bond issued by Country A, which currently has a credit rating of BBB-.
Step 1: Economic Indicators
- GDP growth is slowing but remains positive.
- Government debt-to-GDP ratio is high at 90%.
Step 2: Political Stability
- Recent elections have introduced uncertainty regarding fiscal policy.
Step 3: External Factors
- Country A relies heavily on commodity exports, vulnerable to price swings.
Step 4: Market Indicators
- Bond yields have increased by 50 basis points in the last quarter.
Assessment: The slowing growth, high debt, and political uncertainty increase credit risk. The BBB- rating is at the lower end of investment grade, suggesting caution.
Best Practice Tip: Monitor sovereign credit risk continuously as political and economic conditions can change rapidly.
Mind Map: Sovereign Credit Risk Assessment
Practical Scenario 3: Using Credit Default Swaps (CDS) for Risk Insight
Background: You observe that the 5-year CDS spread for Company B has widened from 100 basis points to 200 basis points over three months.
Interpretation: The market perceives increased default risk for Company B.
Action: Investigate underlying causes such as deteriorating financials or sector issues before investing.
Best Practice Tip: Use CDS spreads as a real-time market sentiment indicator to complement fundamental analysis.
Summary of Best Practices
- Combine quantitative financial analysis with qualitative factors like industry trends and political environment.
- Use credit ratings as a starting point, not the sole determinant.
- Monitor market-based indicators such as credit spreads and CDS prices for timely insights.
- Compare issuers against peers to identify relative credit strength or weakness.
- Continuously update assessments as new information emerges.
By following these best practices and applying them to real-world scenarios, finance professionals can make more informed decisions and better manage credit risk exposure.
5.5 Example: Evaluating Investment-Grade vs High-Yield Bonds
When evaluating bonds, understanding the distinction between investment-grade and high-yield bonds is critical for making informed investment decisions. This section provides a detailed example, supported by mind maps and practical illustrations, to help finance professionals and investment analysts grasp the key differences and evaluation criteria.
What Are Investment-Grade and High-Yield Bonds?
- Investment-Grade Bonds: Bonds rated BBB- or higher by rating agencies like S&P or Baa3 or higher by Moody’s. These bonds have lower default risk and typically offer lower yields.
- High-Yield Bonds (Junk Bonds): Bonds rated below BBB- or Baa3, indicating higher default risk but offering higher yields to compensate investors.
Mind Map: Key Characteristics of Investment-Grade vs High-Yield Bonds
Example Scenario: Comparing Two Bonds
| Feature | Bond A (Investment-Grade) | Bond B (High-Yield) |
|---|---|---|
| Issuer | Large multinational corporation | Mid-sized technology startup |
| Credit Rating | AA (S&P) | BB (S&P) |
| Coupon Rate | 3.5% | 7.5% |
| Maturity | 10 years | 7 years |
| Yield to Maturity | 3.7% | 8.2% |
| Default Probability | 0.5% over 10 years | 5% over 7 years |
| Liquidity | High | Moderate |
Interpretation:
- Bond A offers lower yield but comes with significantly lower default risk and higher liquidity.
- Bond B offers a higher yield to compensate for increased credit risk and relatively lower liquidity.
Mind Map: Evaluation Factors for Bond Selection
Best Practices for Evaluating Bonds
- Analyze Credit Ratings and Reports: Use ratings as a starting point but review issuer financials and market conditions.
- Assess Yield in Context of Risk: Higher yields may compensate for higher risk but require careful due diligence.
- Consider Maturity and Interest Rate Environment: Longer maturities may increase interest rate risk.
- Evaluate Liquidity Needs: Investment-grade bonds generally offer better liquidity.
- Diversify Across Bond Types: Combining investment-grade and high-yield bonds can balance risk and return.
Practical Example: Portfolio Construction
An investment analyst is tasked with building a fixed income portfolio with a moderate risk profile. The portfolio includes:
- 70% Investment-Grade Bonds (average rating A)
- 30% High-Yield Bonds (average rating BB)
Rationale:
- The investment-grade portion provides stability and income with low default risk.
- The high-yield portion enhances overall portfolio yield but is limited to control risk exposure.
Outcome:
- Expected portfolio yield: ~5.0%
- Weighted average default probability: ~1.5%
This balanced approach exemplifies best practices in bond evaluation and portfolio construction.
Summary
Evaluating investment-grade versus high-yield bonds requires a comprehensive understanding of credit quality, yield, maturity, liquidity, and issuer characteristics. By combining these factors with real-world examples and structured evaluation frameworks, finance professionals can make informed decisions aligned with their risk tolerance and investment objectives.
6. Derivatives and Risk Management
6.1 Understanding Futures and Forwards: Mechanics and Uses
Introduction
Futures and forwards are fundamental derivative instruments widely used in financial markets for hedging, speculation, and arbitrage. Both contracts obligate the buyer and seller to transact an asset at a predetermined price on a future date, but they differ significantly in terms of standardization, trading venues, and settlement mechanisms.
Definitions
- Forward Contract: A customized, over-the-counter (OTC) agreement between two parties to buy or sell an asset at a specified price on a future date.
- Futures Contract: A standardized contract traded on an exchange to buy or sell an asset at a set price and date.
Key Differences Between Futures and Forwards
| Feature | Forward Contract | Futures Contract |
|---|---|---|
| Trading Venue | OTC (private negotiation) | Exchange-traded (e.g., CME, ICE) |
| Standardization | Customized terms (quantity, delivery) | Standardized contract specifications |
| Counterparty Risk | Higher (no clearinghouse) | Lower (clearinghouse guarantees trade) |
| Settlement | Usually at maturity (physical or cash) | Daily mark-to-market with margining |
| Liquidity | Generally less liquid | Highly liquid |
Mechanics of Forward Contracts
- Customization: Parties negotiate asset type, quantity, price, and delivery date.
- Settlement: Typically settled at maturity by physical delivery or cash settlement.
- Counterparty Risk: Since forwards are OTC, there is a risk that one party defaults.
Example:
A wheat farmer and a bread manufacturer enter a forward contract where the farmer agrees to sell 10,000 bushels of wheat at $5.00 per bushel in six months. This locks in the price for both parties, protecting the farmer from price drops and the manufacturer from price rises.
Mechanics of Futures Contracts
- Standardization: Contracts specify asset type, quantity, quality, delivery location, and delivery month.
- Trading: Conducted on regulated exchanges with transparent pricing.
- Margining: Traders post initial margin and are subject to daily mark-to-market adjustments.
- Settlement: Can be physical delivery or cash settlement depending on the contract.
Example:
An investor buys one gold futures contract (100 troy ounces) at $1,800 per ounce expiring in three months on the COMEX exchange. The investor must maintain margin and settle gains or losses daily until contract expiration or offset the position before delivery.
Mind Map: Futures vs Forwards Overview
Uses of Futures and Forwards
- Hedging: Protecting against price fluctuations.
- Example: Airlines hedge jet fuel prices using futures to stabilize costs.
- Speculation: Taking positions to profit from price movements.
- Example: A trader anticipates oil prices will rise and buys oil futures to gain exposure.
- Arbitrage: Exploiting price differences between markets.
- Example: Simultaneously buying a forward contract in one market and selling a futures contract in another to lock in riskless profit.
Mind Map: Uses of Futures and Forwards
Practical Example: Hedging with Futures
Scenario: A coffee exporter expects to receive 100,000 pounds of coffee beans in 3 months. Concerned about price declines, the exporter sells coffee futures contracts today to lock in the current price.
- If prices fall, losses on the physical coffee are offset by gains on the futures position.
- If prices rise, the exporter loses on the futures but gains on the physical sale.
This strategy stabilizes revenue and reduces uncertainty.
Practical Example: Forward Contract in Currency Hedging
Scenario: A US-based company expects to receive €1 million in 6 months. To avoid currency risk from EUR/USD fluctuations, it enters a forward contract to sell €1 million at a fixed rate.
- Locks in the USD amount to be received.
- Protects against adverse currency movements.
Summary
- Futures and forwards are essential tools for managing financial risk.
- Futures offer liquidity and reduced counterparty risk through exchange trading and margining.
- Forwards provide customization but carry higher counterparty risk.
- Both instruments serve hedging, speculation, and arbitrage purposes effectively.
Understanding the mechanics and appropriate use cases of these contracts is critical for finance professionals and investment analysts to optimize portfolio risk and return.
Further Reading
- Hull, J. C. (2018). Options, Futures, and Other Derivatives.
- CME Group Education Center: Futures Fundamentals
- Investopedia: Forward Contract and Futures Contract
6.2 Options Basics: Calls, Puts, and Strategies
Options are versatile financial derivatives that give the holder the right, but not the obligation, to buy or sell an underlying asset at a predetermined price before or at a specified expiration date. Understanding the fundamentals of calls, puts, and common strategies is essential for finance professionals and investment analysts to effectively incorporate options into portfolios for hedging, income generation, or speculation.
What is an Option?
- Call Option: Gives the buyer the right to buy the underlying asset at the strike price.
- Put Option: Gives the buyer the right to sell the underlying asset at the strike price.
Key Terms
- Underlying Asset: The security on which the option is based (e.g., stock, index, commodity).
- Strike Price: The price at which the option can be exercised.
- Expiration Date: The last date the option can be exercised.
- Premium: The price paid to purchase the option.
Mind Map: Basic Option Types
Call Options Explained
- Example: Suppose Stock XYZ is trading at $50.
- You buy a call option with a strike price of $55, expiring in one month, paying a premium of $2.
- If at expiration, XYZ is trading at $60, you can exercise the option to buy at $55 and immediately sell at $60, making a profit (ignoring fees) of $3 per share ($5 gain - $2 premium).
- If XYZ stays below $55, the option expires worthless, and your loss is limited to the premium paid ($2).
Put Options Explained
- Example: Stock ABC is trading at $40.
- You buy a put option with a strike price of $38, expiring in one month, paying a premium of $1.50.
- If at expiration, ABC is trading at $30, you can sell at $38, making a profit of $6.50 per share ($8 gain - $1.50 premium).
- If ABC stays above $38, the option expires worthless, and your loss is limited to the premium paid ($1.50).
Mind Map: Profit/Loss Profiles
Common Options Strategies
Covered Call
- Description: Own the underlying stock and sell call options on it.
- Purpose: Generate income from premiums while holding the stock.
- Example: Own 100 shares of XYZ at $50, sell 1 call option with a $55 strike for $2 premium.
- Best Practice: Use when expecting neutral to moderately bullish market.
Protective Put
- Description: Own the underlying stock and buy put options.
- Purpose: Hedge downside risk.
- Example: Own 100 shares of ABC at $40, buy 1 put option with a $38 strike for $1.50 premium.
- Best Practice: Use when wanting downside protection during uncertain markets.
Long Straddle
- Description: Buy a call and a put at the same strike price and expiration.
- Purpose: Profit from large moves in either direction.
- Example: Buy call and put options on XYZ at $50 strike, paying $3 and $2 premiums respectively.
- Best Practice: Use before earnings announcements or major events.
Bull Call Spread
- Description: Buy a call at a lower strike and sell a call at a higher strike.
- Purpose: Limit cost and potential profit in a moderately bullish market.
- Example: Buy call at $50 strike for $4, sell call at $55 strike for $2.
- Best Practice: Use to reduce premium outlay while maintaining upside potential.
Mind Map: Options Strategies Overview
Practical Example: Using a Protective Put
Imagine you hold 100 shares of DEF stock currently trading at $100. You are concerned about a potential short-term decline but want to keep your shares.
- Buy 1 put option with a $95 strike price, expiring in 1 month, paying a premium of $3.
- If DEF falls to $85, you can exercise the put and sell at $95, limiting your loss.
- If DEF rises above $100, your shares appreciate, and the put expires worthless.
This strategy acts like insurance, limiting downside risk while allowing upside participation.
Best Practices for Trading Options
- Understand the Greeks: Delta, Gamma, Theta, Vega, and Rho help measure risk and potential reward.
- Start Small: Use options on a small portion of your portfolio initially.
- Use Defined-Risk Strategies: Spreads and protective puts limit potential losses.
- Monitor Expiration Dates: Options lose value over time (time decay).
- Stay Informed: Market events can drastically affect option prices.
Summary
Options provide powerful tools for hedging, income, and speculation. Calls and puts form the foundation, while strategies like covered calls, protective puts, and spreads allow tailored risk-reward profiles. By combining theoretical knowledge with practical examples and mind maps, finance professionals can confidently integrate options into their investment toolkit.
6.3 Swaps: Interest Rate, Currency, and Commodity Swaps
Swaps are derivative contracts through which two parties exchange financial instruments, typically cash flows, based on specified terms. They are widely used for hedging, speculation, and managing exposures to various financial risks.
What is a Swap?
- A swap is a bilateral agreement to exchange cash flows or financial instruments over a set period.
- Commonly used to manage interest rate risk, currency risk, or commodity price risk.
Types of Swaps
Interest Rate Swaps (IRS)
-
Definition: Exchange of interest payments between two parties, typically swapping fixed rate payments for floating rate payments or vice versa.
-
Purpose: Manage exposure to fluctuations in interest rates.
-
Example: A company with a floating rate loan wants to lock in fixed interest payments to reduce uncertainty.
-
Mind Map:
-
Example in Practice:
Company X has a $10 million loan with a floating rate of LIBOR + 1%. To stabilize interest expenses, it enters into an IRS to pay fixed 4.5% and receive floating LIBOR + 1%. This swap effectively converts its floating rate loan into a fixed rate loan.
Currency Swaps
-
Definition: Exchange of principal and interest payments in one currency for principal and interest payments in another currency.
-
Purpose: Manage foreign exchange risk and access cheaper funding in foreign currencies.
-
Mind Map:
-
Example in Practice:
A US company needs euros to fund a European subsidiary, while a European company needs US dollars. They agree to a currency swap where the US company pays EUR principal and interest to the European company, and receives USD principal and interest in return. This allows both to access cheaper funding and hedge currency risk.
Commodity Swaps
-
Definition: Exchange of cash flows related to commodity prices, typically swapping a fixed price for a floating market price.
-
Purpose: Manage exposure to commodity price volatility.
-
Mind Map:
-
Example in Practice:
An airline company concerned about rising jet fuel prices enters into a commodity swap with a financial institution. The airline agrees to pay a fixed price per barrel, while receiving payments based on the floating market price. This arrangement stabilizes fuel costs.
Best Practices for Using Swaps
- Understand the underlying exposure: Identify the risk (interest rate, currency, commodity) you want to hedge.
- Match swap terms to exposure: Ensure notional amounts, payment dates, and currencies align with the underlying exposure.
- Counterparty risk management: Evaluate the creditworthiness of the swap counterparty.
- Regulatory compliance: Follow relevant regulations and reporting requirements.
- Use clear documentation: ISDA Master Agreements are standard for swaps.
Summary Mind Map of Swaps
Swaps are powerful tools for managing financial risks across interest rates, currencies, and commodities. Through clear understanding and prudent application, finance professionals can use swaps to stabilize cash flows, reduce volatility, and optimize financing costs.
6.4 Best Practices: Using Derivatives for Hedging and Speculation with Case Examples
Derivatives are powerful financial instruments that allow market participants to manage risk (hedging) or seek profit opportunities (speculation). Understanding best practices in using derivatives is essential for finance professionals and investment analysts to optimize portfolio performance while controlling exposure.
Key Concepts in Using Derivatives
- Hedging: Reducing or eliminating risk exposure to adverse price movements.
- Speculation: Taking on risk with the expectation of profiting from price changes.
- Leverage: Derivatives often require a smaller upfront investment, amplifying gains and losses.
- Margin Requirements: Understanding collateral and margin calls is critical.
Mind Map: Using Derivatives for Hedging and Speculation
Best Practices Explained with Examples
Understand the Underlying Asset and Market Conditions
Before entering a derivative contract, thoroughly analyze the underlying asset’s price behavior, volatility, and market fundamentals.
Example: A commodity trader hedging crude oil exposure should monitor geopolitical events, OPEC announcements, and inventory reports to time futures contracts effectively.
Define Clear Objectives: Hedging vs Speculation
Clarify whether the goal is to protect existing positions or to profit from anticipated price movements.
Example: A multinational corporation uses currency forwards to hedge foreign exchange risk on expected euro receivables, while a hedge fund might buy call options on the euro expecting appreciation.
Use Appropriate Instruments and Strategies
Select derivatives that best fit the risk profile and investment horizon.
- Hedging: Protective puts, forward contracts, interest rate swaps.
- Speculation: Buying calls/puts, futures contracts, option spreads.
Example: An investor holding a large equity position buys protective put options to limit downside risk without selling the shares.
Manage Leverage and Margin Requirements
Leverage can magnify losses; maintain sufficient margin and monitor positions to avoid forced liquidations.
Example: A trader using futures contracts sets aside margin and uses stop-loss orders to prevent excessive losses during volatile markets.
Monitor and Adjust Positions Regularly
Market conditions change; adjust hedges or speculative positions accordingly.
Example: A portfolio manager rolling over expiring futures contracts to maintain continuous hedging exposure.
Case Examples
Case 1: Hedging Currency Risk with Forward Contracts
Scenario: A US-based company expects to receive €5 million in 6 months. To avoid currency risk from EUR/USD fluctuations, it enters a forward contract to sell €5 million at a fixed rate.
Best Practice Applied: The company clearly defines its risk exposure and uses a forward contract to lock in the exchange rate, eliminating uncertainty.
Outcome: Regardless of EUR/USD movements, the company knows the exact USD amount it will receive.
Case 2: Speculating on Interest Rate Movements Using Interest Rate Futures
Scenario: An investment analyst expects interest rates to rise in the next quarter. They sell Treasury futures contracts to profit from the anticipated price decline of bonds.
Best Practice Applied: The analyst uses futures to gain leveraged exposure to interest rate movements without buying bonds.
Outcome: If rates rise, bond prices fall, and the short futures position gains value, generating profit.
Case 3: Using Options for Hedging Equity Portfolio
Scenario: An investor holds 1,000 shares of a technology stock but fears short-term volatility. They purchase put options with a strike price near the current market price.
Best Practice Applied: Protective puts act as insurance, limiting downside while allowing upside participation.
Outcome: If the stock price falls, the put options increase in value, offsetting losses. If the stock rises, the investor benefits minus the cost of the options.
Summary
Using derivatives effectively requires a deep understanding of the instruments, clear objectives, and disciplined risk management. By following these best practices and learning from real-world examples, finance professionals can harness derivatives to enhance portfolio resilience and capitalize on market opportunities.
6.5 Example: Hedging Currency Risk in International Portfolios
Introduction
When investing internationally, currency risk (also known as exchange rate risk) arises because the value of foreign investments can be affected by fluctuations in exchange rates. Hedging currency risk is a fundamental practice to protect portfolio returns from adverse currency movements.
What is Currency Risk?
Currency risk occurs when the value of a foreign currency fluctuates relative to the investor’s home currency, impacting the portfolio’s overall value.
Why Hedge Currency Risk?
- Protect returns: Avoid losses due to unfavorable currency movements.
- Reduce volatility: Stabilize portfolio value.
- Align with investment goals: Match currency exposure with investment horizon and risk tolerance.
Common Hedging Instruments
- Forward Contracts
- Currency Futures
- Currency Options
- Currency Swaps
Mind Map: Currency Risk Hedging Overview
Example Scenario: Hedging EUR/USD Exposure
Investor Profile:
- US-based investor holds €1,000,000 in European equities.
- Concerned about EUR/USD depreciation (EUR weakening vs USD).
Risk:
- If EUR/USD falls from 1.10 to 1.00, the USD value of the investment drops from $1,100,000 to $1,000,000.
Hedging Approach:
- Use a forward contract to sell €1,000,000 at a fixed rate of 1.10 in 3 months.
Outcome:
- Regardless of EUR/USD spot rate in 3 months, investor receives $1,100,000.
Mind Map: Forward Contract Hedging Process
Partial Hedging Example
Instead of hedging the full €1,000,000, the investor hedges 50% (€500,000).
- If EUR depreciates, losses on unhedged portion partially offset by gains on hedged portion.
- If EUR appreciates, investor benefits from unhedged exposure but sacrifices some gains on hedged portion.
Mind Map: Partial Hedging Strategy
Dynamic Hedging
Adjust hedge ratios over time based on market conditions, portfolio performance, and currency outlook.
Example: Currency Options for Hedging
Investor buys EUR put options to sell €1,000,000 at strike price 1.10 USD/EUR.
- If EUR/USD falls below 1.10, investor exercises option, limiting losses.
- If EUR/USD rises, investor lets option expire and benefits from appreciation.
Cost: Premium paid for options.
Mind Map: Currency Options Hedging
Best Practices for Hedging Currency Risk
- Assess exposure carefully: Quantify currency risk accurately.
- Choose appropriate instruments: Match hedging tools to portfolio size and risk tolerance.
- Consider costs: Hedging can reduce returns; weigh benefits vs costs.
- Monitor and adjust: Currency markets are dynamic; update hedges as needed.
- Integrate with overall portfolio strategy: Currency hedging should complement asset allocation and risk management.
Summary
Hedging currency risk is essential for international portfolios to protect against adverse exchange rate movements. Using instruments like forwards, futures, and options, investors can tailor their hedging strategies—full, partial, or dynamic—to balance risk and cost effectively.
Additional Resources
- Investopedia: Currency Risk
- CFA Institute: Currency Management Best Practices
- Bloomberg: FX Hedging Strategies
7. Foreign Exchange Markets
7.1 Structure of the Forex Market: Participants and Trading Hours
The foreign exchange (Forex) market is the largest and most liquid financial market in the world, with a daily trading volume exceeding $6 trillion as of recent estimates. Unlike centralized exchanges such as the NYSE or NASDAQ, the Forex market operates as a decentralized over-the-counter (OTC) market, where currencies are traded directly between participants globally.
Key Characteristics of the Forex Market
- Decentralized Market: No single physical location; trading occurs electronically across global financial centers.
- 24-Hour Trading: Opens Sunday evening (GMT) and closes Friday evening (GMT), enabling continuous trading.
- High Liquidity: Major currency pairs enjoy tight spreads and high volume.
- Participants: Diverse range from central banks to retail traders.
Participants in the Forex Market
The Forex market is composed of various participants, each playing a unique role in market functioning and liquidity provision.
-
Commercial Banks and Investment Banks
- Act as primary liquidity providers.
- Facilitate currency transactions for clients and proprietary trading.
- Example: JPMorgan Chase executing large FX orders for multinational clients.
-
Central Banks
- Influence currency value through monetary policy and interventions.
- Example: The Federal Reserve adjusting interest rates impacting USD strength.
-
Corporations
- Engage in Forex to hedge currency risk from international trade.
- Example: A European company hedging USD payments for imported goods.
-
Hedge Funds and Speculators
- Aim to profit from currency fluctuations.
- Employ strategies ranging from short-term scalping to long-term trend following.
-
Retail Traders
- Individual investors trading through brokers using margin accounts.
- Example: A retail trader speculating on EUR/USD movements using a trading platform.
-
Brokers and Market Makers
- Provide access to the Forex market for retail and institutional clients.
- Market makers quote bid and ask prices, ensuring liquidity.
-
Electronic Communication Networks (ECNs)
- Platforms that match buy and sell orders electronically.
- Provide transparent pricing and direct market access.
Forex Trading Hours
The Forex market operates 24 hours a day during weekdays, divided into four major trading sessions based on the world’s financial centers:
-
Sydney Session (Asia-Pacific)
- Opens the trading week on Sunday 10 PM GMT.
- Lower liquidity but important for AUD and NZD pairs.
-
Tokyo Session (Asia)
- Overlaps with Sydney session.
- Active trading in JPY pairs.
-
London Session (Europe)
- Highest liquidity and volatility.
- Overlaps with Tokyo and New York sessions, creating peak trading periods.
-
New York Session (North America)
- Second most liquid session.
- Overlaps with London session, often leading to increased volatility.
Example: Trading During Session Overlaps
- The overlap between London and New York sessions (1 PM to 5 PM GMT) is considered the most liquid and volatile period.
- Example: A trader focusing on EUR/USD might place trades during this overlap to benefit from tighter spreads and larger price movements.
Best Practice Example: Aligning Trading Strategy with Market Hours
- A retail trader specializing in JPY pairs may focus on the Tokyo session (12 AM to 9 AM GMT) to capitalize on higher liquidity and predictable volatility.
- Conversely, a trader interested in GBP/USD might prioritize the London-New York overlap for optimal trading conditions.
Summary Mind Map
Understanding the structure of the Forex market, its participants, and trading hours is fundamental for finance professionals and investment analysts to develop effective trading strategies, manage risk, and optimize execution timing.
7.2 Spot, Forward, and Swap Transactions
Understanding the different types of foreign exchange transactions is fundamental for finance professionals and investment analysts dealing with currency markets. This section explores Spot, Forward, and Swap transactions in detail, illustrating their mechanics, use cases, and best practices through clear examples and mind maps.
Spot Transactions
Definition: A spot transaction is the purchase or sale of a foreign currency for immediate delivery, typically settled within two business days.
Key Characteristics:
- Settlement usually occurs T+2 (trade date plus two days).
- Exchange rate agreed upon at the time of the trade is called the spot rate.
- Used for immediate currency needs.
Mind Map: Spot Transaction
Example: A US-based company needs to pay a supplier in Europe €1,000,000 in two days. They enter a spot transaction to buy €1,000,000 at the current spot rate of 1.10 USD/EUR, agreeing to pay $1,100,000 in two days.
Forward Transactions
Definition: A forward transaction is an agreement to buy or sell a currency at a predetermined rate on a specified future date beyond the spot settlement period.
Key Characteristics:
- Customized contracts between two parties.
- Settlement date can be days, months, or years ahead.
- Forward rate is derived from the spot rate adjusted for interest rate differentials.
- Used to hedge against future currency risk.
Mind Map: Forward Transaction
Example: A UK importer expects to pay USD 500,000 in 3 months. To avoid currency risk, they enter a forward contract to buy USD 500,000 at a forward rate of 1.30 GBP/USD, locking in GBP 384,615 regardless of market fluctuations.
Swap Transactions
Definition: A currency swap is a simultaneous purchase and sale of identical amounts of one currency for another with two different value dates (typically spot and forward).
Key Characteristics:
- Combines a spot transaction and a forward transaction.
- Used for liquidity management and hedging.
- Helps manage short-term currency needs without exposure to exchange rate risk.
Mind Map: Swap Transaction
Example: A multinational corporation needs EUR 2 million today but will receive USD 2.2 million in 6 months. They enter a currency swap: buy EUR 2 million spot and agree to sell EUR 2 million forward in 6 months at a predetermined rate, effectively borrowing EUR now and repaying later without currency risk.
Best Practices for Managing FX Transactions
- Assess your exposure: Understand your currency needs and timing.
- Use forwards for hedging: Lock in rates to avoid adverse movements.
- Consider swaps for liquidity: Manage short-term currency needs efficiently.
- Monitor counterparty risk: Use reputable counterparties or clearinghouses.
- Document transactions: Maintain clear records for compliance and audit.
Summary Mind Map: FX Transaction Types
By mastering spot, forward, and swap transactions, finance professionals can effectively manage currency risk, optimize liquidity, and enhance portfolio performance in global markets.
7.3 Currency Pairs and Quoting Conventions
Understanding currency pairs and quoting conventions is fundamental for anyone involved in forex trading or international finance. This section breaks down the concepts with clear explanations, mind maps, and practical examples.
What is a Currency Pair?
A currency pair represents the quotation of one currency against another. It shows how much of the quote currency is needed to purchase one unit of the base currency.
- Base Currency: The first currency in the pair.
- Quote Currency: The second currency in the pair.
Example:
- EUR/USD = 1.1200 means 1 Euro (EUR) costs 1.1200 US Dollars (USD).
Types of Currency Pairs
Currency pairs are generally categorized into three types:
- Major Pairs: Most traded pairs involving USD.
- Minor Pairs (Crosses): Pairs without USD but involving major currencies.
- Exotic Pairs: Pairs involving a major currency and a developing economy currency.
Quoting Conventions
Forex quotes can be presented in two main ways:
- Direct Quote: Domestic currency as the quote currency.
- Indirect Quote: Domestic currency as the base currency.
For example, if you are in the US:
- Direct quote for EUR/USD is 1.1200 (USD is quote currency).
- Indirect quote for USD/JPY is 110.00 (USD is base currency).
Bid and Ask Prices
- Bid Price: Price at which the market is willing to buy the base currency.
- Ask Price: Price at which the market is willing to sell the base currency.
Example:
EUR/USD 1.1198/1.1200 means:
- Bid: 1.1198 USD per 1 EUR
- Ask: 1.1200 USD per 1 EUR
Understanding Pips and Pipettes
- Pip: The smallest price move in a currency pair, usually the fourth decimal place (0.0001).
- Pipette: One-tenth of a pip, the fifth decimal place (0.00001).
Example:
If EUR/USD moves from 1.1200 to 1.1205, it has moved 5 pips.
Mind Map: Quoting Conventions and Key Concepts
Practical Examples
- Example 1: Understanding a Quote
- Quote: GBP/USD = 1.3500/1.3502
- Interpretation:
- You can sell 1 GBP for 1.3500 USD (Bid)
- You can buy 1 GBP for 1.3502 USD (Ask)
- Spread = 0.0002 or 2 pips
- Example 2: Calculating Profit/Loss in Pips
- You buy EUR/USD at 1.1200.
- You sell at 1.1250.
- Profit = 1.1250 - 1.1200 = 0.0050 = 50 pips.
- Example 3: Exotic Pair Quote
- USD/TRY = 8.4500/8.4550
- Higher spread due to lower liquidity.
Best Practices
- Always check whether the currency pair is quoted in direct or indirect terms relative to your domestic currency.
- Pay attention to the spread as it affects trading costs.
- Understand pip values for accurate profit and loss calculations.
- Be aware that exotic pairs tend to have wider spreads and higher volatility.
Summary
Understanding currency pairs and quoting conventions is essential for accurate interpretation of forex prices and effective trading decisions. Using the mind maps and examples above, finance professionals can better navigate the complexities of forex markets with confidence.
7.4 Best Practices: Managing Forex Exposure with Practical Examples
Managing foreign exchange (forex) exposure is crucial for finance professionals and investment analysts who deal with international portfolios or transactions. Forex exposure arises when the value of assets, liabilities, or cash flows is affected by fluctuations in currency exchange rates. Effective management helps mitigate risks and protect portfolio value.
Key Types of Forex Exposure
Best Practices for Managing Forex Exposure
Identify and Measure Exposure
- Example: A US-based company expecting a €1 million payment in 3 months should quantify potential USD/EUR rate fluctuations.
- Use sensitivity analysis and scenario planning to estimate impact.
Use Hedging Instruments
- Forward Contracts: Lock in exchange rates for future transactions.
- Options: Provide the right, but not obligation, to exchange at a set rate.
- Currency Swaps: Exchange principal and interest payments in different currencies.
Diversify Currency Exposure
- Avoid concentration in a single foreign currency.
- Example: An investment portfolio diversified across USD, EUR, JPY, and GBP reduces risk from any one currency’s volatility.
Natural Hedging
- Match foreign currency revenues with expenses in the same currency.
- Example: A multinational firm sourcing materials in the same currency as sales revenue reduces net exposure.
Monitor and Adjust Regularly
- Continuously track currency movements and adjust hedging strategies accordingly.
- Example: Rebalancing hedges quarterly based on updated forecasts.
Practical Example: Managing Forex Exposure for an Importer
Scenario: A US importer expects to pay ¥100 million in 6 months for goods from Japan.
- Risk: USD/JPY exchange rate may increase, making payment more expensive in USD.
Step 1: Identify Exposure
- Transaction exposure of ¥100 million payable.
Step 2: Choose Hedging Strategy
- Enter a forward contract to buy ¥100 million at a fixed USD/JPY rate in 6 months.
Step 3: Execute and Monitor
- Lock in the rate, eliminating uncertainty.
- Monitor market in case of opportunities to adjust hedge.
Outcome: The importer avoids unexpected cost increases due to yen appreciation.
Practical Example: Hedging Currency Risk in an Investment Portfolio
Scenario: An investment analyst manages a portfolio with 30% European equities denominated in EUR.
- Risk: EUR/USD depreciation reduces USD value of European holdings.
Step 1: Quantify Exposure
- Calculate EUR-denominated asset value and potential USD impact.
Step 2: Implement Hedging
- Use EUR/USD futures contracts to offset potential losses.
Step 3: Monitor and Adjust
- Regularly review hedge effectiveness and adjust futures positions.
Outcome: Portfolio volatility due to currency movements is reduced, stabilizing returns.
Summary Mind Map of Best Practices
By integrating these best practices with practical examples, finance professionals can effectively manage forex exposure, minimizing risks and optimizing portfolio performance in the dynamic global currency markets.
7.5 Example: Impact of Central Bank Announcements on Currency Movements
Central bank announcements are among the most influential events in the foreign exchange (Forex) market. These announcements can cause significant volatility and rapid price movements in currency pairs. Understanding how to interpret and anticipate the impact of these announcements is a crucial skill for finance professionals and investment analysts.
What Are Central Bank Announcements?
Central banks, such as the Federal Reserve (Fed), European Central Bank (ECB), Bank of England (BoE), and Bank of Japan (BoJ), regularly release statements and decisions regarding monetary policy. These include:
- Interest rate decisions
- Quantitative easing (QE) or tightening
- Economic outlook and inflation forecasts
- Forward guidance on future policy
Why Do Central Bank Announcements Affect Currency Movements?
Currencies reflect the relative economic health and interest rate differentials between countries. Central bank policies directly influence these factors, affecting demand for a currency.
- Interest Rate Changes: Higher rates typically attract foreign capital, increasing demand for the currency.
- Monetary Policy Tone: Hawkish (tightening) tones strengthen the currency; dovish (easing) tones weaken it.
- Economic Outlook: Positive outlooks boost confidence and currency value.
Mind Map: Central Bank Announcements and Currency Impact
Example 1: Federal Reserve Interest Rate Hike
Scenario: The Federal Reserve announces a 0.25% interest rate hike, signaling confidence in economic growth.
Market Reaction:
- USD strengthens against major currencies like EUR and JPY.
- EUR/USD falls as the dollar appreciates.
Explanation: Higher US interest rates attract investors seeking better yields, increasing demand for USD.
Mind Map:
Example 2: ECB Dovish Forward Guidance
Scenario: ECB signals continued low interest rates and potential asset purchases due to inflation concerns.
Market Reaction:
- Euro weakens against the US dollar.
- EUR/USD rises less or falls.
Explanation: Dovish tone suggests prolonged easy monetary policy, reducing Euro attractiveness.
Mind Map:
Example 3: Surprise Rate Cut by Bank of England
Scenario: The BoE unexpectedly cuts interest rates by 0.5% amid economic uncertainty.
Market Reaction:
- GBP sharply depreciates against USD and EUR.
- GBP/USD falls significantly.
Explanation: Surprise easing signals economic weakness, reducing GBP demand.
Mind Map:
Best Practices for Trading Around Central Bank Announcements
- Monitor Economic Calendars: Always know the timing of announcements.
- Assess Market Expectations: Compare actual announcements to consensus forecasts.
- Use Limit and Stop Orders: Protect against volatility spikes.
- Avoid Overleveraging: Volatility can cause rapid losses.
- Analyze Historical Reactions: Study past announcement impacts on specific currency pairs.
Summary Mind Map: Trading Central Bank Announcements
By integrating an understanding of central bank announcements with practical examples and mind maps, finance professionals and investment analysts can better anticipate currency movements and manage trading risks effectively.
8. Trading Fundamentals and Strategies
8.1 Technical Analysis: Chart Patterns, Indicators, and Tools
Technical analysis is a method used by traders and investment analysts to evaluate securities and make trading decisions by analyzing statistical trends gathered from trading activity, such as price movement and volume. Unlike fundamental analysis, which looks at a company’s financials, technical analysis focuses on price charts and market data to forecast future price movements.
Key Concepts in Technical Analysis
- Price Trends: The general direction in which a security’s price moves.
- Support and Resistance: Price levels where a stock tends to stop and reverse.
- Volume: The number of shares or contracts traded in a security or market during a given period.
Mind Map: Overview of Technical Analysis
Chart Patterns
Chart patterns are specific formations created by the movement of security prices on a chart and are the foundation of technical analysis. They help traders identify potential market reversals or continuation of trends.
Reversal Patterns
-
Head and Shoulders: Indicates a reversal from bullish to bearish trend.
- Example: A stock trading at $50 forms a peak (left shoulder), then a higher peak ($55, head), followed by a lower peak ($52, right shoulder). When the price breaks below the neckline ($48), it signals a potential downtrend.
-
Double Top/Bottom: Two peaks or troughs at roughly the same price level signaling a reversal.
- Example: A stock hits $60 twice but fails to break higher, then drops below support at $58, signaling a bearish reversal.
Continuation Patterns
-
Flags and Pennants: Small consolidations that indicate the trend will continue.
- Example: After a strong upward move from $40 to $50, the price consolidates in a small downward sloping channel (flag) before breaking out upward.
-
Triangles: Can be ascending, descending, or symmetrical, often signaling continuation.
- Example: An ascending triangle with a flat resistance at $30 and rising support suggests a breakout above $30 is likely.
Mind Map: Common Chart Patterns
Technical Indicators
Indicators are mathematical calculations based on price, volume, or open interest, used to forecast market direction.
Trend Indicators
-
Moving Averages (MA): Smooth out price data to identify trend direction.
- Example: A 50-day MA crossing above the 200-day MA (Golden Cross) is a bullish signal.
-
MACD: Shows the relationship between two moving averages.
- Example: When the MACD line crosses above the signal line, it indicates a buy signal.
Momentum Indicators
-
Relative Strength Index (RSI): Measures speed and change of price movements; values above 70 indicate overbought, below 30 oversold.
- Example: RSI hitting 80 on a rally might suggest a pullback is imminent.
-
Stochastic Oscillator: Compares a security’s closing price to its price range over a period.
- Example: A stochastic value crossing below 80 from above signals a potential sell.
Volume Indicators
-
On-Balance Volume (OBV): Uses volume flow to predict price changes.
- Example: Rising OBV with rising prices confirms an uptrend.
-
Volume Moving Average: Helps smooth volume data to identify trends.
Mind Map: Technical Indicators
Tools for Technical Analysis
-
Candlestick Charts: Show open, high, low, and close prices; patterns like Doji, Hammer, and Engulfing provide insights.
- Example: A Hammer candlestick after a downtrend can signal a bullish reversal.
-
Fibonacci Retracements: Identify potential support and resistance levels based on Fibonacci ratios (23.6%, 38.2%, 50%, 61.8%).
- Example: After a price rally from $100 to $150, a retracement to $130 (38.2%) might be a buying opportunity.
-
Charting Software: Platforms like TradingView, MetaTrader, and Bloomberg Terminal provide tools for drawing, indicators, and backtesting.
Best Practices for Using Technical Analysis
- Combine multiple indicators and patterns to confirm signals rather than relying on one.
- Always consider volume to validate price movements.
- Use stop-loss orders based on technical levels to manage risk.
- Backtest strategies on historical data before applying them live.
Example: Developing a Simple Moving Average Crossover Strategy
- Strategy: Buy when the 50-day MA crosses above the 200-day MA (Golden Cross), sell when it crosses below (Death Cross).
- Example: Stock XYZ’s 50-day MA crosses above the 200-day MA on March 1st; an analyst buys at $100. On September 15th, the 50-day MA crosses below the 200-day MA; the analyst sells at $130, capturing a 30% gain.
Summary
Technical analysis is a powerful tool for finance professionals and investment analysts to understand market behavior and make informed trading decisions. By mastering chart patterns, indicators, and tools, and applying best practices with real-world examples, traders can enhance their ability to anticipate market moves and manage risk effectively.
8.2 Fundamental Analysis: Financial Statements and Economic Indicators
Fundamental analysis is a cornerstone technique used by finance professionals and investment analysts to evaluate the intrinsic value of a security. It involves examining both microeconomic factors, such as a company’s financial health, and macroeconomic factors, such as economic indicators, to make informed investment decisions.
Understanding Financial Statements
Financial statements provide a quantitative overview of a company’s financial performance and position. The three primary financial statements are:
- Income Statement (Profit & Loss Statement)
- Balance Sheet
- Cash Flow Statement
Mind Map: Components of Financial Statements
Example: Analyzing a Company’s Income Statement
Consider Company ABC’s income statement for the fiscal year:
| Item | Amount (USD millions) |
|---|---|
| Revenue | 500 |
| Cost of Goods Sold | 300 |
| Gross Profit | 200 |
| Operating Expenses | 100 |
| Operating Income | 100 |
| Interest Expense | 10 |
| Taxes | 27 |
| Net Income | 63 |
Best Practice: Calculate key profitability ratios such as Gross Margin (Gross Profit / Revenue = 40%) and Net Profit Margin (Net Income / Revenue = 12.6%) to assess operational efficiency.
Key Financial Ratios Derived from Statements
- Liquidity Ratios: Current Ratio, Quick Ratio
- Profitability Ratios: Return on Assets (ROA), Return on Equity (ROE)
- Leverage Ratios: Debt-to-Equity Ratio
- Efficiency Ratios: Inventory Turnover, Receivables Turnover
Mind Map: Financial Ratios and Their Uses
Example: Using ROE to Evaluate Performance
If Company ABC has a net income of $63 million and shareholders’ equity of $315 million, then:
ROE = Net Income / Shareholders’ Equity = 63 / 315 = 20%
A 20% ROE indicates strong profitability relative to equity.
Economic Indicators and Their Role in Fundamental Analysis
Economic indicators provide insight into the overall economic environment, influencing market trends and investment decisions.
Categories of Economic Indicators:
- Leading Indicators: Predict future economic activity (e.g., stock market returns, new orders for durable goods)
- Lagging Indicators: Confirm trends after they occur (e.g., unemployment rate, corporate profits)
- Coincident Indicators: Occur simultaneously with economic changes (e.g., GDP, industrial production)
Mind Map: Economic Indicators
Example: Interpreting GDP Growth
If a country’s GDP grows at 3% annually, it signals economic expansion, which can boost corporate earnings and stock prices. Conversely, a contraction may indicate recession risks.
Integrating Financial Statements and Economic Indicators
A comprehensive fundamental analysis combines company-specific data with macroeconomic context.
Best Practice: Cross-Referencing
- Use economic indicators to gauge sector or market conditions.
- Analyze financial statements to identify companies well-positioned to benefit or withstand economic cycles.
Example: Investing in Consumer Goods During Economic Expansion
During periods of rising GDP and consumer confidence, companies in the consumer discretionary sector often see revenue growth. An analyst might select firms with strong balance sheets and improving profit margins to capitalize on this trend.
Summary
Fundamental analysis requires a detailed understanding of financial statements and economic indicators. By mastering these tools and applying best practices, finance professionals can make well-informed investment decisions.
Additional Example: Evaluating a Retail Company Using Fundamental Analysis
- Review Income Statement: Check revenue growth and profit margins.
- Examine Balance Sheet: Assess liquidity and debt levels.
- Analyze Cash Flow: Ensure positive operating cash flow.
- Consider Economic Indicators: Monitor consumer confidence and unemployment rates.
- Make Decision: Invest if the company shows strong fundamentals and the economic environment is favorable.
This integrated approach helps mitigate risks and identify opportunities effectively.
8.3 Algorithmic and High-Frequency Trading: Concepts and Implications
Algorithmic Trading (Algo Trading) and High-Frequency Trading (HFT) have revolutionized the landscape of financial markets by leveraging technology to execute trades at speeds and volumes impossible for human traders. This section explores the core concepts, operational mechanisms, benefits, risks, and real-world implications of these trading methodologies.
What is Algorithmic Trading?
Algorithmic Trading refers to the use of computer algorithms to automate the process of trading financial instruments. These algorithms follow predefined rules based on timing, price, quantity, or other mathematical models to execute orders efficiently.
Key Characteristics:
- Automated decision-making
- Predefined trading strategies
- Speed and accuracy
What is High-Frequency Trading?
High-Frequency Trading is a subset of algorithmic trading characterized by extremely high speeds, high order-to-trade ratios, and very short holding periods. HFT firms often use co-location services to place their servers physically close to exchange servers to minimize latency.
Key Characteristics:
- Millisecond or microsecond order execution
- Large volumes of orders
- Exploiting very short-term market inefficiencies
Mind Map: Overview of Algorithmic and High-Frequency Trading
Core Algorithmic Trading Strategies with Examples
-
Trend Following
- Strategy: Buy when prices are rising, sell when falling.
- Example: A moving average crossover algorithm that buys when the 50-day moving average crosses above the 200-day moving average.
-
Arbitrage
- Strategy: Exploit price differences of the same asset across markets.
- Example: Buying a stock on one exchange where it is undervalued and simultaneously selling it on another where it is overvalued.
-
Mean Reversion
- Strategy: Assume prices will revert to their historical average.
- Example: If a stock price deviates significantly from its average, the algorithm sells or buys expecting a return to the mean.
-
Market Making
- Strategy: Provide liquidity by simultaneously posting buy and sell orders.
- Example: An algorithm continuously quotes bid and ask prices to capture the bid-ask spread.
Mind Map: Algorithmic Trading Strategies
Technologies Enabling HFT
- Co-location: Placing trading servers physically close to exchange data centers to reduce latency.
- Low Latency Networks: Optimized communication protocols and fiber optic cables.
- Hardware Acceleration: Use of Field Programmable Gate Arrays (FPGAs) and Application-Specific Integrated Circuits (ASICs) for ultra-fast processing.
Mind Map: Technologies in High-Frequency Trading
Implications of Algorithmic and High-Frequency Trading
Benefits:
- Improved Liquidity: Increased market participation and tighter bid-ask spreads.
- Reduced Transaction Costs: Automation reduces manual intervention and errors.
- Faster Price Discovery: Rapid incorporation of information into prices.
Risks:
- Market Manipulation: Practices like quote stuffing or layering can distort markets.
- Flash Crashes: Sudden, severe market drops triggered or exacerbated by HFT algorithms.
- Systemic Risk: Algorithmic errors can cascade, affecting broader markets.
Example: The Flash Crash of May 6, 2010
On May 6, 2010, the U.S. stock market experienced a rapid and severe drop within minutes, wiping out nearly $1 trillion in market value before rebounding. Investigations revealed that HFT algorithms contributed to exacerbating the crash by rapidly withdrawing liquidity and amplifying selling pressure.
Lesson: This event highlighted the importance of circuit breakers, risk controls, and regulatory oversight in algorithmic trading.
Best Practices for Finance Professionals and Investment Analysts
- Understand Algorithmic Logic: Familiarize yourself with common algorithms and their market impact.
- Monitor Market Conditions: Be aware of periods of high volatility where algo trading can amplify moves.
- Use Risk Controls: Implement stop-losses and circuit breakers to manage algorithmic risk.
- Regulatory Compliance: Stay updated on evolving regulations affecting algorithmic and HFT activities.
Summary
Algorithmic and High-Frequency Trading represent a powerful evolution in financial markets, combining speed, technology, and complex strategies to optimize trade execution. While they offer significant benefits in liquidity and efficiency, they also introduce new risks and challenges that require careful management and regulatory oversight.
Understanding these concepts and their implications is essential for finance professionals and investment analysts to navigate modern capital markets effectively.
8.4 Best Practices: Combining Technical and Fundamental Analysis for Trade Decisions
Combining technical and fundamental analysis is a powerful approach that allows finance professionals and investment analysts to make well-rounded trade decisions. While fundamental analysis helps assess the intrinsic value of an asset based on economic and financial factors, technical analysis focuses on price movements and market sentiment. Integrating both methods can improve timing, risk management, and overall trade success.
Why Combine Technical and Fundamental Analysis?
- Fundamental analysis provides the “why” behind price movements — it evaluates company earnings, macroeconomic indicators, industry trends, and news.
- Technical analysis provides the “when” — it identifies entry and exit points based on price patterns, volume, and momentum.
- Together, they offer a comprehensive view, reducing the risk of relying solely on one method.
Mind Map: Combining Technical and Fundamental Analysis
Step-by-Step Best Practices
-
Start with Fundamental Screening
- Identify assets with strong fundamentals: positive earnings growth, healthy balance sheets, favorable industry outlook.
- Example: A technology company reporting consistent revenue growth and expanding market share.
-
Apply Technical Analysis for Timing
- Use charts to find optimal entry points, such as a breakout above resistance or a moving average crossover.
- Example: The same tech stock forms a bullish flag pattern and breaks above its 50-day moving average.
-
Validate Trade with Volume and Momentum Indicators
- Confirm that price moves are supported by increasing volume and positive momentum (e.g., RSI above 50).
- Example: Volume spikes during the breakout, and RSI moves from 45 to 65, indicating strength.
-
Set Stop-Loss and Take-Profit Levels Based on Technical Levels
- Use support levels or recent swing lows to define stop-loss.
- Set take-profit near resistance or based on risk-reward ratio.
- Example: Stop-loss placed just below the breakout point; take-profit set at previous high.
-
Monitor Fundamental News Continuously
- Stay alert for earnings announcements, regulatory changes, or macroeconomic shifts that could impact the trade.
- Adjust or exit positions if fundamentals deteriorate.
-
Review and Adjust Based on Market Conditions
- Use trailing stops or scale out of positions as technical indicators signal weakening momentum.
Example: Combining Analyses for a Trade Decision
Scenario: An investment analyst is evaluating a pharmaceutical company (PharmaCo).
- Fundamental Analysis: PharmaCo just announced FDA approval for a new drug, expected to boost revenues by 20% next year. Earnings estimates have been revised upward.
- Technical Analysis: The stock has been consolidating sideways but recently broke above a key resistance level at $50 with strong volume.
- Decision: Analyst enters a long position at $51, placing a stop-loss at $48 (below previous resistance turned support).
- Outcome: The stock rallies to $60 over the next two months. Analyst monitors quarterly earnings and adjusts stop-loss to lock in profits.
Mind Map: Trade Decision Workflow
Additional Tips
- Avoid over-reliance on either method; fundamentals can indicate value but may not predict short-term price moves.
- Use fundamental analysis to filter out weak candidates before applying technical setups.
- Be aware of market sentiment and macroeconomic environment as they can override both analyses.
- Practice disciplined risk management regardless of analysis type.
By weaving fundamental insights with technical signals, finance professionals can enhance their trade decision-making process, improving both entry timing and confidence in their positions.
8.5 Example: Developing a Simple Moving Average Crossover Strategy
Introduction
A Simple Moving Average (SMA) Crossover strategy is one of the most popular and straightforward trading strategies used by finance professionals and investment analysts to identify potential buy and sell signals based on trend direction. This example will walk through the development of an SMA crossover strategy, illustrating best practices and providing clear examples.
What is a Simple Moving Average (SMA)?
- The SMA is the arithmetic mean of a given set of prices over a specific number of periods.
- It smooths out price data to identify the direction of the trend.
Formula: \[ SMA = \frac{P_1 + P_2 + … + P_n}{n} \] where \(P_i\) is the price at period \(i\) and \(n\) is the number of periods.
Concept of SMA Crossover Strategy
- Uses two SMAs: a short-term SMA and a long-term SMA.
- Buy Signal: When the short-term SMA crosses above the long-term SMA (Golden Cross).
- Sell Signal: When the short-term SMA crosses below the long-term SMA (Death Cross).
Mind Map: SMA Crossover Strategy Components
Step-by-Step Development
-
Select Timeframes for SMAs
- Short-term SMA: 50 days (captures recent price movements)
- Long-term SMA: 200 days (captures overall trend)
-
Calculate SMAs
- Compute the 50-day SMA and 200-day SMA for the stock price series.
-
Generate Trading Signals
- Buy when 50-day SMA crosses above 200-day SMA.
- Sell when 50-day SMA crosses below 200-day SMA.
-
Implement Risk Management
- Set stop-loss orders (e.g., 5% below entry price).
- Define position size based on risk tolerance.
-
Backtest Strategy
- Apply the strategy on historical data.
- Evaluate performance metrics.
Example: Applying SMA Crossover on Stock XYZ
| Date | Close Price | 50-day SMA | 200-day SMA | Signal |
|---|---|---|---|---|
| 2023-01-01 | 100 | - | - | - |
| … | … | … | … | … |
| 2023-03-15 | 110 | 105 | 108 | Buy (Golden Cross) |
| 2023-06-20 | 115 | 112 | 113 | Hold |
| 2023-09-10 | 108 | 110 | 111 | Sell (Death Cross) |
Interpretation:
- On 2023-03-15, the 50-day SMA crossed above the 200-day SMA, signaling a buy.
- The position was held until 2023-09-10 when the 50-day SMA crossed below the 200-day SMA, signaling a sell.
Mind Map: Example Walkthrough
Best Practices
- Avoid Whipsaws: Combine SMA crossover with volume confirmation or other indicators (e.g., RSI).
- Backtest Thoroughly: Use diverse market conditions to validate strategy robustness.
- Risk Controls: Always use stop-loss and position sizing to manage downside risk.
- Adapt Timeframes: Customize SMA periods based on asset volatility and trading horizon.
Additional Example: Enhancing SMA Crossover with RSI Filter
- Only take buy signals when RSI is above 50 (indicating bullish momentum).
- Avoid sell signals if RSI is below 30 (oversold conditions).
This reduces false signals and improves trade quality.
Summary
The SMA Crossover strategy is a foundational approach to trend-following trading. By combining simple moving averages with disciplined risk management and additional filters, finance professionals can develop effective and easy-to-understand trading systems.
References & Tools
- Python libraries: pandas, matplotlib for SMA calculation and visualization.
- Platforms: TradingView for charting and strategy backtesting.
9. Regulatory Environment and Compliance
9.1 Overview of Financial Market Regulations Globally
Financial market regulations are essential frameworks established by governments and regulatory bodies worldwide to ensure transparency, fairness, and stability within capital markets. These regulations protect investors, maintain market integrity, and reduce systemic risk.
Key Objectives of Financial Market Regulations
- Investor Protection: Safeguarding investors from fraud, manipulation, and unfair practices.
- Market Integrity: Ensuring transparent and fair trading environments.
- Systemic Stability: Preventing financial crises by managing systemic risks.
- Transparency: Mandating disclosure of relevant financial information.
- Efficiency: Promoting efficient capital allocation and market functioning.
Global Regulatory Landscape Mind Map
Examples of Regulatory Frameworks and Their Impact
-
United States – Dodd-Frank Act (2010)
- Enacted after the 2008 financial crisis to increase transparency and reduce risks in the financial system.
- Introduced stricter oversight on derivatives trading and established the Consumer Financial Protection Bureau (CFPB).
- Example: The Volcker Rule restricts proprietary trading by banks to limit risky behavior.
-
European Union – MiFID II (2018)
- Enhances transparency and investor protection across EU capital markets.
- Regulates algorithmic and high-frequency trading.
- Example: Requires pre- and post-trade transparency for equity and non-equity instruments, improving price discovery.
-
Japan – Financial Instruments and Exchange Act
- Regulates securities and derivatives markets.
- Emphasizes investor protection and fair disclosure.
- Example: Requires registration of financial instruments business operators to ensure compliance.
Mind Map: Core Components of Financial Market Regulations
Best Practice Example: Navigating Cross-Border Compliance
A multinational investment firm operating in both the US and EU must comply with both SEC regulations and MiFID II requirements. For instance, when executing trades on European venues, the firm must ensure adherence to MiFID II’s transparency rules, while also fulfilling SEC’s reporting obligations for US clients.
This requires integrated compliance systems and continuous monitoring of regulatory updates to avoid penalties and maintain operational integrity.
Summary
Understanding the global regulatory environment is crucial for finance professionals and investment analysts to navigate complex markets effectively. Regulations vary by jurisdiction but share common goals of protecting investors, ensuring market fairness, and maintaining systemic stability. Familiarity with key regulatory bodies, frameworks, and best practices enables market participants to operate confidently and compliantly across borders.
9.2 Key Regulatory Bodies: SEC, FINRA, FCA, ESMA, and Others
Financial markets operate within a framework governed by regulatory bodies that ensure transparency, fairness, and investor protection. Understanding these key regulators is essential for finance professionals and investment analysts to navigate compliance requirements and market conduct effectively.
Securities and Exchange Commission (SEC) - United States
- Role: Oversees securities markets, protects investors, maintains fair and efficient markets.
- Scope: Public companies, securities exchanges, brokers, investment advisors.
- Key Functions:
- Enforces securities laws.
- Regulates public company disclosures.
- Oversees mutual funds and ETFs.
Example: The SEC’s enforcement action against insider trading cases ensures market integrity by penalizing those who trade on non-public information.
Financial Industry Regulatory Authority (FINRA) - United States
- Role: Self-regulatory organization overseeing brokerage firms and exchange markets.
- Scope: Broker-dealers, registered representatives.
- Key Functions:
- Licensing and registration.
- Market surveillance.
- Dispute resolution through arbitration.
Example: FINRA’s BrokerCheck tool allows investors to verify the credentials and disciplinary history of brokers, promoting transparency.
Financial Conduct Authority (FCA) - United Kingdom
- Role: Regulates financial firms to protect consumers, enhance market integrity.
- Scope: Banks, insurers, investment firms, and markets in the UK.
- Key Functions:
- Authorizes firms and individuals.
- Supervises conduct and prudential standards.
- Enforces compliance and takes disciplinary actions.
Example: FCA’s intervention in the LIBOR manipulation scandal highlighted its role in maintaining benchmark integrity.
European Securities and Markets Authority (ESMA) - European Union
- Role: Enhances investor protection and promotes stable, orderly financial markets across the EU.
- Scope: National regulators, financial markets, and participants within EU member states.
- Key Functions:
- Develops regulatory technical standards.
- Supervises credit rating agencies and trade repositories.
- Coordinates enforcement actions among national regulators.
Example: ESMA’s regulation of MiFID II implementation harmonized trading rules across EU markets, improving transparency.
Other Notable Regulatory Bodies
| Regulatory Body | Region | Key Focus |
|---|---|---|
| Commodity Futures Trading Commission (CFTC) | USA | Derivatives and futures markets |
| Prudential Regulation Authority (PRA) | UK | Prudential regulation of banks and insurers |
| Australian Securities and Investments Commission (ASIC) | Australia | Corporate, markets, and financial services regulation |
| Monetary Authority of Singapore (MAS) | Singapore | Financial sector regulation and supervision |
Example: The CFTC’s oversight of derivatives markets helped prevent excessive speculation that contributed to the 2008 financial crisis.
Mind Maps
Mind Map 1: Overview of Key Regulatory Bodies
Mind Map 2: Functions of Regulatory Bodies
Mind Map 3: Example - SEC Enforcement Process
Integrated Best Practice Example
Scenario: An investment analyst working with US equities must ensure compliance with SEC and FINRA regulations.
- Step 1: Verify broker credentials using FINRA’s BrokerCheck.
- Step 2: Review SEC filings (10-K, 10-Q) for transparency and disclosures.
- Step 3: Monitor trading activity for suspicious patterns that may violate SEC rules.
- Step 4: Stay updated on FCA and ESMA regulations if dealing with cross-border investments.
This integrated approach ensures adherence to multiple regulatory frameworks, reducing compliance risk and enhancing investor confidence.
Understanding these regulatory bodies and their functions equips finance professionals with the knowledge to operate within legal frameworks, anticipate regulatory changes, and implement best practices that safeguard market integrity and investor interests.
9.3 Compliance Best Practices: Anti-Money Laundering (AML) and Know Your Customer (KYC)
In the complex world of financial markets, compliance with Anti-Money Laundering (AML) and Know Your Customer (KYC) regulations is paramount. These frameworks are designed to prevent illicit activities such as money laundering, terrorist financing, and fraud, thereby protecting the integrity of financial institutions and markets.
Understanding AML and KYC
- AML (Anti-Money Laundering): A set of laws, regulations, and procedures intended to stop criminals from disguising illegally obtained funds as legitimate income.
- KYC (Know Your Customer): The process of verifying the identity of clients to assess and monitor risk.
Mind Map: Core Components of AML and KYC
Best Practices for AML and KYC Compliance
-
Robust Customer Identification Program (CIP):
- Collect government-issued IDs, proof of address, and other relevant documents.
- Example: A brokerage firm requires a passport and utility bill before onboarding a new client.
-
Risk-Based Customer Due Diligence (CDD):
- Assess customer risk profile based on factors like geography, occupation, and transaction behavior.
- Example: Clients from high-risk jurisdictions undergo additional scrutiny.
-
Enhanced Due Diligence (EDD) for High-Risk Clients:
- Conduct deeper investigations for Politically Exposed Persons (PEPs) or clients with complex ownership structures.
- Example: A hedge fund performs background checks and monitors transactions more closely for a PEP client.
-
Continuous Transaction Monitoring:
- Use automated systems to flag unusual or suspicious transactions.
- Example: A sudden large transfer inconsistent with a client’s profile triggers an alert for manual review.
-
Timely Suspicious Activity Reporting (SAR):
- Report suspicious transactions to relevant authorities within stipulated timeframes.
- Example: A bank files a SAR after detecting structuring activity designed to evade reporting thresholds.
-
Comprehensive Record Keeping:
- Maintain detailed records of customer information, transaction history, and compliance actions.
- Example: Retaining KYC documents and transaction logs for at least five years.
-
Regular Employee Training:
- Conduct ongoing training programs to keep staff updated on AML/KYC regulations and red flags.
- Example: Quarterly workshops on emerging money laundering typologies.
Mind Map: AML Transaction Monitoring Workflow
Practical Example: Implementing AML/KYC in an Investment Firm
Scenario: An investment firm is onboarding a new client who is a foreign national with complex ownership in multiple companies.
- Step 1: Collect identity documents (passport, proof of address).
- Step 2: Conduct CDD by assessing risk factors such as country of origin and source of funds.
- Step 3: Identify the client as a PEP, triggering EDD.
- Step 4: Perform enhanced background checks, including adverse media screening.
- Step 5: Set up transaction monitoring rules tailored to the client’s profile.
- Step 6: Monitor transactions continuously; flag any unusual activity.
- Step 7: If suspicious activity is detected, file a SAR with the financial intelligence unit (FIU).
This example illustrates how layered compliance processes work together to mitigate risks.
Common Red Flags in AML/KYC
- Frequent large cash deposits or withdrawals inconsistent with business profile.
- Transactions involving high-risk countries or jurisdictions.
- Use of multiple accounts to structure transactions below reporting thresholds.
- Reluctance or refusal to provide complete information or documentation.
- Complex ownership structures designed to obscure beneficial ownership.
Mind Map: Red Flags and Response Actions
Summary
Adhering to AML and KYC best practices is essential for financial professionals to safeguard their institutions and comply with regulatory mandates. By implementing comprehensive identification, due diligence, monitoring, and reporting frameworks — supported by continuous training and technology — firms can effectively mitigate financial crime risks.
Further Reading & Resources:
- Financial Action Task Force (FATF) Recommendations
- Basel Committee on Banking Supervision Guidelines
- Regulatory websites such as SEC, FINRA, FCA
9.4 Example: Navigating Regulatory Changes in Algorithmic Trading
Algorithmic trading (algo trading) has revolutionized financial markets by enabling high-speed, automated decision-making. However, regulatory bodies worldwide have introduced evolving rules to ensure market fairness, transparency, and stability. Navigating these regulatory changes is critical for trading firms and finance professionals.
Understanding Key Regulatory Changes Impacting Algorithmic Trading
Market Stability Measures
Regulators have introduced mechanisms like circuit breakers and order-to-trade ratios to prevent excessive volatility caused by algorithmic strategies.
Example:
- The U.S. Securities and Exchange Commission (SEC) enforces market-wide circuit breakers that halt trading if the S&P 500 index drops by a certain percentage within a trading day.
- Algo firms must program their systems to recognize these halts and suspend trading accordingly.
Best Practice: Implement real-time monitoring and automated pause functions in algorithms to comply with circuit breaker rules.
Transparency and Algorithm Registration
Many jurisdictions require firms to register their trading algorithms and provide detailed documentation.
Example:
- The European Union’s MiFID II mandates that firms submit descriptions of their algorithms to regulators.
Best Practice: Maintain comprehensive documentation of algorithm logic, parameters, and updates to streamline registration and audits.
Pre-Trade Risk Controls
Pre-trade controls prevent erroneous or excessive orders from entering the market.
Example:
- FINRA requires firms to implement pre-trade risk checks such as price collars, maximum order size limits, and order frequency limits.
Best Practice: Integrate risk control modules within trading systems to automatically validate orders before submission.
Reporting and Audit Trails
Regulators demand detailed logs of algorithmic trading activity for surveillance and investigation.
Example:
- The SEC’s Rule 613 requires broker-dealers to maintain audit trails of all orders and executions.
Best Practice: Utilize robust logging frameworks that capture timestamps, order parameters, and decision points for every trade.
Risk Management Features
Kill switches and real-time monitoring are mandated to quickly disable malfunctioning algorithms.
Example:
- The UK’s Financial Conduct Authority (FCA) requires firms to have effective kill switches to halt algorithmic trading in emergencies.
Best Practice: Design algorithms with built-in emergency stop functions and continuous health checks.
Mind Map: Practical Steps for Compliance
Illustrative Scenario: Adapting to MiFID II Algorithmic Trading Rules
Scenario: A European trading firm must adapt its existing algo trading platform to comply with MiFID II requirements effective from January 2018.
Steps Taken:
- Algorithm Registration: The firm documents all algorithms, including logic, parameters, and intended use cases, submitting them to the national regulator.
- Pre-Trade Controls: They implement order throttling and price limit checks to prevent erroneous orders.
- Kill Switch: A manual and automated kill switch is integrated to immediately halt trading if abnormal behavior is detected.
- Audit Trail Enhancement: The system is upgraded to log every decision point and order event with millisecond precision.
- Staff Training: Traders and compliance officers receive training on new regulatory requirements and system changes.
Outcome: The firm successfully passes regulatory audits and reduces operational risks associated with algorithmic trading.
Summary
Navigating regulatory changes in algorithmic trading requires a proactive approach combining technology upgrades, documentation, risk controls, and staff training. By embedding compliance into the design and operation of trading algorithms, firms can ensure adherence to evolving rules while maintaining competitive trading performance.
9.5 Case Study: Impact of MiFID II on European Capital Markets
Introduction
The Markets in Financial Instruments Directive II (MiFID II), implemented on January 3, 2018, represents one of the most significant regulatory overhauls in European capital markets. It aims to increase transparency, improve investor protection, and enhance market efficiency. This case study explores MiFID II’s impact on European capital markets, highlighting key changes, challenges, and best practices, supported by illustrative examples and mind maps.
Key Objectives of MiFID II
- Enhance transparency across trading venues
- Strengthen investor protection
- Improve market structure and competition
- Regulate algorithmic and high-frequency trading
- Increase reporting and disclosure requirements
Mind Map: MiFID II Core Components
Impact on Market Structure
Trading Venues and Dark Pools
MiFID II introduced new categories of trading venues such as Organized Trading Facilities (OTFs) alongside Regulated Markets (RMs) and Multilateral Trading Facilities (MTFs). It also imposed stricter rules on dark pools to curb opaque trading.
Example: A large asset manager previously executing large block trades in dark pools experienced reduced liquidity and increased costs due to volume caps and transparency requirements imposed on dark pools.
Increased Transparency
Pre-trade and post-trade transparency requirements were expanded to cover more asset classes, including bonds and derivatives.
Example: Bond market participants now receive real-time data on bid-ask spreads and executed trades, enabling better price discovery and reduced information asymmetry.
Investor Protection Enhancements
MiFID II strengthened rules around product governance, ensuring financial products are designed to meet the needs of specific target markets, and enhanced suitability assessments.
Example: A wealth management firm revamped its client onboarding process to include more detailed suitability assessments, reducing mis-selling risks.
Algorithmic and High-Frequency Trading Regulation
Firms engaging in algorithmic trading must register with regulators, implement risk controls, and maintain kill switches.
Example: A proprietary trading firm implemented real-time monitoring systems and automated kill switches to comply with MiFID II requirements, reducing the risk of erroneous trades.
Reporting and Best Execution
MiFID II mandates comprehensive transaction reporting and requires firms to demonstrate best execution for client orders.
Example: An investment bank enhanced its order management system to capture detailed execution data, enabling transparent reporting and compliance with best execution obligations.
Mind Map: MiFID II Impact on Stakeholders
Best Practices for Compliance and Adaptation
- Invest in Technology: Upgrade trading, reporting, and compliance systems to handle increased data and transparency requirements.
- Enhance Training: Educate staff on new rules, especially around investor protection and algorithmic trading.
- Review Product Governance: Align product design and distribution with MiFID II target market requirements.
- Engage with Regulators: Maintain open communication to stay ahead of regulatory expectations.
Summary
MiFID II has profoundly reshaped European capital markets by promoting transparency, investor protection, and market integrity. While it has increased operational complexity and costs for market participants, it has also fostered a more robust and fair trading environment.
Final Example: MiFID II in Action
A European asset manager, post-MiFID II, shifted part of its fixed income trading from dark pools to lit venues due to volume caps on dark trading. Although initially facing higher transaction costs, the manager benefited from improved price transparency and reduced information leakage, ultimately enhancing portfolio performance and client trust.
This case study underscores the importance of proactive adaptation and leveraging regulatory changes as opportunities to strengthen market practices and client relationships.
10. Risk Management in Trading and Investments
10.1 Types of Risks: Market, Credit, Liquidity, Operational, and Systemic
Financial markets are inherently exposed to various types of risks that can impact investment returns, trading outcomes, and overall financial stability. Understanding these risks is fundamental for finance professionals and investment analysts to manage portfolios effectively and implement robust risk management frameworks.
Mind Map: Overview of Financial Risks
Market Risk
Definition: Market risk is the risk of losses in positions arising from movements in market prices. It affects the value of investments due to fluctuations in equity prices, interest rates, foreign exchange rates, and commodity prices.
Subtypes:
- Equity Risk: Changes in stock prices.
- Interest Rate Risk: Changes in bond prices due to interest rate fluctuations.
- Currency Risk: Changes in foreign exchange rates.
- Commodity Risk: Price volatility in commodities like oil, gold, etc.
Example: An investment analyst holds a portfolio of technology stocks. A sudden market downturn triggered by negative earnings reports causes the equity prices to drop by 15%, leading to significant losses.
Best Practice: Use diversification and hedging strategies such as options or futures to mitigate market risk.
Mind Map: Market Risk Components
Credit Risk
Definition: Credit risk is the possibility that a borrower or counterparty will fail to meet their contractual obligations, resulting in financial loss.
Example: A bond investor purchases corporate bonds from a company with a BBB credit rating. If the company defaults on interest payments or principal repayment, the investor faces credit risk losses.
Best Practice: Assess credit ratings, conduct due diligence, and diversify credit exposures across issuers and sectors.
Mind Map: Credit Risk Factors
Liquidity Risk
Definition: Liquidity risk arises when an asset cannot be bought or sold quickly enough in the market to prevent or minimize a loss.
Example: An investment analyst tries to sell a large position in a thinly traded bond during a market stress period but finds few buyers, forcing a sale at a significant discount.
Best Practice: Maintain a portion of the portfolio in highly liquid assets and monitor market depth before executing large trades.
Mind Map: Liquidity Risk Aspects
Operational Risk
Definition: Operational risk is the risk of loss resulting from inadequate or failed internal processes, people, systems, or external events.
Example: A trading desk experiences a system outage during market hours, preventing order execution and causing missed trading opportunities and potential losses.
Best Practice: Implement strong internal controls, regular system testing, staff training, and disaster recovery plans.
Mind Map: Operational Risk Sources
Systemic Risk
Definition: Systemic risk is the risk of collapse of an entire financial system or market, triggered by the failure of a single entity or group of entities, leading to widespread instability.
Example: The 2008 global financial crisis was a systemic event triggered by the collapse of Lehman Brothers, which caused a domino effect impacting banks, markets, and economies worldwide.
Best Practice: Monitor interconnectedness of institutions, stress test portfolios for systemic shocks, and adhere to regulatory capital requirements.
Mind Map: Systemic Risk Characteristics
Summary Table of Risk Types and Examples
| Risk Type | Definition | Example | Mitigation Best Practice |
|---|---|---|---|
| Market Risk | Losses from market price fluctuations | Equity portfolio loss due to market downturn | Diversification, hedging with derivatives |
| Credit Risk | Counterparty failure to meet obligations | Corporate bond default | Credit analysis, diversification |
| Liquidity Risk | Inability to quickly buy/sell assets without loss | Selling illiquid bonds at a discount | Maintain liquid assets, monitor market depth |
| Operational Risk | Failures in processes, systems, or people | Trading system outage during market hours | Internal controls, system testing, staff training |
| Systemic Risk | Collapse of entire financial system | 2008 financial crisis triggered by Lehman Brothers collapse | Stress testing, regulatory compliance, monitoring interconnections |
By mastering these risk types and applying best practices with real-world examples, finance professionals and investment analysts can enhance portfolio resilience and safeguard against unexpected losses.
10.2 Risk Measurement Tools: VaR, Stress Testing, and Scenario Analysis
Understanding and quantifying risk is fundamental for finance professionals and investment analysts to protect portfolios and comply with regulatory requirements. This section delves into three pivotal risk measurement tools: Value at Risk (VaR), Stress Testing, and Scenario Analysis. Each tool provides unique insights into potential losses under varying market conditions.
Value at Risk (VaR)
Definition: VaR estimates the maximum expected loss over a specified time period at a given confidence level.
- Key Components:
- Time Horizon (e.g., 1 day, 10 days)
- Confidence Level (e.g., 95%, 99%)
- Portfolio or Asset Value
Types of VaR Calculation Methods:
- Historical Simulation: Uses actual historical returns to simulate potential losses.
- Variance-Covariance (Parametric): Assumes returns are normally distributed; uses mean and variance.
- Monte Carlo Simulation: Uses random sampling and statistical models to simulate a wide range of outcomes.
Mind Map: Value at Risk (VaR)
Example:
An investment analyst manages a portfolio worth $10 million. Using a 1-day 99% VaR calculated by Historical Simulation, the VaR is $200,000. This means there is a 1% chance the portfolio could lose more than $200,000 in one day.
Best Practice: Always complement VaR with other risk measures as VaR does not capture tail risk or extreme market events.
Stress Testing
Definition: Stress Testing evaluates portfolio resilience under extreme but plausible adverse market conditions.
- Purpose: Identify vulnerabilities and prepare for unlikely but impactful events.
- Types:
- Historical Stress Tests: Apply past crisis scenarios (e.g., 2008 financial crisis).
- Hypothetical Stress Tests: Construct custom adverse scenarios (e.g., sudden interest rate spike).
Mind Map: Stress Testing
Example:
A fixed income portfolio is stress tested against a scenario where interest rates rise by 200 basis points in one month. The test reveals a potential portfolio loss of 8%, highlighting sensitivity to rate changes.
Best Practice: Regularly update stress scenarios to reflect evolving market conditions and emerging risks.
Scenario Analysis
Definition: Scenario Analysis explores the impact of multiple hypothetical or historical events on portfolio value.
- Difference from Stress Testing: Scenario analysis can include both adverse and favorable conditions and often involves multiple variables changing simultaneously.
Steps in Scenario Analysis:
- Identify relevant scenarios (e.g., geopolitical crisis, economic recession).
- Quantify changes in risk factors (e.g., equity prices, interest rates, FX rates).
- Calculate portfolio impact.
- Interpret results for decision-making.
Mind Map: Scenario Analysis
Example:
An equity portfolio is analyzed under a scenario combining a 10% drop in global equity markets, a 15% depreciation of the USD, and a 50 basis point increase in interest rates. The combined effect results in a 12% portfolio loss, guiding the analyst to consider hedging strategies.
Best Practice: Use scenario analysis to complement VaR and stress testing, providing a broader perspective on portfolio risks.
Summary Table of Risk Measurement Tools
| Tool | Purpose | Strengths | Limitations | Example Use Case |
|---|---|---|---|---|
| Value at Risk | Estimate maximum expected loss at confidence level | Quantitative, widely used | Ignores tail risk, assumes normality | 1-day 99% VaR of $200,000 on $10M portfolio |
| Stress Testing | Assess impact of extreme adverse events | Tests resilience under crises | Scenario selection bias | Portfolio loss under 200 bps interest rate shock |
| Scenario Analysis | Evaluate impact of multiple hypothetical events | Flexible, multi-factor analysis | Complex, requires judgment | Combined market drop, FX depreciation, rate hike |
Integrating Risk Measurement Tools: A Practical Example
Case: A portfolio manager overseeing a diversified portfolio wants to understand potential losses and prepare for adverse events.
- Step 1: Calculate 10-day 95% VaR using Monte Carlo simulation — result: $500,000.
- Step 2: Conduct stress test simulating a 2008-style market crash — portfolio loss estimated at 20%.
- Step 3: Perform scenario analysis combining a geopolitical crisis, commodity price shock, and currency volatility — portfolio loss estimated at 15%.
Insight: While VaR provides a baseline risk estimate, stress testing and scenario analysis reveal vulnerabilities under extreme conditions, informing risk mitigation strategies such as diversification and hedging.
Conclusion
Risk measurement tools like VaR, Stress Testing, and Scenario Analysis are essential components of a robust risk management framework. By understanding their methodologies, strengths, and limitations, finance professionals can better anticipate potential losses and make informed decisions to safeguard investments.
10.3 Best Practices: Building Robust Risk Management Frameworks with Examples
Effective risk management is critical for finance professionals and investment analysts to safeguard portfolios, ensure regulatory compliance, and optimize returns. A robust risk management framework systematically identifies, measures, monitors, and mitigates risks across trading and investment activities.
Key Components of a Robust Risk Management Framework
Best Practice 1: Comprehensive Risk Identification
-
Example: A multi-asset portfolio manager conducts a quarterly risk identification workshop involving traders, risk officers, and compliance teams. They map out potential risks such as geopolitical events impacting currency exposure (Forex risk), counterparty default risk in OTC derivatives, and operational risks from system outages.
-
Tip: Use risk registers and heat maps to visualize and prioritize risks.
Best Practice 2: Quantitative Risk Measurement Techniques
-
Value at Risk (VaR): Measures the maximum expected loss over a given time frame at a certain confidence level.
- Example: An equity fund calculates daily VaR at 99% confidence to estimate potential losses under normal market conditions.
-
Stress Testing: Simulates extreme market scenarios.
- Example: Simulating a 30% market drop to assess portfolio resilience.
-
Scenario Analysis: Evaluates impact of specific hypothetical events.
- Example: Assessing portfolio impact if interest rates rise by 200 basis points.
Best Practice 3: Continuous Risk Monitoring and Reporting
-
Implement real-time risk dashboards integrating market data and portfolio positions.
- Example: A trading desk uses a dashboard that triggers alerts when risk limits are breached, such as excessive exposure to a single sector.
-
Regular risk reports to senior management ensure transparency and timely decision-making.
Best Practice 4: Effective Risk Mitigation Strategies
-
Hedging: Use derivatives to offset exposures.
- Example: An investment analyst hedges currency risk in an international equity portfolio using FX forwards.
-
Diversification: Spread investments across asset classes and geographies.
- Example: A portfolio combining equities, bonds, and commodities to reduce volatility.
-
Stop-Loss Orders: Automatically exit losing positions to limit downside.
- Example: A trader sets a stop-loss at 5% below purchase price to protect capital.
-
Capital Allocation: Allocate capital based on risk-adjusted returns.
Best Practice 5: Strong Governance and Compliance
-
Establish clear policies outlining risk appetite and limits.
-
Conduct periodic audits and compliance checks.
-
Train staff regularly on risk management protocols.
-
Example: A firm implements a three-lines-of-defense model involving operational teams, risk management, and internal audit.
Integrated Example: Building a Risk Management Framework for a Hedge Fund
-
Risk Identification: The fund identifies market risk from equity and bond holdings, credit risk from counterparties, and liquidity risk from less liquid assets.
-
Risk Measurement: Uses Monte Carlo VaR and stress tests simulating a 2008-style financial crisis.
-
Risk Monitoring: Implements a dashboard with real-time P&L and exposure metrics.
-
Risk Mitigation: Employs options to hedge downside risk and enforces stop-loss limits on positions.
-
Governance: Risk committee meets weekly to review reports and update policies.
By following these best practices, finance professionals can build resilient risk management frameworks that not only protect investments but also enable informed decision-making in dynamic markets.
10.4 Example: Using Stop-Loss Orders to Limit Downside Risk
Stop-loss orders are essential tools for managing downside risk in trading and investment portfolios. They automatically trigger a sale of a security when its price falls to a predetermined level, helping investors limit potential losses without needing to constantly monitor the market.
What is a Stop-Loss Order?
A stop-loss order is an instruction given to a broker to sell a security once it reaches a specified price, known as the stop price. Once the stop price is hit, the stop-loss order becomes a market order and is executed at the next available price.
Mind Map: Stop-Loss Orders Overview
Example 1: Basic Stop-Loss Order
Scenario:
- Investor buys 100 shares of XYZ Corp at $50 per share.
- To limit downside risk, the investor places a stop-loss order at $45.
Outcome:
- If XYZ’s price drops to $45, the stop-loss order triggers a market sell.
- This limits the investor’s loss to approximately $5 per share.
Best Practice:
- Set stop-loss levels based on technical support levels or a fixed percentage loss (e.g., 10%).
Mind Map: Setting a Stop-Loss Order
Example 2: Trailing Stop-Loss Order
Scenario:
- Investor buys 200 shares of ABC Inc. at $100.
- Sets a trailing stop-loss order with a 10% trail.
How it works:
- If ABC rises to $120, the trailing stop moves up to $108 (10% below $120).
- If the price then falls to $108, the stop-loss triggers and shares are sold.
Benefit:
- Locks in profits while allowing for upside potential.
Mind Map: Trailing Stop-Loss Mechanics
Example 3: Using Stop-Loss to Manage a Portfolio
Scenario:
- Portfolio contains multiple stocks.
- Investor sets stop-loss orders individually based on each stock’s volatility.
Approach:
- High volatility stocks: wider stop-loss (e.g., 15%) to avoid premature selling.
- Low volatility stocks: tighter stop-loss (e.g., 5-7%).
Result:
- Reduces overall portfolio drawdown during market downturns.
Mind Map: Portfolio-Level Stop-Loss Strategy
Important Considerations and Best Practices
- Avoid setting stops too tight: May cause frequent triggering due to normal price fluctuations.
- Use stop-loss orders as part of a broader risk management plan: Combine with position sizing and diversification.
- Be aware of market gaps: Stop-loss orders may execute at prices worse than the stop price in fast-moving markets.
- Regularly review and adjust stop levels: Reflect changes in market conditions or investment thesis.
Summary
Stop-loss orders are a practical and automated way to limit downside risk. By setting appropriate stop levels—whether fixed or trailing—investors can protect capital, maintain discipline, and reduce emotional decision-making during volatile market conditions.
For finance professionals and investment analysts, mastering stop-loss order placement and management is a fundamental skill that enhances portfolio resilience and trading effectiveness.
10.5 Case Study: Risk Failures and Lessons from the Flash Crash of 2010
Introduction
The Flash Crash of May 6, 2010, remains one of the most dramatic and instructive events in modern financial market history. Within minutes, major U.S. stock indices plunged and rebounded sharply, wiping out nearly $1 trillion in market value temporarily. This case study explores the risk management failures that contributed to the event and extracts key lessons for finance professionals.
Event Overview
- On May 6, 2010, between 2:32 pm and 2:45 pm EST, the Dow Jones Industrial Average (DJIA) dropped about 1,000 points (around 9%) and then quickly recovered.
- The sudden plunge was triggered by a large sell order executed by an automated algorithm, which overwhelmed liquidity.
- High-frequency trading (HFT) algorithms exacerbated the volatility by rapidly withdrawing liquidity.
Mind Map: Key Factors Leading to the Flash Crash
Risk Management Failures Explained
-
Algorithmic Trading Without Adequate Controls
- The large sell order was executed via an algorithm designed to minimize market impact but failed to account for rapidly declining liquidity.
- Example: The algorithm sold contracts at a fixed rate without adjusting for market conditions, leading to a liquidity vacuum.
-
Liquidity Fragmentation and Withdrawal
- Multiple trading venues caused liquidity to be spread thin.
- High-frequency traders, sensing volatility, pulled back, worsening the liquidity crisis.
-
Lack of Robust Circuit Breakers
- Some exchanges did not have effective trading halts or price limits.
- This allowed prices to spiral down unchecked for several minutes.
-
Inadequate Real-Time Risk Monitoring
- Market participants and regulators lacked tools to detect and intervene promptly.
Mind Map: Risk Management Lessons
Practical Example: Algorithmic Trading Risk Controls
Scenario: An investment firm deploys an algorithm to sell a large block of futures contracts.
- Without Controls: The algorithm executes at a fixed pace regardless of market liquidity, risking a liquidity crunch.
- With Controls: The algorithm monitors real-time order book depth and slows execution when liquidity dries up, reducing market impact.
This example illustrates the importance of adaptive algorithms that incorporate risk parameters to prevent exacerbating market stress.
Regulatory and Market Responses Post-Flash Crash
- Introduction of market-wide circuit breakers that halt trading if indices fall beyond set thresholds.
- Implementation of limit-up/limit-down rules to prevent trades outside specified price bands.
- Enhanced coordination among exchanges and regulators.
- Increased scrutiny and regulation of high-frequency trading practices.
Summary
The Flash Crash of 2010 exposed critical vulnerabilities in market structure and risk management practices. Key takeaways for finance professionals include:
- The necessity of adaptive, liquidity-aware trading algorithms.
- Importance of robust market-wide safeguards like circuit breakers.
- Continuous monitoring and stress testing of trading strategies and systems.
- Understanding the interplay between market structure and risk dynamics.
By integrating these lessons, investment analysts and finance professionals can better prepare for and mitigate risks associated with extreme market events.
11. Market Microstructure and Price Formation
11.1 Order Book Dynamics and Price Discovery
Introduction
The order book is a fundamental component of modern financial markets, serving as the mechanism through which buy and sell orders are organized and matched. Understanding order book dynamics is essential for finance professionals and investment analysts to grasp how prices are formed and how liquidity is provided.
What is an Order Book?
An order book is an electronic list of buy and sell orders for a specific financial instrument, organized by price level. It displays the quantity of shares or contracts available at each price point, enabling market participants to see the supply and demand at different prices.
- Bid side: Buy orders, showing prices buyers are willing to pay.
- Ask side (Offer): Sell orders, showing prices sellers are willing to accept.
Order Book Structure
- Spread: Difference between the best (highest) bid and best (lowest) ask price.
- Depth: The volume of orders at each price level beyond the best bid and ask.
- Liquidity: How easily an asset can be bought or sold without affecting its price.
Price Discovery Process
Price discovery is the mechanism through which the market determines the price of an asset based on supply and demand. The order book plays a vital role in this process by aggregating all outstanding orders.
- When a market buy order arrives, it is matched against the best available ask price.
- When a market sell order arrives, it is matched against the best available bid price.
- Limit orders add liquidity by resting in the order book until matched or canceled.
Example: Order Book Snapshot and Price Formation
Consider a simplified order book for stock XYZ:
| Bid Price | Bid Size | Ask Price | Ask Size |
|---|---|---|---|
| 100.00 | 500 | 100.05 | 300 |
| 99.95 | 400 | 100.10 | 600 |
| 99.90 | 700 | 100.15 | 200 |
- The best bid is 100.00 with 500 shares.
- The best ask is 100.05 with 300 shares.
- The spread is 5 cents.
If a market buy order for 200 shares arrives, it will execute at 100.05, reducing the ask size to 100 shares.
If a market sell order for 600 shares arrives, it will execute 500 shares at 100.00 and the remaining 100 shares at 99.95, moving the last traded price down.
Impact of Order Book Dynamics on Trading
- Liquidity provision: Limit orders provide liquidity; market orders consume it.
- Price impact: Large market orders can move prices by consuming multiple price levels.
- Volatility: Thin order books with low depth can lead to higher price volatility.
Best Practices for Traders Using Order Book Information
Example: A trader notices a large buy limit order at 99.90, indicating strong support. They may place a stop-loss just below this level to manage risk.
Conclusion
Understanding order book dynamics and the price discovery process enables finance professionals to make informed trading decisions, optimize order execution, and better anticipate market movements. By analyzing the order book, traders can gauge market sentiment, liquidity, and potential price levels.
Additional Example: Flash Crash and Order Book
During the 2010 Flash Crash, rapid withdrawal of liquidity from the order book caused extreme price swings. This event highlighted the importance of order book depth and the risks of liquidity evaporation.
Summary
- The order book organizes buy and sell orders by price.
- Price discovery is driven by the interaction of market and limit orders.
- Spread and depth are key indicators of market quality.
- Traders can use order book insights to improve execution and manage risk.
11.2 Bid-Ask Spread: Causes and Implications
Understanding the Bid-Ask Spread
The bid-ask spread is the difference between the highest price a buyer is willing to pay for an asset (the bid) and the lowest price a seller is willing to accept (the ask or offer). It is a fundamental concept in financial markets that reflects liquidity, transaction costs, and market efficiency.
Mind Map: Components of Bid-Ask Spread
Causes of Bid-Ask Spread
-
Liquidity
- Highly liquid assets (e.g., large-cap stocks) tend to have tighter spreads.
- Illiquid assets (e.g., small-cap stocks, certain bonds) have wider spreads due to fewer participants.
-
Volatility
- Increased price volatility raises uncertainty, causing market makers to widen spreads to compensate for risk.
-
Market Maker Costs and Risks
- Market makers provide liquidity but face inventory and adverse selection risks.
- To cover operational costs and potential losses, they widen the spread.
-
Information Asymmetry
- When some traders have better information, market makers protect themselves by increasing spreads.
-
Order Size and Type
- Larger orders may face wider spreads due to market impact.
Mind Map: Causes of Bid-Ask Spread
Implications of Bid-Ask Spread
- Transaction Costs: The spread represents an implicit cost to traders, especially for frequent trading.
- Market Liquidity Indicator: Narrow spreads imply high liquidity and efficient markets; wide spreads suggest illiquidity.
- Price Discovery: Spreads affect how quickly prices adjust to new information.
- Trading Strategy Impact: High spreads can erode profits, influencing order types and timing.
Example 1: Comparing Bid-Ask Spreads in Different Stocks
| Stock Symbol | Bid Price | Ask Price | Spread | Spread % |
|---|---|---|---|---|
| AAPL | $150.00 | $150.05 | $0.05 | 0.033% |
| XYZ SmallCap | $10.00 | $10.50 | $0.50 | 5.00% |
- Interpretation: Apple (AAPL), a highly liquid stock, has a very tight spread, minimizing trading costs.
- XYZ SmallCap, with lower liquidity, has a much wider spread, increasing transaction costs.
Example 2: Impact of Volatility on Bid-Ask Spread
- During a calm trading day, a stock trades with a bid-ask spread of $0.02.
- Following a major earnings announcement causing uncertainty, the spread widens to $0.10.
Reason: Market makers increase spreads to compensate for higher risk due to volatility.
Best Practices for Finance Professionals
- Monitor Spreads Before Trading: Always check the current spread to estimate transaction costs.
- Use Limit Orders in Wide Spread Markets: To avoid paying the full spread, place limit orders near the bid or ask.
- Consider Time of Day: Spreads tend to be narrower during peak trading hours.
- Analyze Spread Trends: Widening spreads can signal upcoming volatility or liquidity issues.
Mind Map: Best Practices Around Bid-Ask Spread
Summary
The bid-ask spread is a crucial indicator of market quality and trading costs. Understanding its causes—from liquidity to information asymmetry—and implications helps finance professionals optimize trading strategies and manage costs effectively.
11.3 Impact of Information Asymmetry on Market Efficiency
Information asymmetry occurs when one party in a transaction has more or better information than the other. This imbalance can significantly affect the efficiency of financial markets by distorting price discovery, increasing transaction costs, and potentially leading to market failures.
What is Information Asymmetry?
- Definition: A situation where different market participants have unequal access to relevant information.
- Types:
- Adverse Selection: Occurs before a transaction when one party cannot accurately assess the quality or risk of the asset.
- Moral Hazard: Happens after a transaction when one party changes behavior because they are insulated from risk.
How Information Asymmetry Affects Market Efficiency
- Price Distortion: Prices may not reflect true asset values if some participants have superior information.
- Reduced Liquidity: Investors may withdraw from markets where they feel disadvantaged, reducing trading volumes.
- Increased Volatility: Sudden information revelations can cause sharp price movements.
- Market Failure: In extreme cases, markets may collapse or become inefficient due to persistent asymmetry.
Mind Map: Impact of Information Asymmetry on Market Efficiency
Example 1: Insider Trading and Market Efficiency
Consider a scenario where a company executive knows about an upcoming merger that will significantly increase the stock price. If the executive buys shares before the information is public, they have an unfair advantage. Other investors, unaware of this information, trade at prices that do not reflect the true value, leading to price inefficiency.
Best Practice: Strict enforcement of insider trading regulations helps reduce information asymmetry and promotes fair price discovery.
Example 2: Earnings Announcements and Price Volatility
Before quarterly earnings are announced, some analysts may have better insights due to superior models or access to management. When the earnings report is released, the market rapidly adjusts prices to reflect the new information, often causing volatility.
Best Practice: Investors should be cautious around earnings announcements and consider using limit orders to manage execution price risk.
Mind Map: Mitigating Information Asymmetry
Example 3: Role of Credit Rating Agencies
Credit rating agencies provide assessments of bond issuers’ creditworthiness. If these ratings are accurate and timely, they reduce information asymmetry between issuers and investors, leading to more efficient pricing in the bond market.
However, conflicts of interest or delayed updates can exacerbate asymmetry, as seen during the 2008 financial crisis.
Best Practice: Investors should use ratings as one input among many and remain vigilant to potential biases.
Summary
Information asymmetry is a critical factor that can impair market efficiency by causing price distortions, reducing liquidity, and increasing volatility. Understanding its impact and employing best practices—such as regulatory compliance, transparency, and rigorous analysis—helps finance professionals navigate these challenges effectively.
11.4 Best Practices: Optimizing Trade Execution Using Market Microstructure Insights
Optimizing trade execution is critical for finance professionals and investment analysts aiming to minimize trading costs, reduce market impact, and improve overall portfolio performance. Market microstructure—the study of how orders are processed and how prices form in financial markets—provides valuable insights that can be leveraged to enhance execution strategies.
Key Concepts in Market Microstructure for Trade Execution
- Order Types and Their Impact: Market orders, limit orders, stop orders, and iceberg orders each affect execution price and timing differently.
- Order Book Dynamics: Understanding the depth and liquidity at various price levels helps in timing and sizing trades.
- Bid-Ask Spread: Narrow spreads reduce transaction costs; wide spreads indicate lower liquidity or higher volatility.
- Price Impact and Market Impact Costs: Large orders can move prices unfavorably; breaking orders into smaller sizes can mitigate this.
- Information Asymmetry: Awareness of how informed traders affect price movements can guide execution tactics.
Mind Map: Factors Influencing Trade Execution Optimization
Best Practices for Optimizing Trade Execution
-
Choose the Appropriate Order Type
- Use limit orders to control execution price and avoid paying the spread, especially in less liquid markets.
- Use market orders when immediacy is critical, but be aware of potential slippage.
- Example: Buying a large block of shares in a thinly traded stock with a limit order to avoid price spikes.
-
Analyze Order Book Depth and Liquidity
- Monitor the order book to identify where liquidity is concentrated.
- Break large orders into smaller chunks to execute at multiple price levels, reducing market impact.
- Example: Executing a $1 million bond purchase by slicing into smaller orders aligned with visible liquidity.
-
Consider Timing and Market Conditions
- Avoid trading during periods of high volatility or low liquidity (e.g., market open/close or news releases).
- Use historical data to identify optimal trading windows.
- Example: Scheduling trades during mid-day when spreads tend to be tighter and volume steadier.
-
Leverage Algorithmic Trading and Smart Order Routing
- Use algorithms that adapt to market conditions, such as VWAP (Volume Weighted Average Price) or TWAP (Time Weighted Average Price).
- Smart order routers can scan multiple venues to find the best prices and liquidity.
- Example: Using a VWAP algorithm to execute a large equity order over the trading day to minimize market impact.
-
Utilize Dark Pools and Alternative Trading Systems (ATS)
- For large orders, dark pools can provide anonymity and reduce signaling risk.
- Be cautious of potential price slippage and lack of transparency.
- Example: Executing a block trade in a dark pool to avoid moving the lit market price.
-
Monitor and Adjust Execution Strategies in Real-Time
- Continuously track execution performance metrics such as slippage, fill rates, and market impact.
- Adjust order size, type, or timing based on evolving market conditions.
- Example: Switching from a limit order to a market order if liquidity dries up unexpectedly.
Example Scenario: Optimizing Execution for a Large Equity Purchase
Context: An investment analyst needs to buy 100,000 shares of a mid-cap stock with average daily volume of 500,000 shares.
Challenges: Large order size relative to daily volume risks moving the price upward.
Execution Strategy:
- Break the order into smaller slices of 10,000 shares.
- Use a VWAP algorithm to spread execution evenly over the trading day.
- Place limit orders slightly inside the bid-ask spread to improve fill probability without paying full spread.
- Monitor order book depth and adjust order sizes dynamically.
- Avoid trading during the first 30 minutes and last 30 minutes of the trading day to reduce volatility risk.
Outcome: The strategy minimizes market impact, achieves an average execution price close to VWAP, and reduces transaction costs.
Mind Map: Execution Strategy Workflow
Summary
Optimizing trade execution through market microstructure insights involves a deep understanding of order types, liquidity, timing, and technology. By applying best practices such as order slicing, using appropriate algorithms, and continuously monitoring market conditions, finance professionals can significantly reduce trading costs and improve execution quality. Real-world examples demonstrate how these principles translate into tangible benefits in diverse trading scenarios.
11.5 Example: How Dark Pools Affect Price Transparency
Dark pools are private trading venues where large blocks of securities are traded anonymously, away from public exchanges. While they offer benefits such as reduced market impact and lower transaction costs for institutional investors, they also introduce challenges to price transparency and market efficiency.
What Are Dark Pools?
- Definition: Private forums for trading securities not accessible to the general public.
- Purpose: Allow large investors to execute big trades without revealing their intentions to the broader market.
Impact on Price Transparency
- Reduced Visibility: Trades executed in dark pools are not immediately reported to the public order book.
- Delayed Reporting: Trade details are often published with a delay, obscuring real-time price discovery.
- Fragmentation: Liquidity is split between lit exchanges and dark pools, complicating the true picture of supply and demand.
Mind Map: Dark Pools and Price Transparency
Example Scenario: Institutional Investor Using a Dark Pool
Context: A pension fund wants to sell 500,000 shares of a mid-cap stock.
- Without Dark Pool: Selling such a large block on a public exchange could cause the stock price to drop sharply due to visible selling pressure.
- With Dark Pool: The pension fund executes the trade anonymously, preventing other market participants from reacting prematurely.
Effect on Price Transparency:
- Other traders do not see this large sell order in the public order book.
- The official market price may not immediately reflect the true supply-demand balance.
- Price discovery is delayed until the trade is reported, often after the fact.
Mind Map: Trade Execution in Dark Pools vs Public Exchanges
Quantitative Example: Price Impact Comparison
- Public Exchange: Selling 500,000 shares might push the price down by 3% due to visible supply.
- Dark Pool: The trade executes at a price close to the last market price, with minimal immediate impact.
However, because the trade is hidden, other market participants lack information to adjust their valuations, potentially leading to inefficiencies.
Best Practices for Finance Professionals
- Monitor Dark Pool Activity: Use consolidated tape data and dark pool volume indicators to gauge hidden liquidity.
- Adjust Trading Strategies: Incorporate potential delays in price discovery when assessing market conditions.
- Balance Transparency and Impact: Use dark pools judiciously to minimize market impact while maintaining awareness of transparency limitations.
Summary
Dark pools provide valuable benefits for large trades but at the cost of reduced price transparency. This can lead to delayed price discovery and increased information asymmetry, affecting market fairness and efficiency. Understanding these dynamics is crucial for finance professionals when analyzing market data and executing trades.
12. Emerging Trends and Technologies in Financial Markets
12.1 Blockchain and Cryptocurrencies: Market Structure and Trading
Introduction
Blockchain technology and cryptocurrencies have revolutionized the financial markets by introducing decentralized, transparent, and secure transaction systems. Understanding their market structure and trading fundamentals is essential for finance professionals and investment analysts aiming to navigate this rapidly evolving landscape.
What is Blockchain?
Blockchain is a distributed ledger technology that records transactions across multiple computers in a way that ensures the data cannot be altered retroactively.
- Decentralization: No single authority controls the ledger.
- Transparency: Transactions are visible to all participants.
- Immutability: Once recorded, data cannot be changed.
Mind Map: Blockchain Fundamentals
Cryptocurrencies: Digital Assets on Blockchain
Cryptocurrencies are digital or virtual currencies that use cryptography for security and operate on blockchain networks.
- Examples: Bitcoin (BTC), Ethereum (ETH), Binance Coin (BNB), Cardano (ADA)
- Use Cases: Store of value, medium of exchange, decentralized finance (DeFi), NFTs
Mind Map: Cryptocurrency Ecosystem
Market Structure of Cryptocurrency Trading
Cryptocurrency markets differ from traditional financial markets in several ways:
- 24/7 Trading: Crypto markets operate continuously without closing hours.
- Decentralized Exchanges (DEX) vs Centralized Exchanges (CEX):
- CEXs like Coinbase, Binance act as intermediaries.
- DEXs like Uniswap operate without intermediaries using smart contracts.
- Liquidity: Varies widely; top coins have high liquidity, while smaller tokens may have thin markets.
- Order Types: Market, limit, stop-loss, and advanced orders are supported on many platforms.
Mind Map: Crypto Market Structure
Trading Fundamentals in Cryptocurrency Markets
Order Execution and Pricing
- Order Book Model: Most CEXs use an order book similar to traditional exchanges.
- Automated Market Makers (AMMs): DEXs use AMMs where liquidity pools determine prices algorithmically.
Example: Trading on a Centralized Exchange
- An investor places a limit buy order for 1 BTC at $30,000 on Binance.
- The order sits in the order book until matched with a seller.
Example: Trading on a Decentralized Exchange
- A user swaps ETH for USDC on Uniswap.
- The price is determined by the ratio of tokens in the liquidity pool.
Mind Map: Trading Fundamentals
Best Practices for Trading Cryptocurrencies
- Understand Volatility: Crypto markets are highly volatile; use limit orders to control entry/exit prices.
- Manage Risks: Use stop-loss orders and position sizing to limit downside.
- Security First: Use cold wallets for long-term holdings; enable two-factor authentication on exchanges.
- Stay Informed: Follow regulatory updates, network upgrades, and market sentiment.
Example: Using Limit and Stop-Loss Orders
- An investor buys ETH at $2,000 using a limit order.
- Sets a stop-loss at $1,800 to minimize losses if the price drops.
Real-World Example: Impact of Network Upgrades on Trading
When Ethereum transitioned from Proof of Work to Proof of Stake (The Merge), it influenced trading behavior:
- Increased investor confidence led to price appreciation.
- Network fees (gas) decreased, improving trading efficiency on DEXs.
Summary
Blockchain and cryptocurrencies represent a paradigm shift in financial markets. Their unique market structure and trading mechanisms require finance professionals to adapt traditional concepts and embrace new tools and strategies.
Understanding decentralized vs centralized exchanges, order execution models, and risk management techniques are critical for successful participation in this space.
Additional Resources
- CoinMarketCap – Real-time crypto market data
- Uniswap Docs – Understanding decentralized exchanges
- Ethereum Foundation – Blockchain and smart contract fundamentals
12.2 Artificial Intelligence and Machine Learning in Trading
Artificial Intelligence (AI) and Machine Learning (ML) have revolutionized the way trading is conducted in financial markets. These technologies enable the analysis of vast datasets, uncover hidden patterns, and execute trades with speed and precision beyond human capabilities.
Overview of AI and ML in Trading
- Artificial Intelligence (AI): The simulation of human intelligence processes by machines, especially computer systems.
- Machine Learning (ML): A subset of AI that enables systems to learn and improve from experience without being explicitly programmed.
Key Applications of AI and ML in Trading
Example 1: Sentiment Analysis for Stock Price Prediction
Sentiment analysis uses natural language processing (NLP) to analyze news articles, social media, and earnings call transcripts to gauge market sentiment.
- Best Practice: Combine sentiment scores with historical price data to improve prediction accuracy.
- Example: A hedge fund uses Twitter sentiment analysis to predict short-term price movements of tech stocks. When positive sentiment spikes, the algorithm increases buy orders, resulting in a 5% higher return compared to traditional models.
Example 2: Algorithmic Trading with Reinforcement Learning
Reinforcement learning (RL) algorithms learn optimal trading strategies by interacting with the market environment.
- Best Practice: Train RL models on historical market data and simulate trades before live deployment.
- Example: An AI-driven trading bot uses RL to optimize order execution, minimizing market impact and slippage. Over six months, it reduces transaction costs by 15%.
Mind Map: Machine Learning Workflow in Trading
Example 3: Fraud Detection Using Anomaly Detection
ML models can detect unusual trading patterns that may indicate fraudulent activity.
- Best Practice: Use unsupervised learning techniques like clustering and isolation forests to identify anomalies without labeled data.
- Example: A brokerage firm implements an anomaly detection system that flags suspicious trades for manual review, reducing fraud-related losses by 30%.
Challenges and Considerations
- Data Quality: Garbage in, garbage out. Ensuring high-quality, relevant data is critical.
- Overfitting: Models may perform well on historical data but poorly in live markets.
- Regulatory Compliance: AI models must comply with trading regulations and transparency requirements.
- Ethical Concerns: Avoid biases and ensure fair market practices.
Final Thoughts
AI and ML are powerful tools that, when integrated thoughtfully, can enhance trading strategies, improve risk management, and provide competitive advantages. Finance professionals should combine domain expertise with technological understanding to harness these innovations effectively.
12.3 ESG Investing and Its Impact on Market Instruments
Environmental, Social, and Governance (ESG) investing has rapidly evolved from a niche strategy to a mainstream approach influencing capital allocation and market instruments globally. ESG investing integrates non-financial factors into investment decisions, aiming to generate sustainable, long-term returns while promoting responsible corporate behavior.
Understanding ESG Investing
ESG criteria evaluate companies based on:
- Environmental: Climate change impact, carbon footprint, resource usage, pollution control.
- Social: Labor practices, community relations, diversity and inclusion, human rights.
- Governance: Board structure, executive compensation, transparency, shareholder rights.
Mind Map: ESG Investing Components
Impact of ESG on Market Instruments
ESG considerations have transformed traditional financial instruments and led to the creation of new ones:
-
Equities
- ESG-focused equity funds and ETFs have surged, allowing investors to target companies with strong ESG profiles.
- Example: The iShares ESG Aware MSCI USA ETF (ESGU) tracks U.S. companies with positive ESG characteristics.
-
Fixed Income
- Green bonds, social bonds, and sustainability-linked bonds have emerged to finance projects with positive ESG outcomes.
- Example: Apple issued a $2.2 billion green bond in 2019 to fund renewable energy and energy efficiency projects.
-
Derivatives
- ESG derivatives, such as ESG-linked swaps, are increasingly used for hedging ESG-related risks.
-
Indexes and Benchmarks
- ESG indexes guide passive investment strategies and benchmarking.
- Example: MSCI ESG Leaders Index excludes companies with poor ESG ratings.
Mind Map: ESG Influence on Market Instruments
Best Practices for Integrating ESG in Investment Decisions
- Due Diligence: Evaluate ESG ratings from multiple agencies (e.g., MSCI, Sustainalytics) to avoid rating biases.
- Materiality Focus: Concentrate on ESG factors material to the industry sector.
- Engagement and Stewardship: Actively engage with companies to improve ESG practices rather than excluding them outright.
- Transparency: Disclose ESG integration methodology clearly to stakeholders.
Example:
An investment analyst evaluating a renewable energy company considers not only its financials but also its carbon reduction targets, labor practices, and board diversity. The analyst uses Sustainalytics scores and engages with company management to assess future ESG risks and opportunities before recommending the stock.
Examples of ESG Impact on Market Behavior
- Performance Correlation: Studies show companies with strong ESG profiles often exhibit lower cost of capital and better operational performance.
- Investor Demand: ESG funds attracted over $50 billion in net inflows globally in 2023, driving up valuations of ESG-compliant companies.
- Regulatory Influence: The EU’s Sustainable Finance Disclosure Regulation (SFDR) mandates ESG disclosures, impacting product structuring and investor transparency.
Mind Map: ESG Market Impact
Practical Example: Constructing an ESG-Focused Bond Portfolio
- Objective: Build a fixed income portfolio prioritizing environmental impact.
- Selection: Choose green bonds issued by companies with strong governance ratings.
- Diversification: Include bonds from different sectors (renewable energy, sustainable infrastructure).
- Monitoring: Track use of proceeds and impact reports to ensure alignment with ESG goals.
Outcome: The portfolio not only delivers competitive yields but also supports climate-positive projects, appealing to investors seeking both financial returns and sustainability.
Summary
ESG investing reshapes market instruments by embedding sustainability into capital markets. Finance professionals and investment analysts must understand ESG factors, leverage ESG data, and apply best practices to optimize portfolio construction and risk management in this evolving landscape.
12.4 Best Practices: Integrating New Technologies into Traditional Trading Frameworks
Integrating new technologies such as blockchain, artificial intelligence (AI), and machine learning (ML) into traditional trading frameworks is essential for staying competitive and improving efficiency in modern financial markets. Below are best practices, supported by mind maps and practical examples, to guide finance professionals and investment analysts through this integration process.
Assess Current Trading Frameworks and Identify Integration Points
Before adopting new technologies, thoroughly evaluate existing systems to identify areas where technology can add value without disrupting core operations.
Mind Map: Assessing Trading Frameworks
Example: A mid-sized investment firm reviewed its OMS and found manual order entry was causing delays. They identified automation via AI-powered order routing as an integration opportunity.
Start with Pilot Projects to Test Technology Fit
Implement small-scale pilots to validate technology benefits and identify challenges before full-scale deployment.
Mind Map: Pilot Project Workflow
Example: A trading desk piloted an AI-driven predictive analytics tool to forecast short-term price movements. The pilot improved trade timing accuracy by 12%, leading to broader adoption.
Ensure Data Quality and Integration
New technologies rely heavily on data. Establish robust data governance and seamless integration between legacy systems and new platforms.
Mind Map: Data Integration Best Practices
Example: A capital markets firm integrated blockchain-based trade confirmation with their existing settlement system using APIs, reducing reconciliation errors by 30%.
Incorporate AI and ML for Enhanced Decision-Making
Leverage AI/ML models to analyze large datasets, identify patterns, and automate routine tasks, improving trading decisions and operational efficiency.
Mind Map: AI/ML Integration in Trading
Example: An investment analyst used ML models to scan news sentiment and adjust portfolio allocations dynamically, resulting in a 5% increase in risk-adjusted returns.
Adopt Blockchain for Transparency and Efficiency
Utilize blockchain to enhance transparency, reduce settlement times, and lower counterparty risk.
Mind Map: Blockchain Integration
Example: A derivatives trading firm implemented blockchain smart contracts to automate margin calls, reducing operational delays by 40%.
Maintain Compliance and Security
Ensure all technology integrations comply with regulatory requirements and maintain robust cybersecurity protocols.
Mind Map: Compliance & Security
Example: After integrating AI tools, a trading firm implemented automated compliance checks to flag suspicious trades, reducing regulatory risk.
Foster Continuous Learning and Change Management
Train staff on new technologies and promote a culture of innovation to maximize benefits.
Mind Map: Change Management

Example: A capital markets firm launched an internal AI academy, enabling traders and analysts to develop ML skills, accelerating technology adoption.
Summary Table of Best Practices with Examples
| Best Practice | Description | Example |
|---|---|---|
| Assess Current Frameworks | Identify integration points | Automating manual order entry |
| Pilot Projects | Test technology on small scale | AI predictive analytics pilot |
| Data Quality & Integration | Ensure clean data and seamless connectivity | Blockchain API integration for settlement |
| AI/ML for Decision-Making | Use models for analysis and automation | Sentiment analysis for portfolio adjustments |
| Blockchain Adoption | Enhance transparency and efficiency | Smart contracts for margin calls |
| Compliance & Security | Maintain regulatory and cybersecurity standards | Automated compliance checks post-AI integration |
| Continuous Learning & Change Mgmt | Train staff and foster innovation culture | Internal AI academy for traders and analysts |
By following these best practices, finance professionals can effectively integrate cutting-edge technologies into traditional trading frameworks, improving efficiency, transparency, and decision-making while managing risks and regulatory compliance.
12.5 Example: Using AI to Enhance Portfolio Management Decisions
Artificial Intelligence (AI) has revolutionized portfolio management by enabling finance professionals to analyze vast datasets, identify patterns, and make data-driven investment decisions with greater precision and speed. This section explores practical applications of AI in portfolio management, supported by mind maps and examples.
Mind Map: AI Applications in Portfolio Management
Example 1: Sentiment Analysis for Stock Selection
A portfolio manager wants to enhance stock selection by incorporating market sentiment derived from news articles and social media. Using Natural Language Processing (NLP), an AI model analyzes thousands of news feeds and tweets daily to score stocks based on positive or negative sentiment.
-
Process:
- Collect real-time news and social media data.
- Apply NLP algorithms to extract sentiment scores.
- Integrate sentiment scores with fundamental data.
- Adjust portfolio weights favoring stocks with strong positive sentiment.
-
Outcome:
- Improved identification of momentum stocks.
- Early detection of potential risks from negative news.
Mind Map: Sentiment Analysis Workflow
Example 2: AI-Driven Dynamic Asset Allocation
Traditional asset allocation often relies on static models updated periodically. AI enables dynamic asset allocation by continuously analyzing market conditions, correlations, and risk factors.
-
Process:
- Use machine learning models to forecast asset returns and volatilities.
- Employ reinforcement learning to optimize portfolio weights dynamically.
- Incorporate macroeconomic indicators and market sentiment as inputs.
-
Outcome:
- Enhanced portfolio adaptability to changing market regimes.
- Better risk-adjusted returns through timely rebalancing.
Mind Map: Dynamic Asset Allocation Using AI
Example 3: AI for Risk Management and Stress Testing
AI models can simulate thousands of market scenarios to assess portfolio vulnerability under extreme conditions.
-
Process:
- Train AI models on historical crisis data.
- Generate synthetic stress scenarios using generative adversarial networks (GANs).
- Evaluate portfolio performance and identify risk concentrations.
-
Outcome:
- Proactive risk mitigation strategies.
- Improved regulatory compliance and reporting.
Best Practices for Implementing AI in Portfolio Management
- Data Quality: Ensure high-quality, clean, and relevant data inputs.
- Model Transparency: Use explainable AI techniques to understand model decisions.
- Continuous Monitoring: Regularly validate and recalibrate AI models.
- Human Oversight: Combine AI insights with expert judgment.
- Ethical Considerations: Address biases and ensure compliance with regulations.
Summary
AI enhances portfolio management by providing advanced tools for data analysis, risk management, asset allocation, and trade execution. By integrating AI-driven insights with traditional investment expertise, finance professionals can improve decision-making, optimize returns, and manage risks more effectively.
13. Practical Case Studies and Real-World Applications
13.1 Case Study: Building a Diversified Portfolio Across Asset Classes
Introduction
Diversification is a fundamental principle in portfolio management aimed at reducing risk by allocating investments across various asset classes. This case study explores how a finance professional or investment analyst can construct a diversified portfolio that balances risk and return effectively.
Step 1: Understanding Asset Classes
Key Asset Classes:
- Equities (Stocks)
- Fixed Income (Bonds)
- Cash and Cash Equivalents
- Real Estate
- Commodities
- Alternative Investments (e.g., Hedge Funds, Private Equity)
Step 2: Setting Investment Objectives and Risk Tolerance
Example:
- Investor Profile: Moderate risk tolerance, 10-year investment horizon
- Objective: Capital appreciation with some income generation
Step 3: Allocating Across Asset Classes
Sample Allocation:
- Equities: 50%
- Fixed Income: 30%
- Real Estate: 10%
- Commodities: 5%
- Cash: 5%
Best Practice: Use historical data and forward-looking analysis to adjust allocations periodically.
Step 4: Selecting Instruments Within Each Asset Class
Equities:
- 30% Large Cap US Stocks (e.g., S&P 500 ETFs)
- 10% International Developed Markets
- 10% Emerging Markets
Fixed Income:
- 20% US Treasury Bonds
- 5% Investment Grade Corporate Bonds
- 5% High Yield Bonds
Real Estate:
- 10% REIT ETFs
Commodities:
- 5% Gold ETFs
Cash:
- 5% Money Market Funds
Step 5: Example Portfolio Construction
| Asset Class | Instrument Type | Allocation | Example Instrument |
|---|---|---|---|
| Equities | Large Cap US Stocks | 30% | SPDR S&P 500 ETF (SPY) |
| Equities | International Developed | 10% | iShares MSCI EAFE ETF (EFA) |
| Equities | Emerging Markets | 10% | Vanguard FTSE EM ETF (VWO) |
| Fixed Income | US Treasuries | 20% | iShares 7-10 Year Treasury |
| Fixed Income | Corporate Bonds | 5% | iShares Investment Grade |
| Fixed Income | High Yield Bonds | 5% | SPDR High Yield Bond ETF |
| Real Estate | REITs | 10% | Vanguard REIT ETF (VNQ) |
| Commodities | Gold | 5% | SPDR Gold Shares (GLD) |
| Cash | Money Market | 5% | Vanguard Prime MM Fund |
Step 6: Risk and Return Considerations
- Diversification reduces unsystematic risk.
- Correlation between asset classes is key: equities and bonds often have low or negative correlation.
- Example: During a market downturn, bonds and gold may provide a cushion.

Step 7: Monitoring and Rebalancing
Best Practice: Regularly review portfolio (e.g., quarterly or annually) to maintain target allocations.
Example: If equities outperform and grow to 60% of portfolio, sell some equities and buy bonds or cash to rebalance.
Step 8: Real-World Example
Scenario: In 2020, during the COVID-19 pandemic market crash:
- Equities dropped sharply.
- Bonds and gold gained value.
Outcome: A diversified portfolio softened losses compared to an all-equity portfolio.
Summary
Building a diversified portfolio involves:
- Understanding asset classes and their characteristics
- Aligning allocation with investor objectives and risk tolerance
- Selecting appropriate instruments
- Monitoring correlations and risks
- Periodic rebalancing to maintain balance
This structured approach helps finance professionals and investment analysts design portfolios that optimize risk-adjusted returns.
Additional Resources
- “Modern Portfolio Theory and Investment Analysis” by Elton, Gruber
- Morningstar Portfolio Tools
- Bloomberg Portfolio Analytics
13.2 Example: Trading Strategy Adaptation During Market Volatility
Market volatility presents both challenges and opportunities for traders. Adapting trading strategies effectively during volatile periods is crucial to managing risk and capitalizing on price movements. This section explores how to adjust trading approaches during heightened volatility, supported by mind maps and practical examples.
Understanding Market Volatility
Volatility refers to the degree of variation in trading prices over time. High volatility means large price swings, while low volatility indicates stable prices.
Key Characteristics of Volatile Markets:
- Increased price fluctuations
- Wider bid-ask spreads
- Higher trading volumes
- Greater uncertainty and risk
Mind Map: Factors Influencing Trading Strategy Adaptation During Volatility
Best Practices for Strategy Adaptation
Adjust Position Sizes
Example: During calm markets, a trader might take positions representing 5% of their portfolio. In volatile markets, reducing this to 2-3% helps limit exposure to sudden adverse moves.
Use Protective Stop-Loss Orders
Example: Instead of wide stop losses, tighten stops to lock in profits or minimize losses. For instance, if a stock normally has a 5% stop, reduce it to 2-3% during volatility.
Favor Limit Orders Over Market Orders
Example: Market orders can execute at unfavorable prices during volatility due to rapid price changes. Using limit orders ensures trades execute at desired price levels or better.
Shorten Trading Time Frames
Example: Swing traders might shift to intraday or even minute-based charts to better capture quick price moves and avoid overnight risk.
Incorporate Volatility Indicators
Example: Use Average True Range (ATR) or Bollinger Bands to gauge volatility and adjust entry/exit points accordingly.
Hedge Positions
Example: Use options or inverse ETFs to hedge against downside risk during uncertain periods.
Mind Map: Tactical Adjustments to Trading Strategy
Practical Example: Adapting a Momentum Trading Strategy
Scenario: A momentum trader typically buys stocks breaking out above resistance with market orders and holds positions for several days.
During Volatility:
- Switch to limit orders to avoid slippage.
- Reduce position size by 50%.
- Use 15-minute charts instead of daily charts to identify quicker entry and exit points.
- Set tighter stop-loss orders based on ATR to protect capital.
- Avoid holding positions overnight to reduce gap risk.
Outcome: The trader reduces losses during sudden market reversals and captures smaller, more frequent profits.
Example: Using ATR to Set Dynamic Stop-Losses
- Calculate the ATR over the past 14 periods.
- Multiply ATR by a factor (e.g., 1.5) to set stop-loss distance.
Illustration:
- ATR = $2
- Stop-loss distance = 1.5 x $2 = $3
- If entry price is $50, stop-loss is set at $47.
This method adapts stops to current market volatility rather than fixed percentages.
Psychological Considerations
Volatility can induce emotional trading, leading to impulsive decisions.
Best Practices:
- Maintain a written trading plan.
- Use checklists before entering trades.
- Take breaks during extreme volatility.
- Review trades objectively to learn and improve.
Summary
Adapting trading strategies during volatile markets involves:
- Adjusting position sizes and stop-losses
- Employing limit orders to control execution prices
- Shortening time frames and using volatility indicators
- Hedging to manage risk
- Maintaining discipline and emotional control
By integrating these practices, traders can navigate volatility more effectively, protecting capital while seeking opportunities.
13.3 Case Study: Impact of Geopolitical Events on Market Structure and Trading
Geopolitical events have a profound impact on financial markets, influencing market structure, trading behavior, liquidity, and price volatility. Understanding these impacts helps finance professionals and investment analysts anticipate market reactions and adjust strategies accordingly.
Overview
Geopolitical events include elections, wars, trade disputes, sanctions, diplomatic tensions, and policy changes. These events can cause sudden shifts in market sentiment, disrupt supply chains, and alter capital flows.
Mind Map: Geopolitical Events Impact on Financial Markets
Example 1: Brexit Referendum (2016)
- Event: The UK voted to leave the European Union.
- Market Reaction: Sharp volatility in equity and currency markets.
- Market Structure Impact:
- Surge in trading volumes on the GBP/USD and FTSE 100.
- Increased use of dark pools as institutional investors sought anonymity amid volatility.
- Temporary widening of bid-ask spreads due to liquidity uncertainty.
- Trading Behavior:
- Flight to safety: increased demand for gold, US Treasuries, and the Japanese Yen.
- Hedge funds increased options trading to protect portfolios.
Best Practice: Use limit orders and staggered execution to manage slippage during volatile geopolitical events.
Mind Map: Brexit Impact on Market Structure and Trading
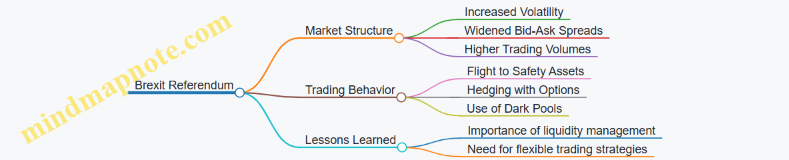
Example 2: US-China Trade War (2018-2020)
- Event: Escalating tariffs and trade restrictions between the US and China.
- Market Reaction: Periodic market sell-offs and sector rotation.
- Market Structure Impact:
- Increased fragmentation as some exchanges and OTC desks specialized in affected sectors.
- Surge in derivatives trading, especially futures and options, to hedge tariff risks.
- Trading Behavior:
- Increased volatility in commodities like soybeans and semiconductors.
- Investors rebalanced portfolios away from exposed sectors.
Best Practice: Monitor geopolitical news flow closely and use derivatives for tactical hedging.
Mind Map: US-China Trade War Effects
Example 3: Russia-Ukraine Conflict (2022-Present)
- Event: Military conflict leading to sanctions and energy supply disruptions.
- Market Reaction: Extreme volatility in energy, metals, and currency markets.
- Market Structure Impact:
- Sanctions led to exclusion of Russian securities from major indices and exchanges.
- Liquidity dried up in affected markets, causing wider spreads.
- Trading Behavior:
- Surge in trading of energy futures and safe-haven assets like US Treasuries.
- Increased use of stop-loss orders to manage risk.
Best Practice: Incorporate geopolitical risk scenarios into portfolio stress testing.
Mind Map: Russia-Ukraine Conflict Market Impact

Integrated Best Practices for Trading During Geopolitical Events
- Liquidity Management: Anticipate liquidity drops; use limit orders and staggered executions.
- Diversification: Maintain diversified portfolios to reduce exposure to region-specific risks.
- Hedging: Utilize derivatives (options, futures, swaps) to hedge against volatility and adverse price moves.
- Real-Time Monitoring: Leverage news analytics and sentiment tools for timely decision-making.
- Scenario Analysis: Conduct stress tests incorporating geopolitical risk scenarios.
- Flexible Trading Strategies: Adapt algorithmic and manual strategies to changing market microstructure.
Summary
Geopolitical events reshape market structure by affecting liquidity, trading venues, and regulatory landscapes. Traders and investment analysts must understand these dynamics to effectively manage risk and capitalize on opportunities. Real-world examples like Brexit, the US-China trade war, and the Russia-Ukraine conflict illustrate the diverse ways geopolitical risks manifest in markets.
Additional Resources
- IMF Geopolitical Risk Index
- Bloomberg Terminal News and Analytics
- CME Group Derivatives Guides
- Regulatory Updates from SEC, ESMA, and FCA
This case study underscores the importance of integrating geopolitical awareness into market analysis and trading strategies for finance professionals.
13.4 Best Practices: Continuous Learning and Adaptation in Dynamic Markets
In the fast-paced and ever-evolving landscape of financial markets, continuous learning and adaptation are not just advantageous—they are essential for sustained success. Market conditions, regulations, technologies, and investor behaviors change rapidly, and finance professionals must remain agile to navigate these shifts effectively.
Why Continuous Learning Matters
- Market Complexity: New instruments, trading platforms, and strategies emerge regularly.
- Regulatory Changes: Compliance requirements evolve, affecting trading and investment decisions.
- Technological Advances: AI, machine learning, and blockchain reshape market dynamics.
- Behavioral Shifts: Investor sentiment and macroeconomic factors fluctuate unpredictably.
Core Best Practices for Continuous Learning and Adaptation
-
Regular Market Analysis and Review
- Schedule weekly and monthly reviews of market trends, news, and performance.
- Use dashboards and analytics tools to track portfolio and market indicators.
-
Engage with Educational Resources
- Subscribe to reputable financial journals, newsletters, and podcasts.
- Attend webinars, workshops, and industry conferences.
-
Leverage Peer Networks and Mentorship
- Participate in professional forums and discussion groups.
- Seek mentorship from experienced professionals to gain insights.
-
Experiment and Backtest Strategies
- Use simulation platforms to test new trading strategies without risk.
- Analyze historical data to understand potential outcomes.
-
Embrace Technological Tools
- Adopt AI-driven analytics and algorithmic trading tools.
- Stay updated on fintech innovations impacting trading and investment.
-
Maintain Flexibility and Open-mindedness
- Be willing to pivot strategies based on new information.
- Avoid cognitive biases by challenging assumptions regularly.
Mind Map: Continuous Learning Framework in Dynamic Markets
Example 1: Adapting to Regulatory Changes
Scenario: A new regulation requires enhanced transparency in algorithmic trading.
Action: An investment analyst regularly attends regulatory webinars and updates their firm’s trading algorithms to ensure compliance while maintaining execution efficiency.
Outcome: The firm avoids penalties, improves client trust, and gains a competitive edge by proactively adapting.
Example 2: Learning from Market Volatility
Scenario: Sudden geopolitical events cause unexpected market swings.
Action: A portfolio manager reviews the event’s impact, studies similar historical cases, and adjusts asset allocations accordingly.
Outcome: The portfolio is better positioned to withstand volatility, minimizing losses and capitalizing on recovery opportunities.
Mind Map: Adaptive Trading Strategy Cycle
Example 3: Incorporating New Technologies
Scenario: Introduction of AI-powered sentiment analysis tools.
Action: An investment analyst integrates sentiment data into fundamental analysis workflows.
Outcome: Enhanced prediction accuracy for short-term price movements, leading to improved trade timing.
Tips for Embedding Continuous Learning into Daily Routine
- Dedicate 30 minutes daily to reading market news or educational content.
- Keep a learning journal to document insights and strategy reflections.
- Set quarterly goals for skill development or certification.
- Use collaborative platforms to share knowledge with team members.
By embedding continuous learning and adaptation into your professional practice, you build resilience against market uncertainties and position yourself to seize emerging opportunities effectively.
13.5 Example: Applying Lessons from Historical Market Crashes to Current Trading
Financial market crashes, while disruptive, offer invaluable lessons for traders and investment analysts. Understanding the causes, market reactions, and recovery patterns from past crashes can help professionals develop robust trading strategies and risk management frameworks today.
Key Historical Market Crashes and Their Lessons
| Crash Event | Year | Key Causes | Market Impact | Lesson for Traders |
|---|---|---|---|---|
| The Great Depression | 1929 | Speculative bubble, margin buying | Massive market collapse, prolonged recession | Importance of leverage control and diversification |
| Black Monday | 1987 | Program trading, liquidity crisis | 22.6% single-day drop in DJIA | Need for circuit breakers and understanding market microstructure |
| Dot-com Bubble | 2000 | Overvaluation of tech stocks | Sharp decline in tech-heavy indices | Valuation discipline and skepticism of hype |
| Global Financial Crisis | 2008 | Subprime mortgage crisis, leverage | Severe liquidity crunch, systemic risk | Credit risk assessment and stress testing |
| Flash Crash | 2010 | Algorithmic trading, liquidity gaps | Rapid intraday plunge and recovery | Algorithmic risk controls and real-time monitoring |
Mind Map: Lessons from Historical Crashes
Practical Examples Applying Historical Lessons
Example 1: Using Stop-Loss Orders to Manage Volatility
During the 1987 Black Monday crash, many traders suffered catastrophic losses due to lack of protective measures. Today, implementing stop-loss orders can help limit downside exposure during sudden market drops.
- Scenario: A trader holds a tech stock showing high volatility.
- Action: Places a stop-loss order 5% below the purchase price.
- Outcome: If the stock price plummets rapidly, the stop-loss triggers an automatic sale, preventing further losses.
Example 2: Avoiding Overleveraging Inspired by the 2008 Crisis
The 2008 crisis highlighted the dangers of excessive leverage.
- Scenario: An investment analyst evaluates a leveraged position in mortgage-backed securities.
- Action: Limits leverage to a conservative ratio and performs stress testing under adverse economic scenarios.
- Outcome: The portfolio withstands market shocks better, avoiding forced liquidations.
Example 3: Algorithmic Trading Controls Post-2010 Flash Crash
The Flash Crash exposed vulnerabilities in algorithmic trading.
- Scenario: A trading firm deploys high-frequency trading algorithms.
- Action: Implements real-time monitoring and kill-switch mechanisms to halt trading if abnormal patterns emerge.
- Outcome: Prevents runaway algorithms from exacerbating market instability.
Mind Map: Applying Lessons to Current Trading
Summary
By studying historical market crashes, finance professionals can better anticipate risks and design trading strategies that are resilient to extreme market events. Incorporating lessons such as prudent leverage use, protective order types, algorithmic risk management, and regulatory compliance ensures more stable and informed trading decisions in today’s dynamic financial markets.
14. Conclusion and Future Outlook
14.1 Recap of Key Concepts and Best Practices
Overview
This section consolidates the essential concepts and best practices covered throughout the blog, providing finance professionals and investment analysts with a clear, structured summary. Using mind maps and practical examples, we reinforce understanding and application of financial markets, instruments, and trading fundamentals.
Mind Map: Financial Markets Structure
Example: Understanding that the Forex market operates 24/5 globally helps analysts plan trading strategies around liquidity peaks in different time zones.
Mind Map: Financial Instruments Overview
Example: A portfolio manager selects convertible bonds to balance fixed income stability with potential equity upside in a bullish market.
Mind Map: Trading Fundamentals and Strategies
Example: Using limit orders during volatile market conditions can protect traders from unexpected price swings, as demonstrated during earnings announcements.
Mind Map: Risk Management Essentials
Example: A trader uses options to hedge against downside risk in an equity portfolio, effectively limiting losses during a market downturn.
Mind Map: Regulatory Environment
Example: Adhering to MiFID II transparency requirements improves trade execution quality and investor protection in European markets.
Integrated Best Practices Summary
- Understand Market Structure: Know the differences between primary/secondary markets and trading venues to optimize execution.
- Instrument Selection: Align instruments with investment objectives and risk appetite; diversify across asset classes.
- Order Management: Use appropriate order types (limit, stop) to control trade execution and manage risk.
- Combine Analyses: Integrate technical and fundamental analysis for well-rounded trading decisions.
- Risk Controls: Implement stop-losses, hedging, and diversification to mitigate various risks.
- Stay Compliant: Keep updated with regulations to avoid penalties and maintain market integrity.
- Leverage Technology: Utilize electronic platforms, AI, and algorithmic tools to enhance trading efficiency.
Final Example: Applying Recap Concepts
Consider an investment analyst managing a diversified portfolio during a volatile earnings season:
- Uses limit orders to avoid slippage during high volatility.
- Applies fundamental analysis to assess earnings impact on stock valuations.
- Employs options to hedge downside risk.
- Monitors regulatory updates to ensure compliance with reporting.
- Leverages electronic trading platforms for timely execution.
This integrated approach, grounded in the key concepts and best practices reviewed, enhances decision-making and risk management.
This recap serves as a practical reference to reinforce your expertise and guide effective application in real-world financial markets.
14.2 The Future of Financial Markets: Predictions and Preparations
As financial markets continue to evolve rapidly, understanding emerging trends and preparing strategically is crucial for finance professionals and investment analysts. This section explores key predictions shaping the future of financial markets and offers practical guidance on how to adapt effectively.
Key Predictions for the Future of Financial Markets
Technology: The Driving Force
Blockchain & Distributed Ledger Technology (DLT)
- Prediction: Blockchain will revolutionize clearing, settlement, and custody by enabling near-instantaneous, secure transactions.
- Example: The Australian Securities Exchange (ASX) is transitioning to a blockchain-based post-trade platform, reducing settlement times and operational risks.
Artificial Intelligence (AI) and Machine Learning
- Prediction: AI will enhance market analysis, predictive modeling, and automated trading strategies.
- Example: Hedge funds like Renaissance Technologies use AI-driven algorithms to identify subtle market patterns and execute trades at high speed.
Quantum Computing
- Prediction: Though nascent, quantum computing promises to solve complex optimization and risk modeling problems beyond classical capabilities.
- Example: Financial institutions are investing in quantum research to prepare for breakthroughs that could transform portfolio optimization.
Market Structure Evolution
Decentralized Finance (DeFi)
- Prediction: DeFi platforms will grow, offering peer-to-peer financial services without traditional intermediaries.
- Example: Platforms like Uniswap enable decentralized trading of digital assets, challenging centralized exchanges.
Increased Market Fragmentation
- Prediction: More trading venues and alternative liquidity pools will emerge, increasing complexity.
- Example: Dark pools and alternative trading systems (ATS) continue to grow, requiring sophisticated order routing strategies.
Enhanced Transparency and Data Availability
- Prediction: Advances in data analytics and regulatory demands will improve market transparency.
- Example: Real-time trade reporting and consolidated tape initiatives aim to provide unified market data.
Regulatory Landscape
Stricter Compliance and Enforcement
- Prediction: Regulators will impose tighter controls on market conduct, data privacy, and systemic risk.
- Example: The EU’s MiFID III is expected to expand on transparency and investor protection rules.
Global Regulatory Harmonization
- Prediction: Cross-border cooperation will increase to manage interconnected markets.
- Example: IOSCO initiatives aim to standardize rules for crypto-assets globally.
Data Privacy and Cybersecurity
- Prediction: Heightened focus on protecting sensitive financial data against cyber threats.
- Example: Firms adopting zero-trust security models to safeguard trading infrastructure.
Financial Instruments and ESG
Tokenization of Assets
- Prediction: Real-world assets (real estate, art, commodities) will be tokenized, improving liquidity and accessibility.
- Example: Platforms like tZERO facilitate trading of tokenized securities.
ESG and Sustainable Finance
- Prediction: ESG factors will become central to investment decisions and product development.
- Example: Green bonds and ESG ETFs have seen exponential growth as investors prioritize sustainability.
New Derivative Products
- Prediction: Innovative derivatives tied to climate metrics, cryptocurrencies, and other novel underlyings will emerge.
- Example: Weather derivatives help companies hedge climate-related risks.
Trading and Market Participation
Algorithmic and AI-Driven Trading
- Prediction: Increased reliance on AI for trade execution, risk management, and strategy development.
- Example: AI-powered robo-advisors offering personalized portfolio management.
Increased Retail Participation
- Prediction: Technology and democratization of information will empower more retail investors.
- Example: Platforms like Robinhood have lowered barriers, but also raised concerns about market volatility.
Real-Time Risk Management
- Prediction: Continuous monitoring and instant risk adjustments will become standard.
- Example: Use of cloud computing and big data analytics to track portfolio risk in real time.
Preparing for the Future: Best Practices
- Continuous Learning: Stay updated on technological advances and regulatory changes through courses, webinars, and industry reports.
- Technology Adoption: Invest in AI tools, blockchain pilots, and data analytics to enhance decision-making.
- Risk Adaptation: Develop flexible risk frameworks that incorporate new asset classes and trading environments.
- Collaboration: Engage with regulators, technology providers, and market participants to shape evolving standards.
Practical Example: Scenario Planning for Market Disruptions
Imagine a scenario where a major quantum computing breakthrough enables a competitor to crack current encryption methods, threatening market security.
- Preparation Steps:
- Invest in quantum-resistant cryptography.
- Develop contingency plans for trading platform security.
- Monitor regulatory guidance on quantum risks.
This proactive approach exemplifies how finance professionals can anticipate and prepare for disruptive innovations.
By embracing these predictions and integrating best practices, finance professionals and investment analysts can position themselves to navigate and capitalize on the future financial markets landscape effectively.
14.3 Continuing Education and Resources for Finance Professionals
In the rapidly evolving world of finance and capital markets, continuous learning is essential to stay ahead. Finance professionals and investment analysts must regularly update their knowledge and skills to adapt to new regulations, technologies, and market dynamics. This section explores key avenues for continuing education, valuable resources, and practical examples to help you build a robust learning framework.
Why Continuing Education Matters
- Market Evolution: Financial instruments, trading technologies, and regulations continuously evolve.
- Competitive Edge: Staying informed enhances decision-making and career growth.
- Risk Management: Updated knowledge helps anticipate and mitigate emerging risks.
Key Areas for Ongoing Learning
Certifications: Deepening Expertise
- CFA (Chartered Financial Analyst): Comprehensive coverage of investment management, ethics, and portfolio management.
- FRM (Financial Risk Manager): Focuses on risk analysis and control.
- CAIA (Chartered Alternative Investment Analyst): Specializes in alternative investments.
- CFP (Certified Financial Planner): Emphasizes personal financial planning.
Example: Jane, an investment analyst, pursued the CFA charter to deepen her understanding of equity valuation and portfolio management, which led to improved client recommendations.
Online Courses and Platforms
- Platforms like Coursera and edX offer courses from top universities on financial markets, derivatives, and algorithmic trading.
- Short courses on Udemy and LinkedIn Learning provide practical skills such as Excel modeling and Python for finance.
Example: Mark completed a Python for Finance course on Coursera, enabling him to automate data analysis and backtest trading strategies efficiently.
Industry Publications and News
- Regular reading of Bloomberg, Financial Times, and Wall Street Journal keeps professionals updated on market trends and regulatory changes.
- Subscribing to newsletters and podcasts can provide daily or weekly market insights.
Example: Sarah subscribes to the “Bloomberg Markets” newsletter and uses insights to adjust her fixed income portfolio ahead of interest rate changes.
Professional Networks and Communities
- Joining organizations like the CFA Institute or GARP provides access to exclusive research, webinars, and networking opportunities.
- Local meetups and online forums foster peer learning and discussion.
Example: Tom attends monthly CFA society events, gaining insights from industry leaders and expanding his professional network.
Conferences and Webinars
- Attending events such as the SIFMA Annual Meeting or FinTech Summits exposes professionals to emerging trends and innovative technologies.
- Webinars offer convenient access to expert discussions and Q&A sessions.
Example: Emily participated in a FinTech webinar on blockchain applications in capital markets, inspiring her to explore blockchain-based trading solutions.
Practical Experience and Case Studies
- Simulated trading platforms like Investopedia Simulator or Thinkorswim allow hands-on practice without financial risk.
- Analyzing case studies of historical market events sharpens analytical skills.
- Mentorship programs provide personalized guidance and real-world insights.
Example: David used a simulated trading platform to test a momentum-based equity strategy before applying it with real capital.
Mind Map: Building a Personalized Learning Plan
Final Example: Integrating Continuing Education into Daily Routine
- Morning: Read 30 minutes of market news (e.g., Financial Times).
- Afternoon: Complete one module of an online course.
- Weekly: Attend a webinar or local finance meetup.
- Monthly: Review progress and adjust learning goals.
By embedding continuous education into your workflow, you ensure sustained professional growth and adaptability in the dynamic financial markets landscape.
14.4 Final Example: Scenario Planning for Future Market Disruptions
Scenario planning is a critical tool for finance professionals and investment analysts to anticipate, prepare for, and navigate potential future market disruptions. By envisioning multiple plausible futures, firms can develop strategies that enhance resilience and agility.
What is Scenario Planning?
Scenario planning involves creating detailed narratives about different ways the future might unfold, focusing on uncertainties that could impact financial markets. It helps identify risks, opportunities, and decision points.
Why Scenario Planning Matters in Financial Markets
- Markets are influenced by complex, interconnected factors including geopolitical events, technological innovations, regulatory changes, and economic shifts.
- Unexpected disruptions can cause volatility, liquidity crunches, or structural changes.
- Proactive scenario planning enables better risk management and strategic positioning.
Mind Map: Key Components of Scenario Planning
Example Scenario 1: Geopolitical Tensions Escalate
Context: Rising geopolitical tensions between major economies lead to trade restrictions and sanctions.
Potential Market Impacts:
- Sharp declines in equity markets due to uncertainty.
- Increased volatility in currency and commodity markets.
- Credit spreads widen as risk perception increases.
Scenario Planning Actions:
- Increase allocation to defensive sectors (e.g., utilities, consumer staples).
- Hedge currency exposure using options or forwards.
- Monitor credit ratings and reduce exposure to vulnerable issuers.
Mind Map: Geopolitical Tensions Scenario
Example Scenario 2: Rapid Technological Disruption
Context: Breakthrough in AI-driven trading algorithms causes a shift in market microstructure and liquidity patterns.
Potential Market Impacts:
- Increased market efficiency but also flash crashes and sudden liquidity gaps.
- Traditional trading strategies become less effective.
- Regulatory scrutiny intensifies.
Scenario Planning Actions:
- Invest in technology and data analytics capabilities.
- Develop algorithmic trading safeguards and circuit breakers.
- Engage with regulators proactively.
Mind Map: Technological Disruption Scenario
Example Scenario 3: Regulatory Overhaul
Context: Introduction of stringent global regulations on derivatives trading and capital requirements.
Potential Market Impacts:
- Reduced liquidity in certain asset classes.
- Increased compliance costs.
- Shift in market participant behavior.
Scenario Planning Actions:
- Review and adapt trading strategies to comply with new rules.
- Increase capital buffers and liquidity reserves.
- Explore alternative instruments or markets.
Mind Map: Regulatory Overhaul Scenario
Best Practices for Effective Scenario Planning
- Engage Cross-Functional Teams: Include risk managers, traders, compliance officers, and strategists to capture diverse perspectives.
- Use Quantitative and Qualitative Data: Combine statistical models with expert judgment.
- Regularly Update Scenarios: Reflect evolving market conditions and new information.
- Integrate into Decision-Making: Use scenarios to stress test portfolios and inform contingency plans.
- Communicate Clearly: Ensure all stakeholders understand scenarios and their implications.
Final Thoughts
Scenario planning is not about predicting the future with certainty but preparing for multiple possibilities. By systematically exploring potential disruptions and embedding best practices, finance professionals can enhance their ability to safeguard investments and capitalize on emerging opportunities.
For further reading, consider exploring scenario planning frameworks from leading financial institutions and regulatory bodies.