Audit Analytics for Finance Professionals
1. Introduction to Audit Analytics
1.1 Understanding Audit Analytics: Definition and Scope
Audit analytics is the application of data analysis techniques and tools to audit processes to enhance the effectiveness, efficiency, and accuracy of audits. It involves collecting, processing, and analyzing financial and operational data to identify patterns, anomalies, risks, and opportunities that traditional audit methods might overlook.
Definition
Audit Analytics can be defined as:
The systematic use of data analysis, statistical methods, and technology-driven tools to examine and evaluate audit evidence, improve risk assessment, detect fraud, and support audit decision-making.
Scope of Audit Analytics
The scope of audit analytics extends across various audit phases and types, including financial audits, compliance audits, operational audits, and forensic audits. It covers multiple activities such as:
- Data extraction and preparation
- Risk identification and assessment
- Anomaly and fraud detection
- Continuous auditing and monitoring
- Reporting and visualization
Mind Map: Core Components of Audit Analytics
Why Audit Analytics Matters for Finance Professionals
- Improved Accuracy: Analytics helps uncover hidden risks and errors that manual reviews might miss.
- Efficiency: Automates repetitive tasks, allowing auditors to focus on high-risk areas.
- Fraud Detection: Identifies suspicious patterns and transactions early.
- Data-Driven Decisions: Supports audit conclusions with quantitative evidence.
Example 1: Detecting Duplicate Payments
A finance auditor uses audit analytics to scan thousands of payment transactions. By applying pattern recognition algorithms, the auditor identifies multiple instances where the same invoice number was paid twice within a short period. This early detection prevents financial loss and strengthens internal controls.
Mind Map: Example Workflow for Duplicate Payment Detection
Example 2: Risk Assessment Using Analytics
During an audit planning phase, an auditor uses analytics to segment clients based on transaction volume, frequency, and historical risk indicators. This segmentation helps prioritize audit resources toward higher-risk clients, optimizing audit coverage.
Mind Map: Risk Assessment Process
Summary
Audit analytics is a transformative approach that leverages data and technology to elevate the audit function. Its scope is broad, encompassing data handling, analysis, and actionable insights that empower finance professionals to conduct more insightful, efficient, and effective audits.
By integrating audit analytics into their workflows, accountants and auditors can better manage risks, detect fraud, and deliver greater value to their organizations.
1.2 The Role of Audit Analytics in Modern Finance
Audit analytics has become a cornerstone in transforming how finance professionals approach auditing. By leveraging data-driven techniques, audit analytics enhances the efficiency, accuracy, and insightfulness of audit processes. Below, we explore the multifaceted role audit analytics plays in modern finance, supported by mind maps and practical examples.
What is the Role of Audit Analytics?
Audit analytics integrates data analysis tools and methodologies into traditional auditing to:
- Detect anomalies and fraud more effectively
- Improve risk assessment and management
- Automate routine audit tasks
- Provide deeper insights into financial data
- Support continuous auditing and real-time monitoring
Mind Map: Core Roles of Audit Analytics in Modern Finance
Fraud Detection
Audit analytics enables auditors to sift through vast volumes of transactions to identify suspicious activities that may indicate fraud.
Example: A finance team uses audit analytics software to analyze expense reports. The system flags multiple reimbursements submitted by the same employee for identical amounts on the same day, which would have been difficult to detect manually.
Risk Assessment
By analyzing historical data and trends, audit analytics helps quantify and prioritize risks, allowing auditors to focus on high-risk areas.
Example: An auditor applies predictive analytics to accounts payable data, identifying vendors with unusual payment patterns that could indicate potential compliance risks.
Efficiency Improvement
Automation of data extraction, cleansing, and initial analysis reduces manual effort, freeing auditors to focus on complex judgment areas.
Example: Instead of manually reconciling thousands of transactions, an audit team uses analytics tools to automatically match invoices with payments, highlighting discrepancies instantly.
Continuous Auditing
Audit analytics supports ongoing monitoring rather than periodic reviews, enabling real-time insights and faster response to issues.
Example: A tech company implements continuous auditing dashboards that track key financial metrics daily, alerting auditors immediately when thresholds are breached.
Enhanced Reporting
Data visualization and interactive dashboards improve communication of audit findings to stakeholders, making complex data easier to understand.
Example: An auditor presents a fraud risk heatmap to management, visually highlighting departments with the highest risk scores, facilitating informed decision-making.
Mind Map: Benefits of Audit Analytics for Finance Professionals
Summary
Audit analytics is reshaping the finance auditing landscape by embedding data-driven insights into every stage of the audit lifecycle. From detecting fraud to enabling continuous auditing, it empowers finance professionals to deliver higher quality audits with greater efficiency and strategic value.
By adopting audit analytics, finance professionals and auditors can not only meet regulatory demands but also contribute to stronger organizational governance and risk management.
Call to Action
Finance professionals should start integrating audit analytics into their workflows by:
- Identifying key data sources
- Investing in user-friendly analytics tools
- Upskilling in data analysis techniques
- Encouraging a culture of data-driven decision-making
This foundational step will unlock the full potential of audit analytics in modern finance.
1.3 Key Benefits of Integrating Analytics into Auditing
Integrating analytics into auditing processes brings transformative benefits that enhance the effectiveness, efficiency, and insightfulness of audits. For finance professionals such as accountants and auditors, leveraging audit analytics means moving beyond traditional sampling and manual checks to a data-driven, comprehensive approach.
Enhanced Risk Identification and Assessment
Analytics enables auditors to analyze entire datasets rather than relying on limited samples. This comprehensive view helps identify unusual patterns, anomalies, and potential risks more effectively.
- Example: Instead of manually reviewing a sample of expense reports, an auditor uses analytics to scan all transactions for duplicate payments or outliers in amounts, quickly flagging suspicious entries for further investigation.
Improved Audit Efficiency and Coverage
Automation of data processing and analysis reduces time spent on routine tasks, allowing auditors to focus on high-value activities.
- Example: Using automated scripts to reconcile accounts payable data against purchase orders accelerates the audit process and reduces human error.
Greater Accuracy and Objectivity
Data analytics minimizes subjective judgment by providing evidence-based insights, which increases the reliability of audit conclusions.
- Example: Statistical analysis of revenue recognition patterns helps objectively assess compliance with accounting standards, reducing bias.
Real-Time Monitoring and Continuous Auditing
Analytics facilitates ongoing monitoring of financial transactions, enabling auditors to detect issues as they arise rather than after the fact.
- Example: Continuous auditing dashboards alert auditors to unusual spikes in vendor payments, allowing immediate follow-up.
Enhanced Decision-Making and Strategic Insights
By uncovering trends and correlations, audit analytics supports more informed decision-making and strategic planning.
- Example: Analyzing expense trends over multiple periods helps management identify cost-saving opportunities and adjust budgeting.
Better Compliance and Regulatory Reporting
Analytics tools help ensure compliance by systematically verifying data against regulatory requirements and generating audit trails.
- Example: Automated checks confirm that all transactions meet anti-money laundering (AML) criteria, simplifying regulatory reporting.
Summary Mindmap of Benefits
By integrating analytics into auditing, finance professionals can transform their audit processes into more insightful, efficient, and proactive functions, ultimately driving higher quality assurance and business value.
1.4 Overview of Common Audit Analytics Tools and Technologies
Audit analytics has become an indispensable part of modern auditing, enabling finance professionals to analyze large volumes of data efficiently and uncover insights that traditional methods might miss. This section provides an overview of the most common tools and technologies used in audit analytics, along with practical examples and mind maps to help you understand their applications.
Categories of Audit Analytics Tools
Data Extraction & Preparation Tools
Before any analysis, auditors must extract and prepare data from various sources such as ERP systems, databases, and cloud platforms.
- Alteryx: A user-friendly ETL tool that allows auditors to blend and cleanse data without extensive coding.
- SQL: Essential for querying databases directly to extract relevant audit data.
Example: An auditor uses SQL queries to extract all vendor payment transactions from the company’s ERP system, then uses Alteryx to clean and format the data for analysis.
Data Analysis & Statistical Tools
These tools help auditors perform descriptive and inferential statistics, identify trends, and test hypotheses.
- Microsoft Excel: Widely used for quick data summaries, pivot tables, and basic analytics.
- R and SAS: Powerful statistical programming languages for advanced analysis.
Example: Using Excel’s pivot tables, an auditor summarizes monthly expense data to identify unusual spikes. For deeper analysis, they might use R to run regression models assessing risk factors.
Visualization Tools
Visualization tools transform complex data into intuitive charts and dashboards.
- Tableau and Power BI enable auditors to create interactive dashboards that highlight anomalies and trends.
Example: An auditor creates a dashboard in Power BI showing expense categories by department, with conditional formatting to flag expenses exceeding budget thresholds.
Audit-Specific Analytics Software
These platforms are tailored for audit workflows and come with built-in audit tests and templates.
- ACL Analytics (Galvanize): Enables auditors to perform data analytics, automate tests, and generate reports.
- IDEA: Known for its ease of use in importing data and running audit-specific tests like duplicate payments or gap analysis.
Example: Using IDEA, an auditor runs a duplicate payment test on accounts payable data, quickly identifying potential errors or fraud.
Advanced Analytics & Machine Learning
For predictive analytics and pattern recognition, auditors are increasingly leveraging programming languages and machine learning platforms.
- Python with libraries like Pandas and Scikit-learn allows custom analytics and model building.
- RapidMiner offers a no-code environment for building predictive models.
Example: An auditor builds a machine learning model in Python to predict high-risk transactions based on historical fraud data.
Continuous Monitoring & Automation Tools
Continuous auditing requires tools that automate data collection and analysis.
- SAP Audit Management integrates with SAP ERP to automate audit workflows.
- TeamMate Analytics supports continuous monitoring with automated alerts.
- Automation Anywhere provides robotic process automation (RPA) to streamline repetitive audit tasks.
Example: An auditor sets up TeamMate Analytics to automatically monitor journal entries daily and alert the team to unusual postings.
Mind Map: Selecting the Right Audit Analytics Tool
Summary
Choosing the right audit analytics tools depends on your organization’s size, data complexity, and audit objectives. Combining general-purpose tools like Excel and SQL with audit-specific software such as ACL or IDEA often yields the best results. Advanced analytics and automation tools are becoming increasingly important for proactive and continuous auditing.
By understanding the capabilities and applications of these tools, finance professionals can enhance audit quality, improve efficiency, and uncover deeper insights.
1.5 Best Practice: Establishing a Data-Driven Audit Culture with Practical Examples
Creating a data-driven audit culture is essential for finance professionals aiming to leverage audit analytics effectively. This practice ensures that audit teams consistently use data insights to enhance decision-making, improve risk detection, and increase overall audit quality.
Why Establish a Data-Driven Audit Culture?
- Enhances accuracy and objectivity in audits.
- Facilitates proactive risk identification.
- Encourages continuous improvement through data feedback.
- Promotes transparency and accountability.
Key Components of a Data-Driven Audit Culture
Step-by-Step Approach to Establishing the Culture
- Assess Current State: Evaluate existing audit processes and data capabilities.
- Leadership Buy-In: Secure commitment from senior management to champion data initiatives.
- Invest in Training: Develop tailored training programs to improve data literacy among auditors.
- Implement Tools: Deploy user-friendly analytics platforms suited to audit needs.
- Define Data Governance: Establish policies for data quality, security, and compliance.
- Encourage Collaboration: Foster teamwork between auditors, IT, and data specialists.
- Measure Impact: Track KPIs such as audit cycle time, error detection rate, and user adoption.
- Iterate and Improve: Use feedback to refine analytics processes and culture.
Practical Examples
Example 1: Training Program to Boost Data Literacy
- Scenario: An audit team struggled with interpreting analytics outputs.
- Action: The organization introduced monthly workshops covering basics of data visualization, statistical concepts, and tool usage.
- Outcome: Within 3 months, auditors confidently identified anomalies and presented data-driven findings, reducing reliance on manual checks.
Example 2: Leadership Driving Analytics Adoption
- Scenario: Initial resistance to new audit analytics software.
- Action: The CFO and Audit Committee publicly endorsed the initiative, allocated budget for tools, and recognized early adopters.
- Outcome: Increased enthusiasm and faster adoption, leading to a 20% improvement in audit efficiency.
Example 3: Cross-Functional Collaboration
- Scenario: Data silos between finance, IT, and audit departments.
- Action: Formation of a cross-functional audit analytics task force meeting bi-weekly to share insights and align objectives.
- Outcome: Streamlined data access, improved data quality, and innovative audit tests developed collaboratively.
Mind Map: Practical Steps and Outcomes
Tips for Sustaining the Culture
- Celebrate data-driven successes regularly.
- Encourage curiosity and questioning of assumptions.
- Keep analytics tools intuitive and accessible.
- Update training materials as technology evolves.
- Align audit goals with organizational data strategies.
By embedding these practices and examples into your audit function, you can cultivate a robust data-driven culture that empowers finance professionals to harness the full potential of audit analytics.
2. Data Collection and Preparation for Audit Analytics
2.1 Identifying Relevant Data Sources in Finance and Tech
In audit analytics, the foundation of any insightful analysis is the quality and relevance of the data collected. For finance professionals, especially accountants and auditors, understanding where to find pertinent data sources is crucial to uncovering risks, anomalies, and opportunities for improvement.
Why Identifying Relevant Data Sources Matters
- Ensures comprehensive audit coverage
- Improves accuracy of findings
- Enables effective risk assessment
- Facilitates timely detection of fraud or errors
Key Categories of Data Sources in Finance and Tech
Detailed Breakdown with Examples
Financial Systems
These are core systems where financial transactions and records are maintained.
-
ERP Systems (e.g., SAP, Oracle Financials): Centralized platforms that integrate finance, procurement, and other business processes.
- Example: Extracting journal entries and invoice data to verify transaction legitimacy.
-
General Ledger: The master record of all financial transactions.
- Example: Analyzing ledger entries to identify unusual account activity.
-
Accounts Payable/Receivable: Records of money owed and money to be received.
- Example: Cross-checking vendor invoices against payments to detect duplicate payments.
-
Payroll Systems: Employee compensation data.
- Example: Auditing payroll data to identify ghost employees or irregular salary changes.
Operational Systems
These systems provide context to financial data by capturing business operations.
-
CRM Systems (e.g., Salesforce): Track customer interactions and sales.
- Example: Matching sales orders with revenue recognition to ensure compliance.
-
Inventory Management: Tracks stock levels and movements.
- Example: Verifying inventory valuation and detecting obsolete stock.
-
Procurement Systems: Manage purchasing processes.
- Example: Reviewing purchase orders and approvals to identify unauthorized purchases.
Transactional Data
Raw data from payment and banking activities.
-
Payment Gateways (e.g., Stripe, PayPal): Records of online transactions.
- Example: Detecting suspicious refund patterns that may indicate fraud.
-
Bank Statements: Official records of cash inflows and outflows.
- Example: Reconciling bank statements with internal records to detect discrepancies.
-
Credit Card Transactions: Employee or corporate card usage.
- Example: Analyzing credit card expenses for policy compliance.
External Data
Data from outside the organization that can provide additional insights.
-
Market Data: Stock prices, commodity prices, and economic indicators.
- Example: Comparing revenue trends with market performance to identify anomalies.
-
Regulatory Filings: Public disclosures such as SEC filings.
- Example: Verifying reported financials against regulatory submissions.
-
Vendor Data: Supplier certifications, credit ratings.
- Example: Assessing vendor risk by analyzing external credit scores.
IT Systems
Audit analytics often require IT data to assess system integrity and security.
-
Access Logs: Records of who accessed what and when.
- Example: Detecting unauthorized access to financial systems.
-
Change Management Logs: Documentation of system changes.
- Example: Verifying that system updates were properly authorized.
-
System Event Logs: Capture system errors or unusual activities.
- Example: Identifying potential data tampering or system failures.
Mind Map: Example of Data Source Integration for an Audit
Best Practice Example: Mapping Data Sources for a Revenue Recognition Audit
- Identify relevant systems: ERP for sales orders, CRM for customer contracts, bank statements for cash receipts.
- Extract data: Pull sales transactions, contract terms, and payment records.
- Cross-validate: Match sales orders with contracts and payments.
- Analyze: Use analytics to detect timing mismatches or unusual revenue spikes.
This integrated approach ensures auditors have a holistic view, reducing the risk of oversight.
Summary
Identifying relevant data sources is the first critical step in audit analytics. Finance professionals should develop a comprehensive understanding of both internal and external data systems, including financial, operational, transactional, IT, and external datasets. Leveraging these sources with practical examples and mind maps enhances audit effectiveness and supports data-driven decision-making.
2.2 Data Extraction Techniques: From ERP Systems to Cloud Platforms
Extracting data efficiently and accurately is a critical first step in audit analytics. Finance professionals and auditors must be adept at pulling data from a variety of sources, including traditional ERP systems and modern cloud platforms. This section explores common data extraction techniques, practical examples, and best practices to ensure clean, reliable data for audit purposes.
Overview of Data Extraction
Data extraction involves retrieving data from source systems for analysis. The complexity varies depending on the system architecture, data formats, and access permissions.
Common Data Sources in Finance and Tech:
- ERP Systems (e.g., SAP, Oracle Financials, Microsoft Dynamics)
- Cloud Platforms (e.g., AWS, Azure, Google Cloud)
- Databases (SQL, NoSQL)
- APIs and Web Services
- Spreadsheets and Flat Files
Mind Map: Data Extraction Techniques
Direct Database Queries
Description: Accessing the source database directly using SQL queries to extract relevant financial data.
Example:
An auditor needs to analyze accounts payable transactions from an Oracle Financials database. Using SQL, they extract all transactions over $10,000 in the last quarter:
SELECT vendor_id, invoice_number, amount, transaction_date
FROM accounts_payable
WHERE amount > 10000
AND transaction_date BETWEEN TO_DATE('2023-01-01', 'YYYY-MM-DD') AND TO_DATE('2023-03-31', 'YYYY-MM-DD');
Best Practice: Always work with IT or database administrators to ensure proper permissions and avoid performance issues.
Export Functions from ERP Systems
Most ERP systems provide built-in export features to download reports or data extracts in formats like CSV, Excel, XML, or JSON.
Example:
Using SAP’s standard reporting module, an auditor exports the general ledger transactions for the fiscal year in CSV format, which can then be imported into audit analytics tools.
Best Practice: Verify export settings to include all necessary fields and ensure data completeness.
APIs (Application Programming Interfaces)
APIs allow programmatic access to data, especially useful for cloud platforms and modern ERP systems.
Example:
An auditor accesses financial transaction data from a cloud-based accounting platform (e.g., QuickBooks Online) via its RESTful API:
- Authenticate using OAuth 2.0
- Call the endpoint
/v3/company/{companyId}/reports/ProfitAndLossto retrieve profit and loss data
Best Practice: Use API pagination and filtering to manage large datasets efficiently.
ETL (Extract, Transform, Load) Tools
ETL tools automate data extraction, transformation, and loading into analytics environments.
Example:
Using Microsoft SQL Server Integration Services (SSIS), an auditor schedules a daily job to extract sales data from the ERP, transform it by normalizing date formats, and load it into a SQL Server data warehouse.
Best Practice: Document ETL workflows clearly and validate data at each stage.
Cloud Data Connectors
Cloud platforms offer native connectors to extract data from various sources.
Example:
Using Azure Data Factory, an auditor sets up a pipeline to pull transaction logs from an AWS S3 bucket and load them into an Azure SQL Database for analysis.
Best Practice: Monitor data pipelines for failures and ensure secure authentication.
Manual Extraction
Sometimes, manual extraction is necessary, especially when automated options are unavailable.
Example:
Downloading monthly expense reports as PDFs from a vendor portal and manually converting them into Excel for analysis.
Best Practice: Minimize manual extraction to reduce errors and maintain audit trail documentation.
Mind Map: Example Workflow for Data Extraction from ERP to Analytics Tool
Practical Example: Extracting Data from SAP ERP to Power BI
- Requirement: Analyze vendor payment trends.
- Extraction: Use SAP’s export report to download vendor payment data as CSV.
- Validation: Check CSV for completeness and format consistency.
- Load: Import CSV into Power BI.
- Analysis: Create visualizations to identify payment delays or anomalies.
Summary Best Practices for Data Extraction
- Collaborate with IT and system owners to gain appropriate access.
- Automate extraction processes where possible to improve efficiency and reduce errors.
- Validate extracted data for completeness, accuracy, and consistency.
- Maintain documentation of extraction methods and data lineage for audit trails.
- Ensure compliance with data privacy and security policies during extraction.
By mastering these data extraction techniques, finance professionals and auditors can build a strong foundation for effective audit analytics, enabling deeper insights and more informed decision-making.
2.3 Data Cleaning and Transformation: Ensuring Accuracy and Consistency
Data cleaning and transformation are critical steps in audit analytics to ensure that the data used for analysis is accurate, consistent, and reliable. Poor data quality can lead to incorrect conclusions, missed risks, and ineffective audits. This section will cover best practices, common challenges, and practical examples to help finance professionals master these processes.
Why Data Cleaning and Transformation Matter
- Accuracy: Correct errors and inconsistencies to reflect true financial conditions.
- Consistency: Standardize data formats and values for meaningful comparisons.
- Completeness: Address missing data to avoid biased analysis.
- Reliability: Build trust in audit findings and support regulatory compliance.
Common Data Quality Issues in Finance and Tech Audits
- Duplicate records
- Missing values
- Inconsistent data formats (dates, currencies)
- Outliers and anomalies
- Incorrect or outdated entries
Mind Map: Key Steps in Data Cleaning and Transformation
Practical Example 1: Cleaning Expense Report Data
Scenario: An auditor receives expense data from multiple departments with inconsistent date formats, missing vendor names, and duplicate entries.
Steps:
- Data Profiling: Identify that dates are in formats like MM/DD/YYYY, DD-MM-YYYY, and text strings.
- Standardize Dates: Convert all dates to ISO format (YYYY-MM-DD) using scripting or ETL tools.
- Handle Missing Vendor Names: Use available invoice numbers to look up missing vendors or flag for follow-up.
- Remove Duplicates: Identify duplicate expense entries by matching date, amount, and vendor.
- Validate Amounts: Check for negative or zero values that may indicate data entry errors.
Outcome: Cleaned dataset ready for anomaly detection and trend analysis.
Mind Map: Handling Missing Data Techniques
Practical Example 2: Transforming Revenue Data for Consistency
Scenario: Revenue data is collected from multiple subsidiaries with different currencies and fiscal calendars.
Steps:
- Currency Conversion: Convert all revenue figures to a single reporting currency using the appropriate exchange rates on transaction dates.
- Align Fiscal Periods: Adjust data to a common fiscal calendar by prorating or aggregating monthly figures.
- Normalize Data: Scale revenue figures to account for seasonal variations or business cycles.
- Categorize Revenue Streams: Standardize revenue categories to enable consolidated reporting.
Outcome: Harmonized revenue dataset that supports accurate consolidated financial analysis.
Best Practices for Data Cleaning and Transformation
- Automate repetitive cleaning tasks using scripts or ETL tools to reduce manual errors.
- Maintain a data cleaning log documenting all changes for audit trail purposes.
- Collaborate with data owners and subject matter experts to validate assumptions.
- Use visualization tools to spot anomalies before and after cleaning.
- Continuously monitor data quality as part of ongoing audit processes.
By applying these data cleaning and transformation techniques, finance professionals can significantly enhance the quality of their audit analytics, leading to more insightful, reliable, and actionable audit outcomes.
2.4 Handling Missing or Incomplete Data: Best Practices with Examples
In audit analytics, dealing with missing or incomplete data is a critical step to ensure the accuracy and reliability of audit findings. Missing data can arise from system errors, manual entry mistakes, or incomplete data transfers. Proper handling of these gaps is essential to maintain data integrity and avoid misleading conclusions.
Why Handling Missing Data Matters
- Missing data can bias audit results.
- It may hide potential fraud or errors.
- Ensures compliance with regulatory standards.
Common Causes of Missing or Incomplete Data
- System outages or failures during data capture.
- Manual input errors or omissions.
- Data migration issues between platforms.
- Privacy or security restrictions limiting data availability.
Best Practices for Handling Missing Data
Identify and Understand the Missing Data
- Audit the data source: Check logs and system records.
- Classify missingness: Determine if data is Missing Completely at Random (MCAR), Missing at Random (MAR), or Not Missing at Random (NMAR).
Document Missing Data
- Maintain a data quality report.
- Track the percentage and pattern of missing values.
Choose an Appropriate Handling Method
a. Deletion Methods
- Listwise Deletion: Remove records with missing values.
- Example: Excluding transactions missing invoice numbers when analyzing payment patterns.
- Pairwise Deletion: Use available data pairs for analysis.
- Example: Calculating correlations only on complete pairs of financial variables.
b. Imputation Techniques
- Mean/Median/Mode Imputation: Replace missing values with average or most common values.
- Example: Filling missing expense amounts with the median expense for that category.
- Regression Imputation: Predict missing values based on other variables.
- Example: Estimating missing sales figures using related marketing spend data.
- Last Observation Carried Forward (LOCF): Use the last known value.
- Example: For monthly financial reports, carrying forward last month’s figure if current month is missing.
- Multiple Imputation: Generate several plausible values and average results.
- Example: Creating multiple datasets with different imputed values to assess audit risk.
c. Using Analytics to Detect Patterns
- Use visualization to spot missing data patterns.
- Apply clustering to see if missingness correlates with specific groups.
Mind Map: Handling Missing Data in Audit Analytics
Example 1: Handling Missing Invoice Dates in Accounts Payable
Scenario: During an audit of accounts payable, 8% of invoice dates are missing, which affects payment aging analysis.
Approach:
- Investigate if missing dates are random or linked to specific vendors.
- Use median invoice date by vendor to impute missing values.
- Validate by comparing payment patterns before and after imputation.
Outcome: Improved accuracy in aging reports, enabling better risk assessment.
Example 2: Missing Expense Amounts in Employee Reimbursements
Scenario: Some expense reimbursement records lack amounts due to manual entry errors.
Approach:
- Use regression imputation based on expense category and employee role.
- Cross-check imputed values with historical expense data.
Outcome: Reduced data gaps, allowing comprehensive fraud detection analytics.
Tips for Auditors
- Always question the reason behind missing data.
- Avoid blindly deleting data; consider impact on audit scope.
- Use multiple methods and compare results for robustness.
- Document all decisions and methods used for transparency.
Summary
Handling missing or incomplete data effectively is foundational to reliable audit analytics. By combining identification, documentation, appropriate handling methods, and validation, finance professionals can mitigate risks posed by data gaps and enhance audit quality.
2.5 Case Study: Preparing Financial Data for Fraud Detection Analytics
Introduction
Preparing financial data effectively is a critical step in enabling robust fraud detection analytics. This case study walks through the process of collecting, cleaning, and transforming financial data from a mid-sized technology company to detect potential fraudulent activities.
Step 1: Identifying Relevant Data Sources
The first step involves pinpointing data sources that contain transactional and financial information relevant to fraud detection.
Example: The company extracts data from their ERP system’s general ledger and accounts payable modules, alongside employee expense claim records.
Step 2: Data Extraction Techniques
Data is extracted using SQL queries and API calls to ensure completeness and accuracy.
Example:
- SQL query to extract all vendor payments over the last 12 months.
- API integration to pull employee expense claims from the expense management platform.
Step 3: Data Cleaning and Transformation
Cleaning involves handling missing values, removing duplicates, and standardizing formats.
Example:
- Missing vendor IDs in some transactions are cross-checked with vendor master data and imputed.
- Dates are standardized to ISO 8601 format (YYYY-MM-DD).
- Currency amounts converted to USD for uniformity.
Step 4: Feature Engineering for Fraud Detection
Transform raw data into meaningful features that can help identify anomalies.
Example:
- Flagging transactions exceeding $10,000.
- Identifying vendors with payments only made during weekends.
Step 5: Data Integration and Final Preparation
Combine cleaned and engineered features into a single dataset ready for analytics.
Example:
- Merging payment data with vendor risk scores and employee expense claims.
- Creating a consolidated table with all relevant features for model input.
Summary
This case study highlights the importance of thorough data preparation in fraud detection analytics. By systematically extracting, cleaning, transforming, and enriching financial data, auditors can significantly improve the accuracy and effectiveness of fraud detection models.
Additional Example: Handling Missing Data
Suppose 5% of payment records lack vendor IDs. Instead of discarding these records, the team cross-references invoice numbers with vendor master data to impute missing IDs, preserving valuable data for analysis.
Key Takeaways
- Start with comprehensive data sourcing.
- Clean and standardize data meticulously.
- Engineer features that reflect fraud risk indicators.
- Integrate multiple data sources for a holistic view.
This structured approach ensures that the financial data is audit-ready and optimized for detecting fraudulent activities effectively.
3. Exploratory Data Analysis (EDA) in Auditing
3.1 Introduction to EDA Concepts for Auditors
Exploratory Data Analysis (EDA) is a critical first step in the audit analytics process. It involves summarizing the main characteristics of a dataset, often using visual methods, to uncover patterns, spot anomalies, test hypotheses, and check assumptions before applying more complex analytical techniques.
For auditors, EDA provides a foundation to understand financial data deeply, identify potential risks, and prioritize audit focus areas effectively.
Why EDA Matters for Auditors
- Data Familiarization: Understand the structure, quality, and key features of financial datasets.
- Anomaly Detection: Identify outliers or irregular transactions that may indicate errors or fraud.
- Hypothesis Generation: Formulate audit hypotheses based on observed data trends.
- Risk Prioritization: Focus audit resources on high-risk areas revealed through data patterns.
Core Concepts of EDA for Auditors
Mind Map: Core Concepts of EDA for Auditors
Step-by-Step EDA Process for Auditors
-
Understand the Data Context: Know the source of data (e.g., general ledger, accounts payable), the business processes involved, and relevant accounting standards.
-
Data Cleaning: Identify and handle missing values, duplicates, or inconsistent entries.
-
Summary Statistics: Calculate key metrics such as total transaction amounts, average invoice size, and frequency distributions.
-
Visualization: Use charts to visualize distributions and trends over time.
-
Identify Outliers: Detect transactions that deviate significantly from typical patterns.
-
Document Findings: Record observations and potential areas requiring deeper audit focus.
Practical Example: EDA on Expense Transactions
Imagine you are auditing a company’s expense transactions for the last fiscal year. Here’s how EDA can be applied:
- Data Summary: Calculate total expenses by category (travel, office supplies, entertainment).
- Visualization: Create a box plot to visualize expense amounts per category.
- Outlier Detection: Identify unusually large expense claims that may warrant further investigation.
- Trend Analysis: Plot monthly expenses to detect seasonal spikes or irregularities.
Mind Map: EDA on Expense Transactions
Example Visualization Descriptions
- Histogram: Shows the frequency distribution of expense amounts, helping to see if most expenses cluster around a typical value.
- Box Plot: Highlights median, quartiles, and outliers in expense amounts per category.
- Scatter Plot: Can be used to compare expense amounts against approval times to detect suspicious delays.
Best Practices for Auditors Performing EDA
- Always combine domain knowledge with data insights.
- Use multiple visualization types to get a comprehensive view.
- Document every step to maintain audit trail and reproducibility.
- Be cautious interpreting outliers; investigate context before concluding.
By mastering EDA concepts, auditors can transform raw financial data into actionable insights, improving audit quality and efficiency.
3.2 Visualizing Financial Data: Charts, Graphs, and Dashboards
Visualizing financial data is a critical step in audit analytics, enabling auditors and finance professionals to quickly identify patterns, trends, and anomalies that might be hidden in raw numbers. Effective visualizations transform complex datasets into intuitive and actionable insights.
Why Visualize Financial Data?
- Simplify Complexity: Large volumes of financial data can be overwhelming. Visualizations distill this data into understandable formats.
- Spot Trends and Outliers: Graphs and charts highlight deviations or unusual patterns that warrant further investigation.
- Enhance Communication: Visual tools help auditors communicate findings clearly to stakeholders.
Common Visualization Types for Financial Data
| Visualization Type | Purpose | Example Use Case |
|---|---|---|
| Bar Charts | Compare discrete categories | Comparing monthly revenue across departments |
| Line Graphs | Show trends over time | Tracking quarterly expenses over several years |
| Pie Charts | Show proportions | Distribution of expense categories |
| Scatter Plots | Identify correlations or outliers | Plotting invoice amounts vs. payment delays |
| Heatmaps | Highlight intensity or frequency | Fraud risk heatmap across business units |
| Dashboards | Combine multiple visualizations | Real-time audit monitoring dashboard |
Mind Map: Types of Financial Data Visualizations
Example 1: Using a Line Graph to Track Expense Trends
Scenario: An auditor wants to analyze the monthly travel expenses over the last two years to identify any unusual spikes.
- Data: Monthly travel expenses from January 2022 to December 2023.
- Visualization: Line graph plotting months on the X-axis and expense amounts on the Y-axis.
Insight: A sudden spike in travel expenses in August 2023 is visible, prompting a deeper dive into the transactions for that month.
Example 2: Bar Chart to Compare Departmental Budgets
Scenario: Comparing budget utilization across departments to identify overspending.
- Data: Budgeted vs. actual expenses for Marketing, Sales, IT, and HR.
- Visualization: Grouped bar chart showing budgeted and actual expenses side by side.
Insight: The IT department shows actual expenses exceeding the budget by 15%, signaling a potential audit focus area.
Mind Map: Building an Effective Audit Dashboard
Best Practices for Visualizing Financial Data
- Choose the Right Chart Type: Match the visualization to the data and the question you want to answer.
- Keep It Simple: Avoid clutter; focus on clarity.
- Use Consistent Scales and Colors: Helps in easy comparison and reduces misinterpretation.
- Label Clearly: Axes, legends, and titles should be descriptive.
- Incorporate Interactivity: Filters and drill-downs empower deeper analysis.
Example 3: Interactive Dashboard for Expense Monitoring
Scenario: A finance team creates a dashboard combining multiple charts to monitor expenses in real-time.
- Components:
- Line graph for monthly expense trends
- Bar chart for budget vs. actual by department
- Heatmap highlighting departments with highest variance
- Filters for time period and department
Outcome: The dashboard enables auditors to quickly identify departments with unusual spending patterns and investigate further.
By integrating these visualization techniques, finance professionals and auditors can enhance their analytical capabilities, making audits more efficient and insightful.
3.3 Detecting Anomalies and Outliers through EDA
Exploratory Data Analysis (EDA) is a crucial step in the audit process, especially when it comes to detecting anomalies and outliers that may indicate errors, fraud, or unusual transactions. Identifying these irregularities early helps auditors focus their efforts on high-risk areas, improving audit efficiency and effectiveness.
What Are Anomalies and Outliers?
- Anomalies: Data points or patterns that deviate significantly from the norm and may indicate unusual activity.
- Outliers: Extreme values that lie far away from the majority of data points, which can be either legitimate or indicative of errors or fraud.
Why Detect Anomalies and Outliers in Auditing?
- Highlight potential fraud or financial misstatements.
- Identify data entry errors or system glitches.
- Understand unusual business activities or transactions.
Common Techniques for Detecting Anomalies and Outliers
Mind Map: Techniques for Detecting Anomalies and Outliers
Statistical Methods Explained with Examples
-
Z-Score Method
- Measures how many standard deviations a data point is from the mean.
- Example: In a dataset of monthly sales amounts, transactions with a Z-score above 3 or below -3 could be flagged as outliers.
-
Interquartile Range (IQR)
- Calculates the range between the 25th percentile (Q1) and 75th percentile (Q3).
- Outliers are typically values below Q1 - 1.5IQR or above Q3 + 1.5IQR.
- Example: Expense claims exceeding the upper bound may indicate potential fraud.
-
Grubbs’ Test
- A statistical test to detect a single outlier in a normally distributed dataset.
- Example: Detecting an unusually large invoice amount in a batch of payments.
Visualization Techniques with Examples
Mind Map: Visualization Techniques for Outlier Detection
Example:
- Using a box plot on vendor payment amounts reveals several points beyond the whiskers, prompting further investigation into those payments.
Practical Example: Detecting Irregular Expense Patterns
Imagine auditing a company’s travel expenses dataset containing thousands of records. Using EDA:
- Calculate the IQR for expense amounts.
- Identify claims that exceed Q3 + 1.5*IQR.
- Visualize the data with a box plot to highlight these outliers.
- Investigate outliers for validity—e.g., unusually high hotel bills or duplicate claims.
Mind Map: Workflow for Detecting Irregular Expense Patterns
Best Practices for Anomaly and Outlier Detection in Auditing
- Combine Multiple Techniques: Use both statistical and visualization methods to cross-validate findings.
- Contextualize Findings: Understand the business context before labeling data points as anomalies.
- Document Findings: Maintain clear records of detected anomalies and the rationale for further investigation.
- Iterate: Revisit data after initial findings to refine detection criteria.
Summary
Detecting anomalies and outliers through EDA empowers auditors to uncover hidden risks and irregularities efficiently. By leveraging statistical methods, visualizations, and contextual knowledge, finance professionals can enhance audit quality and provide deeper insights into financial data.
3.4 Practical Example: Using EDA to Identify Irregular Expense Patterns
Exploratory Data Analysis (EDA) is a critical step in auditing that helps finance professionals uncover irregularities, trends, and anomalies in financial data. In this section, we will walk through a practical example of using EDA to identify irregular expense patterns within an organization’s expense reports.
Step 1: Understanding the Dataset
Imagine you have access to a dataset containing expense reports submitted by employees over the past year. The key columns include:
- Employee ID
- Expense Date
- Expense Category (e.g., Travel, Meals, Office Supplies)
- Expense Amount
- Approval Status
Our goal is to detect unusual expense patterns that could indicate errors, fraud, or policy violations.
Step 2: Initial Data Exploration
Start by summarizing the data to get a feel for overall expense distribution.
- Calculate total expenses by category.
- Identify the average and median expense amounts.
- Count the number of expenses per employee.
Mind Map: Initial Data Exploration
Example:
| Expense Category | Total Amount | Average Amount | Median Amount |
|---|---|---|---|
| Travel | $120,000 | $300 | $250 |
| Meals | $45,000 | $50 | $45 |
| Office Supplies | $15,000 | $20 | $18 |
Step 3: Visualizing Expense Distributions
Visual tools help spot outliers and irregularities.
- Boxplots per category to identify outliers.
- Histograms to see frequency distributions.
Mind Map: Visualization Techniques
Example:
A boxplot for the ‘Meals’ category reveals a few expenses significantly higher than the typical range, indicating potential irregularities.
Step 4: Identifying Irregular Patterns
Focus on specific irregularities such as:
- Expenses just below approval thresholds.
- Multiple expenses submitted on the same day by the same employee.
- Unusual spikes in expense amounts or frequency.
Mind Map: Irregular Expense Patterns
Example:
- Several employees submitted multiple ‘Travel’ expenses on the same day exceeding normal travel patterns.
- Numerous ‘Meals’ expenses are clustered just under the $75 approval limit, suggesting possible intentional splitting.
Step 5: Drill-Down Analysis
Use filters and grouping to investigate suspicious entries.
- Group expenses by employee and date.
- Filter for expenses near policy limits.
Mind Map: Drill-Down Analysis
Example:
| Employee ID | Expense Date | Expense Category | Amount | Approval Status |
|---|---|---|---|---|
| E123 | 2024-03-15 | Meals | $74.99 | Approved |
| E123 | 2024-03-15 | Meals | $74.50 | Approved |
| E456 | 2024-04-10 | Travel | $500 | Pending |
This suggests potential splitting of expenses to avoid higher-level approvals.
Step 6: Documenting Findings and Next Steps
- Summarize irregularities with visual evidence.
- Recommend further investigation or policy review.
Mind Map: Documentation & Reporting
Summary
Using EDA, finance professionals can systematically uncover irregular expense patterns by combining statistical summaries, visualizations, and focused drill-downs. This proactive approach enhances audit effectiveness and supports stronger financial controls.
Additional Tips
- Leverage tools like Excel, Power BI, or Python (Pandas, Matplotlib) for EDA.
- Automate repetitive checks to flag anomalies early.
- Collaborate with compliance teams to align findings with organizational policies.
3.5 Best Practice: Documenting EDA Findings for Audit Trails
Effective documentation of Exploratory Data Analysis (EDA) findings is crucial for maintaining transparency, reproducibility, and accountability in audit processes. Proper documentation ensures that audit trails are clear and that findings can be reviewed or challenged by stakeholders, regulators, or future audit teams.
Why Document EDA Findings?
- Transparency: Provides clear evidence of the analytical steps taken.
- Reproducibility: Enables others to replicate the analysis.
- Accountability: Supports audit conclusions with documented data insights.
- Compliance: Meets regulatory and organizational standards for audit trails.
Key Elements to Document in EDA
-
Data Sources and Extraction Methods
- Where the data was obtained
- Extraction dates and tools used
-
Data Cleaning and Transformation Steps
- Handling of missing values
- Data normalization or aggregation
-
Summary Statistics and Visualizations
- Descriptive statistics (mean, median, variance)
- Charts and graphs used to identify patterns or anomalies
-
Anomalies and Outliers Detected
- Description of unusual data points
- Potential reasons or hypotheses
-
Assumptions and Limitations
- Any assumptions made during analysis
- Limitations of the data or methods
-
Next Steps or Recommendations
- Suggested areas for deeper investigation
- Proposed audit procedures based on findings
Mind Map: Documenting EDA Findings
Example: Documenting EDA Findings in an Expense Audit
Context: Auditing employee expense claims for irregularities.
-
Data Source: Extracted expense claim data from ERP system on 2024-05-10 using SQL query.
-
Data Cleaning: Removed duplicate entries; imputed missing dates with submission date.
-
Summary Statistics: Average claim amount: $150; median: $120; max: $5,000.
-
Visualizations: Boxplot revealed several high-value outliers above $3,000.
-
Anomalies: Identified 5 claims exceeding $3,000, flagged for manual review.
-
Assumptions: Assumed all claims are in USD; exchange rates not applied.
-
Recommendations: Investigate high-value claims for policy compliance.
Mind Map: Example Documentation for Expense Audit
Tips for Effective Documentation
- Use standardized templates or checklists to ensure consistency.
- Include screenshots or exports of key visualizations.
- Maintain version control of documentation to track updates.
- Link documentation to audit workpapers and reports.
- Use clear, concise language avoiding jargon where possible.
By following these best practices, finance professionals can create robust audit trails that enhance the credibility and effectiveness of their audit analytics efforts.
4. Statistical Techniques in Audit Analytics
4.1 Descriptive Statistics for Financial Data Summarization
Descriptive statistics are fundamental tools that finance professionals and auditors use to summarize and understand large volumes of financial data quickly. These statistics provide a snapshot of the data’s central tendency, dispersion, and overall distribution, enabling auditors to identify patterns, trends, and anomalies effectively.
Key Concepts in Descriptive Statistics
- Measures of Central Tendency: Mean, Median, Mode
- Measures of Dispersion: Range, Variance, Standard Deviation, Interquartile Range (IQR)
- Shape of Distribution: Skewness, Kurtosis
Mind Map: Overview of Descriptive Statistics
Why Descriptive Statistics Matter in Auditing
- Data Summarization: Quickly condense large datasets into understandable metrics.
- Benchmarking: Compare financial metrics across periods or entities.
- Anomaly Detection: Identify outliers or unusual transactions.
- Risk Assessment: Understand variability and volatility in financial data.
Practical Example 1: Summarizing Monthly Sales Data
Imagine an auditor analyzing monthly sales revenue for a technology company over one year. The raw data consists of 12 monthly revenue figures (in $ thousands):
[120, 135, 150, 160, 155, 170, 165, 180, 175, 190, 185, 200]
Step 1: Calculate Measures of Central Tendency
-
Mean (Average): Sum all values and divide by 12
\( \text{Mean} = \frac{120 + 135 + … + 200}{12} = \frac{1985}{12} = 165.42 \)
-
Median: Middle value when data is sorted
Sorted data:
[120, 135, 150, 155, 160, 165, 170, 175, 180, 185, 190, 200]Median = Average of 6th and 7th values = (165 + 170)/2 = 167.5
-
Mode: No repeating values, so no mode.
Step 2: Calculate Measures of Dispersion
-
Range = Max - Min = 200 - 120 = 80
-
Variance and Standard Deviation (using sample formula):
Calculate each deviation from mean, square it, sum, divide by n-1:
Variance \( s^2 \approx 263.24 \)
Standard Deviation \( s \approx 16.22 \)
Interpretation:
- The average monthly sales revenue is approximately $165.42k.
- The data is fairly consistent with a standard deviation of $16.22k.
- Range shows the spread between the lowest and highest months is $80k.
Mind Map: Steps to Summarize Financial Data
Practical Example 2: Detecting Anomalies in Expense Reports
An auditor reviews expense amounts submitted by employees over a quarter. The amounts (in $) are:
[50, 75, 60, 55, 500, 65, 70, 58, 62, 55]
Step 1: Calculate Mean and Standard Deviation
-
Mean: \( \frac{50 + 75 + 60 + 55 + 500 + 65 + 70 + 58 + 62 + 55}{10} = \frac{1050}{10} = 105 \)
-
Standard Deviation (approximate): High due to 500
Step 2: Identify Outlier
- The value 500 is much higher than the others.
- Using the rule of thumb, values more than 2 standard deviations from the mean are potential outliers.
Step 3: Investigate
- Auditor flags the $500 expense for further review.
Best Practices for Using Descriptive Statistics in Auditing
- Always visualize data alongside statistics (e.g., histograms, boxplots).
- Use median and IQR for skewed data to avoid distortion by outliers.
- Document assumptions and methods used for calculations.
- Combine descriptive statistics with domain knowledge to interpret results effectively.
Summary
Descriptive statistics provide finance professionals and auditors with essential tools to summarize and interpret financial data efficiently. By mastering these concepts, auditors can enhance their ability to detect irregularities, assess risks, and communicate findings clearly.
Additional Mind Map: Integrating Descriptive Statistics in Audit Workflow
4.2 Inferential Statistics: Hypothesis Testing in Audits
Inferential statistics is a powerful branch of statistics that allows auditors to make conclusions about a population based on a sample of data. One of the core techniques in inferential statistics is hypothesis testing, which helps auditors validate assumptions and detect anomalies or irregularities in financial data.
What is Hypothesis Testing?
Hypothesis testing is a systematic method to evaluate claims or assumptions (hypotheses) about a population parameter using sample data. It involves:
- Formulating a null hypothesis (H0) that represents the status quo or no effect.
- Formulating an alternative hypothesis (H1) that represents the claim or effect.
- Using sample data to determine whether there is enough evidence to reject H0 in favor of H1.
Why Hypothesis Testing Matters in Auditing
- Detecting Errors or Fraud: Test if observed anomalies are statistically significant or due to random chance.
- Validating Controls: Assess effectiveness of internal controls by testing compliance rates.
- Sampling Decisions: Infer population characteristics from audit samples without examining every transaction.
Mind Map: Hypothesis Testing Process in Auditing
Step-by-Step Example: Testing Expense Reimbursement Compliance
Scenario: An auditor wants to test if the proportion of expense reports compliant with company policy is at least 95%. The auditor samples 100 expense reports and finds 90 compliant.
-
Define Hypotheses:
- H0: p ≥ 0.95 (compliance rate is at least 95%)
- H1: p < 0.95 (compliance rate is less than 95%)
-
Select Significance Level: α = 0.05
-
Calculate Test Statistic: Using a one-proportion z-test:
\[ z = \frac{\hat{p} - p_0}{\sqrt{\frac{p_0(1-p_0)}{n}}} \]
Where:
- \( \hat{p} = 0.90 \) (sample proportion)
- \( p_0 = 0.95 \) (hypothesized proportion)
- \( n = 100 \)
Calculation:
\[ z = \frac{0.90 - 0.95}{\sqrt{\frac{0.95 \times 0.05}{100}}} = \frac{-0.05}{\sqrt{0.000475}} = \frac{-0.05}{0.0218} = -2.29 \]
-
Determine P-value: For a left-tailed test, P-value = P(Z < -2.29) ≈ 0.011
-
Decision: Since 0.011 < 0.05, reject H0.
-
Conclusion: There is sufficient evidence to conclude the compliance rate is less than 95%, indicating a potential issue with expense report compliance.
Mind Map: Example Breakdown - Expense Compliance Test
Additional Example: Testing Mean Transaction Amount
Scenario: An auditor suspects that the average transaction amount in a particular account is higher than the reported $1,000. A sample of 50 transactions shows a mean of $1,080 with a standard deviation of $200.
-
Hypotheses:
- H0: μ = $1,000
- H1: μ > $1,000
-
Significance Level: α = 0.05
-
Calculate Test Statistic: Using a t-test:
\[ t = \frac{\bar{x} - \mu_0}{s / \sqrt{n}} = \frac{1080 - 1000}{200 / \sqrt{50}} = \frac{80}{28.28} = 2.83 \]
-
Degrees of Freedom: 49
-
P-value: For t = 2.83 and df=49, P-value ≈ 0.003
-
Decision: Since 0.003 < 0.05, reject H0.
-
Conclusion: The average transaction amount is significantly higher than $1,000, warranting further investigation.
Mind Map: Mean Transaction Amount Test
Best Practices for Hypothesis Testing in Audits
- Clearly Define Hypotheses: Ensure hypotheses are specific, measurable, and relevant to audit objectives.
- Choose Appropriate Test: Select tests based on data type (proportion, mean) and sample size.
- Set Significance Level Thoughtfully: Commonly 0.05, but adjust based on risk tolerance.
- Validate Assumptions: Check normality, independence, and sample size adequacy.
- Document Process and Results: Maintain transparency and audit trail.
- Combine Statistical Evidence with Professional Judgment: Use results as one input among many.
Summary
Hypothesis testing empowers auditors to make data-driven decisions by assessing whether observed data provides sufficient evidence to challenge assumptions or detect irregularities. By integrating inferential statistics into audit procedures, finance professionals can enhance the rigor and reliability of their audits.
For further reading, consider exploring:
- “Statistical Techniques in Auditing” by Auditing Standards Board
- Online courses on inferential statistics and hypothesis testing
- Audit analytics software with built-in statistical testing capabilities
4.3 Regression Analysis for Risk Assessment
Regression analysis is a powerful statistical tool used by auditors and finance professionals to understand relationships between variables and to predict outcomes. In the context of audit analytics, regression helps assess financial risks by modeling how different factors influence key risk indicators.
What is Regression Analysis?
Regression analysis estimates the relationship between a dependent variable (outcome) and one or more independent variables (predictors). It helps quantify the strength and form of these relationships.
- Simple Linear Regression: One independent variable predicting one dependent variable.
- Multiple Linear Regression: Multiple independent variables predicting one dependent variable.
Why Use Regression Analysis in Risk Assessment?
- Identify key risk drivers impacting financial outcomes.
- Quantify the effect of changes in predictors on risk levels.
- Predict potential risk exposure under different scenarios.
- Support evidence-based audit decisions.
Mind Map: Regression Analysis Workflow in Audit Risk Assessment
Example 1: Predicting Credit Risk Using Multiple Regression
Scenario: An auditor wants to assess the credit risk of clients based on financial ratios and payment history.
- Dependent Variable: Credit Risk Score (scale 1-100)
- Independent Variables: Debt-to-Equity Ratio, Days Sales Outstanding (DSO), Previous Default Flag (binary)
Steps:
- Collect historical data on clients including their credit risk scores and financial metrics.
- Fit a multiple linear regression model: \[ \text{Credit Risk} = \beta_0 + \beta_1(\text{Debt-to-Equity}) + \beta_2(\text{DSO}) + \beta_3(\text{Default Flag}) + \epsilon \]
- Interpret coefficients:
- Positive \(\beta_1\) means higher debt-to-equity increases risk.
- Positive \(\beta_2\) means longer DSO increases risk.
- \(\beta_3\) indicates how previous defaults impact risk.
- Use the model to predict risk for new clients and prioritize audit focus.
Mind Map: Example 1 Breakdown
Example 2: Assessing Fraud Risk Based on Transaction Patterns
Scenario: An auditor analyzes transaction data to assess fraud risk by modeling the relationship between transaction frequency, average transaction size, and flagged suspicious activities.
- Dependent Variable: Fraud Risk Score (continuous scale)
- Independent Variables: Number of Transactions per Month, Average Transaction Amount, Number of Flagged Transactions
Steps:
- Aggregate transaction data per client.
- Fit a multiple regression model to quantify how transaction behavior influences fraud risk.
- Identify which variables significantly predict fraud risk.
- Use model predictions to flag high-risk clients for deeper audit.
Mind Map: Example 2 Breakdown
Best Practices for Using Regression in Audit Risk Assessment
- Ensure Data Quality: Accurate and complete data is critical for reliable models.
- Check Model Assumptions: Validate linearity, independence, normality of residuals, and homoscedasticity.
- Avoid Overfitting: Use appropriate variable selection techniques and cross-validation.
- Interpret Results in Context: Combine statistical findings with professional judgment.
- Document the Process: Maintain clear audit trails for model development and usage.
Summary
Regression analysis equips finance professionals and auditors with a quantitative method to assess and predict risks by understanding relationships between financial variables. When applied thoughtfully with quality data and domain expertise, it enhances audit effectiveness and supports proactive risk management.
4.4 Time Series Analysis for Trend Detection in Financial Transactions
Time series analysis is a powerful statistical technique used to analyze sequences of data points collected or recorded at successive points in time. For finance professionals and auditors, time series analysis enables the detection of patterns, trends, and seasonal variations in financial transactions, which can be critical for identifying anomalies, forecasting, and risk assessment.
What is Time Series Analysis?
Time series analysis involves methods to analyze time-ordered data to extract meaningful statistics and characteristics. It helps auditors understand how financial metrics evolve over time, detect unusual activities, and predict future trends.
Why Use Time Series Analysis in Auditing?
- Trend Detection: Identify upward or downward trends in revenue, expenses, or cash flows.
- Seasonality Identification: Detect recurring patterns such as monthly sales spikes or quarterly expense fluctuations.
- Anomaly Detection: Spot irregular transactions or sudden changes that may indicate errors or fraud.
- Forecasting: Predict future financial outcomes to support audit planning and risk management.
Key Concepts in Time Series Analysis
Mind Map: Key Concepts in Time Series Analysis
Step-by-Step Example: Detecting Trends in Monthly Expense Transactions
Scenario: An auditor wants to analyze a company’s monthly expense transactions over two years to detect any unusual trends or seasonal patterns.
-
Data Collection: Extract monthly total expenses from the accounting system for 24 months.
-
Visualization: Plot the time series data to observe overall patterns.
-
Decomposition: Break down the time series into trend, seasonal, and residual components.
-
Moving Average: Apply a 3-month moving average to smooth short-term fluctuations.
-
Seasonality Check: Identify if expenses spike during certain months (e.g., year-end bonuses).
-
Anomaly Detection: Look for months where expenses deviate significantly from the trend or seasonal pattern.
-
Interpretation: Investigate anomalies for potential errors or fraud.
Mind Map: Monthly Expense Trend Detection Process
Practical Example with Sample Data
| Month | Total Expenses (USD) |
|---|---|
| Jan 2022 | 120,000 |
| Feb 2022 | 115,000 |
| Mar 2022 | 130,000 |
| … | … |
| Dec 2023 | 160,000 |
- After plotting, a steady upward trend is visible.
- Seasonal spikes occur every December, likely due to holiday bonuses.
- An unexpected spike in July 2023 prompts further review.
Tools and Techniques for Time Series Analysis
- Excel: Basic line charts, moving averages.
- Python (Pandas, statsmodels): Advanced decomposition, ARIMA modeling.
- Tableau/Power BI: Interactive visualizations and dashboards.
Best Practice: Combining Time Series Analysis with Domain Knowledge
While statistical methods highlight trends and anomalies, auditors should always interpret findings in the context of business operations, seasonality, and external factors to avoid false positives.
Summary
Time series analysis equips auditors with the ability to detect meaningful trends and irregularities in financial transactions over time. By combining visualization, decomposition, and smoothing techniques, finance professionals can enhance audit quality, improve risk assessment, and support data-driven decision-making.
4.5 Example: Applying Statistical Tests to Detect Revenue Recognition Issues
Revenue recognition is a critical area in financial audits, often susceptible to manipulation or errors. Statistical tests can help auditors identify anomalies or inconsistencies that may indicate revenue recognition issues. This section provides a detailed example of how to apply statistical tests in this context, supported by mind maps and practical examples.
Understanding Revenue Recognition Issues
Revenue recognition issues often arise when revenue is recorded prematurely, deferred improperly, or manipulated to meet financial targets. Detecting these requires analyzing transaction patterns, timing, and amounts.
Step 1: Define the Audit Objective
- Detect unusual patterns in revenue transactions that may indicate improper recognition.
- Identify periods with abnormal revenue spikes or dips.
Step 2: Collect and Prepare Data
- Extract revenue transaction data from the ERP system, including dates, amounts, customer details, and invoice statuses.
- Clean data to remove duplicates and correct errors.
Step 3: Select Appropriate Statistical Tests
Common statistical tests for revenue recognition include:
- Benford’s Law Analysis: Detects anomalies in the distribution of leading digits in revenue figures.
- Z-Score Analysis: Identifies outliers in revenue amounts.
- Time Series Analysis: Detects unusual trends or spikes over time.
- Chi-Square Test: Compares observed revenue distributions against expected patterns.
Mind Map: Statistical Tests for Revenue Recognition
Step 4: Apply Benford’s Law Analysis
Example:
- Extract the first digit from each revenue transaction amount.
- Calculate the frequency distribution of these digits.
- Compare with Benford’s expected distribution:
| Digit | Expected % (Benford’s Law) |
|---|---|
| 1 | 30.1% |
| 2 | 17.6% |
| 3 | 12.5% |
| 4 | 9.7% |
| 5 | 7.9% |
| 6 | 6.7% |
| 7 | 5.8% |
| 8 | 5.1% |
| 9 | 4.6% |
- Use a Chi-Square test to assess the goodness of fit.
Interpretation:
- Significant deviations suggest possible manipulation or data issues.
Step 5: Conduct Z-Score Analysis
- Calculate mean (μ) and standard deviation (σ) of revenue amounts.
- Compute Z-Score for each transaction: \( Z = \frac{X - \mu}{\sigma} \)
- Transactions with |Z| > 3 are considered outliers.
Example:
| Transaction ID | Revenue Amount | Z-Score | |
|---|---|---|---|
| 101 | $150,000 | 2.5 | |
| 102 | $1,200,000 | 4.2 | <– Outlier |
| 103 | $175,000 | 3.1 | <– Outlier |
- Investigate outliers for potential revenue recognition issues.
Step 6: Time Series Analysis
- Plot monthly revenue over the audit period.
- Identify unusual spikes or drops inconsistent with business cycles.
Example Mind Map:
Example:
- Revenue steadily grows from Jan to Oct.
- Sudden 50% spike in November without corresponding sales events.
- Flag for further review.
Step 7: Chi-Square Test for Distribution
- Categorize revenue transactions into bins (e.g., ranges of amounts).
- Compare observed frequency in each bin with expected frequency based on historical data.
- Calculate Chi-Square statistic:
\[ \chi^2 = \sum \frac{(O_i - E_i)^2}{E_i} \]
where \(O_i\) = observed frequency, \(E_i\) = expected frequency.
- A high Chi-Square value indicates significant deviation.
Summary Mind Map: Workflow for Detecting Revenue Recognition Issues
Best Practice Tips:
- Combine multiple statistical tests for robust detection.
- Always contextualize statistical findings with business knowledge.
- Document assumptions, methods, and results thoroughly for audit trails.
- Use visualization tools to communicate findings effectively.
By following this structured approach and leveraging statistical tests, auditors can efficiently detect potential revenue recognition issues, enhancing audit quality and reducing risk.
4.6 Best Practice: Validating Statistical Models with Real Audit Data
Validating statistical models is a critical step in audit analytics to ensure that the insights and predictions generated are reliable, accurate, and actionable. Using real audit data for validation helps uncover model limitations, biases, and areas for improvement, ultimately strengthening audit conclusions.
Why Validate Statistical Models?
- Accuracy Assurance: Confirm that the model predicts or classifies correctly.
- Reliability: Ensure consistent performance across different datasets.
- Risk Mitigation: Avoid false positives/negatives that could mislead audit decisions.
- Regulatory Compliance: Demonstrate due diligence and robustness in audit procedures.
Steps to Validate Statistical Models Using Real Audit Data
Example: Validating a Regression Model to Detect Revenue Recognition Anomalies
Scenario: An auditor builds a regression model to predict expected monthly revenue based on historical sales data and economic indicators. The goal is to flag months where actual revenue significantly deviates from predicted values, indicating potential misstatements.
Validation Process:
-
Data Preparation:
- Collected 3 years of monthly revenue data.
- Cleaned missing entries and normalized economic indicators.
-
Data Splitting:
- Used 70% of data for training, 15% for validation, and 15% for testing.
-
Performance Metrics:
- Calculated Mean Absolute Error (MAE) and R-squared on validation and test sets.
- MAE was 5% of average monthly revenue, indicating reasonable prediction accuracy.
-
Residual Analysis:
- Plotted residuals to check for non-random patterns.
- Detected a slight seasonal bias, prompting model refinement.
-
Model Refinement:
- Added seasonal dummy variables.
- Re-trained model and improved R-squared by 8%.
-
Final Validation:
- Tested on unseen data with consistent performance.
- Documented validation steps and results in audit working papers.
Example: Validating a Classification Model for Fraud Detection
Scenario: An auditor uses a logistic regression model to classify transactions as ‘fraudulent’ or ‘non-fraudulent’ based on transaction attributes.
Validation Process:
-
Data Preparation:
- Balanced dataset using oversampling to address class imbalance.
-
Cross-Validation:
- Performed 5-fold cross-validation to assess model stability.
-
Performance Metrics:
- Precision: 92%
- Recall: 85%
- F1 Score: 88%
-
Threshold Tuning:
- Adjusted classification threshold to optimize recall without sacrificing precision.
-
Confusion Matrix Analysis:
- Identified false positives and false negatives.
- Investigated false positives to improve feature engineering.
-
Documentation:
- Detailed model validation report included in audit files.
Tips for Effective Model Validation
- Use Realistic and Representative Data: Ensure audit data reflects the diversity and complexity of real-world scenarios.
- Iterate Validation: Continuously validate models as new data becomes available.
- Engage Domain Experts: Collaborate with auditors to interpret model outputs and validation results.
- Maintain Transparency: Keep clear documentation for audit trail and regulatory review.
Summary Mind Map
By rigorously validating statistical models with real audit data, finance professionals can confidently leverage audit analytics to enhance risk detection, improve audit quality, and support data-driven decision-making.
5. Fraud Detection and Risk Assessment Using Analytics
5.1 Understanding Fraud Risk Indicators in Finance and Tech
Fraud risk indicators are specific signs or patterns that suggest the possibility of fraudulent activity within financial and technological environments. For finance professionals, especially auditors and accountants, recognizing these indicators early is crucial to mitigating risks and protecting organizational assets.
What Are Fraud Risk Indicators?
Fraud risk indicators are red flags or warning signs that may point to potential fraud. They can be quantitative (numerical anomalies) or qualitative (behavioral or procedural irregularities).
Categories of Fraud Risk Indicators
Detailed Explanation with Examples
-
Financial Anomalies
- Unusual Transactions: Transactions that deviate from normal patterns, such as large one-time payments or transactions outside regular business hours.
- Example: A tech company’s auditor notices a series of high-value payments to a vendor that was recently added without proper approval.
- Round Dollar Amounts: Fraudsters often use round numbers to avoid complexity.
- Example: Multiple expense reimbursements exactly at $1,000, which is unusual compared to typical varied amounts.
- Duplicate Payments: Paying the same invoice twice due to weak controls.
- Example: An auditor finds two payments made for the same invoice number in the finance system.
- Unusual Transactions: Transactions that deviate from normal patterns, such as large one-time payments or transactions outside regular business hours.
-
Behavioral Indicators
- Employee Lifestyle Changes: Sudden unexplained wealth or lifestyle upgrades.
- Example: An employee in the finance department suddenly buys a luxury car despite a modest salary.
- Reluctance to Take Leave: Employees committing fraud may avoid leave to prevent detection.
- Example: A payroll clerk refuses vacation repeatedly, raising suspicion.
- Frequent Overrides of Controls: Regular bypassing of internal controls.
- Example: A system administrator frequently overrides approval workflows without valid reasons.
- Employee Lifestyle Changes: Sudden unexplained wealth or lifestyle upgrades.
-
Operational Weaknesses
- Lack of Segregation of Duties: One person controlling multiple conflicting functions.
- Example: The same person who approves invoices also processes payments.
- Poor Documentation: Missing or incomplete supporting documents.
- Example: Expense reports submitted without receipts or with altered documents.
- Inadequate IT Controls: Weak password policies or lack of audit trails.
- Example: Access logs show multiple failed login attempts but no follow-up investigation.
- Lack of Segregation of Duties: One person controlling multiple conflicting functions.
-
External Indicators
- Complaints from Customers: Reports of irregular billing or service issues.
- Example: Customers report being charged for services not rendered.
- Vendor Irregularities: Vendors with suspicious backgrounds or related-party relationships.
- Example: A vendor shares an address with a company executive.
- Regulatory Non-Compliance: Frequent fines or warnings from regulators.
- Example: Repeated late filings of financial reports.
- Complaints from Customers: Reports of irregular billing or service issues.
Mind Map: Behavioral Indicators in Fraud
Practical Example: Detecting Fraud Risk in a Tech Startup
A tech startup’s finance team noticed an unusual pattern of vendor payments:
- Multiple payments to a newly registered vendor with no prior history.
- Payments were often made just below the approval threshold.
- The vendor’s address matched that of a senior employee.
By recognizing these fraud risk indicators, the audit team initiated a deeper investigation, uncovering a kickback scheme.
Best Practice Tips
- Regularly update fraud risk indicator checklists tailored to your industry.
- Use data analytics tools to monitor transactions for anomalies automatically.
- Encourage a whistleblower policy to capture behavioral and external indicators.
- Combine quantitative data with qualitative insights from employee interviews and observations.
Understanding fraud risk indicators empowers finance professionals to proactively identify and address potential fraud, safeguarding organizational integrity and compliance.
5.2 Using Analytics to Identify Suspicious Transactions
Audit analytics empowers finance professionals to detect suspicious transactions by systematically analyzing large volumes of financial data to uncover anomalies, patterns, or behaviors that deviate from the norm. This section explores practical approaches, techniques, and examples to effectively identify potentially fraudulent or erroneous transactions.
Key Steps in Using Analytics to Identify Suspicious Transactions
Mind Map: Analytics Workflow for Suspicious Transaction Detection
Common Analytical Techniques with Examples
-
Statistical Outlier Detection
- Example: Identifying transactions with amounts significantly higher than the average monthly expense for a department.
- Practice: Calculate mean and standard deviation of transaction amounts; flag transactions exceeding mean + 3*std deviation.
-
Rule-Based Filters
- Example: Flagging transactions made outside business hours or to vendors not on the approved list.
- Practice: Implement rules such as “Flag all payments above $10,000 made on weekends”.
-
Pattern Recognition
- Example: Detecting multiple small transactions just below approval thresholds to bypass controls.
- Practice: Analyze transaction sequences for clustering near threshold values.
-
Machine Learning Models
- Example: Using supervised learning to classify transactions as suspicious based on historical labeled data.
- Practice: Train a model on past fraud cases, then score new transactions for risk.
Mind Map: Examples of Suspicious Transaction Indicators
Practical Example: Detecting Suspicious Vendor Payments
Scenario: A finance team wants to identify suspicious payments to vendors in their ERP system.
Approach:
- Extract payment transactions for the last 12 months.
- Calculate average payment amount per vendor.
- Flag payments that exceed twice the vendor’s average payment.
- Cross-reference flagged vendors against an approved vendor list.
- Highlight payments made to vendors not on the list or with inconsistent details.
Outcome:
- Several payments flagged where amounts were unusually high.
- One payment made to a vendor with a similar name but different tax ID, indicating a potential fraudulent vendor.
Best Practice: Combine automated flagging with manual review to validate findings and avoid false positives.
Summary
Using analytics to identify suspicious transactions involves combining data-driven techniques with domain knowledge. By applying statistical methods, rule-based filters, and advanced machine learning models, auditors can efficiently surface transactions that warrant deeper investigation. Mind maps help visualize the workflow and indicators, making it easier to communicate findings and implement controls.
5.3 Machine Learning Techniques for Fraud Detection: An Overview
Machine learning (ML) has revolutionized the way auditors and finance professionals detect and prevent fraud. By leveraging algorithms that learn from data patterns, ML enables more accurate, timely, and scalable fraud detection compared to traditional rule-based methods.
What is Machine Learning in Fraud Detection?
Machine learning involves training models on historical data to identify patterns indicative of fraudulent behavior. These models can then predict or flag suspicious transactions in real-time or during audits.
Key Machine Learning Techniques Used in Fraud Detection
Mind Map: Machine Learning Techniques for Fraud Detection
Supervised Learning
Supervised learning models are trained on labeled datasets where transactions are marked as ‘fraudulent’ or ‘legitimate.’ The model learns to classify new transactions based on these labels.
Example:
- Logistic Regression: Predicts the probability that a transaction is fraudulent based on features such as transaction amount, location, and time.
- Random Forests: An ensemble of decision trees that improves accuracy by reducing overfitting.
Use Case: A bank uses a random forest model trained on past transaction data to flag credit card transactions with unusual spending patterns.
Unsupervised Learning
Unsupervised learning is used when labeled data is scarce. It identifies patterns or clusters in data and flags outliers as potential fraud.
Example:
- Clustering: Groups similar transactions together; transactions that don’t fit any cluster may be fraudulent.
- Anomaly Detection: Detects deviations from normal behavior, such as a sudden spike in transaction amount.
Use Case: An e-commerce company applies clustering to group customer purchase behaviors and flags transactions that fall outside typical clusters for further review.
Semi-Supervised Learning
Combines small amounts of labeled data with large amounts of unlabeled data to improve fraud detection accuracy.
Example: Using a small set of confirmed fraud cases combined with many unlabeled transactions to train a model that generalizes better.
Emerging Techniques: Reinforcement Learning
While still experimental, reinforcement learning can adapt fraud detection strategies dynamically by learning from feedback loops.
Practical Example: Implementing a Fraud Detection Model Using Random Forest
- Data Preparation: Collect transaction data including features like amount, merchant category, time, and user profile.
- Labeling: Mark transactions as ‘fraud’ or ‘non-fraud’ based on historical investigations.
- Feature Engineering: Create new features such as transaction frequency, average transaction amount, and geographic distance from usual locations.
- Model Training: Train a random forest classifier on the labeled dataset.
- Evaluation: Use metrics like precision, recall, and F1-score to assess model performance.
- Deployment: Integrate the model into the transaction processing system to flag suspicious transactions in real-time.
Mind Map: Steps in Machine Learning-Based Fraud Detection
Best Practices for Using Machine Learning in Fraud Detection
- Data Quality: Ensure high-quality, representative data to train accurate models.
- Feature Selection: Use domain knowledge to engineer meaningful features.
- Model Explainability: Choose or complement models with explainability tools to justify flagged transactions.
- Regular Updates: Continuously retrain models to adapt to evolving fraud tactics.
- Human Oversight: Combine ML outputs with auditor expertise to reduce false positives.
By integrating machine learning techniques, finance professionals can significantly enhance their fraud detection capabilities, making audits more efficient and effective.
5.4 Practical Example: Implementing a Fraud Detection Model on Payment Data
Fraud detection is a critical application of audit analytics, especially in finance and tech sectors where payment transactions are frequent and voluminous. In this section, we will walk through a practical example of implementing a fraud detection model on payment data, illustrating best practices and providing mind maps to clarify the process.
Step 1: Understanding the Payment Data
Before building any model, it’s essential to understand the dataset. Typical payment data fields include:
- Transaction ID
- Date and Time
- Amount
- Payment Method (Credit Card, Bank Transfer, etc.)
- Merchant Details
- Customer ID
- Location
- Transaction Status
Example: A dataset from a mid-sized tech company contains 1 million payment transactions over the last year.
Step 2: Defining Fraud Indicators
Fraud indicators are patterns or anomalies that suggest suspicious activity. Common indicators include:
- Transactions with unusually high amounts
- Multiple transactions in a short time frame
- Transactions from unusual locations
- Payment method inconsistencies
- Failed transaction attempts followed by successful ones
Mind Map: Fraud Indicators
Step 3: Data Preparation and Feature Engineering
Transform raw data into features that the model can use:
- Calculate average transaction amount per customer
- Flag transactions above a threshold (e.g., 3x average)
- Count transactions per customer per day
- Encode categorical variables (payment method, location)
- Time-based features (hour of day, day of week)
Example:
| Transaction ID | Amount | Avg Amount (Customer) | Above Threshold | Transactions Today | Payment Method | Hour |
|---|---|---|---|---|---|---|
| 1001 | 1200 | 400 | Yes | 3 | Credit Card | 14 |
Step 4: Selecting and Training the Model
Common models for fraud detection include:
- Logistic Regression
- Decision Trees
- Random Forests
- Gradient Boosting Machines
- Neural Networks
For this example, we use a Random Forest classifier due to its balance between interpretability and performance.
Best Practice: Split data into training (70%) and testing (30%) sets to evaluate model performance.
Step 5: Model Evaluation
Key metrics:
- Precision: How many flagged transactions are truly fraudulent?
- Recall: How many actual frauds were detected?
- F1 Score: Harmonic mean of precision and recall
- ROC-AUC: Overall model discrimination ability
Example:
| Metric | Score |
|---|---|
| Precision | 0.85 |
| Recall | 0.78 |
| F1 Score | 0.81 |
| ROC-AUC | 0.92 |
Step 6: Deploying the Model and Monitoring
- Integrate the model into the payment processing system
- Set up alerts for high-risk transactions
- Continuously monitor model performance and retrain periodically
Mind Map: Fraud Detection Workflow
Additional Example: Flagging Suspicious Transactions
Suppose a customer usually makes payments under $100 but suddenly a $5,000 transaction occurs from a foreign location. The model flags this as high risk based on:
- Amount far exceeding average
- Unusual location
- Time of transaction (e.g., 3 AM local time)
This triggers an alert for auditor review.
Summary of Best Practices in This Example
- Understand your data deeply: Know what each field represents and its typical patterns.
- Feature engineering is key: Transform raw data into meaningful inputs.
- Use appropriate models: Balance complexity and interpretability.
- Evaluate thoroughly: Use multiple metrics to assess performance.
- Deploy with monitoring: Fraud patterns evolve, so models must be updated.
By following these steps, finance professionals and auditors can effectively leverage analytics to detect and prevent payment fraud, enhancing organizational security and compliance.
5.5 Best Practice: Combining Analytics with Professional Judgment in Fraud Audits
In fraud audits, relying solely on data analytics can lead to incomplete conclusions or false positives. The most effective approach integrates robust analytical techniques with the seasoned insights and professional judgment of auditors. This combination enhances the accuracy, relevance, and impact of fraud detection efforts.
Why Combine Analytics with Professional Judgment?
- Contextual Understanding: Analytics can flag anomalies, but auditors understand the business context, industry norms, and operational nuances.
- Reducing False Positives: Data patterns may appear suspicious but are sometimes explainable by legitimate business activities.
- Prioritization: Professional judgment helps prioritize which anomalies warrant deeper investigation.
- Ethical Considerations: Human oversight ensures ethical standards are maintained when interpreting sensitive data.
Mind Map: Integrating Analytics and Judgment in Fraud Audits
Practical Example 1: Expense Reimbursement Audit
Scenario: Analytics flags a cluster of expense claims with unusually high amounts submitted on Fridays.
- Analytics Insight: Pattern recognition identifies a spike in claims on Fridays exceeding typical thresholds.
- Professional Judgment Application: Auditor reviews company policy and seasonal business cycles, realizing Fridays are often when employees travel back from client sites, justifying higher expenses.
- Outcome: Instead of flagging all Friday claims as suspicious, the auditor focuses on claims exceeding policy limits or lacking proper documentation.
Practical Example 2: Vendor Payment Fraud Detection
Scenario: Predictive models highlight several payments to a new vendor as potential fraud risks.
- Analytics Insight: Unusual payment amounts and frequency compared to historical vendor data.
- Professional Judgment Application: Auditor investigates vendor onboarding records, confirms vendor legitimacy, and checks for contract approvals.
- Outcome: Fraud risk is mitigated by combining data signals with verification of vendor credentials and approvals.
Mind Map: Steps to Combine Analytics with Professional Judgment
Best Practice Tips
- Engage Cross-Functional Teams: Include finance, compliance, and operational experts to enrich judgment.
- Maintain Audit Trails: Document how professional judgment influenced decisions to ensure transparency.
- Use Analytics as a Guide, Not a Verdict: Treat analytics as a tool to inform, not replace, human decision-making.
- Continuously Update Models: Incorporate auditor feedback to refine analytics algorithms.
- Train Auditors in Analytics: Equip auditors with data literacy to better interpret analytics outputs.
By thoughtfully combining data-driven insights with human expertise, finance professionals can significantly enhance the effectiveness and credibility of fraud audits, leading to more accurate detection and stronger organizational controls.
6. Continuous Auditing and Monitoring with Analytics
6.1 Concept and Benefits of Continuous Auditing
Continuous auditing is an innovative auditing approach that enables finance professionals to perform audit-related activities on an ongoing basis rather than at fixed intervals. This method leverages technology and data analytics to provide real-time or near-real-time assurance over financial transactions and controls.
What is Continuous Auditing?
Continuous auditing involves the automated collection and analysis of financial and operational data to detect anomalies, risks, or control failures as they occur. Unlike traditional audits, which are periodic and retrospective, continuous auditing is proactive and dynamic, allowing auditors to identify issues early and respond promptly.
Mind Map: Core Components of Continuous Auditing
Benefits of Continuous Auditing
-
Timely Risk Identification
- Continuous auditing enables early detection of irregularities such as fraudulent transactions or compliance breaches.
- Example: An automated system flags unusual vendor payments exceeding predefined thresholds immediately, allowing auditors to investigate before significant losses occur.
-
Improved Audit Coverage
- By analyzing 100% of transactions rather than samples, auditors gain comprehensive insights.
- Example: Instead of sampling expense reports quarterly, continuous auditing reviews every expense claim daily, reducing the risk of oversight.
-
Increased Efficiency and Cost Savings
- Automation reduces manual audit tasks, freeing auditors to focus on high-risk areas.
- Example: Automated reconciliation of bank statements reduces time spent on routine checks.
-
Enhanced Compliance and Control
- Continuous monitoring ensures controls are functioning effectively at all times.
- Example: Real-time alerts notify auditors if segregation of duties controls are bypassed in the finance system.
-
Better Decision-Making Support
- Up-to-date audit insights empower management to make informed decisions quickly.
- Example: A dashboard showing current risk levels helps CFOs prioritize resource allocation.
-
Facilitates Continuous Improvement
- Ongoing feedback from continuous auditing helps refine processes and controls.
- Example: Repeated alerts about late invoice approvals lead to process redesign to speed up approvals.
Mind Map: Benefits of Continuous Auditing
Practical Example: Continuous Auditing in Expense Management
A mid-sized tech company implements continuous auditing for its expense management system. Automated scripts extract expense data daily and analyze it against predefined rules such as:
- Expense amount thresholds
- Duplicate claims
- Policy violations (e.g., travel expenses exceeding limits)
When an anomaly is detected, the system sends an alert to the audit team with detailed transaction information. This allows auditors to investigate and resolve issues promptly, reducing the risk of financial leakage and ensuring compliance with company policies.
Summary
Continuous auditing transforms the traditional audit process by embedding automation and analytics into everyday financial operations. For finance professionals, adopting continuous auditing means enhanced risk management, improved operational efficiency, and stronger assurance over financial integrity.
6.2 Setting Up Automated Data Feeds for Real-Time Analysis
In today’s fast-paced financial and tech sectors, auditors and finance professionals increasingly rely on real-time data to make timely, informed decisions. Automated data feeds enable continuous auditing by providing up-to-date information directly from source systems, reducing manual intervention and minimizing errors.
What Are Automated Data Feeds?
Automated data feeds are continuous, scheduled, or event-triggered data transfers from operational systems (e.g., ERP, CRM, payment gateways) into audit analytics platforms or data warehouses. These feeds ensure that auditors have access to the latest transactional and financial data for real-time analysis.
Benefits of Automated Data Feeds
- Timeliness: Immediate access to fresh data enables quicker detection of anomalies and risks.
- Accuracy: Reduces manual data handling errors.
- Efficiency: Saves time by eliminating repetitive data extraction tasks.
- Scalability: Supports large volumes of data and complex audit environments.
Key Components to Consider When Setting Up Automated Data Feeds
Step-by-Step Guide to Setting Up Automated Data Feeds
Identify Relevant Data Sources
- Example: For an audit of expense claims, relevant sources might include the company’s ERP system, credit card transaction logs, and employee reimbursement portals.
Choose Data Extraction Methods
- APIs: Many modern systems provide APIs for direct data access.
- ETL (Extract, Transform, Load) Tools: Tools like Talend, Informatica, or Microsoft SSIS can schedule and automate data extraction.
- Webhooks: Event-driven data pushes from source systems.
Example: Using the ERP system’s REST API to pull daily transaction records.
Data Transformation and Cleaning
- Normalize data formats (e.g., date formats, currency).
- Remove duplicates and handle missing values.
Example: Converting all date fields to ISO 8601 format to maintain consistency across feeds.
Load Data into Audit Analytics Platform
- Use secure, automated processes to load data into a centralized data warehouse or directly into analytics tools like Power BI or Tableau.
Implement Monitoring and Alerts
- Set up automated alerts for feed failures or data anomalies.
Example: An alert triggers if daily transaction volume drops below a threshold, indicating a possible data feed issue.
Ensure Security and Compliance
- Encrypt data in transit and at rest.
- Restrict access based on roles.
- Comply with regulations such as GDPR or SOX.
Practical Example: Automated Data Feed for Expense Auditing
Scenario: A finance team wants to continuously monitor employee expense claims to detect potential fraud or policy violations.
- Data Sources: ERP expense module, corporate credit card transactions, HR system.
- Extraction: Use API connections to pull data every hour.
- Transformation: Standardize merchant names, categorize expenses, and flag missing receipts.
- Loading: Data is pushed to a cloud-based audit analytics platform.
- Monitoring: Automated alerts notify auditors if expenses exceed predefined limits or if duplicate claims appear.
This setup allows auditors to review suspicious transactions almost in real-time, improving the speed and effectiveness of audits.
Mind Map: Practical Example Workflow
Best Practices for Automated Data Feeds
- Start Small: Begin with critical data feeds and expand gradually.
- Document Processes: Maintain clear documentation of data sources, extraction methods, and transformation rules.
- Test Thoroughly: Validate data accuracy and completeness before going live.
- Collaborate: Work closely with IT, finance, and audit teams to ensure alignment.
- Review Regularly: Periodically assess feed performance and update as systems evolve.
By setting up automated data feeds thoughtfully, finance professionals and auditors can leverage real-time data to enhance audit quality, reduce risks, and drive more proactive decision-making.
6.3 Key Performance Indicators (KPIs) and Metrics for Ongoing Monitoring
In continuous auditing and monitoring, KPIs and metrics serve as vital tools to track the health, efficiency, and risk exposure of financial processes in real time. Selecting the right KPIs allows finance professionals and auditors to detect anomalies early, ensure compliance, and drive improvements.
What are KPIs and Metrics in Audit Analytics?
- KPIs (Key Performance Indicators): Quantifiable measures that reflect critical success factors of an audit process or financial control.
- Metrics: Broader measurements that provide detailed insights into specific aspects of financial data or operations.
Why KPIs and Metrics Matter in Ongoing Monitoring
- Enable proactive risk management.
- Provide transparency and accountability.
- Facilitate data-driven decision-making.
- Support regulatory compliance.
Mind Map: Categories of KPIs and Metrics for Audit Monitoring
Examples of KPIs and Metrics with Practical Applications
Error Rate in Transactions
- Definition: Percentage of transactions containing errors or discrepancies.
- Example: If out of 10,000 transactions, 150 have errors, the error rate is 1.5%.
- Best Practice: Set threshold limits (e.g., <1%) and trigger alerts when exceeded.
Reconciliation Timeliness
- Definition: Average time taken to reconcile accounts or transactions.
- Example: If monthly bank reconciliations are completed within 5 days consistently, it indicates efficiency.
- Best Practice: Use dashboards to monitor reconciliation status daily.
Percentage of Transactions Meeting Policy
- Definition: Proportion of transactions that comply with internal controls and policies.
- Example: 98% of expense claims adhere to company policy; 2% are exceptions requiring review.
- Best Practice: Automate policy checks using rule-based analytics.
Number of Suspicious Transactions Flagged
- Definition: Count of transactions identified as potentially fraudulent or unusual.
- Example: Analytics flags 10 suspicious transactions monthly for further investigation.
- Best Practice: Combine multiple indicators (e.g., amount thresholds, frequency) to improve detection accuracy.
Time to Resolve Audit Findings
- Definition: Average duration from identification to closure of audit issues.
- Example: Audit findings resolved within 30 days on average.
- Best Practice: Track this KPI to improve responsiveness and accountability.
Mind Map: Example KPI Dashboard Components
Integrating KPIs into Continuous Monitoring
- Automate Data Collection: Use APIs and data connectors to feed live data into analytics platforms.
- Set Thresholds and Alerts: Define acceptable KPI ranges and configure alerts for deviations.
- Regular Review Meetings: Discuss KPI trends with audit and finance teams to identify improvement areas.
- Example: A tech company monitors “Duplicate Payment Frequency” KPI daily; when it spikes above 0.5%, the system automatically notifies the audit team to investigate.
Summary
KPIs and metrics are the backbone of effective ongoing audit monitoring. By carefully selecting relevant indicators, setting clear thresholds, and leveraging automation, finance professionals can enhance audit quality, reduce risks, and ensure compliance in a dynamic environment.
6.4 Example: Continuous Monitoring of Expense Claims Using Analytics
Continuous monitoring of expense claims is a critical process for finance professionals aiming to detect anomalies, prevent fraud, and ensure compliance in real-time. Leveraging audit analytics transforms traditional periodic reviews into dynamic, ongoing oversight.
Why Continuous Monitoring of Expense Claims?
- Early Detection of Irregularities: Spot suspicious patterns before they escalate.
- Improved Compliance: Ensure adherence to company policies and regulatory requirements.
- Operational Efficiency: Automate routine checks, freeing auditors for higher-value tasks.
Step-by-Step Process for Continuous Monitoring
Example Scenario: Detecting Duplicate Expense Claims
Context: A mid-sized tech company wants to continuously monitor expense claims submitted by employees to prevent duplicate reimbursements.
Approach:
- Data Extraction: Pull expense claim data daily from the expense management system.
- Data Preparation: Normalize employee names, dates, and amounts.
- Analytics Rule: Flag claims where the same employee submits expenses with identical amounts and dates within a short timeframe.
Example Data:
| Employee | Date | Amount | Expense Description |
|---|---|---|---|
| John D. | 2024-05-01 | $150 | Client Meeting Lunch |
| John D. | 2024-05-01 | $150 | Client Meeting Lunch |
| Sarah K. | 2024-05-02 | $200 | Travel to Conference |
Result: The system flags John D.’s two identical claims for review.
Mind Map: Duplicate Detection Logic
Example Scenario: Anomaly Detection in Expense Amounts
Context: The finance team wants to identify expense claims that significantly deviate from typical amounts to catch potential misuse.
Approach:
- Calculate average and standard deviation of expense amounts per category (e.g., meals, travel).
- Flag claims exceeding mean + 2 standard deviations.
Example:
- Average meal expense: $50
- Standard deviation: $15
- Threshold for flagging: $80
If an employee submits a meal expense claim of $120, it triggers an alert.
Mind Map: Anomaly Detection Workflow
Best Practices for Continuous Monitoring of Expense Claims
- Automate Data Integration: Use APIs to pull data from multiple systems daily.
- Define Clear Rules: Align analytics rules with company policies.
- Use Visualization Dashboards: Provide auditors with intuitive tools to monitor flagged claims.
- Maintain an Audit Trail: Document all flagged cases and actions taken.
- Regularly Update Models: Adapt thresholds and detection logic based on evolving expense patterns.
Sample Dashboard Features
- Real-Time Alerts: Notifications for flagged claims.
- Summary Statistics: Total claims, flagged claims, and trends over time.
- Drill-Down Capability: View detailed claim information for investigation.
- Filter Options: By employee, department, date range, and expense category.
Summary
Continuous monitoring of expense claims using audit analytics empowers finance professionals to proactively manage risks and improve compliance. By combining automated data processing, anomaly detection, and clear reporting, organizations can significantly reduce errors and fraud while enhancing audit efficiency.
6.5 Best Practice: Integrating Continuous Auditing into Existing Audit Frameworks
Continuous auditing is a transformative approach that allows finance professionals to monitor and assess controls and transactions in near real-time. Integrating continuous auditing into your existing audit frameworks enhances efficiency, risk detection, and compliance. Below is a detailed guide on best practices for this integration, supported by mind maps and practical examples.
Understanding the Integration Process
To successfully embed continuous auditing, it’s essential to map out how it fits within your current audit lifecycle, technology stack, and organizational processes.
Mind Map: Integration of Continuous Auditing into Existing Frameworks
Step 1: Align Continuous Auditing Objectives with Audit Strategy
- Example: If your organization focuses on revenue recognition risks, set continuous auditing to monitor revenue transactions daily rather than quarterly.
- Best Practice: Use risk assessments to prioritize which controls or processes require continuous monitoring.
Step 2: Leverage Existing Data and Technology Infrastructure
- Example: Integrate continuous auditing tools with your ERP system (e.g., SAP, Oracle) to pull transactional data automatically.
- Best Practice: Ensure data quality by implementing validation checks before analytics processing.
Mind Map: Data Infrastructure for Continuous Auditing
Step 3: Automate Monitoring and Exception Reporting
- Example: Set up automated alerts for unusual vendor payments exceeding predefined thresholds.
- Best Practice: Define clear thresholds and rules to minimize false positives and focus auditor attention on genuine anomalies.
Step 4: Embed Continuous Auditing into Audit Execution and Reporting
- Example: Incorporate continuous audit findings into regular audit reports and dashboards for management.
- Best Practice: Use interactive dashboards that update in real-time, enabling auditors and stakeholders to track issues promptly.
Mind Map: Reporting and Communication
Step 5: Establish Feedback Loops for Continuous Improvement
- Example: After identifying recurring exceptions in expense claims, update audit procedures to include enhanced controls.
- Best Practice: Schedule periodic reviews of continuous auditing effectiveness and adjust parameters accordingly.
Practical Example: Integrating Continuous Auditing in Expense Management
Scenario: A tech company wants to continuously audit employee expense claims to detect potential fraud or policy violations.
- Planning: Identify expense categories with highest risk (e.g., travel, entertainment).
- Data Integration: Connect continuous auditing software to the expense management system.
- Automation: Set rules to flag claims exceeding $500 or submitted outside business hours.
- Execution: Monitor flagged transactions daily and assign auditors for follow-up.
- Reporting: Use dashboards to visualize trends and exceptions.
- Feedback: Adjust thresholds based on false positives and emerging risks.
Summary Checklist for Integration
- Define clear objectives aligned with audit strategy
- Map and connect relevant data sources
- Implement data quality controls
- Automate monitoring with well-defined rules
- Integrate findings into reporting and communication channels
- Establish continuous feedback and update mechanisms
By following these best practices, finance professionals can seamlessly integrate continuous auditing into their existing frameworks, enhancing audit effectiveness and organizational risk management.
7. Advanced Analytics Techniques in Auditing
7.1 Introduction to Predictive Analytics for Audit Planning
Predictive analytics is a branch of advanced analytics that uses historical data, statistical algorithms, and machine learning techniques to identify the likelihood of future outcomes. For audit planning, predictive analytics empowers finance professionals to anticipate risks, prioritize audit areas, and allocate resources more effectively.
Why Predictive Analytics Matters in Audit Planning
- Risk Prioritization: Helps identify high-risk transactions or accounts that require deeper scrutiny.
- Resource Optimization: Enables auditors to focus efforts where they are most needed, improving efficiency.
- Proactive Auditing: Shifts the audit approach from reactive to proactive by forecasting potential issues before they materialize.
Core Components of Predictive Analytics in Auditing
Mind Map: Core Components of Predictive Analytics in Auditing
Common Predictive Models Used in Audit Planning
- Regression Models: Predict continuous outcomes such as expected revenue or expense amounts.
- Classification Models: Categorize transactions as ‘high risk’ or ‘low risk’ based on patterns.
- Clustering: Group similar transactions or accounts to detect anomalies or unusual clusters.
Example: Using Predictive Analytics to Prioritize Audit Areas
Imagine an audit team at a mid-sized tech company wants to identify which vendor payments are most likely to contain errors or fraud. They use historical payment data, including payment amounts, vendor types, and past audit findings, to train a classification model.
- The model predicts a risk score for each payment.
- Payments with scores above a certain threshold are flagged for detailed audit.
This approach helps the audit team focus on a smaller subset of transactions with a higher probability of issues, saving time and improving detection rates.
Mind Map: Predictive Analytics Workflow in Audit Planning
Best Practices for Implementing Predictive Analytics in Audit Planning
- Start with Clear Objectives: Define what risks or outcomes you want to predict.
- Use Quality Data: Ensure data is accurate, complete, and relevant.
- Collaborate Across Teams: Work with data scientists, IT, and audit experts.
- Validate Models Thoroughly: Avoid overfitting and ensure models generalize well.
- Interpret Results Carefully: Use analytics as a decision support tool, not a replacement for professional judgment.
Additional Example: Forecasting Revenue Recognition Risks
A finance team uses time series forecasting to predict revenue trends and identify periods where revenue recognition may deviate from expected patterns. By flagging unusual spikes or drops, auditors can plan targeted reviews during those periods.
By integrating predictive analytics into audit planning, finance professionals can enhance their ability to detect risks early, allocate resources efficiently, and ultimately improve audit quality and outcomes.
7.2 Text Analytics and Natural Language Processing in Audit Documentation
Audit documentation often contains vast amounts of unstructured text data, including emails, contracts, memos, and narrative explanations. Text Analytics and Natural Language Processing (NLP) enable finance professionals and auditors to extract meaningful insights from this unstructured data, improving audit quality, efficiency, and risk detection.
What is Text Analytics and NLP?
- Text Analytics involves processing and analyzing text data to derive useful information.
- Natural Language Processing (NLP) is a subset of AI that enables machines to understand, interpret, and generate human language.
These technologies help auditors to automate the review of large volumes of textual audit evidence and identify patterns, anomalies, or risks that might be missed manually.
Key Applications of Text Analytics and NLP in Audit Documentation
Mind Map: Applications of Text Analytics and NLP in Auditing
Example 1: Contract Clause Extraction
Scenario: Auditors need to verify if contracts comply with new regulatory requirements.
Approach: Using NLP techniques like Named Entity Recognition (NER) and pattern matching, auditors can automatically extract clauses related to payment terms, penalties, or confidentiality.
Benefit: This reduces manual review time and ensures consistent compliance checks.
Example 2: Email Sentiment and Keyword Analysis
Scenario: Auditors want to identify potential fraud or compliance issues by analyzing internal communications.
Approach: Sentiment analysis can detect negative or suspicious tones, while keyword detection highlights mentions of risk-related terms (e.g., “kickback,” “off-the-books”).
Benefit: Early identification of red flags that warrant deeper investigation.
Example 3: Automated Summarization of Audit Reports
Scenario: Senior management requires concise summaries of lengthy audit reports.
Approach: NLP-based summarization tools extract key points and generate executive summaries.
Benefit: Enhances communication efficiency and decision-making.
Core NLP Techniques Used in Audit Documentation
Mind Map: Core NLP Techniques for Audit Analytics
Best Practices for Using Text Analytics and NLP in Auditing
- Data Quality: Ensure text data is clean, well-formatted, and relevant.
- Context Awareness: Customize NLP models to understand finance and audit-specific terminology.
- Human Oversight: Combine automated analysis with expert review to validate findings.
- Privacy Compliance: Handle sensitive information securely, adhering to data protection regulations.
- Iterative Improvement: Continuously refine models based on feedback and new data.
Practical Example: Detecting Risky Language in Vendor Communications
- Data Collection: Gather emails and chat logs related to vendor negotiations.
- Preprocessing: Clean text by removing signatures, disclaimers, and irrelevant content.
- Keyword Search: Identify terms like “urgent payment,” “off-record,” or “under the table.”
- Sentiment Analysis: Flag communications with unusually negative or evasive sentiment.
- Topic Modeling: Group communications by themes such as pricing, delivery, or compliance.
- Outcome: Highlight suspicious communications for auditor follow-up.
Summary
Text Analytics and NLP empower auditors to efficiently analyze unstructured audit documentation, uncover hidden risks, and enhance reporting. By integrating these technologies with traditional audit processes, finance professionals can achieve deeper insights and more effective audits.
For further reading, consider exploring tools like Python’s NLTK, spaCy, or commercial audit analytics platforms that incorporate NLP capabilities.
7.3 Network Analysis for Detecting Collusion and Related Party Transactions
Network analysis is a powerful technique used in audit analytics to uncover hidden relationships and patterns among entities such as individuals, companies, and transactions. In the context of auditing, it is especially useful for detecting collusion schemes and identifying related party transactions that may not be apparent through traditional audit methods.
What is Network Analysis?
Network analysis involves mapping and analyzing the connections between nodes (entities) and edges (relationships) to understand the structure and dynamics within a dataset. In audit analytics, nodes can represent vendors, employees, customers, or accounts, while edges represent transactions, communications, or ownership links.
Why Use Network Analysis in Auditing?
- Detect hidden relationships: Identify connections between parties that may indicate conflicts of interest or fraud.
- Reveal collusion: Detect groups of individuals or entities working together to manipulate financial results.
- Spot related party transactions: Uncover transactions between entities with common ownership or control that require disclosure.
Key Concepts in Network Analysis
Mind Map: Key Concepts in Network Analysis
Step-by-Step Approach to Using Network Analysis for Detecting Collusion and Related Party Transactions
- Data Collection: Gather data on transactions, ownership structures, communications, and organizational charts.
- Data Preparation: Clean and format data to define nodes and edges clearly.
- Network Construction: Build the network graph representing entities and their relationships.
- Analysis: Use network metrics and visualization to identify suspicious clusters or central nodes.
- Investigation: Drill down into flagged relationships for further audit procedures.
Example 1: Detecting Collusion Among Vendors and Employees
A finance auditor suspects collusion between procurement staff and certain vendors. Using network analysis:
- Nodes: Employees, Vendors
- Edges: Purchase transactions
By mapping transactions, the auditor identifies a cluster where a small group of employees repeatedly transacts with a limited set of vendors, showing unusually high frequency and volume compared to others.
Mind Map: Collusion Detection Example
This visualization helps auditors prioritize investigation on these clusters, potentially uncovering kickback schemes or bid rigging.
Example 2: Identifying Related Party Transactions in a Corporate Group
An auditor reviews a conglomerate with multiple subsidiaries. Using network analysis:
- Nodes: Subsidiaries, Parent Company, Key Executives
- Edges: Ownership links, financial transactions
The network graph reveals that several transactions occur between subsidiaries that share common executives or ownership but are not disclosed as related party transactions.
Mind Map: Related Party Transaction Detection
This approach helps ensure compliance with accounting standards requiring disclosure of related party transactions.
Best Practices for Network Analysis in Auditing
- Integrate multiple data sources: Combine transactional, ownership, and communication data for a comprehensive view.
- Use appropriate network metrics: Leverage centrality measures to identify influential nodes and clusters.
- Visualize effectively: Use clear and interactive visualizations to communicate findings to stakeholders.
- Validate findings: Corroborate network analysis results with traditional audit procedures and professional judgment.
- Maintain audit trail: Document data sources, analysis steps, and conclusions for transparency and compliance.
Tools Commonly Used for Network Analysis in Auditing
- Gephi: Open-source network visualization tool.
- Neo4j: Graph database for complex relationship queries.
- Python Libraries: NetworkX, igraph for programmatic analysis.
- Tableau/Power BI: For integrating network visuals into dashboards.
Network analysis empowers finance professionals and auditors to uncover complex, hidden relationships that traditional audit techniques might miss, enhancing fraud detection and compliance assurance.
7.4 Example: Using Predictive Models to Prioritize Audit Areas
Predictive models have become a powerful tool in audit analytics, enabling auditors to focus their efforts on the highest-risk areas and optimize resource allocation. This section demonstrates how finance professionals can leverage predictive analytics to prioritize audit areas effectively.
What Are Predictive Models in Auditing?
Predictive models use historical data and statistical algorithms to forecast future outcomes or behaviors. In auditing, these models help predict which transactions, accounts, or processes are most likely to contain errors, fraud, or compliance issues.
Step-by-Step Example: Prioritizing Audit Areas Using Predictive Models
Scenario: A finance audit team in a mid-sized tech company wants to identify which business units or expense categories are most likely to have irregularities, so they can allocate audit resources efficiently.
Step 1: Data Collection
- Gather historical audit findings, transaction data, expense reports, and relevant metadata (e.g., vendor info, approval workflows).
Step 2: Feature Engineering
- Create variables such as:
- Frequency of transactions per vendor
- Average transaction amount
- Number of exceptions found in past audits
- Time since last audit
- Employee tenure or department size
Step 3: Model Selection
- Choose a classification model (e.g., logistic regression, random forest) to predict the likelihood of irregularities.
Step 4: Model Training and Validation
- Train the model on labeled historical data (where irregularities were confirmed).
- Validate the model using cross-validation or a holdout dataset.
Step 5: Scoring and Prioritization
- Apply the model to current data to generate risk scores for each audit area.
- Rank areas by predicted risk to prioritize audit focus.
Step 6: Audit Planning
- Allocate audit resources starting with the highest-risk areas.
Mind Map: Predictive Model Workflow for Audit Prioritization
Practical Example: Logistic Regression to Predict Expense Irregularities
| Feature | Description | Example Value |
|---|---|---|
| Transaction Amount | Amount of expense transaction | $5,000 |
| Vendor Frequency | Number of transactions with vendor | 15 |
| Past Exceptions Count | Number of past audit exceptions | 2 |
| Days Since Last Audit | Days since last audit on area | 180 |
Using these features, a logistic regression model outputs a probability score between 0 and 1 indicating the likelihood of irregularities.
For instance:
- Business Unit A: 0.85 (High risk)
- Business Unit B: 0.30 (Low risk)
The audit team prioritizes Business Unit A for immediate review.
Mind Map: Features Impacting Predictive Model
Best Practices When Using Predictive Models for Audit Prioritization
- Data Quality: Ensure data is accurate, complete, and up-to-date.
- Model Explainability: Use models that provide interpretable results to support audit decisions.
- Continuous Improvement: Regularly retrain models with new audit findings to improve accuracy.
- Integration with Professional Judgment: Combine model outputs with auditor expertise for balanced decision-making.
- Documentation: Maintain clear records of model assumptions, data sources, and decision rationale.
Summary
Using predictive models to prioritize audit areas helps finance professionals focus on the most critical risks, improving audit efficiency and effectiveness. By combining data-driven insights with auditor expertise, organizations can proactively identify potential issues and allocate resources where they matter most.
7.5 Best Practice: Ensuring Transparency and Explainability in Advanced Analytics
In the realm of advanced audit analytics, particularly when employing machine learning models, predictive analytics, or complex algorithms, transparency and explainability are paramount. Finance professionals and auditors must not only trust the results but also be able to clearly communicate how conclusions were reached to stakeholders, regulators, and clients.
Why Transparency and Explainability Matter
- Regulatory Compliance: Many regulations require auditors to justify their findings and methodologies.
- Stakeholder Trust: Transparent models build confidence among management and audit committees.
- Error Detection: Explainable models help identify biases or errors in data or assumptions.
- Ethical Responsibility: Ensures analytics are used fairly and responsibly.
Key Components of Transparency and Explainability
Mind Map: Components of Transparency and Explainability
Practical Examples
Example 1: Explaining a Predictive Model for Risk Assessment
A finance audit team uses a logistic regression model to predict the likelihood of invoice fraud. To ensure transparency:
- They document the variables used (e.g., invoice amount, vendor history).
- Present coefficients to show how each factor influences risk.
- Use visual aids like coefficient bar charts.
- Provide a simple narrative: “Invoices over $10,000 from new vendors increase fraud risk by 30%.”
Example 2: Interpreting a Black-Box Machine Learning Model
An auditor employs a random forest model to detect anomalies in expense claims. Since the model is complex:
- They apply SHAP (SHapley Additive exPlanations) values to explain individual predictions.
- Generate summary plots showing feature importance.
- Share case studies where the model flagged suspicious claims and how features contributed.
Best Practices Checklist
Mind Map: Best Practices for Transparency & Explainability
Additional Tips
- Balance Complexity and Interpretability: Sometimes a simpler model with slightly less accuracy is preferable for audit transparency.
- Engage Stakeholders Early: Involve audit committees and management in understanding analytics approaches.
- Use Layered Explanations: Provide high-level summaries for executives and detailed technical reports for data teams.
By embedding transparency and explainability into advanced audit analytics, finance professionals not only enhance the credibility of their findings but also foster a culture of trust and continuous improvement within their organizations.
8. Visualization and Reporting of Audit Analytics Results
8.1 Principles of Effective Data Visualization for Auditors
Data visualization is a critical skill for auditors, enabling them to communicate complex audit findings clearly and effectively to stakeholders. Effective visualizations help uncover insights, highlight anomalies, and support decision-making. Below are key principles tailored for auditors, accompanied by mind maps and practical examples.
Principle 1: Clarity and Simplicity
- Avoid clutter and unnecessary decoration.
- Use clear labels, legends, and titles.
- Focus on the key message you want to convey.
Example: When visualizing expense claim anomalies, use a simple bar chart highlighting only outlier amounts rather than plotting every transaction.
Principle 2: Choose the Right Chart Type
- Use bar charts for categorical comparisons.
- Line charts for trends over time.
- Scatter plots for relationships between variables.
- Heatmaps for risk intensity or frequency.
Example: To show monthly revenue fluctuations during an audit period, a line chart is more effective than a pie chart.
Principle 3: Use Color Purposefully
- Use color to differentiate categories or highlight key data points.
- Avoid excessive or distracting colors.
- Ensure color choices are accessible (colorblind-friendly).
Example: In a fraud risk heatmap, use a gradient from green (low risk) to red (high risk) to intuitively convey severity.
Principle 4: Provide Context and Comparisons
- Include benchmarks or targets for reference.
- Use annotations to explain important findings.
- Show comparisons over periods or against standards.
Example: Annotate a spike in vendor payments with notes about a known contract renewal to avoid misinterpretation.
Principle 5: Interactivity and Drill-Down
- Use interactive dashboards to allow users to explore data.
- Enable filtering by time, department, or transaction type.
- Support drill-down to transaction-level details.
Example: An audit dashboard where management can filter expense reports by department and drill down to individual transactions flagged for review.
Principle 6: Accuracy and Integrity
- Ensure data is accurate and up-to-date.
- Avoid misleading scales or truncated axes.
- Represent data honestly without distortion.
Example: Avoid starting a bar chart’s y-axis at a value other than zero when showing total expenses to prevent exaggerating differences.
Summary Mind Map
Practical Example: Visualizing Audit Findings on Vendor Payments
Scenario: An auditor needs to present findings on vendor payments to the audit committee.
- Use a heatmap to show risk levels across vendors (color-coded).
- Provide a bar chart comparing monthly payment volumes.
- Include annotations explaining spikes due to contract renewals.
- Offer an interactive dashboard where users can filter by vendor category and drill down to individual invoices flagged for review.
This approach ensures clarity, context, and actionable insights for stakeholders.
By applying these principles, auditors can transform raw data into compelling visual stories that enhance understanding, support audit conclusions, and drive informed decision-making.
8.2 Designing Interactive Dashboards for Stakeholders
Interactive dashboards are powerful tools that enable finance professionals and auditors to visualize complex audit data dynamically, facilitating better decision-making and communication with stakeholders. Designing an effective dashboard requires understanding the audience, selecting the right metrics, and ensuring usability and clarity.
Key Principles for Designing Interactive Dashboards
- Audience-Centered Design: Tailor the dashboard content and complexity to the needs and expertise of your stakeholders (e.g., senior management, audit committees, operational teams).
- Clarity and Simplicity: Use clean layouts, avoid clutter, and focus on key performance indicators (KPIs) relevant to audit objectives.
- Interactivity: Incorporate filters, drill-downs, and hover-over tooltips to allow users to explore data at different levels.
- Real-Time Data: Where possible, integrate live data feeds to provide up-to-date insights.
- Consistent Visual Language: Use consistent colors, icons, and chart types to reduce cognitive load.
Mind Map: Components of an Interactive Audit Dashboard
Example: Designing a Fraud Risk Dashboard for Audit Committees
Objective: Provide a high-level view of fraud risk indicators across different business units.
Features:
- Summary KPIs: Total flagged transactions, number of high-risk cases, and average risk score.
- Interactive Filters: Select business unit, time period, and risk category.
- Visualizations:
- Heatmap showing risk intensity by region.
- Trend line of flagged transactions over the last 12 months.
- Bar chart comparing risk scores across departments.
- Drill-Down: Clicking on a department bar reveals detailed transaction lists and audit notes.
Example Screenshot Concept:
[Dashboard Header]
| Fraud Risk Overview | Filters: [Business Unit ▼] [Time Period ▼] [Risk Level ▼] |
[KPIs]
- Flagged Transactions: 1,250
- High-Risk Cases: 45
- Avg. Risk Score: 7.8
[Visualizations]
- Heatmap (Regions vs. Risk Intensity)
- Line Chart (Flagged Transactions Over Time)
- Bar Chart (Risk Scores by Department)
[Drill-Down Section]
- Detailed Transaction Table
- Audit Comments and Status
Mind Map: User Interaction Flow in an Audit Dashboard
Best Practices with Examples
- Use Color Wisely:
- Example: Use red to highlight high-risk transactions, yellow for medium risk, and green for low risk.
- Provide Context:
- Example: Include benchmarks or targets next to KPIs to help stakeholders understand performance.
- Enable Customization:
- Example: Allow users to save their preferred filter settings or dashboard views.
- Test with Stakeholders:
- Example: Conduct usability sessions with audit committee members to refine dashboard layout and features.
By integrating these design principles, interactive elements, and real-world examples, finance professionals can create audit dashboards that not only present data effectively but also empower stakeholders to engage deeply with audit insights, driving better governance and risk management.
8.3 Communicating Complex Analytics Findings Clearly
Communicating complex audit analytics findings effectively is crucial for ensuring that stakeholders, including auditors, finance professionals, and management, understand the insights and can make informed decisions. Clear communication bridges the gap between technical analysis and actionable business outcomes.
Key Principles for Clear Communication
- Know Your Audience: Tailor the depth and technicality of your explanation based on whether your audience is technical (e.g., data scientists) or non-technical (e.g., senior management).
- Simplify Without Oversimplifying: Use plain language but maintain accuracy.
- Use Visual Aids: Charts, graphs, and mind maps help illustrate complex relationships and trends.
- Tell a Story: Structure your findings as a narrative with a clear beginning (context), middle (analysis), and end (recommendations).
- Highlight Key Insights: Emphasize the most critical findings upfront.
Mind Map: Components of Effective Communication of Audit Analytics Findings
Example 1: Explaining Anomaly Detection Results to Management
Scenario: You have identified unusual spikes in expense claims using audit analytics.
How to Communicate:
- Start with the context: “Our analysis of expense claims over the past quarter revealed some irregular spikes that deviate significantly from historical patterns.”
- Use a simple line chart showing normal expense trends vs. detected anomalies.
- Explain the impact: “These anomalies could indicate potential policy violations or errors requiring further investigation.”
- Recommend next steps: “We suggest a targeted review of these claims to ensure compliance.”
Visual Aid:
Mind Map: Structuring a Complex Analytics Report
Example 2: Presenting Regression Analysis Results to Auditors
Scenario: You performed regression analysis to assess risk factors affecting revenue recognition.
How to Communicate:
- Begin with the objective: “We analyzed factors influencing revenue recognition to identify potential risk areas.”
- Use a simplified table highlighting key variables and their impact.
- Explain the significance of coefficients in plain terms: “A higher coefficient for variable X means it strongly influences revenue timing.”
- Discuss confidence levels and limitations clearly.
Visual Aid:
Tips for Using Visualizations Effectively
- Choose the right chart type (bar, line, scatter) based on the data and message.
- Avoid clutter: focus on key data points.
- Use color coding to highlight important trends or anomalies.
- Provide clear labels and legends.
- Incorporate interactive elements in dashboards for deeper exploration.
Summary
Clear communication of complex audit analytics findings requires a blend of audience awareness, storytelling, and effective visualization. By structuring your message thoughtfully and using tools like mind maps and charts, you can transform intricate data into compelling insights that drive better audit outcomes.
8.4 Example: Creating a Fraud Risk Heatmap for Management Reporting
A fraud risk heatmap is a powerful visualization tool that helps management quickly identify areas of high fraud risk within an organization. It combines the likelihood of fraud occurring with the potential impact, allowing auditors and finance professionals to prioritize audit efforts and allocate resources effectively.
Step 1: Define Fraud Risk Categories
Before creating the heatmap, categorize the types of fraud risks relevant to your organization. Common categories include:
- Financial statement fraud
- Asset misappropriation
- Corruption and bribery
- Expense reimbursement fraud
- Payroll fraud
Step 2: Assess Likelihood and Impact
Each fraud risk category is assessed based on:
- Likelihood: Probability that the fraud risk will occur (e.g., Low, Medium, High)
- Impact: Potential financial or reputational damage if the fraud occurs (e.g., Low, Medium, High)
These assessments can be based on historical data, audit findings, industry benchmarks, and expert judgment.
Step 3: Construct the Heatmap Matrix
The heatmap is a matrix where:
- The X-axis represents the Likelihood of fraud occurrence.
- The Y-axis represents the Impact of the fraud.
Each cell in the matrix corresponds to a risk level, often color-coded:
- Green: Low risk
- Yellow: Moderate risk
- Red: High risk
Mind Map: Fraud Risk Heatmap Components
Step 4: Example Data and Heatmap Creation
| Fraud Risk Category | Likelihood | Impact | Risk Level |
|---|---|---|---|
| Financial Statement Fraud | High | High | High (Red) |
| Asset Misappropriation | Medium | High | High (Red) |
| Corruption | Low | Medium | Medium (Yellow) |
| Expense Reimbursement | Medium | Medium | Medium (Yellow) |
| Payroll Fraud | Low | Low | Low (Green) |
Using this data, the heatmap matrix looks like this:
| Impact \ Likelihood | Low | Medium | High |
|---|---|---|---|
| High | Asset Misappropriation (Red) | Financial Statement Fraud (Red) | |
| Medium | Corruption (Yellow) | Expense Reimbursement (Yellow) | |
| Low | Payroll Fraud (Green) |
Step 5: Visualization Example (Table with Color Indicators)
| Impact Likelihood | Low | Medium | High |
|---|---|---|---|
| High | 🔴 Asset Misappropriation | 🔴 Financial Statement Fraud | |
| Medium | 🟡 Corruption | 🟡 Expense Reimbursement | |
| Low | 🟢 Payroll Fraud |
Legend: 🔴 High Risk, 🟡 Medium Risk, 🟢 Low Risk
Step 6: Using the Heatmap for Management Reporting
- Highlight Priority Areas: The red zones indicate where management should focus immediate attention.
- Resource Allocation: Assign more audit resources to high-risk categories.
- Trend Analysis: Track changes in risk levels over time to evaluate the effectiveness of controls.
- Communication: Use the heatmap in presentations and reports to convey complex risk data simply and effectively.
Best Practice Example: Integrating Heatmap with Audit Analytics
-
Data-Driven Assessment: Use historical audit data and analytics tools to quantify likelihood and impact rather than relying solely on subjective judgment.
-
Dynamic Heatmaps: Implement interactive dashboards (e.g., Power BI, Tableau) where management can filter by department, time period, or fraud type.
-
Regular Updates: Update the heatmap quarterly or after significant audit cycles to reflect the latest risk environment.
-
Cross-Functional Input: Incorporate insights from finance, compliance, and IT teams to enrich risk assessments.
Mind Map: Best Practices for Fraud Risk Heatmap
Summary
Creating a fraud risk heatmap is an effective way to visualize and communicate fraud risks to management. By combining likelihood and impact assessments into a clear, color-coded matrix, finance professionals can prioritize audit activities and enhance fraud risk management. Leveraging audit analytics to inform these assessments ensures the heatmap is both accurate and actionable.
8.5 Best Practice: Tailoring Reports to Different Audience Needs
In audit analytics, the effectiveness of your report hinges not only on the accuracy of the data but also on how well it resonates with your audience. Different stakeholders have varying levels of technical expertise, interests, and decision-making responsibilities. Tailoring your reports ensures clarity, engagement, and actionable insights.
Why Tailor Reports?
- Enhance Understanding: Simplify complex analytics for non-technical stakeholders.
- Increase Engagement: Use relevant visuals and language that appeal to the audience.
- Drive Action: Highlight insights that align with the audience’s priorities.
Key Audience Groups in Audit Reporting
Tailoring Techniques with Examples
-
Language and Terminology
- Use jargon-free language for executives and managers.
- Include technical terms and definitions for auditors and analysts.
Example:
- Executive Summary: “Our analysis identified a 15% increase in unusual transactions indicating potential risk areas.”
- Technical Appendix: “A Benford’s Law test was applied to transaction data to detect anomalies in digit distribution.”
-
Visualizations
- Executives prefer high-level dashboards with KPIs and trend lines.
- Auditors benefit from detailed charts like box plots, scatter plots, and control charts.
Example Mindmap:
mindmap
root((Visualization Types))
Executives
- KPI Dashboards
- Trend Lines
- Heatmaps
Audit Committee
- Risk Heatmaps
- Control Effectiveness Charts
Operational Managers
- Process Flow Diagrams
- Root Cause Analysis Charts
Technical Auditors
- Statistical Graphs
- Data Distribution Plots -
Report Structure
- Start with a concise executive summary for leadership.
- Follow with detailed sections for auditors and managers.
- Appendices can contain raw data and methodologies.
Example:
- Section 1: Executive Summary (1-2 pages)
- Section 2: Key Findings and Risk Assessment
- Section 3: Detailed Analytics and Methodology
- Section 4: Recommendations and Action Plans
- Appendix: Data Tables and Technical Notes
-
Focus Areas
- Highlight financial impact and strategic risks for executives.
- Emphasize compliance and control gaps for audit committees.
- Detail operational inefficiencies and corrective actions for managers.
Example:
- Executive Report: “Potential revenue leakage estimated at $500K due to control lapses.”
- Manager Report: “Invoice processing delays identified in 3 departments; recommended workflow automation.”
Sample Tailored Report Snippet
| Audience | Report Excerpt | Visualization Type |
|---|---|---|
| Finance Executive | “Overall risk exposure has decreased by 10% this quarter, driven by improved controls in AP.” | KPI Dashboard, Trend Lines |
| Audit Committee | “Control exceptions were noted in 12% of sampled transactions; see heatmap for risk areas.” | Risk Heatmap |
| Operational Manager | “Process bottlenecks in vendor onboarding cause delays; see process flow and recommendations.” | Process Flow Diagram |
| Technical Auditor | “Data integrity verified using regression analysis; detailed results in Appendix B.” | Statistical Graphs |
Summary Mindmap: Tailoring Reports
By adopting these best practices, finance professionals and auditors can ensure their audit analytics reports are not only informative but also impactful, driving better decision-making and fostering trust across all levels of the organization.
9. Regulatory Compliance and Ethical Considerations
9.1 Understanding Regulatory Requirements Impacting Audit Analytics
Audit analytics is transforming the way auditors and finance professionals approach their work, but it also introduces new regulatory considerations. Understanding the regulatory landscape is crucial to ensure compliance, maintain data integrity, and uphold ethical standards. This section explores the key regulatory requirements impacting audit analytics, supported by mind maps and practical examples.
Key Regulatory Frameworks Affecting Audit Analytics
- Sarbanes-Oxley Act (SOX)
- General Data Protection Regulation (GDPR)
- International Standards on Auditing (ISA)
- Financial Industry Regulatory Authority (FINRA)
- Health Insurance Portability and Accountability Act (HIPAA) (where applicable)
- Payment Card Industry Data Security Standard (PCI DSS)
Mind Map: Regulatory Requirements Overview
Sarbanes-Oxley Act (SOX)
SOX mandates strict internal controls and accurate financial reporting for publicly traded companies in the U.S. Audit analytics tools must support compliance by ensuring data integrity and traceability.
Example:
- Using audit analytics to monitor journal entries for unusual patterns that could indicate fraud.
- Maintaining an immutable audit trail within analytics platforms to satisfy SOX documentation requirements.
Best Practice:
- Implement role-based access controls (RBAC) within analytics tools to ensure only authorized personnel can view or modify sensitive financial data.
General Data Protection Regulation (GDPR)
GDPR governs the processing of personal data of EU citizens, emphasizing data privacy, consent, and the right to be forgotten.
Example:
- When analyzing payroll data containing personal identifiers, auditors must anonymize or pseudonymize data to comply with GDPR.
- Ensuring audit analytics platforms have data encryption both at rest and in transit.
Mind Map: GDPR Compliance in Audit Analytics
International Standards on Auditing (ISA)
ISA provides guidelines on audit procedures, including the use of technology and data analytics.
Example:
- Applying ISA 315 (Identifying and Assessing Risks) by leveraging analytics to identify high-risk transactions.
- Documenting analytics procedures and results as part of the audit evidence.
Best Practice:
- Integrate analytics workflows with audit documentation systems to maintain compliance with ISA requirements.
Financial Industry Regulatory Authority (FINRA)
FINRA regulates brokerage firms and exchange markets, with requirements around transaction monitoring and reporting.
Example:
- Using analytics to detect suspicious trading patterns or insider trading activities.
Mind Map: FINRA Compliance Focus Areas
Data Retention and Access Laws
Different jurisdictions impose varying requirements on how long financial and audit data must be retained and who can access it.
Example:
- Ensuring audit analytics platforms support configurable data retention policies aligned with local laws.
Best Practice:
- Regularly review and update data retention schedules and access permissions to remain compliant.
Practical Example: Navigating Multi-Jurisdictional Compliance
A multinational tech company uses audit analytics to monitor financial transactions across the US, EU, and APAC regions. The audit team must:
- Comply with SOX for US subsidiaries.
- Adhere to GDPR for EU employee data.
- Follow local data retention laws in APAC countries.
They implement a centralized analytics platform with:
- Data segmentation by region.
- Automated anonymization for EU personal data.
- Role-based access controls tailored to jurisdictional requirements.
This approach ensures compliance while enabling comprehensive audit analytics.
Summary
Understanding and integrating regulatory requirements into audit analytics is essential for finance professionals. It ensures that analytics initiatives not only enhance audit quality but also uphold legal and ethical standards.
Key Takeaways:
- Always map analytics activities against relevant regulations.
- Use data governance frameworks to manage compliance.
- Document analytics processes thoroughly for audit trails.
- Stay updated on evolving regulatory landscapes.
For further reading, consider reviewing official regulatory guidance documents and consulting with compliance experts when implementing audit analytics solutions.
9.2 Data Privacy and Security in Audit Data Handling
In the realm of audit analytics, handling sensitive financial and personal data responsibly is paramount. Finance professionals must prioritize data privacy and security to maintain trust, comply with regulations, and protect against data breaches.
Key Concepts in Data Privacy and Security
- Data Privacy: Ensuring that personal and sensitive information is collected, processed, and stored in ways that respect individuals’ rights and comply with legal frameworks.
- Data Security: Protecting data from unauthorized access, alteration, or destruction through technical and organizational measures.
Mind Map: Core Principles of Data Privacy and Security
Best Practices for Data Privacy in Audit Analytics
-
Data Minimization: Only collect and analyze data strictly necessary for the audit objectives.
- Example: Instead of extracting full employee records, auditors focus on transactional data relevant to expense claims.
-
Obtain Proper Consent: When dealing with personal data, ensure explicit consent is obtained or a legal basis exists.
- Example: Informing employees that their expense data may be analyzed for audit purposes.
-
Anonymization and Pseudonymization: Remove or mask personally identifiable information (PII) where possible.
- Example: Replacing employee names with unique identifiers during data analysis to protect identities.
-
User Rights Management: Facilitate data subjects’ rights to access, correct, or delete their data when applicable.
Mind Map: Data Privacy Best Practices
Best Practices for Data Security in Audit Analytics
-
Access Controls: Implement role-based access to audit data to ensure only authorized personnel can view or manipulate sensitive information.
- Example: Finance auditors have read-only access to payroll data, while IT auditors have access to system logs.
-
Encryption: Use encryption for data at rest and in transit to prevent unauthorized interception.
- Example: Encrypting audit data stored in cloud repositories and using secure VPNs for remote access.
-
Secure Data Transfer: Use secure protocols (e.g., SFTP, HTTPS) when moving data between systems.
-
Data Masking: Mask sensitive fields in reports or dashboards to avoid exposing confidential information.
-
Incident Response Plan: Develop and regularly test procedures to respond to data breaches or security incidents.
Mind Map: Data Security Best Practices
Example Scenario: Secure Handling of Audit Data in a Financial Firm
Context: An audit team is analyzing transaction data to detect potential fraud.
- Data Minimization: They extract only transaction amounts, dates, and vendor IDs, excluding employee personal details.
- Anonymization: Vendor names are replaced with codes before analysis.
- Access Control: Only the audit analytics team has access to the dataset, with permissions logged.
- Encryption: Data stored on the audit server is encrypted, and all data transfers use secure protocols.
- Incident Response: The firm has a documented plan to notify stakeholders and regulators if a data breach occurs.
This approach ensures compliance with data privacy laws and protects sensitive information throughout the audit process.
Summary
Data privacy and security are foundational to trustworthy audit analytics. By implementing best practices such as data minimization, anonymization, role-based access, and encryption, finance professionals can safeguard sensitive audit data and comply with regulatory requirements. Regular training and audits of these controls further enhance protection and build stakeholder confidence.
9.3 Ethical Use of Analytics in Auditing
In the evolving landscape of audit analytics, ethical considerations are paramount to ensure trust, transparency, and integrity in the auditing process. Finance professionals must not only leverage powerful analytical tools but also uphold ethical standards that protect stakeholders and maintain the credibility of audit outcomes.
Key Ethical Principles in Audit Analytics
- Integrity: Ensuring honesty and accuracy in data analysis and reporting.
- Confidentiality: Protecting sensitive financial and personal data from unauthorized access.
- Objectivity: Avoiding bias and maintaining impartiality in interpreting analytics results.
- Transparency: Clearly documenting methodologies, assumptions, and limitations.
- Accountability: Taking responsibility for decisions made based on analytics.
Mind Map: Ethical Use of Analytics in Auditing
Practical Examples of Ethical Challenges and Solutions
Example 1: Avoiding Data Manipulation
Scenario: An auditor discovers anomalies in expense reports that could indicate fraud. There is pressure from management to overlook minor discrepancies to avoid reputational damage.
Ethical Practice: The auditor uses audit analytics tools to objectively analyze the data and reports findings transparently, resisting any pressure to alter or omit results.
Outcome: The organization addresses the root cause of the anomalies, improving controls and maintaining stakeholder trust.
Example 2: Ensuring Data Privacy
Scenario: Audit analytics requires analyzing employee payroll data, which includes sensitive personal information.
Ethical Practice: The auditor implements strict access controls and anonymizes data where possible to protect employee privacy.
Outcome: Compliance with data protection regulations is maintained, and employee trust is preserved.
Mind Map: Ethical Data Handling Practices
Best Practices for Ethical Audit Analytics
- Establish Clear Policies: Define ethical guidelines for data use, analysis, and reporting.
- Train Audit Teams: Regularly educate auditors on ethical standards and emerging risks.
- Use Explainable Analytics: Prefer models and algorithms that can be easily interpreted and justified.
- Maintain Audit Trails: Document every step of data handling and analysis for accountability.
- Engage Stakeholders: Communicate findings and methodologies openly to build trust.
Example: Implementing Explainable AI in Fraud Detection
A finance audit team uses machine learning to detect fraudulent transactions. To adhere to ethical standards, they choose an explainable AI model that provides clear reasons for flagging transactions. This transparency allows auditors to validate findings and ensures that decisions are justifiable and free from hidden biases.
Summary
Ethical use of analytics in auditing is not just about compliance but about fostering a culture of trust and responsibility. By integrating ethical principles into every stage of audit analytics—from data collection to reporting—finance professionals can enhance the reliability and credibility of their audits while protecting the interests of all stakeholders.
9.4 Example: Ensuring GDPR Compliance in Audit Data Analytics
Ensuring GDPR compliance is a critical aspect when conducting audit analytics, especially within finance and tech sectors where sensitive personal data is frequently processed. This section provides a detailed example of how audit teams can integrate GDPR principles into their analytics workflows, supported by mind maps and practical examples.
Understanding GDPR in the Context of Audit Analytics
The General Data Protection Regulation (GDPR) mandates strict rules on how personal data is collected, processed, stored, and shared. For audit analytics, this means:
- Minimizing personal data usage
- Ensuring lawful basis for data processing
- Maintaining data accuracy and security
- Providing transparency and rights to data subjects
Mind Map: Key GDPR Principles Relevant to Audit Analytics
Practical Example: GDPR-Compliant Audit Analytics Workflow
-
Data Identification & Classification
- Identify which data fields contain personal data (e.g., names, emails, IP addresses).
- Classify data according to sensitivity.
-
Lawful Basis Assessment
- Confirm the audit has a legitimate interest or obtain explicit consent.
-
Data Minimization & Anonymization
- Remove or mask personal identifiers where possible.
- Example: Replace employee names with unique codes during transaction analysis.
-
Secure Data Storage & Access Control
- Store audit data in encrypted databases.
- Restrict access to authorized audit team members only.
-
Transparency & Documentation
- Maintain records of data processing activities.
- Inform relevant stakeholders about data use.
-
Data Retention & Deletion
- Define retention periods aligned with audit requirements.
- Securely delete data after retention period expires.
Mind Map: GDPR-Compliant Data Handling Steps in Audit Analytics
Example Scenario: Auditing Employee Expense Claims
Context: An audit team is analyzing employee expense claims to detect anomalies and potential fraud. The dataset includes employee names, expense details, dates, and amounts.
GDPR Compliance Steps:
- Data Minimization: Replace employee names with unique anonymized IDs before analysis.
- Purpose Limitation: Use data strictly for fraud detection and audit reporting.
- Access Control: Limit dataset access to audit team members.
- Transparency: Notify employees via internal communication about the audit and data use.
- Retention: Keep data only until the audit report is finalized and then archive securely or delete.
Outcome: The audit analytics process successfully identifies suspicious expense patterns without compromising employee privacy.
Best Practices for GDPR Compliance in Audit Analytics
- Conduct regular training on data protection for audit teams.
- Implement Data Protection Impact Assessments (DPIAs) for new analytics projects.
- Use privacy-enhancing technologies such as data masking and encryption.
- Maintain clear documentation of data processing activities.
- Establish protocols for responding to data subject access requests related to audit data.
By embedding GDPR compliance into every stage of audit analytics, finance professionals can ensure ethical, legal, and secure handling of personal data while leveraging analytics to enhance audit quality and effectiveness.
9.5 Best Practice: Developing an Ethical Framework for Audit Analytics
In the evolving landscape of audit analytics, developing a robust ethical framework is essential to ensure that data is used responsibly, privacy is respected, and audit outcomes maintain integrity and trustworthiness. This section outlines best practices for creating such a framework, supported by mind maps and practical examples.
Why an Ethical Framework Matters
- Protects sensitive financial and personal data
- Ensures compliance with legal and regulatory standards
- Maintains auditor independence and objectivity
- Builds stakeholder trust in audit results
Core Principles of an Ethical Framework for Audit Analytics
Step 1: Define Clear Data Privacy Policies
- Example: When analyzing payroll data, anonymize employee identifiers before running analytics to prevent unauthorized exposure of personal information.
- Implement role-based access controls to restrict who can view sensitive audit data.
Step 2: Ensure Transparency and Explainability
- Document the data sources, analytics methods, and assumptions used in audit analytics.
- Example: When using machine learning models to detect fraud, provide clear explanations of how flagged transactions were identified to auditors and management.
Step 3: Maintain Integrity and Avoid Bias
- Regularly validate data quality and model outputs.
- Example: In revenue recognition audits, cross-check analytics results with manual reviews to detect any anomalies caused by biased data.
- Use diverse datasets to reduce the risk of biased conclusions.
Step 4: Comply with Legal and Regulatory Requirements
- Stay updated on regulations such as GDPR, SOX, and industry-specific standards.
- Example: When auditing customer transactions, ensure that data retention and processing comply with GDPR mandates.
Step 5: Establish Accountability and Governance
- Define roles and responsibilities for data stewardship and audit analytics oversight.
- Create monitoring processes to detect and address ethical breaches.
- Example: Assign a Data Ethics Officer to review analytics projects and ensure adherence to the ethical framework.
Practical Example: Ethical Framework in Action
A mid-sized tech company implemented audit analytics to monitor expense claims. They developed an ethical framework incorporating:
- Data Privacy: Employee IDs were hashed before analysis.
- Transparency: Audit teams documented all analytics models and shared findings in clear reports.
- Integrity: Results were validated monthly through manual spot checks.
- Compliance: The process was aligned with GDPR and internal policies.
- Accountability: A governance committee reviewed analytics usage quarterly.
This approach minimized privacy risks, improved trust in audit outcomes, and ensured regulatory compliance.
Summary Checklist for Developing an Ethical Framework
| Step | Key Actions | Example |
|---|---|---|
| Data Privacy | Anonymize data, control access | Hash employee IDs in payroll analytics |
| Transparency | Document methods, explain results | Provide clear fraud detection explanations |
| Integrity | Validate data, check for bias | Cross-verify revenue audit findings |
| Compliance | Follow laws and standards | Ensure GDPR compliance in customer data |
| Accountability | Assign roles, monitor adherence | Appoint Data Ethics Officer |
By embedding these ethical considerations into audit analytics practices, finance professionals can uphold the highest standards of professionalism and trust while leveraging powerful data-driven insights.
10. Implementing Audit Analytics in Your Organization
10.1 Assessing Organizational Readiness for Audit Analytics
Before embarking on the journey to integrate audit analytics into your organization, it is crucial to assess your organization’s readiness. This ensures that the implementation is smooth, effective, and aligned with your strategic goals. Below, we break down the key areas to evaluate, supported by mind maps and practical examples.
Key Dimensions of Organizational Readiness
Detailed Breakdown with Examples
Leadership Support
Why it matters: Without leadership buy-in, audit analytics initiatives often lack the necessary funding and strategic alignment.
Example: A mid-sized tech company’s CFO champions the use of analytics in audits, resulting in dedicated budget allocation and cross-department collaboration.
Data Infrastructure
Why it matters: Analytics relies on clean, accessible, and integrated data.
Example: An auditor discovers that financial data is siloed across multiple ERP systems, causing delays. The company invests in a centralized data warehouse, improving data accessibility.
Skills and Talent
Why it matters: Skilled professionals are needed to interpret analytics and translate insights into audit actions.
Example: An audit team enrolls in a data analytics certification program, enhancing their ability to use tools like ACL and Tableau effectively.
Technology and Tools
Why it matters: The right tools enable efficient data processing and visualization.
Example: A finance department adopts a cloud-based audit analytics platform, allowing real-time monitoring of transactions.
Culture and Change Management
Why it matters: Resistance to change can stall analytics adoption.
Example: Regular workshops and success story sharing help foster a culture that embraces data-driven auditing.
Processes and Methodologies
Why it matters: Clear processes ensure consistency and repeatability.
Example: The audit team develops a standardized checklist for data validation before running analytics.
Regulatory and Compliance Readiness
Why it matters: Ensures analytics practices comply with laws and ethical standards.
Example: The organization consults legal experts to align audit data handling with GDPR requirements.
Mind Map: Assessing Data Infrastructure Readiness
Practical Steps to Assess Readiness
-
Conduct Stakeholder Interviews: Engage leadership, audit teams, IT, and compliance to gather perspectives.
-
Perform Data Inventory: Map out all data sources relevant to auditing.
-
Evaluate Current Skills: Identify gaps in analytics knowledge and training needs.
-
Review Technology Stack: Assess existing tools and identify upgrades or new acquisitions.
-
Analyze Culture: Use surveys or workshops to understand openness to analytics.
-
Document Processes: Review current audit workflows for integration points.
-
Check Compliance: Ensure policies align with regulations.
Example Scenario: Assessing Readiness at “FinTech Solutions Inc.”
- Leadership: The CFO and Head of Internal Audit are enthusiastic and have allocated budget.
- Data: Financial and transaction data are stored in multiple legacy systems with limited integration.
- Skills: Audit team has basic Excel skills but limited experience with analytics software.
- Technology: No dedicated audit analytics tool; IT supports general BI tools.
- Culture: Some resistance from auditors accustomed to traditional methods.
- Processes: Audit procedures are documented but do not include analytics steps.
- Compliance: GDPR and SOX compliance frameworks are in place.
Outcome: FinTech Solutions Inc. decides to invest in data integration projects, initiate training programs, and pilot audit analytics on high-risk areas to build momentum.
Summary
Assessing organizational readiness is a foundational step that helps finance professionals and auditors identify strengths, gaps, and actionable steps before implementing audit analytics. By systematically evaluating leadership, data, skills, technology, culture, processes, and compliance, organizations can set themselves up for success.
10.2 Building a Cross-Functional Audit Analytics Team
Building a cross-functional audit analytics team is essential for leveraging diverse expertise to enhance audit quality, efficiency, and insight generation. This team brings together professionals from different backgrounds to collaborate on data-driven audit processes, ensuring comprehensive coverage of technical, financial, and regulatory aspects.
Why Cross-Functional Teams Matter in Audit Analytics
- Diverse Skill Sets: Combines accounting knowledge, data science, IT expertise, and business acumen.
- Holistic Problem Solving: Different perspectives help identify risks and anomalies that might be missed otherwise.
- Improved Communication: Bridges the gap between technical analytics and audit judgment.
Key Roles in a Cross-Functional Audit Analytics Team
Role Descriptions and Responsibilities
- Accountants & Auditors: Provide domain expertise, interpret analytics results, and apply professional judgment.
- Data Scientists & Analysts: Develop models, perform data cleaning, and conduct statistical analysis.
- IT Specialists: Ensure data integrity, manage data infrastructure, and support tool implementation.
- Business Stakeholders: Offer insights on business processes, compliance requirements, and risk areas.
Best Practices for Building the Team
- Define Clear Objectives: Align team goals with organizational audit strategy.
- Recruit Complementary Skills: Balance technical and domain expertise.
- Foster Collaborative Culture: Encourage open communication and knowledge sharing.
- Provide Continuous Training: Keep team updated on latest audit standards and analytics tools.
- Establish Governance: Define roles, responsibilities, and decision-making processes.
Example: Building a Team for a Fraud Detection Project
Scenario: A mid-sized tech company wants to implement analytics-driven fraud detection in expense reporting.
| Role | Team Member Profile | Contribution |
|---|---|---|
| Lead Auditor | Senior auditor with fraud investigation experience | Defines audit objectives and validates findings |
| Data Scientist | Experienced in anomaly detection models | Develops machine learning models to flag suspicious transactions |
| IT Specialist | Database administrator | Ensures secure access to expense data and maintains data pipelines |
| Compliance Officer | Knowledgeable about company policies | Ensures analytics align with regulatory requirements |
| Business Manager | Oversees expense reporting process | Provides context on business operations and approves interventions |
Mind Map: Steps to Form the Team
Collaboration Tools and Techniques
- Communication Platforms: Slack, Microsoft Teams for real-time discussion.
- Project Management: Jira, Trello to track tasks and progress.
- Data Collaboration: Shared repositories like GitHub or cloud storage.
- Visualization Tools: Power BI, Tableau for joint data exploration.
Summary
Building a cross-functional audit analytics team requires thoughtful selection of diverse roles, clear definition of responsibilities, and fostering a culture of collaboration. By integrating finance professionals, data experts, IT specialists, and business stakeholders, organizations can unlock the full potential of audit analytics, leading to more insightful, efficient, and effective audits.
10.3 Developing an Audit Analytics Strategy and Roadmap
Developing a robust audit analytics strategy and roadmap is essential for finance professionals aiming to leverage data-driven insights to enhance audit quality, efficiency, and risk management. This section will guide you through the key steps, considerations, and practical examples to build a successful strategy tailored to your organization’s needs.
Step 1: Define Clear Objectives and Goals
Start by identifying what you want to achieve with audit analytics. Objectives should align with broader organizational goals and audit function priorities.
- Improve fraud detection capabilities
- Enhance risk assessment accuracy
- Increase audit efficiency through automation
- Provide real-time monitoring and continuous auditing
Example: A mid-sized tech firm aims to reduce manual transaction testing by 50% within 12 months by implementing analytics-driven sampling.
Step 2: Assess Current Capabilities and Gaps
Evaluate your existing data infrastructure, tools, skillsets, and audit processes to identify strengths and areas for improvement.
- Data availability and quality
- Analytics tools and software
- Staff expertise in data analytics
- Integration with audit management systems
Example: An audit team realizes their ERP data is fragmented across multiple systems, requiring a data consolidation initiative before analytics can be effectively applied.
Step 3: Identify Key Stakeholders and Build Collaboration
Engage stakeholders across finance, IT, compliance, and business units to ensure alignment and support.
- Audit leadership
- Data owners
- IT and data governance teams
- External auditors and regulators
Example: Forming a cross-functional committee to oversee the audit analytics implementation ensures diverse perspectives and smoother adoption.
Step 4: Select Appropriate Tools and Technologies
Choose analytics platforms and software that fit your organization’s size, complexity, and audit needs.
- Consider cloud-based vs on-premise solutions
- Evaluate integration capabilities with existing systems
- Prioritize user-friendly interfaces for auditors
Example: A finance team selects a cloud-based analytics tool with built-in fraud detection algorithms and visualization dashboards.
Step 5: Develop a Phased Implementation Roadmap
Break down the strategy into manageable phases with clear milestones, timelines, and deliverables.
- Phase 1: Pilot projects focusing on high-risk audit areas
- Phase 2: Expand analytics use to routine audits
- Phase 3: Implement continuous auditing and real-time monitoring
Example: Starting with a pilot analyzing expense claims data before scaling to revenue and procurement audits.
Step 6: Establish Governance and Quality Controls
Define policies for data privacy, security, model validation, and audit trail documentation.
- Data access controls
- Model performance monitoring
- Documentation standards
Example: Implementing quarterly reviews of analytics model accuracy and updating parameters as needed.
Step 7: Invest in Training and Change Management
Equip your audit team with the necessary skills and foster a culture open to analytics adoption.
- Workshops and certifications in data analytics
- Regular knowledge-sharing sessions
- Incentives for innovation
Example: Hosting monthly lunch-and-learn sessions where auditors present analytics use cases and lessons learned.
Mind Map: Audit Analytics Strategy Development
Mind Map: Phased Implementation Roadmap Example
Practical Example: Developing a Roadmap for a Finance Audit Team
Context: A finance audit team in a tech company wants to implement audit analytics to improve risk detection and reduce manual testing.
- Objective: Reduce manual transaction testing by 40% and improve fraud detection.
- Assessment: Data is stored in multiple systems; auditors have basic Excel skills but limited analytics experience.
- Stakeholders: Audit manager, IT data team, CFO, external audit partner.
- Tools: Choose a user-friendly analytics platform with integration capabilities.
- Roadmap:
- Pilot on expense claims (3 months)
- Expand to procurement and revenue audits (6 months)
- Implement continuous monitoring dashboards (9 months)
- Governance: Define data access policies and model review schedules.
- Training: Conduct workshops on data visualization and basic analytics.
This structured approach ensures the team progresses methodically, managing risks and building confidence in audit analytics.
By following these steps and leveraging the mind maps and examples provided, finance professionals can develop a clear, actionable audit analytics strategy and roadmap that drives meaningful improvements in audit effectiveness and efficiency.
10.4 Training and Upskilling Finance Professionals in Analytics
In today’s rapidly evolving finance and tech landscape, the ability to leverage audit analytics is no longer optional but essential. Training and upskilling finance professionals in analytics empowers auditors and accountants to enhance audit quality, improve risk detection, and deliver greater value to their organizations.
Why Training and Upskilling Matter
- Bridging the Skills Gap: Many finance professionals have strong domain knowledge but limited experience with data analytics tools and techniques.
- Enhancing Efficiency: Analytics skills enable faster data processing and more insightful audit conclusions.
- Supporting Continuous Auditing: Skilled professionals can implement and maintain continuous monitoring systems.
Core Competencies to Develop
Training Approaches
-
Formal Courses and Certifications
- Examples: Certified Analytics Professional (CAP), Data Analytics for Auditors by AICPA
- Benefits: Structured learning, recognized credentials
-
Hands-On Workshops and Bootcamps
- Example: A 3-day workshop on using ACL for transaction testing
- Benefits: Practical experience, immediate application
-
On-the-Job Training and Mentorship
- Example: Pairing junior auditors with data-savvy seniors during audit engagements
- Benefits: Contextual learning, real-time feedback
-
Online Learning Platforms
- Examples: Coursera, Udemy courses on data analytics and visualization
- Benefits: Flexible, self-paced
Example Training Program Outline
Practical Example: Upskilling through a Fraud Detection Workshop
Scenario: A mid-sized tech company wants its audit team to better detect fraudulent transactions using analytics.
Training Steps:
- Introduce common fraud red flags and data patterns.
- Demonstrate how to use ACL to filter and analyze payment data.
- Participants practice identifying anomalies such as duplicate payments or unusual vendor activity.
- Discuss how to document findings and escalate issues.
Outcome: Auditors gain confidence in using analytics tools and can apply these skills immediately in their audits.
Best Practices for Effective Training
- Tailor Content to Audience: Align training with existing skill levels and job roles.
- Blend Theory and Practice: Combine conceptual knowledge with hands-on exercises.
- Encourage Collaboration: Use group projects to foster peer learning.
- Provide Continuous Support: Establish forums or help desks for ongoing questions.
- Measure Progress: Use assessments and real-world application to track skill development.
Summary
Training and upskilling finance professionals in audit analytics is a strategic investment that enhances audit quality and organizational resilience. By adopting a structured, practical, and continuous learning approach, organizations can build a workforce capable of leveraging data-driven insights to meet the challenges of modern auditing.
10.5 Case Study: Successful Audit Analytics Implementation in a Mid-Sized Tech Firm
Background
TechNova Solutions, a mid-sized technology company specializing in software development and cloud services, faced challenges in their internal audit processes. Manual audits were time-consuming, error-prone, and lacked real-time insights. The finance and audit teams decided to implement audit analytics to enhance efficiency, accuracy, and risk detection.
Objectives
- Automate data collection and analysis from multiple financial systems.
- Detect anomalies and potential fraud faster.
- Improve audit coverage and reduce manual effort.
- Provide real-time dashboards for management oversight.
Implementation Steps
Step 1: Preparation
- Stakeholder Alignment: The audit, finance, and IT teams collaborated to define goals and expectations.
- Data Source Identification: Key systems included the ERP (SAP), CRM, and cloud billing platforms.
- Tool Selection: Chose a combination of Power BI for visualization and Python-based analytics scripts.
Step 2: Data Collection
- Automated data extraction scripts pulled transactional data daily.
- APIs connected cloud billing data with internal financial records.
Step 3: Data Cleaning
- Missing invoice numbers were flagged and cross-checked with sales teams.
- Data was normalized to ensure consistent currency and date formats.
Step 4: Analytics Development
- Anomaly Detection Example: Using Z-score calculations, transactions exceeding 3 standard deviations from the mean were flagged.
# Example: Simple anomaly detection using Z-score
import pandas as pd
from scipy import stats

data = pd.read_csv('transactions.csv')
data['z_score'] = stats.zscore(data['transaction_amount'])
anomalies = data[abs(data['z_score']) > 3]
print(anomalies)
- Risk Scoring Model: Transactions were scored based on amount, frequency, and vendor risk profile.
Step 5: Reporting
- Created interactive dashboards showing:
- High-risk transactions
- Monthly audit coverage
- Trend analysis of expenses
- Automated email alerts were set up for suspicious activities.
Step 6: Training & Adoption
- Conducted workshops for auditors on interpreting analytics outputs.
- Established feedback loops to refine models based on auditor input.
Results & Benefits
- Efficiency: Audit cycle time reduced by 40%.
- Coverage: Increased transaction coverage from 30% to 85%.
- Risk Detection: Early identification of 3 potential fraud cases.
- Stakeholder Confidence: Management received real-time insights, improving decision-making.
Mind Map: Benefits Realized
Lessons Learned & Best Practices
- Start Small: Begin with a pilot focusing on high-risk areas.
- Cross-Functional Collaboration: Engage IT, finance, and audit teams early.
- Iterative Improvement: Use auditor feedback to refine analytics models.
- Training: Invest in upskilling auditors to interpret analytics effectively.
Example: Detecting Duplicate Payments
Using audit analytics, TechNova identified duplicate payments by comparing invoice numbers, vendor IDs, and payment amounts.
# Simplified duplicate payment detection
duplicates = data[data.duplicated(subset=['invoice_number', 'vendor_id', 'payment_amount'], keep=False)]
print(duplicates)
This led to recovering $25,000 in overpayments within the first quarter post-implementation.
Conclusion
TechNova Solutions’ successful audit analytics implementation demonstrates how mid-sized tech firms can leverage data-driven approaches to transform their audit functions. By combining technology, collaboration, and continuous learning, finance professionals can significantly enhance audit quality and operational efficiency.
10.6 Best Practice: Continuous Improvement and Feedback Loops in Audit Analytics
Continuous improvement and feedback loops are essential to maintaining the effectiveness, accuracy, and relevance of audit analytics within finance and tech organizations. By systematically reviewing and refining audit processes and analytics models, finance professionals can ensure that their audits remain robust against emerging risks and evolving business environments.
Why Continuous Improvement Matters in Audit Analytics
- Adaptation to Change: Financial regulations, business processes, and technology landscapes evolve rapidly. Continuous improvement ensures audit analytics stay aligned with these changes.
- Enhanced Accuracy: Iterative refinement of data models and analytics techniques reduces false positives/negatives, improving audit quality.
- Increased Efficiency: Feedback loops help identify bottlenecks or redundant steps, streamlining audit workflows.
- Stakeholder Confidence: Demonstrates commitment to quality and responsiveness, building trust with management and regulators.
Key Components of Continuous Improvement and Feedback Loops
Implementing Feedback Loops: Step-by-Step Example
Scenario: A finance team uses an analytics model to detect anomalous vendor payments. Over time, the model generates many false positives, causing audit fatigue.
- Collect Feedback: Auditors report specific types of transactions frequently flagged incorrectly.
- Analyze Data: Review flagged transactions and identify patterns causing false positives (e.g., certain payment types or vendors).
- Refine Model: Adjust model parameters or incorporate additional variables to better differentiate legitimate transactions.
- Test & Validate: Run the updated model on historical data to verify improved accuracy.
- Deploy & Monitor: Implement the refined model and monitor ongoing performance.
- Document Changes: Record modifications and rationale for audit trail and future reference.
Example Mind Map: Feedback Loop for Model Refinement
Practical Tips for Establishing Effective Feedback Loops
- Regular Review Meetings: Schedule periodic sessions with audit teams to discuss analytics outcomes and challenges.
- Automated Reporting: Use dashboards that highlight key performance indicators (KPIs) such as detection rates and false positive ratios.
- Encourage Open Communication: Foster a culture where auditors feel comfortable sharing insights and concerns.
- Leverage Technology: Implement tools that track model performance and trigger alerts when anomalies or drifts occur.
- Document Lessons Learned: Maintain a centralized repository of feedback, improvements, and outcomes to inform future audits.
Example: Continuous Improvement in Action
A mid-sized tech company implemented continuous auditing with analytics to monitor expense claims. Initially, the system flagged 15% of claims as suspicious, but auditors identified that 60% of these were false positives.
By establishing a feedback loop:
- Auditors submitted detailed feedback on false positives.
- Data scientists refined the anomaly detection algorithm to incorporate vendor history and claim context.
- After iterative improvements, false positives dropped to 5%, significantly reducing audit workload.
- The process was documented and incorporated into training for new audit team members.
Summary
Continuous improvement and feedback loops transform audit analytics from a one-time implementation into a dynamic, evolving process. By integrating structured feedback, monitoring model performance, and fostering collaboration between auditors and data professionals, finance teams can enhance audit quality, reduce risks, and optimize resource use.
Remember: The journey of audit analytics is ongoing—embrace feedback as a powerful tool to refine and elevate your audit practices continuously.
11. Future Trends in Audit Analytics
11.1 Emerging Technologies Impacting Audit Analytics
Audit analytics is rapidly evolving, driven by a wave of emerging technologies that are transforming how finance professionals and auditors approach data analysis, risk assessment, and decision-making. Understanding these technologies is crucial for staying competitive and enhancing audit effectiveness.
Key Emerging Technologies in Audit Analytics
Artificial Intelligence (AI) & Machine Learning (ML)
AI and ML enable auditors to analyze vast datasets quickly and uncover patterns that may be invisible through traditional methods.
Example: A finance team uses ML algorithms to analyze thousands of expense reports, automatically flagging those with unusual spending patterns for further investigation. This reduces manual review time and increases fraud detection accuracy.
Mind Map:
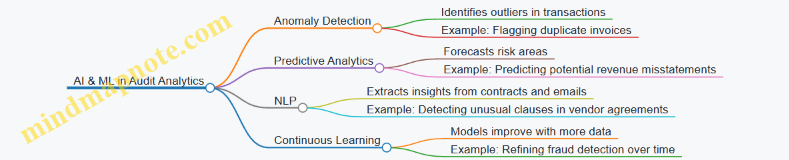
Robotic Process Automation (RPA)
RPA automates repetitive, rule-based audit tasks, freeing auditors to focus on more complex analysis.
Example: An audit department deploys RPA bots to extract financial data from multiple ERP systems and consolidate it into a single audit dashboard daily, ensuring timely and accurate data availability.
Mind Map:
Blockchain Technology
Blockchain offers a decentralized and tamper-proof ledger, enhancing audit transparency and trust.
Example: A tech company uses blockchain to record all financial transactions, enabling auditors to verify transaction authenticity in real-time without relying solely on traditional documentation.
Mind Map:
Cloud Computing
Cloud platforms provide scalable infrastructure and enable collaboration across geographically dispersed audit teams.
Example: An audit firm leverages cloud-based analytics tools to allow auditors in different locations to access and analyze client data simultaneously, improving efficiency and coordination.
Mind Map:
Internet of Things (IoT)
IoT devices provide real-time data streams that can be used to verify asset usage, inventory levels, and operational metrics.
Example: A manufacturing company uses IoT sensors to track equipment usage and maintenance schedules, enabling auditors to validate asset depreciation and operational efficiency.
Mind Map:
Advanced Data Visualization
Modern visualization tools help auditors interpret complex data quickly and communicate findings effectively.
Example: An audit team creates an interactive dashboard that visualizes risk heatmaps, transaction flows, and KPI trends, enabling management to make informed decisions at a glance.
Mind Map:
Big Data Analytics
Big data technologies allow auditors to process and analyze massive volumes of diverse data, uncovering deeper insights.
Example: A financial auditor analyzes social media sentiment, transaction logs, and market data alongside traditional financial statements to assess reputational and financial risks.
Mind Map:
Cognitive Computing
Cognitive computing mimics human thought processes to interpret audit data contextually and support decision-making.
Example: An audit analytics platform uses cognitive computing to review contract language and flag clauses that deviate from standard terms, assisting auditors in contract compliance reviews.
Mind Map:
Summary
Emerging technologies are reshaping audit analytics by enhancing data processing capabilities, improving accuracy, and enabling proactive risk management. Finance professionals and auditors who embrace these technologies can drive more insightful, efficient, and reliable audits.
Best Practice: Start small by piloting one or two technologies relevant to your audit needs, such as AI-driven anomaly detection or RPA for data extraction, and scale based on results and organizational readiness.
11.2 The Role of Artificial Intelligence and Automation
Artificial Intelligence (AI) and automation are transforming the landscape of audit analytics, enabling finance professionals to enhance efficiency, accuracy, and insight generation. This section explores how AI and automation integrate into auditing processes, with practical examples and mind maps to illustrate key concepts.
Understanding AI and Automation in Auditing
- Artificial Intelligence (AI): The simulation of human intelligence processes by machines, especially computer systems, including learning, reasoning, and self-correction.
- Automation: The use of technology to perform tasks with minimal human intervention.
Together, AI and automation help auditors process large volumes of data, identify patterns, and make data-driven decisions faster and more accurately.
Mind Map: AI and Automation in Audit Analytics
Key Applications and Examples
Automated Data Extraction and Preparation
AI-powered tools can automatically extract financial data from diverse sources such as invoices, contracts, and ERP systems. For example, Natural Language Processing (NLP) algorithms can read and interpret unstructured data from contracts to identify key audit-relevant clauses.
Example: A tech company uses AI to scan thousands of vendor contracts to flag unusual payment terms that may indicate risk.
Anomaly and Fraud Detection
Machine learning models analyze historical transaction data to detect anomalies that deviate from normal behavior, which may indicate fraud or errors.
Example: An auditor employs an AI model trained on past expense reports to identify suspicious claims, such as duplicate reimbursements or inflated amounts.
Predictive Risk Assessment
AI algorithms predict areas of high audit risk by analyzing patterns and trends in financial data, helping auditors prioritize their focus.
Example: A finance team uses predictive analytics to forecast which accounts are most likely to have misstatements based on historical audit findings.
Continuous Auditing and Real-Time Monitoring
Automation enables continuous auditing by setting up real-time data feeds and automated alerts for unusual transactions or compliance breaches.
Example: A financial institution implements automated monitoring that instantly flags transactions exceeding predefined risk thresholds, allowing immediate investigation.
Automated Reporting and Visualization
AI tools can generate audit reports and dashboards automatically, summarizing key findings and trends for stakeholders.
Example: After completing an audit cycle, an AI-powered system produces a comprehensive report highlighting risk areas, anomalies detected, and recommendations.
Mind Map: Benefits of AI and Automation in Auditing
Best Practices for Implementing AI and Automation
- Start Small: Pilot AI tools on specific audit tasks such as expense analysis before scaling.
- Maintain Human Oversight: Use AI as an augmentation tool, not a replacement for professional judgment.
- Ensure Data Quality: High-quality, clean data is essential for effective AI models.
- Focus on Explainability: Choose AI models that provide transparent reasoning to support audit conclusions.
- Regularly Update Models: Continuously train AI systems with new data to maintain accuracy.
Summary
AI and automation are powerful enablers for audit analytics, offering finance professionals the ability to conduct deeper, faster, and more accurate audits. By integrating these technologies thoughtfully and maintaining a balance with human expertise, auditors can significantly enhance their effectiveness and deliver greater value to their organizations.
11.3 Blockchain and Its Implications for Audit Data Integrity
Blockchain technology is revolutionizing the way financial data is recorded, stored, and verified. For auditors and finance professionals, understanding blockchain’s impact on audit data integrity is critical to adapting audit methodologies and ensuring trustworthiness in financial reporting.
What is Blockchain?
Blockchain is a decentralized, distributed ledger technology that records transactions across multiple computers so that the record cannot be altered retroactively without the alteration of all subsequent blocks and the consensus of the network.
Key Features of Blockchain Relevant to Audit Data Integrity
- Immutability: Once recorded, data on the blockchain cannot be changed or deleted.
- Transparency: Transactions are visible to all participants with appropriate permissions.
- Traceability: Every transaction is linked to previous transactions, creating a clear audit trail.
- Decentralization: No single entity controls the data, reducing risk of manipulation.
Mind Map: Blockchain Features Impacting Audit Integrity

How Blockchain Enhances Audit Data Integrity
-
Immutable Audit Trails: Auditors can rely on blockchain to provide tamper-proof records, reducing the need for extensive manual verification.
-
Real-Time Verification: Blockchain enables continuous auditing by providing real-time access to transaction data.
-
Reduced Fraud Risk: The decentralized nature and cryptographic security reduce opportunities for fraud.
-
Simplified Reconciliation: Automated consensus mechanisms ensure data consistency across parties.
Practical Example: Auditing a Blockchain-Based Supply Chain
Imagine a tech company uses blockchain to record every step in its supply chain—from raw material sourcing to product delivery. Each transaction is timestamped and linked.
-
Audit Scenario: An auditor wants to verify the authenticity of components used in production.
-
Using Blockchain: The auditor accesses the blockchain ledger to trace each component’s origin and movement without relying on paper documents.
-
Outcome: The immutable ledger confirms the components’ provenance, ensuring data integrity and reducing audit time.
Mind Map: Audit Process with Blockchain Integration
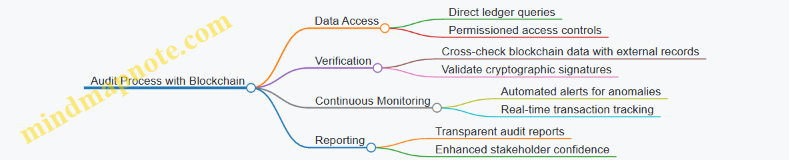
Challenges and Considerations
-
Data Privacy: Public blockchains are transparent but may expose sensitive data; permissioned blockchains help mitigate this.
-
Technical Expertise: Auditors need skills to understand blockchain architecture and cryptography.
-
Regulatory Compliance: Evolving regulations around blockchain require auditors to stay updated.
-
Integration with Legacy Systems: Combining blockchain data with traditional systems can be complex.
Best Practice Example: Combining Blockchain with Traditional Audit Techniques
A financial auditor working with a fintech firm using blockchain for transaction recording applies a hybrid approach:
- Uses blockchain data to verify transaction immutability and timestamps.
- Performs traditional substantive testing on off-chain data such as contracts and invoices.
- Applies data analytics to detect anomalies in blockchain transaction patterns.
This integrated approach ensures comprehensive audit coverage and data integrity.
Summary
Blockchain technology offers transformative potential for audit data integrity by providing immutable, transparent, and traceable records. Finance professionals and auditors should embrace blockchain’s capabilities while addressing challenges through continuous learning and adapting audit methodologies.
11.4 Preparing for the Future: Skills and Tools Finance Professionals Need
As audit analytics continues to evolve rapidly, finance professionals must proactively develop new skills and adopt cutting-edge tools to stay relevant and effective. This section explores the essential competencies and technologies that will empower auditors and accountants to thrive in the future landscape.
Key Skills for Future-Ready Finance Professionals
Below is a mind map outlining the critical skills finance professionals should cultivate:
Examples of Skill Application
-
Example 1: Using Python to Automate Data Cleaning
- A finance auditor automates the extraction and cleaning of large transaction datasets using Python scripts, reducing manual errors and saving 30% of audit preparation time.
-
Example 2: Visualizing Risk Trends with Power BI
- An auditor creates interactive dashboards that highlight risk hotspots in real-time, enabling quicker decision-making and targeted audit procedures.
-
Example 3: Applying Machine Learning for Anomaly Detection
- By understanding basic machine learning concepts, an auditor collaborates with data scientists to implement models that flag unusual vendor payments, improving fraud detection rates.
Essential Tools for Future Audit Analytics
Example: Integrating New Tools in Audit Workflow
A mid-sized tech company’s audit team adopted Power BI and Python to enhance their audit analytics capabilities. They used Python scripts to preprocess data extracted from ERP systems and then visualized key audit metrics through Power BI dashboards. This integration enabled continuous monitoring of financial transactions and quicker identification of anomalies, reducing audit cycle time by 25%.
Mind Map: Roadmap to Future-Proof Your Audit Career
Final Thoughts
Preparing for the future in audit analytics is a continuous journey. Finance professionals who invest in building a strong foundation of technical skills, domain knowledge, and ethical awareness, while embracing innovative tools, will be well-positioned to add significant value to their organizations and advance their careers.
Remember, the fusion of human expertise and advanced analytics is the key to unlocking the full potential of audit functions in the digital era.
11.5 Example: Pilot Projects Leveraging AI for Predictive Audit Insights
In recent years, Artificial Intelligence (AI) has become a transformative force in audit analytics, enabling finance professionals to move from reactive to predictive auditing. Pilot projects leveraging AI for predictive audit insights demonstrate how organizations can identify risks earlier, optimize audit resources, and enhance overall audit quality.
What is Predictive Audit Insights?
Predictive audit insights use AI algorithms to analyze historical and real-time data to forecast potential risks, anomalies, or compliance issues before they fully materialize. This proactive approach helps auditors prioritize high-risk areas and make data-driven decisions.
Mind Map: Key Components of AI-Driven Predictive Audit Projects
Pilot Project Example 1: Predictive Fraud Detection in Expense Reporting
Context: A mid-sized tech company piloted an AI-driven predictive model to detect fraudulent expense claims before reimbursement.
Approach:
- Collected 3 years of historical expense reports and flagged fraudulent cases.
- Engineered features such as expense amount, frequency, vendor type, and submission time.
- Trained a classification model (Random Forest) to predict the likelihood of fraud.
- Integrated the model into the expense management system for real-time scoring.
Outcome:
- Early identification of 85% of fraudulent claims during the pilot phase.
- Reduced manual audit hours by 40%.
- Enhanced auditor focus on high-risk claims.
Example Mind Map:
Pilot Project Example 2: Predictive Risk Scoring for Revenue Recognition
Context: A finance department in a large multinational used AI to predict potential revenue recognition risks across multiple subsidiaries.
Approach:
- Aggregated transactional and contract data.
- Applied regression models to identify patterns linked to revenue misstatements.
- Developed a risk scoring system to flag contracts with high risk.
- Enabled auditors to prioritize reviews based on predictive scores.
Outcome:
- Improved risk identification accuracy by 30% compared to traditional methods.
- Streamlined audit planning and resource allocation.
Example Mind Map:
Best Practices for Running AI Pilot Projects in Audit Analytics
- Start Small: Focus on a specific audit area or risk type to manage complexity.
- Ensure Data Quality: High-quality, well-prepared data is critical for model accuracy.
- Engage Cross-Functional Teams: Collaborate with data scientists, auditors, and IT.
- Maintain Transparency: Document model logic and maintain explainability.
- Iterate and Improve: Use feedback loops to refine models continuously.
- Combine AI with Human Judgment: Use AI as a decision support tool, not a replacement.
Summary
Pilot projects leveraging AI for predictive audit insights showcase the potential to revolutionize auditing by enabling proactive risk management and smarter resource allocation. By combining AI techniques with domain expertise and best practices, finance professionals can unlock significant value and future-proof their audit functions.
11.6 Best Practice: Staying Ahead with Continuous Learning and Innovation
In the rapidly evolving landscape of audit analytics, continuous learning and innovation are essential for finance professionals to maintain a competitive edge and deliver high-quality audits. This section explores strategies and practical examples to foster a culture of ongoing education and innovative thinking within audit teams.
Why Continuous Learning and Innovation Matter
- Technological Advancements: New tools, algorithms, and platforms emerge frequently.
- Regulatory Changes: Compliance requirements evolve, demanding updated knowledge.
- Complex Data Environments: Increasing data volume and variety require innovative approaches.
- Competitive Advantage: Staying current enables more insightful, efficient audits.
Strategies for Continuous Learning
- Regular Training Programs: Schedule workshops, webinars, and certifications.
- Cross-Functional Collaboration: Engage with data scientists, IT, and business units.
- Knowledge Sharing Sessions: Internal forums for sharing insights and lessons learned.
- Subscription to Industry Publications: Stay updated with journals, blogs, and newsletters.
- Participation in Professional Networks: Join audit and analytics communities.
Innovation Practices
- Pilot New Technologies: Test AI, machine learning, and blockchain in small projects.
- Encourage Experimentation: Allow teams to explore novel audit techniques.
- Leverage Feedback Loops: Use audit outcomes to refine analytics models.
- Invest in R&D: Allocate resources for developing proprietary tools.
Mind Map: Continuous Learning Framework for Audit Analytics
Mind Map: Innovation Cycle in Audit Analytics
Practical Examples
Example 1: Monthly Analytics Knowledge Sharing Sessions
An audit team at a mid-sized tech company established monthly “Analytics Lunch & Learn” sessions where team members present recent findings, new tools, or case studies. For instance, one session focused on using Python libraries for anomaly detection, demonstrating real audit data examples. This practice enhanced team skills and encouraged collaborative problem-solving.
Example 2: Pilot Project Using AI for Risk Scoring
A finance department piloted an AI-based risk scoring model to prioritize audit areas. The pilot involved a small dataset of transactions, with iterative feedback from auditors refining the model’s accuracy. The successful pilot led to full integration, improving audit efficiency and focus.
Example 3: Subscription to Industry Analytics Webinars
An audit manager subscribed to leading analytics platforms offering weekly webinars on emerging technologies like blockchain auditing and advanced visualization techniques. The insights gained were incorporated into audit methodologies, keeping the team ahead of industry trends.
Tips for Embedding Continuous Learning and Innovation
- Leadership Support: Secure buy-in from management to allocate time and budget.
- Set Learning Goals: Define clear objectives for skill development.
- Create a Safe Environment: Encourage risk-taking without fear of failure.
- Measure Impact: Track improvements in audit quality and efficiency.
By embedding continuous learning and innovation into the audit analytics function, finance professionals can adapt to change proactively, enhance audit quality, and deliver greater value to their organizations.
12. Appendix and Resources
12.1 Glossary of Key Audit Analytics Terms
Audit analytics is a specialized field combining auditing principles with data analytics techniques. Understanding the terminology is crucial for finance professionals, auditors, and accountants to effectively apply analytics in their work. Below is a detailed glossary of key terms, complemented by mind maps and practical examples to enhance comprehension.
Audit Analytics
- Definition: The application of data analytics techniques to audit processes to improve the effectiveness and efficiency of audits.
- Example: Using data visualization tools to identify unusual patterns in expense reports.
Data Mining
- Definition: The process of discovering patterns, correlations, and anomalies within large datasets.
- Example: Extracting transaction data to identify duplicate payments.
Anomaly Detection
- Definition: Identifying data points that deviate significantly from the norm, which may indicate errors or fraudulent activity.
- Example: Detecting an unusually high invoice amount compared to historical data.
Continuous Auditing
- Definition: An automated approach to auditing that allows ongoing analysis of financial transactions and controls.
- Example: Real-time monitoring of payroll transactions to flag irregularities immediately.
Data Visualization
- Definition: The graphical representation of data to help auditors quickly interpret complex datasets.
- Example: Using heatmaps to show areas of high financial risk.
Machine Learning (ML)
- Definition: A subset of artificial intelligence where algorithms learn from data to make predictions or decisions.
- Example: Training a model to predict the likelihood of fraudulent transactions based on historical audit data.
Regression Analysis
- Definition: A statistical method to examine the relationship between dependent and independent variables.
- Example: Analyzing how changes in sales volume impact revenue recognition.
Key Performance Indicators (KPIs)
- Definition: Quantifiable measures used to evaluate the success of an audit process or financial control.
- Example: Percentage of transactions reviewed within a given period.
Hypothesis Testing
- Definition: A statistical method used to determine if there is enough evidence to support a specific claim about a dataset.
- Example: Testing whether the average invoice amount differs significantly between two departments.
Data Cleaning
- Definition: The process of detecting and correcting (or removing) corrupt or inaccurate records from a dataset.
- Example: Removing duplicate vendor entries before analysis.
Sampling
- Definition: Selecting a representative subset of data from a larger dataset for audit testing.
- Example: Reviewing 10% of all purchase orders to verify compliance.
Risk Assessment
- Definition: The process of identifying and analyzing potential risks that could impact financial statements or operations.
- Example: Using analytics to prioritize audit focus on high-risk vendor payments.
Summary
This glossary provides foundational knowledge for finance professionals and auditors venturing into audit analytics. The mind maps visually organize concepts, while examples demonstrate practical applications, making these terms easier to understand and apply in real-world audit scenarios.
12.2 Recommended Software and Tools for Audit Analytics
Audit analytics requires a robust set of tools that enable finance professionals to efficiently collect, analyze, visualize, and report data. Below is a detailed overview of some of the most widely used software and tools in the industry, categorized by their primary function. Each section includes practical examples and mind maps to help you understand how these tools fit into the audit analytics workflow.
Data Extraction and Preparation Tools
These tools help auditors gather data from various sources, clean it, and prepare it for analysis.
- Alteryx: A powerful data blending and preparation platform that allows users to automate data workflows without coding.
- Microsoft Power Query: Integrated with Excel and Power BI, it simplifies data extraction and transformation.
- Talend: An open-source data integration tool that supports complex ETL (Extract, Transform, Load) processes.
Example: A finance auditor uses Alteryx to extract transactional data from an ERP system, clean inconsistencies, and merge datasets from different departments before analysis.
Data Analysis and Statistical Tools
These tools provide statistical functions, data modeling, and advanced analytics capabilities.
- R: An open-source programming language widely used for statistical computing and graphics.
- Python (with libraries like pandas, NumPy, scikit-learn): Popular for data manipulation, statistical analysis, and machine learning.
- SAS: A comprehensive analytics suite with strong statistical analysis capabilities.
Example: An auditor applies Python’s scikit-learn library to build a predictive model that identifies high-risk transactions for further review.
Visualization and Reporting Tools
Visualization tools help auditors communicate findings effectively to stakeholders.
- Tableau: User-friendly platform for creating interactive dashboards and visualizations.
- Microsoft Power BI: Integrates well with Microsoft products, offering real-time data visualization.
- Qlik Sense: Provides associative data indexing and dynamic dashboards.
Example: Using Tableau, an auditor creates a fraud risk heatmap that visually highlights suspicious transactions by region and time period.
Continuous Auditing and Monitoring Tools
These platforms enable ongoing audit processes and real-time monitoring.
- CaseWare IDEA: Specialized audit data analytics software for continuous auditing and fraud detection.
- ACL Analytics (Galvanize): Provides automated data analysis and risk assessment.
- SAP Audit Management: Integrates with SAP ERP systems for streamlined audit workflows.
Example: An audit team uses ACL Analytics to set up automated scripts that continuously monitor expense claims for anomalies.
Advanced Analytics and Machine Learning Platforms
These tools support predictive analytics, natural language processing, and AI-driven insights.
- IBM Watson Analytics: AI-powered analytics platform with natural language querying.
- Google Cloud AI Platform: Offers scalable machine learning model development and deployment.
- Azure Machine Learning: Microsoft’s cloud-based machine learning service.
Example: A finance auditor leverages IBM Watson to analyze unstructured audit notes and identify patterns indicative of compliance risks.
Summary Mind Map
Final Notes
Selecting the right combination of tools depends on your organization’s size, existing infrastructure, and audit objectives. Many finance professionals start with familiar platforms like Excel and Power BI, then gradually incorporate advanced tools like Python or ACL Analytics as their analytics maturity grows.
By integrating these recommended software solutions into your audit processes, you can enhance accuracy, efficiency, and insight generation, ultimately leading to more effective and proactive audits.
12.3 Sample Audit Analytics Templates and Checklists
To effectively implement audit analytics, having structured templates and checklists can streamline the process, ensure consistency, and improve audit quality. Below are several sample templates and checklists designed specifically for finance professionals and auditors, accompanied by mind maps in format to visualize the workflow and key components.
Audit Analytics Planning Template
Example Usage:
- Define the audit objective such as “Detect unusual vendor payments in Q1”.
- Identify relevant data sources like accounts payable and purchase orders.
- Assign roles: auditor leads, data analyst supports.
- Set timeline for data extraction, analysis, and report delivery.
Data Quality Checklist for Audit Analytics
Example:
- Check for missing invoice numbers in accounts payable data.
- Verify transaction dates align with audit period.
- Confirm vendor codes use standardized naming conventions.
Anomaly Detection Checklist
Example:
- Set payment amount threshold at $10,000 for flagging.
- Use boxplots to visualize expense distributions.
- Validate flagged transactions with procurement team.
Continuous Monitoring Setup Template
Example:
- Monitor duplicate invoice counts monthly.
- Set alerts for manual journal entries exceeding 5% of total entries.
- Schedule quarterly review meetings with finance leadership.
Audit Analytics Reporting Checklist
Example:
- Prepare a heatmap showing fraud risk by vendor category.
- Summarize key risks and recommended controls.
- Tailor report sections for technical and non-technical audiences.
Additional Example: Sample Audit Analytics Workflow Mind Map
Summary
Using these templates and checklists helps finance professionals and auditors maintain a structured, repeatable approach to audit analytics. Visual mind maps complement the process by providing clear overviews and aiding communication within audit teams and stakeholders.
Feel free to customize these templates to fit your organization’s specific audit environment and data landscape.
12.4 Further Reading and Online Courses
To deepen your understanding of audit analytics and enhance your practical skills, here is a curated list of recommended books, articles, and online courses. These resources cover foundational concepts, advanced techniques, and real-world applications tailored for finance professionals, auditors, and accountants.
Recommended Books
-
“Data Analytics for Auditing” by Vernon J. Richardson, Ryan A. Teeter, and Katie L. Terrell
- A comprehensive guide that bridges audit theory with data analytics practice.
- Includes case studies and practical examples.
-
“Audit Analytics: Data Analytics for Auditors” by Mark J. Nigrini
- Focuses on forensic data analytics and fraud detection techniques.
- Explains statistical methods with easy-to-understand examples.
-
“Continuous Auditing: Theory and Application” by Miklos A. Vasarhelyi and Michael G. Alles
- Explores continuous auditing frameworks and technology integration.
-
“Python for Finance and Auditing” by Yves Hilpisch
- Ideal for auditors looking to learn Python programming for data analysis.
Influential Articles and Papers
-
“The Role of Data Analytics in Auditing” – Journal of Accountancy
- Discusses evolving audit methodologies using analytics.
-
“Applying Machine Learning in Audit Risk Assessment” – The CPA Journal
- Explores practical machine learning applications in audit planning.
-
“Ethical Considerations in Audit Analytics” – International Journal of Auditing
- Highlights ethical challenges and best practices.
Online Courses and Certifications
| Course Name | Provider | Description | Level | Link |
|---|---|---|---|---|
| Audit Analytics Fundamentals | Coursera (offered by University of Illinois) | Covers basics of audit data analysis, visualization, and interpretation. | Beginner | Link |
| Data Analytics for Auditors | Udemy | Practical course focusing on Excel, SQL, and Tableau for audit data. | Intermediate | Link |
| Machine Learning for Finance | edX (offered by NYIF) | Introduces ML concepts applied to financial data and fraud detection. | Intermediate | Link |
| Python for Data Science and Finance | DataCamp | Hands-on Python programming with finance datasets and audit examples. | Beginner to Intermediate | Link |
| Certified Analytics Professional (CAP) | INFORMS | Industry-recognized certification covering analytics lifecycle including audit use cases. | Advanced | Link |
Mind Maps
Below are several mind maps to help visualize key concepts and learning paths related to audit analytics.
Mind Map 1: Audit Analytics Learning Path
Mind Map 2: Key Audit Analytics Techniques
Mind Map 3: Ethical Considerations in Audit Analytics

Examples of Applying Further Learning
-
Example 1: After completing the “Audit Analytics Fundamentals” course on Coursera, an auditor used Tableau to create interactive dashboards that highlighted unusual vendor payments, leading to early fraud detection.
-
Example 2: Leveraging Python skills from DataCamp, a finance professional automated the extraction and cleaning of large ERP datasets, reducing audit preparation time by 40%.
-
Example 3: Applying concepts from “Machine Learning for Finance,” an audit team built a predictive model to prioritize high-risk transactions, improving audit efficiency.
Summary
Investing time in these resources will empower finance professionals and auditors to harness audit analytics effectively. Combining foundational knowledge with hands-on practice and ethical awareness ensures a well-rounded skill set to meet the evolving demands of the finance and tech sectors.
12.5 Community and Professional Networks for Audit Analytics
Engaging with communities and professional networks is essential for finance professionals and auditors who want to stay current with audit analytics trends, share knowledge, and develop their skills. These networks provide opportunities for collaboration, mentorship, and access to resources that can enhance audit quality and efficiency.
Why Join Audit Analytics Communities?
- Knowledge Sharing: Learn from peers and experts about best practices, tools, and emerging technologies.
- Networking: Connect with professionals across industries to exchange ideas and opportunities.
- Professional Development: Access webinars, workshops, certifications, and conferences.
- Problem Solving: Get support on challenges through forums and discussion groups.
Key Communities and Networks
The Institute of Internal Auditors (IIA)
- Offers a dedicated focus on audit analytics through its resources and events.
- Provides certifications like Certified Internal Auditor (CIA) with analytics components.
- Hosts the annual IIA International Conference featuring audit analytics tracks.
ISACA
- Known for IT audit and cybersecurity, ISACA also covers audit analytics extensively.
- Offers certifications such as Certified Information Systems Auditor (CISA) and Certified Data Privacy Solutions Engineer (CDPSE).
- Provides forums and local chapter meetings focused on analytics in auditing.
Association of Certified Fraud Examiners (ACFE)
- Focuses on fraud detection and prevention, a critical area for audit analytics.
- Provides resources on data analytics techniques for fraud examination.
- Hosts webinars and local chapter events.
LinkedIn Groups
- Examples include “Audit Analytics Professionals,” “Data Analytics for Auditors,” and “Finance and Audit Analytics Network.”
- Active discussions, job postings, and resource sharing.
Reddit Communities
- Subreddits like r/audit, r/dataanalysis, and r/finance offer informal peer support.
Kaggle and Data Science Platforms
- While not audit-specific, these platforms provide datasets and competitions relevant to fraud detection and financial analytics.
Mind Map: Audit Analytics Community Engagement
Example: Leveraging IIA for Audit Analytics Growth
Scenario: Jane, an internal auditor at a tech company, wants to improve her audit analytics skills.
Steps Taken:
- Joins the IIA and accesses their audit analytics resource library.
- Participates in the IIA webinar on “Using Data Analytics for Risk Assessment.”
- Attends the IIA International Conference and joins the audit analytics track.
- Connects with peers through the IIA local chapter to discuss practical challenges.
- Applies learned techniques to automate data sampling in her audits, improving efficiency.
Mind Map: Benefits of Joining Audit Analytics Networks
Tips for Maximizing Community Involvement
- Be Active: Regularly participate in discussions and share your own insights.
- Attend Events: Webinars, workshops, and conferences provide hands-on learning.
- Seek Mentors: Experienced professionals can guide your analytics journey.
- Contribute Content: Write articles or case studies to establish expertise.
- Stay Updated: Follow newsletters and alerts from key organizations.
Additional Resources
- IIA Website
- ISACA Website
- ACFE Website
- LinkedIn: Search for “Audit Analytics” groups
- Reddit: Visit r/audit and r/dataanalysis
- Kaggle: Explore finance and fraud detection datasets
By actively engaging with these communities and networks, finance professionals and auditors can continuously enhance their audit analytics capabilities, stay informed about industry developments, and contribute to the evolution of audit practices.