Budget Variance Analysis
1. Introduction to Budget Variance Analysis
1.1 Understanding Budget Variance: Definition and Importance
What is Budget Variance?
Budget variance is the difference between the budgeted or planned amount and the actual amount incurred or earned. It is a key financial metric used by accountants and financial analysts to measure performance against expectations.
- Favorable Variance: When actual income is higher than budgeted or actual expenses are lower than budgeted.
- Unfavorable Variance: When actual income is lower than budgeted or actual expenses are higher than budgeted.
Why is Budget Variance Important?
Budget variance analysis helps organizations:
- Identify areas where performance deviates from the plan.
- Understand the reasons behind these deviations.
- Make informed decisions to control costs or capitalize on opportunities.
- Improve future budgeting accuracy.
Mind Map: Budget Variance Overview
Example 1: Sales Department Revenue Variance
A company budgeted $500,000 in sales revenue for Q1 but actually earned $550,000.
- Budgeted Revenue: $500,000
- Actual Revenue: $550,000
- Variance = Actual - Budgeted = $550,000 - $500,000 = +$50,000 (Favorable)
This favorable variance indicates better-than-expected sales performance.
Example 2: Marketing Expenses Variance
The marketing department budgeted $100,000 for advertising but spent $120,000.
- Budgeted Expense: $100,000
- Actual Expense: $120,000
- Variance = Actual - Budgeted = $120,000 - $100,000 = +$20,000 (Unfavorable)
This unfavorable variance signals overspending that needs investigation.
Mind Map: Example Breakdown
Key Takeaways
- Budget variance is a vital tool for financial control.
- Both favorable and unfavorable variances provide insights.
- Regular variance analysis supports proactive management.
By understanding budget variance clearly, accountants and financial analysts can better support their organizations in achieving financial discipline and strategic goals.
1.2 Types of Budget Variances: Favorable vs. Unfavorable
Budget variance analysis is a critical tool for accountants and financial analysts to understand how actual financial performance compares to the budgeted expectations. Variances can be broadly categorized into two types: Favorable Variances and Unfavorable Variances. Recognizing and interpreting these variances correctly enables organizations to make informed decisions, optimize resource allocation, and improve financial control.
What is a Budget Variance?
A budget variance is the difference between the budgeted amount and the actual amount incurred or earned. It can be expressed as:
\[ \text{Variance} = \text{Actual} - \text{Budgeted} \]
- If the result is positive or beneficial to the company, it is considered favorable.
- If the result is negative or detrimental, it is considered unfavorable.
Mind Map: Types of Budget Variances
Favorable Variances
Favorable variances occur when actual results are better than budgeted. This means:
- Higher revenues than expected
- Lower expenses than planned
Examples:
-
Revenue Example: A company budgeted $100,000 in sales for the month but actually achieved $110,000. The $10,000 positive variance is favorable.
-
Expense Example: The marketing department budgeted $20,000 for advertising but spent only $18,000, resulting in a $2,000 favorable variance.
Mind Map: Favorable Variances Breakdown
Unfavorable Variances
Unfavorable variances occur when actual results are worse than budgeted. This means:
- Lower revenues than expected
- Higher expenses than planned
Examples:
-
Revenue Example: A company budgeted $150,000 in sales but only achieved $140,000, resulting in a $10,000 unfavorable variance.
-
Expense Example: The production department budgeted $50,000 for raw materials but spent $55,000, leading to a $5,000 unfavorable variance.
Mind Map: Unfavorable Variances Breakdown
Integrated Example: Retail Store Budget Variance
| Category | Budgeted Amount | Actual Amount | Variance | Variance Type |
|---|---|---|---|---|
| Sales Revenue | $200,000 | $210,000 | +$10,000 | Favorable |
| Cost of Goods Sold | $120,000 | $125,000 | -$5,000 | Unfavorable |
| Marketing Expense | $30,000 | $28,000 | +$2,000 | Favorable |
Interpretation:
- Sales revenue exceeded expectations, which is favorable.
- Cost of goods sold was higher than budgeted, an unfavorable variance indicating possible inefficiencies or price increases.
- Marketing expenses were under budget, a favorable variance that may reflect cost-saving measures.
Best Practices for Handling Favorable and Unfavorable Variances
- Investigate significant variances: Both favorable and unfavorable variances should be analyzed to understand underlying causes.
- Avoid complacency with favorable variances: Sometimes favorable variances result from under-budgeting or missed opportunities.
- Use variances to improve forecasting: Historical variance data can refine future budgets.
- Communicate findings clearly: Use visual aids like charts and mind maps to explain variances to stakeholders.
Summary
Understanding the distinction between favorable and unfavorable budget variances is foundational for effective financial analysis. By systematically categorizing and analyzing these variances, accountants and financial analysts can provide actionable insights that drive better financial performance and strategic decision-making.
1.3 Role of Budget Variance Analysis in Corporate Finance
Budget variance analysis plays a pivotal role in corporate finance by providing insights into the financial health and operational efficiency of an organization. It helps accountants and financial analysts understand deviations between planned budgets and actual performance, enabling informed decision-making and strategic adjustments.
Key Roles of Budget Variance Analysis:
- Performance Measurement: Evaluates how well departments or projects adhere to their budgets.
- Cost Control: Identifies areas where expenses exceed expectations, allowing corrective actions.
- Forecasting Accuracy: Improves future budgeting by analyzing past variances.
- Resource Allocation: Guides management in reallocating resources to optimize returns.
- Risk Management: Detects financial risks early by highlighting unfavorable variances.
- Strategic Planning: Supports long-term planning by revealing trends and inefficiencies.
Mind Map: Role of Budget Variance Analysis in Corporate Finance
Example 1: Performance Measurement in a Marketing Department
A company budgets $200,000 for its annual marketing campaign. At the end of the quarter, actual spending is $250,000, resulting in a $50,000 unfavorable variance. Through variance analysis, the financial analyst identifies that increased digital advertising costs and unplanned promotional events caused the overspend. This insight allows management to adjust future campaigns and negotiate better vendor contracts.
Mind Map: Performance Measurement Example
Example 2: Cost Control in Manufacturing
A manufacturing firm budgets $1 million for raw materials. Mid-year, actual costs are $900,000, a $100,000 favorable variance. Variance analysis reveals improved supplier contracts and efficient inventory management. The finance team uses this data to reinforce best practices and explore further cost-saving measures.
Mind Map: Cost Control Example
Integrating Budget Variance Analysis into Corporate Finance Workflow
Budget variance analysis is not a standalone activity but an integral part of the corporate finance cycle. It feeds into monthly financial reviews, supports quarterly forecasting, and informs annual strategic planning.
Summary
In corporate finance, budget variance analysis empowers accountants and financial analysts to monitor financial performance, control costs, improve forecasting, allocate resources wisely, manage risks, and support strategic initiatives. By systematically analyzing variances, organizations can adapt quickly to changing conditions and maintain financial discipline.
This section has demonstrated the multifaceted role of budget variance analysis with practical examples and mind maps, providing a clear framework for finance professionals to apply these concepts effectively.
1.4 Common Terminology and Concepts Explained with Examples
Understanding budget variance analysis begins with mastering the key terminology and concepts that form its foundation. This section breaks down these terms with clear definitions, practical explanations, and illustrative examples. Additionally, mind maps are provided in format to visually organize and connect these ideas.
Key Terms in Budget Variance Analysis
-
Budget: A financial plan that estimates revenue and expenses over a specific period.
-
Actuals: The real financial results recorded during the period.
-
Variance: The difference between the budgeted amount and the actual amount.
-
Favorable Variance (F): When actual revenue is higher than budgeted or actual expenses are lower than budgeted, positively impacting profit.
-
Unfavorable Variance (U): When actual revenue is lower than budgeted or actual expenses are higher than budgeted, negatively impacting profit.
-
Static Budget: A fixed budget created before the period begins, not adjusted for actual activity levels.
-
Flexible Budget: A budget that adjusts based on actual activity levels or volume.
-
Controllable Variance: Variances that management can influence or control.
-
Uncontrollable Variance: Variances caused by external factors outside management’s control.
-
Materiality: The significance of a variance in terms of its impact on decision-making.
Mind Map: Core Concepts of Budget Variance Analysis
Practical Examples for Each Term
Example 1: Calculating Variance
- Budgeted Sales: $100,000
- Actual Sales: $110,000
Variance = Actual - Budget = $110,000 - $100,000 = +$10,000 (Favorable)
This means sales exceeded expectations by $10,000, which is a favorable variance.
Example 2: Expense Variance
- Budgeted Marketing Expense: $20,000
- Actual Marketing Expense: $25,000
Variance = $25,000 - $20,000 = +$5,000 (Unfavorable)
The company spent $5,000 more than budgeted on marketing, resulting in an unfavorable variance.
Example 3: Controllable vs. Uncontrollable Variance
- Controllable: A sales manager overspent on advertising beyond the budget.
- Uncontrollable: A sudden increase in raw material prices due to market conditions.
Mind Map: Types of Variances
Concept: Materiality in Variance Analysis
Materiality helps prioritize which variances require investigation. For example, a $100 variance in a $1,000,000 budget might be immaterial, while a $10,000 variance could be significant.
Example:
- Department A has a $500 variance on a $50,000 budget (1%) — likely immaterial.
- Department B has a $15,000 variance on a $100,000 budget (15%) — material and warrants investigation.
Mind Map: Materiality Considerations
Summary
By mastering these terms and concepts, accountants and financial analysts can effectively communicate, analyze, and act on budget variances. Visualizing these relationships through mind maps and applying real-world examples ensures a practical understanding that supports better financial decision-making.
2. Setting Up an Effective Budget for Variance Analysis
2.1 Best Practices for Creating Realistic Budgets
Creating a realistic budget is the cornerstone of effective budget variance analysis. A well-constructed budget not only sets achievable financial targets but also provides a reliable baseline against which actual performance can be measured. Below are best practices to ensure your budgets are both practical and actionable.
Base Budgets on Historical Data
Using past financial data helps ground your budget in reality. Analyze trends, seasonality, and recurring expenses to forecast future costs and revenues.
Example: A retail company reviews sales data from the past three years and notices a 10% increase in sales every holiday season. Incorporating this trend into the budget ensures seasonal spikes are accounted for.
Engage Cross-Functional Teams
Involve department heads and key stakeholders in the budgeting process. Their insights help identify realistic targets and uncover potential challenges.
Example: The finance team collaborates with marketing and operations to forecast advertising expenses and production costs, ensuring the budget reflects operational realities.
Set SMART Budget Goals
Budgets should be Specific, Measurable, Achievable, Relevant, and Time-bound. This framework ensures clarity and accountability.
Example: Instead of budgeting a vague “increase sales,” set a goal like “Increase Q3 sales by 8% compared to Q3 last year.”
Incorporate Contingency Plans
Unexpected expenses or market changes can impact budgets. Allocate a contingency reserve to handle uncertainties without derailing financial plans.
Example: A manufacturing firm includes a 5% contingency fund in its budget to cover raw material price fluctuations.
Use Zero-Based Budgeting Where Appropriate
Instead of relying solely on previous budgets, start from zero and justify every expense. This approach helps eliminate unnecessary costs.
Example: A department justifies each line item for the upcoming year, resulting in a 7% reduction in discretionary spending.
Regularly Review and Update Budgets
Budgets should be living documents. Schedule periodic reviews to adjust for new information or changes in business conditions.
Example: A financial analyst reviews the budget quarterly and revises forecasts based on updated sales data and market trends.
Leverage Technology and Tools
Use budgeting software and spreadsheets to improve accuracy, streamline data collection, and facilitate collaboration.
Example: A corporate finance team uses cloud-based budgeting software that integrates with ERP systems, enabling real-time updates and collaboration.
Summary Table of Best Practices with Examples
| Best Practice | Description | Example Scenario |
|---|---|---|
| Base Budgets on Historical Data | Use past data to forecast realistically | Retailer accounts for holiday sales spikes |
| Engage Cross-Functional Teams | Collaborate with departments for accuracy | Finance works with marketing and operations |
| Set SMART Budget Goals | Define clear, measurable, achievable targets | Increase Q3 sales by 8% |
| Incorporate Contingency Plans | Allocate reserves for uncertainties | Manufacturing includes 5% contingency for materials |
| Use Zero-Based Budgeting | Justify all expenses from zero | Department reduces discretionary spending by 7% |
| Regularly Review and Update | Adjust budgets based on new data | Quarterly budget revisions by financial analyst |
| Leverage Technology and Tools | Use software for accuracy and collaboration | Cloud-based budgeting software with ERP integration |
By following these best practices, accountants and financial analysts can create budgets that are not only realistic but also flexible and aligned with corporate objectives. This foundation is critical for meaningful budget variance analysis and informed financial decision-making.
2.2 Incorporating Historical Data and Market Trends: Practical Examples
Incorporating historical data and market trends into your budgeting process is essential for creating realistic and achievable budgets. This section explores how accountants and financial analysts can effectively leverage past financial performance and external market indicators to improve budget accuracy and relevance.
Why Use Historical Data and Market Trends?
- Historical Data provides a factual basis for forecasting by reflecting actual past performance.
- Market Trends offer insights into external factors that may impact future financial outcomes, such as economic cycles, industry shifts, and competitive dynamics.
Together, they help reduce uncertainty and improve the reliability of budget assumptions.
Mind Map: Incorporating Historical Data and Market Trends
Step 1: Collecting and Analyzing Historical Data
Start by gathering financial data from previous periods, ideally spanning multiple years to identify patterns and trends.
Example:
A retail company reviews the last 3 years of monthly sales data to identify seasonal peaks during holiday seasons and dips in summer months.
- Practice: Use rolling averages to smooth out fluctuations and highlight underlying trends.
Step 2: Identifying and Adjusting for Anomalies
Historical data may include one-time events (e.g., major contracts, natural disasters) that skew results.
Example:
A manufacturing firm experienced an unusually high expense in one quarter due to equipment replacement. This should be excluded or adjusted in the budget to avoid overestimating future expenses.
- Practice: Annotate anomalies and adjust historical figures accordingly.
Step 3: Incorporating Market Trends
Analyze relevant market data to adjust your budget assumptions.
Example:
An energy company notes rising fuel prices and regulatory changes promoting renewable energy. These trends suggest increasing costs in traditional fuel procurement and potential investment in renewables.
- Practice: Use external reports, government publications, and industry analyses to gather market intelligence.
Step 4: Combining Historical Data with Market Trends for Forecasting
Integrate both data sources to create a more comprehensive budget.
Example:
A financial analyst at a software firm combines historical revenue growth rates with market forecasts predicting increased demand for cloud services. The budget reflects a higher revenue target aligned with these insights.
- Practice: Use scenario planning to model different outcomes based on varying market conditions.
Practical Example: Budgeting for a Restaurant Chain
-
Historical Data: Review past 2 years’ monthly sales and cost data.
- Identify peak seasons (e.g., summer, holidays).
- Adjust for one-time renovations that increased costs.
-
Market Trends: Analyze local economic growth, competitor openings, and food cost inflation.
-
Budget Adjustment: Increase food cost budget by 5% due to inflation, anticipate 10% revenue growth in summer months based on past trends and local tourism data.
-
Result: More accurate budget that anticipates seasonal fluctuations and cost pressures.
Mind Map: Practical Example - Restaurant Chain Budgeting
Tips for Accountants and Financial Analysts
- Always validate historical data accuracy before use.
- Use multiple years of data to avoid bias from short-term fluctuations.
- Stay updated on relevant market trends through subscriptions and industry news.
- Document assumptions clearly to support budget rationale.
- Collaborate with operational teams to understand the context behind data.
By systematically incorporating historical data and market trends, finance professionals can create budgets that are both grounded in reality and responsive to external changes, leading to better financial planning and decision-making.
2.3 Aligning Budgets with Strategic Corporate Goals
Aligning budgets with strategic corporate goals is a critical best practice in budget variance analysis. When budgets are directly linked to the overarching objectives of the company, it ensures that financial resources are allocated efficiently, performance is measurable against key targets, and deviations can be analyzed in the context of strategic priorities.
Why Alignment Matters
- Focus on Priorities: Ensures that spending supports the company’s mission and vision.
- Improved Decision Making: Facilitates better resource allocation and prioritization.
- Enhanced Accountability: Departments understand how their budgets contribute to corporate goals.
- Easier Variance Interpretation: Variances can be assessed relative to strategic impact, not just numbers.
Steps to Align Budgets with Strategic Goals
- Identify Strategic Goals Clearly
- Example: A company aims to increase market share by 10% within 12 months.
- Break Down Goals into Departmental Objectives
- Marketing: Increase brand awareness by 20%.
- Sales: Expand customer base by 15%.
- Translate Objectives into Budget Items
- Marketing budget includes digital campaigns, events, and content creation.
- Sales budget includes hiring, training, and CRM tools.
- Set Measurable KPIs Linked to Budget Items
- Cost per lead, conversion rate, customer acquisition cost.
- Review and Adjust Budgets Periodically
- Based on performance and changing strategic priorities.
Mind Map: Aligning Budgets with Strategic Goals
Example: Aligning Budget in a Corporate Scenario
Company: Tech Solutions Inc.
Strategic Goal: Launch 3 new software products in the next fiscal year to increase revenue by 25%.
Budget Alignment Process:
- R&D Department: Budget allocated for product development, prototyping, and testing.
- Marketing Department: Budget for product launch campaigns, market research, and customer engagement.
- Sales Department: Budget for training sales teams on new products and expanding sales channels.
Outcome:
- Each department’s budget is tied to specific milestones (e.g., prototype completion, campaign launch dates).
- Variance analysis focuses on whether spending delays or accelerations impact product launch timelines and revenue targets.
Mind Map: Example Budget Alignment for Tech Solutions Inc.
Tips for Accountants and Financial Analysts
- Engage with strategic planners early to understand goals.
- Use rolling forecasts to keep budgets flexible and aligned.
- Incorporate scenario planning to anticipate strategic shifts.
- Communicate how budget variances affect strategic outcomes, not just financials.
By embedding strategic goals into the budgeting process, organizations create a cohesive financial plan that drives performance and supports long-term success.
2.4 Common Pitfalls in Budget Preparation and How to Avoid Them
Budget preparation is a critical step in financial planning, but it is often fraught with challenges that can lead to inaccurate forecasts and ineffective resource allocation. Understanding common pitfalls and implementing strategies to avoid them can significantly improve the quality and reliability of your budgets.
Common Pitfalls in Budget Preparation
Overly Optimistic Revenue Projections
Many organizations tend to overestimate their revenues due to optimism or pressure to meet targets.
Example: A retail company projects a 20% increase in sales based on last year’s holiday season, ignoring current market slowdown signals.
Ignoring Historical Data
Failing to analyze past budget performance and actual results can lead to unrealistic assumptions.
Example: A manufacturing firm sets raw material costs without considering last year’s price fluctuations and supplier issues.
Lack of Stakeholder Involvement
Budgeting done in isolation without input from relevant departments often misses critical insights.
Example: Finance prepares the budget without consulting the marketing team, resulting in underfunded campaigns.
Inflexible Budgeting
Rigid budgets that do not allow adjustments for changing business conditions can quickly become obsolete.
Example: A tech startup sticks to a fixed budget despite rapid changes in product development needs.
Underestimating Expenses
Commonly, indirect or variable costs are underestimated or overlooked.
Example: An organization fails to budget for overtime pay during peak production periods.
Lack of Clear Assumptions
Budgets without documented assumptions make it difficult to understand the basis of projections or to revise them.
Example: A financial analyst presents a budget without clarifying assumptions about market growth or cost inflation.
Poor Communication of Budget Goals
When the purpose and expectations of the budget are not clearly communicated, departments may misalign their plans.
Example: Sales teams think the budget is a target to beat rather than a planning tool, leading to aggressive and unrealistic sales forecasts.
How to Avoid These Pitfalls
Mind Map: Avoiding Budget Preparation Pitfalls
Use Conservative and Data-Driven Revenue Projections
- Base revenue estimates on a combination of historical data and current market conditions.
- Example: Instead of assuming a 20% sales increase, use a range (e.g., 10-15%) supported by competitor analysis and economic indicators.
Analyze Historical Data Thoroughly
- Compare previous budgets to actual results to identify trends and recurring variances.
- Example: If last year’s raw material costs were 5% higher than budgeted due to supplier price hikes, factor this into the new budget.
Foster Cross-Functional Collaboration
- Involve department heads and key personnel early in the budgeting process.
- Example: Schedule workshops where finance, marketing, operations, and sales teams discuss assumptions and constraints.
Incorporate Flexibility through Rolling Forecasts
- Update budgets periodically (monthly or quarterly) to reflect changing conditions.
- Example: A startup revises its budget quarterly to accommodate shifts in product development timelines and funding availability.
Include All Relevant Costs
- Create detailed expense categories and review them with department managers.
- Example: Budget for overtime, maintenance, and unexpected expenses rather than only fixed costs.
Document and Review Assumptions Regularly
- Maintain a assumptions log that is reviewed and updated as new information arises.
- Example: If inflation rates change, update cost assumptions accordingly and communicate changes.
Communicate Budget Objectives and Process Clearly
- Provide training sessions and written guidelines on the budgeting process.
- Example: Clarify that budgets are planning tools, not just performance targets, to reduce pressure for unrealistic numbers.
Summary Example: Avoiding Pitfalls in Practice
Scenario: A mid-sized manufacturing company struggled with consistently missing budget targets due to optimistic revenue forecasts and underestimated expenses.
Solution: They implemented the following best practices:
- Engaged sales and operations teams in collaborative budget workshops.
- Used a rolling forecast updated quarterly.
- Documented all assumptions, including market conditions and cost drivers.
- Included contingency reserves for variable costs like overtime.
Result: The company improved budget accuracy by 15% within one fiscal year, enabling better resource allocation and strategic decision-making.
By recognizing and addressing these common pitfalls, accountants and financial analysts can prepare more reliable budgets that serve as effective tools for corporate financial management.
3. Collecting and Organizing Data for Variance Analysis
3.1 Identifying Relevant Financial and Operational Data Sources
Budget variance analysis relies heavily on accurate, comprehensive data from multiple sources. Identifying the right financial and operational data sources is the foundation for meaningful variance insights. This section explores the key data sources, how to categorize them, and practical examples to help accountants and financial analysts gather the most relevant information.
Key Financial Data Sources
- General Ledger (GL): The primary source of all financial transactions, including revenues, expenses, assets, and liabilities.
- Accounts Payable (AP): Records of outstanding bills and payments to suppliers.
- Accounts Receivable (AR): Details of money owed by customers.
- Payroll Systems: Salary, wages, bonuses, and related employee costs.
- Fixed Asset Registers: Information on depreciation and asset values.
- Budget and Forecast Reports: Original budget figures and updated forecasts.
Key Operational Data Sources
- Sales Data: Units sold, sales revenue by product, region, or channel.
- Production Reports: Output volumes, production costs, and efficiency metrics.
- Inventory Records: Stock levels, turnover rates, and carrying costs.
- Procurement Data: Purchase orders, supplier performance, and cost trends.
- Project Management Systems: Costs and timelines related to ongoing projects.
- Customer Service Metrics: Returns, complaints, and service costs.
Mind Map: Categorizing Data Sources for Budget Variance Analysis
Practical Example 1: Retail Company
A retail company analyzing budget variances for its quarterly sales and expenses might collect data from:
- Sales Data: Daily POS (Point of Sale) system reports showing actual sales vs. budgeted sales.
- Inventory Records: Warehouse management system data to track stock levels and shrinkage.
- Payroll Systems: Employee hours worked during peak seasons affecting labor costs.
- Accounts Payable: Supplier invoices for merchandise purchases.
By integrating these sources, the analyst can identify if variances are due to lower sales volume, higher labor costs, or increased supplier prices.
Practical Example 2: Manufacturing Firm
For a manufacturing firm, relevant data sources include:
- Production Reports: Machine uptime, output quantity, and scrap rates.
- Procurement Data: Raw material purchase costs and delivery times.
- Fixed Asset Registers: Depreciation schedules impacting overhead costs.
- Project Management Systems: Costs related to new product development projects.
This data helps pinpoint whether unfavorable variances stem from production inefficiencies, raw material price fluctuations, or project overruns.
Tips for Effective Data Source Identification
- Cross-Functional Collaboration: Engage with departments such as sales, operations, and procurement to understand available data.
- Data Accuracy and Timeliness: Prioritize sources that provide up-to-date and verified data.
- Data Integration: Use software tools to consolidate data from multiple systems for a holistic view.
- Documentation: Maintain a data source inventory with descriptions, owners, and update frequency.
Mind Map: Steps to Identify Relevant Data Sources
By systematically identifying and organizing relevant financial and operational data sources, accountants and financial analysts can ensure their budget variance analysis is grounded in reliable information, enabling more accurate insights and better decision-making.
3.2 Best Practices in Data Collection and Validation
Effective data collection and validation are critical to ensuring accurate and reliable budget variance analysis. Poor data quality can lead to misleading conclusions and faulty decision-making. Below are best practices, supported by practical examples and mind maps to help accountants and financial analysts implement robust data collection and validation processes.
Best Practices in Data Collection
-
Define Clear Data Requirements
- Identify what data is necessary for variance analysis (e.g., actual expenses, budgeted amounts, revenue figures).
- Specify data granularity (monthly, quarterly, department-level).
-
Use Standardized Data Collection Templates
- Develop and distribute templates to ensure consistency.
- Example: A standardized Excel sheet with predefined columns for account codes, budgeted amounts, actual amounts, and variance.
-
Automate Data Collection Where Possible
- Leverage ERP systems or financial software to pull data directly.
- Example: Using SAP or Oracle Financials to export actual expense data automatically.
-
Establish Data Collection Timelines
- Set deadlines aligned with reporting cycles to ensure timely analysis.
-
Train Data Providers
- Educate departments on the importance of accurate data entry.
- Example: Conduct quarterly workshops for department heads on data submission standards.
Best Practices in Data Validation
-
Implement Data Validation Rules
- Use software features to restrict invalid entries (e.g., negative values where not allowed).
-
Cross-Check Data Against Multiple Sources
- Verify actuals with bank statements, invoices, or procurement records.
-
Perform Trend Analysis
- Compare current data with historical trends to identify anomalies.
- Example: If marketing expenses spike 50% without a campaign, flag for review.
-
Use Reconciliation Processes
- Regularly reconcile ledger balances with subsidiary records.
-
Conduct Sample Audits
- Randomly select data points for detailed verification.
-
Document Validation Procedures
- Maintain records of validation checks for audit trails.
Mind Map: Data Collection Best Practices
Mind Map: Data Validation Best Practices
Practical Example: Implementing Data Collection and Validation in a Corporate Finance Team
Scenario: A corporate finance team is preparing monthly budget variance reports for multiple departments.
-
Step 1: Define Data Requirements
- Actual expenses and revenues by department, monthly.
- Budgeted figures for the same periods.
-
Step 2: Standardize Templates
- Created an Excel template with dropdown lists for departments and expense categories.
-
Step 3: Automate Data Collection
- Integrated the company’s ERP system to export actuals directly into the template.
-
Step 4: Set Timelines
- Data submission deadline set for the 5th of each month.
-
Step 5: Train Data Providers
- Conducted a webinar explaining the importance of timely and accurate data.
-
Step 6: Validate Data
- Applied Excel data validation rules to prevent incorrect entries.
- Cross-checked actual expenses against bank statements.
- Performed trend analysis comparing current month to previous months.
- Reconciled ledger balances monthly.
- Documented all validation steps in a shared folder.
Outcome: The team reduced data errors by 30%, improved reporting accuracy, and shortened the variance analysis cycle by 2 days.
By following these best practices in data collection and validation, accountants and financial analysts can ensure that their budget variance analysis is based on accurate, reliable data, leading to better insights and more informed financial decisions.
3.3 Using Technology and Software Tools for Data Management
Effective budget variance analysis relies heavily on accurate, timely, and well-organized data. Leveraging technology and software tools can significantly streamline the data management process, reduce errors, and enhance analytical capabilities. This section explores best practices for using technology in data management, supported by practical examples and mind maps to visualize workflows.
Why Use Technology for Data Management?
- Automation: Reduces manual data entry and errors.
- Real-time Access: Enables up-to-date variance tracking.
- Integration: Combines data from multiple sources for comprehensive analysis.
- Scalability: Handles growing data volumes efficiently.
Key Software Tools for Budget Variance Data Management
| Tool Type | Examples | Key Features |
|---|---|---|
| Spreadsheet Software | Microsoft Excel, Google Sheets | Custom formulas, pivot tables, data visualization |
| Enterprise Resource Planning (ERP) Systems | SAP, Oracle, NetSuite | Integrated financial modules, real-time data, workflow automation |
| Business Intelligence (BI) Tools | Power BI, Tableau, QlikView | Advanced data visualization, dashboards, drill-down analysis |
| Budgeting and Forecasting Software | Adaptive Insights, Anaplan | Collaborative budgeting, scenario modeling, variance tracking |
Mind Map: Technology Tools for Data Management
Best Practices for Using Technology in Data Management
- Centralize Data Sources: Use integrated systems or data warehouses to consolidate financial and operational data.
- Automate Data Import: Connect software tools directly to accounting systems or databases to minimize manual input.
- Ensure Data Accuracy: Implement validation rules and regular audits to maintain data integrity.
- Leverage Cloud Solutions: Facilitate remote access and real-time collaboration among finance teams.
- Customize Dashboards: Tailor visualizations to highlight key variance metrics relevant to stakeholders.
Practical Example: Setting Up a Data Dashboard for Real-Time Variance Tracking
Scenario: A financial analyst at a mid-sized manufacturing company needs to monitor budget variances across departments monthly.
Step 1: Data Integration
- Connect ERP system (e.g., SAP) to Power BI using built-in connectors.
- Import actual expenses, budget figures, and revenue data.
Step 2: Data Transformation
- Use Power Query to clean and format data.
- Create calculated columns for variance (Actual - Budget) and variance percentage.
Step 3: Dashboard Creation
- Design visuals: bar charts for department-wise variance, line charts for trend analysis.
- Add slicers to filter by time period, department, and cost center.
Step 4: Automation and Sharing
- Schedule data refreshes daily.
- Share dashboard link with finance team and management for real-time insights.
Outcome: The company reduces reporting lag from weeks to days, enabling faster decision-making and proactive variance management.
Mind Map: Real-Time Variance Dashboard Workflow
Additional Example: Using Excel Macros for Data Management
Scenario: An accountant managing monthly budget variance reports manually wants to reduce repetitive tasks.
Solution: Develop Excel macros to automate data consolidation and variance calculations.
Macro Features:
- Import multiple departmental budget and actual data files.
- Automatically calculate variances and flag significant deviations.
- Generate summary reports with conditional formatting.
Benefit: Saves several hours per month, reduces human error, and standardizes reporting format.
Summary
Utilizing technology and software tools for data management in budget variance analysis not only improves efficiency but also enhances the accuracy and timeliness of insights. Whether through sophisticated ERP and BI platforms or customized Excel solutions, finance professionals can better support strategic decision-making by adopting these best practices and tools.
3.4 Example: Setting Up a Data Dashboard for Real-Time Variance Tracking
In today’s fast-paced corporate finance environment, having a real-time data dashboard for budget variance tracking is essential for accountants and financial analysts. It enables timely decision-making, quick identification of issues, and improved communication across teams.
Why Use a Real-Time Variance Dashboard?
- Immediate visibility into budget vs. actual performance
- Faster root cause analysis
- Enhanced collaboration between departments
- Proactive management of financial risks
Key Components of a Real-Time Variance Dashboard
Step-by-Step Example: Building a Dashboard in Excel (Widely Used Tool)
-
Data Preparation:
- Collect budgeted and actual figures from your accounting system.
- Organize data in a structured table with columns: Department, Account, Budget, Actual, Period.
-
Calculate Variances:
- Add columns for Variance = Actual - Budget.
- Add % Variance = (Variance / Budget) * 100.
-
Create Pivot Tables:
- Summarize data by Department and Period.
- Use slicers for easy filtering by time or department.
-
Design Visual Elements:
- Insert bar charts comparing Budget vs. Actual.
- Use conditional formatting to highlight unfavorable variances in red.
- Add KPI indicators (e.g., green check for variances within ±5%, red cross otherwise).
-
Add Real-Time Data Refresh:
- Link Excel to external data sources (e.g., SQL database or cloud accounting software) for automatic updates.
-
Set Alerts:
- Use Excel formulas or VBA to trigger alerts when variances exceed predefined thresholds.
Mind Map: Excel Dashboard Workflow
Example Scenario:
A retail company wants to track monthly sales budget variances across three regions: North, South, and West.
- Data Table Sample:
| Region | Month | Budget Sales | Actual Sales | Variance | % Variance |
|---|---|---|---|---|---|
| North | January | 500,000 | 480,000 | -20,000 | -4% |
| South | January | 450,000 | 470,000 | 20,000 | 4.44% |
| West | January | 400,000 | 390,000 | -10,000 | -2.5% |
- Dashboard Features:
- Bar chart showing Budget vs. Actual sales by region.
- Heat map highlighting regions with unfavorable variances (red for >5% negative variance).
- KPI cards summarizing total variance and % variance.
- Slicer to select different months.
Tips for Effective Dashboard Design
- Keep it simple and focused on key metrics.
- Use color coding consistently to indicate performance status.
- Provide interactive filters to allow users to drill down into data.
- Regularly update data connections to maintain real-time accuracy.
By following this example, accountants and financial analysts can create a powerful tool that not only tracks budget variances in real time but also drives actionable insights and supports strategic financial management.
4. Calculating Budget Variances: Step-by-Step Methodology
4.1 Formulae for Calculating Variances in Revenue and Expenses
Budget variance analysis fundamentally revolves around understanding the differences between what was planned (budgeted) and what actually occurred (actual). This section covers the essential formulae used to calculate variances in both revenue and expenses, accompanied by mind maps and practical examples to clarify each concept.
Key Formulae for Variance Calculation
- Variance
\[ \text{Variance} = \text{Actual Amount} - \text{Budgeted Amount} \]
- A positive variance in revenue indicates actual revenue exceeded the budget (favorable).
- A negative variance in expenses indicates actual expenses were less than budgeted (favorable).
- Variance Percentage
\[ \text{Variance Percentage} = \left( \frac{\text{Actual Amount} - \text{Budgeted Amount}}{\text{Budgeted Amount}} \right) \times 100\% \]
- This shows the variance relative to the budget, useful for comparing variances across different accounts or departments.
Mind Map: Basic Variance Calculation
Revenue Variance Calculation
Formula:
\[ \text{Revenue Variance} = \text{Actual Revenue} - \text{Budgeted Revenue} \]
Example:
- Budgeted Revenue for Q1: $500,000
- Actual Revenue for Q1: $550,000
\[ \text{Revenue Variance} = 550,000 - 500,000 = +50,000 \]
- Interpretation: $50,000 favorable variance (actual revenue exceeded budget).
Variance Percentage:
\[ \frac{50,000}{500,000} \times 100\% = 10\%\text{ favorable} \]
Expense Variance Calculation
Formula:
\[ \text{Expense Variance} = \text{Budgeted Expense} - \text{Actual Expense} \]
Note: For expenses, a positive variance means spending less than budgeted (favorable), and negative means overspending (unfavorable).
Example:
- Budgeted Marketing Expense: $120,000
- Actual Marketing Expense: $130,000
\[ \text{Expense Variance} = 120,000 - 130,000 = -10,000 \]
- Interpretation: $10,000 unfavorable variance (overspent).
Variance Percentage:
\[ \frac{-10,000}{120,000} \times 100\% = -8.33\%\text{ unfavorable} \]
Mind Map: Revenue vs Expense Variance
Combined Example: Sales and Operating Expenses
| Category | Budgeted Amount | Actual Amount | Variance Formula | Variance Value | Interpretation |
|---|---|---|---|---|---|
| Sales Revenue | $1,000,000 | $1,100,000 | Actual - Budgeted | +$100,000 | Favorable (10% above) |
| Operating Expenses | $400,000 | $380,000 | Budgeted - Actual | +$20,000 | Favorable (5% below) |
Calculations:
-
Sales Variance = 1,100,000 - 1,000,000 = +100,000 (Favorable)
-
Sales Variance % = (100,000 / 1,000,000) * 100 = 10%
-
Expense Variance = 400,000 - 380,000 = +20,000 (Favorable)
-
Expense Variance % = (20,000 / 400,000) * 100 = 5%
Mind Map: Step-by-Step Variance Calculation Process
Best Practices Embedded in Formula Use:
- Always clearly define whether variance is favorable or unfavorable based on context (revenue vs expenses).
- Use variance percentages to prioritize investigation — larger percentages often indicate more critical issues.
- Maintain consistency in formula application across departments to ensure comparability.
This foundational understanding of variance formulae sets the stage for deeper analysis in subsequent sections, where root causes and corrective actions will be explored.
4.2 Practical Example: Calculating Variance for a Sales Department
Budget variance analysis is essential for understanding how well a sales department performs against its planned targets. In this section, we will walk through a detailed example of calculating budget variances for a sales department, including step-by-step calculations, explanations, and visual mind maps to clarify the process.
Step 1: Understand the Components
Before calculating variances, identify the key components:
- Budgeted Sales Revenue: The planned sales revenue for the period.
- Actual Sales Revenue: The real sales revenue achieved.
- Budgeted Sales Volume: The planned number of units to be sold.
- Actual Sales Volume: The actual number of units sold.
- Budgeted Sales Price per Unit: The planned price per unit.
- Actual Sales Price per Unit: The actual price per unit.
Step 2: Gather Data
| Metric | Budgeted Value | Actual Value |
|---|---|---|
| Sales Volume (units) | 10,000 | 9,500 |
| Sales Price per Unit | $50 | $52 |
| Total Sales Revenue | $500,000 | $494,000 |
Step 3: Calculate Variances
There are two main variances to calculate:
- Sales Volume Variance – Effect of selling more or fewer units than planned.
- Sales Price Variance – Effect of selling at a different price than planned.
Formulas:
- Sales Volume Variance = (Actual Volume - Budgeted Volume) × Budgeted Price
- Sales Price Variance = (Actual Price - Budgeted Price) × Actual Volume
Calculations:
- Sales Volume Variance = (9,500 - 10,000) × $50 = (-500) × $50 = - $25,000 (Unfavorable)
- Sales Price Variance = ($52 - $50) × 9,500 = $2 × 9,500 = + $19,000 (Favorable)
Total Sales Variance:
- Total Variance = Sales Volume Variance + Sales Price Variance = -$25,000 + $19,000 = - $6,000 (Unfavorable)
Step 4: Interpret the Results
- The sales department sold 500 fewer units than budgeted, leading to a $25,000 unfavorable variance.
- However, they sold the units at $2 more than planned, generating a $19,000 favorable variance.
- Overall, the department fell short by $6,000 compared to the budget.
Mind Map: Budget Variance Analysis for Sales Department
Additional Example: Monthly Sales Variance
Suppose the sales department had the following monthly budget and actuals:
| Month | Budgeted Volume | Actual Volume | Budgeted Price | Actual Price |
|---|---|---|---|---|
| Jan | 1,000 | 1,100 | $50 | $48 |
| Feb | 1,000 | 900 | $50 | $53 |
January Variances:
- Volume Variance = (1,100 - 1,000) × $50 = 100 × $50 = +$5,000 (Favorable)
- Price Variance = ($48 - $50) × 1,100 = (-$2) × 1,100 = -$2,200 (Unfavorable)
- Total Variance = $5,000 - $2,200 = +$2,800 (Favorable)
February Variances:
- Volume Variance = (900 - 1,000) × $50 = (-100) × $50 = -$5,000 (Unfavorable)
- Price Variance = ($53 - $50) × 900 = $3 × 900 = +$2,700 (Favorable)
- Total Variance = -$5,000 + $2,700 = -$2,300 (Unfavorable)
This monthly breakdown helps identify specific periods where sales volume or price impacted performance.
Mind Map: Monthly Sales Variance Breakdown
Best Practices Highlighted:
- Separate volume and price variances to pinpoint the exact cause of deviations.
- Use actual sales volume with budgeted price for volume variance to isolate quantity effects.
- Use actual sales volume with price difference for price variance to isolate pricing effects.
- Analyze variances monthly or by period to detect trends and take timely corrective actions.
- Visualize variances with mind maps or charts to communicate findings effectively.
By following this structured approach and using clear examples, accountants and financial analysts can confidently calculate and interpret sales department budget variances, enabling better financial control and decision-making.
4.3 Handling Complex Variances: Multi-Period and Multi-Department Scenarios
Budget variance analysis can become significantly more complex when dealing with multiple periods and multiple departments. This section explores best practices and examples to effectively manage and analyze these complex variances.
Understanding Multi-Period Variance Analysis
Multi-period variance analysis involves comparing budgeted and actual figures across several time periods (e.g., monthly, quarterly, annually) to identify trends and patterns.
Key Challenges:
- Variances may fluctuate over time, requiring trend analysis.
- Seasonal effects or cyclical business patterns can distort simple variance interpretations.
- Aggregating variances over multiple periods can mask underlying issues.
Best Practice: Use rolling variance analysis and cumulative variance tracking to get a clearer picture.
Example: A retail company budgets $100,000 for marketing expenses each quarter. Actual expenses were:
- Q1: $110,000 (unfavorable variance)
- Q2: $90,000 (favorable variance)
- Q3: $105,000 (unfavorable variance)
- Q4: $95,000 (favorable variance)
Individually, each quarter shows variances, but cumulatively, the total annual variance is zero, indicating balanced spending over the year.
Understanding Multi-Department Variance Analysis
Multi-department variance analysis involves examining variances across different departments or cost centers to pinpoint where deviations occur.
Key Challenges:
- Departments may have different budgeting methods or timelines.
- Interdepartmental dependencies can complicate variance attribution.
- Consolidating variances requires standardized reporting formats.
Best Practice: Implement a centralized variance reporting system with standardized templates.
Example: A manufacturing firm has three departments: Production, Sales, and R&D.
- Production budgeted $500,000, actual $520,000 (unfavorable $20,000)
- Sales budgeted $300,000, actual $280,000 (favorable $20,000)
- R&D budgeted $200,000, actual $210,000 (unfavorable $10,000)
The net variance is unfavorable $10,000, but analyzing department-level variances helps management focus on Production cost overruns.
Integrating Multi-Period and Multi-Department Analysis
When combining both dimensions, the complexity increases, but so does the insight.
Mind Map: Multi-Period & Multi-Department Variance Analysis
Step-by-Step Example: Multi-Period, Multi-Department Variance Analysis
Scenario: A corporation wants to analyze budget variances for Q1 and Q2 across three departments: Marketing, Operations, and IT.
| Department | Budget Q1 | Actual Q1 | Variance Q1 | Budget Q2 | Actual Q2 | Variance Q2 |
|---|---|---|---|---|---|---|
| Marketing | $150,000 | $160,000 | $10,000 U | $140,000 | $135,000 | $5,000 F |
| Operations | $300,000 | $290,000 | $10,000 F | $310,000 | $320,000 | $10,000 U |
| IT | $100,000 | $105,000 | $5,000 U | $110,000 | $100,000 | $10,000 F |
Analysis:
- Marketing shows an unfavorable variance in Q1 but favorable in Q2.
- Operations reversed the trend with favorable variance in Q1 and unfavorable in Q2.
- IT’s variances are smaller but fluctuate.
Cumulative Variance per Department:
- Marketing: $5,000 Unfavorable
- Operations: $0 (net zero)
- IT: $5,000 Favorable
Insights:
- Marketing overspent overall, mainly in Q1.
- Operations managed to balance out over two quarters.
- IT controlled costs well in Q2.
Mind Map: Example Workflow for Complex Variance Analysis
Tips for Managing Complex Variances
- Use software tools: Leverage ERP and budgeting software that support multi-dimensional variance analysis.
- Maintain data integrity: Ensure consistent data definitions and timely updates.
- Collaborate cross-functionally: Engage department heads to understand context behind variances.
- Visualize data: Use dashboards and heat maps to quickly identify problem areas.
By mastering multi-period and multi-department variance analysis, accountants and financial analysts can provide deeper insights, enabling more informed decision-making and strategic financial management.
4.4 Common Calculation Errors and How to Prevent Them
Budget variance analysis is a powerful tool, but its effectiveness depends heavily on the accuracy of calculations. Even small errors can lead to misleading conclusions and poor decision-making. This section highlights the most common calculation errors encountered during budget variance analysis and provides practical strategies to prevent them.
Common Calculation Errors
-
Incorrect Formula Application
- Using wrong formulas for variance (e.g., mixing absolute variance with percentage variance).
- Confusing favorable and unfavorable variances.
-
Data Entry Mistakes
- Typographical errors when inputting budgeted or actual figures.
- Copy-paste errors leading to misaligned data.
-
Ignoring Units or Time Periods
- Comparing figures from different time periods without adjustments.
- Mixing units (e.g., thousands vs. actual numbers).
-
Rounding Errors
- Rounding too early in calculations causing cumulative inaccuracies.
-
Omitting Relevant Costs or Revenues
- Forgetting to include indirect costs or supplementary revenues in calculations.
-
Misclassifying Variances
- Labeling controllable variances as uncontrollable or vice versa, affecting interpretation.
-
Overlooking Multi-Department or Multi-Period Aggregations
- Failing to aggregate variances correctly across departments or time frames.
Mind Map: Common Calculation Errors
Examples of Calculation Errors and Prevention Techniques
Example 1: Incorrect Formula Application
Scenario: An analyst calculates variance as “Actual - Budget” but interprets all positive variances as favorable.
Error: Positive variance in expense accounts is actually unfavorable (higher expense than budget).
Prevention: Always define variance direction based on account type.
- For revenues: Variance = Actual - Budget (positive = favorable)
- For expenses: Variance = Budget - Actual (positive = favorable)
Example Calculation:
| Account | Budget | Actual | Variance (Actual - Budget) | Interpretation (Incorrect) | Correct Variance (Budget - Actual) | Correct Interpretation |
|---|---|---|---|---|---|---|
| Expense | 10000 | 12000 | 2000 (positive) | Favorable | -2000 (negative) | Unfavorable |
Example 2: Data Entry Mistake
Scenario: Actual sales for Q2 entered as 50000 instead of 55000.
Error: Variance understated by 5000, leading to incorrect conclusions.
Prevention:
- Double-check data entries.
- Use data validation tools in spreadsheets.
- Cross-verify with source documents.
Example 3: Ignoring Units
Scenario: Budget is prepared in thousands, actuals recorded in units.
| Item | Budget (in 000s) | Actual (units) |
|---|---|---|
| Sales | 120 | 120000 |
Error: Direct subtraction leads to huge variance (120 - 120000 = -119880).
Prevention: Standardize units before calculation.
Example 4: Rounding Errors
Scenario: Rounding each line item to nearest hundred before summing.
| Item | Budget | Actual | Variance |
|---|---|---|---|
| A | 1234 | 1250 | 16 |
| B | 987 | 1000 | 13 |
| Total | 2221 | 2250 | 29 |
If rounded first:
| Item | Budget (rounded) | Actual (rounded) | Variance (rounded) |
|---|---|---|---|
| A | 1200 | 1300 | 100 |
| B | 1000 | 1000 | 0 |
| Total | 2200 | 2300 | 100 |
Error: Variance inflated due to premature rounding.
Prevention: Perform calculations using full precision, round final results only.
Example 5: Omitting Relevant Costs
Scenario: Overhead costs excluded from expense variance analysis.
Error: Variance appears favorable, but actual total costs are higher.
Prevention: Ensure comprehensive inclusion of all relevant cost elements.
Best Practices to Prevent Calculation Errors
- Standardize Formulas: Develop and document standard variance formulas for different account types.
- Use Automated Tools: Leverage spreadsheet functions, templates, and budgeting software to minimize manual errors.
- Implement Data Validation: Use dropdowns, input masks, and error alerts to reduce data entry mistakes.
- Cross-Check Data: Regularly reconcile budget and actual figures with source documents.
- Train Teams: Educate accountants and analysts on common pitfalls and correct variance interpretation.
- Review and Audit: Conduct periodic reviews and audits of variance calculations.
- Maintain Consistent Units and Periods: Always verify that data compared are in the same units and time frames.
Mind Map: Prevention Strategies
By understanding these common errors and implementing the prevention strategies, accountants and financial analysts can ensure their budget variance analysis is accurate, reliable, and actionable.
5. Analyzing Causes of Budget Variances
5.1 Techniques for Root Cause Analysis
Root Cause Analysis (RCA) is a critical step in budget variance analysis that helps accountants and financial analysts identify the underlying reasons behind variances. Understanding these causes enables organizations to take corrective actions, improve budgeting accuracy, and enhance financial performance.
Key Techniques for Root Cause Analysis
-
The 5 Whys Technique
- This technique involves asking “Why?” repeatedly (typically five times) until the fundamental cause of a variance is discovered.
- It encourages digging deeper beyond surface-level symptoms.
Example:
- Variance: Marketing expenses exceeded budget by $10,000.
- Why? Because more digital ads were purchased.
- Why? Because a new campaign was launched.
- Why? Because sales targets were increased.
- Why? Because the company wanted to enter a new market.
- Why? Because the previous market showed saturation.
- Root Cause: Strategic decision to enter a new market led to increased marketing spend.
Mind Map:
- 5 Whys Technique - Variance: Marketing expenses +$10,000 - Why 1: More digital ads purchased - Why 2: New campaign launched - Why 3: Increased sales targets - Why 4: Enter new market - Why 5: Previous market saturation -
Fishbone Diagram (Ishikawa Diagram)
- A visual tool that categorizes potential causes of a problem into major categories such as People, Processes, Equipment, Materials, Environment, and Management.
- Helps organize thoughts and identify multiple contributing factors.
Example:
- Variance: Manufacturing overhead costs higher than budgeted.
- Possible causes categorized:
- People: Overtime due to staff shortage
- Processes: Inefficient workflow
- Equipment: Frequent machine breakdowns
- Materials: Price increase in raw materials
- Environment: Power outages
- Management: Poor scheduling
Mind Map:
- Fishbone Diagram: Manufacturing Overhead Variance - People - Overtime due to staff shortage - Processes - Inefficient workflow - Equipment - Machine breakdowns - Materials - Raw material price increase - Environment - Power outages - Management - Poor scheduling -
Pareto Analysis
- Based on the Pareto Principle (80/20 rule), this technique helps identify the few causes that contribute to the majority of the variance.
- Prioritizes issues to focus on the most impactful root causes.
Example:
- Total unfavorable variance of $50,000 in operating expenses.
- Breakdown:
- Vendor price increases: $30,000
- Excessive overtime: $10,000
- Utility costs: $5,000
- Miscellaneous: $5,000
- Focus should be on vendor price increases as it accounts for 60% of the variance.
Mind Map:
- Pareto Analysis: Operating Expense Variance - Vendor price increases: $30,000 (60%) - Excessive overtime: $10,000 (20%) - Utility costs: $5,000 (10%) - Miscellaneous: $5,000 (10%) -
Process Mapping
- Visualizing the workflow or process related to the budget item to identify inefficiencies or deviations causing variances.
- Helps pinpoint where in the process the variance originates.
Example:
- Variance: Delay in project completion leading to higher labor costs.
- Process map reveals bottlenecks in approval stages causing delays.
Mind Map:
- Process Mapping: Project Completion Delay - Task initiation - Approval stage (bottleneck) - Execution - Review - Completion -
Brainstorming Sessions
- Collaborative approach involving cross-functional teams to generate possible causes.
- Encourages diverse perspectives and uncovers hidden factors.
Example:
- Variance: Unexpected increase in travel expenses.
- Brainstorming reveals causes such as last-minute bookings, policy non-compliance, and increased client meetings.
Mind Map:
- Brainstorming: Travel Expense Variance - Last-minute bookings - Policy non-compliance - Increased client meetings - Currency fluctuations
Integrating Techniques for Robust Analysis
Often, combining these techniques yields the best results. For example, start with the 5 Whys to get to a preliminary root cause, then use a Fishbone Diagram to explore other contributing factors, and apply Pareto Analysis to prioritize them.
Summary Table of Techniques and Examples
| Technique | Description | Example Use Case |
|---|---|---|
| 5 Whys | Repeatedly ask “Why?” to find root cause | Marketing overspend due to new market entry |
| Fishbone Diagram | Categorize causes visually | Manufacturing overhead variance causes |
| Pareto Analysis | Identify major contributors to variance | Operating expense variance prioritization |
| Process Mapping | Visualize workflow to find inefficiencies | Project delay causing labor cost increase |
| Brainstorming | Collaborative cause identification | Travel expense increase causes |
By mastering these root cause analysis techniques, accountants and financial analysts can transform budget variance analysis from a reactive exercise into a proactive tool for continuous financial improvement.
5.2 Differentiating Between Controllable and Uncontrollable Variances
Budget variance analysis is a critical tool for accountants and financial analysts to understand why actual financial results differ from budgeted figures. One of the key aspects of this analysis is distinguishing between controllable and uncontrollable variances. This differentiation helps organizations focus their efforts on areas where they can take corrective actions and better manage resources.
What are Controllable Variances?
Controllable variances are those variances that can be influenced or managed by the decisions and actions of a specific manager or department within a given period. These variances typically arise from operational decisions, efficiency, or resource management.
Example:
- A production manager can control labor hours and material usage, so variances in labor cost or material cost due to inefficiency are controllable.
What are Uncontrollable Variances?
Uncontrollable variances are variances that arise from factors beyond the control of the manager or department responsible for the budget. These may include external economic conditions, regulatory changes, or unexpected events.
Example:
- A sudden increase in raw material prices due to global supply chain disruptions is an uncontrollable variance for the purchasing department.
Mind Map: Differentiating Controllable vs. Uncontrollable Variances
Practical Examples
Example 1: Controllable Variance in Labor Cost
Scenario: The budgeted labor cost for manufacturing 1,000 units was $20,000, assuming 2 hours per unit at $10/hour. Actual labor cost was $22,000.
Analysis:
- Actual labor hours: 2,200 hours
- Actual labor rate: $10/hour
Variance: $2,000 unfavorable
Cause: More labor hours used than budgeted (inefficiency).
Classification: Controllable variance because the production manager can influence labor efficiency through better scheduling or training.
Example 2: Uncontrollable Variance in Material Cost
Scenario: The budgeted cost for raw materials was $15,000 based on $5 per unit. Actual cost was $18,000.
Analysis:
- Units produced: 3,000
- Actual price per unit: $6
Variance: $3,000 unfavorable
Cause: Increase in raw material price due to supplier price hike.
Classification: Uncontrollable variance because the purchasing manager cannot control market prices.
Mind Map: Example Breakdown for Labor and Material Variances
Why is Differentiation Important?
- Focus on Improvement: Managers can focus on controlling factors within their influence.
- Accurate Performance Evaluation: Avoid penalizing managers for factors outside their control.
- Better Decision Making: Helps in revising budgets and strategies realistically.
Best Practices for Differentiating Variances
- Clearly define responsibility centers and their scope.
- Regularly update budgets to reflect changing external conditions.
- Use variance analysis as a communication tool to explain deviations.
- Combine quantitative data with qualitative insights from managers.
Summary
| Aspect | Controllable Variances | Uncontrollable Variances |
|---|---|---|
| Definition | Influenced by internal management decisions | Caused by external factors beyond control |
| Examples | Labor efficiency, material usage, overhead | Market price changes, regulations, disasters |
| Managerial Action | Process improvements, cost control | Risk mitigation, strategic planning |
| Impact on Performance | Directly reflects management effectiveness | Requires understanding external environment |
By mastering the differentiation between controllable and uncontrollable variances, accountants and financial analysts can provide more actionable insights and drive better financial performance within their organizations.
5.3 Case Study: Investigating Variances in Manufacturing Costs
In this section, we explore a detailed case study on investigating variances in manufacturing costs, illustrating best practices and practical examples to help accountants and financial analysts understand how to identify, analyze, and address cost variances effectively.
Background
ABC Manufacturing produces electronic components. The company has a monthly budget for direct materials, direct labor, and manufacturing overhead. In the latest month, the finance team noticed a significant unfavorable variance in manufacturing costs compared to the budget.
The goal is to investigate the root causes of these variances and recommend corrective actions.
Step 1: Identify the Variances
The first step is to break down the total manufacturing cost variance into its components:
- Direct Materials Variance
- Direct Labor Variance
- Manufacturing Overhead Variance
Example:
| Cost Element | Budgeted Cost | Actual Cost | Variance | Variance Type |
|---|---|---|---|---|
| Direct Materials | $150,000 | $165,000 | $15,000 | Unfavorable |
| Direct Labor | $100,000 | $90,000 | -$10,000 | Favorable |
| Manufacturing Overhead | $80,000 | $95,000 | $15,000 | Unfavorable |
| Total | $330,000 | $350,000 | $20,000 | Unfavorable |
Step 2: Drill Down into Each Variance
Direct Materials Variance Breakdown
Direct materials variance can be further divided into:
- Material Price Variance (MPV)
- Material Usage Variance (MUV)
Example Calculation:
-
Budgeted price per unit: $5
-
Actual price per unit: $5.50
-
Budgeted quantity: 30,000 units
-
Actual quantity used: 30,000 units
-
MPV = (Actual Price - Budgeted Price) x Actual Quantity = ($5.50 - $5) x 30,000 = $15,000 Unfavorable
-
MUV = (Actual Quantity - Budgeted Quantity) x Budgeted Price = (30,000 - 30,000) x $5 = $0
Mind Map: Direct Materials Variance
Direct Labor Variance Breakdown
Direct labor variance splits into:
- Labor Rate Variance (LRV)
- Labor Efficiency Variance (LEV)
Example Calculation:
-
Budgeted labor rate: $20/hour
-
Actual labor rate: $18/hour
-
Budgeted hours: 5,000
-
Actual hours: 5,000
-
LRV = (Actual Rate - Budgeted Rate) x Actual Hours = ($18 - $20) x 5,000 = -$10,000 Favorable
-
LEV = (Actual Hours - Budgeted Hours) x Budgeted Rate = (5,000 - 5,000) x $20 = $0
Mind Map: Direct Labor Variance
Manufacturing Overhead Variance Breakdown
Manufacturing overhead variance can be split into:
- Variable Overhead Spending Variance
- Variable Overhead Efficiency Variance
- Fixed Overhead Spending Variance
- Fixed Overhead Volume Variance
Example:
- Variable overhead budgeted: $50,000
- Actual variable overhead: $60,000
- Fixed overhead budgeted: $30,000
- Actual fixed overhead: $35,000
Step 3: Root Cause Analysis
Using the mind maps, the team investigates the causes:
- Material Price Variance: Supplier increased prices due to raw material shortages.
- Labor Rate Variance: Favorable due to hiring less expensive temporary workers.
- Overhead Variance: Increased utility costs and unexpected maintenance.
Mind Map: Root Cause Analysis for Manufacturing Cost Variances
Step 4: Recommendations and Corrective Actions
- Negotiate long-term contracts with suppliers to stabilize material prices.
- Evaluate the impact of temporary labor on product quality and consider training programs.
- Implement energy-saving initiatives and preventive maintenance schedules to control overhead costs.
Summary
This case study illustrates how breaking down variances into detailed components, using mind maps to organize potential causes, and applying practical examples can help financial analysts and accountants effectively investigate and manage manufacturing cost variances.
Additional Example: Visual Mind Map Summary
This structured approach ensures clarity and actionable insights for managing budget variances in manufacturing costs.
5.4 Using Variance Analysis to Identify Operational Inefficiencies
Budget variance analysis is a powerful tool not only for tracking financial performance but also for uncovering operational inefficiencies within an organization. By systematically analyzing variances between budgeted and actual figures, accountants and financial analysts can pinpoint areas where resources are not being used optimally, processes are underperforming, or unexpected costs are creeping in.
Understanding Operational Inefficiencies Through Variance Analysis
Operational inefficiencies refer to situations where the actual use of resources, time, or processes is less effective or more costly than planned. Variance analysis helps identify these inefficiencies by highlighting deviations that warrant further investigation.
Key areas where variance analysis can reveal operational inefficiencies:
- Labor costs exceeding budget due to overtime or low productivity
- Material wastage or higher-than-expected consumption
- Equipment downtime leading to lower output
- Inefficient procurement resulting in higher prices
- Process bottlenecks causing delays and cost overruns
Mind Map: Using Variance Analysis to Identify Operational Inefficiencies
Example 1: Identifying Labor Inefficiency in a Manufacturing Plant
Scenario: A manufacturing company budgeted $50,000 for labor costs in a month but incurred $65,000, resulting in a $15,000 unfavorable variance.
Variance Analysis:
- Investigate labor hours: Actual hours were 1,200 vs. budgeted 1,000.
- Overtime hours accounted for 300 hours.
- Productivity was lower due to machine breakdowns causing idle time.
Operational Inefficiency Identified:
- Excessive overtime due to unplanned machine downtime.
- Idle time reducing overall labor productivity.
Action Plan:
- Schedule preventive maintenance to reduce machine breakdowns.
- Optimize shift scheduling to minimize overtime.
- Train operators to handle minor repairs quickly.
Mind Map: Labor Inefficiency Analysis
Example 2: Material Wastage in a Retail Supply Chain
Scenario: A retail company budgeted $30,000 for packaging materials but spent $40,000.
Variance Analysis:
- Actual usage was 20% higher than budgeted.
- Investigation revealed frequent damage to packaging materials during handling.
Operational Inefficiency Identified:
- Inefficient handling processes leading to material wastage.
Action Plan:
- Implement better training for warehouse staff.
- Introduce improved packaging techniques.
- Use quality control checkpoints to reduce damage.
Mind Map: Material Wastage Analysis
Steps to Use Variance Analysis for Identifying Operational Inefficiencies
- Collect and Compare Data: Gather actual vs. budgeted figures for key expense categories.
- Calculate Variances: Determine favorable or unfavorable variances.
- Drill Down: Break down variances by departments, processes, or cost centers.
- Investigate Root Causes: Use interviews, process reviews, and data analytics.
- Identify Patterns: Look for recurring variances indicating systemic inefficiencies.
- Develop Action Plans: Target process improvements, cost controls, or training.
- Monitor Improvements: Track variance changes over subsequent periods.
Final Example: Using Variance Analysis Dashboard to Spot Inefficiencies
A financial analyst creates a dashboard that tracks monthly variances across labor, materials, and overhead. The dashboard highlights a consistent unfavorable variance in utility costs in one plant. Further investigation reveals outdated equipment consuming excessive energy.
Outcome:
- Investment in energy-efficient machinery.
- Reduced utility costs by 15% in the next quarter.
Summary
Using budget variance analysis to identify operational inefficiencies enables finance professionals to move beyond numbers and uncover actionable insights that improve overall business performance. By combining detailed variance calculations with root cause analysis and practical examples, accountants and financial analysts can help their organizations optimize resource use, reduce waste, and enhance profitability.
6. Reporting and Communicating Budget Variance Findings
6.1 Best Practices for Clear and Concise Variance Reporting
Effective variance reporting is critical for accountants and financial analysts to communicate financial performance clearly and enable informed decision-making. Here are best practices to ensure your variance reports are both clear and concise.
Focus on Key Variances
- Highlight only the most significant variances that impact business objectives.
- Avoid overwhelming stakeholders with minor details.
Example: Instead of listing every small expense variance, focus on a 15% unfavorable variance in raw materials cost that affects gross margin.
Use Simple and Consistent Language
- Avoid jargon and complex financial terms unless the audience is familiar.
- Maintain consistent terminology throughout the report.
Example: Use “Favorable variance” and “Unfavorable variance” consistently rather than switching between synonyms.
Structure the Report Logically
- Start with an executive summary.
- Follow with detailed variance analysis grouped by categories (e.g., revenue, cost of goods sold, operating expenses).
- End with actionable recommendations.
Visualize Data Effectively
- Use charts, graphs, and tables to present variances visually.
- Highlight trends and patterns rather than raw numbers alone.
Example: A bar chart comparing budgeted vs. actual sales by region can quickly show where variances occurred.
Provide Context and Root Cause Analysis
- Explain why variances occurred, not just what the variances are.
- Link variances to business activities or external factors.
Example: “The unfavorable variance in marketing expenses is due to an unplanned promotional campaign launched in Q2.”
Keep It Concise and Focused
- Use bullet points and short paragraphs.
- Avoid unnecessary repetition.
Tailor the Report to the Audience
- For executives, focus on high-level insights and strategic implications.
- For operational teams, include detailed breakdowns and actionable items.
Mind Map: Best Practices for Clear and Concise Variance Reporting
Example: Clear and Concise Variance Report Snippet
Executive Summary:
- Total revenue was $1.2M, 8% below budget due to lower sales in the Northeast region.
- Cost of goods sold was 5% favorable, driven by lower raw material prices.
- Operating expenses exceeded budget by 10%, primarily due to increased marketing spend.
Detailed Analysis:
- Revenue Variance:
- Northeast sales were $150K below budget due to delayed product launches.
- Other regions met or exceeded targets.
- COGS Variance:
- Raw material costs decreased by 7%, saving $40K.
- Operating Expenses:
- Marketing expenses increased by $30K due to an unplanned digital campaign.
Recommendations:
- Investigate Northeast product launch delays and implement corrective actions.
- Monitor marketing spend closely to align with budget.
By following these best practices, accountants and financial analysts can create variance reports that are not only informative but also actionable, driving better financial management and strategic decision-making.
6.2 Visualizing Variance Data: Charts, Graphs, and Dashboards
Effective visualization of budget variance data is essential for accountants and financial analysts to communicate insights clearly and drive informed decision-making. Visual tools help transform raw numbers into intuitive, actionable information that stakeholders at all levels can understand quickly.
Why Visualize Variance Data?
- Simplifies complex data sets
- Highlights trends and outliers
- Facilitates quicker decision-making
- Enhances stakeholder engagement
Common Visualization Types for Variance Analysis
| Visualization Type | Purpose | Example Use Case |
|---|---|---|
| Bar Charts | Compare actual vs. budget amounts across categories or time periods | Monthly expense variance by department |
| Line Graphs | Show trends in variances over time | Quarterly revenue variance trend |
| Waterfall Charts | Illustrate how individual variances contribute to total variance | Breakdown of cost overruns |
| Pie Charts | Show proportion of variances by category | Expense variance distribution |
| Heat Maps | Highlight areas with significant variances using color intensity | Department-wise variance heat map |
| Dashboards | Combine multiple visualizations for a comprehensive view | Executive variance dashboard |
Mind Map: Visualization Techniques for Budget Variance Analysis
Best Practices for Creating Effective Visualizations
- Choose the Right Chart Type: Match the visualization to the data story you want to tell.
- Keep It Simple: Avoid clutter; focus on key variances.
- Use Color Wisely: Use colors to differentiate favorable (e.g., green) vs. unfavorable (e.g., red) variances.
- Label Clearly: Include titles, axis labels, and data values for clarity.
- Interactive Elements: When possible, use interactive dashboards to allow users to drill down into details.
Example 1: Bar Chart Showing Departmental Expense Variances
| Department | Budgeted Expense | Actual Expense | Variance | Variance Type |
|---|---|---|---|---|
| Marketing | $50,000 | $55,000 | $5,000 | Unfavorable |
| Sales | $70,000 | $65,000 | -$5,000 | Favorable |
| IT | $40,000 | $42,000 | $2,000 | Unfavorable |
Visualization: A clustered bar chart with departments on the x-axis and amounts on the y-axis, displaying budgeted and actual expenses side-by-side. Variance values annotated above bars with color coding.
Example 2: Line Graph Depicting Revenue Variance Over 12 Months
- X-axis: Months (Jan to Dec)
- Y-axis: Variance Amount ($)
- Two lines: Favorable Variance (positive values), Unfavorable Variance (negative values)
Insight: This graph quickly shows seasonal trends and highlights months with significant deviations.
Mind Map: Components of an Effective Variance Dashboard
Example 3: Waterfall Chart for Cost Variance Breakdown
Imagine a manufacturing firm with a $100,000 unfavorable total cost variance. The waterfall chart breaks down the variance into:
- Raw Materials: +$40,000 (Unfavorable)
- Labor: +$30,000 (Unfavorable)
- Overhead: +$20,000 (Unfavorable)
- Efficiency Savings: -$10,000 (Favorable)
This visualization helps pinpoint which cost components are driving the variance.
Tools to Create Visualizations
- Microsoft Excel (PivotCharts, Waterfall Charts)
- Power BI (Interactive Dashboards)
- Tableau (Advanced Visual Analytics)
- Google Data Studio (Cloud-based Dashboards)
Summary
Visualizing budget variance data through charts, graphs, and dashboards is a critical skill for accountants and financial analysts. By applying best practices and leveraging appropriate visualization tools, professionals can enhance clarity, facilitate faster insights, and support strategic financial decisions.
6.3 Tailoring Reports for Different Stakeholders: Executives vs. Operational Teams
Effective budget variance analysis reporting requires customization to meet the unique needs of different stakeholders. Executives and operational teams have distinct priorities, levels of detail, and decision-making contexts. Tailoring reports accordingly ensures clarity, relevance, and actionable insights.
Understanding Stakeholder Needs
| Stakeholder | Focus Areas | Reporting Style | Key Metrics |
|---|---|---|---|
| Executives | Strategic overview, financial impact, high-level trends | Summary, visual dashboards | Total variance, % variance, ROI, forecast adjustments |
| Operational Teams | Day-to-day operations, process efficiency, root causes | Detailed, granular data | Departmental variances, cost drivers, process metrics |
Mind Map: Tailoring Reports by Stakeholder
Reporting to Executives
Best Practices:
- Use concise executive summaries highlighting key variances.
- Incorporate visual elements like bar charts, pie charts, and heat maps.
- Focus on the financial impact and strategic implications.
- Provide trend analysis and forecast revisions.
Example:
Executive Summary Report for Q1
| Metric | Budgeted | Actual | Variance | Variance % | Comment |
|---|---|---|---|---|---|
| Total Revenue | $5,000K | $4,750K | -$250K | -5% | Lower sales in Region A |
| Operating Expenses | $3,000K | $2,850K | +$150K | +5% | Cost savings in logistics |
| Net Profit | $2,000K | $1,900K | -$100K | -5% | Impacted by revenue shortfall |
Visual Dashboard:
- Revenue variance bar chart by region
- Expense heat map by department
- Profit trend line over quarters
Reporting to Operational Teams
Best Practices:
- Provide detailed variance data at the departmental or process level.
- Include root cause analysis and explanatory notes.
- Suggest actionable steps to address variances.
- Use tables and detailed charts to support analysis.
Example:
Operations Variance Report for Logistics Department
| Cost Item | Budgeted | Actual | Variance | Variance % | Root Cause | Recommended Action |
|---|---|---|---|---|---|---|
| Fuel Expenses | $200K | $230K | -$30K | -15% | Increased fuel prices | Negotiate fuel contracts |
| Maintenance Costs | $100K | $90K | +$10K | +10% | Preventive maintenance savings | Continue preventive programs |
| Overtime Labor | $50K | $70K | -$20K | -40% | Staff shortages | Hire temporary workers |
Detailed Charts:
- Monthly fuel cost trend
- Overtime hours vs. budget
- Maintenance schedule adherence
Mind Map: Key Differences in Reporting
Integrated Example: From Operational Detail to Executive Summary
- Operational Team Report: Logistics department identifies a $30K unfavorable variance in fuel costs due to rising prices.
- Root Cause Analysis: Fuel price increases linked to market fluctuations; overtime labor increased due to staff shortages.
- Action Plan: Negotiate fuel contracts and hire temporary workers.
- Executive Summary: Highlights overall $250K revenue shortfall and $150K expense savings, noting logistics fuel cost increase as a factor.
This flow ensures operational insights feed into strategic decision-making.
Summary
Tailoring budget variance reports for executives and operational teams enhances communication effectiveness. Executives require concise, high-level insights with visual summaries focusing on financial impact and strategy. Operational teams need detailed, data-rich reports emphasizing root causes and actionable recommendations. Using mind maps and examples helps structure reports that resonate with each audience, driving better financial management and organizational performance.
6.4 Example: Creating a Monthly Variance Analysis Report
Creating a monthly variance analysis report is a critical task for accountants and financial analysts to communicate financial performance effectively. This section will walk you through a detailed example, integrating best practices, visual aids, and clear explanations.
Step 1: Define the Report Objectives
The primary objective of a monthly variance analysis report is to compare actual financial results against the budgeted figures, identify variances, analyze their causes, and provide actionable insights.
Mind Map: Report Objectives
Step 2: Gather and Organize Data
Collect the following data for the reporting period:
- Budgeted Revenue and Expenses
- Actual Revenue and Expenses
- Prior Month and Year Comparisons (optional for trend analysis)
Example Data Table:
| Category | Budgeted Amount | Actual Amount | Variance Amount | Variance % |
|---|---|---|---|---|
| Sales Revenue | $500,000 | $480,000 | -$20,000 | -4.0% |
| Cost of Goods Sold | $300,000 | $320,000 | +$20,000 | +6.7% |
| Operating Expenses | $100,000 | $90,000 | -$10,000 | -10.0% |
| Net Profit | $100,000 | $70,000 | -$30,000 | -30.0% |
Step 3: Calculate Variances
Use the formula:
Variance Amount = Actual Amount - Budgeted Amount
Variance % = (Variance Amount / Budgeted Amount) * 100
Example Calculation:
- Sales Revenue Variance = $480,000 - $500,000 = -$20,000
- Sales Revenue Variance % = (-$20,000 / $500,000) * 100 = -4.0%
Step 4: Analyze Variances
Interpret whether variances are favorable or unfavorable and investigate causes.
Mind Map: Variance Analysis Approach
Example Insight:
- Sales Revenue is 4% below budget due to delayed product launches.
- Cost of Goods Sold is 6.7% higher due to increased raw material prices.
- Operating Expenses are 10% under budget due to cost-saving initiatives.
Step 5: Visualize the Data
Use charts and graphs to make the report more digestible.
Example Visualizations:
- Bar Chart comparing Budget vs Actual for each category.
- Pie Chart showing expense distribution.
- Trend Line for Net Profit over the last 6 months.
Mind Map: Visualization Tools
Step 6: Prepare the Report Narrative
Write a concise summary highlighting key points, causes, and recommendations.
Example Narrative:
“In the month of April, total sales revenue fell short of budget by 4%, primarily due to delayed product launches impacting customer orders. Meanwhile, the cost of goods sold exceeded budget by 6.7%, driven by rising raw material costs. However, operating expenses were managed effectively, coming in 10% under budget, reflecting successful cost control measures. We recommend accelerating product launch timelines and negotiating better supplier contracts to mitigate these variances going forward.”
Step 7: Distribute and Present the Report
Tailor the report format depending on the audience:
- Executives: High-level summary with key visuals and strategic recommendations.
- Department Managers: Detailed breakdowns with actionable insights.
Mind Map: Report Distribution
Summary Table: Monthly Variance Analysis Report Components
| Component | Description | Example/Tool |
|---|---|---|
| Objectives | Define purpose and scope | Mind map of objectives |
| Data Collection | Budgeted vs Actual figures | Data tables |
| Variance Calculation | Compute variance amounts and percentages | Excel formulas |
| Analysis | Interpret variances and causes | Root cause mind map |
| Visualization | Graphical representation of data | Bar charts, pie charts |
| Narrative | Written summary and recommendations | Executive summary |
| Distribution | Tailor report for stakeholders | Audience-specific formats |
By following this structured approach, accountants and financial analysts can create clear, insightful, and actionable monthly variance analysis reports that drive better financial decision-making across the organization.
7. Integrating Variance Analysis into Financial Decision-Making
7.1 Using Variance Insights to Adjust Forecasts and Budgets
Budget variance analysis is not just about identifying differences between planned and actual figures; it is a powerful tool that provides actionable insights to refine and improve future financial planning. By leveraging variance insights, accountants and financial analysts can make informed adjustments to forecasts and budgets, ensuring greater accuracy and alignment with business realities.
Why Adjust Forecasts and Budgets?
- Reflect Real-World Changes: Market conditions, operational efficiencies, and external factors often change after budgets are set.
- Improve Accuracy: Incorporating variance data helps reduce forecasting errors.
- Optimize Resource Allocation: Adjustments ensure resources are allocated where they are most needed.
- Enhance Strategic Decision-Making: Timely adjustments support proactive rather than reactive management.
Mind Map: Using Variance Insights to Adjust Forecasts and Budgets
Step-by-Step Process to Use Variance Insights for Adjustments
-
Collect and Review Variance Data:
- Gather variance reports comparing actuals to budgets.
- Identify which variances are significant and recurring.
-
Analyze Causes:
- Use root cause analysis techniques to understand why variances occurred.
- Example: A consistent unfavorable variance in raw material costs may be due to supplier price increases.
-
Evaluate Impact on Forecasts:
- Determine how these causes affect future periods.
- Example: If supplier prices are rising, future cost forecasts should be adjusted upward.
-
Adjust Forecasts:
- Update revenue and expense projections based on variance insights.
- Example: If sales are consistently 5% below forecast, revise sales forecasts accordingly.
-
Revise Budgets:
- Modify budget allocations to reflect updated forecasts.
- Example: Increase budget for marketing if it is driving higher sales than expected.
-
Communicate Changes:
- Share revised forecasts and budgets with relevant stakeholders.
-
Implement and Monitor:
- Track performance against updated budgets to validate adjustments.
Example 1: Adjusting Sales Forecast Based on Variance Analysis
Scenario: A retail company budgeted $1,000,000 in sales for Q1 but actual sales were $900,000, showing an unfavorable variance of $100,000 (-10%).
Analysis:
- Root cause identified: Lower foot traffic due to unexpected local events.
- Market trend analysis shows this is likely to continue for Q2.
Action:
- Adjust Q2 sales forecast down by 8% to reflect ongoing market conditions.
- Revise marketing budget to increase promotions aimed at driving foot traffic.
Mind Map:
Example 2: Revising Expense Budget After Variance Analysis
Scenario: A manufacturing firm budgeted $200,000 for raw materials in a quarter but actual costs were $230,000, an unfavorable variance of $30,000 (+15%).
Analysis:
- Root cause: Supplier price increases and higher-than-expected wastage.
Action:
- Adjust raw material cost forecasts upward by 12% for the next quarter.
- Implement process improvements to reduce wastage.
- Allocate additional contingency funds in the budget.
Mind Map:
Tips for Effective Use of Variance Insights
- Be Timely: Regularly update forecasts and budgets as new variance data becomes available.
- Be Collaborative: Engage cross-functional teams to understand causes and implications.
- Document Assumptions: Clearly record reasons for adjustments to maintain transparency.
- Use Technology: Leverage budgeting and forecasting software that integrates variance analysis.
By systematically using variance insights to adjust forecasts and budgets, finance professionals can enhance the agility and accuracy of financial planning, ultimately driving better business outcomes.
7.2 Examples of Strategic Decisions Driven by Variance Analysis
Budget variance analysis is a powerful tool that enables accountants and financial analysts to uncover insights that drive strategic decision-making within an organization. By identifying where actual performance deviates from planned budgets, companies can make informed choices to optimize resources, improve profitability, and align operations with corporate goals. Below are detailed examples illustrating how variance analysis informs strategic decisions, accompanied by mind maps to visualize the decision pathways.
Example 1: Adjusting Marketing Spend Based on Sales Variance
Scenario: A retail company notices a significant unfavorable variance in sales revenue compared to the budget. The variance analysis reveals that a particular product line underperformed due to lower customer engagement.
Strategic Decision: The company decides to reallocate marketing budget from underperforming product lines to high-potential categories and increase digital marketing efforts.
Mind Map:
Explanation: By analyzing the variance, the company strategically shifts resources to maximize impact, demonstrating how variance insights directly influence budget reallocation decisions.
Example 2: Production Efficiency Improvements from Cost Variance
Scenario: A manufacturing firm experiences an unfavorable variance in production costs, primarily due to higher raw material expenses and labor inefficiencies.
Strategic Decision: The management initiates a supplier renegotiation process and invests in employee training programs to improve labor productivity.
Mind Map:
Explanation: Variance analysis highlights specific cost drivers, enabling targeted strategic initiatives that reduce expenses and improve operational efficiency.
Example 3: Capital Expenditure (CapEx) Prioritization Based on Variance Trends
Scenario: A corporate finance team observes consistent unfavorable variances in maintenance expenses, suggesting aging equipment is causing higher repair costs.
Strategic Decision: The company prioritizes capital expenditure to replace or upgrade critical machinery, balancing short-term costs with long-term savings.
Mind Map:
Explanation: By linking variance trends to asset management, the finance team supports strategic investment decisions that enhance operational sustainability.
Example 4: Workforce Planning Based on Labor Cost Variance
Scenario: A service-based company detects a favorable variance in labor costs but an unfavorable variance in customer satisfaction scores.
Strategic Decision: The company decides to hire additional skilled staff and invest in employee engagement initiatives to improve service quality.
Mind Map:
Explanation: This example shows how variance analysis can reveal hidden risks of cost-cutting measures, prompting strategic workforce adjustments to maintain service standards.
Example 5: Pricing Strategy Adjustment from Revenue Variance
Scenario: A financial analyst observes an unfavorable variance in revenue due to increased competition and price undercutting.
Strategic Decision: The company undertakes a pricing strategy review, introducing tiered pricing and value-added services to differentiate its offerings.
Mind Map:
Explanation: Variance analysis drives strategic pricing decisions that respond to market dynamics and protect revenue streams.
Summary
These examples illustrate how budget variance analysis is not merely a reporting exercise but a strategic tool that informs critical business decisions. By systematically analyzing variances, accountants and financial analysts provide actionable insights that help organizations adapt, optimize, and grow.
7.3 Linking Variance Analysis to Performance Management and Incentives
Budget variance analysis is not just a tool for identifying financial discrepancies; it plays a crucial role in shaping performance management systems and incentive structures within organizations. By connecting variance insights to employee and departmental performance, companies can foster accountability, motivate teams, and drive continuous improvement.
Understanding the Link
Variance analysis highlights where actual performance deviates from planned budgets. When these variances are analyzed and communicated effectively, they can inform performance evaluations and incentive programs, ensuring that rewards are aligned with financial and operational goals.
Mind Map: Linking Variance Analysis to Performance Management and Incentives
Best Practices with Examples
-
Setting Clear Financial Targets Aligned with Budgets
- Example: A sales team has a quarterly revenue target of $1 million. Variance analysis shows a 10% shortfall in Q1. This variance is used in performance reviews to discuss challenges and set realistic corrective actions.
-
Using Variance Thresholds to Trigger Performance Discussions
- Example: If a department exceeds a 5% unfavorable variance in expenses, it triggers a mandatory review meeting. This ensures timely intervention and accountability.
-
Incorporating Variance Results into Bonus Calculations
- Example: An operations team’s bonus is partially based on maintaining expenses within 3% of the budget. If the team achieves this, they receive a full bonus; otherwise, the bonus is prorated.
-
Balancing Financial and Non-Financial Incentives
- Example: Beyond bonuses, employees who consistently manage budget variances well receive recognition awards and opportunities for professional development, fostering long-term engagement.
Example Scenario: Manufacturing Department
- Context: The manufacturing department has a budget for raw materials set at $500,000 per quarter.
- Variance Analysis: Actual spending is $550,000, a 10% unfavorable variance.
- Performance Management: The variance triggers a review where the team identifies supplier price increases and waste as root causes.
- Incentives: The team is given a target to reduce waste by 5% next quarter. Achieving this target will unlock a performance bonus.
This approach links the variance directly to actionable goals and rewards, encouraging proactive management.
Mind Map: Performance Management Cycle with Variance Analysis
Tips for Effective Integration
- Transparency: Share variance reports openly with teams to build trust and collective responsibility.
- Timeliness: Conduct variance analysis frequently (monthly or quarterly) to ensure relevance.
- Customization: Tailor incentive programs to different roles and departments based on their impact on budget outcomes.
- Continuous Feedback: Use variance insights as a basis for ongoing coaching rather than solely punitive measures.
By embedding budget variance analysis into performance management and incentives, organizations can create a culture of financial discipline and continuous improvement, ultimately driving better corporate performance.
7.4 Best Practices for Continuous Improvement Based on Variance Trends
Continuous improvement in budget variance analysis is essential for maintaining financial health and operational efficiency. By systematically analyzing variance trends, accountants and financial analysts can identify recurring issues, optimize budgeting processes, and support strategic decision-making. Below are best practices, mind maps, and examples to guide this ongoing improvement.
Best Practices for Continuous Improvement
-
Establish Regular Review Cycles
- Schedule monthly or quarterly variance review meetings.
- Use these sessions to identify patterns and discuss corrective actions.
-
Trend Analysis Over Time
- Track variances across multiple periods to detect persistent issues.
- Compare actuals against budgets and forecasts to refine accuracy.
-
Root Cause Documentation
- Maintain detailed records of variance causes.
- Use this documentation to prevent recurrence and inform future budgeting.
-
Collaborate Across Departments
- Engage operational teams to understand the context behind variances.
- Foster open communication to align budgeting assumptions with realities.
-
Leverage Technology and Automation
- Use variance analysis software to automate data collection and reporting.
- Implement dashboards that highlight trends and anomalies in real-time.
-
Continuous Training and Skill Development
- Provide ongoing education on variance analysis techniques and tools.
- Encourage knowledge sharing within the finance team.
-
Integrate Variance Insights into Strategic Planning
- Use variance trends to adjust long-term financial plans and resource allocation.
- Align budgeting processes with evolving business objectives.
Mind Map: Continuous Improvement Framework Based on Variance Trends
Example 1: Monthly Review Cycle Implementation
Scenario: A mid-sized manufacturing company noticed recurring unfavorable variances in raw material costs.
Action: The finance team implemented a monthly variance review meeting involving procurement, production, and finance.
Outcome: Through collaborative discussions, they identified supplier price increases and inefficiencies in inventory management. This led to renegotiating supplier contracts and optimizing inventory levels, reducing future variances.
Mind Map: Root Cause Analysis and Documentation
Example 2: Leveraging Technology for Trend Monitoring
Scenario: A financial analyst at a retail corporation struggled to manually track variances across multiple stores.
Action: The company adopted a cloud-based budgeting tool with automated variance reporting and interactive dashboards.
Outcome: The analyst could quickly identify stores with consistent unfavorable variances and drill down into specific expense categories, enabling targeted interventions and improved budget accuracy.
Mind Map: Integrating Variance Analysis into Strategic Planning
Example 3: Continuous Training for Enhanced Analysis
Scenario: A corporate finance team found that variance reports were often misinterpreted by operational managers.
Action: They initiated quarterly training sessions focused on variance concepts, interpretation, and collaborative problem-solving.
Outcome: Improved understanding led to more effective use of variance data in decision-making and proactive management of budget deviations.
Summary
Continuous improvement based on variance trends requires a structured approach combining regular reviews, thorough root cause analysis, cross-functional collaboration, technology adoption, and ongoing training. By embedding these best practices into the finance function, accountants and financial analysts can drive more accurate budgeting, timely corrective actions, and stronger alignment with corporate goals.
8. Advanced Techniques in Budget Variance Analysis
8.1 Variance Analysis in Zero-Based and Flexible Budgeting
Budget variance analysis plays a crucial role in both Zero-Based Budgeting (ZBB) and Flexible Budgeting, helping organizations understand deviations and make informed decisions. This section explores how variance analysis integrates with these budgeting approaches, highlighting best practices and providing practical examples.
Understanding Zero-Based Budgeting (ZBB)
Zero-Based Budgeting requires each expense to be justified from scratch for every new period, rather than adjusting prior budgets. This approach promotes cost efficiency and prioritization.
Key Points:
- Every budget cycle starts at zero.
- Requires detailed justification for all expenses.
- Encourages critical evaluation of all spending.
Mind Map: Zero-Based Budgeting and Variance Analysis
Example: A corporate finance team creates a zero-based budget for the marketing department, justifying every campaign and expense anew. After the quarter, variance analysis reveals that actual spending on digital ads was 15% below the zero-based budget due to renegotiated vendor contracts, highlighting effective cost management.
Understanding Flexible Budgeting
Flexible budgeting adjusts the budget based on actual activity levels, providing a dynamic framework that reflects operational realities.
Key Points:
- Budgets adapt to changes in volume or activity.
- Useful for organizations with variable costs.
- Enables more accurate variance analysis.
Mind Map: Flexible Budgeting and Variance Analysis
Example: A manufacturing company sets a flexible budget for production costs based on units produced. If actual production is 10,000 units instead of the planned 8,000, the flexible budget adjusts variable costs accordingly. Variance analysis then isolates whether cost overruns are due to inefficiencies or volume changes.
Integrating Variance Analysis with ZBB and Flexible Budgeting
| Aspect | Zero-Based Budgeting | Flexible Budgeting |
|---|---|---|
| Budget Basis | Justified from zero each period | Adjusted for actual activity levels |
| Variance Focus | Identify unjustified or excessive expenses | Separate volume and efficiency variances |
| Best Practice Example | Review all expenses quarterly with variance analysis | Adjust budget monthly based on activity and analyze deviations |
Mind Map: Combined Approach
Practical Example: Applying Variance Analysis in ZBB and Flexible Budgeting
Scenario: A financial analyst is tasked with variance analysis for the IT department, which uses zero-based budgeting for software licenses and flexible budgeting for support staff salaries (which vary with helpdesk tickets).
- Step 1: Collect actual expenses and activity data (number of tickets).
- Step 2: Compare software license costs to zero-based budget; identify any unplanned purchases.
- Step 3: Adjust salary budget based on actual ticket volume and compare actual salaries to flexible budget.
- Step 4: Analyze variances:
- Software licenses show a 5% unfavorable variance due to an unexpected security tool purchase.
- Support staff salaries show a 3% favorable variance due to lower ticket volume.
- Step 5: Report findings with recommendations:
- Review approval process for unplanned software purchases.
- Adjust future flexible budgets to reflect ticket volume trends.
Best Practices for Variance Analysis in ZBB and Flexible Budgeting
- Maintain Clear Documentation: Justifications in ZBB should be well-documented to facilitate variance explanations.
- Use Activity-Based Data: For flexible budgets, accurate activity measurement is critical.
- Regular Review Cycles: Frequent variance analysis enables timely corrective actions.
- Leverage Technology: Use budgeting and analytics tools to automate adjustments and variance calculations.
- Train Teams: Ensure accountants and analysts understand both budgeting methods and variance analysis techniques.
By integrating variance analysis effectively within zero-based and flexible budgeting frameworks, finance professionals can enhance cost control, improve forecasting accuracy, and support strategic decision-making.
8.2 Incorporating Predictive Analytics and Machine Learning
Incorporating predictive analytics and machine learning (ML) into budget variance analysis represents a significant advancement in how finance professionals forecast, detect anomalies, and make data-driven decisions. These technologies enable accountants and financial analysts to move beyond traditional variance calculations and gain deeper insights into future financial performance.
What is Predictive Analytics in Budget Variance Analysis?
Predictive analytics uses historical data, statistical algorithms, and machine learning techniques to identify the likelihood of future outcomes. In budget variance analysis, it helps anticipate variances before they occur, enabling proactive management.
How Machine Learning Enhances Variance Analysis
Machine learning models can learn from complex datasets, recognize patterns, and improve over time without explicit programming. This capability allows for:
- Automated anomaly detection
- Dynamic forecasting
- Scenario analysis
Mind Map: Predictive Analytics and Machine Learning in Budget Variance Analysis
Practical Examples
Example 1: Forecasting Sales Variance Using Time Series Forecasting
A retail company uses historical monthly sales data and budget figures to train a time series forecasting model (e.g., ARIMA or LSTM neural network). The model predicts next quarter’s sales and expected variances against the budget.
- Step 1: Collect 3 years of monthly sales and budget data.
- Step 2: Train the model to recognize seasonal patterns and trends.
- Step 3: Generate forecasts and compare with budget to identify potential unfavorable variances early.
Outcome: The finance team adjusts marketing spend proactively to mitigate forecasted shortfalls.
Example 2: Anomaly Detection in Expense Variances Using Classification Models
A manufacturing firm implements a machine learning classification model to detect unusual expense variances.
- Step 1: Historical expense data labeled as ‘normal’ or ‘anomalous’ based on past variance investigations.
- Step 2: Train a Random Forest classifier to identify patterns associated with anomalies.
- Step 3: Apply the model on current month’s expense data to flag suspicious variances for review.
Outcome: Early identification of potential fraud or accounting errors, saving significant costs.
Mind Map: Workflow for Incorporating ML in Variance Analysis
Best Practices for Implementation
- Start Small: Pilot predictive models on a single department or variance type before scaling.
- Ensure Data Quality: Garbage in, garbage out – invest in clean, structured data.
- Collaborate Across Teams: Engage data scientists, accountants, and IT for successful integration.
- Interpretability: Use models that provide explainable outputs to build trust with stakeholders.
- Continuous Learning: Regularly update models with new data to maintain accuracy.
Summary
Incorporating predictive analytics and machine learning into budget variance analysis empowers finance professionals to anticipate issues, optimize budgets, and support strategic decision-making. By leveraging historical data and advanced algorithms, organizations can transform variance analysis from a reactive process into a proactive, predictive discipline.
8.3 Scenario Analysis and Sensitivity Testing with Variance Data
Scenario analysis and sensitivity testing are powerful techniques used by accountants and financial analysts to understand how different variables impact budget variances. These methods help organizations anticipate potential outcomes, manage risks, and make informed decisions.
What is Scenario Analysis?
Scenario analysis involves creating multiple hypothetical situations (scenarios) to evaluate how changes in key assumptions affect financial outcomes and budget variances.
Example: A company forecasts sales revenue based on optimistic, base, and pessimistic scenarios. Each scenario reflects different assumptions about market demand, pricing, and costs.
What is Sensitivity Testing?
Sensitivity testing isolates individual variables to see how sensitive the budget variance is to changes in that variable, holding others constant.
Example: Analyzing how a 5% increase in raw material costs affects the overall expense variance without changing other factors.
Mind Map: Scenario Analysis Process
Mind Map: Sensitivity Testing Workflow
Step-by-Step Example: Scenario Analysis Using Variance Data
Context: A retail company wants to analyze how different sales growth rates affect their budget variance for revenue.
| Scenario | Sales Growth Assumption | Budgeted Revenue | Actual Revenue | Variance (Actual - Budget) |
|---|---|---|---|---|
| Optimistic | +15% | $1,000,000 | $1,150,000 | +$150,000 (Favorable) |
| Base Case | +5% | $1,000,000 | $1,050,000 | +$50,000 (Favorable) |
| Pessimistic | -5% | $1,000,000 | $950,000 | -$50,000 (Unfavorable) |
Analysis:
- The optimistic scenario shows a significant favorable variance, indicating strong sales.
- The pessimistic scenario reveals a potential unfavorable variance, signaling a risk.
Best Practice: Use these scenarios to prepare contingency plans and adjust budgets accordingly.
Step-by-Step Example: Sensitivity Testing on Cost Variance
Context: A manufacturing firm wants to test how sensitive their cost variance is to changes in raw material prices.
| Raw Material Cost Change | Budgeted Cost | Actual Cost | Variance | Impact on Total Cost Variance |
|---|---|---|---|---|
| -10% | $500,000 | $450,000 | -$50,000 | Decreases total cost variance |
| 0% (Base) | $500,000 | $500,000 | $0 | Baseline |
| +10% | $500,000 | $550,000 | +$50,000 | Increases total cost variance |
Analysis:
- A 10% increase in raw material costs leads to a $50,000 unfavorable variance.
- This sensitivity testing helps prioritize cost control measures.
Mind Map: Integrating Scenario and Sensitivity Analysis with Variance Data
Tools and Techniques
- Excel What-If Analysis: Use Data Tables and Scenario Manager to model different scenarios and sensitivity tests.
- Financial Modeling Software: Platforms like Adaptive Insights or Anaplan provide built-in scenario and sensitivity modules.
Summary
Scenario analysis and sensitivity testing allow finance professionals to use variance data proactively. By modeling different outcomes and testing variable impacts, accountants and analysts can better anticipate financial risks and opportunities, leading to more resilient budgeting and strategic planning.
8.4 Example: Applying Advanced Techniques in a Corporate Finance Setting
In this section, we will explore how advanced budget variance analysis techniques can be applied in a real-world corporate finance environment. We will focus on a hypothetical multinational manufacturing company, “GlobalTech Corp,” which is implementing zero-based budgeting, predictive analytics, and scenario analysis to enhance its variance management process.
Context: GlobalTech Corp’s Budgeting Challenge
GlobalTech Corp operates in multiple countries with diverse product lines and fluctuating raw material costs. Traditional variance analysis revealed frequent unfavorable variances in production costs and sales revenue, but root causes were often unclear. To improve accuracy and decision-making, the finance team decided to adopt advanced variance analysis techniques.
Step 1: Zero-Based Budgeting (ZBB) Integration
Zero-Based Budgeting requires every expense to be justified from scratch, rather than basing budgets on historical spending. This approach helps identify unnecessary costs and aligns spending with current strategic priorities.
Mind Map: Zero-Based Budgeting Process
Example: GlobalTech’s finance team breaks down the marketing department’s budget into decision packages such as digital advertising, trade shows, and sponsorships. Each package is evaluated for necessity and ROI. This granular approach allows the team to set a more accurate budget baseline, reducing unexpected variances.
Step 2: Predictive Analytics for Variance Forecasting
Using historical data and machine learning models, predictive analytics can forecast potential variances before they occur, enabling proactive management.
Mind Map: Predictive Analytics Workflow
Example: GlobalTech uses a time series forecasting model to predict raw material cost fluctuations based on commodity market trends. The model forecasts a 7% increase in steel prices next quarter, signaling a potential unfavorable variance in production costs. The finance team flags this early, allowing procurement to negotiate fixed-price contracts.
Step 3: Scenario Analysis and Sensitivity Testing
Scenario analysis evaluates how different assumptions impact budget variances, while sensitivity testing identifies which variables most influence outcomes.
Mind Map: Scenario Analysis and Sensitivity Testing
Example: The finance team models three scenarios for GlobalTech’s upcoming quarter:
- Best Case: Steel prices drop by 5%, sales volume increases by 10%
- Base Case: Steel prices increase by 7%, sales volume stable
- Worst Case: Steel prices increase by 15%, sales volume decreases by 5%
Sensitivity testing reveals that steel price fluctuations have a 3x greater impact on production cost variance than sales volume changes. This insight helps prioritize risk mitigation efforts.
Step 4: Integrated Application and Results
By combining ZBB, predictive analytics, and scenario analysis, GlobalTech achieves a more dynamic and accurate variance analysis process.
Mind Map: Integrated Advanced Variance Analysis
Example: GlobalTech’s finance team sets a zero-based budget for Q3, incorporating predictive forecasts of raw material costs. Scenario analysis prepares contingency plans for price volatility. When steel prices rise by 10%, the team quickly reallocates budget from lower-priority projects to cover increased costs, minimizing unfavorable variances.
Summary
Advanced techniques like zero-based budgeting, predictive analytics, and scenario analysis empower corporate finance teams to anticipate, understand, and manage budget variances more effectively. By applying these methods in an integrated manner, organizations like GlobalTech Corp can improve financial accuracy, support strategic decision-making, and enhance overall performance.
Key Takeaways:
- Zero-Based Budgeting ensures budgets are built on current needs, reducing variance surprises.
- Predictive Analytics provides foresight into potential variances, enabling proactive responses.
- Scenario Analysis and Sensitivity Testing help understand risks and prioritize focus areas.
- Integration of these techniques creates a robust framework for dynamic variance management.
9. Common Challenges and Solutions in Budget Variance Analysis
9.1 Dealing with Incomplete or Inaccurate Data
In budget variance analysis, the accuracy and completeness of data are paramount. Incomplete or inaccurate data can lead to misleading conclusions, poor decision-making, and ultimately, financial losses. This section explores best practices to identify, manage, and mitigate issues arising from data quality problems.
Understanding the Impact of Incomplete or Inaccurate Data
- Misstated variances can obscure true financial performance.
- Incorrect root cause analysis due to faulty data.
- Reduced confidence among stakeholders in financial reports.
Common Causes of Data Issues
- Missing entries or delayed data submissions.
- Manual data entry errors.
- Inconsistent data formats across departments.
- Outdated or obsolete data sources.
Best Practices to Address Data Quality Issues
-
Establish Data Governance Policies
- Define clear roles and responsibilities for data owners.
- Implement standardized data entry protocols.
-
Automate Data Collection Where Possible
- Use integrated financial systems to minimize manual input.
- Employ validation rules and error-checking algorithms.
-
Regular Data Audits and Reconciliation
- Schedule periodic reviews to detect anomalies.
- Cross-verify data with multiple sources.
-
Training and Awareness
- Educate teams on the importance of data accuracy.
- Provide training on tools and best practices.
-
Use of Data Imputation Techniques\n - Apply statistical methods to estimate missing values cautiously.
Mind Map: Managing Data Quality in Budget Variance Analysis
Example 1: Detecting Missing Data in Expense Reports
Scenario: A financial analyst notices that the monthly expense report for a department is missing several entries compared to the previous month.
Action Steps:
- Cross-check the submitted expense reports with the procurement system.
- Identify the missing entries and contact the department for clarification.
- Implement an automated alert system that flags incomplete submissions before finalizing reports.
Outcome: The department improves data submission timeliness, reducing incomplete data incidents by 80%.
Example 2: Correcting Inaccurate Data Through Validation Rules
Scenario: An accountant finds that some sales figures in the budget are unusually high compared to historical trends.
Action Steps:
- Apply validation rules in the budgeting software to flag outliers.
- Investigate flagged entries by comparing with sales invoices and CRM data.
- Correct errors and update the budget accordingly.
Outcome: Enhanced data accuracy leads to more reliable variance analysis and better forecasting.
Mind Map: Data Validation Workflow
Additional Tips
- Maintain a data quality log to track recurring issues and resolutions.
- Foster a culture that values data integrity across finance and operational teams.
- Leverage collaborative tools to streamline communication about data discrepancies.
By proactively addressing incomplete or inaccurate data, accountants and financial analysts can ensure that budget variance analysis remains a powerful tool for insightful financial management and strategic decision-making.
9.2 Overcoming Resistance to Variance Reporting in Organizations
Resistance to variance reporting is a common challenge in many organizations, especially when it comes to finance teams, department heads, and operational staff. Understanding the root causes of this resistance and applying strategic approaches can help accountants and financial analysts foster a culture of transparency and continuous improvement.
Common Causes of Resistance
- Fear of Accountability: Employees may fear that unfavorable variances will lead to blame or punitive actions.
- Lack of Understanding: Some stakeholders may not fully grasp the purpose or benefits of variance reporting.
- Perceived Complexity: Variance reports can sometimes be seen as overly technical or complicated.
- Cultural Barriers: Organizational culture may not support open communication about financial performance.
- Time Constraints: Preparing and reviewing variance reports may be viewed as time-consuming.
Mind Map: Causes of Resistance to Variance Reporting
Strategies to Overcome Resistance
-
Promote a No-Blame Culture
- Emphasize that variance analysis is a tool for improvement, not punishment.
- Example: A manufacturing company shifted from blaming department heads for unfavorable variances to collaborative problem-solving sessions, resulting in more open discussions and actionable insights.
-
Educate and Train Stakeholders
- Conduct workshops explaining variance concepts, benefits, and how to interpret reports.
- Example: A retail chain implemented quarterly training for store managers, improving their engagement with variance reports and enabling them to take proactive measures.
-
Simplify Reporting Formats
- Use clear visuals, dashboards, and concise summaries.
- Example: A financial analyst redesigned variance reports using color-coded charts and bullet points, which increased report readership by 40%.
-
Engage Leadership Support
- Secure buy-in from top management to champion transparency and accountability.
- Example: In a tech firm, the CFO personally reviewed variance reports with teams, reinforcing their importance and encouraging openness.
-
Integrate Variance Reporting into Regular Meetings
- Make variance discussions a routine part of team meetings to normalize the process.
- Example: A corporate finance team added a 10-minute variance review segment in weekly meetings, fostering continuous dialogue.
-
Leverage Technology for Efficiency
- Use automated tools to reduce manual effort and errors.
- Example: An accounting department implemented software that automatically generated variance reports, freeing up time for analysis and discussion.
Mind Map: Strategies to Overcome Resistance
Example Scenario: Overcoming Resistance in a Corporate Finance Department
Background: A corporate finance department faced pushback from various business units reluctant to share detailed budget variance data. Units feared negative repercussions and found the reports too complex.
Actions Taken:
- The finance leadership introduced a “no-blame” policy emphasizing learning from variances.
- Conducted interactive training sessions tailored to each unit’s context.
- Redesigned variance reports with easy-to-understand visuals and summaries.
- The CFO personally communicated the importance of transparency.
- Incorporated variance discussions into monthly cross-departmental meetings.
- Implemented a cloud-based reporting tool to streamline data sharing.
Outcome: Within six months, variance reporting participation increased by 70%, and the quality of data improved significantly. The organization was able to identify cost-saving opportunities and improve forecasting accuracy.
Summary
Overcoming resistance to variance reporting requires a multifaceted approach that addresses emotional, educational, cultural, and technical barriers. By fostering a supportive environment, simplifying communication, and leveraging leadership and technology, organizations can transform variance analysis into a powerful tool for financial transparency and operational excellence.
For accountants and financial analysts, applying these best practices with empathy and clarity will help unlock the full potential of budget variance analysis across their organizations.
9.3 Managing Variance Analysis in Rapidly Changing Markets
In rapidly changing markets, budget variance analysis becomes both more challenging and more critical. Market volatility, shifting consumer preferences, supply chain disruptions, and regulatory changes can all cause significant deviations from budgeted figures. Accountants and financial analysts must adapt their variance analysis techniques to remain relevant and actionable.
Key Challenges in Rapidly Changing Markets
- Unpredictable Revenue Streams: Sudden shifts in demand can cause revenue to fluctuate widely.
- Cost Volatility: Raw material prices, labor costs, and logistics expenses may vary unexpectedly.
- Shortened Planning Cycles: Budgets may need frequent revisions, reducing the reliability of static variance analysis.
- Data Lag: Traditional monthly or quarterly reporting may not capture real-time changes.
Best Practices for Managing Variance Analysis in Dynamic Environments
-
Adopt Rolling Forecasts and Continuous Budgeting
- Instead of fixed annual budgets, use rolling forecasts updated monthly or quarterly.
- Example: A tech company updates its sales forecast every month based on the latest market intelligence, allowing variance analysis to reflect current realities.
-
Increase Reporting Frequency and Granularity
- Move from quarterly to monthly or even weekly variance reports.
- Drill down variances by product line, region, or customer segment to identify specific drivers.
-
Leverage Real-Time Data and Automation
- Use ERP and BI tools that integrate real-time sales, procurement, and expense data.
- Example: A retailer uses a dashboard that automatically flags variances exceeding 5% in daily sales versus budget.
-
Scenario Planning and Sensitivity Analysis
- Develop multiple budget scenarios (best case, worst case, most likely) to prepare for uncertainty.
- Analyze how variances behave under different market conditions.
-
Collaborate Cross-Functionally
- Engage sales, operations, and supply chain teams to understand drivers behind variances.
- Example: A manufacturing firm holds weekly variance review meetings with procurement and production to adjust forecasts based on supplier lead times.
-
Focus on Leading Indicators
- Track non-financial metrics that predict financial performance (e.g., order backlog, customer inquiries).
Mind Map: Managing Variance Analysis in Rapidly Changing Markets
Example: Retailer Adapting Variance Analysis Amid Supply Chain Disruptions
A large retail chain faced significant supply chain delays during a global crisis, causing inventory shortages and lost sales. Traditional monthly variance reports showed large unfavorable variances in cost of goods sold (COGS) and revenue but were unable to explain the root causes promptly.
Actions Taken:
- Implemented weekly variance reporting with drill-downs by product category.
- Integrated supplier shipment data into the variance dashboard.
- Collaborated with procurement to forecast delays and adjust budgets dynamically.
Outcome:
- Early identification of product categories at risk.
- Ability to reallocate marketing spend to available inventory.
- Reduced unfavorable variance impact by 15% within two quarters.
Example: Financial Analyst Using Scenario Planning in a Volatile Market
A financial analyst at a manufacturing company created three budget scenarios to prepare for raw material price swings:
- Best Case: Prices remain stable.
- Most Likely: Prices increase by 10%.
- Worst Case: Prices increase by 25%.
Monthly variance analysis compared actual costs against all scenarios, enabling management to make informed procurement decisions and hedge appropriately.
Summary
Managing budget variance analysis in rapidly changing markets requires agility, enhanced data capabilities, and close collaboration across departments. By adopting rolling forecasts, increasing reporting frequency, leveraging real-time data, and using scenario planning, accountants and financial analysts can provide timely insights that support proactive decision-making.
9.4 Practical Solutions Illustrated Through Real-World Examples
Budget variance analysis often encounters challenges such as incomplete data, resistance to reporting, and rapidly changing market conditions. This section presents practical solutions to these challenges, supported by real-world examples and mind maps to visualize the problem-solving approach.
Challenge 1: Dealing with Incomplete or Inaccurate Data
Problem: Missing or inaccurate data can distort variance analysis, leading to poor decision-making.
Solution: Implement rigorous data validation processes and establish cross-functional communication channels to ensure data accuracy.
Example: A mid-sized manufacturing firm noticed frequent discrepancies in their cost variance reports due to inconsistent data entry from different departments.
- They introduced a centralized data validation checklist.
- Monthly cross-departmental meetings were held to reconcile data differences.
- Automated data entry controls were implemented in their ERP system.
Result: Data accuracy improved by 30%, leading to more reliable variance reports.
Mind Map:
Challenge 2: Overcoming Resistance to Variance Reporting in Organizations
Problem: Employees or managers may resist variance reporting fearing blame or increased scrutiny.
Solution: Foster a culture of transparency and continuous improvement rather than punishment.
Example: A financial analyst at a retail company faced pushback when presenting unfavorable variances.
- Shifted focus from blame to identifying improvement opportunities.
- Incorporated variance discussions into regular team meetings as learning sessions.
- Recognized and rewarded teams that proactively addressed variances.
Result: Engagement increased, and variance reporting became a collaborative effort.
Mind Map:
Challenge 3: Managing Variance Analysis in Rapidly Changing Markets
Problem: Market volatility can cause frequent and unpredictable variances, complicating analysis.
Solution: Adopt flexible budgeting and real-time variance tracking.
Example: A tech startup operating in a fast-evolving market implemented rolling forecasts and real-time dashboards.
- Budgets were updated quarterly instead of annually.
- Real-time variance dashboards allowed immediate identification of deviations.
- Scenario analysis was used to prepare for multiple market conditions.
Result: The company improved agility in financial planning and reduced surprise variances.
Mind Map:
Summary Table of Challenges and Solutions
| Challenge | Practical Solution | Real-World Example Summary |
|---|---|---|
| Incomplete/Inaccurate Data | Centralized validation, cross-team meetings, automation | Manufacturing firm improved data accuracy by 30% |
| Resistance to Variance Reporting | Promote transparency, learning culture, recognition | Retail company fostered collaborative reporting |
| Rapidly Changing Markets | Rolling forecasts, real-time dashboards, scenario analysis | Tech startup increased agility and responsiveness |
By applying these practical solutions, accountants and financial analysts can overcome common obstacles in budget variance analysis, ensuring more accurate, timely, and actionable insights for their organizations.
10. Case Studies and Real-World Applications
10.1 Case Study 1: Variance Analysis in a Retail Corporation
Overview
In this case study, we explore how a mid-sized retail corporation utilized budget variance analysis to identify and address discrepancies in their financial performance. The company operates multiple stores across several regions, selling consumer electronics and accessories.
Background
The retail corporation had set an annual budget projecting revenues, cost of goods sold (COGS), operating expenses, and net profit. Midway through the fiscal year, the finance team noticed significant variances between actual and budgeted figures, especially in sales revenue and inventory costs.
The goal was to perform a detailed variance analysis to understand the root causes and recommend corrective actions.
Step 1: Collecting Data
- Budgeted Sales Revenue: $50 million (for first half of the year)
- Actual Sales Revenue: $46 million
- Budgeted COGS: $30 million
- Actual COGS: $33 million
- Budgeted Operating Expenses: $10 million
- Actual Operating Expenses: $9.5 million
Step 2: Calculating Variances
| Category | Budgeted ($) | Actual ($) | Variance ($) | Variance Type |
|---|---|---|---|---|
| Sales Revenue | 50,000,000 | 46,000,000 | -4,000,000 | Unfavorable |
| Cost of Goods Sold | 30,000,000 | 33,000,000 | +3,000,000 | Unfavorable |
| Operating Expenses | 10,000,000 | 9,500,000 | -500,000 | Favorable |
- Sales Revenue Variance: $4 million unfavorable (actual less than budgeted)
- COGS Variance: $3 million unfavorable (actual higher than budgeted)
- Operating Expenses Variance: $0.5 million favorable (actual less than budgeted)
Step 3: Analyzing Causes
Mind Map: Root Cause Analysis of Sales Revenue Variance
Example:
- The team discovered that a key product line was out of stock for 3 weeks due to supply chain disruptions, causing lost sales.
- Regional sales in the Northeast underperformed due to a competitor’s aggressive discounting.
Mind Map: Root Cause Analysis of COGS Variance
Example:
- Supplier price hikes increased unit costs by 5%.
- Freight costs rose due to fuel price increases.
- Inventory shrinkage was identified in one warehouse due to theft.
Step 4: Reporting Findings
The finance team prepared a variance analysis report including:
- Summary tables of variances
- Visual charts (bar charts showing budget vs actual)
- Root cause explanations
- Recommendations
Example Chart (Table Representation):
| Category | Budgeted | Actual | Variance |
|---|---|---|---|
| Sales Revenue | 50M | 46M | -4M |
| COGS | 30M | 33M | +3M |
| Operating Expenses | 10M | 9.5M | -0.5M |
Step 5: Recommendations and Actions
-
Sales Revenue:
- Improve inventory management to avoid stockouts.
- Launch targeted promotions in underperforming regions.
- Monitor competitor pricing and adjust strategies accordingly.
-
COGS:
- Negotiate better supplier contracts.
- Optimize logistics to reduce freight costs.
- Strengthen warehouse security to reduce shrinkage.
-
Operating Expenses:
- Continue cost control measures that led to favorable variance.
Step 6: Follow-Up Example
Three months after implementing corrective actions, the company observed:
- Sales revenue increased by 8% in previously underperforming regions.
- COGS growth slowed to 1% above budget due to renegotiated contracts.
- Operating expenses remained under budget.
Summary Mind Map: Retail Corporation Budget Variance Analysis
This case study illustrates how comprehensive variance analysis, combined with clear reporting and actionable recommendations, can help retail corporations address financial discrepancies and improve overall performance.
10.2 Case Study 2: Managing Budget Variances in a Manufacturing Firm
Introduction
In this case study, we explore how a mid-sized manufacturing firm, “Precision Components Inc.”, effectively managed budget variances to improve operational efficiency and financial performance. The company produces automotive parts and faced significant challenges due to fluctuating raw material costs and labor inefficiencies.
Background
- Company: Precision Components Inc.
- Industry: Automotive Manufacturing
- Annual Revenue: $150 million
- Budgeting Cycle: Annual with quarterly reviews
Initial Challenges
- Raw material cost variances exceeding 15% monthly
- Labor cost overruns due to overtime and inefficiencies
- Inaccurate forecasting of production volumes
- Lack of timely variance reporting leading to delayed corrective actions
Step 1: Setting Up the Variance Analysis Framework
Mind Map: Variance Analysis Framework Setup
Example:
- The finance team collaborated with procurement and production to gather accurate data on raw material prices and labor hours.
Step 2: Calculating and Categorizing Variances
Material Variances:
- Material Price Variance (MPV): Difference between standard cost and actual cost of materials purchased.
- Material Usage Variance (MUV): Difference between standard quantity and actual quantity used.
Labor Variances:
- Labor Rate Variance (LRV): Difference between standard labor rate and actual labor rate.
- Labor Efficiency Variance (LEV): Difference between standard labor hours and actual hours worked.
Example Calculation:
- Standard cost per kg of steel: $5
- Actual cost per kg: $5.75
- Quantity purchased: 10,000 kg
Material Price Variance = (5 - 5.75) x 10,000 = -$7,500 (Unfavorable)
Step 3: Root Cause Analysis of Significant Variances
Mind Map: Root Cause Analysis Process
Example:
- The procurement team identified a sudden surge in steel prices due to global supply chain disruptions.
- Production supervisors reported increased scrap rates leading to higher material usage.
Step 4: Implementing Corrective Actions
- Negotiated better contracts with steel suppliers to lock in prices and reduce volatility.
- Introduced process improvements on the production line to reduce scrap by 10%.
- Optimized labor scheduling to minimize overtime and improve efficiency.
Example:
- After process improvements, material usage variance reduced from -$12,000 to -$3,000 within two quarters.
Step 5: Reporting and Continuous Monitoring
Mind Map: Reporting and Monitoring
Example:
- The firm implemented a dashboard using Power BI to visualize variances in real-time, enabling quicker decision-making.
Results and Lessons Learned
- Material cost variances reduced by 60% over one year.
- Labor efficiency improved by 15%, reducing overtime costs.
- Enhanced collaboration between finance and operations led to proactive variance management.
- Timely variance reporting became integral to the monthly review process.
Summary Table of Key Variances and Actions
| Variance Type | Initial Impact | Root Cause | Corrective Action | Outcome |
|---|---|---|---|---|
| Material Price Variance | -$7,500 | Steel price surge | Supplier contract negotiation | Reduced price volatility |
| Material Usage Variance | -$12,000 | High scrap rates | Process improvements | Scrap reduced by 10% |
| Labor Rate Variance | -$4,000 | Overtime premium rates | Optimized labor scheduling | Overtime costs reduced |
| Labor Efficiency Variance | -$5,500 | Inefficient workflows | Training and workflow redesign | Labor efficiency improved 15% |
Conclusion
This case study demonstrates how a manufacturing firm can effectively manage budget variances by establishing a structured variance analysis framework, performing detailed root cause analysis, and implementing targeted corrective actions. The integration of clear reporting and continuous monitoring ensures sustained financial control and operational excellence.
10.3 Case Study 3: Financial Analyst’s Approach to Variance in a Tech Startup
Overview
In this case study, we explore how a financial analyst at a fast-growing tech startup approaches budget variance analysis to support strategic decision-making and operational efficiency. The startup operates in a highly dynamic environment with rapid changes in product development costs, marketing expenses, and revenue streams.
Initial Budget Setup and Challenges
- The startup created an initial budget based on projected user growth, expected product launch timelines, and marketing campaigns.
- Challenges included volatile market conditions, unpredictable customer acquisition costs, and fluctuating development expenses.
Example:
- Budgeted Marketing Expense: $200,000
- Actual Marketing Expense: $280,000
- Variance: $80,000 (Unfavorable)
Step 1: Collecting and Organizing Data
The analyst gathered data from multiple sources:
- CRM system for customer acquisition metrics
- Project management tools for development costs
- Accounting software for actual expenses
Mind Map: Data Collection Sources
Step 2: Calculating Variances
The analyst calculated variances for key budget categories:
| Category | Budgeted ($) | Actual ($) | Variance ($) | Variance Type |
|---|---|---|---|---|
| Marketing | 200,000 | 280,000 | +80,000 | Unfavorable |
| Product Development | 500,000 | 450,000 | -50,000 | Favorable |
| Sales Revenue | 1,000,000 | 1,200,000 | +200,000 | Favorable |
Example Calculation:
- Marketing Variance = Actual - Budgeted = 280,000 - 200,000 = +80,000 (Unfavorable)
Step 3: Root Cause Analysis
The analyst used a structured approach to identify causes:
Mind Map: Root Cause Analysis for Marketing Variance
Example:
- The startup increased bids on digital ads to maintain visibility in a competitive market, driving up costs.
- Unplanned influencer campaigns were launched without adjusting the budget.
Step 4: Reporting and Communication
The analyst prepared a clear report highlighting:
- Variance figures with visual aids
- Root causes and their impact
- Recommendations for corrective actions
Example Visualization:
Communication Best Practice:
- Tailor reports for executives focusing on strategic impact
- Provide detailed operational insights for marketing teams
Step 5: Strategic Recommendations and Follow-up
Based on the analysis, the analyst recommended:
- Revising the marketing budget to reflect competitive CPC trends
- Implementing stricter approval processes for additional campaigns
- Monitoring campaign ROI more closely with real-time dashboards
Example Action Plan:
- Immediate
- Freeze new influencer campaigns pending review
- Short-term
- Adjust digital ad bids based on performance data
- Long-term
- Develop predictive models for marketing spend
Summary Mind Map: Financial Analyst’s Approach
Key Takeaways
- In a tech startup, budget variance analysis must be agile and data-driven.
- Understanding market dynamics is critical to interpreting variances.
- Clear communication and actionable recommendations help align teams.
- Continuous monitoring and adjustment improve budget accuracy over time.
This case study demonstrates how financial analysts can leverage structured variance analysis to navigate the uncertainties of a tech startup environment, ensuring financial discipline while supporting growth initiatives.
10.4 Lessons Learned and Best Practices from Each Case
In this section, we synthesize the key takeaways and best practices derived from the three detailed case studies presented earlier. These lessons provide actionable insights for accountants and financial analysts aiming to enhance their budget variance analysis processes.
Case Study Recap Mind Map
Retail Corporation: Key Lessons & Best Practices
Lesson 1: Importance of Granular Data Collection
- Collecting detailed sales and expense data by product line and region allowed pinpointing exact variance sources.
- Example: Breaking down sales variance by store location revealed underperformance in specific areas.
Lesson 2: Adjust Budgets for Seasonality
- Incorporate seasonal trends into budgeting to avoid misleading variances.
- Example: Holiday season sales spikes were factored into monthly budgets, reducing unfavorable variance surprises.
Lesson 3: Foster Cross-Department Collaboration
- Engaging marketing, sales, and finance teams improved understanding of variance causes.
- Example: Marketing campaigns’ impact on sales variance was better interpreted through joint analysis.
Manufacturing Firm: Key Lessons & Best Practices
Lesson 1: Conduct Thorough Root Cause Analysis
- Investigate variances beyond surface numbers to identify operational inefficiencies.
- Example: Increased raw material costs were traced to supplier price hikes, not internal waste.
Lesson 2: Differentiate Controllable vs. Uncontrollable Variances
- Focus management attention on variances that can be influenced.
- Example: Labor overtime variance was controllable and addressed by adjusting shift schedules.
Lesson 3: Implement Continuous Monitoring and Early Alerts
- Use real-time dashboards to detect variances early and take corrective action.
- Example: Weekly variance reports triggered immediate investigation into a sudden spike in utility costs.
Tech Startup: Key Lessons & Best Practices
Lesson 1: Adopt Agile Budgeting Techniques
- Frequent budget revisions allowed adapting to fast-changing market conditions.
- Example: Monthly budget updates reflected rapid changes in customer acquisition costs.
Lesson 2: Use Scenario Planning to Prepare for Uncertainty
- Develop multiple budget scenarios to anticipate different business outcomes.
- Example: Best-case and worst-case revenue scenarios helped prioritize spending.
Lesson 3: Leverage Predictive Analytics for Proactive Variance Management
- Utilize machine learning models to forecast variances and guide decision-making.
- Example: Predictive models identified potential overspending in R&D before it occurred.
Integrated Mind Map of Best Practices
Practical Example: Applying Lessons to a New Variance Analysis
Scenario: A corporate finance team at a mid-sized company notices a 15% unfavorable variance in marketing expenses.
Step 1: Data Granularity
- Break down expenses by campaign and channel.
Step 2: Root Cause Analysis
- Identify if overspending is due to increased ad rates or inefficient campaigns.
Step 3: Controllability
- Determine which variances marketing can control (e.g., campaign budgets) versus external factors (e.g., platform price changes).
Step 4: Collaboration
- Engage marketing and finance teams to discuss findings and corrective actions.
Step 5: Continuous Monitoring
- Set up weekly variance reports to track progress.
Step 6: Scenario Planning
- Prepare revised budgets for different marketing spend levels based on expected ROI.
Step 7: Predictive Analytics
- Use historical data to forecast future marketing cost variances.
Summary
By integrating these lessons and best practices, accountants and financial analysts can enhance the accuracy, relevance, and impact of their budget variance analyses. The combination of detailed data, collaborative processes, analytical rigor, and modern tools creates a robust framework for effective financial management.
11. Tools and Resources for Effective Budget Variance Analysis
11.1 Overview of Popular Budgeting and Variance Analysis Software
Budgeting and variance analysis are critical functions for accountants and financial analysts aiming to maintain financial control and optimize corporate performance. Leveraging the right software tools can significantly enhance accuracy, efficiency, and insight generation. This section provides an overview of some of the most popular budgeting and variance analysis software solutions, along with practical examples and mind maps to illustrate their features and best use cases.
Key Features to Consider in Budgeting and Variance Analysis Software
Popular Software Solutions
Adaptive Insights (Workday Adaptive Planning)
Overview: Adaptive Insights is a cloud-based planning software widely used for budgeting, forecasting, and variance analysis. It offers powerful modeling capabilities, real-time collaboration, and integration with major ERP systems.
Best Practices & Example:
- Use Adaptive Insights to create rolling forecasts that adjust based on actuals, reducing variance surprises.
- Example: A financial analyst at a manufacturing company uses Adaptive Insights to compare monthly budget vs. actual sales and drill down into product-level variances, enabling targeted cost control.
Oracle Hyperion Planning
Overview: Oracle Hyperion Planning is an enterprise-level budgeting and forecasting solution known for its scalability and deep integration with Oracle’s ERP and financial systems.
Best Practices & Example:
- Utilize Hyperion’s driver-based planning to link operational metrics directly to financial outcomes.
- Example: A corporate finance team uses Hyperion to analyze budget variances in a multi-division corporation, identifying which business units are driving unfavorable variances.
Microsoft Excel with Power BI Integration
Overview: Excel remains a staple for many accountants and analysts due to its flexibility. When combined with Power BI, it becomes a powerful tool for variance analysis with interactive visualizations.
Best Practices & Example:
- Build dynamic variance analysis templates in Excel and connect them to Power BI for real-time dashboards.
- Example: An analyst creates an Excel workbook to calculate budget vs. actual variances by department and uses Power BI to visualize trends and highlight areas needing attention.
Planful (formerly Host Analytics)
Overview: Planful is a cloud-based financial planning and analysis platform designed for mid-sized to large organizations, offering budgeting, forecasting, and variance reporting.
Best Practices & Example:
- Leverage Planful’s workflow automation to streamline budget approvals and variance report distribution.
- Example: A financial analyst uses Planful to automate variance report generation and send alerts to department heads when variances exceed thresholds.
Anaplan
Overview: Anaplan offers a connected planning platform that integrates budgeting, forecasting, and variance analysis with operational data, enabling agile decision-making.
Best Practices & Example:
- Use Anaplan’s scenario planning to test the impact of different business decisions on budget variances.
- Example: A financial analyst at a retail company models the effect of a new marketing campaign on sales budgets and analyzes resulting variances in real-time.
Summary Table of Software Comparison
| Software | Deployment | Key Strengths | Ideal For | Example Use Case |
|---|---|---|---|---|
| Adaptive Insights | Cloud | Rolling forecasts, collaboration | Mid to large enterprises | Monthly sales variance analysis |
| Oracle Hyperion | On-premise/Cloud | Driver-based planning, scalability | Large enterprises | Multi-division variance tracking |
| Excel + Power BI | Desktop/Cloud | Flexibility, visualization | Small to mid-sized businesses | Departmental variance dashboards |
| Planful | Cloud | Workflow automation, alerts | Mid-sized to large organizations | Automated variance report distribution |
| Anaplan | Cloud | Connected planning, scenario analysis | Large enterprises, agile teams | Impact analysis of marketing campaigns on budget |
Final Thoughts
Selecting the right budgeting and variance analysis software depends on organizational size, complexity, existing systems, and specific analysis needs. Combining best practices with the appropriate tool can empower accountants and financial analysts to deliver timely, accurate, and actionable insights.
11.2 Leveraging Excel and Other Spreadsheet Tools: Practical Templates
Budget variance analysis is a critical task for accountants and financial analysts, and Excel remains one of the most powerful and accessible tools for this purpose. In this section, we will explore how to leverage Excel and other spreadsheet tools effectively, with practical templates and examples that simplify variance tracking, calculation, and reporting.
Why Use Excel for Budget Variance Analysis?
- Flexibility: Customize formulas, layouts, and reports according to your organization’s needs.
- Functionality: Powerful functions and pivot tables allow for dynamic data analysis.
- Visualization: Built-in charting tools help visualize variances clearly.
- Accessibility: Widely used and understood by finance professionals.
Key Components of an Effective Budget Variance Template
Example 1: Simple Budget Variance Template in Excel
| Category | Budgeted Amount | Actual Amount | Variance Amount | Variance % | Status |
|---|---|---|---|---|---|
| Sales Revenue | $100,000 | $95,000 | -$5,000 | -5% | Unfavorable |
| Marketing | $20,000 | $18,000 | $2,000 | 10% | Favorable |
| R&D | $15,000 | $17,000 | -$2,000 | -13.3% | Unfavorable |
Formulas:
- Variance Amount:
=Actual Amount - Budgeted Amount - Variance %:
=Variance Amount / Budgeted Amount - Status (using IF):
=IF(Variance Amount >= 0, "Favorable", "Unfavorable")
Best Practice: Use conditional formatting to highlight favorable variances in green and unfavorable in red for quick visual identification.
Example 2: Using Pivot Tables for Multi-Department Variance Analysis
Pivot tables allow you to summarize large datasets by departments, months, or categories.
Steps:
- Organize your raw data with columns for Date, Department, Budget, Actual, and Category.
- Insert a Pivot Table.
- Drag Department to Rows, Date (or Month) to Columns.
- Add Budget and Actual to Values.
- Create a calculated field for Variance:
Actual - Budget.
Mind Map:
Example 3: Automated Variance Dashboard Template
A dashboard can consolidate variance data and provide interactive insights.
Features:
- Summary cards showing total budget, actual, and variance.
- Trend line charts showing variance over time.
- Departmental variance bar charts.
- Slicers to filter by time period or department.
Excel Tools Used:
- Pivot Tables & Pivot Charts
- Slicers
- Conditional Formatting
- Named Ranges
Mind Map:
Tips for Building Your Own Templates
- Start Simple: Begin with basic variance calculations before adding complexity.
- Use Named Ranges: Makes formulas easier to read and maintain.
- Leverage Excel Tables: Tables auto-expand and make referencing easier.
- Protect Your Sheets: Lock formulas to prevent accidental changes.
- Document Your Template: Include instructions or comments for users.
Other Spreadsheet Tools to Consider
| Tool | Strengths | Notes |
|---|---|---|
| Google Sheets | Cloud-based, real-time collaboration | Supports many Excel functions |
| Smartsheet | Project management + budgeting integration | Good for team workflows |
| LibreOffice Calc | Open-source alternative | Compatible with Excel formats |
Example: Using Google Sheets for collaborative variance analysis allows multiple analysts to update actuals in real-time, improving accuracy and timeliness.
Summary
Leveraging Excel and other spreadsheet tools with well-designed templates empowers accountants and financial analysts to perform budget variance analysis efficiently and accurately. By combining formulas, pivot tables, conditional formatting, and dashboards, you can transform raw data into actionable insights that support better financial decision-making.
11.3 Training and Certification Resources for Accountants and Analysts
Budget variance analysis is a critical skill for accountants and financial analysts, and continuous learning through training and certifications can significantly enhance proficiency and career growth. This section explores key training programs, certifications, and learning resources tailored to finance professionals.
Professional Certifications
a. Certified Management Accountant (CMA)
- Offered by the Institute of Management Accountants (IMA).
- Focuses on financial planning, analysis, control, and decision support.
- Includes detailed modules on budgeting and variance analysis.
Example: A CMA candidate learns how to perform variance analysis to evaluate departmental performance and recommend corrective actions.
b. Chartered Financial Analyst (CFA)
- Offered by the CFA Institute.
- Emphasizes investment management but covers financial reporting and analysis.
- Useful for analysts involved in budgeting within investment contexts.
c. Certified Public Accountant (CPA)
- Focuses on accounting principles, auditing, and financial reporting.
- Some CPA programs include budgeting and variance analysis as part of managerial accounting.
Specialized Training Courses
a. Online Platforms
- Coursera, edX, LinkedIn Learning, and Udemy offer courses on budgeting, financial analysis, and variance analysis.
- Example Course: “Budgeting and Forecasting for Business Analysts” on Coursera.
b. Corporate Finance Institute (CFI)
- Offers a dedicated course on Budgeting and Forecasting.
- Includes practical exercises on variance analysis.
Example: A financial analyst completes CFI’s budgeting course and applies variance analysis techniques to real company data.
Workshops and Seminars
- Many professional accounting bodies and finance associations conduct workshops focused on budgeting techniques and variance analysis.
- Example: IMA’s annual conference includes hands-on sessions on variance investigation and reporting.
Internal Corporate Training Programs
- Larger corporations often provide tailored training for their finance teams.
- Example: A multinational company runs quarterly workshops on advanced variance analysis using their ERP system.
Mind Maps
Mind Map 1: Certification Pathways for Budget Variance Analysis
Mind Map 2: Training Resources for Accountants and Analysts
Mind Map 3: Skills Developed Through Training
Practical Example: Applying Training to Real-World Variance Analysis
Scenario: A financial analyst recently completed a budgeting and forecasting course on CFI. Using the skills learned, they:
- Collected actual sales and expense data from the ERP system.
- Calculated variances for each department.
- Conducted root cause analysis to identify why marketing expenses exceeded budget.
- Prepared a clear report with visual charts for senior management.
- Recommended adjustments to the next quarter’s budget based on findings.
This example illustrates how formal training translates into actionable insights and improved financial management.
Summary
Investing in training and certifications equips accountants and financial analysts with the knowledge and tools necessary for effective budget variance analysis. By leveraging professional certifications, online courses, workshops, and internal training, finance professionals can enhance their analytical capabilities, improve reporting accuracy, and contribute more strategically to their organizations.
11.4 Community and Professional Networks for Continuous Learning
In the dynamic fields of accounting and financial analysis, staying updated with the latest trends, tools, and best practices is crucial. Engaging with community and professional networks provides invaluable opportunities for continuous learning, peer support, and career growth. This section explores key networks, how to leverage them effectively, and practical examples of their benefits.
Why Join Professional Networks?
- Access to industry insights and emerging trends.
- Opportunities for mentorship and knowledge sharing.
- Invitations to webinars, workshops, and conferences.
- Platforms for discussing challenges and solutions.
Key Professional Networks and Communities
| Network Name | Description | Example Benefits |
|---|---|---|
| AICPA (American Institute of CPAs) | Leading professional organization for CPAs offering resources, certifications, and events. | Access to CPE courses, technical resources, and advocacy updates. |
| CFA Institute | Global association for financial analysts providing certifications and research. | Networking with analysts worldwide, research publications. |
| LinkedIn Groups | Numerous finance and accounting-focused groups for discussions and job leads. | Peer discussions, job postings, expert Q&A sessions. |
| Finance and Accounting Forums (e.g., Reddit r/Accounting) | Online forums for informal discussion and problem-solving. | Real-time advice, community-driven solutions. |
| Local CPA Societies and Finance Clubs | Regional groups offering localized events and networking. | Face-to-face networking, local market insights. |
How to Leverage These Networks Effectively
- Active Participation: Regularly contribute to discussions, share insights, and ask questions.
- Attend Events: Join webinars, workshops, and conferences to learn and network.
- Mentorship: Seek mentors or become one to foster knowledge exchange.
- Resource Sharing: Share articles, tools, and templates to build community value.
Mind Map: Leveraging Professional Networks
Example: Using LinkedIn Groups for Budget Variance Analysis
Sarah, a financial analyst, joins the “Corporate Finance Professionals” LinkedIn group. She posts a question about best practices for variance analysis in flexible budgets. Within hours, she receives detailed responses, including links to recent articles and templates shared by other members. She also connects with a senior accountant who offers to mentor her.
Mind Map: LinkedIn Group Engagement Example
Example: Local CPA Society for Continuous Learning
John, an accountant, attends monthly meetings of his local CPA society. At one meeting, a guest speaker presents on integrating AI tools into variance analysis. John gains practical insights and later pilots AI-driven variance reports at his firm, improving accuracy and efficiency.
Mind Map: Local CPA Society Benefits
Tips for Maximizing Value from Networks
- Set clear learning goals before joining.
- Schedule regular time to engage with communities.
- Be open to diverse perspectives and constructive feedback.
- Document and apply new knowledge systematically.
By actively participating in professional networks and communities, accountants and financial analysts can continuously sharpen their skills, stay ahead of industry changes, and foster meaningful professional relationships that enhance their careers and organizational impact.
12. Future Trends in Budget Variance Analysis
12.1 Impact of Artificial Intelligence and Automation
Artificial Intelligence (AI) and automation are transforming the landscape of budget variance analysis by enhancing accuracy, efficiency, and predictive capabilities. For accountants and financial analysts, understanding these impacts is crucial to staying competitive and delivering deeper insights.
How AI and Automation Influence Budget Variance Analysis
- Data Processing Speed: AI algorithms can process vast amounts of financial data faster than manual methods, enabling near real-time variance detection.
- Improved Accuracy: Automation reduces human errors in calculations and data entry, ensuring more reliable variance reports.
- Predictive Analytics: AI models can forecast potential variances before they occur, allowing proactive management.
- Anomaly Detection: Machine learning algorithms identify unusual spending patterns or revenue dips that may not be obvious through traditional analysis.
- Scenario Simulation: AI can run multiple budget scenarios quickly, helping analysts understand potential outcomes and risks.
Mind Map: AI and Automation in Budget Variance Analysis
Example 1: Automated Variance Detection in a Retail Company
A retail corporation implemented an AI-powered financial platform that automatically compares actual sales and expenses against budgets daily. The system flags variances exceeding a 5% threshold and categorizes them by department. For example, if the marketing department’s actual spend is 12% over budget, the AI highlights this and suggests potential causes based on historical data, such as increased advertising during a new product launch.
This automation saved the finance team 20 hours per week previously spent on manual variance calculations and allowed faster corrective actions.
Mind Map: Automated Variance Detection Workflow
Example 2: Predictive Variance Analysis in Manufacturing
A manufacturing firm uses machine learning models to predict budget variances based on production schedules, raw material price trends, and historical cost data. For instance, the AI forecasts a 7% unfavorable variance in raw material costs next quarter due to anticipated price hikes. The finance team uses this insight to negotiate better supplier contracts and adjust budgets proactively.
This predictive capability helps the company avoid surprises and maintain tighter control over costs.
Mind Map: Predictive Variance Analysis Process
Best Practices for Leveraging AI and Automation
- Start with Clean Data: Ensure data quality before feeding it into AI systems to maximize accuracy.
- Integrate Systems: Connect AI tools with existing ERP and budgeting software for seamless workflows.
- Train Teams: Equip accountants and analysts with skills to interpret AI-driven insights effectively.
- Maintain Human Oversight: Use AI as a decision-support tool, not a replacement for professional judgment.
- Continuously Update Models: Regularly retrain AI models with new data to adapt to changing business conditions.
Summary
AI and automation are revolutionizing budget variance analysis by enabling faster, more accurate, and predictive insights. By embracing these technologies, finance professionals can enhance their analytical capabilities, reduce manual workload, and support more strategic decision-making within their organizations.
12.2 The Growing Role of Real-Time Data and Cloud Computing
In today’s fast-paced corporate finance environment, the integration of real-time data and cloud computing has revolutionized budget variance analysis. These technologies empower accountants and financial analysts to access up-to-the-minute financial information, enabling quicker decision-making and more accurate forecasting.
Why Real-Time Data Matters in Budget Variance Analysis
Traditional variance analysis often relies on historical data compiled at the end of a reporting period. This lag can delay the identification of unfavorable variances, reducing the ability to respond proactively. Real-time data addresses this by providing continuous updates, allowing finance teams to:
- Detect variances as they occur
- Adjust budgets and forecasts dynamically
- Improve accuracy in financial reporting
Example: A retail company uses real-time sales data integrated with their budget system. When sales drop unexpectedly in a particular region, the finance team immediately notices the unfavorable variance and collaborates with operations to implement corrective actions, minimizing financial impact.
Cloud Computing: The Backbone of Real-Time Financial Insights
Cloud computing offers scalable, accessible, and collaborative platforms that support real-time data processing and analysis. Key benefits include:
- Accessibility: Finance teams can access data anytime, anywhere, facilitating remote work and cross-department collaboration.
- Scalability: Cloud platforms can handle large volumes of data from multiple sources without performance degradation.
- Integration: Easy integration with ERP, CRM, and other financial systems for seamless data flow.
Example: A multinational corporation leverages a cloud-based budgeting tool that consolidates data from subsidiaries worldwide. This enables the central finance team to perform variance analysis in real time, adjusting resource allocation promptly across regions.
Mind Map: Benefits of Real-Time Data and Cloud Computing in Budget Variance Analysis
Implementing Real-Time Data and Cloud Solutions: Best Practices
- Choose the Right Cloud Platform: Evaluate platforms based on security, compliance, and integration capabilities.
- Ensure Data Quality: Implement automated validation to maintain accuracy in real-time feeds.
- Train Finance Teams: Equip accountants and analysts with skills to interpret and act on real-time data.
- Establish Clear Reporting Protocols: Define how and when variance alerts should be communicated.
Example: A financial analyst sets up automated alerts within a cloud budgeting tool to notify the team when expense variances exceed 5%. This proactive approach ensures timely investigation and resolution.
Mind Map: Steps to Integrate Real-Time Data and Cloud Computing
Challenges and Mitigation Strategies
- Data Overload: Real-time data can be overwhelming. Use dashboards and filters to focus on critical variances.
- Security Concerns: Implement robust encryption and access controls to protect sensitive financial data.
- Change Resistance: Engage stakeholders early and demonstrate benefits through pilot programs.
Example: An accounting team initially struggled with the volume of real-time data. By customizing dashboards to highlight key performance indicators and variances, they improved focus and efficiency.
Summary
The growing role of real-time data and cloud computing in budget variance analysis is transforming how finance professionals monitor and manage budgets. By embracing these technologies, accountants and financial analysts can enhance accuracy, responsiveness, and collaboration, ultimately driving better financial performance.
12.3 Emerging Best Practices for Agile Budgeting and Variance Analysis
Agile budgeting and variance analysis are transforming how finance teams respond to rapidly changing business environments. Traditional static budgets are giving way to more dynamic, iterative processes that allow organizations to adapt quickly and make informed decisions. Below, we explore emerging best practices that accountants and financial analysts can adopt to enhance agility in budgeting and variance analysis.
Continuous Forecasting and Rolling Budgets
Best Practice: Move away from annual static budgets toward continuous forecasting and rolling budgets that are updated regularly (monthly or quarterly).
Example: A retail company updates its sales forecasts monthly based on real-time sales data and market trends, allowing it to adjust inventory purchases and marketing spend dynamically.
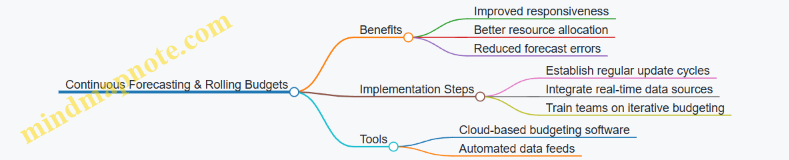
Scenario Planning and What-If Analysis
Best Practice: Incorporate scenario planning and what-if analysis into variance analysis to anticipate multiple outcomes and prepare contingency plans.
Example: A manufacturing firm models the impact of raw material price fluctuations on its budget, enabling it to quickly pivot procurement strategies when prices spike.
Cross-Functional Collaboration
Best Practice: Foster collaboration between finance, operations, sales, and other departments to ensure budgets and variance analyses reflect real operational realities.
Example: A financial analyst works closely with the sales team to understand pipeline changes, adjusting revenue forecasts and variance expectations accordingly.
Leveraging Technology and Automation
Best Practice: Utilize advanced budgeting and variance analysis tools that automate data collection, variance calculations, and reporting to improve speed and accuracy.
Example: An accounting team implements a cloud-based platform that automatically pulls actuals from ERP systems and generates variance reports with visual dashboards.
Driver-Based Budgeting
Best Practice: Build budgets around key business drivers (e.g., sales volume, headcount, production hours) to create more flexible and transparent financial plans.
Example: A software company links its budget to the number of active users and subscription renewals, enabling quick adjustments as customer behavior changes.
Frequent Variance Review Cycles
Best Practice: Conduct variance reviews more frequently (e.g., weekly or bi-weekly) to identify issues early and take corrective actions promptly.
Example: A financial analyst holds bi-weekly variance meetings with department heads to discuss deviations and collaboratively develop action plans.
Summary Example: Agile Budgeting in Action
A mid-sized manufacturing company implemented rolling budgets updated monthly, driver-based budgeting linked to production volume, and scenario planning for raw material costs. They adopted cloud-based tools that automated variance reporting and held bi-weekly cross-functional review meetings. As a result, they reduced budget variances by 15% within one year and improved decision-making speed.
By adopting these emerging best practices, accountants and financial analysts can make budget variance analysis more agile, insightful, and aligned with fast-paced corporate environments.
12.4 Preparing Finance Teams for the Future: Skills and Tools
As the finance landscape evolves rapidly with technological advancements and shifting business dynamics, preparing finance teams for the future is critical. This preparation involves equipping accountants and financial analysts with the right skills and tools to stay competitive, efficient, and insightful.
Key Skills for Future-Ready Finance Teams
-
Data Analytics & Interpretation
- Ability to analyze large datasets to uncover trends and insights.
- Example: Using variance analysis combined with predictive analytics to forecast budget deviations before they occur.
-
Technological Proficiency
- Familiarity with AI, machine learning, cloud-based financial software, and automation tools.
- Example: Automating variance report generation using RPA (Robotic Process Automation) tools.
-
Strategic Thinking & Business Acumen
- Understanding how financial data impacts broader business strategies.
- Example: Advising management on budget adjustments based on market trend analysis.
-
Communication & Visualization Skills
- Presenting complex financial data in clear, actionable formats.
- Example: Creating interactive dashboards that highlight key variances for non-finance stakeholders.
-
Adaptability & Continuous Learning
- Staying current with emerging trends and tools in finance.
- Example: Regularly attending workshops on new budgeting software or AI applications.
Essential Tools for Modern Budget Variance Analysis
-
Cloud-Based Budgeting Platforms (e.g., Adaptive Insights, Anaplan)
- Enable real-time collaboration and dynamic budgeting.
-
Data Visualization Tools (e.g., Tableau, Power BI)
- Transform raw variance data into intuitive charts and dashboards.
-
Automation Software (e.g., UiPath, Automation Anywhere)
- Streamline repetitive tasks like data collection and report generation.
-
Advanced Spreadsheet Functions & Add-ons
- Use of Power Query, Power Pivot, and macros to enhance Excel capabilities.
-
AI & Predictive Analytics Tools
- Tools that forecast budget variances and suggest corrective actions.
Mind Map: Future Skills for Finance Teams
Mind Map: Essential Tools for Budget Variance Analysis
Practical Example: Upskilling a Finance Team
Scenario: A mid-sized corporation wants to enhance its budget variance analysis capabilities to be more proactive and strategic.
Steps Taken:
- Skill Assessment: Identified gaps in data analytics and automation knowledge among team members.
- Training Program: Enrolled team in courses on Power BI and basic machine learning concepts.
- Tool Implementation: Adopted a cloud-based budgeting platform integrated with automation tools to reduce manual data entry.
- Pilot Project: Created a pilot variance dashboard that uses predictive analytics to flag potential budget overruns.
- Feedback & Iteration: Collected user feedback and refined reports for clarity and actionability.
Outcome: The finance team reduced variance reporting time by 40%, improved forecast accuracy, and provided strategic insights that helped avoid a major cost overrun.
Summary
Preparing finance teams for the future involves a balanced focus on developing advanced analytical skills, embracing new technologies, and fostering strategic communication abilities. By investing in continuous learning and adopting modern tools, accountants and financial analysts can transform budget variance analysis from a reactive task into a strategic driver of business success.
13. Summary and Action Plan for Accountants and Financial Analysts
13.1 Recap of Key Concepts and Best Practices
Budget variance analysis is a critical tool for accountants and financial analysts to monitor financial performance, identify discrepancies, and support strategic decision-making. This section revisits the essential concepts and best practices covered throughout the blog, reinforced with clear examples and visual mind maps to enhance understanding.
Key Concepts Recap
- Budget Variance: The difference between budgeted and actual figures, which can be favorable (better than expected) or unfavorable (worse than expected).
- Types of Variances: Revenue variances, cost variances, fixed and variable cost variances, and multi-period variances.
- Root Cause Analysis: Identifying controllable vs. uncontrollable factors driving variances.
- Reporting: Clear communication tailored to stakeholders using visual tools.
- Integration: Using variance insights to adjust forecasts and improve future budgeting.
Mind Map: Core Elements of Budget Variance Analysis
Best Practices Recap with Examples
-
Set Realistic Budgets
- Use historical data and market trends.
- Example: A retail company uses last year’s sales data adjusted for seasonal trends to set a realistic sales budget.
-
Collect Accurate and Relevant Data
- Validate data sources and use technology for real-time tracking.
- Example: A manufacturing firm integrates ERP data to automatically update cost variances daily.
-
Calculate Variances Correctly
- Apply standard formulas consistently.
- Example: Calculating sales variance as (Actual Sales - Budgeted Sales).
-
Perform Root Cause Analysis
- Differentiate controllable from uncontrollable causes.
- Example: An unfavorable labor cost variance traced to overtime due to machine breakdowns (uncontrollable) vs. inefficient scheduling (controllable).
-
Communicate Findings Effectively
- Use dashboards and visual aids.
- Example: Monthly variance reports with bar charts highlighting departments with the largest variances.
-
Use Variance Analysis to Drive Decisions
- Adjust forecasts and budgets dynamically.
- Example: A financial analyst revises the quarterly budget downward after identifying persistent unfavorable variances in raw material costs.
-
Leverage Advanced Techniques When Appropriate
- Incorporate flexible budgeting and predictive analytics.
- Example: Using scenario analysis to predict the impact of raw material price fluctuations on future budgets.
Mind Map: Best Practices Workflow
Final Example: Applying Recap Concepts
Consider a corporate finance team reviewing their quarterly budget variance:
- Step 1: They calculate the revenue variance and find it unfavorable by $50,000.
- Step 2: Root cause analysis reveals the shortfall is due to delayed product launches (uncontrollable) and lower marketing spend effectiveness (controllable).
- Step 3: They prepare a visual report highlighting these variances and share it with marketing and product teams.
- Step 4: Based on insights, they adjust the next quarter’s budget to allocate more funds to marketing campaigns and revise revenue forecasts.
This example encapsulates the entire variance analysis cycle, emphasizing best practices and actionable insights.
By consistently applying these key concepts and best practices, accountants and financial analysts can enhance the accuracy of financial planning, improve organizational transparency, and support data-driven decision-making.
13.2 Step-by-Step Action Plan to Implement Effective Variance Analysis
Implementing an effective budget variance analysis process requires a structured approach. Below is a detailed step-by-step action plan designed specifically for accountants and financial analysts to integrate variance analysis seamlessly into their workflows.
Step 1: Define Clear Budget Objectives and Metrics
- Establish what the budget aims to achieve (e.g., cost control, revenue targets).
- Identify key performance indicators (KPIs) relevant to your department or company.
Example: For a sales department, KPIs might include monthly sales revenue, average deal size, and customer acquisition cost.
Step 2: Develop a Realistic and Detailed Budget
- Use historical data and market trends to create achievable budgets.
- Break down budgets by department, project, or cost center for granularity.
Example: A manufacturing firm budgets raw material costs based on last year’s consumption adjusted for inflation and expected production volume.
Step 3: Establish Data Collection and Validation Processes
- Identify data sources (ERP systems, accounting software, operational reports).
- Set up automated data collection where possible to reduce errors.
- Validate data regularly to ensure accuracy.
Example: Using an automated feed from the accounting system to pull actual expenses weekly.
Step 4: Calculate Variances Accurately
- Use the formula: Variance = Actual - Budgeted.
- Separate variances into favorable and unfavorable.
- Calculate variances at appropriate levels (department, project).
Example: Sales revenue budgeted at $100,000 but actual was $90,000, resulting in an unfavorable variance of $10,000.
Step 5: Analyze Variance Causes
- Perform root cause analysis to understand why variances occurred.
- Categorize causes as controllable (e.g., inefficient processes) or uncontrollable (e.g., market downturn).
Example: A spike in raw material costs due to supplier price increases (uncontrollable), or overtime labor costs due to poor scheduling (controllable).
Step 6: Report Findings Clearly and Effectively
- Use visual aids like charts and dashboards to communicate variances.
- Tailor reports for different audiences (executives, operational managers).
Example: A dashboard showing monthly expense variances with color-coded indicators (green for favorable, red for unfavorable).
Step 7: Take Corrective Actions and Adjust Budgets
- Use insights from variance analysis to adjust forecasts and budgets.
- Implement process improvements or cost controls where needed.
Example: After identifying consistent unfavorable variances in marketing spend, the team revises the budget and optimizes campaign targeting.
Step 8: Establish Continuous Monitoring and Feedback Loops
- Schedule regular variance analysis reviews (monthly, quarterly).
- Encourage feedback from stakeholders to improve the process.
Example: Monthly variance review meetings with department heads to discuss deviations and corrective plans.
Summary Mind Map of the Action Plan

By following this structured action plan, accountants and financial analysts can ensure their budget variance analysis is thorough, actionable, and aligned with corporate financial goals. This approach not only improves financial control but also supports strategic decision-making.
13.3 Tips for Continuous Improvement and Professional Growth
Continuous improvement and professional growth are essential for accountants and financial analysts to stay relevant and excel in budget variance analysis. Here are practical tips, supported by mind maps and examples, to help you develop your skills and enhance your career.
Embrace Lifelong Learning
- Stay Updated: Regularly read industry publications, attend webinars, and participate in workshops.
- Certifications: Pursue relevant certifications such as CPA, CMA, or CFA to deepen your expertise.
- Online Courses: Platforms like Coursera, LinkedIn Learning, and edX offer courses on advanced budgeting and variance analysis.
Example: Sarah, a financial analyst, enrolled in an advanced Excel course to automate variance calculations, reducing her reporting time by 30%.
Develop Analytical and Critical Thinking Skills
- Practice Root Cause Analysis: Always dig deeper into variances to understand underlying causes.
- Scenario Analysis: Use “what-if” scenarios to anticipate future variances.
- Peer Reviews: Collaborate with colleagues to review variance reports and share insights.
Example: John used scenario analysis to predict the impact of raw material price fluctuations on manufacturing variances, enabling proactive budget adjustments.
Leverage Technology and Automation
- Master Financial Software: Become proficient in tools like SAP, Oracle, or Microsoft Dynamics.
- Excel Mastery: Learn advanced Excel functions, pivot tables, and macros.
- Data Visualization: Use Power BI or Tableau to create interactive variance dashboards.
Example: Emily automated variance report generation using Excel macros, freeing up time for deeper analysis.

Enhance Communication Skills
- Simplify Complex Data: Use clear visuals and concise language to explain variances.
- Tailor Messaging: Adapt reports for different audiences (executives, operations, finance teams).
- Feedback Loop: Encourage questions and feedback to improve future reports.
Example: Michael redesigned his variance reports with charts and bullet points, leading to better stakeholder engagement.
Build a Professional Network
- Join Professional Associations: Engage with groups like AICPA, IMA, or local finance clubs.
- Attend Conferences: Network with peers and learn industry best practices.
- Mentorship: Seek mentors and also mentor juniors to exchange knowledge.
Example: Lisa joined a local finance association and gained insights into emerging budgeting trends through monthly meetups.
Set Personal Development Goals
- SMART Goals: Define Specific, Measurable, Achievable, Relevant, and Time-bound goals.
- Track Progress: Use journals or apps to monitor skill development.
- Reflect and Adjust: Regularly review goals and adapt based on new challenges.
Example: David set a goal to reduce variance reporting errors by 50% within six months by implementing double-check protocols.
Summary Mind Map: Continuous Improvement & Professional Growth
By integrating these tips into your daily workflow, you can continuously improve your budget variance analysis capabilities and advance your professional career effectively.
13.4 Final Example: Creating a Personalized Variance Analysis Workflow
Creating a personalized variance analysis workflow is essential for accountants and financial analysts to efficiently identify, understand, and act upon budget variances. This final example will guide you through designing a workflow tailored to your organization’s needs, integrating best practices and practical tools.
Step 1: Define Objectives and Scope
- Determine which departments or projects require variance analysis.
- Set clear goals: Are you focusing on cost control, revenue optimization, or both?
Example: A financial analyst in a manufacturing firm decides to focus on production cost variances and sales revenue variances for the next quarter.
Step 2: Data Collection and Preparation
- Identify data sources (ERP systems, accounting software, spreadsheets).
- Establish data validation steps to ensure accuracy.
- Schedule regular data updates.
Example: Collect monthly actual expenses and revenues from the accounting system and compare them against the approved budget.
Step 3: Variance Calculation
- Use standardized formulas for calculating variances:
- Variance = Actual Amount - Budgeted Amount
- Percentage Variance = (Variance / Budgeted Amount) × 100
Example:
- Budgeted Sales: $500,000
- Actual Sales: $450,000
- Variance: $450,000 - $500,000 = -$50,000 (Unfavorable)
- Percentage Variance: (-50,000 / 500,000) × 100 = -10%
Step 4: Root Cause Analysis
- Categorize variances as controllable or uncontrollable.
- Investigate significant variances to identify underlying causes.
Example: A 10% unfavorable sales variance is traced back to a delayed product launch.
Step 5: Reporting and Communication
- Design clear, concise reports tailored to stakeholders.
- Use visual aids like charts and dashboards.
Example: Prepare a monthly variance report highlighting key variances with color-coded indicators (green for favorable, red for unfavorable).
Step 6: Action Planning and Follow-Up
- Develop corrective actions based on analysis.
- Assign responsibilities and timelines.
- Monitor progress and update forecasts.
Example: Marketing team accelerates promotional campaigns to boost sales; finance updates forecasts accordingly.
Mind Maps for Personalized Variance Analysis Workflow
Mind Map 1: Overview of Workflow Steps
Mind Map 2: Data Collection and Preparation Details
Mind Map 3: Root Cause Analysis Approach
Mind Map 4: Reporting and Communication

Example: Personalized Variance Analysis Workflow in Practice
| Step | Task Description | Tool/Method Used | Example Outcome |
|---|---|---|---|
| Define Objectives & Scope | Focus on sales and production cost variances | Meetings with stakeholders | Clear focus areas identified |
| Data Collection | Extract actual and budget data monthly | ERP system reports | Accurate, timely data available |
| Variance Calculation | Compute variances and percentage differences | Excel formulas | Identified a 10% unfavorable sales variance |
| Root Cause Analysis | Investigate causes of sales variance | Team discussions, data review | Delayed product launch identified as cause |
| Reporting | Prepare monthly variance report with visuals | Power BI dashboard | Report highlights key variances for management |
| Action Planning | Develop corrective marketing actions | Project management tools | Marketing accelerates campaigns, forecasts updated |
By following this personalized workflow, accountants and financial analysts can systematically approach budget variance analysis, ensuring actionable insights and continuous improvement aligned with organizational goals.