Financial Reporting Automation
1. Introduction to Financial Reporting Automation
1.1 Understanding Financial Reporting: Purpose and Challenges
Financial reporting is the process of producing statements that disclose an organization’s financial status to management, investors, regulators, and other stakeholders. It plays a critical role in decision-making, compliance, and transparency.
Purpose of Financial Reporting
- Communication: Provides clear, standardized information about financial performance and position.
- Decision-Making: Helps internal and external stakeholders make informed decisions.
- Compliance: Ensures adherence to accounting standards and regulatory requirements.
- Accountability: Demonstrates management’s stewardship of resources.
- Performance Measurement: Tracks progress against goals and benchmarks.
Common Challenges in Financial Reporting
-
Data Accuracy and Integrity
- Manual data entry errors
- Inconsistent data sources
-
Time-Consuming Processes
- Lengthy consolidation and reconciliation
- Tight reporting deadlines
-
Complex Regulatory Requirements
- Constantly evolving standards
- Multiple jurisdiction compliance
-
Lack of Standardization
- Varied formats and templates
- Disparate systems
-
Limited Visibility and Transparency
- Difficulty in tracking changes
- Poor audit trails
-
Resource Constraints
- Dependence on skilled accountants
- IT infrastructure limitations
Example: Manual Financial Reporting Pitfalls
Consider a mid-sized tech company preparing quarterly financial statements manually:
- Data is pulled from multiple spreadsheets maintained by different departments.
- Consolidation requires manual cross-checking, leading to errors.
- Tight deadlines cause stress and increase the risk of oversight.
- Regulatory updates require last-minute adjustments, complicating the process.
This results in delayed reports, potential compliance risks, and reduced confidence among stakeholders.
Example: How Automation Addresses Challenges
- Automated data integration reduces manual errors by pulling data directly from ERP systems.
- Workflow automation accelerates consolidation and report generation.
- Built-in compliance rules ensure adherence to latest standards.
- Standardized templates improve consistency and auditability.
Understanding these foundational elements sets the stage for exploring how automation can transform financial reporting by addressing these challenges effectively.
1.2 The Evolution of Financial Reporting: From Manual to Automated
Financial reporting has undergone a significant transformation over the past decades, evolving from labor-intensive manual processes to sophisticated automated systems. This evolution has been driven by the increasing complexity of financial data, regulatory demands, and the need for timely and accurate reporting.
Early Days: Manual Financial Reporting
- Process: Accountants manually collected data from ledgers, journals, and spreadsheets.
- Challenges: Time-consuming, error-prone, limited scalability.
- Example: A small business accountant compiling monthly financial statements by hand, cross-checking paper records.
Introduction of Digital Tools
- Process: Use of spreadsheets (e.g., Excel) and basic accounting software.
- Benefits: Improved calculation accuracy, faster data processing.
- Limitations: Still reliant on manual data entry and reconciliation.
- Example: An accountant using Excel templates to generate monthly P&L statements but manually consolidating data from multiple sources.
Emergence of Financial Reporting Automation
- Process: Integration of ERP systems, automation software, and data connectors.
- Capabilities: Automated data extraction, consolidation, validation, and report generation.
- Example: A mid-sized company using an ERP system integrated with a reporting automation tool that pulls data directly, applies business rules, and generates financial statements with minimal human intervention.
Real-World Example: Transition from Manual to Automated Reporting
Scenario: A technology startup initially prepared quarterly financial reports manually using spreadsheets. As the company grew, the finance team faced challenges with data accuracy and report timeliness.
Solution: They implemented an integrated financial reporting automation platform connected to their accounting software and CRM.
Outcome:
- Reduced report preparation time from 5 days to 1 day.
- Eliminated manual data entry errors.
- Enabled real-time financial dashboards for executives.
Summary Mind Map: Evolution Overview
Key Takeaways
- The shift from manual to automated financial reporting improves accuracy, efficiency, and compliance.
- Automation enables finance and IT teams to focus on analysis rather than data gathering.
- Understanding this evolution helps organizations plan their automation journey effectively.
1.3 Key Benefits of Automating Financial Reporting
Automating financial reporting transforms the way organizations handle their financial data, enabling faster, more accurate, and insightful reporting. Below, we explore the key benefits of automation, supported by easy-to-understand examples and mind maps to visualize the advantages.
Increased Accuracy and Reduced Errors
Manual financial reporting is prone to human errors such as data entry mistakes, formula miscalculations, or overlooked adjustments. Automation minimizes these risks by using predefined rules and validations.
Example: A mid-sized company previously spent hours reconciling accounts manually, often encountering discrepancies due to human error. After implementing an automated reporting tool, data is pulled directly from the ERP system, and calculations are performed automatically, reducing errors by 90%.
Time Savings and Faster Reporting Cycles
Automation accelerates the financial close process by eliminating repetitive manual tasks, enabling organizations to produce reports more quickly and focus on analysis rather than data gathering.
Example: An accounting team that used to take 10 days to close monthly books now completes the process in 4 days thanks to automated data consolidation and report generation.
Enhanced Compliance and Audit Readiness
Automated financial reporting systems maintain detailed audit trails and enforce compliance with accounting standards and regulatory requirements, making audits smoother and less time-consuming.
Example: A tech firm implemented automation that logs every data change and approval step, enabling auditors to trace report lineage easily and reducing audit preparation time by 50%.
Improved Data Consistency and Standardization
Automation enforces consistent data formats and reporting templates across departments and periods, improving comparability and reducing confusion.
Example: A multinational company standardized its financial reports across subsidiaries using automation, ensuring all reports adhere to the same format and accounting policies.
Better Decision-Making Through Timely Insights
Automated reporting enables near real-time data updates, allowing finance teams and management to access up-to-date financial information and make informed decisions quickly.
Example: An IT company uses automated dashboards that refresh financial KPIs daily, enabling executives to identify cost overruns early and adjust budgets accordingly.
Cost Reduction and Resource Optimization
By reducing manual labor and minimizing errors, automation lowers operational costs and frees up finance professionals to focus on higher-value activities such as analysis and strategy.
Example: A finance department reduced overtime hours and reliance on external consultants after automating repetitive reporting tasks.
Summary Mind Map: Key Benefits of Financial Reporting Automation
By embracing financial reporting automation, organizations can significantly enhance their reporting quality, speed, and compliance, ultimately driving better business outcomes.
1.4 Overview of Technologies Enabling Automation
Financial reporting automation is powered by a variety of technologies that streamline data collection, processing, validation, and presentation. Understanding these technologies helps accountants and IT specialists select and implement the right tools effectively.
Key Technologies in Financial Reporting Automation
Data Integration Technologies
Description: Data integration tools connect disparate financial systems (ERP, CRM, accounting software) to centralize data for automated reporting.
Examples:
- APIs (Application Programming Interfaces): Enable real-time data exchange. For example, connecting QuickBooks with a reporting platform to automatically pull transactional data.
- ETL (Extract, Transform, Load) Tools: Tools like Talend or Microsoft SSIS extract data from multiple sources, transform it into a consistent format, and load it into a data warehouse.
Best Practice: Use standardized APIs and maintain data mapping documentation to ensure smooth integration.
Robotic Process Automation (RPA)
Description: RPA automates repetitive, rule-based tasks such as data entry, reconciliation, and report generation.
Examples:
- A bot that extracts invoice data from emails and inputs it into the accounting system.
- An RPA workflow that consolidates monthly financial statements from multiple subsidiaries.
Best Practice: Start with simple, high-volume tasks to demonstrate ROI before scaling.
Artificial Intelligence (AI)
Description: AI enhances automation by enabling systems to learn, interpret, and generate insights from data.
Examples:
- Machine Learning: Predicting cash flow trends based on historical data.
- Natural Language Generation (NLG): Automatically creating narrative explanations for financial results, such as “Revenue increased by 12% due to higher sales in Q2.”
- Predictive Analytics: Forecasting budget variances and highlighting potential risks.
Best Practice: Combine AI outputs with human review to ensure accuracy and context.
Cloud Computing
Description: Cloud platforms provide scalable infrastructure and software-as-a-service (SaaS) solutions for financial reporting automation.
Examples:
- Using cloud-based platforms like Oracle NetSuite or Workiva for automated consolidated reporting.
- Storing large datasets securely in cloud data lakes for on-demand analysis.
Best Practice: Leverage cloud elasticity to handle peak reporting periods efficiently.
Blockchain
Description: Blockchain technology offers an immutable ledger, enhancing transparency and trust in financial data.
Examples:
- Recording transactions on a blockchain to create auditable trails.
- Using smart contracts to automate compliance checks and trigger report updates.
Best Practice: Pilot blockchain for specific use cases like audit trails before full-scale adoption.
Data Visualization Tools
Description: Visualization tools transform raw data into interactive dashboards and reports for easier interpretation.
Examples:
- Power BI or Tableau dashboards that update automatically with the latest financial data.
- Interactive reports that allow users to drill down into specific accounts or periods.
Best Practice: Design dashboards focused on key metrics relevant to stakeholders.
Integrated Example: Automating a Monthly Financial Close
Scenario:
- APIs pull transactional data from ERP and banking systems.
- ETL tools consolidate and clean the data.
- RPA bots perform validation checks and flag anomalies.
- AI generates a narrative summary explaining key variances.
- Dashboards update in real-time for management review.
- Automated workflows route reports for approval and distribute them.
This integrated approach reduces manual effort, accelerates closing cycles, and improves accuracy.
In summary, financial reporting automation is a multi-technology ecosystem. Combining data integration, RPA, AI, cloud computing, blockchain, and visualization tools creates a powerful framework that transforms traditional reporting into a streamlined, insightful process.
1.5 Common Misconceptions and Risks in Financial Reporting Automation
Financial reporting automation is transforming the finance and tech sectors by increasing efficiency and accuracy. However, several misconceptions and risks can hinder successful adoption. Understanding these pitfalls helps accountants and IT specialists implement automation effectively.
Common Misconceptions
Misconception 1: Automation Eliminates the Need for Human Oversight
- Many believe automation fully replaces manual review. In reality, human expertise is crucial for interpreting results, handling exceptions, and ensuring compliance.
Misconception 2: Automation is Only for Large Enterprises
- Small and medium-sized businesses can also benefit from automation, especially with scalable cloud-based tools.
Misconception 3: Automation is a One-Time Setup
- Financial reporting automation requires ongoing maintenance, updates, and optimization to adapt to changing regulations and business needs.
Misconception 4: Automation Will Immediately Save Costs
- Initial investments in technology and training may be significant; cost savings typically materialize over time.
Misconception 5: Automation Guarantees 100% Accuracy
- While automation reduces errors, data quality issues or incorrect configurations can still cause inaccuracies.
Risks in Financial Reporting Automation
Risk 1: Data Quality and Integrity Issues
- Poor data input leads to flawed automated reports.
- Example: Automating consolidation with inconsistent chart of accounts causes mismatched figures.
Risk 2: Over-Reliance on Technology
- Ignoring manual checks can allow errors to propagate unnoticed.
Risk 3: Security Vulnerabilities
- Automated systems can be targets for cyberattacks if not properly secured.
Risk 4: Compliance and Regulatory Risks
- Automation tools must be updated to reflect current financial regulations; failure to do so can result in non-compliance.
Risk 5: Resistance to Change
- Staff may resist automation fearing job loss or complexity, impacting adoption and effectiveness.
Mind Maps
Mind Map 1: Common Misconceptions about Financial Reporting Automation
Mind Map 2: Risks in Financial Reporting Automation
Practical Examples
Example 1: Data Quality Impact A mid-sized company automated its monthly financial consolidation. However, inconsistent account naming conventions across subsidiaries led to inaccurate totals. The team implemented a data standardization step before automation, improving accuracy.
Example 2: Human Oversight Necessity An IT specialist configured an automated report generation tool. During a quarterly close, a sudden regulatory change required manual adjustments not yet programmed into the system. Accountants identified and corrected the issue, highlighting the need for ongoing human review.
Example 3: Security Risk Mitigation A finance department adopted cloud-based automation tools but initially neglected multi-factor authentication. After a security audit, they implemented stronger access controls, preventing unauthorized data access.
Summary
Understanding common misconceptions and risks helps organizations approach financial reporting automation with realistic expectations and robust safeguards. Combining automation with human expertise, continuous monitoring, and strong data governance ensures successful, secure, and compliant financial reporting.
2. Preparing for Financial Reporting Automation
2.1 Assessing Current Financial Reporting Processes
Before embarking on financial reporting automation, it is crucial to thoroughly assess your current financial reporting processes. This assessment helps identify inefficiencies, bottlenecks, and areas where automation can add the most value. Below, we break down the key steps and considerations, supported by mind maps and practical examples.
Why Assess Current Processes?
- Understand the existing workflow
- Identify manual and repetitive tasks
- Detect data quality issues
- Recognize integration gaps between systems
- Establish a baseline for measuring automation impact
Step 1: Document the Current Financial Reporting Workflow
Create a detailed map of how financial data flows from source systems to the final report. This includes data collection, validation, consolidation, report generation, review, and distribution.
Mind Map: Current Financial Reporting Workflow
Example:
A mid-sized company collects sales data from three different ERP modules and manually consolidates them in Excel. The finance team then performs manual reconciliations before generating monthly financial statements.
Step 2: Identify Manual and Repetitive Tasks
Pinpoint tasks that consume significant time and are prone to errors.
Mind Map: Manual Tasks in Financial Reporting
Example:
Accountants spend 10 hours monthly reconciling intercompany transactions manually, often discovering discrepancies late in the cycle.
Step 3: Analyze Data Quality and Integrity Issues
Assess the accuracy, completeness, and consistency of data used in reporting.
Mind Map: Data Quality Issues
Example:
A technology firm finds that revenue data from one business unit is often delayed and entered in inconsistent formats, causing delays in report finalization.
Step 4: Evaluate System Integration and Data Flow
Understand how different systems communicate and where manual interventions occur.
Mind Map: System Integration Points
Example:
An IT specialist discovers that the financial reporting tool requires manual uploads of trial balance data from the ERP due to lack of API integration.
Step 5: Gather Stakeholder Feedback
Interview accountants, finance managers, and IT specialists to understand pain points and improvement ideas.
Mind Map: Stakeholder Feedback Themes
Example:
Accountants express frustration over frequent last-minute changes requested by management, which require manual report adjustments.
Step 6: Summarize Findings and Prioritize Automation Opportunities
Create a prioritized list of processes that will benefit most from automation based on impact and feasibility.
Mind Map: Prioritization Criteria
Example:
Automating data consolidation from ERP modules is high impact and moderate effort, making it a prime candidate for initial automation.
Summary
Assessing current financial reporting processes is a foundational step that sets the stage for successful automation. By mapping workflows, identifying manual tasks, analyzing data quality, evaluating system integration, and gathering stakeholder input, organizations can create a clear roadmap for automation that maximizes efficiency and accuracy.
This structured approach ensures that automation initiatives are targeted, measurable, and aligned with organizational goals.
2.2 Identifying Automation Opportunities with Practical Examples
Identifying the right opportunities for automation in financial reporting is crucial for maximizing efficiency and accuracy. This section will guide you through practical methods to pinpoint automation candidates, supported by illustrative examples and mind maps to visualize the process.
Understanding Key Areas for Automation
Financial reporting involves multiple repetitive and rule-based tasks that are ideal for automation. These include data collection, data validation, report generation, consolidation, and compliance checks.
Mind Map: Core Financial Reporting Tasks Suitable for Automation
Step 1: Map Your Current Processes
Begin by documenting your existing financial reporting workflows. Identify repetitive, manual, and time-consuming tasks. For example, if accountants spend hours manually consolidating data from multiple sources, this is a prime candidate for automation.
Example:
Manual Consolidation Challenge: A mid-sized company’s accounting team spends 10 hours weekly consolidating financial data from five subsidiaries, manually converting currencies and eliminating intercompany transactions.
Automation Opportunity: Implementing an automated consolidation tool that pulls data directly from subsidiaries’ ERP systems, applies currency conversion rates, and performs eliminations automatically.
Step 2: Evaluate Data Handling and Reporting Bottlenecks
Look for areas where data errors frequently occur or where report generation is delayed due to manual intervention.
Mind Map: Identifying Bottlenecks
Example:
Data Entry Errors: An IT specialist notices frequent discrepancies in trial balance reports due to manual journal entries.
Automation Opportunity: Deploying automated data validation scripts that flag inconsistencies immediately after data entry, reducing errors before report generation.
Step 3: Prioritize Automation Based on Impact and Feasibility
Use a simple matrix to evaluate tasks based on potential time savings, error reduction, and ease of automation.
Mind Map: Prioritization Matrix Criteria
Example:
High Impact & Easy to Automate: Automating monthly income statement generation using pre-built templates and direct data feeds.
High Impact & Complex to Automate: Automating multi-entity consolidation requiring currency conversion and intercompany eliminations.
Step 4: Explore Practical Automation Examples
Example 1: Automated Data Extraction
Scenario: An accountant manually exports trial balance data from multiple systems.
Automation: Use ETL (Extract, Transform, Load) tools to automatically pull data daily, reducing manual effort and errors.
Example 2: Automated Report Generation and Distribution
Scenario: Monthly financial reports are manually compiled and emailed.
Automation: Implement scheduling tools that generate reports in PDF/Excel and automatically distribute them to stakeholders.
Example 3: Automated Compliance Checks
Scenario: Compliance officers manually verify report adherence to regulatory standards.
Automation: Use rule-based engines that automatically flag non-compliant entries or missing disclosures.
Summary
Identifying automation opportunities requires a clear understanding of your current processes, bottlenecks, and potential impact. By mapping workflows, evaluating pain points, and prioritizing tasks, finance and IT teams can collaboratively target areas where automation delivers the greatest value.
This approach not only improves efficiency but also enhances data accuracy and compliance, setting a strong foundation for successful financial reporting automation.
2.3 Setting Clear Objectives and KPIs for Automation Projects
Setting clear objectives and defining Key Performance Indicators (KPIs) are foundational steps in ensuring the success of financial reporting automation projects. Without well-articulated goals and measurable outcomes, automation initiatives risk misalignment with business needs, wasted resources, and missed opportunities for improvement.
Why Set Clear Objectives?
- Direction & Focus: Objectives provide a roadmap, guiding teams on what to achieve.
- Alignment: Ensures that both finance and IT teams share a common understanding.
- Measurement: Enables tracking progress and assessing success.
Characteristics of Effective Objectives
- Specific: Clearly define what is to be achieved.
- Measurable: Quantifiable to track progress.
- Achievable: Realistic given resources and constraints.
- Relevant: Aligned with organizational goals.
- Time-bound: Set within a clear timeframe.
Common Objectives in Financial Reporting Automation
- Reduce report generation time by 50% within 6 months.
- Eliminate manual data entry errors to achieve 99.9% data accuracy.
- Improve compliance reporting turnaround to meet regulatory deadlines consistently.
- Increase report distribution efficiency by automating delivery to stakeholders.
Mind Map: Setting Clear Objectives
Defining KPIs for Automation Projects
KPIs are quantifiable metrics that reflect the success of your objectives. They help monitor performance and identify areas needing adjustment.
Examples of KPIs in Financial Reporting Automation:
| Objective | KPI | Example Target |
|---|---|---|
| Reduce report generation time | Average report preparation time | From 10 hours to 5 hours |
| Improve data accuracy | Percentage of error-free reports | 99.9% accuracy |
| Enhance compliance | Number of compliance breaches | Zero breaches |
| Automate report distribution | Percentage of reports delivered automatically | 100% automated delivery |
Mind Map: Defining KPIs
Practical Example: Setting Objectives and KPIs for a Mid-Sized Tech Company
Scenario: The finance team struggles with monthly financial close reports taking 12 hours to prepare, with frequent manual errors causing rework.
Objectives:
- Reduce report preparation time from 12 hours to 6 hours within 4 months.
- Achieve 99.8% data accuracy by minimizing manual data entry.
KPIs:
- Average report preparation time (hours).
- Number of data entry errors per report.
Implementation:
- Automate data extraction from ERP.
- Introduce validation rules to catch errors early.
Outcome Measurement:
- Weekly tracking of report preparation time.
- Error logs reviewed monthly.
Tips for Successful Objective and KPI Setting
- Involve both finance and IT teams to ensure objectives are realistic and technically feasible.
- Start with a few critical KPIs to avoid complexity.
- Regularly review and adjust KPIs as the project evolves.
- Communicate objectives and KPIs clearly to all stakeholders.
Summary
Setting clear objectives and KPIs is essential for steering financial reporting automation projects toward success. By defining what success looks like and how it will be measured, organizations can ensure alignment, accountability, and continuous improvement throughout the automation journey.
2.4 Building a Cross-Functional Team: Accountants and IT Specialists Collaboration
Successful financial reporting automation hinges on the seamless collaboration between accountants and IT specialists. Each group brings unique expertise that, when combined, ensures the automation process is both technically sound and aligned with financial regulations and business goals.
Why Cross-Functional Collaboration Matters
- Accountants understand the nuances of financial data, compliance requirements, and reporting standards.
- IT Specialists bring technical skills to design, implement, and maintain automation tools and infrastructure.
Together, they can identify automation opportunities, troubleshoot issues, and optimize workflows.
Key Roles and Responsibilities
Best Practices for Building the Team
-
Define Clear Objectives Together
- Example: Set a shared goal to reduce monthly report generation time by 50%.
-
Establish Open Communication Channels
- Use tools like Slack or Microsoft Teams for real-time collaboration.
-
Create Joint Workflow Maps
- Visualize current processes and identify automation points collaboratively.
-
Schedule Regular Check-ins and Workshops
- Example: Weekly sprint meetings where accountants explain reporting needs and IT updates on development progress.
-
Cross-Train Team Members
- Accountants learn basics of automation tools; IT specialists get familiar with financial terminology.
Example Scenario: Automating Monthly Financial Close
- Step 1: Accountants map out the manual close process, highlighting repetitive tasks.
- Step 2: IT specialists review the process and suggest automation tools (e.g., RPA bots for data extraction).
- Step 3: Both teams collaborate to design an automated workflow, ensuring compliance checkpoints are included.
- Step 4: Pilot the automation, gather feedback, and iterate.
Mind Map: Collaboration Workflow Example
Tips for Overcoming Common Challenges
- Language Barriers: Use shared glossaries to align terminology.
- Different Priorities: Align on business impact to prioritize tasks.
- Resistance to Change: Involve team members early and highlight benefits.
Summary
Building a cross-functional team that integrates accountants’ domain knowledge with IT specialists’ technical expertise is critical for effective financial reporting automation. By fostering communication, defining clear roles, and working collaboratively through each stage of the automation journey, organizations can achieve smoother implementations and better outcomes.
2.5 Data Quality and Integrity: Best Practices Before Automation
Ensuring high data quality and integrity is foundational before embarking on financial reporting automation. Poor data quality can lead to inaccurate reports, compliance risks, and loss of stakeholder trust. This section covers best practices to prepare your data environment effectively.
Why Data Quality and Integrity Matter
- Accurate financial reports depend on clean, consistent, and reliable data.
- Automation amplifies errors if data is flawed, leading to systemic issues.
- Regulatory compliance requires traceability and correctness of financial data.
Key Dimensions of Data Quality
Best Practices for Data Quality and Integrity Before Automation
Conduct a Comprehensive Data Audit
- Example: Review trial balance data for missing or unusual entries before automating report generation.
- Identify gaps, inconsistencies, and anomalies.
- Document data sources and flows.
Standardize Data Definitions and Formats
- Example: Agree on a single chart of accounts and enforce consistent date/time formats.
- Create a data dictionary accessible to all stakeholders.
Cleanse and Enrich Data
- Remove duplicates, correct errors, and fill missing values.
- Example: Use scripts or ETL tools to fix incorrect currency codes before feeding data into automation tools.
Implement Strong Data Governance
- Define roles and responsibilities for data stewardship.
- Establish policies for data entry, modification, and approval.
- Example: Assign a data owner for each financial data set responsible for quality checks.
Automate Data Validation Rules
- Before full automation, implement rule-based checks to flag invalid data.
- Example: Automatically flag transactions exceeding predefined thresholds for manual review.
Ensure Traceability and Audit Trails
- Maintain logs of data changes and approvals.
- Example: Use version control on financial data files and track who made changes and when.
Mind Map: Preparing Data for Automation
Practical Example: Cleaning Financial Data Before Automation
Scenario: A mid-sized company plans to automate monthly financial reporting. Initial data from multiple subsidiaries shows inconsistent account codes and missing transaction dates.
Steps Taken:
- Data Audit: Identified 15% of transactions with missing dates and 10% with non-standard account codes.
- Standardization: Developed a unified chart of accounts and enforced date format YYYY-MM-DD.
- Cleansing: Used an ETL tool to fill missing dates based on transaction logs and corrected account codes using lookup tables.
- Governance: Assigned data stewards in each subsidiary to maintain data quality.
- Validation: Implemented automated checks to flag missing or invalid data before report generation.
Outcome: The company reduced data errors by 90%, enabling smooth automation rollout and accurate financial reports.
Summary
Prior to automating financial reporting, investing time and resources in ensuring data quality and integrity is critical. By auditing, standardizing, cleansing, governing, validating, and maintaining traceability, organizations lay a strong foundation for successful automation that delivers reliable and compliant financial insights.
3. Selecting the Right Tools and Technologies
3.1 Criteria for Choosing Financial Reporting Automation Software
Selecting the right financial reporting automation software is critical to ensure efficiency, accuracy, and compliance in your organization’s financial processes. Below are the key criteria to consider, each illustrated with practical examples and mind maps to help visualize the decision-making process.
Functionality and Features
- The software must support core financial reporting tasks such as data consolidation, report generation, variance analysis, and compliance reporting.
- Look for features like multi-currency support, intercompany eliminations, and customizable report templates.
Example: A mid-sized tech company needed automation software that could handle multi-entity consolidation and generate IFRS-compliant reports. They chose a platform with built-in consolidation and currency translation features, reducing manual adjustments by 70%.
Integration Capabilities
- Seamless integration with existing ERP, accounting, and data warehouse systems is essential.
- Supports APIs, connectors, or native integrations to avoid manual data transfers.
Example: An accounting firm automated reporting by selecting software that integrated directly with their SAP ERP system, enabling real-time data updates and eliminating spreadsheet errors.
User-Friendliness and Accessibility
- The interface should be intuitive for accountants and finance professionals.
- Cloud-based solutions offer accessibility from multiple locations and devices.
Example: A finance team with limited IT support chose a cloud-based tool with drag-and-drop report builders, enabling faster report creation without heavy technical training.
Scalability and Performance
- The software should handle growing data volumes and increasing complexity as the business expands.
- Performance metrics such as report generation speed and system uptime are important.
Example: A fast-growing fintech startup selected a scalable platform that could process large datasets quickly, supporting their rapid reporting cycles and multiple subsidiaries.
Compliance and Security
- Ensure the software supports compliance with relevant financial regulations (e.g., SOX, GDPR, IFRS, GAAP).
- Robust security features like encryption, access controls, and audit trails are mandatory.
Example: A multinational corporation adopted software with built-in audit logs and role-based access controls, helping them pass stringent SOX audits with minimal manual intervention.
Cost and Licensing Model
- Evaluate total cost of ownership including licensing fees, implementation, training, and ongoing support.
- Consider subscription-based vs. perpetual licenses based on budget and flexibility needs.
Example: A small accounting firm opted for a SaaS subscription model to minimize upfront costs and scale usage as their client base grew.
Vendor Support and Community
- Strong vendor support for onboarding, troubleshooting, and updates is vital.
- Active user communities and resources (forums, tutorials) enhance user experience.
Example: An IT specialist praised a vendor’s 24/7 support and extensive online knowledge base, which accelerated their team’s adoption of the automation tool.
Summary Mind Map: Key Criteria for Choosing Financial Reporting Automation Software
By carefully evaluating these criteria with real-world examples and visualizing them through mind maps, finance and IT teams can make informed decisions that align with their organizational goals and technical environment.
3.2 Comparing Popular Automation Platforms with Use Case Examples
When selecting a financial reporting automation platform, understanding the strengths, weaknesses, and ideal use cases of each option is crucial. Below, we compare some of the most popular platforms, integrating practical examples and mind maps to help visualize their application.
Popular Financial Reporting Automation Platforms
| Platform | Key Features | Ideal Use Cases | Pricing Model |
|---|---|---|---|
| BlackLine | Reconciliation automation, task management, compliance tracking | Large enterprises needing robust compliance and reconciliation | Subscription-based |
| Workiva | Cloud-based reporting, collaboration, audit trail | Companies requiring collaborative report creation and SEC filings | Tiered subscription |
| FloQast | Close management, integration with ERP systems | Mid-market companies focused on month-end close efficiency | Subscription-based |
| Oracle Cloud EPM | Comprehensive financial planning and reporting, AI-driven insights | Enterprises seeking integrated EPM and automation | Enterprise licensing |
| Tagetik (Wolters Kluwer) | Financial consolidation, budgeting, regulatory reporting | Organizations needing unified finance and operational reporting | Subscription/License |
Mind Map: Key Features Comparison
Use Case Examples
Example 1: Large Enterprise Automating Account Reconciliations with BlackLine
Scenario: A multinational corporation struggles with manual reconciliations causing delays and errors during month-end close.
Solution: Implementing BlackLine automates reconciliation tasks, assigns ownership, and tracks compliance.
Outcome: Reduced close cycle by 30%, improved accuracy, and enhanced audit readiness.
Example 2: Collaborative SEC Reporting Using Workiva
Scenario: A publicly traded company needs to streamline SEC filings involving multiple departments.
Solution: Workiva’s cloud platform enables real-time collaboration, version control, and audit trails.
Outcome: Faster report generation, reduced errors, and improved transparency.
Example 3: Mid-Market Company Streamlining Month-End Close with FloQast
Scenario: A mid-sized firm faces bottlenecks in consolidating financial data from various ERPs.
Solution: FloQast integrates with existing ERP systems to automate close checklists and status tracking.
Outcome: Close process shortened by 25%, better team coordination.
Mind Map: Use Case Alignment
Additional Considerations
- Integration: Ensure the platform integrates smoothly with your existing ERP and accounting systems.
- Scalability: Choose a platform that can grow with your organization’s complexity.
- User Experience: Platforms with intuitive interfaces reduce training time and increase adoption.
- Support & Community: Strong vendor support and active user communities can ease implementation challenges.
Summary Table: Platform Strengths and Weaknesses
| Platform | Strengths | Weaknesses |
|---|---|---|
| BlackLine | Robust reconciliation, compliance focus | Higher cost, complexity for smaller firms |
| Workiva | Excellent collaboration, cloud-native | Can be expensive, learning curve |
| FloQast | Easy ERP integration, focused on close management | Limited advanced reporting features |
| Oracle Cloud EPM | Comprehensive suite, AI capabilities | Complex implementation, high cost |
| Tagetik | Strong consolidation and budgeting features | Less intuitive UI, requires training |
By carefully evaluating these platforms against your organization’s specific needs and workflows, you can select the best fit to maximize efficiency, accuracy, and compliance in your financial reporting automation journey.
3.3 Integration with Existing ERP and Accounting Systems
Integrating financial reporting automation tools with existing ERP (Enterprise Resource Planning) and accounting systems is a critical step to ensure seamless data flow, accuracy, and efficiency. This integration eliminates manual data entry, reduces errors, and accelerates the reporting process.
Why Integration Matters
- Data Consistency: Ensures that financial data is synchronized across systems, avoiding discrepancies.
- Efficiency: Automates data transfer, reducing time spent on manual reconciliation.
- Real-Time Reporting: Enables up-to-date financial insights by accessing live data.
- Compliance: Maintains audit trails and supports regulatory requirements.
Common Integration Challenges
- Data Format Differences: ERP systems and automation tools may use different data structures.
- Legacy Systems: Older ERP platforms might lack modern APIs.
- Security Concerns: Sensitive financial data requires secure transmission.
- Customization: Tailored ERP setups may need bespoke integration solutions.
Integration Approaches
Best Practices for Integration
Example 1: Integrating Automation Tool with SAP ERP Using APIs
Scenario: A finance team uses SAP ERP for accounting and wants to automate monthly financial reports.
Steps:
- Identify SAP’s API endpoints for financial data extraction.
- Configure the automation tool to connect via REST API using OAuth for secure authentication.
- Map SAP data fields (e.g., GL accounts, cost centers) to the reporting tool’s schema.
- Schedule automated data pulls and report generation.
Outcome: Automated reports are generated with up-to-date SAP data, reducing manual effort by 70%.
Example 2: Using Middleware (ETL) to Connect QuickBooks with Reporting Software
Scenario: A small business uses QuickBooks Online and wants to automate cash flow reports.
Steps:
- Deploy an ETL tool like Talend or Microsoft Power Automate.
- Extract data from QuickBooks via its API.
- Transform data to match reporting requirements (e.g., categorize expenses).
- Load transformed data into the reporting platform.
Outcome: Cash flow reports update automatically daily, improving decision-making speed.
Example 3: File-Based Integration for Legacy ERP Systems
Scenario: A company with an older ERP system that doesn’t support APIs wants to automate quarterly financial statements.
Steps:
- Export financial data as CSV files from the ERP system.
- Use secure SFTP to transfer files to the automation platform.
- Configure the automation tool to parse and import CSV data.
- Automate report generation and distribution.
Outcome: Despite legacy constraints, financial reporting is streamlined, cutting down manual consolidation time.
Summary
Successful integration between financial reporting automation tools and existing ERP/accounting systems requires careful planning, understanding of system capabilities, and adherence to best practices. By leveraging APIs, middleware, or file-based methods, organizations can achieve efficient, accurate, and timely financial reporting.
For accountants and IT specialists, collaboration during integration ensures that both financial accuracy and technical robustness are maintained throughout the automation journey.
3.4 Cloud vs On-Premises Solutions: Pros, Cons, and Practical Considerations
When selecting a financial reporting automation solution, one of the critical decisions is choosing between cloud-based and on-premises deployments. Each approach has distinct advantages and challenges that impact cost, scalability, security, and integration.
Overview
| Aspect | Cloud Solutions | On-Premises Solutions |
|---|---|---|
| Deployment Speed | Rapid deployment, minimal setup | Longer setup, infrastructure required |
| Cost Structure | Subscription-based (OPEX), pay-as-you-go | Capital expenditure (CAPEX), upfront investment |
| Scalability | Highly scalable, flexible resource allocation | Limited by physical hardware |
| Maintenance | Vendor-managed updates and patches | Internal IT team responsible |
| Security | Shared responsibility model, vendor compliance | Full control, but requires in-house expertise |
| Integration | Easier integration with cloud services | May require custom connectors |
Mind Map: Key Factors in Choosing Cloud vs On-Premises
Pros and Cons with Examples
Cloud Solutions
Pros:
- Rapid Deployment: For example, a mid-sized tech company implemented a cloud-based financial reporting tool within two weeks, enabling faster month-end closes.
- Scalability: A fintech startup scaled their reporting system during rapid growth without investing in new hardware.
- Lower Upfront Costs: Subscription pricing allowed a small accounting firm to access advanced automation features without large capital expenditure.
- Automatic Updates: The vendor regularly pushed compliance updates, ensuring reports met the latest regulatory standards.
Cons:
- Data Security Concerns: A financial institution hesitated to adopt cloud automation due to concerns about sensitive data residing off-premises.
- Dependence on Internet Connectivity: During a network outage, an IT services company experienced delays accessing cloud reports.
- Customization Limitations: Some cloud platforms offer less flexibility for highly customized reporting workflows.
On-Premises Solutions
Pros:
- Full Data Control: A multinational bank preferred on-premises deployment to comply with strict data residency regulations.
- Customization: An enterprise software company built tailored automation scripts integrated tightly with legacy systems.
- No Internet Dependency: Financial reports were accessible even during network disruptions.
Cons:
- High Initial Investment: A manufacturing firm spent significant capital on servers and licenses.
- Longer Deployment Time: Setup and configuration took several months.
- Maintenance Burden: The internal IT team had to dedicate resources to patching and upgrades.
Practical Considerations
- Regulatory Compliance:
- Example: GDPR and financial data sovereignty laws may dictate on-premises deployment.
- IT Infrastructure and Expertise:
- Organizations with strong IT teams may prefer on-premises; others benefit from cloud vendor support.
- Budget Constraints:
- Cloud suits organizations wanting predictable operating expenses.
- Business Continuity:
- Cloud providers often guarantee uptime SLAs; on-premises require disaster recovery planning.
- Integration Needs:
- Cloud solutions often integrate easily with SaaS tools; on-premises may better connect with legacy systems.
Mind Map: Decision Criteria for Deployment Model
Summary Example: Choosing the Right Deployment
Scenario: A mid-sized accounting firm wants to automate monthly financial reporting.
-
Cloud Choice: They select a cloud solution due to limited IT staff, need for rapid deployment, and budget constraints. They benefit from automatic updates and scalable resources.
-
On-Premises Choice: A large bank with strict compliance requirements and existing robust IT infrastructure opts for on-premises deployment to maintain full control over data and customization.
In conclusion, the decision between cloud and on-premises financial reporting automation solutions depends on organizational priorities around cost, control, compliance, and scalability. Understanding these trade-offs with real-world examples helps accountants and IT specialists make informed choices aligned with their business goals.
3.5 Security and Compliance Features to Look For
In financial reporting automation, security and compliance are paramount. Automated systems handle sensitive financial data, and any breach or non-compliance can lead to severe financial penalties, reputational damage, and operational disruptions. This section explores the critical security and compliance features that organizations should prioritize when selecting and implementing automation tools.
Key Security Features
-
Access Control and Role-Based Permissions
- Ensure that only authorized personnel can access specific financial data and reporting functions.
- Example: An accountant can generate reports but cannot modify the underlying data, while IT specialists manage system configurations.
-
Data Encryption
- Data should be encrypted both at rest and in transit to prevent unauthorized interception.
- Example: Using AES-256 encryption for stored financial records and TLS for data transfer.
-
Multi-Factor Authentication (MFA)
- Adds an extra layer of security beyond passwords.
- Example: Users must enter a code sent to their mobile device after entering their password.
-
Audit Trails and Logging
- Comprehensive logs of who accessed or modified data, when, and what changes were made.
- Example: An automated report showing all changes to a financial statement with timestamps and user IDs.
-
Regular Security Updates and Patch Management
- Ensures the system is protected against known vulnerabilities.
- Example: Automated notifications and updates from the software vendor.
-
Data Backup and Disaster Recovery
- Automated backups and tested recovery plans to prevent data loss.
- Example: Nightly backups stored securely offsite with automated restoration drills.
Compliance Features
-
Regulatory Compliance Support
- Tools should support compliance with standards such as SOX (Sarbanes-Oxley), GDPR, IFRS, and GAAP.
- Example: Automated validation checks to ensure financial reports meet SOX internal control requirements.
-
Data Retention Policies
- Automated enforcement of data retention and deletion policies as per legal requirements.
- Example: Automatically archiving financial reports for 7 years and deleting outdated drafts.
-
Report Version Control
- Maintaining versions of reports to track changes and ensure auditability.
- Example: Ability to retrieve previous versions of quarterly financial reports during audits.
-
Compliance Reporting and Alerts
- Automated alerts when compliance thresholds are breached or deadlines approach.
- Example: Notification sent to compliance officers if a report is not submitted before the regulatory deadline.
-
User Training and Certification Tracking
- Integration with learning management systems to ensure users are trained on compliance policies.
- Example: Automated reminders for accountants to complete annual SOX compliance training.
Mind Map: Security Features in Financial Reporting Automation
Mind Map: Compliance Features in Financial Reporting Automation
Integrated Example: Implementing Security and Compliance in an Automated Financial Reporting System
Scenario: A mid-sized tech company is implementing a new financial reporting automation platform.
- Access Control: The system is configured so that only senior accountants can approve final reports, while junior accountants can prepare drafts.
- Encryption: All financial data stored in the cloud is encrypted using AES-256, and all data transfers use TLS 1.3.
- Audit Trails: Every change to financial reports is logged with user ID, timestamp, and change description.
- Compliance: The system automatically checks reports against SOX compliance rules before submission.
- Alerts: Compliance officers receive automated notifications if reports are incomplete 48 hours before deadlines.
- Training: The platform integrates with the company’s LMS to track completion of mandatory compliance training.
This cohesive approach ensures that security and compliance are embedded throughout the financial reporting automation lifecycle.
Summary
When selecting financial reporting automation tools, prioritize robust security features such as access control, encryption, MFA, and audit trails. Equally important are compliance capabilities that support regulatory adherence, data retention, version control, and automated alerts. Combining these features with practical implementation strategies safeguards sensitive financial data and ensures trustworthy, compliant reporting.
4. Designing Automated Financial Reporting Workflows
4.1 Mapping Out Financial Reporting Processes for Automation
Mapping out financial reporting processes is a critical first step toward successful automation. It involves understanding every step involved in generating financial reports, identifying repetitive tasks, bottlenecks, and manual interventions that can be automated. This section will guide you through creating detailed process maps and mind maps to visualize workflows clearly, enabling both accountants and IT specialists to collaborate effectively.
Why Map Financial Reporting Processes?
- Clarity: Visualizing the entire reporting process helps uncover hidden inefficiencies.
- Alignment: Ensures finance and IT teams share a common understanding.
- Automation Readiness: Identifies which tasks are suitable for automation.
- Risk Management: Highlights control points and potential risk areas.
Step-by-Step Guide to Mapping Processes
-
Identify Key Reporting Outputs:
- Monthly financial statements
- Quarterly management reports
- Regulatory filings
-
List All Input Data Sources:
- ERP systems
- Spreadsheets
- External data feeds
-
Break Down Each Reporting Task:
- Data extraction
- Data validation
- Data consolidation
- Calculations and adjustments
- Report generation
- Review and approval
-
Document Roles and Responsibilities:
- Who performs each task?
- What systems/tools are used?
-
Identify Pain Points and Manual Steps:
- Manual data entry
- Cross-checking errors
- Time-consuming reconciliations
-
Visualize the Workflow Using Mind Maps and Flowcharts
Mind Map Example: Financial Reporting Process Overview
Detailed Example: Mapping the Monthly Close Process
Practical Tips for Creating Effective Process Maps
- Engage Stakeholders: Include both finance and IT team members to capture technical and business perspectives.
- Use Clear Symbols and Labels: Flowcharts should use standard symbols (e.g., rectangles for tasks, diamonds for decisions).
- Iterate and Refine: Start with high-level maps and progressively add detail.
- Leverage Tools: Use software like Microsoft Visio, Lucidchart, or free tools like Draw.io for professional diagrams.
- Highlight Automation Candidates: Mark repetitive, rule-based tasks that can be automated.
Example: Identifying Automation Opportunities in the Process Map
Summary
Mapping out financial reporting processes provides a foundational blueprint for automation. By visualizing workflows through mind maps and detailed flowcharts, teams can pinpoint automation opportunities, reduce errors, and streamline reporting cycles. This collaborative approach bridges the gap between accountants’ domain expertise and IT specialists’ technical skills, ensuring a smooth transition to automated financial reporting.
4.2 Automating Data Collection and Consolidation: Step-by-Step Example
Automating data collection and consolidation is a critical step in financial reporting automation. It reduces manual errors, saves time, and ensures that data is up-to-date and consistent across reports. In this section, we will walk through a detailed step-by-step example of automating these processes, accompanied by mind maps to visualize the workflow.
Step 1: Identify Data Sources
The first step is to identify all relevant data sources that feed into your financial reports. These might include:
- ERP systems (e.g., SAP, Oracle)
- CRM platforms
- Spreadsheets and CSV files
- Banking and payment systems
- External data feeds (e.g., stock prices, currency rates)
Example: A mid-sized company uses SAP for accounting, Salesforce for sales data, and Excel spreadsheets for manual adjustments.
Step 2: Define Data Extraction Methods
Once sources are identified, decide how to extract data automatically:
- APIs for ERP and CRM systems
- Database queries (SQL)
- Scheduled imports for spreadsheets
- Webhooks or scheduled scripts for external feeds
Example: Use SAP’s API to pull general ledger data daily, Salesforce API for sales figures, and automate Excel import via Power Query.
Step 3: Automate Data Collection
Implement automation tools or scripts to collect data:
- Use RPA bots to log into systems and download reports if APIs are unavailable
- Schedule ETL (Extract, Transform, Load) jobs
- Use integration platforms like Zapier, Microsoft Power Automate, or custom Python scripts
Example: A Python script runs every night to pull data from SAP and Salesforce APIs, then stores it in a centralized database.
Step 4: Data Consolidation and Transformation
After data is collected, it needs to be consolidated and transformed into a unified format:
- Normalize data fields (e.g., date formats, currency)
- Aggregate data by required dimensions (e.g., department, region)
- Handle duplicates and missing values
Example: Consolidate sales data from Salesforce and revenue data from SAP, converting all figures into USD and aggregating monthly totals.
Step 5: Store Consolidated Data in a Central Repository
Store the cleaned and consolidated data in a centralized location for easy access:
- Data warehouses (e.g., Snowflake, Redshift)
- Cloud databases (e.g., Azure SQL, AWS RDS)
- Financial reporting platforms with built-in data storage
Example: The company uses Snowflake as a data warehouse where all consolidated financial data is stored and accessible for reporting.
Step 6: Schedule and Monitor the Automation Process
Set up schedules for data collection and consolidation, and monitor for failures:
- Use cron jobs or task schedulers
- Implement alerting systems for errors
- Maintain logs for audit and troubleshooting
Example: A nightly ETL job runs at 2 AM, with email alerts sent to IT and finance teams if any step fails.
Real-World Example Summary
Scenario: A technology company wants to automate monthly financial reporting by consolidating data from SAP (accounting), Salesforce (sales), and Excel spreadsheets (manual adjustments).
Implementation:
- Identify data sources: SAP, Salesforce, Excel.
- Extract data using SAP and Salesforce APIs; automate Excel import.
- Use Python scripts scheduled nightly to collect data.
- Normalize currency to USD, aggregate sales and revenue by month.
- Store consolidated data in Snowflake.
- Schedule ETL jobs and set up email alerts for failures.
Outcome: Reduced manual data preparation time from 3 days to a few hours, improved data accuracy, and enabled near real-time reporting.
Key Best Practices
- Start small: Automate high-impact data sources first.
- Ensure data quality: Validate data at each step.
- Collaborate: Accountants and IT specialists should work closely.
- Document workflows: Maintain clear documentation for maintenance.
- Monitor continuously: Set up alerts and review logs regularly.
By following these steps and best practices, organizations can successfully automate data collection and consolidation, laying a strong foundation for efficient and accurate financial reporting automation.
4.3 Implementing Automated Calculations and Adjustments
Automated calculations and adjustments form the backbone of financial reporting automation. By embedding calculation logic into reporting workflows, organizations can reduce manual errors, improve accuracy, and accelerate report generation.
Key Concepts in Automated Calculations
- Formula Automation: Embedding accounting formulas directly into the system to perform calculations such as revenue recognition, depreciation, or tax computations.
- Adjustment Entries: Automatically applying adjustments for accruals, deferrals, or corrections based on predefined rules.
- Dynamic Calculations: Calculations that update in real-time as source data changes.
- Validation Checks: Ensuring calculated values meet expected thresholds or business rules.
Mind Map: Core Elements of Automated Calculations and Adjustments
Step-by-Step Example: Automating Depreciation Calculation
Scenario: A company wants to automate monthly depreciation expense calculations for its fixed assets.
-
Define Asset Data Inputs:
- Asset cost
- Useful life (in months or years)
- Salvage value
-
Select Depreciation Method: Straight-line method.
-
Formula: \[ \text{Monthly Depreciation} = \frac{\text{Asset Cost} - \text{Salvage Value}}{\text{Useful Life (months)}} \]
-
Implementation:
- Configure the automation tool to pull asset data from the fixed asset register.
- Embed the formula within the reporting workflow.
- Schedule monthly calculation runs.
-
Adjustment Handling:
- If asset data changes (e.g., asset disposal), the system automatically recalculates depreciation.
-
Validation:
- Set alerts if depreciation exceeds asset cost or if useful life is zero.
Mind Map: Depreciation Automation Workflow
Example: Automating Accrual Adjustments
Scenario: At month-end, the finance team needs to accrue expenses for utilities that have been incurred but not yet invoiced.
Automation Approach:
- Data Source: Historical utility expense data and consumption patterns.
- Calculation: Estimate current month’s utility expense based on prior months’ average.
- Adjustment Entry: Automatically generate an accrual journal entry.
- Review: Automated workflow routes the accrual entry for manager approval.
Benefits:
- Eliminates manual estimation errors.
- Ensures timely and consistent accruals.
Mind Map: Accrual Adjustment Automation
Tips and Best Practices
- Modularize Calculations: Break down complex calculations into smaller, reusable components.
- Use Clear Naming Conventions: For formulas and adjustment rules to improve maintainability.
- Test Extensively: Validate automated calculations with historical data before going live.
- Document Logic: Maintain clear documentation for audit and troubleshooting purposes.
- Incorporate Exception Handling: Automatically flag unusual results for manual review.
Summary
Implementing automated calculations and adjustments streamlines financial reporting by embedding accounting logic directly into workflows. Using real-world examples like depreciation and accruals, organizations can reduce manual effort, increase accuracy, and ensure timely reporting. Mind maps help visualize the components and flow, making it easier for accountants and IT specialists to collaborate on designing robust automation solutions.
4.4 Scheduling and Triggering Reports Automatically
Automating the scheduling and triggering of financial reports is a critical component of financial reporting automation. It ensures timely delivery, reduces manual intervention, and enhances accuracy by minimizing human error. This section explores best practices, practical examples, and mind maps to help accountants and IT specialists design efficient automated report scheduling systems.
Why Automate Scheduling and Triggering?
- Timeliness: Ensure reports are generated and distributed at precise intervals (daily, weekly, monthly, quarterly).
- Consistency: Maintain uniformity in report delivery without relying on manual processes.
- Efficiency: Free up resources by eliminating repetitive manual tasks.
- Compliance: Meet regulatory deadlines automatically.
Key Concepts in Scheduling and Triggering
Mind Map: Scheduling and Triggering Reports Automatically
Best Practices for Scheduling and Triggering
-
Define Clear Scheduling Requirements:
- Identify report frequency based on business needs.
- Example: A monthly financial statement scheduled on the 1st of each month at 7 AM.
-
Use Event-Driven Triggers When Possible:
- Trigger reports after key events, such as data validation completion.
- Example: Automatically generate a cash flow report once the daily bank reconciliation process finishes.
-
Implement Notification Systems:
- Notify stakeholders upon report generation success or failure.
- Example: Send an automated email with the report attached or a link to the dashboard.
-
Incorporate Error Handling and Retry Logic:
- Automatically retry failed report generation.
- Alert IT or finance teams if failures persist.
-
Secure Report Access and Distribution:
- Use role-based access controls.
- Encrypt reports during transmission.
-
Maintain Logs and Audit Trails:
- Track when reports were generated, by whom, and any errors encountered.
Practical Example: Automating Monthly Financial Close Report
Scenario: A finance team wants to automate the generation and distribution of the monthly financial close report immediately after the general ledger is closed.
Steps:
- Trigger: Event-based trigger when the general ledger close process completes.
- Process: Automated system pulls data, runs calculations, and generates the report.
- Distribution: Email the PDF report to CFO, controllers, and auditors.
- Notification: Send confirmation email to finance team.
- Error Handling: If report generation fails, retry up to 3 times; if still unsuccessful, notify IT support.
Mind Map: Monthly Financial Close Report Automation
Tools and Technologies Supporting Scheduling and Triggering
- Workflow Automation Platforms: e.g., Microsoft Power Automate, UiPath
- Scheduling Tools: Cron jobs (Linux), Windows Task Scheduler
- Financial Reporting Software: Many include built-in scheduling (e.g., Oracle Hyperion, SAP BPC)
- Notification Services: SMTP servers for email, Slack or Teams integrations
Additional Example: Daily Sales Report Triggered by Data Upload
Scenario: Sales data is uploaded daily at 8 PM. The system should automatically generate and distribute a sales performance report within 30 minutes of upload.
Implementation:
- Event trigger detects completion of data upload.
- Automated ETL process cleans and consolidates data.
- Report generation module runs.
- Report emailed to sales managers.
Mind Map: Daily Sales Report Automation
Summary
Automating the scheduling and triggering of financial reports streamlines the reporting cycle, enhances accuracy, and ensures compliance with deadlines. By combining fixed schedules with event-driven triggers, incorporating robust notification and error handling mechanisms, and leveraging appropriate tools, finance and IT teams can create resilient, efficient reporting workflows.
Next Steps: In the following section, we will explore how to incorporate review and approval workflows into automated financial reporting to maintain control and accuracy.
4.5 Incorporating Review and Approval Workflows with Automation
Automating the review and approval workflows within financial reporting is critical to ensuring accuracy, compliance, and accountability while significantly reducing manual bottlenecks. This section explores how to design, implement, and optimize these workflows using automation tools, supported by practical examples and mind maps to visualize the process.
Why Automate Review and Approval Workflows?
- Improved Accuracy: Automated workflows reduce human error by enforcing standardized review steps.
- Faster Turnaround: Automated notifications and task assignments speed up the approval cycle.
- Auditability: Digital trails provide transparency and compliance documentation.
- Collaboration: Seamless coordination between accountants, auditors, and IT specialists.
Key Components of Automated Review and Approval Workflows
- Submission: Financial reports or data are submitted into the system.
- Validation: Automated checks for completeness and accuracy.
- Review: Assigned reviewers receive notifications and access reports.
- Feedback: Reviewers can comment or request changes.
- Approval: Final sign-off is captured digitally.
- Escalation: Delays or rejections trigger automated escalation.
Mind Map: Automated Review and Approval Workflow
Practical Example: Automating Monthly Financial Report Approval
Scenario: A mid-sized tech company automates its monthly financial report approval process to reduce delays and improve compliance.
- Submission: The accounting team uploads the consolidated financial report into the automation platform.
- Validation: The system runs automated checks for missing data, incorrect formats, and compliance with accounting standards.
- Review: The CFO and finance controller receive notifications to review the report within 48 hours.
- Feedback: The CFO adds comments requesting clarification on specific line items; the accounting team is automatically notified.
- Approval: After addressing feedback, the CFO digitally signs off the report.
- Escalation: If the CFO does not approve within the timeframe, the system escalates the task to the CEO.
This automated workflow reduced the approval cycle from 7 days to 3 days and improved audit readiness.
Best Practices for Implementing Automated Review and Approval Workflows
- Define Clear Roles and Responsibilities: Map out who reviews and approves each report.
- Set Timeframes and SLAs: Automate reminders and escalations to keep the process on track.
- Enable Collaborative Feedback: Use platforms that allow inline comments and version tracking.
- Ensure Security and Access Controls: Protect sensitive financial data with role-based permissions.
- Maintain Audit Trails: Capture timestamps, user actions, and approval history for compliance.
Mind Map: Best Practices for Review and Approval Automation
Tools and Technologies Supporting Automated Review and Approval
- Workflow Automation Platforms: e.g., Microsoft Power Automate, Nintex
- Financial Reporting Software with Built-in Approvals: e.g., Workiva, BlackLine
- Document Management Systems: e.g., SharePoint, Google Workspace
- Digital Signature Solutions: e.g., DocuSign, Adobe Sign
Example: Using Microsoft Power Automate to Build Approval Workflow
- Step 1: Trigger workflow when a report file is uploaded to SharePoint.
- Step 2: Run validation scripts to check data integrity.
- Step 3: Send approval request emails to designated reviewers.
- Step 4: Collect feedback via Microsoft Teams or email.
- Step 5: Upon approval, automatically archive the report and notify stakeholders.
- Step 6: If rejected or delayed, escalate to higher management.
This low-code approach enables IT specialists to collaborate closely with accountants to tailor workflows without extensive development.
Incorporating review and approval workflows with automation not only streamlines financial reporting but also enhances governance and transparency, making it an indispensable practice for modern finance and tech teams.
5. Data Management and Validation in Automation
5.1 Establishing Data Governance Policies
Effective data governance is the cornerstone of successful financial reporting automation. It ensures data accuracy, consistency, security, and compliance throughout the reporting lifecycle. This section explores how to establish robust data governance policies tailored for automated financial reporting systems.
What is Data Governance?
Data governance refers to the framework of rules, processes, and standards that manage the availability, usability, integrity, and security of data used in an organization. In financial reporting automation, it guarantees that the data feeding automated reports is reliable and compliant with regulatory standards.
Key Components of Data Governance Policies
Step-by-Step Guide to Establish Data Governance Policies
-
Define Data Ownership and Accountability
- Assign clear roles such as Data Owners (usually finance leads) and Data Stewards (IT specialists or analysts) responsible for data quality and security.
- Example: The CFO is the Data Owner for financial data, while the IT team acts as Data Stewards managing data infrastructure.
-
Develop Data Quality Standards
- Establish criteria for data accuracy, completeness, timeliness, and consistency.
- Example: All transactional data must be validated against source systems before being used in reports.
-
Implement Data Security and Privacy Controls
- Define access levels, encryption standards, and compliance with regulations like GDPR or SOX.
- Example: Only authorized accountants can access sensitive payroll data, enforced through role-based access control (RBAC).
-
Create Data Handling and Validation Procedures
- Document how data is collected, processed, and validated within automated workflows.
- Example: Automated scripts check for missing values or anomalies daily and flag exceptions for review.
-
Establish Monitoring and Audit Mechanisms
- Use tools to continuously monitor data quality and maintain audit trails.
- Example: An automated dashboard tracks data validation errors and generates alerts for the finance team.
-
Provide Training and Documentation
- Ensure all stakeholders understand governance policies through regular training and accessible documentation.
- Example: Quarterly workshops for accountants and IT specialists on data governance best practices.
Mind Map: Roles and Responsibilities in Data Governance
Example Scenario: Implementing Data Governance in Automated Financial Reporting
Context: A mid-sized tech company is automating its monthly financial close process.
- Challenge: Inconsistent data from multiple ERP systems causing inaccurate reports.
- Governance Action:
- Assign Data Owners for each ERP system.
- Define data quality rules such as mandatory fields and format standards.
- Implement automated validation scripts that reconcile data across systems.
- Restrict data access to authorized personnel only.
- Maintain audit logs for every data modification.
- Outcome: Improved data consistency, reduced manual errors, and faster report generation.
Summary
Establishing comprehensive data governance policies is essential for the integrity and success of financial reporting automation. By clearly defining roles, standards, and processes — supported by appropriate tools and continuous monitoring — organizations can ensure their automated reports are accurate, secure, and compliant.
Further Reading & Resources
- DAMA-DMBOK Guide: Data Management Body of Knowledge
- COSO Framework for Internal Controls
- GDPR Compliance Guidelines for Financial Data
5.2 Automating Data Validation Checks: Practical Examples
Automating data validation checks is a critical step in ensuring the accuracy, consistency, and reliability of financial reports. Manual validation is time-consuming and prone to human error, whereas automation accelerates the process and improves data integrity. In this section, we will explore practical examples of automating data validation checks and illustrate these concepts with mind maps to help visualize the workflows.
Why Automate Data Validation?
- Speed: Automated checks run faster than manual reviews.
- Consistency: Rules are applied uniformly across datasets.
- Error Reduction: Minimizes human oversight and mistakes.
- Auditability: Automated logs provide traceability.
Common Types of Data Validation Checks in Financial Reporting
- Format Validation: Ensuring data conforms to expected formats (e.g., dates, currency).
- Range Checks: Verifying values fall within acceptable limits.
- Completeness Checks: Confirming all required fields are populated.
- Cross-Field Validation: Comparing related fields for logical consistency.
- Duplicate Detection: Identifying repeated entries.
- Referential Integrity: Ensuring relationships between datasets are valid.
Mind Map: Automated Data Validation Checks Workflow
Practical Example 1: Automating Format and Range Checks in Excel with VBA
Scenario: A finance team receives monthly transaction data in Excel. They want to automate validation to check that all dates are in YYYY-MM-DD format and amounts are within a reasonable range.
Automation Approach:
- Use VBA macros to loop through rows.
- Validate date format using regular expressions.
- Check amount fields to ensure they are between $0 and $1,000,000.
- Highlight invalid cells and generate a summary report.
Sample VBA Pseudocode:
For Each row In DataRange
  If Not IsDateFormatCorrect(row.Date) Then
    HighlightCell(row.Date)
  End If
  If row.Amount < 0 Or row.Amount > 1000000 Then
    HighlightCell(row.Amount)
  End If
Next row
GenerateSummaryReport()
Practical Example 2: Using Python and Pandas for Cross-Field and Duplicate Checks
Scenario: An IT specialist automates validation for a financial dataset stored in CSV files. They want to check that debit and credit columns balance out and detect duplicate transaction IDs.
Automation Approach:
- Load data using Pandas.
- Verify that sum of debit equals sum of credit.
- Identify duplicate transaction IDs.
- Export validation results to a separate report.
Sample Python Code:
import pandas as pd

data = pd.read_csv('transactions.csv')

# Cross-field validation
if data['Debit'].sum() != data['Credit'].sum():
    print('Warning: Debits and Credits do not balance!')

# Duplicate detection
duplicates = data[data.duplicated(subset=['TransactionID'], keep=False)]
if not duplicates.empty:
    print('Duplicate Transaction IDs found:')
    print(duplicates)

# Export validation report
validation_report = pd.DataFrame({
    'Issue': ['Debit/Credit imbalance', 'Duplicate Transaction IDs'],
    'Status': [data['Debit'].sum() == data['Credit'].sum(), duplicates.empty]
})
validation_report.to_csv('validation_report.csv', index=False)
Practical Example 3: Implementing Completeness and Referential Integrity Checks in ERP Systems
Scenario: An organization uses an ERP system to generate financial reports. They want to automate checks ensuring all invoices have associated customer IDs and that no mandatory fields are missing.
Automation Approach:
- Configure ERP validation rules to flag missing customer IDs.
- Use workflow automation to prevent report generation if mandatory fields are incomplete.
- Set up alerts for missing data.
Example Workflow Mind Map:
Best Practices for Automating Data Validation Checks
- Define Clear Validation Rules: Collaborate between accountants and IT specialists to define precise rules.
- Use Layered Validation: Combine multiple types of checks for robust validation.
- Maintain Audit Trails: Log all validation results for compliance and troubleshooting.
- Automate Alerts and Reporting: Ensure stakeholders are notified promptly of issues.
- Test and Iterate: Continuously refine validation logic based on feedback and data changes.
By integrating these practical examples and mind maps, finance and IT teams can collaboratively design and implement effective automated data validation checks, significantly enhancing the reliability of financial reporting automation.
5.3 Handling Exceptions and Anomalies in Automated Reports
Automated financial reporting systems significantly reduce manual errors and improve efficiency, but they are not immune to exceptions and anomalies. Handling these irregularities effectively is crucial to maintain the integrity, accuracy, and trustworthiness of financial reports.
Understanding Exceptions and Anomalies
- Exceptions: These are deviations from expected processes or data values that violate predefined rules or thresholds.
- Anomalies: Unusual or unexpected data points that may indicate errors, fraud, or system malfunctions.
Example: A sudden spike in expense claims during a month that is inconsistent with historical data.
Why Handling Exceptions Matters
- Prevents propagation of errors into final reports.
- Ensures compliance with regulatory standards.
- Maintains stakeholder confidence.
- Enables timely corrective actions.
Mind Map: Handling Exceptions and Anomalies in Automated Reports
Detection Techniques
-
Rule-Based Alerts: Define thresholds or conditions that trigger alerts.
- Example: Flagging transactions exceeding $10,000 without prior approval.
-
Statistical Analysis: Use statistical methods like standard deviation or z-scores to identify outliers.
- Example: Identifying revenue entries that deviate by more than 3 standard deviations from the monthly average.
-
Machine Learning Models: Employ anomaly detection algorithms that learn normal patterns and flag deviations.
- Example: Using clustering algorithms to detect unusual vendor payments.
Classification and Prioritization
- False Positives: Alerts triggered by normal variations; require filtering to avoid alert fatigue.
- Genuine Errors: Data entry mistakes, system glitches needing correction.
- Fraud Indicators: Suspicious patterns requiring investigation.
Example: An automated system flags a duplicate invoice submission. This is a genuine error requiring manual review.
Resolution Strategies
-
Automated Corrections: For predictable and low-risk exceptions.
- Example: Automatically correcting date format inconsistencies.
-
Manual Review: Exceptions that require human judgment.
- Example: Investigating unusual vendor payments flagged by the system.
-
Escalation Procedures: Routing critical anomalies to senior management or compliance teams.
- Example: Escalating potential fraud cases immediately for investigation.
Documentation and Audit Trails
Maintaining detailed logs of exceptions, actions taken, and resolutions is essential for transparency and audits.
- Timestamped records
- User actions and comments
- Status updates
Example: A system-generated exception log showing a flagged transaction, the reviewer’s notes, and final disposition.
Continuous Improvement
- Use feedback from resolved exceptions to refine detection rules.
- Regularly update machine learning models with new data.
- Train staff on emerging anomaly patterns.
Example: After identifying recurring false positives related to currency conversions, update rules to accommodate exchange rate fluctuations.
Integrated Example Scenario
Imagine an automated financial reporting system that detects an unusually high expense claim from a department.
- Detection: Rule-based alert triggers because the claim exceeds the monthly average by 200%.
- Classification: System flags it as a potential anomaly.
- Resolution: The claim is routed to the finance team for manual review.
- Documentation: All steps are logged with timestamps and reviewer comments.
- Improvement: After investigation, the system updates thresholds to better reflect seasonal expense variations.
By embedding robust exception and anomaly handling mechanisms, organizations can ensure their automated financial reports remain accurate, reliable, and compliant.
5.4 Ensuring Audit Trails and Traceability
Introduction
In financial reporting automation, ensuring robust audit trails and traceability is critical for maintaining transparency, accountability, and compliance. An audit trail is a chronological record that provides documentary evidence of the sequence of activities that have affected a specific operation, procedure, or event. Traceability refers to the ability to track and verify the history, application, or location of an item or data throughout its lifecycle.
Why Audit Trails and Traceability Matter
- Regulatory Compliance: Many financial regulations (e.g., SOX, GDPR, IFRS) require detailed audit trails.
- Error Detection: Helps identify where and when errors or discrepancies occurred.
- Fraud Prevention: Deters fraudulent activities by maintaining transparent records.
- Accountability: Assigns responsibility to specific users or systems for changes.
- Data Integrity: Ensures that financial data remains accurate and unaltered.
Key Components of Effective Audit Trails
Best Practices for Implementing Audit Trails and Traceability
-
User Identification and Authentication
- Every action in the financial reporting system must be linked to a unique user ID.
- Example: When an accountant updates a ledger entry, the system logs “User: JaneDoe” along with the change.
-
Timestamping Every Action
- Record the exact date and time of every transaction or modification.
- Example: A report generated on “2024-06-15 14:23:10” is logged to show when it was created.
-
Detailed Change Logs
- Capture what was changed, including before and after values.
- Example: Changing an account balance from $10,000 to $12,000 is logged with both values.
-
Immutable Logs
- Audit trails should be tamper-proof; use write-once-read-many (WORM) storage or blockchain.
- Example: A blockchain ledger records all transactions, making retroactive changes impossible.
-
Access and Approval Tracking
- Log who accessed reports and who approved changes.
- Example: An automated workflow logs that “Manager JohnSmith approved the Q1 report on 2024-04-10”.
-
Regular Review and Monitoring
- Periodically audit the audit trails themselves to detect anomalies.
- Example: IT specialists run scripts weekly to identify unusual access patterns.
Example Scenario: Automated Financial Report Update
Tools and Technologies Supporting Audit Trails
- ERP Systems: Most ERP platforms (e.g., SAP, Oracle) have built-in audit trail features.
- Version Control Systems: Track changes in report templates or scripts.
- Blockchain: Provides decentralized, immutable audit logs.
- RPA Tools: Robotic Process Automation bots can log every automated step.
- SIEM Systems: Security Information and Event Management tools monitor access and changes.
Mind Map: Audit Trail Lifecycle
Summary
Ensuring audit trails and traceability within financial reporting automation is not just a regulatory checkbox but a foundational practice that enhances trust, accuracy, and operational efficiency. By implementing detailed, immutable, and well-monitored audit logs, finance and IT teams can safeguard their automated reporting processes against errors, fraud, and compliance risks.
Additional Example: Traceability in Action
Imagine a situation where a quarterly financial report shows unexpected revenue growth. Using audit trails, the finance team traces the change back to a manual adjustment made by an accountant correcting a previously missed sales entry. The audit log shows who made the change, when, and why, providing full transparency and enabling quick resolution.
This example illustrates how traceability supports both operational clarity and regulatory compliance.
5.5 Leveraging AI and Machine Learning for Data Accuracy
In the realm of financial reporting automation, ensuring data accuracy is paramount. AI (Artificial Intelligence) and Machine Learning (ML) technologies have emerged as powerful allies in enhancing the precision, consistency, and reliability of financial data. This section explores how AI and ML can be integrated into financial reporting workflows to detect errors, predict anomalies, and improve overall data quality.
Understanding AI and ML in Financial Reporting
- Artificial Intelligence (AI): Systems designed to perform tasks that typically require human intelligence, such as pattern recognition and decision-making.
- Machine Learning (ML): A subset of AI where systems learn from data to improve performance over time without explicit programming.
Key Applications of AI and ML for Data Accuracy
- Anomaly Detection: Identifying unusual transactions or data points that deviate from expected patterns.
- Data Cleansing: Automatically correcting or flagging inconsistent or incomplete data.
- Predictive Validation: Forecasting expected values and comparing them with actual data to spot discrepancies.
- Natural Language Processing (NLP): Extracting and validating financial information from unstructured sources like invoices or contracts.
Mind Map: AI and ML Techniques for Data Accuracy
Example 1: Anomaly Detection in Expense Reporting
A finance team implements an ML model trained on historical expense data to detect anomalies such as unusually high amounts or suspicious vendor patterns. When the system flags an expense report, it triggers an automatic review, reducing errors and potential fraud.
Example 2: Automated Data Cleansing in Accounts Payable
Using AI-powered tools, an organization automates the identification of duplicate invoices and missing fields. The system suggests corrections or requests additional information, ensuring the accuracy of payable records before they enter the financial reports.
Mind Map: Workflow Integration of AI for Data Accuracy
Example 3: Predictive Validation for Revenue Recognition
An ML model forecasts expected monthly revenue based on historical trends and market indicators. The finance team compares actual revenue figures against predictions to quickly identify and investigate discrepancies, enhancing the reliability of revenue reporting.
Best Practices for Leveraging AI and ML
- Start with Clean Historical Data: AI models require quality data to learn effectively.
- Continuous Model Training: Regularly update models with new data to maintain accuracy.
- Human-in-the-Loop: Combine AI insights with expert review to validate flagged issues.
- Transparency: Use explainable AI techniques to understand model decisions.
- Integration with Existing Systems: Seamlessly embed AI tools into current workflows to avoid disruption.
Summary
Leveraging AI and Machine Learning in financial reporting automation significantly enhances data accuracy by proactively identifying errors, automating corrections, and providing predictive insights. By thoughtfully integrating these technologies, finance and IT professionals can build more reliable, efficient, and trustworthy reporting processes.
6. Best Practices for Implementing Financial Reporting Automation
6.1 Phased Implementation Approach with Real-World Case Study
Implementing financial reporting automation can be a complex undertaking, especially in organizations with legacy systems and diverse stakeholder groups. A phased implementation approach breaks down the project into manageable stages, reducing risk and ensuring continuous improvement.
Why Choose a Phased Implementation?
- Risk Mitigation: Smaller, controlled deployments help identify issues early.
- User Adoption: Gradual changes allow users to adapt and provide feedback.
- Resource Management: Spreads workload and budget over time.
- Continuous Improvement: Each phase can build on lessons learned.
Typical Phases in Financial Reporting Automation
Phase 1: Assessment & Planning
- Example: A mid-sized tech company starts by documenting their current monthly financial close process. They identify repetitive manual tasks such as data consolidation from multiple sources.
- Best Practice: Engage both accountants and IT specialists early to map out pain points and automation opportunities.
Phase 2: Pilot Deployment
- Example: The company automates the consolidation of trial balance data from three main systems using an RPA tool. This pilot covers only the finance department’s reporting for one business unit.
- Best Practice: Keep the pilot scope limited to minimize disruption and gather actionable feedback.
Phase 3: Full Rollout
- Example: After successful pilot validation, automation is expanded to include all business units and integrates with the ERP system for real-time data access.
- Best Practice: Provide comprehensive training sessions and establish a helpdesk for user support.
Phase 4: Optimization & Monitoring
- Example: The company sets up dashboards to monitor report generation times and error rates, adjusting workflows based on user feedback.
- Best Practice: Schedule regular review meetings between finance and IT teams to continuously improve the automation.
Real-World Case Study: FinTech Solutions Inc.
Background: FinTech Solutions Inc., a growing financial software provider, struggled with monthly reporting delays due to manual data aggregation from disparate systems.
Implementation:
- Phase 1: Conducted workshops with finance and IT to map processes and select an automation platform.
- Phase 2: Piloted automation on revenue recognition reports, reducing manual effort by 60%.
- Phase 3: Rolled out automation across all financial reports, integrating with their cloud ERP.
- Phase 4: Established KPIs such as report accuracy and turnaround time, achieving a 40% faster close cycle.
Outcome: The phased approach allowed FinTech Solutions to minimize disruption, build user confidence, and realize measurable efficiency gains.
Summary
A phased implementation approach to financial reporting automation balances risk, resource allocation, and user adoption. By starting small and scaling thoughtfully, organizations can achieve sustainable automation success.
Additional Mind Map: Stakeholder Roles in Phased Implementation
This structured approach, supported by clear roles and real-world examples, ensures that financial reporting automation delivers value efficiently and effectively.
6.2 Change Management Strategies for Finance and IT Teams
Implementing financial reporting automation requires not only technical adjustments but also significant organizational change. Effective change management ensures that both Finance and IT teams align, adapt, and thrive during the transition. Below is a comprehensive guide to change management strategies tailored for these teams, enriched with practical examples and mind maps to visualize key concepts.
Understanding the Need for Change Management
Automation impacts workflows, roles, and responsibilities. Resistance can arise from uncertainty, fear of job loss, or unfamiliarity with new tools. Change management helps mitigate these risks by fostering communication, training, and involvement.
Key Change Management Strategies
Establish Clear Vision and Objectives
- Define why automation is needed.
- Communicate benefits clearly to both Finance and IT.
Example: A mid-sized tech company implemented automation to reduce month-end closing time by 50%. Communicating this goal helped teams focus on the shared objective.
Engage Stakeholders Early and Often
- Identify key stakeholders in Finance and IT.
- Involve them in planning and decision-making.
Example: An accounting firm created a cross-functional steering committee including senior accountants and IT leads to guide the automation rollout.
Develop a Communication Plan
- Use multiple channels: emails, meetings, intranet.
- Share progress updates and success stories.
Example: Weekly newsletters highlighting milestones and user testimonials helped maintain momentum in a financial services company.
Provide Comprehensive Training and Support
- Tailor training sessions for different user groups.
- Offer hands-on workshops and Q&A sessions.
Example: An IT specialist team developed interactive tutorials for accountants unfamiliar with the new reporting software.
Manage Resistance Proactively
- Listen to concerns and feedback.
- Address fears about job security by emphasizing role evolution.
Example: In a banking institution, leadership held open forums to discuss automation impact, alleviating anxiety among staff.
Implement Incrementally with Pilot Programs
- Start with small-scale pilots.
- Use feedback to refine processes before full deployment.
Example: A global finance firm piloted automation on a single reporting module before expanding.
Monitor, Measure, and Adapt
- Track KPIs related to adoption and performance.
- Adjust change strategies based on data.
Example: Post-implementation surveys and system usage analytics informed ongoing training needs.
Mind Map: Change Management Strategies
Mind Map: Stakeholder Engagement Process
Practical Example: Cross-Functional Collaboration
Scenario: A software company planned to automate its quarterly financial reporting.
Approach:
- Formed a joint task force with senior accountants and IT specialists.
- Conducted joint workshops to map existing processes.
- IT specialists demonstrated automation capabilities; accountants provided domain knowledge.
- Developed a phased rollout plan with pilot testing.
Outcome:
- Reduced misunderstandings between teams.
- Accelerated adoption due to shared ownership.
Tips for Successful Change Management
- Empathy: Understand the human side of change.
- Transparency: Be honest about challenges and timelines.
- Recognition: Celebrate small wins to motivate teams.
- Flexibility: Be ready to pivot strategies based on feedback.
By integrating these change management strategies, Finance and IT teams can collaboratively navigate the complexities of financial reporting automation, ensuring a smoother transition and maximizing the benefits of the new system.
6.3 Training and Skill Development for End Users
Effective training and skill development are critical to the successful adoption of financial reporting automation tools. End users, primarily accountants and IT specialists, must be equipped not only with technical know-how but also with an understanding of how automation transforms their workflows. This section explores best practices, training strategies, and practical examples to empower users and maximize automation benefits.
Why Training Matters
- Ensures smooth transition from manual to automated processes
- Reduces resistance and builds user confidence
- Minimizes errors caused by misuse or misunderstanding
- Enhances collaboration between finance and IT teams
Key Training Objectives
- Familiarize users with automation software interfaces and features
- Teach data input standards and validation techniques
- Explain automated workflow triggers and exception handling
- Develop troubleshooting and basic maintenance skills
- Promote understanding of compliance and security protocols
Training Approaches
Mind Map: Training Approaches for Financial Reporting Automation
Example: Step-by-Step Training Plan for Accountants
- Introduction Session: Overview of automation benefits and objectives.
- Software Walkthrough: Demonstrate key features such as report generation, data validation, and error alerts.
- Hands-On Practice: Users create sample reports using test data.
- Scenario-Based Exercises: Handling exceptions like missing data or validation failures.
- Q&A and Feedback: Address concerns and gather input for improvement.
- Follow-Up Support: Provide access to helpdesk and online resources.
Skill Development Focus Areas
Mind Map: Essential Skills for End Users
Practical Example: Training IT Specialists
- Focus on integration points between automation tools and ERP systems.
- Teach scripting or configuration for workflow customization.
- Provide exercises on monitoring system performance and error logs.
- Encourage collaboration sessions with finance teams to understand reporting needs.
Measuring Training Effectiveness
- Pre- and post-training assessments
- Monitoring error rates in automated reports
- User feedback surveys
- Tracking adoption rates and usage frequency
Summary
Training and skill development are ongoing processes that require a well-structured approach combining multiple learning methods. By investing in comprehensive training programs tailored to both accountants and IT specialists, organizations can ensure a successful transition to automated financial reporting, reduce operational risks, and unlock the full potential of automation technologies.
6.4 Continuous Monitoring and Optimization of Automated Processes
Continuous monitoring and optimization are critical to maintaining the effectiveness, accuracy, and efficiency of financial reporting automation. Without ongoing oversight, automated processes can degrade due to changing data inputs, evolving business requirements, or software updates. This section explores best practices, practical examples, and mind maps to help accountants and IT specialists ensure their automation workflows remain robust and deliver maximum value.
Why Continuous Monitoring Matters
- Detect anomalies early: Automated processes can sometimes produce errors due to unexpected data or system glitches.
- Maintain data integrity: Ensures that financial data remains accurate and consistent over time.
- Adapt to changes: Business rules, regulatory requirements, and data sources evolve, requiring updates to automation.
- Optimize performance: Identify bottlenecks or inefficiencies to improve processing speed and resource use.
Key Components of Continuous Monitoring
Practical Example: Monitoring Automated Consolidation
Scenario: A company uses automation to consolidate financial data from multiple subsidiaries monthly.
Monitoring Steps:
- Data Validation: Automated scripts check for missing or inconsistent entries before consolidation.
- Performance Tracking: Measure time taken for consolidation each month; flag if it exceeds thresholds.
- Error Logging: Capture and categorize errors (e.g., data format issues, connectivity failures).
- User Alerts: Notify finance team immediately if anomalies or failures occur.
- Review Meetings: Monthly review of monitoring reports to identify trends and improvement areas.
Outcome: Early detection of a data feed issue from one subsidiary prevented inaccurate consolidated reports.
Optimization Strategies
- Automated Alerts and Dashboards: Use real-time dashboards to visualize key metrics and set up alerts for deviations.
- Regular Process Audits: Schedule quarterly audits to review automation logic, data sources, and output accuracy.
- User Training: Continuous education for finance and IT teams on new features or process changes.
- Scalability Planning: Optimize workflows to handle increased data volume or complexity without degradation.
Example: Optimization Through Feedback Loop
A mid-sized tech firm automated its monthly financial reporting but noticed delays during quarter-end close. By collecting feedback from users and analyzing system logs, the team identified that certain data validation steps were redundant and could be parallelized. After reconfiguring the workflow, report generation time was reduced by 30%, improving overall efficiency.
Mind Map: End-to-End Continuous Monitoring and Optimization Workflow
Summary
Continuous monitoring and optimization are not one-time activities but ongoing commitments that ensure financial reporting automation remains accurate, compliant, and efficient. By leveraging automated validation, real-time dashboards, user feedback, and regular audits, organizations can proactively manage their automated processes and adapt to evolving business needs.
Actionable Tips
- Establish clear KPIs for automated processes (e.g., error rates, processing times).
- Implement real-time monitoring tools with alert capabilities.
- Schedule regular cross-functional meetings to review automation performance.
- Document all changes and maintain version control for automation scripts.
- Encourage open communication between finance and IT teams for continuous improvement.
6.5 Documentation and Knowledge Sharing Practices
Effective documentation and knowledge sharing are critical components for the success and sustainability of financial reporting automation initiatives. Proper documentation ensures that processes are transparent, repeatable, and easily understood by both current and future team members. Knowledge sharing fosters collaboration between accountants and IT specialists, enabling continuous improvement and minimizing risks associated with staff turnover or system changes.
Importance of Documentation in Financial Reporting Automation
- Process Transparency: Clear documentation allows all stakeholders to understand how automated workflows function.
- Error Reduction: Well-documented processes help identify and rectify errors quickly.
- Compliance: Documentation supports audit requirements and regulatory compliance.
- Training: New team members can onboard faster with comprehensive guides.
Key Documentation Types and Their Purposes
| Documentation Type | Purpose | Example |
|---|---|---|
| Process Flow Diagrams | Visualize automated workflows and decision points | Flowchart showing automated data consolidation steps and approval checkpoints |
| Technical Specifications | Detail system configurations, software versions, and integration points | Document listing API endpoints used to pull data from ERP systems |
| User Manuals | Guide end-users on how to interact with automated reports and dashboards | Step-by-step guide for accountants to generate monthly financial summaries |
| Data Dictionaries | Define data fields, formats, and sources | Table describing each data element used in the automated reporting system |
| Change Logs | Track modifications to automation scripts, workflows, and configurations | Log of updates made to the report generation script with dates and responsible personnel |
Mind Map: Documentation Components for Financial Reporting Automation
Best Practices for Creating and Maintaining Documentation
- Use Collaborative Tools: Platforms like Confluence, SharePoint, or Notion enable real-time collaboration and version control.
- Standardize Formats: Adopt templates for consistency across documents.
- Keep It Updated: Schedule regular reviews to ensure documentation reflects current processes.
- Make It Accessible: Store documentation in a centralized, easy-to-find location.
- Incorporate Visuals: Use diagrams, flowcharts, and screenshots to improve understanding.
- Encourage Contributions: Allow both finance and IT teams to contribute insights and updates.
Example: Creating a Process Flow Diagram for Automated Report Generation
- Step 1: Identify key steps in the report generation process (data extraction, validation, calculation, report compilation, review, distribution).
- Step 2: Use a tool like Microsoft Visio or Lucidchart to map these steps.
- Step 3: Highlight automated vs manual tasks.
- Step 4: Add decision points, such as validation checks that trigger error handling.
    flowchart TD
  A[Start: Data Extraction] --> B{Data Valid?}
  B -- Yes --> C[Run Calculations]
  B -- No --> D[Error Handling]
  C --> E[Compile Report]
  E --> F[Review & Approval]
  F --> G[Distribute Report]
  G --> H[End]
  D --> H
Knowledge Sharing Strategies
- Regular Cross-Functional Meetings: Schedule sessions where accountants and IT specialists discuss challenges, updates, and improvements.
- Internal Wikis: Maintain a living knowledge base with FAQs, troubleshooting tips, and best practices.
- Lunch & Learn Sessions: Informal training where team members share insights or new features.
- Mentorship Programs: Pair experienced staff with newcomers to transfer tacit knowledge.
- Recorded Tutorials: Create video walkthroughs of automation tools and processes.
Example: Knowledge Sharing Wiki Structure
Final Tips
- Encourage a culture of documentation and knowledge sharing as part of daily workflows.
- Recognize and reward contributions to documentation and knowledge bases.
- Leverage automation tools themselves to generate parts of the documentation, such as audit trails and logs.
By embedding strong documentation and knowledge sharing practices, organizations can maximize the value of financial reporting automation, ensuring resilience, compliance, and continuous improvement.
7. Compliance, Security, and Risk Management
7.1 Regulatory Requirements Impacting Automated Financial Reporting
Automated financial reporting must comply with a variety of regulatory frameworks designed to ensure transparency, accuracy, and accountability in financial disclosures. Understanding these regulations is critical for both accountants and IT specialists to design and maintain compliant automation systems.
Key Regulatory Frameworks
- Sarbanes-Oxley Act (SOX)
- Ensures accuracy and reliability of corporate disclosures
- Requires internal controls over financial reporting
- International Financial Reporting Standards (IFRS)
- Global accounting standards for financial statements
- Emphasizes consistency and comparability
- Generally Accepted Accounting Principles (GAAP)
- U.S. accounting standards
- Defines principles for revenue recognition, expense matching, etc.
- Dodd-Frank Act
- Focuses on financial stability and transparency
- Includes provisions for reporting and risk management
- General Data Protection Regulation (GDPR)
- Governs data privacy and protection in the EU
- Impacts how financial data is stored and processed
Mind Map: Regulatory Landscape for Automated Financial Reporting
Best Practices to Address Regulatory Requirements
- Implement Robust Internal Controls
- Example: Automate segregation of duties by restricting report generation and approval to different user roles.
- Maintain Comprehensive Audit Trails
- Example: Use automation tools that log every data change and report generation timestamp.
- Ensure Data Accuracy and Consistency
- Example: Validate data inputs automatically against predefined accounting rules (e.g., revenue recognition criteria).
- Regular Compliance Audits
- Example: Schedule automated compliance checks aligned with SOX and GAAP requirements.
- Data Privacy Compliance
- Example: Encrypt financial data and implement access controls to meet GDPR standards.
Example Scenario: Automating SOX Compliance in Financial Reporting
A mid-sized tech company implements an automated financial reporting system. To comply with SOX:
- The system enforces role-based access controls, ensuring that the person preparing the report cannot approve it.
- Every financial entry and report generation is timestamped and logged for audit purposes.
- Automated reconciliation processes verify that ledger balances match subsidiary records before report finalization.
- Monthly automated compliance reports are generated and reviewed by internal auditors.
This approach reduces manual errors, enhances transparency, and ensures regulatory compliance.
Mind Map: SOX Compliance Automation Workflow
Challenges and Considerations
- Keeping Up with Regulatory Changes
- Automation systems must be flexible to adapt to evolving regulations.
- Balancing Automation and Human Oversight
- Critical judgments may still require human review.
- Data Security Risks
- Automated systems are targets for cyber threats; compliance includes securing data.
Summary
Regulatory requirements such as SOX, GAAP, IFRS, Dodd-Frank, and GDPR significantly impact automated financial reporting. By embedding compliance into automation workflows through internal controls, audit trails, data validation, and privacy safeguards, organizations can ensure their financial reports are accurate, transparent, and compliant. Collaboration between accountants and IT specialists is essential to align technology capabilities with regulatory demands.
7.2 Ensuring Data Privacy and Security in Automation Tools
Automation tools in financial reporting handle sensitive financial data, making data privacy and security paramount. This section explores best practices, frameworks, and real-world examples to safeguard data throughout the automation lifecycle.
Key Principles of Data Privacy and Security
- Confidentiality: Ensuring only authorized users can access sensitive data.
- Integrity: Maintaining accuracy and completeness of data.
- Availability: Ensuring data and systems are accessible when needed.
- Compliance: Adhering to legal and regulatory requirements.
Mind Map: Core Components of Data Privacy and Security in Automation Tools
Best Practices with Examples
Role-Based Access Control (RBAC)
Assign permissions based on job roles to limit data exposure.
Example: In a financial reporting automation platform, accountants have access to generate and review reports, while IT specialists manage system configurations but cannot view sensitive financial data.
Multi-Factor Authentication (MFA)
Add an extra layer of security beyond passwords.
Example: Before accessing the automation dashboard, users must enter a password and a one-time code sent to their mobile device.
Data Encryption
Encrypt data both at rest and in transit to prevent unauthorized interception.
Example: Financial data stored in cloud automation tools is encrypted using AES-256, and all data transfers use TLS protocols.
Audit Trails and Logging
Maintain detailed logs of user activities and changes for accountability and forensic analysis.
Example: Every modification to a financial report template is logged with user ID, timestamp, and change description.
Compliance Adherence
Ensure automation tools support compliance with relevant regulations.
Example: Automation software includes built-in controls to support Sarbanes-Oxley (SOX) compliance by enforcing segregation of duties and generating compliance reports.
Regular Vulnerability Assessments
Conduct security assessments to identify and remediate vulnerabilities.
Example: Quarterly penetration tests reveal a potential SQL injection vulnerability, which is promptly patched.
Incident Response Planning
Prepare for potential security breaches with a clear response plan.
Example: Upon detecting unauthorized access, the system automatically locks affected accounts and notifies security teams for immediate investigation.
Mind Map: Example Workflow for Securing Financial Reporting Automation
Real-World Example: Implementing Security in a Financial Reporting Automation Project
Scenario: A mid-sized tech company automates monthly financial reporting using a cloud-based tool.
- Challenge: Protect sensitive financial data from unauthorized access and ensure compliance with GDPR.
- Solution:
- Implemented RBAC to restrict report access.
- Enabled MFA for all users.
- Encrypted data at rest and in transit.
- Configured audit logs to track all user activities.
- Conducted regular security training for finance and IT teams.
- Established an incident response plan aligned with company policies.
Outcome: The company successfully automated reporting with zero data breaches and passed GDPR audits without issues.
Summary
Ensuring data privacy and security in financial reporting automation requires a multi-layered approach combining technical controls, process governance, and ongoing vigilance. By implementing best practices such as RBAC, encryption, audit trails, and compliance checks, organizations can protect sensitive financial data while leveraging automation benefits.
7.3 Managing Risks Associated with Automation Failures
Automation in financial reporting offers tremendous efficiency and accuracy benefits, but it also introduces new risks that must be carefully managed. Failures in automation can lead to incorrect financial data, compliance breaches, and loss of stakeholder trust. This section explores key risk areas, mitigation strategies, and real-world examples to help accountants and IT specialists proactively manage these risks.
Key Risk Areas in Financial Reporting Automation
Mitigation Strategies
-
Robust Testing and Validation
- Conduct thorough unit and integration testing before deployment.
- Example: A mid-sized tech company implemented automated financial consolidation and ran parallel manual checks for 3 months to validate outputs, uncovering a formula error that would have misstated revenue.
-
Data Quality Controls
- Implement automated data validation rules to catch anomalies early.
- Example: An accounting firm used automated scripts to flag missing or outlier data points before reports were generated, reducing errors by 40%.
-
Redundancy and Backup Systems
- Maintain backups and failover systems to ensure continuity.
- Example: A financial services provider scheduled nightly backups of automated reporting data and had a standby server to switch over during outages.
-
Access Controls and Security Protocols
- Enforce role-based access and multi-factor authentication.
- Example: An IT department restricted report generation permissions to senior accountants and logged all access attempts, preventing unauthorized changes.
-
Regular Audits and Monitoring
- Schedule periodic audits of automated processes and outputs.
- Example: Quarterly reviews of automated reports helped identify subtle discrepancies caused by recent software updates.
-
Comprehensive Training Programs
- Train both finance and IT teams on system use and risk awareness.
- Example: A company held joint workshops for accountants and IT specialists to understand automation workflows and potential failure points.
-
Clear Escalation Procedures
- Define steps for incident response when automation failures occur.
- Example: A documented protocol ensured immediate manual intervention and communication to stakeholders upon detection of a reporting anomaly.
Mind Map: Risk Mitigation Workflow
Real-World Example: Automation Failure and Recovery
Scenario: A multinational finance firm automated its quarterly financial reporting. During one cycle, a software update introduced a bug that caused misclassification of expenses, inflating operating costs.
Impact: The error was not caught immediately, leading to an inaccurate report submitted to regulators.
Response:
- The IT team rolled back the update and restored data from backups.
- Accountants performed manual reconciliations to correct the report.
- Root cause analysis identified insufficient testing of the update.
- New protocols were established requiring multi-environment testing before deployment.
Outcome: Improved collaboration between IT and finance teams and enhanced testing protocols significantly reduced future automation risks.
Summary
Managing risks associated with automation failures requires a combination of technical controls, process discipline, and cross-functional collaboration. By understanding potential failure points, implementing layered safeguards, and preparing for rapid response, organizations can harness the benefits of financial reporting automation while minimizing its risks.
7.4 Internal Controls and Automated Audit Procedures
Introduction
Internal controls are essential mechanisms within financial reporting to ensure accuracy, reliability, and compliance with regulatory standards. When financial reporting processes are automated, these controls must also evolve to maintain integrity and transparency. Automated audit procedures leverage technology to continuously monitor, verify, and validate financial data and processes, reducing human error and increasing efficiency.
Key Components of Internal Controls in Automated Financial Reporting
Best Practices for Implementing Internal Controls in Automation
-
Segregation of Duties (SoD)
- Ensure that no single individual has control over all aspects of a financial transaction.
- Example: In an automated system, configure role-based access so that data entry, approval, and report generation are handled by different users.
-
Automated Data Validation Checks
- Implement system rules that automatically validate data inputs against predefined criteria.
- Example: A system automatically flags transactions exceeding a certain threshold for manual review.
-
Audit Trails and Logging
- Maintain detailed logs of all changes, approvals, and system activities.
- Example: Every modification in the financial report is timestamped and linked to a user ID, enabling traceability.
-
Exception and Anomaly Reporting
- Set up automated alerts for unusual transactions or discrepancies.
- Example: The system generates a report highlighting discrepancies between budgeted and actual expenses exceeding 10%.
-
Periodic Control Testing and Review
- Schedule automated and manual reviews to test the effectiveness of controls.
- Example: Quarterly automated reconciliation reports are generated and reviewed by internal audit teams.
Automated Audit Procedures: Practical Examples
Example 1: Automated Reconciliation
- Process: The system automatically matches transactions from the general ledger with bank statements.
- Control: Any unmatched transactions trigger an exception report.
- Benefit: Reduces manual reconciliation time and identifies discrepancies promptly.
Example 2: Continuous Monitoring with RPA
- Process: Robotic Process Automation bots continuously scan financial data for compliance with internal policies.
- Control: Bots flag transactions that violate spending limits or approval workflows.
- Benefit: Enables real-time compliance monitoring and faster issue resolution.
Example 3: Automated Access Reviews
- Process: The system generates periodic reports on user access rights and changes.
- Control: Automated alerts notify managers of unauthorized access or role conflicts.
- Benefit: Enhances security and reduces risk of fraud.
Mind Map: Automated Audit Procedures Workflow
Challenges and Mitigation Strategies
| Challenge | Mitigation Strategy | Example |
|---|---|---|
| Over-reliance on Automation | Combine automated controls with periodic manual reviews | Schedule manual audits quarterly |
| Data Quality Issues | Implement strict data validation and cleansing routines | Automated validation rules on input data |
| Access Control Misconfigurations | Regular automated access reviews and role audits | Automated alerts for role conflicts |
| False Positives in Alerts | Fine-tune rules and thresholds based on historical data | Adjust anomaly detection parameters |
Conclusion
Integrating robust internal controls with automated audit procedures is critical to safeguarding the integrity of financial reporting automation. By combining technology with well-designed control frameworks, organizations can enhance accuracy, compliance, and operational efficiency while reducing risks associated with financial misstatements and fraud.
7.5 Case Examples of Compliance Breaches and Lessons Learned
Financial reporting automation can significantly reduce errors and improve compliance, but failures or oversights in implementation can lead to serious compliance breaches. Understanding real-world examples helps accountants and IT specialists anticipate risks and strengthen controls.
Case Example 1: Inaccurate Revenue Recognition Due to Automation Misconfiguration
Scenario: A mid-sized technology company automated its revenue recognition process using an ERP-integrated financial reporting tool. However, the automation rules were incorrectly configured to recognize revenue immediately upon contract signing rather than over the service delivery period.
Impact:
- Violated ASC 606 revenue recognition standards.
- Led to overstated quarterly revenues.
- Triggered regulatory scrutiny and restatement of financials.
Lessons Learned:
- Best Practice: Always validate automation logic against accounting standards before deployment.
- Example Mind Map:
Case Example 2: Data Privacy Breach from Inadequate Access Controls
Scenario: A financial services firm automated report generation and distribution. However, due to weak role-based access controls in the automation platform, sensitive financial data was inadvertently sent to unauthorized recipients.
Impact:
- Breach of GDPR and other data privacy regulations.
- Loss of client trust and potential fines.
Lessons Learned:
- Best Practice: Implement strict access controls and audit trails in automation tools.
- Example Mind Map:
Case Example 3: Failure to Update Automated Tax Calculations
Scenario: An accounting department automated tax calculations within their financial reports. When tax laws changed, the automation rules were not updated promptly, resulting in incorrect tax liabilities being reported.
Impact:
- Underpayment of taxes.
- Penalties and interest charges from tax authorities.
Lessons Learned:
- Best Practice: Establish a process for timely updates of regulatory changes in automation workflows.
- Example Mind Map:
Case Example 4: Incomplete Audit Trail Leading to Compliance Failure
Scenario: A company implemented automated financial reporting but neglected to configure audit logs properly. During an external audit, the lack of traceability for automated adjustments raised compliance concerns.
Impact:
- Audit delays and increased scrutiny.
- Potential qualification of financial statements.
Lessons Learned:
- Best Practice: Ensure all automated processes generate comprehensive, tamper-proof audit trails.
- Example Mind Map:
Summary of Key Lessons
By learning from these compliance breach examples, finance and IT teams can proactively design and maintain automated financial reporting systems that are robust, secure, and compliant.
8. Advanced Techniques and Innovations in Financial Reporting Automation
8.1 Using Robotic Process Automation (RPA) in Financial Reporting
Robotic Process Automation (RPA) is revolutionizing the way financial reporting is conducted by automating repetitive, rule-based tasks that traditionally consume significant time and resources. For accountants and IT specialists in finance and tech sectors, understanding how to leverage RPA can lead to increased accuracy, faster report generation, and reduced operational costs.
What is RPA?
RPA uses software robots or “bots” to mimic human actions interacting with digital systems. These bots can log into applications, extract and input data, perform calculations, and generate reports without manual intervention.
Benefits of RPA in Financial Reporting
- Speed: Bots can process large volumes of data much faster than humans.
- Accuracy: Minimizes human errors in data entry and calculations.
- Consistency: Ensures standardized reporting processes.
- Cost Efficiency: Reduces labor costs and frees up staff for higher-value tasks.
- Scalability: Easily scales to handle increased reporting volumes.
Mind Map: Key Applications of RPA in Financial Reporting
Practical Example 1: Automating Monthly Financial Close
Scenario: The finance team spends several days consolidating data from multiple sources to close monthly books.
RPA Solution:
- Bots log into various ERP and accounting systems.
- Extract trial balances and transactional data.
- Perform reconciliations and flag discrepancies.
- Compile data into standardized templates.
- Generate and distribute financial statements to stakeholders.
Outcome: Reduced monthly close cycle from 7 days to 2 days, with improved accuracy.
Mind Map: Steps in RPA-Driven Monthly Close
Practical Example 2: Automating Regulatory Reporting
Scenario: A financial institution must submit regulatory reports quarterly, which involves gathering data from multiple systems and formatting it according to strict guidelines.
RPA Solution:
- Bots extract required data from internal systems.
- Validate data against regulatory rules.
- Format reports according to submission standards.
- Automatically submit reports through regulatory portals.
- Generate audit logs for compliance verification.
Outcome: Eliminated manual errors, ensured timely submissions, and improved audit readiness.
Best Practices for Implementing RPA in Financial Reporting
- Start Small: Begin with high-volume, repetitive tasks to demonstrate quick wins.
- Involve Both Finance and IT: Collaboration ensures process accuracy and technical feasibility.
- Maintain Data Security: Ensure bots comply with data privacy and security policies.
- Monitor and Optimize: Continuously track bot performance and update workflows as needed.
- Document Processes: Maintain clear documentation for audit and maintenance purposes.
Mind Map: Best Practices for RPA Implementation
Conclusion
RPA offers a powerful way to streamline financial reporting by automating mundane, error-prone tasks. By integrating RPA thoughtfully, finance and IT professionals can enhance accuracy, accelerate reporting cycles, and free up valuable resources for strategic activities. The examples and mind maps provided illustrate practical pathways to harness RPA effectively within your financial reporting workflows.
8.2 Incorporating Natural Language Generation for Narrative Reports
Natural Language Generation (NLG) is a transformative technology in financial reporting automation that converts structured data into clear, human-readable narrative text. This capability enables accountants and IT specialists to generate insightful, consistent, and timely narrative reports that complement numerical data, improving communication with stakeholders.
What is Natural Language Generation (NLG)?
NLG is a subset of artificial intelligence that automatically produces written or spoken narratives from data. In financial reporting, it helps translate complex financial metrics and trends into understandable language without manual intervention.
Mind Map: Key Components of NLG in Financial Reporting
How NLG Enhances Narrative Reporting
- Automates Routine Commentary: Automatically generates explanations for financial results, reducing manual effort.
- Improves Accuracy: Minimizes human errors and ensures consistent language across reports.
- Accelerates Reporting Cycles: Enables faster delivery of reports with up-to-date narratives.
- Customizes Content: Tailors narratives based on audience, such as executives, auditors, or regulators.
Practical Example: Generating a Quarterly Financial Summary
Data Input:
- Revenue: $10M (up 8% QoQ)
- Net Profit: $2M (down 5% QoQ)
- Operating Expenses: $5M (flat QoQ)
NLG-Generated Narrative:
“In Q2, the company achieved a revenue of $10 million, reflecting an 8% increase compared to the previous quarter. Despite this growth, net profit decreased by 5% to $2 million, primarily due to stable operating expenses which remained at $5 million. This indicates that while sales improved, cost management will be critical to enhancing profitability going forward.”
Mind Map: NLG Workflow for Narrative Reports
Best Practices for Implementing NLG in Financial Reporting
- Start Small: Begin with automating simple, repetitive narratives before scaling.
- Collaborate Closely: Accountants provide domain expertise; IT specialists handle integration and technical setup.
- Maintain Transparency: Ensure generated narratives are auditable and traceable to data sources.
- Customize Language: Adapt tone and complexity based on the target audience.
- Continuously Improve: Use feedback loops to refine templates and algorithms.
Example Use Case: Automated Earnings Call Scripts
Many companies automate the creation of earnings call scripts using NLG. For instance, an NLG system can generate the CEO’s opening remarks by summarizing key financial highlights, market conditions, and strategic initiatives, allowing executives to focus on delivering insights rather than drafting text.
Challenges and Considerations
- Data Quality: NLG output is only as good as the input data; poor data leads to misleading narratives.
- Context Understanding: Complex financial nuances may require human review.
- Regulatory Compliance: Generated text must comply with financial disclosure regulations.
Conclusion
Incorporating Natural Language Generation into financial reporting automation empowers finance and IT teams to produce clear, consistent, and insightful narrative reports at scale. By combining structured data with intelligent text generation, organizations can enhance stakeholder communication, reduce manual workload, and accelerate reporting cycles.
For accountants and IT specialists, mastering NLG integration is a strategic step towards next-generation financial reporting.
8.3 Real-Time Financial Reporting and Dashboards
Real-time financial reporting and dashboards represent a transformative leap in how organizations monitor, analyze, and act upon their financial data. By delivering up-to-the-minute insights, these tools empower accountants and IT specialists to make faster, more informed decisions, reduce risks, and improve overall financial agility.
What is Real-Time Financial Reporting?
Real-time financial reporting refers to the continuous or near-instantaneous updating and presentation of financial data as transactions occur or data is processed. Unlike traditional batch reporting, which may happen daily, weekly, or monthly, real-time reporting provides immediate visibility into financial performance.
Key Benefits:
- Faster decision-making: Immediate access to financial data enables proactive management.
- Improved accuracy: Continuous data feeds reduce errors from manual data entry or delayed reconciliation.
- Enhanced transparency: Stakeholders can monitor financial health anytime.
- Risk mitigation: Early detection of anomalies or irregularities.
Components of Real-Time Financial Dashboards
Best Practices for Implementing Real-Time Financial Dashboards
-
Identify Critical KPIs: Focus on metrics that drive business decisions such as cash flow, revenue, expenses, and profit margins.
-
Ensure Data Integration: Seamlessly connect multiple data sources (ERP, CRM, banking) to provide a holistic view.
-
Automate Data Validation: Implement automated checks to maintain data accuracy and consistency.
-
Design Intuitive Visualizations: Use clear charts, gauges, and tables that highlight key insights without clutter.
-
Enable User Customization: Allow users to filter data, drill down into details, and personalize views.
-
Implement Alerting Mechanisms: Set thresholds for KPIs to trigger notifications for anomalies or important changes.
-
Ensure Security and Access Controls: Protect sensitive financial data by defining user roles and permissions.
Example: Real-Time Cash Flow Dashboard
Imagine a mid-sized tech company implementing a real-time cash flow dashboard that updates every 15 minutes. The dashboard includes:
- Current Cash Position: Displays total cash available across all bank accounts.
- Incoming Payments: Lists recent customer payments and expected receivables.
- Outgoing Payments: Tracks upcoming vendor payments and payroll.
- Cash Flow Forecast: Projects cash position for the next 30 days based on historical trends and scheduled transactions.
Use Case: The CFO notices a sudden dip in cash position due to delayed receivables and immediately coordinates with the sales team to expedite collections, avoiding potential liquidity issues.
Mind Map: Real-Time Cash Flow Dashboard Features
Example: Automated Variance Analysis Dashboard
An accounting team uses a real-time variance analysis dashboard to compare actual vs. budgeted expenses across departments. The dashboard highlights:
- Department-wise Expense Variance: Color-coded indicators showing over or under-spending.
- Trend Lines: Monthly expense trends to detect unusual spikes.
- Root Cause Drill-Down: Ability to click on a variance to see detailed transaction-level data.
Use Case: The IT department identifies an unexpected spike in software licensing costs and investigates immediately, preventing budget overruns.
Mind Map: Variance Analysis Dashboard
Integration Tips for IT Specialists
- Use APIs to connect ERP and financial systems for live data feeds.
- Implement data caching strategies to balance performance and real-time accuracy.
- Employ scalable cloud infrastructure to handle data volume and user concurrency.
- Collaborate with accountants to validate KPI definitions and dashboard usability.
Summary
Real-time financial reporting and dashboards are essential tools for modern finance and tech professionals. By combining continuous data integration, automated validation, and intuitive visualization, organizations can unlock actionable insights that drive better financial management and strategic decision-making.
Embracing these technologies requires careful planning, cross-functional collaboration, and adherence to best practices to maximize their value and ensure data integrity.
8.4 Blockchain for Transparent and Immutable Reporting
Introduction
Blockchain technology is revolutionizing financial reporting by providing a decentralized, transparent, and immutable ledger. This ensures that financial data cannot be tampered with, fostering trust and compliance in reporting processes. For accountants and IT specialists, understanding how blockchain integrates into financial reporting automation is crucial for leveraging its full potential.
What is Blockchain?
Blockchain is a distributed ledger technology where transactions are recorded in blocks linked chronologically and cryptographically secured. Each participant in the network holds a copy of the ledger, making data manipulation nearly impossible without consensus.
Benefits of Blockchain in Financial Reporting
- Transparency: Every transaction is visible to authorized participants, enabling real-time auditability.
- Immutability: Once recorded, data cannot be altered or deleted, ensuring data integrity.
- Efficiency: Automates reconciliation and reduces manual intervention.
- Security: Cryptographic techniques protect data from unauthorized access.
Mind Map: Blockchain Benefits in Financial Reporting
How Blockchain Integrates with Financial Reporting Automation
- Data Entry: Transactions are recorded on the blockchain ledger as they occur.
- Validation: Consensus mechanisms verify transaction authenticity.
- Reporting: Automated tools extract data directly from the blockchain for report generation.
- Audit: Auditors access immutable records for verification without intermediaries.
Example: Using Blockchain for Expense Reporting
Scenario: A multinational company implements blockchain to automate and secure its expense reporting process.
- Employees submit expense claims recorded as blockchain transactions.
- Smart contracts automatically validate claims against company policies.
- Approved expenses are immutably stored, accessible to finance teams.
- Automated reports generate real-time expense summaries for management.
Outcome: Reduced fraud risk, faster approvals, and transparent audit trails.
Mind Map: Blockchain-Enabled Expense Reporting Workflow
Challenges and Considerations
- Scalability: Blockchain networks may face performance issues with high transaction volumes.
- Integration Complexity: Aligning blockchain with existing ERP and accounting systems requires careful planning.
- Regulatory Compliance: Ensuring blockchain implementations meet financial regulations.
- Cost: Initial setup and maintenance can be resource-intensive.
Best Practices for Implementing Blockchain in Financial Reporting
- Start with pilot projects focusing on high-impact areas like audit trails or expense reporting.
- Collaborate closely between finance and IT teams to align technical and business requirements.
- Use permissioned blockchains to control access and comply with privacy regulations.
- Combine blockchain with smart contracts to automate validations and approvals.
- Continuously monitor and update blockchain protocols to adapt to evolving regulations.
Example: Audit Trail Enhancement Using Blockchain
A financial services firm implemented a permissioned blockchain to record all journal entries and adjustments. Auditors accessed the blockchain ledger directly, reducing audit time by 40% and increasing confidence in data integrity.
Mind Map: Best Practices for Blockchain in Financial Reporting
Conclusion
Blockchain technology offers transformative potential for financial reporting automation by ensuring transparency, security, and immutability. When thoughtfully implemented with best practices and collaboration between accountants and IT specialists, blockchain can significantly enhance the accuracy, efficiency, and trustworthiness of financial reports.
Further Reading & Resources
- IBM Blockchain for Financial Services
- Deloitte’s Blockchain in Finance Report
- Hyperledger Fabric Documentation
- Case Studies on Blockchain in Accounting and Auditing
8.5 Predictive Analytics for Forecasting and Scenario Analysis
Predictive analytics is transforming financial reporting by enabling organizations to forecast future financial outcomes and perform scenario analysis with greater accuracy and speed. By leveraging historical data, statistical algorithms, and machine learning techniques, accountants and IT specialists can uncover patterns and trends that inform strategic decision-making.
What is Predictive Analytics in Financial Reporting?
Predictive analytics uses data, statistical models, and machine learning to predict future events based on historical data. In financial reporting, this means forecasting revenues, expenses, cash flows, and other key financial metrics.
Benefits of Predictive Analytics
- Improved Forecast Accuracy: By analyzing large datasets and identifying hidden trends.
- Proactive Decision-Making: Enables scenario planning to assess potential risks and opportunities.
- Resource Optimization: Helps allocate budgets and resources more effectively.
Mind Map: Components of Predictive Analytics in Financial Reporting
Practical Example 1: Revenue Forecasting Using Time Series Analysis
Scenario: A technology company wants to forecast its quarterly revenues for the next year.
Approach:
- Collect historical quarterly revenue data for the past 5 years.
- Use time series forecasting methods such as ARIMA (AutoRegressive Integrated Moving Average).
- Validate the model by comparing predicted vs actual revenues for the last 4 quarters.
- Generate forecasts for the upcoming 4 quarters.
Outcome: The company identifies seasonal trends and predicts a 10% revenue growth in Q4 due to product launches.
Mind Map: Time Series Forecasting Workflow
Practical Example 2: Scenario Analysis for Expense Management
Scenario: An accounting team wants to understand how changes in raw material costs affect overall expenses.
Approach:
- Define multiple scenarios: baseline, 10% increase, 20% increase in raw material costs.
- Use predictive models to estimate the impact on total expenses under each scenario.
- Visualize results to support budgeting decisions.
Outcome: The team prepares contingency budgets and identifies cost-saving opportunities.
Mind Map: Scenario Analysis Process
Integrating Predictive Analytics into Financial Reporting Automation
- Data Integration: Connect predictive models with automated reporting tools to update forecasts in real-time.
- Visualization: Use dashboards to display forecasted financial metrics alongside actuals.
- Alerts: Set up automated alerts for deviations from predicted outcomes.
Best Practices
- Start with clean, high-quality data.
- Choose models appropriate to the financial metric and data characteristics.
- Continuously validate and update models with new data.
- Collaborate between finance and IT teams to ensure technical and domain accuracy.
Summary
Predictive analytics empowers finance and IT professionals to move beyond historical reporting into forward-looking insights. By embedding forecasting and scenario analysis into automated financial reporting, organizations can enhance agility, improve accuracy, and drive strategic growth.
9. Measuring Success and ROI of Automation Initiatives
9.1 Defining Metrics for Financial Reporting Automation Success
Financial reporting automation is a transformative initiative that can significantly improve accuracy, efficiency, and compliance. However, to truly gauge the success of automation efforts, it is essential to define clear, actionable metrics. These metrics help organizations measure performance, identify areas for improvement, and justify investments.
Key Categories of Metrics
Below is a mind map outlining the main categories of metrics to consider when evaluating financial reporting automation success:
Accuracy Metrics
Error Rate Reduction: One of the primary goals of automation is to minimize human errors. Track the number of errors or discrepancies found in reports before and after automation.
Example: Before automation, a company found 15 errors per quarterly report. After automation, errors dropped to 2 per report, indicating an 87% improvement.
Data Consistency: Automated systems should ensure consistent data across reports and periods.
Example: Cross-checking balance sheet figures with underlying ledger data to confirm consistency.
Efficiency Metrics
Report Generation Time: Measure the time taken to produce financial reports.
Example: Manual reporting took 5 days; automation reduced this to 1 day, a 80% time saving.
Manual Effort Reduction: Quantify the reduction in hours spent by accountants on repetitive tasks.
Example: Automation cut down data consolidation efforts from 40 hours per month to 10 hours.
Compliance Metrics
Regulatory Adherence: Track the number of compliance issues or regulatory breaches related to reporting.
Example: Zero compliance issues reported in the automated reporting cycle versus 2 in the manual process.
Audit Trail Completeness: Ensure every automated action is logged and auditable.
Example: Automated logs provide 100% traceability of data changes, facilitating smoother audits.
User Adoption Metrics
User Engagement Levels: Monitor how frequently finance and IT teams use the automation tools.
Example: 95% of finance team members regularly use the automated reporting platform.
Training Completion Rates: Track how many users have completed training on the new system.
Example: 100% of accounting staff completed automation training within the first month.
Financial Impact Metrics
Cost Savings: Calculate reductions in labor costs, error correction costs, and penalties.
Example: Automation saved $50,000 annually in labor and error-related expenses.
Return on Investment (ROI): Compare the total cost of automation implementation against the financial benefits gained.
Example: An initial investment of $100,000 yielded $150,000 in savings within the first year, resulting in a 50% ROI.
Integrated Example Mind Map
Best Practices for Defining Metrics
- Align Metrics with Business Goals: Ensure the metrics reflect what the organization values most, such as compliance or speed.
- Use Baseline Data: Collect pre-automation data to compare and measure improvements accurately.
- Keep Metrics Actionable: Choose metrics that can guide decision-making and continuous improvement.
- Regularly Review Metrics: Schedule periodic reviews to adapt metrics as automation matures.
By carefully defining and tracking these metrics, accountants and IT specialists can collaboratively demonstrate the tangible benefits of financial reporting automation, driving continuous improvement and strategic value for their organizations.
9.2 Collecting and Analyzing Performance Data
Effective financial reporting automation requires continuous monitoring and analysis of performance data to ensure the system is delivering the expected benefits. This section explores how to systematically collect relevant data points and analyze them to optimize automation processes.
Key Performance Indicators (KPIs) to Track
Before collecting data, it’s essential to define which KPIs will provide meaningful insights into the automation’s effectiveness. Common KPIs include:
- Report Generation Time: Time taken to produce financial reports before and after automation.
- Error Rate: Number of errors detected in reports or data entries.
- Data Processing Volume: Amount of financial data processed automatically.
- User Adoption Rate: Percentage of finance team members actively using the automation tools.
- Cost Savings: Reduction in labor or operational costs attributable to automation.
Mind Map: KPIs for Financial Reporting Automation
Data Collection Methods
-
System Logs and Analytics: Most automation platforms generate logs detailing processing times, error occurrences, and user activities.
-
Surveys and Feedback: Collect qualitative data from accountants and IT specialists on usability and perceived efficiency.
-
Financial Metrics Comparison: Compare financial close cycle times, audit adjustments, and compliance incidents before and after automation.
-
Dashboard Monitoring: Use real-time dashboards to track live performance metrics.
Example: Collecting Report Generation Time Data
A mid-sized tech company automated their monthly financial close reporting. They collected data over three months:
| Month | Manual Report Time (hours) | Automated Report Time (hours) | Time Saved (%) |
|---|---|---|---|
| Jan | 40 | 15 | 62.5% |
| Feb | 42 | 14 | 66.7% |
| Mar | 39 | 13 | 66.7% |
This quantitative data clearly demonstrates the time efficiency gained.
Mind Map: Data Collection Sources
Analyzing Performance Data
Once data is collected, analysis involves:
- Trend Analysis: Identify patterns over time, such as decreasing report generation times or error rates.
- Root Cause Analysis: Investigate spikes in errors or delays to pinpoint system or process issues.
- Benchmarking: Compare performance against industry standards or internal targets.
- Correlation Analysis: Examine relationships between user adoption rates and error reduction.
Example: Root Cause Analysis of Increased Errors
After automation, a finance team noticed a sudden increase in data validation errors. Analysis revealed:
- Errors spiked after a system update.
- The update introduced a formatting change in source data.
- Solution: Adjusted the automation script to accommodate new data format.
This example highlights the importance of continuous monitoring and quick response.
Mind Map: Performance Data Analysis Techniques
Best Practices for Effective Data Collection and Analysis
- Automate data collection wherever possible to reduce manual effort and increase accuracy.
- Establish regular reporting intervals (weekly, monthly) to track progress.
- Involve both finance and IT teams in interpreting data for holistic insights.
- Use visualization tools like dashboards and charts to communicate findings clearly.
- Act on insights promptly to refine automation workflows and training.
Summary
Collecting and analyzing performance data is critical to realizing the full value of financial reporting automation. By defining clear KPIs, leveraging multiple data sources, and applying structured analysis techniques, organizations can continuously improve accuracy, efficiency, and user satisfaction.
9.3 Case Study: ROI Calculation from Automation Deployment
Overview
This case study explores how a mid-sized technology firm implemented financial reporting automation and calculated the return on investment (ROI) from the deployment. The goal was to streamline monthly financial close processes, reduce errors, and improve reporting speed.
Company Background
- Industry: Technology
- Employees: 500
- Finance Team Size: 12
- Previous Reporting Process: Manual consolidation using spreadsheets and ERP exports
Objectives of Automation
- Reduce the monthly close cycle from 10 days to 5 days
- Minimize manual data entry errors
- Improve report accuracy and compliance
- Free up finance team time for analysis and strategic tasks
Automation Deployment Summary
- Tool Implemented: Cloud-based financial reporting automation software with ERP integration
- Key Features Used: Automated data consolidation, validation rules, scheduled report generation, and workflow approvals
- Implementation Time: 3 months
ROI Calculation Framework
Step 1: Calculate Total Investment
- Software License: $50,000/year
- Implementation & Integration: $30,000 (one-time)
- Training & Change Management: $10,000
Total Investment (Year 1): $90,000
Step 2: Quantify Benefits
Time Savings
- Monthly close reduced from 10 to 5 days
- Finance team of 12 spends 50% of time on close activities
- Average salary per employee: $80,000/year
Calculation:
- Time saved per month per employee = 5 days
- Total saved hours = 5 days * 8 hours/day * 12 employees = 480 hours/month
- Annual saved hours = 480 * 12 = 5,760 hours
- Hourly cost = $80,000 / (52 weeks * 40 hours) ≈ $38.46
- Annual savings = 5,760 * $38.46 ≈ $221,370
Error Reduction
- Previous error correction cost: $20,000/year
- Automation reduced errors by 80%
- Savings = $16,000/year
Compliance Improvement
- Avoided penalties and audit costs estimated at $10,000/year
Staff Reallocation
- 2 employees shifted from manual reporting to value-added analysis
- Estimated additional business value: $40,000/year
Total Annual Benefits: $221,370 + $16,000 + $10,000 + $40,000 = $287,370
Step 3: Calculate ROI
- ROI: 219.3% in the first year
- Payback Period: Approximately 4 months
Step 4: Visualizing the ROI Mind Map
Key Takeaways
- Automation can deliver significant cost savings primarily through time efficiency.
- Quantifying benefits like error reduction and compliance improvements adds to the ROI.
- Early investment in training and change management is crucial for maximizing benefits.
- Visual tools like mind maps help stakeholders understand and communicate ROI effectively.
Example: Simplified ROI Calculation Table
| Item | Cost / Savings |
|---|---|
| Software License | $50,000 |
| Implementation | $30,000 |
| Training | $10,000 |
| Total Investment | $90,000 |
| Time Savings | $221,370 |
| Error Reduction | $16,000 |
| Compliance | $10,000 |
| Staff Reallocation | $40,000 |
| Total Benefits | $287,370 |
| ROI | 219.3% |
| Payback Period | 4 months |
This case study demonstrates how a structured approach to calculating ROI, supported by clear examples and visual mind maps, can help finance and IT teams justify financial reporting automation investments effectively.
9.4 Identifying Continuous Improvement Opportunities
Continuous improvement is essential to maximize the benefits of financial reporting automation. As automated systems evolve, regularly identifying opportunities to enhance processes ensures sustained efficiency, accuracy, and adaptability to changing business needs.
Why Continuous Improvement Matters
- Automation is not a one-time setup; it requires ongoing refinement.
- Business environments, regulations, and technologies change, necessitating updates.
- Continuous improvement helps uncover hidden inefficiencies and new automation potentials.
Key Areas to Monitor for Improvement
Practical Examples of Identifying Improvement Opportunities
-
Data Quality Checks
- Example: After automating monthly financial consolidation, the team notices discrepancies in intercompany eliminations.
- Action: Implement additional automated validation rules to flag mismatches early.
-
Process Bottlenecks
- Example: Report generation takes longer than expected due to manual data exports.
- Action: Automate data extraction from ERP systems directly into the reporting tool.
-
User Feedback Integration
- Example: Accountants report difficulty navigating the automated dashboard.
- Action: Conduct user training sessions and redesign the dashboard for better usability.
-
Technology Upgrades
- Example: New version of the automation software offers AI-powered anomaly detection.
- Action: Plan and test upgrade to leverage new features for improved accuracy.
-
Compliance Adaptation
- Example: New financial reporting standards require additional disclosures.
- Action: Update automation workflows to include new data fields and validation.
Tools and Techniques to Support Continuous Improvement
Step-by-Step Approach to Identify and Implement Improvements
- Collect Data and Feedback Regularly
- Use automated logs and user surveys.
- Analyze Data for Patterns and Issues
- Identify recurring errors or delays.
- Prioritize Improvement Opportunities
- Focus on high-impact and feasible changes.
- Develop and Test Solutions
- Collaborate between finance and IT teams.
- Deploy Changes and Monitor Impact
- Measure KPIs post-implementation.
- Document Lessons Learned and Update Processes
Example Mind Map: Continuous Improvement Cycle
By embedding continuous improvement into your financial reporting automation strategy, your organization can adapt swiftly to new challenges, enhance accuracy, and maintain a competitive edge in financial management.
9.5 Reporting Automation Benefits to Stakeholders
Effectively communicating the benefits of financial reporting automation to stakeholders is crucial for securing ongoing support, funding, and alignment across departments. Stakeholders can include executives, finance teams, IT specialists, auditors, and even external partners. This section explores how to present automation benefits clearly and persuasively, supported by practical examples and mind maps to visualize key points.
Key Benefits to Highlight
- Improved Accuracy and Reduced Errors
- Time Savings and Increased Efficiency
- Enhanced Compliance and Audit Readiness
- Real-Time Insights and Better Decision-Making
- Cost Reduction and ROI
- Scalability and Future-Proofing
Mind Map: Communicating Automation Benefits to Stakeholders
Example 1: Presenting Time Savings to CFO
Scenario: The finance team automated monthly financial close reporting, reducing the process from 10 days to 4 days.
How to report:
- “Automation cut the monthly close cycle by 60%, enabling faster financial insights and freeing up 6 days per month for strategic analysis.”
- Visualize with a simple bar chart comparing manual vs automated timelines.
Example 2: Demonstrating Accuracy Improvements to Audit Committee
Scenario: Automated validation rules reduced data entry errors by 95%.
How to report:
- “By implementing automated validation, error rates dropped from 10% to 0.5%, significantly improving report reliability and audit readiness.”
- Include a mind map showing error sources before and after automation.
Example 3: Showcasing Cost Savings to CFO and Finance Leadership
Scenario: Automation reduced overtime hours and reliance on temporary staff during reporting periods.
How to report:
- “Automation saved approximately $50,000 annually in overtime and temporary staffing costs, with additional intangible benefits such as improved employee satisfaction.”
- Present a cost-benefit table comparing pre- and post-automation expenses.
Mind Map: Tailoring Benefits to Different Stakeholders
Best Practices for Reporting Benefits
- Use Clear, Quantifiable Metrics: Always back benefits with measurable data (e.g., time saved, error reduction percentages, cost savings).
- Visualize Data: Use charts, graphs, and mind maps to make complex information digestible.
- Align Benefits with Stakeholder Priorities: Customize messaging depending on the audience’s focus (e.g., cost savings for CFOs, compliance for auditors).
- Include Real-Life Examples: Share success stories or case studies from your organization or industry.
- Highlight Intangible Benefits: Such as improved employee morale, scalability, and future readiness.
Summary
Reporting the benefits of financial reporting automation is not just about showcasing technical achievements but about demonstrating tangible business value. Using structured mind maps and clear examples helps bridge the communication gap between finance and IT teams and ensures stakeholders understand and champion the automation initiatives.
10. Future Trends and Preparing for Next-Generation Financial Reporting
10.1 Emerging Technologies Shaping Financial Reporting Automation
Financial reporting automation is rapidly evolving, driven by several cutting-edge technologies that enhance accuracy, speed, and insight generation. Understanding these emerging technologies is crucial for accountants and IT specialists aiming to stay ahead in the finance and tech sectors.
Key Emerging Technologies
Artificial Intelligence (AI) and Machine Learning (ML)
AI and ML are transforming financial reporting by enabling systems to learn from data patterns and improve over time.
-
Predictive Analytics: AI models forecast financial trends, helping companies anticipate revenue, expenses, and cash flows.
Example: A company uses ML algorithms to predict quarterly sales based on historical data and market indicators, automating adjustments in financial forecasts.
-
Anomaly Detection: AI flags unusual transactions or discrepancies automatically, reducing manual review time.
Example: An AI system detects an unexpected spike in expenses in a department, prompting a timely investigation.
-
Natural Language Generation (NLG): Converts complex financial data into easy-to-understand narrative reports.
Example: Automated generation of management commentary explaining financial results in plain language.
Robotic Process Automation (RPA)
RPA automates repetitive, rule-based tasks in financial reporting, increasing efficiency and accuracy.
-
Data Extraction: Bots pull data from multiple sources such as ERP systems, spreadsheets, and PDFs.
Example: An RPA bot extracts monthly sales data from various regional systems and consolidates it automatically.
-
Report Generation: Automated compilation and formatting of financial statements.
Example: Bots generate balance sheets and income statements with updated data, reducing manual errors.
-
Workflow Automation: Automates approval routing and notifications.
Example: Once reports are generated, RPA triggers review workflows, sending alerts to relevant stakeholders.
Blockchain Technology
Blockchain offers a decentralized, immutable ledger that enhances transparency and security in financial reporting.
-
Immutable Ledgers: Ensures transaction records cannot be altered, increasing trust.
Example: Recording audit trails on blockchain to provide verifiable proof of data integrity.
-
Smart Contracts: Automate contract execution based on predefined conditions.
Example: Automatic recognition of revenue when delivery milestones are confirmed on the blockchain.
-
Transparent Audit Trails: Auditors can access real-time, tamper-proof data.
Cloud Computing
Cloud platforms provide scalable infrastructure and enable real-time collaboration.
-
Scalability: Easily handle large volumes of financial data without infrastructure constraints.
-
Real-time Data Access: Finance teams access up-to-date information anytime, anywhere.
Example: CFOs review live dashboards during board meetings, enabling faster decision-making.
-
Collaboration: Multiple users work simultaneously on reports, improving efficiency.
Advanced Analytics
Advanced analytics tools help visualize data and model financial scenarios.
-
Data Visualization: Interactive dashboards make complex data understandable.
Example: Heatmaps highlighting expense categories exceeding budgets.
-
Scenario Modeling: Simulate financial outcomes based on different assumptions.
Example: Modeling the impact of currency fluctuations on international revenues.
-
KPI Tracking: Automated monitoring of key performance indicators.
Internet of Things (IoT)
IoT devices provide real-time data streams that can be integrated into financial systems.
-
Real-time Data Collection: Sensors track inventory levels or asset usage.
Example: Automated valuation adjustments based on real-time asset depreciation data.
-
Automated Asset Tracking: Reduces manual inventory counts and errors.
Summary Mind Map
By embracing these emerging technologies, finance and IT professionals can significantly enhance the accuracy, efficiency, and strategic value of financial reporting automation initiatives.
10.2 The Role of AI and Cognitive Computing in Finance
Artificial Intelligence (AI) and Cognitive Computing are revolutionizing the finance industry by enabling smarter, faster, and more accurate financial reporting and decision-making. These technologies go beyond traditional automation by mimicking human thought processes, learning from data, and adapting over time.
What is AI and Cognitive Computing in Finance?
- Artificial Intelligence (AI): The simulation of human intelligence processes by machines, especially computer systems. In finance, AI can analyze vast datasets, recognize patterns, and make predictions.
- Cognitive Computing: A subset of AI that involves self-learning systems using data mining, pattern recognition, and natural language processing to mimic human brain functions.
Key Applications of AI and Cognitive Computing in Financial Reporting
Detailed Examples and Use Cases
Automated Narrative Reporting Using NLP
AI-powered tools can generate textual explanations of financial data automatically, turning complex numbers into easy-to-understand narratives.
Example: A financial reporting system uses NLP to create quarterly earnings summaries, highlighting key performance indicators, variances, and trends without manual input.
Anomaly Detection in Financial Data
Machine learning models can scan transactional data to detect unusual patterns that may indicate errors or fraud.
Example: An AI system flags an unexpected spike in expenses for a particular department, prompting accountants to investigate potential misreporting.
Predictive Analytics for Forecasting
AI models analyze historical financial data to forecast future revenues, expenses, or cash flows.
Example: A CFO uses AI-driven forecasts to adjust budgets proactively, improving financial planning accuracy.
Intelligent Reconciliation
Cognitive computing automates the matching of transactions across multiple ledgers and systems, identifying discrepancies quickly.
Example: An AI tool reconciles bank statements with accounting records overnight, reducing manual effort and errors.
Chatbots and Virtual Assistants
AI-powered chatbots can answer finance team queries, guide users through reporting processes, or provide real-time data insights.
Example: An accountant asks a chatbot for the status of the latest financial close, receiving instant updates without waiting for manual reports.
Best Practices for Leveraging AI and Cognitive Computing
- Start Small: Pilot AI applications on specific reporting tasks like anomaly detection before scaling.
- Ensure Data Quality: AI effectiveness depends on clean, well-structured data.
- Collaborate Across Teams: Finance and IT specialists should work together to align AI models with business needs.
- Maintain Transparency: Use explainable AI models to ensure decisions can be audited and understood.
- Continuous Learning: Regularly update AI models with new data to improve accuracy.
Mind Map: Benefits of AI and Cognitive Computing in Financial Reporting
Conclusion
AI and Cognitive Computing are transforming financial reporting by automating routine tasks, enhancing data analysis, and enabling intelligent decision-making. For accountants and IT specialists, embracing these technologies means not only improving accuracy and efficiency but also unlocking new strategic insights that drive business growth.
10.3 Preparing Teams for Future Automation Challenges
As financial reporting automation evolves, preparing your teams—both accountants and IT specialists—to adapt and thrive in this changing landscape is critical. This section explores strategies, training approaches, and mindset shifts necessary to equip your workforce for future automation challenges.
Understanding the Changing Roles
Automation will shift many routine tasks away from humans, requiring teams to focus on higher-value activities such as analysis, exception management, and strategic decision-making.
Mind Map: Changing Roles in Financial Reporting Automation
Example:
An accounting team member who previously spent hours reconciling reports now focuses on analyzing trends and advising management, while IT specialists automate reconciliation processes and monitor system health.
Building a Continuous Learning Culture
Automation technologies evolve rapidly. Teams must embrace continuous learning to stay current with new tools, regulations, and best practices.
Mind Map: Continuous Learning Culture

Example:
A finance department implements monthly “Automation Fridays” where team members share insights on new automation features or challenges encountered, fostering peer learning.
Enhancing Technical and Analytical Skills
Teams need to develop both technical skills (e.g., understanding automation tools, scripting) and analytical skills (e.g., interpreting automated reports, spotting anomalies).
Mind Map: Skill Enhancement Areas
Example:
An IT specialist learns Python scripting to customize automation workflows, while an accountant takes a data analytics course to better interpret automated financial dashboards.
Change Management and Emotional Readiness
Automation can cause uncertainty or resistance. Preparing teams emotionally and managing change effectively is essential.
Mind Map: Change Management Strategies
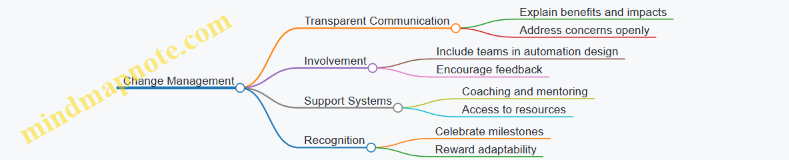
Example:
Before rolling out a new automated reporting tool, leadership holds Q&A sessions to address employee concerns and highlights how automation will reduce mundane tasks, allowing focus on more rewarding work.
Fostering Cross-Functional Collaboration
Automation projects succeed when finance and IT teams work closely, sharing domain knowledge and technical expertise.
Mind Map: Cross-Functional Collaboration

Example:
An automation project team includes accountants and IT specialists who co-design the reporting workflow, ensuring the solution meets both technical feasibility and financial accuracy.
Preparing for Emerging Technologies
Teams should stay informed about innovations such as AI, machine learning, and blockchain that will further transform financial reporting.
Mind Map: Preparing for Emerging Technologies
Example:
A finance team pilots an AI-powered tool that automatically flags unusual transactions, while IT specialists evaluate blockchain solutions for audit trail enhancements.
Summary
Preparing teams for future automation challenges involves shifting mindsets, continuous learning, skill development, effective change management, fostering collaboration, and staying ahead of emerging technologies. By proactively investing in these areas, organizations can ensure their finance and IT teams are ready to leverage automation for greater accuracy, efficiency, and strategic impact.
10.4 Ethical Considerations in Automated Financial Reporting
Automated financial reporting brings tremendous efficiency and accuracy benefits, but it also introduces unique ethical challenges that accountants and IT specialists must carefully navigate. Ensuring ethical standards in automated processes is critical to maintaining trust, transparency, and compliance in financial disclosures.
Key Ethical Considerations
Data Integrity: The Foundation of Ethical Reporting
Automated reports rely heavily on data quality. Ethical automation demands that data inputs are accurate, complete, and timely to avoid misleading stakeholders.
Example: A company automates its quarterly financial reports using an AI-driven platform. If the underlying data feeds are outdated or incomplete, the automated report might show inflated revenue figures. To prevent this, the finance team implements automated data validation checks and flags anomalies before report generation.
Transparency: Explainability and Auditability
Automation algorithms, especially those involving AI or machine learning, can be complex and opaque. Ethical practice requires that the logic behind automated calculations and adjustments is explainable to auditors and stakeholders.
Example: An IT specialist designs an automated reporting system that uses machine learning to classify expenses. To maintain transparency, they document the classification criteria and provide a user-friendly dashboard showing how decisions are made, enabling accountants to verify and override classifications if necessary.
Accountability: Defining Responsibility
Automation does not absolve humans from responsibility. Clear governance structures must define who is accountable for errors or misstatements in automated reports.
Example: A financial institution implements robotic process automation (RPA) for report generation. They establish a cross-functional review committee including accountants and IT specialists who jointly sign off on reports, ensuring shared accountability.
Privacy and Confidentiality: Protecting Sensitive Data
Automated systems often process large volumes of sensitive financial data. Ethical considerations include implementing strong data protection measures and limiting access to authorized personnel only.
Example: During automation of financial reporting, the IT team encrypts all data transmissions and applies role-based access controls. Additionally, audit logs track who accesses or modifies sensitive information, ensuring compliance with data privacy laws like GDPR.
Bias and Fairness: Avoiding Algorithmic Discrimination
Algorithms can unintentionally embed biases that affect financial reporting outcomes, such as misclassifying transactions or skewing forecasts.
Example: An automated forecasting tool disproportionately underestimates expenses for a particular department due to biased historical data. The finance team regularly reviews model outputs and retrains the algorithm with balanced data sets to ensure fairness.
Compliance: Aligning Automation with Ethical and Regulatory Standards
Automated reporting must comply with financial regulations and ethical standards, including GAAP, IFRS, and Sarbanes-Oxley requirements.
Example: Before deploying an automated reporting system, the company conducts a compliance audit to ensure the system enforces segregation of duties and maintains immutable audit trails, satisfying regulatory requirements.
Summary Mind Map
Final Thoughts
Ethical considerations in automated financial reporting are not just about avoiding legal penalties—they are essential for sustaining stakeholder trust and the integrity of financial markets. Accountants and IT specialists must work hand-in-hand to embed ethical principles into every stage of automation, from design and implementation to monitoring and continuous improvement.
By proactively addressing these ethical challenges with practical measures and transparent communication, organizations can harness the full potential of automation while upholding the highest standards of financial reporting integrity.
10.5 Strategic Roadmap for Long-Term Automation Success
Achieving long-term success in financial reporting automation requires a well-structured strategic roadmap that aligns technology, people, and processes. This section outlines a comprehensive approach, supported by practical examples and mind maps, to help finance and IT teams build sustainable automation capabilities.
Key Phases of the Strategic Roadmap
Phase 1: Assessment & Planning
Best Practice: Begin by thoroughly assessing existing financial reporting processes to identify bottlenecks and repetitive tasks ideal for automation.
Example: A mid-sized tech company mapped out their monthly close process and discovered that data consolidation from multiple subsidiaries took 40% of the reporting time. By setting a KPI to reduce consolidation time by 50%, they prioritized automation efforts accordingly.
Phase 2: Technology Selection & Integration
Best Practice: Select automation tools that integrate seamlessly with existing ERP and accounting systems to avoid data silos.
Example: An accounting firm chose a cloud-based automation platform that integrated directly with their SAP system, enabling real-time data updates and reducing manual data entry errors.
Phase 3: Implementation & Change Management
Best Practice: Implement automation in phases, starting with pilot projects to gather user feedback and refine workflows.
Example: A finance department automated their trial balance report first, involving both accountants and IT specialists in testing. Feedback led to adjustments in validation rules before scaling automation to other reports.
Mind Map:
Phase 4: Monitoring & Optimization
Best Practice: Continuously monitor automated processes against KPIs and optimize based on performance data.
Example: After automation, a financial services company tracked report generation time and error rates monthly. They identified a recurring data validation issue and enhanced their automated checks, reducing errors by 30%.
Phase 5: Innovation & Future-Proofing
Best Practice: Encourage ongoing innovation by exploring emerging technologies and adapting to regulatory changes.
Example: A multinational corporation integrated AI-driven narrative generation into their financial reports, providing insightful commentary alongside numbers, which improved stakeholder engagement.
Mind Map:
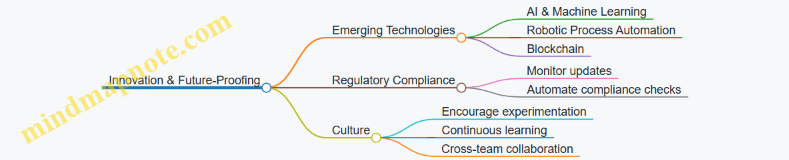
Summary Checklist for Long-Term Automation Success
- Conduct comprehensive process assessments regularly
- Align automation goals with business objectives
- Choose scalable and secure technologies
- Engage stakeholders early and often
- Implement phased rollouts with pilot testing
- Provide continuous training and support
- Monitor KPIs and refine processes
- Stay abreast of technological and regulatory trends
- Foster a culture that embraces change and innovation
By following this strategic roadmap, finance and IT teams can ensure their financial reporting automation initiatives deliver sustained value, adaptability, and competitive advantage.