Performance Measurement and Management
1. Introduction to Performance Measurement and Management
1.1 Understanding Performance Measurement: Definition and Importance
What is Performance Measurement?
Performance measurement is the systematic process of evaluating how well an individual, team, or organization is achieving its objectives. It involves identifying key metrics, collecting relevant data, and analyzing results to assess effectiveness and efficiency.
Why is Performance Measurement Important?
- Alignment with Strategic Goals: Ensures activities support overall business objectives.
- Informed Decision-Making: Provides data-driven insights for management.
- Accountability: Clarifies responsibilities and expectations.
- Continuous Improvement: Identifies areas for enhancement.
- Resource Optimization: Helps allocate resources effectively.
Mind Map: Core Concepts of Performance Measurement
Key Components Explained
- Metrics and KPIs: Quantitative indicators that reflect performance. For example, in corporate finance, a KPI might be “Return on Investment (ROI)” or “Operating Cash Flow.”
- Data Collection: Gathering accurate and timely data from various sources such as financial reports, operational systems, or market analysis.
- Analysis: Interpreting data to understand trends, variances, and performance gaps.
- Reporting: Communicating findings to stakeholders through dashboards, reports, or presentations.
Example 1: Balanced Scorecard in Action
A mid-sized manufacturing company uses a Balanced Scorecard to measure performance across four perspectives: Financial, Customer, Internal Processes, and Learning & Growth.
- Financial: Measures like profit margin and cost reduction.
- Customer: Customer satisfaction scores.
- Internal Processes: Production cycle time.
- Learning & Growth: Employee training hours.
This holistic approach helps the company maintain strategic focus and improve overall performance.
Mind Map: Balanced Scorecard Perspectives
Example 2: Performance Measurement in Corporate Finance
An accounting team tracks the “Days Sales Outstanding (DSO)” metric to measure how quickly the company collects payments. By monitoring DSO monthly, they identify delays and implement process improvements, reducing DSO from 45 to 30 days within six months.
Mind Map: Performance Measurement Benefits
Summary
Performance measurement is a foundational element for effective management in corporate finance and accounting. By clearly defining metrics, collecting accurate data, and analyzing results, organizations can drive better decisions, enhance accountability, and foster continuous improvement. Using practical frameworks like the Balanced Scorecard and focusing on relevant KPIs ensures that performance measurement remains aligned with strategic goals and operational realities.
1.2 The Role of Performance Management in Corporate Finance
Performance management plays a pivotal role in corporate finance by ensuring that financial goals align with the overall strategic objectives of the organization. It involves continuous processes of planning, monitoring, analyzing, and improving financial and operational performance to drive sustainable growth and profitability.
Key Functions of Performance Management in Corporate Finance
- Strategic Alignment: Ensures financial activities support the company’s long-term vision and strategy.
- Resource Allocation: Guides optimal distribution of financial resources to maximize returns.
- Risk Management: Identifies financial risks early and implements controls to mitigate them.
- Performance Monitoring: Tracks financial metrics and KPIs to evaluate business health.
- Decision Support: Provides data-driven insights to inform budgeting, forecasting, and investment decisions.
Mind Map: Role of Performance Management in Corporate Finance
How Performance Management Supports Corporate Finance Objectives
-
Improving Financial Transparency: Through regular reporting and analysis, performance management provides clear visibility into financial performance, enabling timely interventions.
-
Enhancing Accountability: By setting measurable targets and tracking outcomes, departments and individuals are held accountable for financial results.
-
Driving Efficiency: Identifying underperforming areas allows finance teams to optimize processes and reduce costs.
-
Facilitating Strategic Planning: Performance data informs long-term financial planning and capital allocation decisions.
Example: Performance Management in Action at a Corporate Finance Department
A multinational corporation implemented a performance management system that linked departmental KPIs directly to corporate financial goals. For example, the treasury team’s KPI was to maintain a debt-to-equity ratio within a target range. Monthly reports highlighted deviations, prompting timely corrective actions such as refinancing or adjusting capital structure. This proactive approach helped the company maintain financial stability and investor confidence.
Mind Map: Example - Treasury Department Performance Management
Best Practice: Integrating Performance Management into Corporate Finance
- Set Clear Financial KPIs: Define measurable and relevant KPIs aligned with strategic goals.
- Use Real-Time Data: Leverage technology to gather and analyze financial data continuously.
- Engage Stakeholders: Ensure collaboration between finance, operations, and executive teams.
- Regular Review Cycles: Conduct frequent performance reviews to identify issues and opportunities.
- Continuous Improvement: Use insights to refine financial strategies and processes.
Summary
Performance management is essential in corporate finance to translate strategy into measurable financial outcomes. By systematically monitoring and managing financial performance, organizations can enhance decision-making, mitigate risks, and achieve sustainable growth.
1.3 Key Stakeholders: Accountants and Performance Analysts
In the realm of performance measurement and management, understanding the roles and responsibilities of key stakeholders is crucial for effective implementation and continuous improvement. Two of the most pivotal roles are those of Accountants and Performance Analysts. Both contribute uniquely to the process, ensuring that performance metrics are accurate, relevant, and actionable.
The Role of Accountants
Accountants are traditionally seen as the custodians of financial data. Their expertise ensures that the financial information used in performance measurement is accurate, compliant, and timely. Beyond bookkeeping, accountants play a strategic role in interpreting financial results and linking them to broader organizational goals.
Key Responsibilities:
- Ensuring accuracy and integrity of financial data
- Preparing financial statements and reports
- Supporting budgeting and forecasting processes
- Identifying cost drivers and financial risks
- Collaborating with other departments to align financial and operational data
Example: Consider a corporate finance team in a manufacturing company. Accountants here not only prepare monthly financial reports but also analyze cost variances and provide insights into how production inefficiencies affect profitability. Their input is critical in setting realistic performance targets.
The Role of Performance Analysts
Performance Analysts specialize in collecting, analyzing, and interpreting data related to organizational performance. They focus on both financial and non-financial metrics, providing a holistic view of how well the organization is meeting its objectives.
Key Responsibilities:
- Designing and maintaining performance measurement systems
- Selecting and defining Key Performance Indicators (KPIs)
- Conducting trend and variance analysis
- Preparing dashboards and visual reports
- Facilitating performance review meetings
Example: In a retail corporation, performance analysts track sales KPIs, customer satisfaction scores, and inventory turnover rates. By integrating these data points, they identify underperforming stores and recommend targeted interventions.
Mind Map: Stakeholder Roles in Performance Measurement
Collaboration Between Accountants and Performance Analysts
Effective performance measurement requires seamless collaboration between accountants and performance analysts. While accountants provide the financial backbone, analysts contextualize this data within operational and strategic frameworks.
Example: In a corporate finance department, accountants prepare the monthly financial statements. Performance analysts then use this data alongside operational metrics to create a balanced scorecard report. Together, they identify areas where financial performance lags operational efficiency, enabling targeted management actions.
Mind Map: Collaboration Workflow
Real-World Example: Balanced Scorecard Implementation
A mid-sized technology firm implemented a balanced scorecard to improve performance management. Accountants ensured that financial metrics such as revenue growth and cost control were accurately reported. Performance analysts integrated these with customer satisfaction and internal process KPIs.
The collaboration led to:
- Clear visibility of financial and non-financial performance
- Improved decision-making based on comprehensive data
- Enhanced accountability across departments
Summary
Accountants and Performance Analysts are indispensable stakeholders in performance measurement and management. Their combined expertise ensures that performance data is both reliable and insightful, enabling organizations to track progress, identify issues, and drive continuous improvement.
1.4 Overview of Common Performance Metrics and KPIs
Performance metrics and Key Performance Indicators (KPIs) are essential tools that help accountants and performance analysts quantify and evaluate the effectiveness and efficiency of business operations. Selecting the right metrics ensures alignment with strategic goals and provides actionable insights.
What Are Performance Metrics and KPIs?
- Performance Metrics: Quantitative measures used to track and assess the status of specific business processes.
- KPIs: A subset of performance metrics that are critical to achieving strategic objectives.
Categories of Common Performance Metrics and KPIs
Detailed Examples of Key Metrics
Financial Metrics
- Revenue Growth: Measures the increase in a company’s sales over a period.
- Example: A corporate finance team tracks quarterly revenue growth to assess market expansion effectiveness.
- Profit Margin: Indicates the percentage of revenue that turns into profit.
- Example: An accountant monitors gross profit margin to identify cost-saving opportunities.
- Return on Investment (ROI): Evaluates the profitability of investments.
- Example: Performance analysts calculate ROI on new software implementation to justify expenses.
Operational Metrics
- Cycle Time: The time taken to complete a process.
- Example: A manufacturing unit tracks cycle time to improve production efficiency.
- Inventory Turnover: How often inventory is sold and replaced.
- Example: Finance teams analyze inventory turnover to optimize working capital.
Customer Metrics
- Customer Satisfaction Score (CSAT): Measures customer satisfaction with products or services.
- Example: A retail company surveys customers post-purchase to improve service quality.
- Net Promoter Score (NPS): Gauges customer loyalty by likelihood to recommend.
- Example: Corporate analysts use NPS to guide marketing strategies.
Employee Metrics
- Employee Productivity: Output per employee over a period.
- Example: HR and finance collaborate to link productivity metrics with compensation.
- Turnover Rate: Percentage of employees leaving the company.
- Example: Performance analysts monitor turnover to identify retention issues.
Project Metrics
- On-Time Delivery: Percentage of projects completed by the deadline.
- Example: Project managers report on-time delivery rates to stakeholders.
- Budget Variance: Difference between budgeted and actual costs.
- Example: Accountants track budget variance to control project expenses.
Mind Map: Financial KPIs Breakdown
Best Practice: Selecting KPIs
- Align KPIs with the organization’s strategic goals.
- Use a balanced mix of financial and non-financial metrics.
- Ensure KPIs are measurable, actionable, and relevant.
Example:
A corporate finance department aiming to improve profitability might select:
- Net Profit Margin to track overall profitability.
- Operating Expense Ratio to control costs.
- Customer Retention Rate to ensure revenue stability.
Summary
Understanding and selecting the right performance metrics and KPIs is foundational for effective performance measurement and management. By integrating financial, operational, customer, employee, and project metrics, accountants and performance analysts can provide a comprehensive view of organizational health and drive informed decision-making.
1.5 Best Practice: Aligning Performance Metrics with Corporate Strategy (Example: Balanced Scorecard in a Mid-Sized Firm)
Aligning performance metrics with corporate strategy is a cornerstone of effective performance measurement and management. Without this alignment, organizations risk measuring activities that do not contribute meaningfully to strategic goals, leading to wasted resources and missed opportunities.
Why Align Performance Metrics with Corporate Strategy?
- Ensures every department and employee works toward common objectives.
- Provides clarity on what success looks like at all organizational levels.
- Facilitates better decision-making by focusing on strategic priorities.
- Enhances accountability and motivation by linking individual and team goals to corporate outcomes.
Introducing the Balanced Scorecard (BSC)
The Balanced Scorecard is a strategic planning and management system that organizations use to:
- Communicate what they are trying to accomplish.
- Align day-to-day work with strategy.
- Prioritize projects, products, and services.
- Measure and monitor progress toward strategic targets.
It balances financial measures with non-financial metrics across four perspectives:
- Financial – How do we look to shareholders?
- Customer – How do customers see us?
- Internal Business Processes – What must we excel at?
- Learning and Growth – Can we continue to improve and create value?
Mind Map: Balanced Scorecard Framework
Example: Implementing Balanced Scorecard in a Mid-Sized Manufacturing Firm
Company Background:
- Mid-sized manufacturing firm with 500 employees.
- Strategic goal: Increase market share by 15% over 3 years while improving operational efficiency.
Step 1: Define Strategic Objectives
- Financial: Increase profitability by 10%.
- Customer: Improve customer satisfaction scores by 20%.
- Internal Processes: Reduce production cycle time by 15%.
- Learning and Growth: Enhance employee skills through targeted training programs.
Step 2: Develop Metrics for Each Perspective
| Perspective | Metric | Target |
|---|---|---|
| Financial | Net Profit Margin | Increase from 8% to 10% |
| Customer | Customer Satisfaction Index | Improve from 75 to 90 |
| Internal Processes | Production Cycle Time (days) | Reduce from 10 to 8.5 |
| Learning & Growth | Average Training Hours/Employee | Increase from 12 to 20 |
Step 3: Align Departmental Goals
- Sales team focuses on customer engagement initiatives.
- Operations team implements lean manufacturing techniques.
- HR develops training modules aligned with skill gaps.
Step 4: Monitor and Review
- Monthly performance dashboards track progress.
- Quarterly strategy review meetings adjust targets and initiatives.
Mind Map: Aligning Metrics with Strategy in the Mid-Sized Firm
Key Takeaways and Best Practices
- Start with Strategy: Clearly articulate strategic goals before selecting metrics.
- Balance Metrics: Use a mix of financial and non-financial indicators.
- Cascade Goals: Translate corporate objectives into departmental and individual targets.
- Use Visual Tools: Mind maps and scorecards help communicate and clarify alignment.
- Regular Reviews: Continuously monitor and adjust metrics to stay aligned with evolving strategy.
By following this best practice, accountants and performance analysts can ensure that performance measurement drives meaningful progress toward strategic success, as demonstrated in the mid-sized manufacturing firm example.
2. Frameworks and Models for Performance Measurement
2.1 The Balanced Scorecard: Structure and Application
The Balanced Scorecard (BSC) is a strategic performance management framework that helps organizations translate their vision and strategy into a coherent set of performance measures. Developed by Robert Kaplan and David Norton in the early 1990s, the BSC goes beyond traditional financial metrics by incorporating non-financial perspectives, enabling a more balanced and comprehensive view of organizational performance.
Structure of the Balanced Scorecard
The Balanced Scorecard typically includes four key perspectives:
- Financial Perspective: Measures reflecting financial performance such as profitability, revenue growth, cost management, and return on investment.
- Customer Perspective: Metrics related to customer satisfaction, retention, acquisition, and market share.
- Internal Business Processes Perspective: Focuses on the efficiency and effectiveness of internal processes that create value.
- Learning and Growth Perspective: Measures related to employee training, development, knowledge management, and organizational culture.
These perspectives ensure that organizations do not focus solely on short-term financial outcomes but also on the drivers of future performance.
Mind Map: Balanced Scorecard Structure
Application of the Balanced Scorecard
The BSC is applied by organizations to:
- Clarify and communicate strategy: Translating high-level strategy into operational terms.
- Align organizational activities: Ensuring all departments and employees work towards common goals.
- Prioritize projects and initiatives: Based on their impact on strategic objectives.
- Monitor performance comprehensively: Using a mix of financial and non-financial indicators.
Example: Balanced Scorecard in a Mid-Sized Financial Services Company
Scenario: A mid-sized financial services firm wants to improve its overall performance by adopting the Balanced Scorecard.
- Financial Perspective: Increase net profit margin by 10% over the next fiscal year.
- Customer Perspective: Improve customer satisfaction scores from 75% to 85%.
- Internal Processes: Reduce loan processing time from 5 days to 3 days.
- Learning and Growth: Provide 20 hours of professional development training per employee annually.
Implementation Steps:
- Define Objectives: Leadership team defines clear objectives for each perspective.
- Select Measures: Identify KPIs such as net profit margin, customer satisfaction index, average loan processing time, and training hours.
- Set Targets: Establish realistic and time-bound targets.
- Communicate: Share the scorecard with all employees and explain their role.
- Monitor and Review: Use monthly dashboards to track progress and adjust strategies as needed.
Mind Map: Balanced Scorecard Application Example
Best Practices for Implementing the Balanced Scorecard
- Link to Strategy: Ensure every metric ties back to strategic objectives.
- Keep it Simple: Focus on a manageable number of KPIs (typically 3-5 per perspective).
- Engage Stakeholders: Involve employees at all levels to foster ownership.
- Use Technology: Employ dashboards and reporting tools for real-time tracking.
- Review Regularly: Update the scorecard periodically to reflect changing priorities.
Additional Example: Balanced Scorecard in a Corporate Finance Department
A corporate finance team uses the BSC to improve budgeting accuracy and stakeholder communication:
- Financial: Reduce budget variance from 8% to 3%.
- Customer (Internal Clients): Increase satisfaction with finance reporting from 70% to 90%.
- Internal Processes: Automate 50% of manual reporting tasks.
- Learning and Growth: Cross-train 80% of team members on financial analysis tools.
This approach helps the finance department align its activities with broader corporate goals and improve service quality.
The Balanced Scorecard is a powerful tool for accountants and performance analysts to measure and manage performance holistically. By integrating financial and non-financial metrics, it drives sustainable organizational success.
2.2 Economic Value Added (EVA) as a Performance Metric
What is Economic Value Added (EVA)?
Economic Value Added (EVA) is a financial performance metric that calculates the value created beyond the required return of a company’s shareholders. It is essentially the net profit after deducting the cost of capital.
Formula:
\[ \text{EVA} = \text{NOPAT} - (\text{Capital Employed} \times \text{WACC}) \]
Where:
- NOPAT = Net Operating Profit After Taxes
- Capital Employed = Total capital invested in the business
- WACC = Weighted Average Cost of Capital
Why Use EVA?
- Measures true economic profit rather than accounting profit.
- Encourages efficient capital use.
- Aligns management decisions with shareholder value creation.
Mind Map: Understanding EVA
Calculating EVA: Step-by-Step Example
Company ABC has the following data for the fiscal year:
- NOPAT: $5,000,000
- Capital Employed: $30,000,000
- WACC: 10%
Calculation:
\[ \text{EVA} = 5,000,000 - (30,000,000 \times 0.10) = 5,000,000 - 3,000,000 = 2,000,000 \]
Interpretation: Company ABC created $2,000,000 of economic value over and above the cost of capital.
Mind Map: EVA Calculation Example
Best Practices for Using EVA
- Accurate Calculation of WACC: Ensure the cost of capital reflects the true risk and financing structure.
- Consistent Capital Employed Measurement: Include all relevant assets and liabilities.
- Adjust NOPAT for Non-Recurring Items: To reflect ongoing operational performance.
- Use EVA in Performance Reviews: Incorporate EVA as a key metric in management evaluations.
- Communicate EVA Clearly: Simplify the concept for non-financial stakeholders.
Example: EVA in a Corporate Finance Department
A corporate finance team at a manufacturing firm implemented EVA to evaluate project performance. They found that while some projects showed strong accounting profits, their EVA was negative due to high capital costs. This insight led to reprioritizing investments towards projects with positive EVA, improving overall shareholder value.
Mind Map: Best Practices & Example
Limitations of EVA
- Requires detailed financial data and adjustments.
- Can be complex for smaller organizations.
- Sensitive to assumptions in WACC and capital employed.
Summary
Economic Value Added (EVA) is a powerful metric that helps accountants and performance analysts assess true economic profit by factoring in the cost of capital. When applied correctly, EVA drives better decision-making and aligns management incentives with shareholder interests.
For further reading, consider exploring how EVA integrates with other performance frameworks like the Balanced Scorecard or how technology tools can automate EVA calculations.
2.3 Key Performance Indicators (KPIs): Selection and Prioritization
Key Performance Indicators (KPIs) are quantifiable measures that help organizations track progress toward their strategic and operational goals. Selecting and prioritizing the right KPIs is critical for ensuring that performance measurement efforts are meaningful, actionable, and aligned with corporate objectives.
Understanding KPIs
- KPIs provide a focus for strategic and operational improvement.
- They help communicate what is important to the organization.
- KPIs enable performance monitoring over time.
Steps to Select and Prioritize KPIs
-
Align KPIs with Strategic Objectives
- Identify the organization’s key goals.
- Ensure KPIs reflect these goals directly.
-
Define Clear and Measurable Metrics
- KPIs must be quantifiable.
- Avoid ambiguous or subjective measures.
-
Consider Relevance and Impact
- Select KPIs that significantly influence business outcomes.
- Prioritize KPIs that drive decision-making.
-
Limit the Number of KPIs
- Focus on a manageable set (typically 5-10 per business unit).
- Too many KPIs dilute focus and complicate reporting.
-
Ensure Data Availability and Quality
- Confirm that reliable data sources exist.
- Assess the frequency and ease of data collection.
-
Review and Adjust Regularly
- KPIs should evolve with business priorities.
- Regularly validate their continued relevance.
Mind Map: KPI Selection Process
Examples of KPI Selection and Prioritization
Example 1: Corporate Finance Department
- Strategic Goal: Improve profitability and cash flow management.
- Selected KPIs:
- EBITDA Margin (%)
- Days Sales Outstanding (DSO)
- Operating Cash Flow
- Cost-to-Income Ratio
Prioritization Reasoning:
- EBITDA Margin reflects overall profitability.
- DSO impacts cash flow and working capital.
- Operating Cash Flow shows liquidity health.
- Cost-to-Income Ratio measures operational efficiency.
Example 2: Performance Analyst in a Retail Company
- Strategic Goal: Enhance customer satisfaction and sales growth.
- Selected KPIs:
- Customer Satisfaction Score (CSAT)
- Sales Growth Rate (%)
- Inventory Turnover
- Average Transaction Value
Prioritization Reasoning:
- CSAT directly ties to customer experience.
- Sales Growth Rate tracks revenue expansion.
- Inventory Turnover affects stock management and costs.
- Average Transaction Value indicates sales effectiveness.
Mind Map: KPI Prioritization Criteria
Best Practice: Using a KPI Prioritization Matrix
A KPI Prioritization Matrix helps visualize and rank KPIs based on two dimensions: Impact and Feasibility.
| KPI | Impact (High/Low) | Feasibility (High/Low) | Priority |
|---|---|---|---|
| EBITDA Margin | High | High | High |
| Customer Satisfaction | High | Medium | High |
| Social Media Mentions | Low | High | Low |
| Employee Turnover | Medium | Medium | Medium |
This approach ensures focus on KPIs that provide the greatest value and are practical to measure.
Summary
Selecting and prioritizing KPIs is a strategic exercise that requires alignment with business goals, clarity in measurement, and practical considerations around data and reporting. By focusing on a concise set of high-impact KPIs, accountants and performance analysts can drive meaningful insights and support effective decision-making.
For further reading, explore how the Balanced Scorecard framework integrates KPI selection across financial, customer, internal process, and learning perspectives.
2.4 Benchmarking: Internal and External Approaches
Benchmarking is a critical practice in performance measurement and management that involves comparing an organization’s processes, metrics, and performance against best practices from within the organization or from other organizations. It helps identify gaps, set realistic targets, and drive continuous improvement.
What is Benchmarking?
Benchmarking is the systematic process of measuring and comparing an organization’s performance against peers or internal standards to understand where improvements are needed and how to achieve them.
Types of Benchmarking
- Internal Benchmarking: Comparing performance metrics across different departments, teams, or units within the same organization.
- External Benchmarking: Comparing performance against other organizations, competitors, or industry standards.
Internal Benchmarking
Internal benchmarking focuses on leveraging existing organizational data to identify best practices and performance gaps.
Example: A corporate finance department compares the month-end closing process duration across its regional offices. If the Asia-Pacific office completes the process in 5 days while the Europe office takes 7 days, the Europe team can learn from Asia-Pacific’s practices to improve efficiency.
Mind Map: Internal Benchmarking
External Benchmarking
External benchmarking involves comparing your organization’s performance with that of competitors or industry leaders.
Example: A performance analyst in a corporate finance team benchmarks the company’s return on equity (ROE) against top competitors in the finance sector. If the company’s ROE is 8% while competitors average 12%, this highlights an opportunity to investigate and improve financial strategies.
Mind Map: External Benchmarking
Best Practices for Effective Benchmarking
- Define Clear Objectives: Understand what you want to measure and why.
- Select Relevant Metrics: Choose KPIs that align with strategic goals.
- Use Reliable Data Sources: Ensure data accuracy and comparability.
- Engage Stakeholders: Involve teams to encourage buy-in and knowledge sharing.
- Analyze Gaps and Root Causes: Go beyond numbers to understand underlying issues.
- Implement Improvement Plans: Use insights to drive actionable changes.
- Monitor Progress: Continuously track performance against benchmarks.
Integrated Example: Benchmarking in a Corporate Finance Context
A corporate finance team at a multinational company wants to improve its budgeting process. They start with internal benchmarking by comparing the budgeting cycle times of different regional offices. They find that the North America office completes budgeting in 3 weeks, while the Asia-Pacific office takes 5 weeks.
Next, they perform external benchmarking by reviewing industry reports and learning that leading companies in their sector complete budgeting in 2-3 weeks.
Using these insights, the team identifies process bottlenecks in Asia-Pacific and adopts best practices from North America and industry leaders, such as automating data collection and improving cross-department communication.
Mind Map: Benchmarking Process Example
Summary
Benchmarking, both internal and external, is an indispensable tool for accountants and performance analysts aiming to elevate organizational performance. By systematically comparing processes and outcomes, organizations can uncover improvement opportunities, adopt best practices, and maintain competitive advantage.
Through clear objectives, relevant metrics, and continuous monitoring, benchmarking transforms performance measurement from a static report into a dynamic management tool driving sustainable growth.
2.5 Best Practice: Implementing a Balanced Scorecard with Real-World Example from a Financial Services Company
Introduction
The Balanced Scorecard (BSC) is a strategic planning and management system widely used in business and industry, government, and nonprofit organizations worldwide to align business activities to the vision and strategy of the organization, improve internal and external communications, and monitor organizational performance against strategic goals.
In this section, we’ll explore best practices for implementing a Balanced Scorecard, specifically within a financial services company, supported by clear examples and mind maps to visualize the process.
What is a Balanced Scorecard?
The Balanced Scorecard translates an organization’s mission and vision statements into a comprehensive set of performance measures that provides the framework for a strategic measurement and management system.
It typically includes four perspectives:
- Financial Perspective
- Customer Perspective
- Internal Business Processes Perspective
- Learning and Growth Perspective
Best Practice Steps for Implementing a Balanced Scorecard
Clarify Vision and Strategy
- Ensure leadership has a clear, communicated vision and strategy.
- Engage key stakeholders early.
Develop Objectives for Each Perspective
- Define strategic objectives that align with the vision.
- Objectives should be specific, measurable, achievable, relevant, and time-bound (SMART).
Select Measures and KPIs
- Choose key performance indicators that effectively measure progress toward objectives.
- Balance leading and lagging indicators.
Set Targets and Initiatives
- Establish realistic targets for each KPI.
- Identify initiatives or projects to achieve targets.
Communicate and Link to Individual Goals
- Cascade the scorecard to departments and individuals.
- Link performance reviews and incentives to scorecard outcomes.
Monitor, Review, and Adapt
- Use dashboards and regular reviews to track progress.
- Adjust objectives and measures as necessary.
Mind Map: Balanced Scorecard Implementation Process
Real-World Example: Financial Services Company “FinServe”
Background: FinServe is a mid-sized financial services company specializing in wealth management and investment advisory. They faced challenges with fragmented performance measurement and lack of strategic alignment across departments.
Implementation Highlights:
-
Vision: “To be the most trusted partner in wealth creation.”
-
Step 1: Clarify Vision and Strategy
- Leadership workshops to define strategic priorities.
-
Step 2: Develop Objectives
- Financial: Increase revenue by 15% annually.
- Customer: Improve customer satisfaction scores by 20%.
- Internal Processes: Reduce client onboarding time by 30%.
- Learning & Growth: Enhance employee training hours by 25%.
-
Step 3: Select KPIs
- Financial: Revenue growth rate, profit margin.
- Customer: Net Promoter Score (NPS), customer retention rate.
- Internal Processes: Average onboarding time, process error rate.
- Learning & Growth: Training hours per employee, employee engagement score.
-
Step 4: Set Targets and Initiatives
- Targets aligned with objectives.
- Initiatives included digital onboarding platform, customer service training.
-
Step 5: Communication and Alignment
- Scorecards cascaded to departments.
- Individual goals linked to KPIs.
-
Step 6: Monitor and Review
- Monthly dashboard reviews.
- Quarterly strategy meetings.
Mind Map: FinServe Balanced Scorecard Example
Key Takeaways from FinServe’s Implementation
- Strategic Alignment: Clear linkage of objectives to company vision ensured all employees understood their role in strategy execution.
- Balanced Metrics: Combining financial and non-financial KPIs provided a holistic view of performance.
- Communication: Cascading scorecards fostered accountability and engagement.
- Technology Use: Dashboards enabled real-time monitoring and quick decision-making.
Additional Example: Simplified Balanced Scorecard for a Corporate Finance Team
| Perspective | Objective | KPI | Target | Initiative |
|---|---|---|---|---|
| Financial | Improve cost efficiency | Cost-to-income ratio | Reduce by 10% | Implement cost tracking software |
| Customer | Enhance internal client service | Internal client satisfaction | 90% satisfaction | Quarterly feedback sessions |
| Internal Processes | Speed up financial reporting | Report turnaround time | 2 days | Automate report generation |
| Learning & Growth | Develop team skills | Training hours per employee | 40 hours/year | Monthly training workshops |
Summary
Implementing a Balanced Scorecard in a financial services company requires a structured approach that ties strategic vision to measurable objectives across multiple perspectives. Using real-world examples like FinServe helps illustrate how best practices can be applied effectively, ensuring that performance measurement drives meaningful business outcomes.
References & Further Reading
- Kaplan, R.S., & Norton, D.P. (1996). The Balanced Scorecard: Translating Strategy into Action.
- Harvard Business Review articles on Balanced Scorecard implementations.
- Case studies from financial services firms adopting BSC.
3. Designing Effective Performance Measurement Systems
3.1 Identifying Relevant Metrics for Different Business Units
Performance measurement is most effective when the metrics used are tailored to the specific functions and goals of each business unit. Different units contribute uniquely to the overall corporate objectives, so identifying relevant metrics ensures that performance measurement drives meaningful insights and actionable outcomes.
Why Tailor Metrics to Business Units?
- Alignment with Objectives: Each unit has distinct goals; metrics must reflect these to measure true performance.
- Improved Decision-Making: Relevant metrics provide clarity on what works and what needs improvement.
- Motivation and Accountability: Teams are more engaged when their performance is measured by meaningful indicators.
Common Business Units and Their Typical Metrics
| Business Unit | Typical Metrics Examples |
|---|---|
| Finance | Return on Investment (ROI), Economic Value Added (EVA), Cash Flow, Budget Variance |
| Sales | Sales Growth, Customer Acquisition Cost (CAC), Conversion Rate, Average Deal Size |
| Marketing | Customer Lifetime Value (CLV), Lead-to-Customer Rate, Marketing ROI, Website Traffic |
| Operations | Cycle Time, Defect Rate, Capacity Utilization, On-Time Delivery |
| Human Resources | Employee Turnover Rate, Time to Hire, Employee Engagement Score |
| Customer Service | Net Promoter Score (NPS), First Response Time, Customer Satisfaction (CSAT) |
Mind Map: Identifying Relevant Metrics by Business Unit
Step-by-Step Approach to Identify Relevant Metrics
- Understand Business Unit Objectives: Meet with unit leaders to clarify goals.
- Map Activities to Outcomes: Identify key processes that drive results.
- Select Metrics That Reflect Success: Choose KPIs that measure progress toward objectives.
- Validate with Stakeholders: Ensure metrics are practical and accepted.
- Review and Adjust Regularly: Metrics should evolve with business changes.
Example 1: Finance Department
- Objective: Maximize profitability and ensure liquidity.
- Relevant Metrics:
- Return on Investment (ROI): Measures profitability relative to invested capital.
- Cash Flow: Tracks liquidity to meet obligations.
- Budget Variance: Compares actual spending to budgeted amounts.
Example: A corporate finance team uses budget variance reports monthly to identify departments overspending, enabling timely corrective actions.
Example 2: Sales Department
- Objective: Increase revenue and market share.
- Relevant Metrics:
- Sales Growth: Measures increase in sales over time.
- Customer Acquisition Cost (CAC): Cost to acquire a new customer.
- Conversion Rate: Percentage of leads converted to customers.
Example: A sales team tracks CAC alongside sales growth to ensure marketing spend is efficient and sustainable.
Mind Map: Step-by-Step Identification Process
Best Practice: Cross-Functional Collaboration
Engage representatives from different units to share insights and ensure metrics are comprehensive and aligned. For example, finance and operations collaborating to develop metrics that balance cost control with production efficiency.
Summary
Identifying relevant metrics for each business unit is critical for effective performance measurement. By understanding unit-specific objectives, mapping key activities, and selecting appropriate KPIs, accountants and performance analysts can provide targeted insights that drive strategic decisions and operational improvements.
3.2 Data Collection Methods and Ensuring Data Integrity
Effective performance measurement relies heavily on accurate and reliable data collection. In this section, we explore various data collection methods and best practices to ensure data integrity, with practical examples tailored for accountants and performance analysts.
Data Collection Methods
Data collection methods can be broadly categorized into manual and automated techniques. Each has its advantages and challenges.
Manual Data Collection
- Description: Data is gathered by individuals through surveys, interviews, observation, or manual entry.
- Example: An accountant manually compiling monthly expense reports from paper receipts.
- Advantages: Flexible, allows qualitative insights.
- Challenges: Time-consuming, prone to human error.
Automated Data Collection
- Description: Use of technology such as software systems, sensors, or APIs to collect data automatically.
- Example: Using ERP systems to automatically capture sales and cost data.
- Advantages: Faster, reduces human error, real-time data availability.
- Challenges: Initial setup cost, requires technical expertise.
Hybrid Data Collection
- Description: Combination of manual and automated methods to balance flexibility and efficiency.
- Example: Automated extraction of financial data supplemented by manual validation.
Mind Map: Data Collection Methods
Ensuring Data Integrity
Data integrity refers to the accuracy, consistency, and reliability of data throughout its lifecycle. Maintaining data integrity is critical for trustworthy performance measurement.
Key Practices to Ensure Data Integrity:
-
Validation and Verification
- Cross-check data entries against source documents.
- Example: Reconcile bank statements with recorded transactions monthly.
-
Access Controls
- Restrict data entry and modification rights to authorized personnel.
- Example: Only senior accountants can approve adjustments in the financial system.
-
Audit Trails
- Maintain logs of data changes to track who made what changes and when.
- Example: ERP systems that record user activities for compliance.
-
Data Standardization
- Use consistent formats and definitions for data fields.
- Example: Standardize date formats (YYYY-MM-DD) across all reports.
-
Regular Backups
- Schedule frequent backups to prevent data loss.
- Example: Daily automated backups of financial databases.
-
Training and Awareness
- Educate staff on data handling best practices.
- Example: Workshops for performance analysts on data entry protocols.
Mind Map: Ensuring Data Integrity
Practical Example: Implementing Data Collection and Integrity in a Corporate Finance Team
Scenario: A corporate finance team is tasked with measuring monthly departmental expenses to monitor budget adherence.
-
Data Collection Method: They use an automated ERP system that collects expense data from various departments. However, some smaller departments submit manual expense reports.
-
Ensuring Data Integrity:
- The finance team validates manual reports by cross-checking with receipts.
- Access to the ERP expense module is restricted to finance managers.
- All changes in the ERP are logged with user IDs and timestamps.
- Standardized expense categories are used to avoid confusion.
- Daily backups ensure no data is lost.
- Regular training sessions keep the team updated on data handling best practices.
This hybrid approach ensures comprehensive data collection while maintaining high data integrity.
Summary
Accurate performance measurement depends on selecting appropriate data collection methods and rigorously maintaining data integrity. Accountants and performance analysts should leverage a mix of manual and automated techniques, supported by strong controls and validation processes, to ensure reliable and actionable insights.
3.3 Integrating Financial and Non-Financial Measures
Performance measurement in corporate finance often focuses heavily on financial metrics such as revenue, profit margins, and return on investment. However, relying solely on financial measures can provide an incomplete picture of organizational health and future potential. Integrating non-financial measures alongside financial ones creates a balanced and comprehensive performance management system that drives sustainable success.
Why Integrate Financial and Non-Financial Measures?
- Holistic View: Financial results reflect past performance, while non-financial indicators often signal future outcomes.
- Balanced Decision-Making: Helps avoid overemphasis on short-term financial gains at the expense of long-term growth.
- Improved Strategy Execution: Aligns operational activities with strategic objectives.
Common Financial Measures
- Revenue Growth
- Profit Margins
- Return on Assets (ROA)
- Economic Value Added (EVA)
- Cash Flow
Common Non-Financial Measures
- Customer Satisfaction and Retention
- Employee Engagement and Turnover
- Process Efficiency and Quality
- Innovation Rate (e.g., new products launched)
- Environmental, Social, and Governance (ESG) Metrics
Mind Map: Integrating Financial and Non-Financial Measures
Best Practice Example: Balanced Scorecard Approach
The Balanced Scorecard (BSC) framework is a widely adopted method to integrate financial and non-financial measures. It organizes performance metrics into four perspectives:
- Financial Perspective: Measures profitability, growth, and shareholder value.
- Customer Perspective: Tracks customer satisfaction, loyalty, and market share.
- Internal Business Processes: Focuses on operational efficiency and quality.
- Learning and Growth: Measures employee skills, culture, and innovation.
Example: A corporate finance department in a manufacturing company uses the BSC to track:
- Financial: Operating profit margin, cost reduction targets.
- Customer: On-time delivery rate, customer complaint resolution time.
- Internal Processes: Production cycle time, defect rates.
- Learning & Growth: Employee training hours, number of process improvement initiatives.
This integration helps the company not only monitor financial outcomes but also identify operational bottlenecks and employee development needs that impact financial results.
Example: Linking Customer Satisfaction to Financial Performance
A retail company noticed a decline in quarterly profits. By integrating customer satisfaction surveys (a non-financial measure) with financial data, the performance analysts discovered that poor customer service was driving down repeat purchases.
Action Taken: The company invested in staff training and improved customer service protocols.
Result: Within two quarters, customer satisfaction scores improved by 15%, and revenue increased by 8%, demonstrating how non-financial measures can directly influence financial outcomes.
Mind Map: Example of Customer Satisfaction Impact on Financials
Practical Tips for Integration
- Select Relevant Metrics: Choose non-financial measures that directly influence financial outcomes.
- Use Data Visualization: Dashboards that combine financial and non-financial KPIs improve understanding.
- Regular Review: Incorporate both types of measures in performance reviews.
- Communicate the Link: Help teams understand how non-financial activities impact financial results.
Case Study: Manufacturing Firm’s Integration Success
A mid-sized manufacturing firm integrated machine downtime (non-financial) with production costs (financial). By tracking downtime causes and correlating them with cost overruns, the firm identified inefficient maintenance schedules as a root cause.
Solution: Implemented predictive maintenance.
Outcome: Reduced downtime by 20%, lowered production costs by 12%, and improved profit margins.
Summary
Integrating financial and non-financial measures is essential for a comprehensive performance management system. It enables accountants and performance analysts to uncover deeper insights, drive strategic decisions, and foster sustainable growth. Using frameworks like the Balanced Scorecard and leveraging real-world examples can help organizations successfully implement this integration.
3.4 Best Practice: Using Automated Data Collection Tools to Enhance Accuracy (Example: ERP Integration in Manufacturing)
In today’s fast-paced corporate environment, the accuracy and timeliness of data collection are critical for effective performance measurement and management. Manual data entry is prone to errors, delays, and inconsistencies, which can mislead decision-making and reduce overall organizational efficiency. Automated data collection tools, particularly through ERP (Enterprise Resource Planning) system integration, provide a robust solution to these challenges.
Why Automate Data Collection?
- Accuracy: Reduces human errors caused by manual entry.
- Timeliness: Enables real-time or near-real-time data availability.
- Consistency: Standardizes data formats and collection methods.
- Efficiency: Frees up staff time for analysis rather than data gathering.
- Traceability: Provides audit trails for compliance and review.
ERP Integration in Manufacturing: A Practical Example
Manufacturing companies often deal with complex operations involving inventory management, production scheduling, quality control, and financial tracking. Integrating automated data collection tools within an ERP system can streamline these processes.
Example Scenario:
A mid-sized manufacturing firm implemented an ERP system that automatically collects data from shop floor machines, inventory scanners, and quality control devices.
-
Data Sources:
- Machine sensors capturing production speed, downtime, and output quality.
- Barcode scanners tracking raw materials and finished goods.
- Quality control systems logging defect rates and inspection results.
-
ERP Functions:
- Centralizes data into a unified database.
- Automatically updates inventory levels and production status.
- Generates real-time performance dashboards for managers.
-
Outcome:
- Improved accuracy in production reporting.
- Faster identification of bottlenecks and quality issues.
- Enhanced ability to forecast and plan based on reliable data.
Mind Map: Benefits of Automated Data Collection via ERP
Mind Map: ERP Integration Workflow in Manufacturing
Practical Tips for Successful ERP Data Integration
- Identify Key Data Points: Focus on metrics that directly impact performance measurement such as production output, defect rates, and inventory levels.
- Ensure System Compatibility: Verify that shop floor devices and ERP software can communicate effectively, possibly using middleware or APIs.
- Pilot Testing: Start with a small-scale pilot to troubleshoot integration issues before full deployment.
- Train Staff: Equip employees with the knowledge to use automated tools and interpret the data outputs.
- Maintain Data Quality: Regularly audit automated data streams to detect anomalies or sensor malfunctions.
Example: Impact on Performance Measurement
Before ERP integration, the manufacturing firm relied on manual logs updated at the end of each shift. This caused delays and occasional inaccuracies in production data.
After integration:
- Production data was available in real-time.
- Managers could immediately react to machine downtime.
- Quality issues were detected earlier, reducing scrap rates by 15%.
- Inventory discrepancies dropped by 20%, improving procurement planning.
This example illustrates how automated data collection through ERP integration not only enhances accuracy but also drives better performance management outcomes.
Summary
Automated data collection tools, when integrated with ERP systems, provide a powerful best practice for accountants and performance analysts aiming to enhance data accuracy and operational efficiency. By leveraging real-time, consistent, and reliable data, organizations can make more informed decisions, improve performance tracking, and ultimately achieve strategic goals with greater confidence.
3.5 Case Study: Designing a Performance Measurement System for a Corporate Finance Department
Introduction
Designing an effective performance measurement system (PMS) for a corporate finance department is critical to ensure alignment with organizational goals, enhance decision-making, and improve overall financial health. This case study walks through the process of creating a PMS tailored to a mid-sized corporation’s finance department, highlighting best practices and practical examples.
Step 1: Define Objectives and Scope
The first step is to clearly define what the finance department aims to achieve through performance measurement. Typical objectives include:
- Improving financial reporting accuracy
- Enhancing budget management
- Monitoring cost control
- Supporting strategic decision-making
Example: The finance department of “ABC Corp” wanted to reduce budget variances by 15% within one fiscal year and improve the timeliness of monthly financial reports.
Step 2: Identify Key Performance Indicators (KPIs)
KPIs should be relevant, measurable, and aligned with the department’s objectives. For a corporate finance department, common KPIs include:
- Budget Variance (%): Measures the difference between budgeted and actual expenses/revenues.
- Report Timeliness (Days): Tracks how quickly financial reports are delivered after month-end.
- Cost per Transaction: Evaluates efficiency in processing financial transactions.
- Days Sales Outstanding (DSO): Measures the average number of days to collect receivables.
- Return on Investment (ROI) for Finance Projects: Assesses the value generated from finance initiatives.
Mind Map: KPIs for Corporate Finance Department
Step 3: Data Collection and Integration
To ensure accuracy and timeliness, data should be collected from multiple sources and integrated into a centralized system.
Example: ABC Corp integrated their ERP system with a Business Intelligence (BI) tool to automate data extraction for KPIs such as budget variance and report timeliness.
Best Practice: Use automated data feeds where possible to reduce manual errors and improve update frequency.
Step 4: Establish Reporting and Visualization Tools
Effective visualization helps stakeholders quickly understand performance trends and issues.
Example: ABC Corp implemented a dashboard using Power BI that displayed real-time KPI updates, including color-coded alerts for budget overruns and delayed reports.
Mind Map: Reporting Components
Step 5: Set Targets and Benchmarks
Targets should be realistic and based on historical data or industry standards.
Example: ABC Corp set a target to reduce budget variance to under 5% and achieve report delivery within 3 business days after month-end.
Step 6: Implement Review and Feedback Mechanisms
Regular performance reviews enable continuous improvement.
Example: Monthly review meetings were scheduled at ABC Corp where finance analysts presented KPI trends, identified bottlenecks, and proposed corrective actions.
Best Practice: Encourage open dialogue and use data-driven insights to guide decisions.
Step 7: Continuous Improvement
The PMS should evolve based on feedback and changing business needs.
Example: After six months, ABC Corp added a new KPI measuring automation rate in transaction processing to further improve operational efficiency.
Summary Mind Map: Designing a Performance Measurement System
Additional Practical Examples
-
Example 1: A finance department at a technology firm used variance analysis to identify that marketing expenses were consistently exceeding budgets due to untracked vendor contracts. By adding a KPI for contract compliance, they reduced overspending by 12% in the next quarter.
-
Example 2: A retail company’s finance team implemented a KPI for report error rate. By introducing peer reviews and automated checks, they decreased errors by 30%, improving stakeholder confidence.
Conclusion
Designing a performance measurement system for a corporate finance department requires a structured approach that aligns KPIs with strategic goals, leverages technology for data accuracy, and fosters a culture of continuous improvement. Through clear objectives, relevant KPIs, and effective reporting, finance teams can drive better decision-making and contribute significantly to organizational success.
4. Performance Management Processes and Cycles
4.1 Setting Performance Targets and Benchmarks
Setting performance targets and benchmarks is a foundational step in effective performance measurement and management. It establishes clear expectations, motivates teams, and provides a basis for evaluating success.
What Are Performance Targets?
Performance targets are specific, measurable goals that an organization or individual aims to achieve within a defined timeframe. They should be aligned with the overall corporate strategy and reflect realistic yet challenging objectives.
What Are Benchmarks?
Benchmarks are standards or reference points derived from internal historical data or external industry best practices. They help organizations understand where they stand relative to peers or past performance.
Key Principles for Setting Performance Targets and Benchmarks
- SMART Criteria: Targets should be Specific, Measurable, Achievable, Relevant, and Time-bound.
- Alignment: Ensure targets align with corporate objectives and departmental goals.
- Data-Driven: Use historical data and industry benchmarks to inform realistic target setting.
- Flexibility: Allow for adjustments based on changing business conditions.
Mind Map: Components of Effective Performance Targets
Mind Map: Sources for Benchmarking
Example 1: Setting Targets in a Corporate Finance Department
Scenario: A corporate finance team wants to improve the accuracy of its monthly financial forecasts.
- Current Situation: Forecast accuracy is at 85%.
- Target: Improve forecast accuracy to 92% within 6 months.
- Benchmark: Industry average forecast accuracy is 90%.
Approach:
- Use historical forecast data to understand current performance.
- Review industry reports to identify the 90% benchmark.
- Set a SMART target of 92% to push beyond the industry average.
- Implement monthly review meetings to track progress.
Mind Map: Steps to Set Performance Targets
Example 2: Benchmarking Sales Performance in a Corporate Setting
Scenario: A performance analyst is tasked with setting sales targets for the next quarter.
- Internal Benchmark: Last quarter’s sales growth was 5%.
- External Benchmark: Competitors in the sector averaged 7% growth.
Target Setting:
- Set a sales growth target of 6.5% to exceed internal past performance but remain realistic compared to competitors.
- Break down target by region and product line for more granular management.
Best Practice: Collaborative Target Setting
Engage cross-functional teams including accountants, analysts, and department heads to ensure targets are realistic and supported. This collaboration fosters ownership and improves the quality of targets.
Summary
Setting performance targets and benchmarks requires a balance between ambition and realism. Using SMART criteria, leveraging internal and external data, and involving stakeholders ensures targets drive meaningful performance improvements.
For accountants and performance analysts, mastering this process is critical to delivering actionable insights and steering corporate success.
4.2 Continuous Monitoring and Reporting Techniques
Continuous monitoring and reporting are critical components of effective performance management. They ensure that organizations can track progress against goals in real time, identify issues early, and make informed decisions promptly. For accountants and performance analysts, mastering these techniques helps maintain financial health and operational efficiency.
What is Continuous Monitoring?
Continuous monitoring is the ongoing process of collecting, analyzing, and reporting performance data to ensure that business activities align with strategic objectives. It involves real-time or near-real-time tracking of key performance indicators (KPIs) to detect deviations and opportunities.
Why Continuous Monitoring Matters
- Enables proactive management rather than reactive problem-solving.
- Improves accuracy and timeliness of performance data.
- Supports transparency and accountability.
- Facilitates agile decision-making.
Key Techniques for Continuous Monitoring and Reporting
Automated Data Collection
- Use of software tools (e.g., ERP, BI platforms) to automatically gather data from multiple sources.
- Reduces manual errors and saves time.
Real-Time Dashboards
- Visual displays of KPIs updated in real time.
- Helps stakeholders quickly grasp performance status.
Scheduled Reporting
- Regular reports (daily, weekly, monthly) that summarize performance trends.
- Provides historical context and supports trend analysis.
Exception Reporting
- Alerts triggered when performance metrics fall outside predefined thresholds.
- Focuses attention on critical issues requiring immediate action.
Continuous Feedback Loops
- Incorporating feedback from performance reports into strategy and operations.
- Encourages iterative improvements.
Mind Map: Continuous Monitoring Techniques
Example 1: Automated Data Collection in a Corporate Finance Department
A mid-sized corporation implemented an ERP system that automatically pulls financial data from various departments. This automation reduced the monthly closing process from 10 days to 4 days, enabling faster reporting and decision-making. Accountants no longer had to manually reconcile data, minimizing errors and freeing time for analysis.
Mind Map: Reporting Techniques
Example 2: Real-Time Dashboard in a Retail Chain
A retail chain uses a real-time dashboard to monitor daily sales, inventory turnover, and customer footfall across stores. Performance analysts receive alerts when sales drop below targets or inventory levels become critically low. This immediate insight allows store managers to adjust promotions or reorder stock promptly, improving overall performance.
Best Practice: Integrating Continuous Monitoring with Reporting
- Combine automated data collection with real-time dashboards to provide up-to-date insights.
- Use exception reporting to highlight areas needing urgent attention.
- Schedule regular performance review meetings to discuss reports and implement corrective actions.
- Encourage cross-functional collaboration by sharing dashboards with relevant teams.
Summary
Continuous monitoring and reporting techniques empower accountants and performance analysts to maintain a clear, current view of organizational performance. By leveraging automation, visualization, and timely communication, organizations can respond swiftly to challenges and capitalize on opportunities, driving sustained success.
4.3 Conducting Performance Reviews and Feedback Sessions
Performance reviews and feedback sessions are critical components of an effective performance management cycle. They provide a structured opportunity to evaluate progress against goals, identify areas for improvement, recognize achievements, and align future objectives.
Key Objectives of Performance Reviews
- Assess employee performance relative to established KPIs and targets
- Provide constructive feedback to encourage growth
- Identify training and development needs
- Foster open communication and trust between managers and employees
- Set clear expectations and goals for the next period
Best Practices for Conducting Effective Performance Reviews
-
Prepare Thoroughly
- Review performance data and documentation beforehand
- Gather input from multiple sources if possible (360-degree feedback)
-
Create a Comfortable Environment
- Choose a private, distraction-free setting
- Encourage open dialogue and active listening
-
Use a Balanced Approach
- Highlight strengths and accomplishments
- Discuss areas for improvement with specific examples
-
Set SMART Goals
- Specific, Measurable, Achievable, Relevant, Time-bound
-
Follow-Up and Support
- Agree on action plans
- Schedule regular check-ins to monitor progress
Mind Map: Performance Review Process
Example: Conducting a Performance Review in a Corporate Finance Team
Scenario: Sarah, a performance analyst, is meeting with her manager to review her quarterly performance.
- Preparation: Sarah’s manager reviews her KPI dashboard showing budget variance analysis accuracy, report delivery timeliness, and collaboration feedback.
- Discussion: The manager praises Sarah’s accuracy in variance analysis but notes delays in report submissions due to workload.
- Feedback: Constructive suggestions include prioritizing tasks and leveraging automation tools.
- Goal Setting: They set a goal to reduce report delivery time by 15% over the next quarter and attend a time management workshop.
- Follow-Up: A follow-up meeting is scheduled in six weeks to assess progress.
Mind Map: Feedback Session Techniques
Example: Feedback Session Using the SBI Model (Situation-Behavior-Impact)
Situation: During the monthly financial close process
Behavior: Sarah missed the deadline for submitting the variance report
Impact: This delayed the consolidation process and affected the finance team’s ability to deliver timely insights to senior management
Feedback Delivery: “Sarah, during last month’s financial close (Situation), I noticed the variance report was submitted after the deadline (Behavior). This caused delays in consolidating the financials and impacted our reporting schedule (Impact). Let’s discuss how we can better manage your workload to avoid this in the future.”
Tips for Accountants and Performance Analysts
- Use data-driven insights to support feedback
- Encourage self-assessment before the review
- Maintain a solution-focused mindset
- Document key points and agreed actions
- Follow up consistently to reinforce accountability
By integrating these best practices, examples, and structured approaches, performance reviews and feedback sessions become powerful tools to drive continuous improvement and employee engagement within finance and corporate teams.
4.4 Best Practice: Monthly Performance Review Meetings with Actionable Insights
Monthly performance review meetings are a cornerstone of effective performance management. They provide a structured opportunity for accountants and performance analysts to evaluate progress against targets, identify issues early, and drive continuous improvement. When executed well, these meetings transform raw data into actionable insights that empower teams to make informed decisions.
Why Monthly Reviews Matter
- Timely Identification of Issues: Frequent reviews help catch deviations before they escalate.
- Enhanced Accountability: Regular check-ins promote ownership of goals.
- Data-Driven Decisions: Continuous analysis ensures decisions are based on current, accurate data.
- Alignment: Keeps all stakeholders aligned with organizational objectives.
Example Context: Quarterly Business Reviews (QBRs) in a Retail Chain
A retail chain conducts quarterly business reviews to assess sales performance, inventory turnover, customer satisfaction, and operational efficiency across multiple stores. These reviews are supported by monthly performance meetings at the regional level to ensure continuous monitoring and course correction.
Mind Map: Structure of Monthly Performance Review Meetings
Key Components of Effective Monthly Reviews
-
Preparation and Data Quality
- Ensure data is accurate and up-to-date.
- Use automated tools where possible to reduce manual errors.
- Example: The retail chain uses an integrated ERP system to pull real-time sales and inventory data.
-
Focused Agenda
- Limit the meeting to critical KPIs relevant to the business unit.
- Avoid information overload by prioritizing actionable metrics.
- Example: The retail chain focuses on same-store sales growth, stockouts, and customer satisfaction scores.
-
Insightful Discussion
- Encourage open dialogue to understand the “why” behind the numbers.
- Use variance analysis to highlight areas needing attention.
- Example: A sudden drop in sales in one region prompts investigation revealing supply chain delays.
-
Action-Oriented Outcomes
- Define clear action items with assigned owners and deadlines.
- Track progress in subsequent meetings to ensure accountability.
- Example: Assigning the logistics manager to expedite shipments and reporting status in the next meeting.
-
Use of Visual Tools
- Dashboards and charts help participants quickly grasp performance trends.
- Example: The retail chain uses color-coded heat maps to highlight stores underperforming against targets.
Mind Map: Example Action Plan from a Monthly Review
Practical Tips for Accountants and Performance Analysts
- Prepare concise reports: Highlight only the most relevant data and trends.
- Facilitate rather than dominate: Encourage input from all stakeholders.
- Link metrics to business goals: Ensure every KPI discussed ties back to strategic objectives.
- Document decisions and actions: Maintain a clear record to follow up effectively.
- Leverage technology: Use collaborative platforms for real-time updates and transparency.
Summary
Monthly performance review meetings, exemplified by quarterly business reviews in retail, are vital for maintaining operational excellence. By focusing on actionable insights, clear communication, and accountability, these meetings help organizations stay agile and aligned with their goals. Accountants and performance analysts play a critical role in preparing data, facilitating discussions, and driving follow-through on action plans.
4.5 Using Dashboards and Visualization Tools for Real-Time Performance Tracking
In today’s fast-paced corporate finance environment, real-time performance tracking is essential for timely decision-making and proactive management. Dashboards and visualization tools transform raw data into intuitive visual formats, enabling accountants and performance analysts to quickly grasp complex information and identify trends, anomalies, or areas requiring attention.
Why Use Dashboards and Visualization Tools?
- Immediate Insights: Real-time data updates allow instant visibility into key metrics.
- Simplified Complexity: Visual formats like charts and graphs make large datasets easier to interpret.
- Enhanced Communication: Visuals help align teams by providing a common understanding of performance.
- Proactive Management: Early detection of issues enables faster corrective actions.
Key Features of Effective Dashboards
- Customizability: Tailored views for different roles (e.g., CFO vs. Performance Analyst).
- Interactivity: Filters, drill-downs, and clickable elements for deeper analysis.
- Real-Time Data Integration: Seamless connection with ERP, CRM, and financial systems.
- Clear KPI Presentation: Highlight critical metrics with color coding and alerts.
Mind Map: Components of an Effective Performance Dashboard
Example: Real-Time Dashboard in a Corporate Finance Department
A mid-sized corporation implemented a real-time dashboard integrating data from their ERP and accounting software. The dashboard featured:
- Revenue vs. Target: A line graph updating every hour.
- Expense Breakdown: Interactive pie charts showing departmental spend.
- Cash Flow Status: Gauge indicators with green/yellow/red alerts.
- Accounts Receivable Aging: Heat maps highlighting overdue invoices.
This setup enabled the finance team to identify cash flow bottlenecks early and adjust spending dynamically, improving liquidity management.
Mind Map: Steps to Implement a Real-Time Performance Dashboard
Best Practices for Using Dashboards and Visualization Tools
- Keep It Simple: Avoid clutter; focus on the most impactful KPIs.
- Use Color Wisely: Use colors to indicate status (e.g., red for alerts).
- Enable Drill-Downs: Allow users to explore data behind summary visuals.
- Automate Data Refresh: Ensure data is updated frequently without manual intervention.
- Tailor Views: Customize dashboards based on user roles and responsibilities.
Example: Using Power BI to Track Financial Performance
An accounting team used Power BI to create a dashboard that tracked monthly financial performance. Features included:
- Dynamic filters to view data by region or product line.
- Trend lines showing revenue growth over 12 months.
- Automated alerts for budget overruns.
This empowered performance analysts to quickly generate reports and provide actionable insights to management.
Mind Map: Benefits of Real-Time Performance Tracking
Summary
Using dashboards and visualization tools for real-time performance tracking transforms how accountants and performance analysts monitor and manage corporate finance metrics. By adopting best practices and leveraging modern BI tools, finance teams can enhance decision-making, improve communication, and drive better business outcomes.
5. Advanced Analytical Techniques in Performance Measurement
5.1 Variance Analysis: Identifying Causes of Performance Deviations
Variance analysis is a critical technique in performance measurement and management that helps accountants and performance analysts understand the differences between planned financial outcomes and actual results. By identifying and analyzing these deviations, organizations can pinpoint underlying issues, make informed decisions, and implement corrective actions to improve future performance.
What is Variance Analysis?
Variance analysis involves comparing budgeted or standard costs and revenues against actual figures to determine the magnitude and reasons for any differences (variances). These variances can be either favorable (better than expected) or unfavorable (worse than expected).
Why is Variance Analysis Important?
- Performance Evaluation: Helps assess how well departments or projects are performing against expectations.
- Cost Control: Identifies areas where costs are exceeding budgets.
- Decision Making: Provides insights to guide managerial decisions.
- Accountability: Holds managers responsible for controllable variances.
Types of Variances
- Sales Variance: Difference between actual and budgeted sales revenue.
- Cost Variance: Difference between actual and budgeted costs.
- Material Variance: Includes material price variance and material usage variance.
- Labor Variance: Includes labor rate variance and labor efficiency variance.
- Overhead Variance: Fixed and variable overhead variances.
Mind Map: Overview of Variance Analysis
Step-by-Step Process of Conducting Variance Analysis
- Set Standards or Budgets: Establish expected costs, revenues, and performance levels.
- Collect Actual Data: Gather actual financial and operational data.
- Calculate Variances: Subtract budgeted figures from actual results.
- Analyze Causes: Investigate reasons behind significant variances.
- Report Findings: Communicate insights to relevant stakeholders.
- Take Corrective Actions: Implement changes to address unfavorable variances.
Example: Variance Analysis in a Corporate Finance Team
Scenario: A corporate finance department budgeted $500,000 for office supplies for the quarter. The actual spending was $600,000.
- Variance: $600,000 - $500,000 = $100,000 (Unfavorable)
Analysis:
- Investigate if prices increased unexpectedly (price variance).
- Check if more supplies were used than planned (usage variance).
- Determine if there were any one-time purchases or errors.
Outcome: The team discovers that a new project required additional supplies, explaining the usage variance. They decide to adjust future budgets accordingly and implement tighter approval processes.
Mind Map: Causes of Variance
Best Practice: Applying Variance Analysis to Budget vs Actuals
- Use Detailed Sub-Variance Analysis: Break down large variances into smaller components (e.g., material price vs. material quantity).
- Engage Cross-Functional Teams: Collaborate with procurement, operations, and finance for root cause analysis.
- Leverage Technology: Use ERP and BI tools to automate variance calculations and drill-down analysis.
- Regular Review Cycles: Conduct variance analysis monthly or quarterly to ensure timely interventions.
Example: Material Price and Usage Variance
A manufacturing company budgeted $200,000 for raw materials at $10 per unit for 20,000 units.
- Actual cost: $220,000 for 22,000 units.
Calculations:
-
Material Price Variance: (Actual Price - Standard Price) x Actual Quantity
- Actual Price = $220,000 / 22,000 = $10
- Price Variance = ($10 - $10) x 22,000 = $0 (No price variance)
-
Material Usage Variance: (Actual Quantity - Standard Quantity) x Standard Price
- Usage Variance = (22,000 - 20,000) x $10 = $20,000 (Unfavorable)
Interpretation: The company used 2,000 more units than planned, causing an unfavorable usage variance. This might indicate inefficiencies or increased demand.
Mind Map: Variance Analysis Workflow
Summary
Variance analysis is a foundational tool for accountants and performance analysts to diagnose performance deviations effectively. By systematically identifying the causes behind variances, organizations can enhance financial control, improve operational efficiency, and align performance with strategic goals. Incorporating detailed examples and mind maps helps clarify complex concepts and supports practical application in corporate finance settings.
5.2 Trend Analysis and Forecasting for Proactive Management
Trend analysis and forecasting are critical tools in performance measurement and management that enable accountants and performance analysts to anticipate future outcomes, identify patterns, and make informed decisions proactively. By examining historical data and recognizing trends, organizations can mitigate risks, capitalize on opportunities, and align their strategies more effectively.
What is Trend Analysis?
Trend analysis involves reviewing historical data over a specific period to identify consistent results or patterns. These patterns help predict future performance or behavior.
Example: A corporate finance team analyzing monthly revenue over the past 24 months to detect seasonal fluctuations or growth trends.
What is Forecasting?
Forecasting uses historical data, statistical models, and sometimes qualitative inputs to estimate future values or performance metrics.
Example: Predicting next quarter’s cash flow based on past cash inflows, outflows, and market conditions.
Why Trend Analysis and Forecasting Matter
- Proactive Decision-Making: Enables early identification of potential issues or opportunities.
- Resource Allocation: Helps allocate budgets and resources more efficiently.
- Performance Improvement: Identifies areas needing corrective action before problems escalate.
Mind Map: Components of Trend Analysis and Forecasting
Step-by-Step Trend Analysis Process
- Define Objective: What performance metric or KPI to analyze?
- Gather Data: Collect relevant historical data ensuring accuracy.
- Visualize Data: Use charts/graphs to spot patterns.
- Identify Trends: Look for upward, downward, or cyclical trends.
- Analyze Causes: Understand factors driving trends.
- Document Findings: Record insights for forecasting.
Example: Trend Analysis in Accounts Receivable
A corporate finance team noticed increasing days sales outstanding (DSO) over 6 months. By plotting monthly DSO values, they identified a steady upward trend indicating slower customer payments. Further analysis revealed a recent policy change in credit terms as the cause.
Action: Adjust credit policies and improve collection efforts proactively to avoid cash flow issues.
Forecasting Techniques
Moving Averages
Smooths out short-term fluctuations to highlight longer-term trends.
Example: Calculating a 3-month moving average of monthly sales to predict next month’s sales.
Regression Analysis
Estimates relationships between variables to forecast dependent variables.
Example: Using advertising spend as an independent variable to forecast sales revenue.
Time Series Analysis
Analyzes data points collected or recorded at time intervals.
Example: Seasonal decomposition of sales data to separate trend, seasonal, and residual components.
Mind Map: Forecasting Models
Practical Example: Forecasting Cash Flow Using Time Series
A performance analyst uses historical monthly cash inflows and outflows to build an ARIMA model forecasting cash flow for the next 6 months. The forecast highlights a potential shortfall in month 5.
Proactive Management: The finance team arranges a short-term credit facility in advance, avoiding liquidity crises.
Best Practices for Trend Analysis and Forecasting
- Use clean, accurate, and relevant data.
- Combine multiple forecasting methods for better accuracy.
- Regularly update forecasts with new data.
- Involve cross-functional teams for qualitative insights.
- Visualize trends clearly for stakeholder communication.
Mind Map: Best Practices
Summary
Trend analysis and forecasting empower accountants and performance analysts to move from reactive to proactive management. By understanding past patterns and predicting future outcomes, organizations can improve planning, reduce risks, and enhance overall performance.
Additional Resources
- “Forecasting: Principles and Practice” by Rob J Hyndman & George Athanasopoulos (free online book)
- Online courses on time series analysis and forecasting (Coursera, edX)
- Tutorials on Excel forecasting functions and Power BI visualization
5.3 Predictive Analytics and Machine Learning Applications
Predictive analytics and machine learning (ML) are transforming performance measurement and management by enabling finance professionals to anticipate future trends, identify risks, and optimize decision-making processes. For accountants and performance analysts, leveraging these technologies means moving beyond historical data analysis to proactive and predictive insights.
What is Predictive Analytics?
Predictive analytics uses statistical algorithms and machine learning techniques to analyze historical data and make predictions about future outcomes. It helps organizations forecast revenues, detect anomalies, and improve budgeting accuracy.
What is Machine Learning?
Machine learning is a subset of artificial intelligence that enables systems to learn from data, identify patterns, and make decisions with minimal human intervention. In finance, ML models can automate complex analyses, detect fraud, and optimize resource allocation.
Key Applications in Performance Measurement and Management
- Forecasting Financial Performance: Predict future revenues, expenses, and cash flows to improve budgeting and planning.
- Risk Management: Identify potential financial risks or operational bottlenecks before they impact performance.
- Anomaly Detection: Detect unusual transactions or performance deviations that require attention.
- Resource Optimization: Allocate resources efficiently based on predicted demand or performance trends.
Mind Map: Predictive Analytics and Machine Learning in Finance
Example 1: Applying Predictive Analytics to Cash Flow Forecasting
A corporate finance team uses historical cash inflow and outflow data combined with external economic indicators to train a time series forecasting model. The model predicts cash flow shortages three months in advance, allowing the team to arrange short-term financing proactively.
Best Practice: Integrate multiple data sources (e.g., sales forecasts, payment cycles) to improve model accuracy.
Example 2: Machine Learning for Expense Anomaly Detection
An organization implements an ML-based anomaly detection system that scans expense reports and flags unusual spending patterns, such as duplicate reimbursements or out-of-policy expenses.
Best Practice: Continuously retrain the model with new data and feedback from auditors to reduce false positives.
Mind Map: Steps to Implement Predictive Analytics in Performance Management
Example 3: Predictive Analytics for Budget Variance Analysis
A performance analyst uses regression models to predict budget variances based on historical spending patterns and market conditions. This enables early identification of departments likely to overshoot their budgets, allowing timely corrective actions.
Best Practice: Combine quantitative model outputs with qualitative insights from department heads for balanced decision-making.
Conclusion
Predictive analytics and machine learning empower accountants and performance analysts to shift from reactive to proactive management. By adopting these technologies, finance teams can enhance forecasting accuracy, detect risks early, and optimize resource allocation, ultimately driving better organizational performance.
Further Reading & Tools
- Tools: Python (scikit-learn, TensorFlow), R, SAS, Power BI with AI capabilities
- Concepts: Time Series Analysis, Classification, Clustering
- Resources: Coursera - Machine Learning for Finance, Harvard Business Review articles on Predictive Analytics
5.4 Best Practice: Applying Variance Analysis to Budget vs Actuals in a Corporate Finance Team
Variance analysis is a critical tool in performance measurement that helps corporate finance teams understand the differences between budgeted and actual financial outcomes. By identifying and analyzing these variances, organizations can uncover underlying causes, improve forecasting accuracy, and make informed decisions to enhance financial performance.
What is Variance Analysis?
Variance analysis involves comparing actual financial results against budgeted figures to determine deviations. These deviations, or variances, can be either favorable (better than expected) or unfavorable (worse than expected).
Key components:
- Budgeted Amounts
- Actual Amounts
- Variance = Actual - Budget
- Variance Percentage = (Variance / Budget) * 100
Why is Variance Analysis Important?
- Identifies areas where performance deviates from expectations
- Helps diagnose causes of financial discrepancies
- Supports corrective action and strategic adjustments
- Enhances accountability within departments
- Improves future budgeting and forecasting processes
Mind Map: Core Steps in Variance Analysis
Example: Applying Variance Analysis in a Corporate Finance Team
Scenario: A corporate finance team at a mid-sized manufacturing company is reviewing the monthly budget vs actual report for Q1.
| Category | Budget ($) | Actual ($) | Variance ($) | Variance (%) |
|---|---|---|---|---|
| Sales Revenue | 1,000,000 | 950,000 | -50,000 | -5.0% |
| Cost of Goods Sold | 600,000 | 630,000 | +30,000 | +5.0% |
| Operating Expenses | 200,000 | 180,000 | -20,000 | -10.0% |
| Net Profit | 200,000 | 140,000 | -60,000 | -30.0% |
Analysis:
- Sales Revenue is 5% below budget, indicating lower sales volume or pricing issues.
- Cost of Goods Sold (COGS) is 5% higher than budget, possibly due to increased raw material costs or inefficiencies.
- Operating Expenses are 10% under budget, showing cost control success.
- Net Profit is 30% below budget, driven primarily by lower sales and higher COGS.
Action Steps:
- Investigate sales decline causes (market conditions, competition).
- Review supplier contracts and production processes to control COGS.
- Maintain operating expense discipline.
- Adjust forecasts and communicate findings to management.
Mind Map: Investigating Variances
Tips for Effective Variance Analysis
- Timeliness: Perform variance analysis regularly (monthly or quarterly) to quickly identify issues.
- Granularity: Break down variances by department, product line, or project for detailed insights.
- Collaboration: Engage cross-functional teams to understand root causes.
- Visualization: Use charts and dashboards to communicate variances clearly.
- Documentation: Record explanations and actions taken for future reference.
Example Visualization: Variance Dashboard Snapshot
Summary
Applying variance analysis effectively enables corporate finance teams to monitor financial health, diagnose problems early, and support strategic decision-making. By combining quantitative calculations with qualitative investigation and clear communication, finance professionals can drive continuous improvement and align financial performance with organizational goals.
5.5 Example: Using Predictive Models to Anticipate Cash Flow Issues
Predictive modeling is a powerful technique that leverages historical data and statistical algorithms to forecast future outcomes. In corporate finance, one critical application is anticipating cash flow issues before they become problematic. This proactive approach enables accountants and performance analysts to take timely corrective actions, ensuring liquidity and operational stability.
What is Predictive Modeling in Cash Flow Management?
Predictive modeling uses data such as past cash inflows and outflows, payment cycles, customer payment behavior, and market conditions to predict future cash positions. By identifying patterns and trends, organizations can forecast potential shortfalls or surpluses.
Mind Map: Key Components of Predictive Cash Flow Models
Example Scenario: Mid-Sized Manufacturing Company
Background: A mid-sized manufacturing company experiences seasonal fluctuations in sales, leading to unpredictable cash flow. The finance team wants to anticipate cash shortages 30 days in advance to avoid emergency borrowing.
Step 1: Data Collection
- Gather 24 months of historical cash inflows and outflows.
- Collect accounts receivable aging reports.
- Include supplier payment terms and payroll schedules.
Step 2: Model Selection
- Use time series analysis combined with regression to factor in seasonality and payment delays.
Step 3: Model Training and Validation
- Train the model on 18 months of data.
- Validate predictions against the last 6 months.
Step 4: Forecasting
- Generate 30-day cash flow forecasts weekly.
- Identify periods where predicted cash balance falls below a defined threshold.
Step 5: Actionable Insights
- Early warning alerts trigger discussions with sales and procurement teams.
- Adjust payment terms with customers and suppliers.
- Plan short-term financing if necessary.
Mind Map: Workflow for Predictive Cash Flow Management
Additional Example: Using Machine Learning to Predict Late Payments
Context: A corporate finance team uses machine learning classification models to predict which customers are likely to delay payments, impacting cash inflows.
Process:
- Features include customer payment history, invoice amounts, industry sector, and economic indicators.
- The model assigns a risk score to each invoice.
- High-risk invoices trigger proactive collection efforts.
Outcome:
- Reduced days sales outstanding (DSO) by 15%.
- Improved cash flow predictability.
Best Practices for Implementing Predictive Cash Flow Models
- Ensure Data Quality: Accurate, timely data is critical.
- Involve Cross-Functional Teams: Collaborate with sales, procurement, and treasury.
- Iterate and Improve: Continuously update models with new data.
- Use Visualization Tools: Dashboards help communicate forecasts effectively.
- Scenario Planning: Test different assumptions to understand potential impacts.
Summary
Predictive models empower finance professionals to anticipate cash flow challenges, enabling proactive management rather than reactive firefighting. By combining historical data, advanced analytics, and domain expertise, organizations can safeguard liquidity and support strategic decision-making.
6. Linking Performance Measurement to Incentives and Rewards
6.1 Designing Incentive Programs Based on Measured Performance
Designing effective incentive programs is a critical step in linking performance measurement to employee motivation and organizational success. When incentives are aligned with measured performance, they encourage behaviors that drive business objectives and foster a culture of accountability.
Key Principles for Designing Incentive Programs
- Alignment with Organizational Goals: Incentives should directly support the company’s strategic objectives.
- Measurable and Transparent Metrics: Use clear, quantifiable performance indicators.
- Fairness and Equity: Ensure the program is perceived as fair across roles and levels.
- Timely Rewards: Incentives should be given promptly to reinforce desired behaviors.
- Balanced Approach: Combine financial and non-financial rewards to motivate diverse employee needs.
Mind Map: Core Components of Incentive Program Design
Step-by-Step Process to Design Incentive Programs
-
Identify Key Performance Indicators (KPIs): Select KPIs that reflect critical success factors. For example, an accounts receivable team might focus on Days Sales Outstanding (DSO) reduction.
-
Set Clear Performance Targets: Define realistic and challenging targets. For example, reducing DSO by 10% over six months.
-
Determine Incentive Types: Choose between monetary (bonuses, commissions) and non-monetary rewards (extra vacation days, public recognition).
-
Establish Measurement and Reporting Mechanisms: Use dashboards or reports to track performance regularly.
-
Communicate the Program: Clearly explain how incentives are earned and measured.
-
Monitor and Adjust: Continuously review program effectiveness and make improvements.
Example: Balanced Incentive Scheme in a Corporate Finance Department
Scenario: A corporate finance team is responsible for budgeting accuracy and timely reporting.
- KPIs Selected: Budget variance percentage, report submission timeliness, and stakeholder satisfaction scores.
- Targets: Budget variance under 3%, 100% on-time reports, satisfaction score above 85%.
- Incentives:
- Monetary: Quarterly bonuses tied to meeting targets.
- Non-Monetary: Recognition awards and professional development opportunities.
Outcome: The team showed a 25% improvement in budget accuracy and improved report timeliness by 15%, with increased morale reported in employee surveys.
Mind Map: Example Incentive Program for Finance Team
Additional Example: Sales Performance Incentive
Scenario: A sales team’s performance is measured by revenue growth and customer retention.
- KPIs: Quarterly revenue targets, customer renewal rates.
- Incentives: Commission on sales above target, team outings for retention milestones.
This combination motivates individual performance while fostering team collaboration.
Tips for Accountants and Performance Analysts
- Use historical data to set realistic targets.
- Ensure data accuracy to maintain trust in the program.
- Incorporate employee feedback to improve program design.
- Balance short-term incentives with long-term development goals.
By thoughtfully designing incentive programs based on measured performance, organizations can effectively motivate employees, improve accountability, and drive sustained business success.
6.2 Aligning Employee Goals with Organizational Objectives
Aligning employee goals with organizational objectives is a critical step in ensuring that every team member contributes effectively to the company’s overall success. This alignment fosters engagement, accountability, and a clear understanding of how individual efforts impact broader business outcomes.
Why Alignment Matters
- Focus and Clarity: Employees understand what is expected and how their work supports the company’s vision.
- Motivation: Clear linkage between personal goals and company success increases motivation.
- Performance Improvement: Helps identify gaps and areas for development.
- Better Resource Allocation: Ensures efforts are directed towards strategic priorities.
Steps to Align Employee Goals with Organizational Objectives
-
Define Clear Organizational Objectives
- Use frameworks like SMART (Specific, Measurable, Achievable, Relevant, Time-bound).
- Example: Increase revenue by 15% in the next fiscal year.
-
Translate Objectives into Departmental Goals
- Break down company-wide goals into actionable targets for each department.
- Example: Finance department aims to reduce budget variances by 10%.
-
Set Individual Employee Goals
- Collaborate with employees to set personal goals that support departmental objectives.
- Example: An accountant’s goal to improve monthly financial report accuracy by 5%.
-
Regular Review and Feedback
- Schedule periodic check-ins to assess progress and realign goals if necessary.
-
Incorporate Goals into Performance Management Systems
- Use software tools to track and visualize goal progress.
Mind Map: Aligning Employee Goals with Organizational Objectives
Example 1: Corporate Finance Department
- Organizational Objective: Improve profitability by 12%.
- Departmental Goal: Reduce operational costs by 8%.
- Employee Goal: Identify and implement cost-saving measures in vendor contracts to reduce expenses by 5%.
This clear line of sight helps the employee understand how their negotiation skills directly impact the company’s profitability.
Mind Map: Example 1 Breakdown
Example 2: Performance Analyst in Corporate Sector
- Organizational Objective: Enhance customer satisfaction by 20%.
- Departmental Goal: Improve reporting accuracy and timeliness.
- Employee Goal: Deliver weekly performance reports with 99% accuracy and within 24 hours of data availability.
This alignment ensures the analyst’s work supports customer satisfaction by enabling faster, more accurate decision-making.
Mind Map: Example 2 Breakdown
Best Practices for Successful Alignment
- Collaborative Goal Setting: Engage employees in the goal-setting process to increase buy-in.
- Transparency: Clearly communicate how individual goals connect to organizational success.
- Flexibility: Allow adjustments to goals as business priorities evolve.
- Recognition: Acknowledge achievements that contribute to organizational objectives.
Summary
Aligning employee goals with organizational objectives transforms individual efforts into collective success. Through clear communication, structured goal-setting, and continuous feedback, accountants and performance analysts can drive meaningful impact within their organizations.
6.3 Avoiding Common Pitfalls: Overemphasis on Short-Term Metrics
In performance measurement and management, focusing excessively on short-term metrics can lead to unintended consequences that undermine long-term organizational success. This section explores the common pitfalls associated with overemphasis on short-term indicators and provides practical strategies to balance short-term performance with sustainable growth.
Understanding the Pitfalls of Short-Term Focus
Short-term metrics often emphasize immediate financial results, such as quarterly revenue, cost reductions, or cash flow improvements. While these are important, an exclusive focus on them can:
- Encourage risky or unethical behavior to meet targets quickly.
- Discourage investment in innovation, employee development, or customer relationships.
- Lead to burnout and low morale among employees due to constant pressure.
- Result in distorted decision-making that sacrifices long-term value.
Mind Map: Consequences of Overemphasizing Short-Term Metrics
Example: Quarterly Sales Targets Leading to Customer Churn
A corporate finance team in a retail company set aggressive quarterly sales targets. To meet these, sales staff offered excessive discounts and pushed products customers didn’t need. While sales numbers improved temporarily, customer satisfaction dropped, leading to increased churn and lower lifetime value. This short-term focus compromised long-term profitability.
Balancing Short-Term and Long-Term Metrics
To avoid these pitfalls, organizations should adopt a balanced approach that integrates both short-term and long-term performance indicators. This ensures immediate goals are met without sacrificing future growth.
Key strategies include:
- Incorporate Non-Financial Metrics: Track customer satisfaction, employee engagement, and innovation milestones alongside financial KPIs.
- Use Balanced Scorecards: Combine financial and strategic objectives to provide a holistic view.
- Set Realistic Targets: Align short-term goals with long-term strategy to avoid pressure that leads to corner-cutting.
- Promote Ethical Behavior: Embed ethics and compliance metrics into performance evaluations.
Mind Map: Strategies to Balance Short-Term and Long-Term Performance
Example: Balanced Incentive Scheme in Corporate Finance
A corporate finance department redesigned its incentive program to reward both quarterly financial results and progress on strategic initiatives such as process automation and staff training. This approach reduced pressure to meet short-term targets at all costs and encouraged behaviors that supported sustainable growth.
Practical Tips for Accountants and Performance Analysts
- Regularly review the mix of KPIs to ensure long-term drivers are included.
- Communicate the rationale behind balanced metrics to stakeholders.
- Monitor for signs of gaming or unethical behavior linked to short-term targets.
- Use dashboards that highlight trends over multiple periods, not just snapshots.
Mind Map: Practical Tips to Avoid Short-Term Pitfalls
By consciously avoiding an overemphasis on short-term metrics and embedding balanced performance measurement practices, accountants and performance analysts can help their organizations achieve enduring success while maintaining operational excellence.
6.4 Best Practice: Implementing a Balanced Incentive Scheme in a Corporate Finance Department (Example: Combining Financial and Behavioral KPIs)
Incentive schemes are critical tools for motivating employees and aligning their efforts with organizational goals. In corporate finance departments, where precision, accountability, and collaboration are paramount, a balanced incentive scheme that combines both financial and behavioral Key Performance Indicators (KPIs) can drive sustainable performance improvements.
Why Combine Financial and Behavioral KPIs?
- Financial KPIs focus on measurable outcomes such as cost savings, budget adherence, and revenue growth.
- Behavioral KPIs emphasize the quality of work, teamwork, communication, and adherence to ethical standards.
A balanced approach ensures that employees are rewarded not only for what they achieve but also for how they achieve it, fostering a healthy work culture and long-term success.
Key Components of a Balanced Incentive Scheme
Example: Corporate Finance Department Incentive Scheme
Scenario: A mid-sized corporate finance team aims to improve financial accuracy and foster collaboration across departments.
| KPI Type | Specific KPI | Target/Metric | Incentive Linked |
|---|---|---|---|
| Financial | Budget Variance | Keep variance within ±2% | Quarterly bonus based on accuracy |
| Financial | Timely Financial Reporting | Reports submitted on schedule | Recognition and small bonus |
| Behavioral | Cross-Department Collaboration | Positive peer feedback scores | Spot awards and public recognition |
| Behavioral | Ethical Compliance | Zero compliance violations | Eligibility for leadership training |
Implementation Tips
- Define Clear and Measurable KPIs: Ensure KPIs are specific, measurable, achievable, relevant, and time-bound (SMART).
- Communicate Transparently: Employees should understand how their performance affects incentives.
- Use Mixed Incentives: Combine monetary rewards with non-monetary recognition to appeal to diverse motivators.
- Regular Monitoring and Feedback: Frequent check-ins help employees stay on track and adjust behaviors.
- Review and Adapt: Periodically reassess KPIs and incentives to align with evolving business goals.
Mind Map: Steps to Implement Balanced Incentive Scheme
Real-World Example
A corporate finance department at a technology firm implemented a balanced incentive scheme combining financial KPIs like cost control and budget adherence with behavioral KPIs such as teamwork and ethical conduct. Over a year, the department saw a 15% improvement in budget accuracy and a notable increase in cross-functional projects, attributed to enhanced collaboration incentives. Employee satisfaction surveys also reflected higher morale due to recognition programs.
Summary
Implementing a balanced incentive scheme that integrates both financial and behavioral KPIs can significantly enhance performance in corporate finance departments. This approach not only drives measurable financial results but also nurtures a positive, ethical, and collaborative work environment.
By following structured steps and leveraging clear communication, organizations can create incentive programs that motivate employees holistically, leading to sustainable success.
6.5 Case Study: Impact of Performance-Based Bonuses on Employee Productivity
Introduction
Performance-based bonuses are a widely used incentive mechanism designed to align employee efforts with organizational goals. This case study explores how implementing a structured bonus system in a corporate finance department influenced employee productivity, motivation, and overall business outcomes.
Background
A mid-sized corporate finance department with 50 employees faced challenges with inconsistent performance levels and engagement. The management decided to introduce a performance-based bonus scheme tied to clearly defined KPIs such as accuracy in financial reporting, timeliness of deliverables, and contribution to cost-saving initiatives.
Objectives of the Bonus Program
- Increase accuracy and reduce errors in financial reports
- Improve adherence to deadlines
- Encourage proactive cost management
- Foster a culture of accountability and continuous improvement
Implementation Steps
- Define Clear KPIs: KPIs were collaboratively developed with input from accountants and performance analysts to ensure relevance and fairness.
- Set Transparent Targets: Targets were communicated clearly, with examples and historical benchmarks.
- Regular Monitoring: Monthly performance data was collected and reviewed.
- Feedback Mechanisms: Employees received constructive feedback during quarterly reviews.
- Bonus Distribution: Bonuses were awarded quarterly based on performance against KPIs.
Mind Map: Performance-Based Bonus Program Structure
Results and Observations
- Productivity Increase: Average task completion time improved by 20% within six months.
- Error Reduction: Financial report errors dropped from 5% to 1.5%.
- Employee Engagement: Survey results showed a 30% increase in employee satisfaction related to recognition and rewards.
- Cost Savings: The department exceeded its cost-saving targets by 15%.
Example: Bonus Calculation for an Employee
- Employee: Jane Doe, Senior Accountant
- KPIs Achieved:
- Financial Reporting Accuracy: 99% (Target: 98%)
- Timeliness: 100% on-time submissions (Target: 95%)
- Cost Savings Contribution: $18,000 (Target: $15,000)
- Bonus Scheme: Tier 1 (meets all targets) = 10% of quarterly salary
- Quarterly Salary: $15,000
- Bonus Awarded: $1,500
Mind Map: Impact on Employee Productivity
Lessons Learned and Best Practices
- Align Bonuses with Meaningful KPIs: Ensure metrics reflect true business priorities.
- Maintain Transparency: Clear communication prevents misunderstandings and builds trust.
- Provide Regular Feedback: Helps employees adjust efforts and stay motivated.
- Balance Short-Term and Long-Term Goals: Avoid overemphasis on immediate results that could harm sustainability.
- Customize Incentives: Tailor bonus schemes to different roles and responsibilities.
Conclusion
This case study demonstrates that well-designed performance-based bonuses can significantly enhance employee productivity and engagement in corporate finance settings. By integrating clear KPIs, transparent processes, and consistent feedback, organizations can foster a high-performance culture that benefits both employees and the business.
Additional Example: Small Finance Team Bonus Impact
A small finance team of 10 employees implemented a similar bonus system focused on reducing invoice processing time. Within three months, processing time decreased by 35%, and employee morale improved as reflected in internal surveys. This example underscores the scalability and adaptability of performance-based bonuses across different organizational sizes.
7. Challenges and Solutions in Performance Measurement
7.1 Dealing with Data Quality and Availability Issues
In performance measurement and management, data quality and availability are foundational pillars. Without reliable, accurate, and timely data, performance metrics lose their credibility, leading to poor decision-making and ineffective management.
Understanding Data Quality Issues
Data quality issues can manifest in various forms:
- Inaccurate Data: Errors in data entry, outdated information, or incorrect calculations.
- Incomplete Data: Missing values or gaps in datasets.
- Inconsistent Data: Variations in data formats, units, or definitions across sources.
- Duplicate Data: Multiple records representing the same entity.
- Untimely Data: Data that is not updated frequently enough to reflect current performance.
Common Causes of Data Availability Problems
- Siloed Systems: Data trapped in isolated departments or legacy systems.
- Lack of Integration: Poor connectivity between data sources.
- Limited Access Rights: Restrictive permissions preventing data retrieval.
- Manual Processes: Dependence on manual data collection causing delays.
Mind Map: Data Quality and Availability Challenges
Best Practices to Improve Data Quality and Availability
-
Establish Data Governance Frameworks:
- Define clear ownership and accountability for data.
- Implement data standards and policies.
-
Automate Data Collection and Integration:
- Use ETL (Extract, Transform, Load) tools to consolidate data.
- Integrate systems via APIs to ensure seamless data flow.
-
Implement Data Validation and Cleansing Processes:
- Use software tools to detect and correct errors.
- Regularly audit data for accuracy and completeness.
-
Enhance Accessibility with Role-Based Permissions:
- Balance security with ease of access.
- Use centralized data repositories or data lakes.
-
Train Staff and Promote Data Literacy:
- Educate employees on the importance of data quality.
- Encourage consistent data entry practices.
Mind Map: Strategies to Address Data Quality and Availability
Practical Examples
Example 1: Automating Data Collection in a Corporate Finance Team
A corporate finance department was struggling with monthly reporting delays due to manual data consolidation from multiple spreadsheets. By implementing an ETL tool that automatically extracted data from ERP and CRM systems, transformed it into a unified format, and loaded it into a centralized dashboard, the team improved data availability and reduced errors. This automation enabled timely and accurate performance reports.
Example 2: Data Cleansing in a Performance Analytics Unit
A performance analytics team noticed discrepancies in sales data due to inconsistent product codes entered by different regional offices. They introduced a standardized product code list and deployed data validation rules within their data entry system. Additionally, they ran a cleansing process to merge duplicate records and correct invalid entries. As a result, KPI calculations became more reliable, enhancing decision-making.
Example 3: Overcoming Data Silos in a Multinational Corporation
In a multinational corporation, financial data was stored separately by country offices, causing delays in consolidated reporting. The company invested in a cloud-based data warehouse solution that integrated data from all regions in near real-time. Role-based access ensured that accountants and analysts could retrieve relevant data without compromising security. This improved data availability and enabled cross-border performance comparisons.
Summary
Addressing data quality and availability issues requires a combination of governance, technology, and people-focused strategies. By automating data processes, enforcing standards, and promoting data literacy, finance professionals can ensure that performance measurement is based on trustworthy and accessible data — a critical factor for effective performance management.
7.2 Managing Resistance to Performance Measurement Systems
Resistance to performance measurement systems is a common challenge in organizations, especially when new systems or processes are introduced. Understanding the root causes of resistance and applying effective strategies can help accountants and performance analysts facilitate smoother adoption and maximize the benefits of these systems.
Why Resistance Occurs
Resistance often stems from fear, misunderstanding, or perceived threats to job security and autonomy. Common reasons include:
- Fear of Increased Scrutiny: Employees may worry that performance metrics will be used punitively.
- Lack of Understanding: Unclear communication about the purpose and benefits of the system.
- Change Fatigue: Employees overwhelmed by frequent changes.
- Perceived Irrelevance: Metrics that don’t align with employees’ roles or goals.
- Loss of Control: Feeling that the system reduces autonomy.
Mind Map: Causes of Resistance
Strategies to Manage Resistance
-
Engage Stakeholders Early
- Involve employees in the design and selection of metrics.
- Example: A corporate finance team held workshops to gather input on KPIs, increasing buy-in.
-
Transparent Communication
- Clearly explain the purpose, benefits, and how data will be used.
- Example: A retail chain circulated FAQs and held Q&A sessions before launching their new performance dashboard.
-
Training and Support
- Provide hands-on training to build confidence and competence.
- Example: An accounting department introduced monthly training sessions on interpreting performance reports.
-
Align Metrics with Roles and Goals
- Customize KPIs to reflect individual and team responsibilities.
- Example: A manufacturing firm tailored performance indicators for finance analysts versus operational accountants.
-
Demonstrate Quick Wins
- Share early successes to build momentum.
- Example: Highlighting how improved cash flow forecasting reduced costs in the first quarter.
-
Encourage Feedback and Iteration
- Create channels for ongoing feedback and adjust the system accordingly.
- Example: A multinational corporation implemented a suggestion portal and adjusted KPIs based on employee input.
-
Leadership Support and Role Modeling
- Leaders should actively use and endorse the system.
- Example: CFOs presenting performance reports in town halls to emphasize importance.
Mind Map: Strategies to Manage Resistance
Example Scenario: Overcoming Resistance in a Corporate Finance Department
Context: A corporate finance department was implementing a new performance measurement system focused on financial accuracy and timeliness.
Challenge: Staff were concerned the system would be used to penalize mistakes rather than support improvement.
Approach:
- Held initial workshops to explain the system’s purpose and gather input on relevant KPIs.
- Provided training sessions on how to interpret and use the data constructively.
- Leadership communicated openly about the system’s role in enabling better decision-making.
- Shared early examples where the system helped identify process bottlenecks and improve reporting speed.
Outcome: Resistance decreased significantly, and employees began to view the system as a tool for empowerment rather than punishment.
Summary
Managing resistance to performance measurement systems requires a thoughtful, inclusive approach that addresses fears, builds understanding, and aligns metrics with meaningful goals. By engaging stakeholders, communicating transparently, providing training, and demonstrating leadership support, organizations can foster acceptance and leverage performance systems to drive continuous improvement.
7.3 Ensuring Fairness and Transparency in Performance Evaluation
Performance evaluation is a critical component of performance management systems. Ensuring fairness and transparency in this process not only boosts employee morale but also enhances trust and accountability within the organization. For accountants and performance analysts, understanding how to embed these principles into evaluation frameworks is essential.
Why Fairness and Transparency Matter
- Employee Motivation: Fair evaluations encourage employees to perform better.
- Trust Building: Transparent processes reduce suspicion and promote open communication.
- Legal Compliance: Fairness helps avoid discrimination claims and ensures compliance with labor laws.
- Better Decision-Making: Transparent data and criteria enable objective decisions on promotions, bonuses, and development.
Key Elements of Fairness and Transparency
Best Practices with Examples
-
Clear and Consistent Criteria
- Define performance metrics that are aligned with job roles and organizational goals.
- Example: A corporate finance team uses a standardized KPI framework where each accountant’s performance is measured on accuracy, timeliness, and compliance with financial regulations.
-
Open Communication and Feedback
- Regularly share performance expectations and progress with employees.
- Example: Monthly one-on-one meetings where performance analysts receive constructive feedback and can discuss challenges.
-
Training Evaluators to Minimize Bias
- Conduct workshops on unconscious bias and standardized rating scales.
- Example: A multinational corporation trains its finance managers to use behaviorally anchored rating scales to reduce subjective judgments.
-
Use of Data and Documentation
- Maintain transparent records of performance data and evaluation decisions.
- Example: An accounting department implements a digital dashboard that logs all performance reviews and supporting documents accessible to both managers and employees.
-
Employee Involvement and Appeals
- Encourage self-assessments and provide a formal appeals process for disputed evaluations.
- Example: Performance analysts submit quarterly self-assessments which are discussed during review meetings, and a clear process exists to challenge unfair ratings.
Mind Map: Steps to Ensure Fairness and Transparency
Common Challenges and Solutions
| Challenge | Solution | Example |
|---|---|---|
| Subjectivity and Bias | Use objective KPIs and train evaluators | A finance team uses automated KPI tracking to reduce subjective ratings |
| Lack of Communication | Schedule regular feedback meetings | Monthly performance check-ins in a corporate accounting team |
| Data Inaccuracy | Implement automated data collection tools | ERP integration ensures real-time, accurate financial data for performance evaluation |
| Employee Disengagement | Involve employees in goal setting and self-assessment | Analysts co-create KPIs with managers, increasing ownership and transparency |
Real-World Example: Transparent Performance Evaluation in a Corporate Finance Department
Context: A mid-sized corporation struggled with employee dissatisfaction due to perceived unfair evaluations.
Action Taken:
- Introduced a clear KPI framework aligned with job descriptions.
- Trained managers on unconscious bias and standardized evaluation forms.
- Implemented quarterly feedback sessions and digital dashboards accessible to employees.
- Created a formal appeals process.
Outcome:
- Employee trust in the evaluation process increased by 40% (measured via internal surveys).
- Performance-related disputes decreased by 30%.
- Overall productivity improved as employees clearly understood expectations and received timely feedback.
Summary
Ensuring fairness and transparency in performance evaluation requires a structured approach involving clear criteria, open communication, evaluator training, accurate data, and active employee participation. By embedding these elements, accountants and performance analysts can foster a culture of trust and continuous improvement within their organizations.
7.4 Best Practice: Overcoming Resistance through Stakeholder Engagement (Example: Change Management in a Multinational Corporation)
Resistance to performance measurement and management initiatives is a common challenge, especially in large, complex organizations like multinational corporations (MNCs). Overcoming this resistance requires a strategic approach centered on effective stakeholder engagement. This section explores best practices for engaging stakeholders to facilitate smooth change management, illustrated with a real-world example.
Understanding Resistance in Performance Management
Resistance often stems from fear of the unknown, perceived threats to job security, lack of trust, or skepticism about the value of new systems. Identifying the root causes early is critical.
Key Principles of Stakeholder Engagement
- Identify Stakeholders: Map out all individuals and groups affected by the change.
- Communicate Transparently: Share the purpose, benefits, and impact of the performance management system.
- Involve Stakeholders Early: Engage them in design and decision-making to build ownership.
- Provide Training and Support: Equip stakeholders with the skills and knowledge needed.
- Address Concerns Proactively: Listen and respond to fears and objections.
- Celebrate Quick Wins: Highlight early successes to build momentum.
Mind Map: Stakeholder Engagement Process
Example: Change Management in a Multinational Corporation
Context: A multinational corporation with finance teams spread across five continents planned to implement a new performance measurement system integrating financial and non-financial KPIs.
Challenges:
- Diverse cultural attitudes towards performance evaluation.
- Varied levels of technological proficiency.
- Concerns about increased workload and transparency.
Approach:
- Stakeholder Mapping: Identified key influencers in each region, including finance managers, accountants, and performance analysts.
- Communication Campaign: Developed multilingual communication materials explaining the system’s benefits, emphasizing alignment with corporate goals and personal development.
- Inclusive Workshops: Conducted virtual workshops allowing stakeholders to provide input on KPI selection and reporting formats.
- Pilot Testing: Rolled out the system in two regions first, gathering feedback and making adjustments.
- Training Programs: Delivered tailored training sessions focusing on system navigation and interpreting reports.
- Support Channels: Established a dedicated helpdesk and online resource center.
- Feedback Mechanisms: Regular surveys and focus groups to capture ongoing concerns.
- Recognition: Shared success stories in company newsletters and rewarded teams demonstrating effective use.
Outcome:
- Significant reduction in resistance levels.
- Improved data accuracy and timeliness.
- Enhanced collaboration between regional teams.
- Positive shift in organizational culture towards performance transparency.
Mind Map: Change Management Strategy in MNC
Additional Tips for Accountants and Performance Analysts
- Build Trust: Regularly share how performance data is used to support, not punish.
- Customize Engagement: Adapt communication styles to cultural and regional differences.
- Leverage Influencers: Identify and empower champions within teams to advocate for change.
- Maintain Transparency: Be open about challenges and progress.
By following these stakeholder engagement best practices, organizations can effectively overcome resistance, ensuring successful adoption and sustained use of performance measurement and management systems.
7.5 Practical Solutions for Small and Medium Enterprises (SMEs)
Small and Medium Enterprises (SMEs) often face unique challenges when implementing performance measurement and management systems. Limited resources, smaller teams, and less access to sophisticated technology can make it difficult to adopt complex frameworks used by larger corporations. However, SMEs can still benefit greatly from tailored, practical solutions that fit their scale and needs.
Key Challenges for SMEs in Performance Measurement:
- Limited budget for advanced software and tools
- Smaller teams with overlapping roles
- Less formalized processes and data collection
- Difficulty in identifying relevant KPIs that align with business goals
Practical Solutions for SMEs
-
Start Simple: Focus on Core KPIs
- Identify 3-5 key performance indicators that directly impact business success.
- Examples:
- Revenue growth rate
- Customer acquisition cost
- Inventory turnover
- Employee productivity
-
Leverage Affordable Tools
- Use cloud-based, low-cost or free tools like Google Sheets, Microsoft Excel, or affordable BI tools (e.g., Zoho Analytics, Power BI Free).
- Example: A retail SME tracking sales and inventory using Excel dashboards updated weekly.
-
Automate Data Collection Where Possible
- Integrate sales systems, CRM, or accounting software to reduce manual data entry.
- Example: Using QuickBooks for automatic financial data capture linked with sales reports.
-
Regular Review Meetings
- Schedule short, focused monthly or bi-weekly meetings to review performance data and adjust plans.
- Example: A small marketing agency holds a 30-minute KPI review every two weeks to track client campaign performance.
-
Use Visual Dashboards
- Create simple visual dashboards that highlight trends and variances.
- Example: A dashboard showing monthly revenue vs target with color-coded alerts.
-
Employee Involvement and Communication
- Engage employees in setting realistic targets and understanding performance metrics.
- Example: A family-owned manufacturing SME holds quarterly workshops to explain how KPIs affect overall business health.
-
Iterative Improvement
- Start with basic measures and refine KPIs and processes as the business grows.
- Example: An SME initially tracks only sales volume but later adds customer satisfaction scores as it expands.
Mind Map: Practical Solutions for SMEs in Performance Measurement
Example: Implementing a KPI System in a Small Retail Business
Background: A small retail store wants to improve sales and inventory management but lacks a dedicated finance team.
Solution:
- Selected KPIs: Monthly sales revenue, inventory turnover, and customer footfall.
- Tools: Used Excel to create a dashboard updated weekly by the store manager.
- Data Collection: Sales data exported from the POS system; footfall counted manually.
- Review: Monthly meeting with store staff to discuss results and brainstorm improvements.
Outcome: Improved inventory management reduced stockouts by 15%, and monthly sales increased by 10% over six months.
Example: Performance Management in a Small Consulting Firm
Background: A consulting firm with 10 employees wants to track project profitability and employee utilization.
Solution:
- KPIs: Project margin %, billable hours per consultant, client satisfaction score.
- Tools: Google Sheets for time tracking and project financials.
- Automation: Integration with invoicing software to track payments.
- Review: Bi-weekly meetings to review project status and resource allocation.
Outcome: Enhanced visibility into project profitability helped prioritize high-margin projects, increasing overall profitability by 12% in one year.
Tips for SMEs to Sustain Performance Measurement Efforts
- Keep it manageable: Avoid overcomplicating metrics.
- Train staff: Ensure everyone understands the importance of KPIs.
- Be flexible: Adapt KPIs as business priorities change.
- Celebrate successes: Recognize improvements to motivate teams.
By adopting these practical, scalable solutions, SMEs can build effective performance measurement and management systems that drive growth, improve decision-making, and foster a culture of continuous improvement.
8. Technology and Tools for Performance Measurement and Management
8.1 Overview of Performance Management Software
Performance management software plays a crucial role in modern corporate finance and accounting by automating, streamlining, and enhancing the process of measuring and managing organizational performance. These tools help accountants and performance analysts collect data, analyze metrics, generate reports, and align performance with strategic goals.
What is Performance Management Software?
Performance management software is a digital solution designed to facilitate the continuous process of setting objectives, monitoring progress, analyzing results, and improving business outcomes. It integrates various performance measurement methodologies and provides real-time insights.
Key Features of Performance Management Software
- KPI Tracking: Automatically track key performance indicators relevant to different departments.
- Data Integration: Connects with ERP, CRM, and financial systems to consolidate data.
- Dashboard and Visualization: Interactive dashboards for real-time monitoring.
- Reporting and Analytics: Generate detailed reports and perform advanced analytics.
- Goal Setting and Alignment: Helps set, cascade, and align goals across the organization.
- Collaboration Tools: Facilitate communication and feedback among teams.
- Automation: Automate routine tasks like data collection and report generation.
Mind Map: Core Components of Performance Management Software
Popular Performance Management Software Solutions
-
Oracle Hyperion
- Widely used in corporate finance for budgeting, forecasting, and financial consolidation.
- Example: A multinational corporation uses Oracle Hyperion to consolidate financial data from subsidiaries worldwide, enabling timely and accurate performance reporting.
-
SAP SuccessFactors
- Focuses on employee performance management, goal alignment, and talent analytics.
- Example: A large retail chain implements SuccessFactors to align store managers’ goals with corporate sales targets, improving overall store performance.
-
IBM Cognos Analytics
- Provides advanced analytics, reporting, and dashboard capabilities.
- Example: A financial services firm uses Cognos to create interactive dashboards that track investment portfolio performance in real-time.
-
KPI Fire
- Designed for small to medium enterprises, emphasizing simplicity and ease of use.
- Example: A mid-sized manufacturing company uses KPI Fire to monitor production KPIs and quickly identify bottlenecks.
-
Anaplan
- Cloud-based platform for connected planning and performance management.
- Example: A technology company leverages Anaplan to synchronize sales forecasting with financial planning, enhancing accuracy.
Mind Map: Benefits of Using Performance Management Software
Best Practice Example: ERP Integration in Manufacturing
A manufacturing company integrated its ERP system with a performance management software to automate KPI tracking related to production efficiency, inventory turnover, and cost control. This integration reduced manual data entry errors and provided real-time insights to both accountants and performance analysts, enabling faster corrective actions and improved financial outcomes.
Conclusion
Performance management software is an indispensable tool for accountants and performance analysts in corporate finance. By leveraging these systems, organizations can ensure accurate measurement, timely reporting, and effective management of performance, ultimately driving strategic success.
8.2 Leveraging Business Intelligence (BI) Tools for Data Analysis
Business Intelligence (BI) tools have become indispensable in the realm of performance measurement and management, especially for accountants and performance analysts in corporate finance. These tools enable organizations to transform raw data into actionable insights, facilitating better decision-making, enhanced reporting, and strategic planning.
What Are BI Tools?
BI tools are software applications designed to collect, process, analyze, and visualize data from various sources. They help users identify trends, patterns, and anomalies, thereby supporting performance measurement and management efforts.
Key Benefits of BI Tools in Performance Analysis
- Data Integration: Consolidate data from multiple systems (ERP, CRM, financial databases).
- Real-Time Reporting: Access up-to-date performance metrics instantly.
- Advanced Analytics: Perform complex calculations, trend analysis, and forecasting.
- Visualization: Create intuitive dashboards and reports for stakeholders.
- Collaboration: Share insights easily across teams.
Mind Map: Core Functions of BI Tools in Performance Measurement
Popular BI Tools Used in Corporate Finance
- Microsoft Power BI: User-friendly, integrates well with Excel and Azure.
- Tableau: Strong visualization capabilities and interactive dashboards.
- Qlik Sense: Associative data model for flexible exploration.
- SAP BusinessObjects: Enterprise-grade reporting and analytics.
Example: Using Power BI for Financial Performance Analysis
Scenario: A corporate finance team wants to monitor monthly revenue, expenses, and profitability across different business units.
Steps:
- Data Integration: Import data from ERP and accounting software into Power BI.
- Data Modeling: Create relationships between tables (e.g., sales, expenses, departments).
- Visualization: Build dashboards showing KPIs such as revenue growth, expense ratios, and profit margins.
- Drill-Down: Enable users to drill down from company-wide metrics to individual departments.
- Alerts: Set up notifications for when performance falls below targets.
Outcome: The team gains real-time visibility into financial performance, enabling faster corrective actions.
Mind Map: Workflow for BI-Driven Performance Analysis
Best Practice: Embedding BI Tools into Daily Performance Management
- Automate Data Refresh: Schedule automatic updates to ensure data freshness.
- Customize Dashboards: Tailor views for different roles (e.g., CFO vs. performance analyst).
- Train Users: Provide training sessions to maximize tool adoption.
- Use Storytelling: Combine data visualizations with narrative to explain insights.
Example: Tableau for Expense Management
A performance analyst uses Tableau to analyze expense data across multiple cost centers.
- Connects Tableau to the company’s financial database.
- Creates heatmaps highlighting departments with unusually high expenses.
- Uses trend lines to detect seasonal expense patterns.
- Shares interactive dashboards with department heads to encourage accountability.
Result: The company identifies and reduces unnecessary expenses by 8% within six months.
Summary
Leveraging BI tools empowers accountants and performance analysts to move beyond static reports and spreadsheets. By integrating data, applying advanced analytics, and visualizing insights effectively, BI tools enhance the accuracy, timeliness, and impact of performance measurement and management initiatives.
Additional Resources
- Microsoft Power BI official tutorials
- Tableau Public Gallery for dashboard inspiration
- Qlik Sense community forums
- Books: “Data Analytics for Accounting” by Vernon J. Richardson
8.3 Integrating Performance Measurement with ERP and CRM Systems
Integrating performance measurement with Enterprise Resource Planning (ERP) and Customer Relationship Management (CRM) systems is a critical best practice for accountants and performance analysts aiming to streamline data flows, enhance accuracy, and enable real-time decision-making. This integration allows organizations to unify financial, operational, and customer data, providing a holistic view of performance that supports strategic management.
Why Integrate Performance Measurement with ERP and CRM?
- Data Consistency: Centralizes data to avoid discrepancies between departments.
- Real-Time Insights: Enables up-to-date performance tracking.
- Improved Reporting: Automates data collection for KPIs and dashboards.
- Cross-Functional Collaboration: Bridges finance, sales, and operations.
Key Integration Points
- Financial metrics from ERP (e.g., cost, revenue, budget vs actuals).
- Customer metrics from CRM (e.g., customer acquisition cost, lifetime value).
- Operational metrics (e.g., inventory turnover, order fulfillment) from ERP.
Mind Map: Integration Overview
Example 1: ERP-CRM Integration in a Corporate Finance Department
A mid-sized manufacturing company integrated its ERP system (SAP) with its CRM platform (Salesforce) to measure performance more effectively. By linking sales data with financials, the finance team could track customer profitability in real-time.
- Before Integration: Sales and finance teams worked in silos; profitability reports were delayed by weeks.
- After Integration: Automated dashboards showed up-to-date customer revenue, costs, and margins.
Result: Improved decision-making on discount strategies and resource allocation.
Mind Map: Example 1 Workflow
Example 2: Automating KPI Reporting Using ERP and CRM Data
A retail company used Microsoft Dynamics ERP integrated with HubSpot CRM to automate monthly KPI reporting:
- KPIs included sales growth, average order value, customer retention rate, and operational costs.
- Integration enabled automatic extraction and consolidation of data into Power BI dashboards.
Outcome: Reduced manual reporting time by 70%, increased accuracy, and enabled proactive performance management.
Mind Map: KPI Automation Process
Best Practices for Integration
- Define Clear Objectives: Identify which KPIs will benefit from integration.
- Choose Compatible Systems: Ensure ERP and CRM platforms support integration (APIs, middleware).
- Automate Data Flows: Reduce manual data entry to minimize errors.
- Maintain Data Quality: Regular audits and validation rules.
- Train Users: Ensure finance and sales teams understand integrated reports.
- Use Visualization Tools: Leverage BI platforms like Power BI or Tableau for intuitive dashboards.
Summary
Integrating performance measurement with ERP and CRM systems empowers accountants and performance analysts to access comprehensive, accurate, and timely data. This integration supports better financial control, customer insight, and operational efficiency, ultimately driving improved corporate performance.
8.4 Best Practice: Using Cloud-Based Dashboards for Collaborative Performance Management (Example: SaaS Solutions in Finance Teams)
In today’s fast-paced corporate finance environment, collaboration and real-time data accessibility are critical for effective performance management. Cloud-based dashboards powered by Software as a Service (SaaS) solutions have revolutionized how finance teams measure, monitor, and manage performance collaboratively.
What Are Cloud-Based Dashboards?
Cloud-based dashboards are interactive, web-accessible platforms that consolidate key performance indicators (KPIs), financial metrics, and operational data into a single, visually intuitive interface. Hosted on the cloud, these dashboards enable multiple users to access, update, and analyze data simultaneously from anywhere.
Why Use Cloud-Based Dashboards in Finance Teams?
- Real-Time Data Access: Instant updates ensure all team members work with the latest information.
- Enhanced Collaboration: Multiple stakeholders can view and comment on data, fostering transparency.
- Scalability: Easily adapt to growing data needs without infrastructure investment.
- Cost-Efficiency: SaaS eliminates the need for expensive hardware and maintenance.
- Integration: Seamlessly connect with ERP, CRM, and other financial systems.
Mind Map: Benefits of Cloud-Based Dashboards for Finance Teams
Key Features to Look for in SaaS Dashboard Solutions
- Customizable Widgets: Tailor KPIs and visuals to team needs.
- Role-Based Access Control: Secure sensitive financial data.
- Automated Data Refresh: Minimize manual updates.
- Mobile Accessibility: Access dashboards on-the-go.
- Collaboration Tools: Chat, annotations, and shared reports.
Example: SaaS Dashboard Implementation in a Corporate Finance Team
Company: FinCorp, a mid-sized financial services firm.
Challenge: FinCorp’s finance team struggled with siloed data and delayed reporting, impacting decision-making speed.
Solution: They implemented a cloud-based SaaS dashboard integrating data from their ERP and CRM systems.
Outcome:
- Real-time visibility into cash flow, budget variances, and revenue forecasts.
- Collaborative monthly performance reviews using shared dashboards.
- Reduced reporting time by 40%, enabling faster strategic adjustments.
Mind Map: SaaS Dashboard Implementation Process
Best Practices for Maximizing SaaS Dashboard Effectiveness
- Define Clear Objectives: Align dashboard KPIs with corporate finance goals.
- Engage Stakeholders Early: Ensure dashboards meet user needs.
- Maintain Data Quality: Regularly audit data sources.
- Promote Collaborative Culture: Encourage team discussions around dashboard insights.
- Leverage Automation: Use alerts and scheduled reports to stay proactive.
Example: Collaborative Use Case
During monthly financial reviews, FinCorp’s performance analysts and accountants access the cloud dashboard simultaneously. They annotate trends, flag anomalies, and assign action items directly within the platform. This collaborative approach reduces email chains and accelerates issue resolution.
Summary
Cloud-based dashboards powered by SaaS solutions empower finance teams to manage performance collaboratively with real-time insights, enhanced transparency, and improved agility. By adopting these tools and following best practices, accountants and performance analysts can drive better financial outcomes and foster a culture of continuous improvement.
8.5 Case Study: Implementing a BI Tool to Enhance Financial Reporting Accuracy
Introduction
In today’s fast-paced corporate finance environment, accuracy and timeliness in financial reporting are paramount. This case study explores how a mid-sized manufacturing company successfully implemented a Business Intelligence (BI) tool to enhance the accuracy, transparency, and efficiency of its financial reporting processes.
Background
The company faced several challenges:
- Manual consolidation of financial data from multiple departments leading to errors
- Delays in monthly closing and reporting cycles
- Difficulty in tracking variances and identifying root causes
- Limited visibility into real-time financial performance
To address these issues, the finance team decided to implement a BI tool that would automate data integration, provide real-time dashboards, and improve analytical capabilities.
Objectives
- Automate data collection and consolidation from ERP and accounting systems
- Improve accuracy by reducing manual data entry and reconciliation errors
- Enable real-time financial performance tracking
- Provide intuitive dashboards and reports for stakeholders
- Facilitate variance analysis and drill-down capabilities
Implementation Process
Needs Assessment and Tool Selection
- Evaluated multiple BI platforms focusing on integration capabilities, user-friendliness, and cost
- Selected a cloud-based BI tool with strong connectors for ERP and accounting software
Data Integration
- Connected the BI tool to ERP, CRM, and accounting systems
- Established automated data pipelines to refresh financial data daily
Dashboard and Report Development
- Designed dashboards for key financial metrics: revenue, expenses, profit margins, cash flow
- Created variance analysis reports comparing budget vs actuals
- Built drill-down features to investigate discrepancies
User Training and Change Management
- Conducted workshops for finance team and key stakeholders
- Developed user guides and support materials
Go-Live and Continuous Improvement
- Rolled out the BI dashboards for monthly reporting cycles
- Collected feedback and iteratively enhanced reports and features
Results and Benefits
- Accuracy Improvement: Automated data consolidation reduced reconciliation errors by 75%
- Faster Reporting: Monthly close cycle shortened from 10 days to 5 days
- Enhanced Visibility: Real-time dashboards enabled proactive financial management
- Better Decision-Making: Drill-down analytics helped identify cost overruns and revenue leaks quickly
- User Adoption: Positive feedback from finance and management teams on usability and insights
Mind Map: BI Tool Implementation for Financial Reporting
Example: Variance Analysis Dashboard
The BI tool enabled the finance team to create a variance analysis dashboard that automatically compared budgeted figures against actuals for each department. For example:
| Department | Budgeted Expense | Actual Expense | Variance | Variance % | Comment |
|---|---|---|---|---|---|
| Sales | $500,000 | $520,000 | $20,000 | 4% | Increased travel costs |
| Production | $1,200,000 | $1,150,000 | -$50,000 | -4.2% | Efficiency improvements |
| R&D | $300,000 | $310,000 | $10,000 | 3.3% | Additional project costs |
This dashboard allowed managers to quickly identify departments with significant variances and drill down into transaction-level data to understand causes.
Lessons Learned and Best Practices
- Start Small: Begin with critical metrics and expand dashboards over time
- Data Quality is Key: Invest time upfront to clean and standardize data sources
- Engage Users Early: Involve end-users in dashboard design to ensure relevance
- Automate Where Possible: Reduce manual interventions to minimize errors
- Iterate Continuously: Use feedback loops to improve usability and insights
Conclusion
Implementing a BI tool transformed the company’s financial reporting by enhancing accuracy, speeding up processes, and providing actionable insights. For accountants and performance analysts, leveraging BI technology is a best practice that drives better financial management and supports strategic decision-making.
Additional Mind Map: Benefits of BI in Financial Reporting
9. Regulatory and Ethical Considerations
9.1 Compliance Requirements Affecting Performance Measurement
Performance measurement in corporate finance is not only about tracking and improving business outcomes but also about adhering to various compliance requirements. These regulations ensure that performance data is accurate, transparent, and reliable, protecting stakeholders and maintaining organizational integrity.
Key Compliance Areas Impacting Performance Measurement
- Financial Reporting Standards
- Data Privacy and Security Regulations
- Industry-Specific Regulatory Requirements
- Internal Controls and Audit Requirements
Mind Map: Compliance Requirements in Performance Measurement
Financial Reporting Standards
Performance measurement often feeds into financial reporting. Compliance with standards such as IFRS (International Financial Reporting Standards) or GAAP (Generally Accepted Accounting Principles) is essential.
Example: A corporate finance team measuring operational efficiency must ensure that cost allocations and revenue recognition align with GAAP principles. Misstating these can lead to inaccurate KPIs such as profit margins or return on investment.
Best Practice: Implement cross-functional reviews between accountants and performance analysts to validate that performance metrics are consistent with financial statements.
Sarbanes-Oxley Act (SOX) Compliance
SOX mandates strict internal controls over financial reporting, which directly impacts performance measurement systems.
- Control Environment: Ensuring that performance data is collected and processed under controlled conditions.
- Audit Trails: Maintaining detailed logs of data changes and approvals.
Example: A performance analyst working in a publicly traded company must ensure that any changes to performance data or assumptions are documented and traceable to comply with SOX.
Mind Map: SOX Compliance in Performance Measurement
Data Privacy and Security Regulations
With increasing reliance on data, regulations like GDPR (General Data Protection Regulation) and CCPA (California Consumer Privacy Act) affect how performance data is collected, stored, and shared.
Example: When measuring employee performance, personal data must be handled in compliance with GDPR. For instance, anonymizing data or obtaining explicit consent before using employee information in performance dashboards.
Best Practice: Incorporate privacy impact assessments when designing performance measurement systems.
Industry-Specific Regulatory Requirements
Certain industries have additional compliance layers that influence performance measurement.
- Banking: Basel III requires banks to maintain certain capital ratios, which must be accurately measured and reported.
- Healthcare: HIPAA governs patient data privacy, affecting performance metrics related to patient care.
Example: A bank’s performance analyst must ensure that risk-adjusted return metrics incorporate regulatory capital requirements under Basel III.
Internal Controls and Audit Requirements
Robust internal controls ensure the integrity of performance measurement systems.
- Segregation of duties to prevent fraud
- Regular audits of data and processes
Example: An internal audit team reviews the performance measurement process quarterly to verify data accuracy and compliance with internal policies.
Summary Table: Compliance Requirements and Their Impact
| Compliance Area | Impact on Performance Measurement | Example |
|---|---|---|
| Financial Reporting (GAAP) | Ensures metrics align with financial statements | Cost allocation affecting profit margin KPIs |
| SOX | Requires internal controls and audit trails | Documenting changes in performance data |
| GDPR/CCPA | Governs personal data handling | Anonymizing employee performance data |
| Industry Regulations | Adds sector-specific measurement requirements | Basel III capital ratio calculations in banking |
| Internal Controls | Ensures data integrity and fraud prevention | Segregation of duties in data entry and approval |
Final Thoughts
For accountants and performance analysts, understanding and integrating compliance requirements into performance measurement processes is critical. It not only ensures legal and regulatory adherence but also enhances the credibility and usefulness of performance data.
Actionable Tip: Regularly update your knowledge on relevant regulations and collaborate closely with compliance and audit teams to embed best practices into your performance measurement frameworks.
9.2 Ethical Issues in Data Collection and Reporting
In the realm of performance measurement and management, ethical considerations in data collection and reporting are paramount. Accountants and performance analysts must ensure that the data they gather and present is accurate, transparent, and respects privacy and confidentiality. Ethical lapses can lead to misinformed decisions, loss of stakeholder trust, legal penalties, and damage to corporate reputation.
Key Ethical Issues in Data Collection and Reporting
Accuracy and Integrity of Data
Ethical data collection demands that all information is accurate and complete. Manipulating data to present a more favorable performance picture is unethical and can mislead stakeholders.
Example: An accountant discovers that certain expenses were omitted from the monthly report to inflate profit margins. Reporting the full expenses maintains integrity and supports sound decision-making.
Transparency in Reporting
Transparency involves openly communicating how data was collected, processed, and any limitations or assumptions made.
Example: A performance analyst includes notes in the report explaining that some KPIs are estimated due to incomplete data, ensuring stakeholders understand the context.
Privacy and Confidentiality
Handling sensitive financial and personal data requires strict adherence to privacy laws and company policies.
Example: When collecting employee performance data, anonymizing individual identifiers protects privacy while allowing aggregate analysis.
Avoiding Bias and Ensuring Fairness
Selective reporting or cherry-picking data to support a preconceived narrative undermines ethical standards.
Example: A finance team resists excluding underperforming business units from the overall performance report to provide a balanced view.
Accountability and Ethical Responsibility
Professionals must take responsibility for the accuracy and honesty of their reports and be prepared to address ethical dilemmas.
Example: An analyst flags discrepancies in reported figures and escalates the issue rather than ignoring it to meet deadlines.
Mind Map: Ethical Data Reporting Process
Practical Example: Ethical Reporting in Budget Variance Analysis
An accountant preparing a budget variance report notices that some cost overruns were due to unforeseen external factors. Instead of omitting these overruns to present a better performance, the accountant includes detailed explanations and supporting data. This transparency helps management understand the true performance drivers and make informed decisions.
Summary
Ethical issues in data collection and reporting are critical to maintaining trust, compliance, and effective performance management. By prioritizing accuracy, transparency, privacy, fairness, and accountability, accountants and performance analysts uphold professional standards and contribute to sustainable corporate success.
9.3 Transparency and Accountability in Performance Management
Transparency and accountability are foundational pillars in effective performance management systems. They ensure that all stakeholders—from employees to senior management—understand how performance is measured, reported, and acted upon. This clarity fosters trust, drives motivation, and supports ethical decision-making.
Why Transparency Matters
- Builds trust between management and employees
- Encourages open communication and feedback
- Reduces misunderstandings and conflicts
- Enhances the credibility of performance data
Why Accountability is Crucial
- Ensures responsibility for results
- Drives continuous improvement
- Aligns individual performance with organizational goals
- Supports fair and consistent evaluation processes
Mind Map: Transparency and Accountability in Performance Management
Best Practice: Implementing Transparent Reporting Systems
Example: A multinational corporation implemented an internal performance dashboard accessible to all employees. This dashboard displayed key performance indicators (KPIs) relevant to each department, updated in real-time. Employees could see how their contributions impacted overall business goals, fostering a sense of ownership and transparency.
Key Takeaway: Making performance data accessible and understandable promotes transparency and encourages employees to take accountability for their results.
Accountability Through Clear Role Definition
Clear assignment of responsibilities ensures that everyone knows what they are accountable for.
Example: In a corporate finance team, accountants are responsible for accurate financial reporting, while performance analysts focus on interpreting data trends and providing actionable insights. Regular meetings clarify these roles, ensuring accountability at every level.
Mind Map: Accountability Mechanisms

Example: Transparent Performance Review Process
A retail company introduced a quarterly review process where employees and managers jointly review performance metrics and discuss progress. The process is documented and accessible to HR and relevant stakeholders, ensuring transparency and accountability.
This approach reduced disputes over evaluations and improved employee engagement.
Encouraging Ethical Reporting
Transparency also means reporting performance honestly without manipulation.
Example: An accounting department adopted strict controls and audit trails for performance data entry, ensuring that all reported figures could be traced back to verified sources. This practice upheld data integrity and accountability.
Summary
Transparency and accountability in performance management create an environment where employees understand expectations and feel responsible for their contributions. By implementing clear communication channels, accessible reporting tools, and defined accountability mechanisms, organizations can foster trust, improve performance, and maintain ethical standards.
9.4 Best Practice: Ensuring Compliance with Financial Reporting Standards (Example: SOX Compliance in Performance Data)
Ensuring compliance with financial reporting standards is a critical aspect of performance measurement and management, especially within corporate finance functions. One of the most well-known regulatory frameworks in this space is the Sarbanes-Oxley Act (SOX), which mandates strict controls over financial reporting to prevent fraud and ensure accuracy.
Understanding SOX Compliance in Performance Data
SOX compliance requires organizations to establish and maintain internal controls over financial reporting (ICFR). This means that any performance data used in financial reports must be accurate, complete, and verifiable.
Key elements include:
- Data Integrity: Ensuring data is accurate and unaltered.
- Access Controls: Restricting who can view or modify performance data.
- Audit Trails: Maintaining logs of data changes and user activities.
- Regular Testing: Periodic review and testing of controls.
Mind Map: SOX Compliance Components in Performance Data
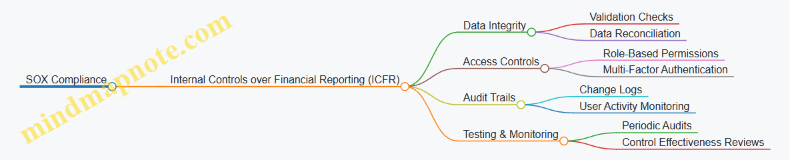
Best Practices for Ensuring SOX Compliance in Performance Measurement
-
Implement Robust Data Governance Policies
- Define clear roles and responsibilities for data owners and users.
- Example: A corporate finance team assigns data stewardship roles to ensure accountability for KPI data accuracy.
-
Use Automated Controls and Validation Rules
- Automate data validation to reduce manual errors.
- Example: An ERP system enforces validation rules on financial inputs, preventing incorrect data entry.
-
Maintain Comprehensive Audit Trails
- Track all changes to performance data with timestamps and user IDs.
- Example: A performance management software logs every KPI update, enabling traceability during audits.
-
Regularly Test and Review Controls
- Conduct internal audits and control testing to identify weaknesses.
- Example: Quarterly control testing reveals a gap in access permissions, which is promptly addressed.
-
Train Staff on Compliance Requirements
- Educate accountants and analysts on SOX requirements and their role in compliance.
- Example: Monthly training sessions include case studies on compliance breaches and prevention.
Mind Map: Best Practices for SOX Compliance
Example Scenario: SOX Compliance in a Corporate Finance Department
Situation: A multinational corporation’s finance department uses a performance measurement system to report quarterly financial KPIs to the board.
Challenge: Ensuring that the KPI data feeding into financial reports complies with SOX requirements.
Actions Taken:
- Implemented role-based access controls limiting data entry to authorized personnel.
- Automated data validation checks within the performance system to flag anomalies.
- Established audit trails capturing every data modification with user details.
- Conducted quarterly internal audits to test the effectiveness of controls.
- Provided ongoing SOX compliance training to all finance and performance analysts.
Outcome: The company passed external SOX audits without any material weaknesses related to performance data, enhancing stakeholder confidence.
Summary
Ensuring SOX compliance in performance measurement is not just about meeting regulatory requirements but also about fostering trust and transparency in financial reporting. By implementing strong internal controls, automating validation, maintaining audit trails, and educating staff, organizations can effectively manage compliance risks associated with performance data.
For accountants and performance analysts, embedding these best practices into daily workflows is essential to uphold the integrity and reliability of corporate performance measurement systems.
9.5 Case Study: Ethical Dilemmas in Performance Reporting and How to Address Them
Performance reporting is a critical function within corporate finance and accounting, providing stakeholders with insights into organizational health and progress. However, ethical dilemmas often arise when the pressure to meet targets conflicts with transparency and accuracy. This case study explores common ethical challenges in performance reporting and practical ways to address them.
Common Ethical Dilemmas in Performance Reporting
Example Scenario: Inflated Revenue Reporting
A corporate finance team in a mid-sized company faced intense pressure to demonstrate quarterly growth. To meet targets, the team recognized revenue prematurely from sales contracts that had contingencies yet to be fulfilled. This led to inflated revenue figures in the performance reports.
Ethical Issues:
- Misleading stakeholders about true financial health.
- Potential violation of accounting standards.
Consequences:
- Loss of trust from investors and auditors.
- Regulatory penalties and reputational damage.
Addressing Ethical Dilemmas: Best Practices
Example Solution: Implementing an Ethics Framework
The company from the scenario introduced an ethics framework that included:
- Mandatory quarterly ethics training for all finance staff.
- Anonymous reporting hotline to raise concerns about data integrity.
- Regular internal audits focusing on revenue recognition policies.
- Revised incentive plans balancing financial results with compliance and ethical behavior.
As a result, the company improved accuracy in performance reporting and restored stakeholder confidence.
Additional Example: Selective Disclosure in KPI Reporting
A performance analyst noticed that the monthly report consistently excluded customer satisfaction scores when they were below target, focusing only on financial KPIs.
Ethical Concern: Misleading management by omitting critical non-financial indicators.
Resolution: The analyst proposed a revised reporting template that integrated financial and non-financial KPIs, ensuring a balanced view of performance. Management adopted this approach, leading to more informed decision-making.
Summary
Ethical dilemmas in performance reporting can undermine trust and damage organizational reputation. Accountants and performance analysts play a pivotal role in maintaining integrity by:
- Upholding transparency and accuracy.
- Advocating for ethical policies and training.
- Encouraging open communication and independent reviews.
By embedding ethics into performance measurement systems, organizations can foster a culture of accountability and long-term success.
10. Future Trends in Performance Measurement and Management
10.1 The Rise of Real-Time Performance Analytics
Introduction
Real-time performance analytics is revolutionizing how organizations monitor, analyze, and respond to their operational and financial data. Unlike traditional periodic reporting, real-time analytics provides instantaneous insights, enabling accountants and performance analysts to make faster, data-driven decisions that can significantly improve business outcomes.
What is Real-Time Performance Analytics?
Real-time performance analytics refers to the continuous collection, processing, and visualization of data as events occur. This approach allows organizations to track key performance indicators (KPIs) and metrics without delay, facilitating immediate action and agile management.
Benefits of Real-Time Performance Analytics
- Faster Decision-Making: Immediate access to data helps identify issues and opportunities quickly.
- Improved Accuracy: Automated data feeds reduce manual errors.
- Enhanced Responsiveness: Enables proactive management rather than reactive.
- Better Resource Allocation: Real-time insights help optimize operational efficiency.
Mind Map: Components of Real-Time Performance Analytics
Example 1: Real-Time Cash Flow Monitoring in Corporate Finance
A multinational corporation implemented a real-time cash flow dashboard integrated with their ERP and treasury management systems. This dashboard updates cash positions every 15 minutes, allowing the finance team to:
- Detect potential liquidity shortages early.
- Optimize short-term borrowing and investment decisions.
- Reduce reliance on end-of-day manual reconciliations.
This proactive approach led to a 20% reduction in overdraft fees and improved working capital management.
Mind Map: Real-Time Cash Flow Monitoring
Example 2: Performance Analytics in Retail Sales
A retail chain uses real-time sales analytics to monitor store performance across locations. Sales data streams from POS systems into a centralized dashboard, enabling regional managers to:
- Identify underperforming stores instantly.
- Adjust inventory and staffing dynamically.
- Launch targeted promotions based on live customer behavior.
As a result, the company increased same-store sales by 8% within six months.
Mind Map: Real-Time Retail Sales Analytics
Implementing Real-Time Performance Analytics: Best Practices
- Identify Critical KPIs: Focus on metrics that truly impact business objectives.
- Ensure Data Quality: Use automated data validation to maintain accuracy.
- Leverage Scalable Technology: Adopt cloud-based and in-memory computing solutions.
- Create Intuitive Dashboards: Design visualizations that are easy to interpret.
- Enable Mobile Access: Allow stakeholders to access insights anytime, anywhere.
- Set Thresholds and Alerts: Automate notifications for anomalies or target breaches.
Conclusion
The rise of real-time performance analytics empowers accountants and performance analysts to transform raw data into actionable insights instantly. By embracing this approach, organizations can enhance agility, improve financial management, and maintain a competitive edge in today’s fast-paced business environment.
10.2 Integration of Artificial Intelligence and Automation
Artificial Intelligence (AI) and automation are revolutionizing performance measurement and management in corporate finance. By automating routine tasks and leveraging AI-driven insights, accountants and performance analysts can focus on strategic decision-making, improve accuracy, and accelerate reporting cycles.
What AI and Automation Bring to Performance Management
- Data Processing at Scale: AI can analyze vast datasets quickly, identifying patterns and anomalies that may be missed by manual review.
- Predictive Analytics: AI models forecast future performance trends based on historical data.
- Automation of Routine Tasks: Automation tools handle repetitive activities such as data entry, report generation, and KPI tracking.
- Enhanced Decision Support: AI-driven dashboards provide actionable insights in real-time.
Mind Map: AI and Automation in Performance Measurement
Practical Examples
Example 1: Automated KPI Tracking in a Corporate Finance Team
A multinational corporation implemented an AI-powered platform that automatically pulls financial data from ERP systems and updates KPIs daily. This automation reduced manual data reconciliation by 70%, enabling analysts to focus on interpreting results rather than gathering data.
Example 2: Predictive Cash Flow Forecasting
Using machine learning algorithms, a finance department developed a predictive model that forecasts cash flow fluctuations based on historical payment patterns, seasonal trends, and external economic indicators. This allowed proactive management of liquidity risks.
Mind Map: Workflow Automation in Performance Management
Best Practices for Integrating AI and Automation
- Start Small with Pilot Projects: Begin with automating simple, high-impact tasks such as report generation or data validation.
- Ensure Data Quality: AI effectiveness depends on clean, accurate data; invest in data governance.
- Involve End-Users Early: Engage accountants and analysts to tailor AI tools to actual workflow needs.
- Maintain Transparency: Use explainable AI models to build trust and facilitate audit trails.
- Continuously Monitor and Refine: AI models should be regularly updated based on feedback and changing business conditions.
Example: AI-Driven Anomaly Detection in Expense Reporting
A corporate finance team integrated an AI system that scans expense reports for unusual patterns, such as duplicate claims or outliers compared to historical spending. This system flagged potential errors or fraud early, reducing financial leakage and improving compliance.
Mind Map: Benefits of AI and Automation for Accountants and Performance Analysts
Summary
Integrating AI and automation into performance measurement and management transforms how finance professionals operate. By automating routine processes and harnessing advanced analytics, organizations can achieve more accurate, timely, and insightful performance evaluations. This empowers accountants and performance analysts to drive strategic value and support sustained corporate growth.
10.3 The Growing Importance of Sustainability and ESG Metrics
In recent years, sustainability and Environmental, Social, and Governance (ESG) metrics have become central to corporate performance measurement and management. This shift is driven by increasing regulatory requirements, investor demand, and societal expectations for responsible business practices. For accountants and performance analysts, integrating ESG metrics into traditional financial performance frameworks is no longer optional but essential for comprehensive corporate evaluation.
What are ESG Metrics?
- Environmental (E): Measures related to a company’s impact on the natural environment, such as carbon emissions, energy consumption, waste management, and water usage.
- Social (S): Metrics that assess how a company manages relationships with employees, suppliers, customers, and communities. Examples include labor practices, diversity and inclusion, and community engagement.
- Governance (G): Focuses on corporate governance structures and practices, including board diversity, executive compensation, transparency, and ethical conduct.
Why ESG Metrics Matter in Performance Measurement
- Investor Influence: Increasingly, investors use ESG data to assess risk and long-term value creation.
- Regulatory Compliance: Governments and regulatory bodies are mandating ESG disclosures (e.g., EU Taxonomy, SEC proposals).
- Reputation and Brand Value: Strong ESG performance enhances corporate reputation and customer loyalty.
- Operational Efficiency: Sustainability initiatives often lead to cost savings through energy efficiency and waste reduction.
Mind Map: ESG Metrics Integration into Performance Management
Best Practice: Incorporating ESG Metrics into Corporate Performance Dashboards
Example: A multinational corporation in the finance sector integrated ESG metrics alongside traditional financial KPIs in their executive dashboard. Key environmental KPIs included carbon emissions per revenue unit and paper usage reduction targets. Social KPIs tracked employee turnover rates and diversity ratios. Governance KPIs monitored board independence and compliance incidents.
This integration enabled the leadership team to view ESG and financial performance holistically, driving strategic decisions such as investing in green technologies and enhancing diversity programs.
Mind Map: Example ESG KPIs for Finance and Corporate Sectors
Practical Example: ESG Reporting in Action
A corporate finance team at a retail company implemented quarterly ESG reporting as part of their performance management cycle. They tracked energy consumption and waste reduction initiatives at store locations (Environmental), monitored employee satisfaction surveys and diversity hiring targets (Social), and reviewed governance policies related to supplier ethics and anti-corruption (Governance).
The team used this data to identify underperforming stores in sustainability efforts and worked with operations to implement corrective actions, resulting in a 15% reduction in energy consumption over 12 months.
Challenges and Considerations
- Data Quality and Availability: ESG data can be difficult to collect and standardize.
- Materiality: Not all ESG metrics are equally relevant; focus should be on material issues.
- Integration with Financial Metrics: Balancing ESG goals with financial performance requires thoughtful KPI design.
Mind Map: Challenges in ESG Performance Measurement
Conclusion
Sustainability and ESG metrics are reshaping how performance is measured and managed in corporate finance. By thoughtfully integrating ESG into performance frameworks, accountants and performance analysts can provide deeper insights that support sustainable growth, risk mitigation, and enhanced stakeholder trust.
Further Reading and Resources
- Global Reporting Initiative (GRI) Standards
- Sustainability Accounting Standards Board (SASB)
- Task Force on Climate-related Financial Disclosures (TCFD)
- Examples of ESG Integration in Corporate Finance Reports
10.4 Best Practice: Incorporating ESG Metrics into Corporate Performance Dashboards (Example: Sustainability Reporting in Finance)
Incorporating Environmental, Social, and Governance (ESG) metrics into corporate performance dashboards is becoming increasingly critical for finance professionals. ESG factors not only influence a company’s reputation and compliance but also impact long-term financial performance and risk management.
Why Incorporate ESG Metrics?
- Investor Demand: Growing interest from investors in sustainable and responsible investing.
- Regulatory Compliance: Increasing regulations require transparent ESG reporting.
- Risk Management: Identifying ESG risks can prevent financial losses.
- Competitive Advantage: Demonstrating sustainability can improve brand value and stakeholder trust.
Key ESG Metrics to Include in Dashboards
Steps to Incorporate ESG Metrics into Performance Dashboards
-
Identify Relevant ESG Metrics
- Align with industry standards (e.g., SASB, GRI, TCFD).
- Prioritize metrics material to your business.
-
Integrate ESG Data Sources
- Collect data from internal systems (HR, operations).
- Use third-party ESG data providers if needed.
-
Define Clear KPIs and Targets
- Set measurable, time-bound goals.
- Example: Reduce carbon emissions by 20% over 5 years.
-
Design Dashboard Visualizations
- Use charts, gauges, and trend lines for clarity.
- Combine ESG metrics with financial KPIs for holistic insight.
-
Enable Real-Time Monitoring and Reporting
- Automate data updates where possible.
- Schedule regular reviews with stakeholders.
Example: Sustainability Reporting in Finance
A multinational corporation’s finance team integrated ESG metrics into their existing performance dashboard to support sustainability reporting:
- Environmental: Tracked monthly energy consumption and carbon emissions per business unit.
- Social: Monitored employee diversity ratios and recorded community investment amounts.
- Governance: Reported on board diversity and compliance incidents.
The dashboard featured:
- A carbon emissions trend line showing progress against reduction targets.
- A diversity heatmap highlighting departments with low representation.
- A risk compliance scorecard updated quarterly.
This integration enabled the finance team to:
- Provide transparent ESG disclosures to investors.
- Identify areas requiring improvement.
- Link ESG performance with financial outcomes such as cost savings from energy efficiency.
Mind Map: Integrating ESG into Corporate Dashboards
Additional Examples
-
Example 1: A financial services firm used ESG dashboards to monitor energy usage across offices globally, identifying high-consumption sites and implementing targeted reduction plans.
-
Example 2: A manufacturing company linked ESG metrics with operational KPIs, revealing that improved waste management correlated with lower production costs.
Best Practice Tips
- Start small by integrating a few high-impact ESG metrics.
- Ensure data quality and consistency through standardized collection methods.
- Engage cross-functional teams (finance, sustainability, operations) for comprehensive insights.
- Use storytelling in dashboards to communicate ESG impact effectively.
In summary, incorporating ESG metrics into corporate performance dashboards empowers finance professionals to drive sustainable business practices, meet stakeholder expectations, and enhance long-term value creation.
10.5 Preparing for the Future: Skills and Tools Accountants and Analysts Need
As the landscape of performance measurement and management evolves rapidly, accountants and performance analysts must equip themselves with a blend of technical, analytical, and interpersonal skills, alongside mastering emerging tools. This section explores these essential skills and tools, supported by mind maps and practical examples.
Key Skills for Future-Ready Accountants and Analysts
Example:
An accountant in a corporate finance team learns Python to automate repetitive data cleaning tasks, freeing up time to focus on deeper financial analysis and forecasting.
Essential Tools for Modern Performance Measurement
Example:
A performance analyst uses Power BI to create interactive dashboards that update in real-time, enabling leadership to monitor KPIs instantly and make data-driven decisions.
Mind Map: Integrating Skills and Tools for Future Performance Management
Practical Example: Upskilling Journey of a Performance Analyst
- Starting Point: Proficient in Excel and basic financial reporting.
- Step 1: Enrolls in an online Python for Data Analysis course.
- Step 2: Implements Python scripts to automate monthly variance reports.
- Step 3: Learns Power BI to build dynamic dashboards.
- Step 4: Collaborates with IT to integrate ERP data into dashboards.
- Outcome: Reduced report generation time by 50%, improved accuracy, and enhanced stakeholder engagement through visual storytelling.
Preparing for Emerging Trends
-
ESG and Sustainability Reporting: Accountants and analysts should familiarize themselves with ESG frameworks like GRI and SASB, and learn to integrate sustainability metrics into performance reports.
-
AI and Machine Learning: Understanding AI basics enables professionals to leverage predictive analytics for forecasting and anomaly detection.
-
Blockchain: Awareness of blockchain can improve audit trails and data integrity in financial reporting.
Final Recommendations
- Commit to lifelong learning through certifications, workshops, and webinars.
- Experiment with new tools in pilot projects before full-scale adoption.
- Foster cross-department collaboration to understand broader business impacts.
- Develop storytelling skills to translate complex data into actionable insights.
By proactively developing these skills and embracing cutting-edge tools, accountants and performance analysts will not only stay relevant but become strategic partners driving organizational success in the future.
11. Practical Implementation Guide and Case Studies
11.1 Step-by-Step Guide to Implementing a Performance Measurement System
Implementing a performance measurement system is a critical step for accountants and performance analysts aiming to drive organizational success. This guide breaks down the process into clear, actionable steps, supported by mind maps and practical examples to ensure clarity and applicability.
Step 1: Define Objectives and Scope
Start by clearly defining what you want to achieve with your performance measurement system. Objectives should align with the overall corporate strategy.
- Example: A corporate finance team wants to improve cash flow management and reduce overdue receivables.
Mind Map: Defining Objectives and Scope
Step 2: Identify Key Performance Indicators (KPIs)
Select KPIs that directly reflect the objectives. Ensure they are SMART (Specific, Measurable, Achievable, Relevant, Time-bound).
- Example: For cash flow management:
- Days Sales Outstanding (DSO)
- Cash Conversion Cycle
- Percentage of Overdue Receivables
Mind Map: Selecting KPIs
Step 3: Design Data Collection and Reporting Processes
Establish how data will be collected, validated, and reported. Automation can improve accuracy and timeliness.
- Example: Integrate ERP system data with a BI tool to automate cash flow reports.
Mind Map: Data Collection and Reporting
Step 4: Set Targets and Benchmarks
Define performance targets based on historical data, industry standards, or strategic goals.
- Example: Set a target DSO of 30 days, compared to an industry average of 35 days.
Mind Map: Targets and Benchmarks
Step 5: Implement Performance Monitoring Tools
Deploy dashboards and visualization tools to track KPIs in real-time.
- Example: Use Power BI to create a dashboard showing cash flow trends and overdue invoices.
Mind Map: Monitoring Tools
Step 6: Communicate and Train Stakeholders
Ensure all relevant employees understand the system, their roles, and how to interpret the data.
- Example: Conduct workshops for finance staff on using the new dashboard and interpreting KPIs.
Mind Map: Communication and Training
Step 7: Review and Refine the System
Continuously evaluate the system’s effectiveness and make improvements based on feedback and changing business needs.
- Example: Quarterly review meetings to assess KPI relevance and data accuracy.
Mind Map: Review and Refinement
Summary Example: Implementing a Performance Measurement System in a Corporate Finance Department
- Objective: Improve cash flow and reduce overdue payments.
- KPIs: DSO, Cash Conversion Cycle, Overdue Receivables %.
- Data Collection: Automated extraction from ERP, monthly validation.
- Targets: DSO ≤ 30 days, Overdue Receivables < 5%.
- Monitoring: Power BI dashboard with real-time alerts.
- Training: Monthly workshops and user guides.
- Review: Quarterly performance meetings with continuous feedback.
This structured approach ensures that performance measurement systems are not only well-designed but also practical, actionable, and aligned with organizational goals.
11.2 Common Mistakes and How to Avoid Them
Performance measurement and management systems are vital for driving organizational success, but they often fall short due to common pitfalls. Understanding these mistakes and learning how to avoid them can significantly enhance the effectiveness of your performance initiatives.
Common Mistakes in Performance Measurement and Management
How to Avoid These Mistakes
Align Metrics with Strategic Objectives
- Example: A corporate finance team at a manufacturing firm shifted from purely financial KPIs (like cost reduction) to include operational metrics such as production cycle time and quality defects, directly supporting their strategic goal of operational excellence.
- Best Practice: Use frameworks like the Balanced Scorecard to ensure metrics cover financial, customer, internal process, and learning perspectives.
Ensure Data Accuracy and Timeliness
- Example: An accounting department implemented automated data validation rules within their ERP system, reducing errors in monthly financial reports by 30%.
- Best Practice: Establish clear data governance policies and use automated tools to minimize manual errors.
Simplify and Prioritize KPIs
- Example: A retail finance team reduced their KPIs from 25 to 8, focusing on the most impactful metrics such as sales growth, inventory turnover, and cash flow.
- Best Practice: Limit KPIs to a manageable number (typically 5-10) that directly influence business outcomes.
Incorporate Non-Financial Metrics
- Example: A corporate finance department started tracking employee training hours and customer satisfaction scores alongside financial results, leading to better long-term performance insights.
- Best Practice: Balance financial and non-financial indicators to get a holistic view of performance.
Engage Stakeholders Early and Often
- Example: A multinational corporation held workshops with finance teams and business unit managers to co-create KPIs, resulting in higher adoption and ownership.
- Best Practice: Communicate the purpose and benefits of performance measurement clearly and involve stakeholders in the design phase.
Conduct Regular Performance Reviews
- Example: A corporate finance team established monthly review meetings with dashboards highlighting key metrics, enabling timely course corrections.
- Best Practice: Set a consistent review cadence (monthly or quarterly) and use visual tools like dashboards for clarity.
Align Incentives with Desired Outcomes
- Example: A company redesigned its bonus scheme to reward both financial results and process improvements, reducing short-term risk-taking behaviors.
- Best Practice: Combine financial and behavioral KPIs in incentive plans to encourage balanced performance.
Leverage Technology for Integration and Automation
- Example: A finance department integrated their performance measurement system with their ERP and BI tools, enabling real-time data updates and automated report generation.
- Best Practice: Invest in technology platforms that support seamless data flow and visualization.
Mind Map: Avoiding Common Mistakes
Summary Example: Avoiding Pitfalls in Practice
Scenario: A corporate finance team at a mid-sized tech company was struggling with inconsistent performance results and low employee engagement.
Mistakes Identified: Overly complex KPIs, poor data quality, and lack of stakeholder buy-in.
Actions Taken:
- Reduced KPIs from 20 to 7, focusing on strategic goals.
- Implemented automated data validation within their finance system.
- Conducted workshops with finance and operational teams to align objectives.
- Established monthly review meetings supported by interactive dashboards.
Outcome: Improved data accuracy, clearer focus on priorities, and increased team motivation leading to a 15% improvement in key financial metrics within a year.
By proactively identifying these common mistakes and applying the avoidance strategies, accountants and performance analysts can build more effective, reliable, and actionable performance measurement and management systems that drive sustainable corporate success.
11.3 Case Study 1: Performance Management Transformation in a Global Finance Department
Background
A multinational corporation with a complex global finance department faced challenges in aligning performance measurement across its diverse regional teams. The existing system was fragmented, relying heavily on manual reporting and inconsistent KPIs, leading to delayed insights and misaligned objectives.
Objectives
- Standardize performance metrics across all regions.
- Improve data accuracy and timeliness.
- Enhance transparency and accountability.
- Link performance measurement with strategic goals.
Transformation Approach
Step 1: Assessment and Stakeholder Engagement
- Conducted workshops with regional finance leads and performance analysts.
- Mapped existing KPIs and reporting processes.
- Identified gaps and pain points.
Step 2: Designing a Unified Performance Framework
- Adopted the Balanced Scorecard approach to balance financial and operational metrics.
- Developed a standardized KPI library applicable globally but adaptable locally.
Step 3: Technology Integration
- Implemented a cloud-based performance management system integrated with the ERP.
- Automated data collection to reduce manual errors.
Step 4: Training and Change Management
- Delivered training sessions for accountants and analysts on new tools and processes.
- Established a feedback loop for continuous improvement.
Step 5: Continuous Monitoring and Improvement
- Monthly performance review meetings with standardized dashboards.
- Quarterly recalibration of KPIs based on business needs.
Mind Map: Transformation Process Overview
Examples of Standardized KPIs Adopted
| KPI Category | KPI Name | Description | Example Target |
|---|---|---|---|
| Financial | Operating Margin | Profitability measure after operating costs | > 15% |
| Financial | Days Sales Outstanding (DSO) | Average collection period for receivables | < 45 days |
| Operational | Invoice Processing Time | Average time to process supplier invoices | < 3 days |
| Customer/Stakeholder | Internal Client Satisfaction | Survey score from internal departments | > 85% satisfaction |
| Learning & Growth | Training Completion Rate | Percentage of staff completing training | 100% annually |
Mind Map: KPI Categories and Examples
Results and Benefits
- Improved Data Accuracy: Automation reduced manual errors by 40%.
- Faster Reporting: Monthly reports generated 50% faster, enabling timely decision-making.
- Alignment: All regional teams aligned on common objectives, improving collaboration.
- Employee Engagement: Training and clear metrics increased analyst engagement and accountability.
Lessons Learned
- Early stakeholder involvement is critical to adoption.
- Flexibility in KPI application allows regional customization without losing standardization.
- Continuous feedback loops ensure the system evolves with business needs.
Final Mind Map: Key Success Factors
This case study illustrates how a structured, technology-enabled approach to performance management can transform a global finance department, delivering measurable improvements in efficiency, alignment, and strategic impact.
11.4 Case Study 2: Small Business Success Story Using KPI-Driven Management
Introduction
Small businesses often face unique challenges such as limited resources, tight budgets, and the need for rapid decision-making. This case study explores how a small retail business successfully implemented KPI-driven management to improve operational efficiency, increase sales, and enhance customer satisfaction.
Background
“GreenLeaf Organics” is a small, family-owned organic grocery store located in a suburban area. Facing increased competition from larger chains and online retailers, GreenLeaf needed a structured approach to measure performance and make data-driven decisions.
Step 1: Identifying Key Performance Indicators (KPIs)
The management team, including the owner and the accountant, collaborated to identify KPIs that aligned with their strategic goals:
- Sales Growth Rate: Monthly increase in total sales revenue.
- Customer Retention Rate: Percentage of repeat customers.
- Inventory Turnover Ratio: How quickly inventory is sold and replaced.
- Gross Profit Margin: Profitability of products sold.
- Employee Productivity: Sales per employee per month.
Mind Map: KPI Identification
Step 2: Data Collection and Tools
GreenLeaf implemented a simple Point of Sale (POS) system integrated with inventory management software. This allowed automatic tracking of sales, inventory levels, and customer purchase history.
- Example: The POS system generated daily sales reports and flagged slow-moving inventory.
Step 3: Setting Targets and Benchmarks
The team set realistic monthly targets based on historical data and industry averages:
- Sales Growth Rate: 5% increase per month
- Customer Retention Rate: 70%
- Inventory Turnover Ratio: 8 times per year
- Gross Profit Margin: 40%
- Employee Productivity: $5,000 sales per employee per month
Step 4: Monitoring and Analysis
Monthly performance meetings were held to review KPIs. The accountant prepared detailed reports highlighting areas of concern and success.
- Example: In Month 3, inventory turnover dropped to 5 times per year, triggering a review of purchasing practices.
Mind Map: Monitoring Process
Step 5: Action and Continuous Improvement
Based on KPI insights, GreenLeaf took several actions:
- Reduced orders of slow-moving products and introduced promotions to clear excess stock.
- Launched a customer loyalty program to improve retention.
- Provided sales training to employees to boost productivity.
Results After 6 Months
- Sales Growth Rate averaged 6.2% per month, exceeding targets.
- Customer Retention Rate increased from 60% to 75%.
- Inventory Turnover Ratio improved to 9 times per year.
- Gross Profit Margin stabilized at 42%.
- Employee Productivity rose to $5,500 sales per employee per month.
Mind Map: Results Summary
Lessons Learned and Best Practices
- Align KPIs with Business Goals: GreenLeaf’s success was driven by selecting KPIs that directly impacted their strategic priorities.
- Leverage Technology: Even simple POS and inventory systems can provide valuable data for performance management.
- Regular Review and Adaptation: Monthly meetings ensured timely responses to performance issues.
- Employee Involvement: Engaging staff in understanding KPIs and their role in achieving targets boosted motivation.
Conclusion
This case study demonstrates that small businesses like GreenLeaf Organics can achieve significant improvements by adopting KPI-driven management. By focusing on relevant metrics, leveraging technology, and fostering a culture of continuous improvement, small enterprises can compete effectively and sustain growth.
Additional Example: KPI-Driven Marketing Campaign
GreenLeaf used customer purchase data to identify popular products and launched targeted promotions via email. This campaign increased repeat visits by 15% over three months, showcasing how KPIs can guide marketing strategies.
Mind Map: Marketing Campaign
11.5 Best Practice: Continuous Improvement through Feedback Loops and Iterative Refinement
Continuous improvement is a cornerstone of effective performance measurement and management. By establishing feedback loops and embracing iterative refinement, organizations can adapt their strategies, processes, and metrics to evolving business needs and external conditions. This approach ensures that performance management systems remain relevant, actionable, and aligned with organizational goals.
What is Continuous Improvement in Performance Management?
Continuous improvement involves regularly reviewing performance data, gathering stakeholder feedback, and making incremental changes to enhance the effectiveness of measurement and management practices.
Key components include:
- Feedback Loops: Mechanisms to collect, analyze, and act on performance data and stakeholder input.
- Iterative Refinement: Repeated cycles of assessment and adjustment to optimize performance systems.
Why Feedback Loops Matter
Feedback loops enable organizations to:
- Detect issues early and respond proactively.
- Validate if performance metrics are driving desired behaviors.
- Foster a culture of transparency and accountability.
Mind Map: Continuous Improvement Process
Example: Iterative Refinement in a Corporate Finance Team
A corporate finance department implemented a new KPI dashboard to track monthly budget adherence. After the first quarter, feedback from accountants revealed that some KPIs were too broad and didn’t capture department-specific nuances.
Actions Taken:
- Conducted focused workshops with finance teams to understand pain points.
- Refined KPIs to include more granular metrics like project-level cost variances.
- Updated dashboard visuals for better clarity.
- Rolled out training sessions to ensure consistent interpretation.
Outcome:
- Improved accuracy and relevance of performance data.
- Enhanced engagement from accountants and analysts.
- More informed decision-making leading to cost savings.
Mind Map: Feedback Loop Example in Performance Management
Best Practices for Implementing Feedback Loops and Iterative Refinement
- Engage All Relevant Stakeholders: Include accountants, analysts, managers, and frontline staff to gather diverse perspectives.
- Use Multiple Feedback Channels: Combine quantitative data with qualitative insights.
- Maintain Transparency: Share findings and planned changes openly to build trust.
- Set Clear Timelines: Define regular intervals for review and refinement (e.g., quarterly).
- Leverage Technology: Utilize dashboards and collaboration tools to streamline feedback collection and communication.
- Document Changes: Keep a record of iterations to track progress and lessons learned.
Example: Continuous Improvement in a Retail Finance Department
A retail company used monthly sales variance reports but noticed recurring discrepancies between forecasted and actual figures. By establishing a feedback loop involving store managers and finance analysts, they uncovered inconsistent data entry practices.
Iterative Steps:
- Standardized data entry protocols.
- Introduced training sessions for store staff.
- Enhanced variance reports with drill-down capabilities.
- Scheduled monthly review meetings to discuss findings.
Result:
- Reduced data errors by 30% within six months.
- More reliable forecasting and budgeting.
- Increased collaboration between finance and operations teams.
Summary
Continuous improvement through feedback loops and iterative refinement transforms performance measurement from a static reporting exercise into a dynamic management tool. By embracing this best practice, accountants and performance analysts can drive sustained organizational excellence, adapt to change swiftly, and foster a proactive performance culture.
12. Conclusion and Key Takeaways
12.1 Summarizing Best Practices in Performance Measurement and Management
Performance measurement and management are critical pillars for driving organizational success, especially within finance and corporate sectors. To ensure effectiveness, several best practices have emerged that accountants and performance analysts should adopt. Below is a comprehensive summary integrating key best practices with easy-to-understand examples and mind maps to visualize the concepts.
Best Practice 1: Align Metrics with Strategic Objectives
Ensuring that performance metrics directly support the organization’s strategic goals is fundamental. This alignment guarantees that efforts contribute to overall success rather than isolated or irrelevant targets.
Example: A corporate finance team adopts the Balanced Scorecard framework to align financial KPIs (like ROI, EVA) with customer satisfaction and internal process improvements.
Best Practice 2: Use a Balanced Mix of Financial and Non-Financial Metrics
Relying solely on financial data can provide an incomplete picture. Incorporating non-financial indicators such as customer satisfaction, employee engagement, and process efficiency leads to a holistic view.
Example: A retail chain tracks sales growth (financial) alongside customer feedback scores (non-financial) to measure true performance.
Best Practice 3: Ensure Data Accuracy and Integrity
Accurate data collection and validation are vital for trustworthy performance measurement.
Example: A manufacturing company integrates ERP systems to automate data capture, reducing manual errors and improving reporting accuracy.
Best Practice 4: Implement Continuous Monitoring and Feedback Loops
Performance management is an ongoing process. Regular monitoring and timely feedback help identify issues early and enable course corrections.
Example: A finance department holds monthly performance review meetings where KPIs are discussed, and action plans are developed.
Best Practice 5: Leverage Technology and Visualization Tools
Using dashboards and BI tools enhances data accessibility and comprehension, enabling faster decision-making.
Example: A corporate finance team uses cloud-based dashboards to visualize cash flow trends and forecast scenarios.
Best Practice 6: Link Performance to Incentives Thoughtfully
Incentive programs should motivate desired behaviors without encouraging short-termism or unethical practices.
Example: A company combines financial targets with behavioral KPIs (like collaboration and compliance) in its bonus scheme.
Best Practice 7: Foster Transparency and Stakeholder Engagement
Open communication about performance criteria and results builds trust and reduces resistance.
Example: A multinational corporation conducts workshops to explain new performance measurement systems and gather employee feedback.
Summary Table of Best Practices with Examples
| Best Practice | Description | Example Scenario |
|---|---|---|
| Align Metrics with Strategy | Link KPIs to strategic goals | Balanced Scorecard in finance team |
| Balanced Financial & Non-Financial | Use diverse metrics for holistic view | Retail chain tracking sales & customer feedback |
| Data Accuracy & Integrity | Automate and validate data | ERP integration in manufacturing |
| Continuous Monitoring & Feedback | Regular reviews and adjustments | Monthly finance performance meetings |
| Leverage Technology & Visualization | Use dashboards and BI tools | Cloud-based cash flow dashboards |
| Thoughtful Incentive Linking | Combine financial and behavioral incentives | Bonus scheme with compliance and teamwork KPIs |
| Transparency & Stakeholder Engagement | Open communication and involvement | Workshops for new performance system rollout |
By embedding these best practices into your performance measurement and management approach, accountants and performance analysts can drive more accurate, strategic, and actionable insights that propel corporate success.
12.2 The Strategic Value of Effective Performance Management
Effective performance management is not just a routine operational task; it is a strategic imperative that drives organizational success and sustainable growth. For accountants and performance analysts, understanding this strategic value is essential to align their efforts with the broader corporate objectives.
Why Performance Management is Strategically Valuable
- Aligns Organizational Goals: Ensures that every department and individual’s objectives support the company’s vision and mission.
- Enhances Decision-Making: Provides accurate, timely data that informs strategic choices.
- Drives Continuous Improvement: Identifies gaps and opportunities for process optimization.
- Improves Accountability: Establishes clear expectations and tracks progress transparently.
- Supports Resource Allocation: Helps prioritize investments based on performance insights.
Mind Map: Strategic Value of Performance Management
Example 1: Aligning Finance Department Goals with Corporate Strategy
A multinational corporation implemented a performance management system that linked the finance department’s KPIs directly to the company’s strategic goals such as revenue growth and cost efficiency. By tracking metrics like budget variance, cash flow forecasting accuracy, and cost reduction initiatives, the finance team was able to prioritize projects that supported the overall corporate strategy, resulting in a 15% improvement in operational efficiency within one year.
Mind Map: Example 1 - Finance Department Alignment
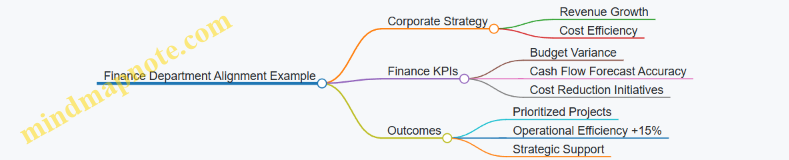
Example 2: Using Performance Management for Proactive Risk Management
A performance analyst in a corporate finance team used real-time dashboards to monitor liquidity ratios and debt covenants. Early detection of deviations allowed the company to take corrective actions before financial distress occurred. This proactive approach minimized risk and safeguarded the company’s credit rating.
Mind Map: Example 2 - Proactive Risk Management
Summary
Effective performance management transforms raw data into strategic insights. For accountants and performance analysts, it means moving beyond number crunching to becoming strategic partners who drive alignment, informed decision-making, and continuous improvement. By embedding performance management into the corporate fabric, organizations can achieve sustainable competitive advantage and long-term success.
12.3 Final Thoughts for Accountants and Performance Analysts
As accountants and performance analysts, you hold a pivotal role in driving the financial health and strategic success of your organizations. Performance measurement and management are not just about numbers—they are about telling the story behind those numbers and enabling informed decision-making that propels the business forward.
Key Mind Map: Core Responsibilities and Impact
Embracing a Strategic Mindset
Your role extends beyond traditional accounting or number crunching. You are strategic partners who translate complex data into meaningful insights. For example, when analyzing a quarterly financial report, instead of just reporting variances, consider the underlying business drivers such as market trends or operational changes. This approach helps leadership make proactive decisions.
Example: A performance analyst at a retail corporation noticed a consistent decline in same-store sales despite stable overall revenue. By digging deeper into regional KPIs and customer feedback, they identified emerging local competitors and changing consumer preferences. This insight led to targeted marketing campaigns and product adjustments that reversed the trend.
Mind Map: Strategic Analytical Approach

Leveraging Technology and Collaboration
Modern performance management relies heavily on technology. Accountants and analysts should embrace tools such as BI platforms, ERP systems, and predictive analytics to enhance accuracy and speed. Collaboration with IT, operations, and finance teams ensures data flows seamlessly and insights are actionable.
Example: An accountant integrated the company’s ERP system with a cloud-based dashboard tool, enabling real-time monitoring of cash flow and expenses. This integration reduced reporting lag from weeks to days and empowered managers to act swiftly on financial anomalies.
Mind Map: Technology & Collaboration
Cultivating a Culture of Continuous Improvement
Performance measurement is not a one-time task but an ongoing journey. Encourage a culture where feedback is welcomed, and performance data drives iterative improvements. Regularly revisit KPIs to ensure they remain relevant and aligned with evolving business goals.
Example: A corporate finance team instituted monthly review sessions where accountants and analysts presented performance results alongside improvement proposals. This practice fostered accountability and innovation, leading to a 15% increase in operational efficiency over a year.
Mind Map: Continuous Improvement Cycle
Final Recommendations:
- Be Proactive: Anticipate challenges by using predictive analytics and scenario planning.
- Communicate Effectively: Tailor your reporting to the audience; use visuals and storytelling.
- Stay Agile: Adapt KPIs and processes as business priorities shift.
- Invest in Skills: Continuously develop technical and analytical capabilities.
- Champion Ethics: Maintain transparency and integrity in all performance reporting.
By embracing these principles, accountants and performance analysts become invaluable strategic advisors, driving sustainable growth and organizational excellence.
12.4 Resources for Further Learning and Development
To excel in performance measurement and management, continuous learning and development are essential. Below are curated resources, including books, online courses, tools, communities, and frameworks, designed to help accountants and performance analysts deepen their expertise.
Books
-
“The Balanced Scorecard: Translating Strategy into Action” by Robert S. Kaplan and David P. Norton
- A foundational text explaining the Balanced Scorecard framework with practical examples.
-
“Performance Measurement and Control Systems for Implementing Strategy” by Robert Simons
- Explores how performance measurement systems can be designed to support strategy execution.
-
“Key Performance Indicators: Developing, Implementing, and Using Winning KPIs” by David Parmenter
- A practical guide to selecting and using KPIs effectively.
Online Courses and Certifications
-
Coursera: Performance Measurement & Control Systems for Implementing Strategy
- Offered by University of Illinois, this course covers frameworks and real-world applications.
-
LinkedIn Learning: Financial Performance Measurement
- Focuses on financial KPIs and how to analyze them.
-
CIMA (Chartered Institute of Management Accountants): Performance Strategy
- Certification course emphasizing strategic performance management.
Tools and Software
-
Power BI and Tableau
- Business Intelligence tools for creating interactive dashboards and visualizing performance data.
-
Klipfolio
- Cloud-based dashboard software designed for KPI tracking.
-
ERP Systems (e.g., SAP, Oracle)
- Integrated platforms that support automated data collection and performance reporting.
Communities and Forums
-
The Performance Management Association (PMA)
- A professional network for sharing best practices and case studies.
-
LinkedIn Groups: Performance Management & Measurement
- Active discussions on trends, challenges, and solutions.
-
Reddit: r/Accounting and r/Finance
- Subreddits where professionals discuss tools, techniques, and industry news.
Frameworks and Methodologies
-
Balanced Scorecard Institute Resources
- Templates, case studies, and guides for implementing Balanced Scorecards.
-
SMART Goals Framework
- Methodology for setting Specific, Measurable, Achievable, Relevant, and Time-bound objectives.
-
Six Sigma and Lean Management
- Approaches focused on process improvement and operational performance.
Mind Maps
Mind Map 1: Key Areas for Learning in Performance Measurement
Mind Map 2: Resources for Skill Development
Mind Map 3: Applying Learning to Practice
Examples
-
Example 1: Using Online Courses to Build Expertise
- An accountant enrolls in the Coursera “Performance Measurement & Control Systems” course, learning to apply the Balanced Scorecard. They then lead a project to implement this framework in their finance department, improving strategic alignment.
-
Example 2: Leveraging BI Tools for Dashboard Creation
- A performance analyst uses Power BI tutorials to create interactive dashboards that visualize monthly KPIs, enabling real-time decision-making for senior management.
-
Example 3: Participating in Professional Communities
- By joining the Performance Management Association, a finance professional gains access to exclusive webinars and case studies, which they use to refine their company’s incentive programs.
By leveraging these resources, accountants and performance analysts can continuously enhance their skills, stay updated with industry best practices, and drive impactful performance management initiatives within their organizations.
12.5 Encouraging a Culture of Performance Excellence
Creating a culture of performance excellence is essential for sustaining long-term success in any corporate finance environment. It goes beyond simply measuring and managing performance—it involves embedding values, behaviors, and practices that motivate employees to consistently strive for improvement and align their efforts with organizational goals.
Key Elements to Foster a Culture of Performance Excellence
Leadership Commitment
Leaders must champion performance excellence by demonstrating commitment through their actions. For example, a CFO who regularly reviews performance dashboards with their team and openly discusses challenges and successes creates an environment of trust and accountability.
Example: At a multinational corporation, the finance leadership introduced monthly “Performance Huddles” where teams discuss KPIs openly, celebrate wins, and identify areas for improvement. This transparency fostered ownership and motivated employees to contribute proactively.
Employee Engagement
Engaged employees are more likely to embrace performance initiatives. Involving them in setting their own goals ensures alignment and personal investment.
Example: A corporate finance team implemented a quarterly workshop where accountants and analysts collaboratively set individual and team KPIs. This participative approach increased motivation and reduced resistance to performance evaluations.
Recognition programs that reward not only outcomes but also behaviors aligned with company values reinforce the culture.
Clear and Aligned Goals
Goals should be Specific, Measurable, Achievable, Relevant, and Time-bound (SMART) and aligned from top management down to individual contributors.
Example: A performance analyst in a corporate finance department linked their monthly reporting accuracy metric directly to the company’s broader financial integrity goal, ensuring their daily tasks contributed to strategic success.
Data-Driven Decision Making
Providing teams with access to accurate, timely data empowers them to make informed decisions.
Example: Implementing a cloud-based dashboard allowed accountants to monitor cash flow KPIs in real time, enabling quicker responses to variances and improving overall financial health.
Encouraging analytical thinking helps employees understand the “why” behind metrics, fostering a proactive rather than reactive mindset.
Continuous Improvement
A culture of excellence embraces learning and innovation.
Example: After identifying recurring budget variances, a performance analyst led a root cause analysis workshop, resulting in process changes that reduced errors by 15%.
Encouraging teams to experiment and learn from failures without fear of blame promotes creativity and resilience.
Summary Mindmap
Final Thought
Encouraging a culture of performance excellence requires deliberate effort, consistent leadership, and active participation from all levels of the organization. When accountants and performance analysts embrace these principles, they not only enhance individual and team performance but also contribute significantly to the organization’s strategic success.