Financial Planning and Analysis
1. Introduction to Financial Planning and Analysis
1.1 Understanding the Role of FP&A in Corporate Finance
Financial Planning and Analysis (FP&A) is a critical function within corporate finance that focuses on budgeting, forecasting, financial modeling, and strategic analysis to support decision-making and drive business performance. FP&A professionals act as the bridge between raw financial data and strategic business insights, enabling organizations to plan effectively, allocate resources efficiently, and respond proactively to market changes.
Core Responsibilities of FP&A
- Budgeting: Creating detailed financial plans that outline expected revenues, expenses, and capital expenditures.
- Forecasting: Updating financial predictions based on actual performance and changing business conditions.
- Financial Modeling: Building quantitative models to simulate financial outcomes and evaluate business scenarios.
- Variance Analysis: Comparing actual results against budgets or forecasts to identify drivers of performance.
- Strategic Planning Support: Aligning financial plans with corporate strategy and long-term goals.
- Reporting: Delivering timely, accurate financial insights to stakeholders.
Mind Map: Role of FP&A in Corporate Finance
Why FP&A is Essential in Corporate Finance
- Informed Decision-Making: FP&A provides executives with actionable insights, enabling data-driven decisions.
- Resource Optimization: Helps allocate capital and operational budgets efficiently to maximize ROI.
- Risk Management: Identifies financial risks early through scenario planning and variance analysis.
- Performance Monitoring: Tracks business performance against targets to ensure accountability.
- Strategic Alignment: Ensures financial plans support the company’s long-term vision and competitive positioning.
Example: FP&A in Action at a Technology Firm
Scenario: A mid-sized technology company is preparing its annual budget and quarterly forecasts.
- The FP&A team collaborates with sales, marketing, and product development to gather input on expected revenue growth and upcoming expenses.
- They build a financial model projecting cash flow for the next 12 months, incorporating assumptions about customer acquisition and churn rates.
- Monthly variance analysis highlights that marketing expenses exceeded budget due to an unplanned campaign.
- FP&A presents this insight to management, recommending adjustments in other discretionary spending to maintain profitability.
- The team updates forecasts accordingly and communicates revised financial targets to stakeholders.
This example demonstrates how FP&A integrates cross-functional information, applies best practices in budgeting and forecasting, and supports agile decision-making.
Mind Map: FP&A Process Flow Example
Summary
Understanding the role of FP&A in corporate finance is foundational for accountants and financial analysts. It encompasses a blend of analytical rigor, strategic thinking, and effective communication to ensure organizations remain financially healthy and competitive. By mastering FP&A, finance professionals can significantly contribute to their company’s success through insightful planning, accurate forecasting, and proactive financial management.
1.2 Key Objectives and Benefits of Effective FP&A
Financial Planning and Analysis (FP&A) is a cornerstone function within corporate finance that drives informed decision-making and strategic growth. Understanding its key objectives and benefits is essential for accountants and financial analysts aiming to maximize their impact.
Key Objectives of Effective FP&A
-
Accurate Budgeting and Forecasting
- Develop precise financial budgets and forecasts to guide resource allocation.
- Anticipate future financial performance and market conditions.
-
Performance Measurement and Variance Analysis
- Monitor actual financial results against budgets and forecasts.
- Identify variances and understand underlying causes.
-
Strategic Decision Support
- Provide actionable insights to support strategic initiatives and investments.
- Model different scenarios to evaluate potential outcomes.
-
Cash Flow Management
- Ensure liquidity and optimize working capital.
- Plan for capital expenditures and financing needs.
-
Risk Management
- Identify financial risks and develop mitigation strategies.
- Incorporate external market factors into planning.
-
Stakeholder Communication
- Deliver clear and concise financial reports to executives and stakeholders.
- Facilitate alignment between finance and operational teams.
Benefits of Effective FP&A
- Improved Financial Visibility: Enables organizations to see a clear picture of their financial health and future outlook.
- Enhanced Decision-Making: Data-driven insights reduce uncertainty and support better strategic choices.
- Operational Efficiency: Identifies cost-saving opportunities and optimizes resource utilization.
- Agility and Responsiveness: Facilitates quick adjustments to changing market conditions.
- Alignment of Goals: Ensures financial plans support overall business objectives.
Mind Map: Key Objectives of FP&A
Mind Map: Benefits of Effective FP&A
Example 1: Accurate Budgeting and Forecasting in Practice
A retail company uses FP&A to create a rolling 12-month forecast based on historical sales data, seasonal trends, and upcoming marketing campaigns. By updating the forecast monthly, the finance team can anticipate cash flow needs and adjust inventory purchases accordingly, preventing stockouts or excess inventory.
Example 2: Performance Measurement and Variance Analysis
A manufacturing firm compares its actual production costs against the budget each quarter. When a significant variance is detected due to higher raw material prices, the FP&A team investigates and recommends negotiating better supplier contracts or adjusting pricing strategies to maintain margins.
Example 3: Strategic Decision Support
A technology startup uses FP&A to model the financial impact of launching a new product line. By simulating different pricing and sales volume scenarios, the team advises leadership on the most profitable approach, balancing growth potential with cash flow constraints.
In summary, effective FP&A is not just about numbers; it is a strategic enabler that empowers finance professionals to guide their organizations toward sustainable success through insightful analysis, proactive planning, and clear communication.
1.3 Overview of the FP&A Process: From Budgeting to Forecasting
Financial Planning and Analysis (FP&A) is a critical function within corporate finance that helps organizations plan their financial future, allocate resources efficiently, and make informed decisions. The FP&A process typically encompasses several interconnected stages, from budgeting to forecasting, each playing a vital role in ensuring financial health and strategic alignment.
The FP&A Process: Key Stages
Budgeting: The Foundation of FP&A
Budgeting is the process of creating a detailed financial plan that outlines expected revenues, expenses, and capital expenditures for a future period, typically a fiscal year. It serves as a financial blueprint that guides the organization’s operations and strategic initiatives.
Best Practice: Involve cross-functional teams early in the budgeting process to ensure realistic assumptions and buy-in.
Example: A manufacturing company sets its annual budget by collaborating with sales, production, and procurement teams. Sales provides revenue targets based on market analysis, production estimates costs based on planned output, and procurement forecasts raw material expenses. This collaborative approach ensures the budget reflects operational realities.
Forecasting: Dynamic Financial Prediction
Forecasting updates the budget by incorporating actual performance data and new information to predict future outcomes. Unlike budgets, forecasts are flexible and can be revised multiple times during the fiscal year.
Best Practice: Use a combination of historical data analysis and market intelligence to improve forecast accuracy.
Example: A retail chain uses monthly sales data and seasonal trends to update its sales forecast quarterly. When a competitor launches a new product, the forecasting team adjusts projections to reflect potential market share changes.
Financial Modeling: Scenario Analysis and Decision Support
Financial models are quantitative tools that simulate financial performance under various assumptions. They help in evaluating investment opportunities, budgeting alternatives, and strategic initiatives.
Best Practice: Build models that are transparent, flexible, and easy to update.
Example: An FP&A analyst creates a cash flow model to assess the impact of opening a new store location, including initial investment, expected revenues, operating costs, and break-even analysis.
Variance Analysis: Monitoring and Control
Variance analysis involves comparing actual financial results against budgeted or forecasted figures to identify discrepancies and understand their causes.
Best Practice: Conduct variance analysis regularly and communicate findings promptly to relevant stakeholders.
Example: After Q2 results, a company notices that marketing expenses exceeded the budget by 15%. The FP&A team investigates and finds that an unplanned campaign was launched. This insight helps management decide whether to adjust the marketing budget or cut costs elsewhere.
Reporting and Communication: Driving Informed Decisions
The final stage involves preparing clear, concise reports and dashboards that communicate financial insights to executives, department heads, and other stakeholders.
Best Practice: Tailor reports to the audience’s needs, focusing on key metrics and actionable insights.
Example: An FP&A team prepares a monthly dashboard highlighting revenue growth, margin trends, and cash flow status for the executive team, enabling quick strategic decisions.
Summary Mind Map: FP&A Process Flow
Integrated Example: A Technology Company’s FP&A Cycle
Step 1: Budgeting The FP&A team collaborates with R&D, sales, and operations to build a budget focused on launching a new software product. They set revenue targets, allocate marketing spend, and plan hiring.
Step 2: Forecasting Mid-year, actual sales are lower than expected due to delayed product release. The team revises the forecast, adjusting revenue and expense projections accordingly.
Step 3: Financial Modeling To evaluate options, the team models the financial impact of accelerating the product launch versus extending the timeline.
Step 4: Variance Analysis Quarterly reviews reveal higher-than-budgeted development costs. The FP&A team investigates and recommends cost-saving measures.
Step 5: Reporting The team presents a comprehensive report to executives, highlighting risks, revised forecasts, and recommended actions.
This integrated approach ensures the company remains agile, financially disciplined, and strategically aligned throughout the fiscal year.
1.4 Best Practice: Aligning FP&A with Strategic Business Goals
Aligning Financial Planning and Analysis (FP&A) with strategic business goals is essential to ensure that financial resources are effectively allocated to drive the company’s long-term success. This alignment bridges the gap between high-level corporate strategy and day-to-day financial decisions, enabling organizations to measure progress, anticipate challenges, and capitalize on opportunities.
Why Alignment Matters
- Ensures financial plans support overall business objectives.
- Enhances decision-making with a clear strategic context.
- Improves resource allocation and prioritization.
- Facilitates communication between finance and other departments.
Key Steps to Align FP&A with Strategic Business Goals
Mind Map: Aligning FP&A with Strategic Business Goals
Example: Aligning FP&A in a Technology Company
Scenario: A mid-sized technology firm aims to increase its market share by 15% over the next two years by investing in product innovation and expanding into new geographic markets.
Step 1: Understand Corporate Strategy
- Strategic goals: Market share growth, innovation leadership, geographic expansion.
Step 2: Translate Strategy into Financial Metrics
- KPIs: R&D spend as % of revenue, revenue growth in new markets, gross margin improvement.
Step 3: Integrate into Budgeting
- Allocate increased budget to R&D and marketing for new regions.
- Reduce budget in less strategic areas.
Step 4: Monitor and Adjust
- Monthly review of R&D spend vs innovation milestones.
- Quarterly sales tracking in new markets.
Step 5: Collaborate Across Teams
- FP&A works with product development and sales teams to refine forecasts and budgets.
Mind Map: Example - Technology Company FP&A Alignment
Additional Tips for Effective Alignment
- Use Balanced Scorecards: Combine financial and non-financial KPIs to get a holistic view.
- Scenario Planning: Prepare for different strategic outcomes and their financial impacts.
- Regular Strategy Reviews: Update FP&A assumptions as business strategies evolve.
- Leverage Technology: Use FP&A tools that integrate strategy mapping and financial data.
By embedding strategic goals into the FP&A process, organizations can ensure that financial planning is not just about numbers but about driving meaningful business outcomes.
1.5 Example: How a Mid-Sized Company Uses FP&A to Drive Growth
Financial Planning and Analysis (FP&A) is a critical function for mid-sized companies aiming to scale efficiently and sustainably. Let’s explore a practical example of how a mid-sized manufacturing company, “ABC Manufacturing,” leverages FP&A to drive growth.
Company Background:
- Industry: Manufacturing (Consumer Electronics Components)
- Size: 250 employees
- Annual Revenue: $75 million
- Growth Goal: Increase revenue by 20% over the next 3 years while improving profitability
FP&A Role in Driving Growth
ABC Manufacturing’s FP&A team plays a pivotal role in aligning financial goals with operational execution. Here’s how they approach it:
Mind Map: FP&A Growth Strategy at ABC Manufacturing
Step 1: Budgeting & Forecasting
Best Practice: ABC Manufacturing uses a rolling forecast updated quarterly rather than a static annual budget. This allows the company to adapt quickly to market changes.
Example:
- The FP&A team collaborates with sales and operations to update revenue forecasts based on recent order trends.
- They run scenario analyses to understand the impact of potential supply chain disruptions.
Mind Map: Rolling Forecast Process
Step 2: Financial Modeling for New Product Launch
Best Practice: ABC Manufacturing builds detailed financial models to evaluate the profitability and cash flow impact of launching a new product line.
Example:
- The FP&A team constructs a model projecting sales volume, pricing, production costs, and marketing expenses over 5 years.
- They incorporate sensitivity analysis to test how changes in raw material prices affect profitability.
Mind Map: New Product Financial Model Components
Step 3: Performance Monitoring and Variance Analysis
Best Practice: Monthly variance analysis helps ABC Manufacturing identify deviations from budget and take corrective actions promptly.
Example:
- The FP&A team compares actual sales and costs against forecasts.
- When a variance is detected (e.g., higher raw material costs), they work with procurement to negotiate better terms or find alternative suppliers.
Mind Map: Variance Analysis Workflow
Step 4: Strategic Planning & Communication
Best Practice: The FP&A team ensures that financial insights are communicated clearly to executives and department heads to support decision-making.
Example:
- Quarterly presentations highlight key financial metrics and growth opportunities.
- Cross-functional workshops are held to align sales, operations, and finance on growth initiatives.
Mind Map: FP&A Communication Framework
Summary
By embedding FP&A best practices such as rolling forecasts, detailed financial modeling, rigorous variance analysis, and effective communication, ABC Manufacturing successfully drives its growth objectives. This integrated approach enables agile decision-making, optimizes resource allocation, and fosters collaboration across departments.
This example illustrates how mid-sized companies can leverage FP&A not just as a reporting function but as a strategic partner in growth.
2. Budgeting Fundamentals and Best Practices
2.1 Types of Budgets: Static, Flexible, and Rolling Budgets
Financial planning and analysis relies heavily on budgeting as a foundational tool to guide business decisions and resource allocation. Understanding the different types of budgets is critical for accountants and financial analysts to select the most appropriate budgeting method for their organization’s needs. In this section, we explore three primary types of budgets: Static, Flexible, and Rolling Budgets, along with practical examples and mind maps to clarify their structure and use.
Static Budgets
Definition: A static budget is a fixed budget that remains unchanged regardless of changes in business activity levels or external conditions. It is typically prepared for a specific period (e.g., annual or quarterly) and assumes a set level of output or sales.
Best Practice: Use static budgets when costs and revenues are predictable and stable, such as in organizations with fixed contracts or regulated industries.
Example: A manufacturing company budgets $500,000 for raw materials for the year, assuming production of 10,000 units. Even if actual production varies, the budgeted amount remains fixed.
Mind Map:
Flexible Budgets
Definition: A flexible budget adjusts or flexes with changes in activity levels or volume. It provides a more dynamic approach by recalculating budgeted costs based on actual output or sales.
Best Practice: Ideal for businesses with variable costs or fluctuating sales volumes, allowing for better performance evaluation.
Example: A retail company budgets variable costs of $20 per unit sold. If sales increase from 1,000 to 1,200 units, the flexible budget adjusts variable costs from $20,000 to $24,000 accordingly.
Mind Map:
Rolling Budgets (Continuous Budgets)
Definition: A rolling budget is continuously updated by adding a new budget period as the current period ends, maintaining a constant planning horizon (e.g., always 12 months ahead).
Best Practice: Use rolling budgets to maintain agility and responsiveness in dynamic business environments.
Example: A software company maintains a 12-month rolling budget. At the end of March, the budget for April of next year is added, and the budget for the month just ended is dropped, ensuring the company always plans one year ahead.
Mind Map:
Comparative Summary Mind Map
Practical Example Integrating All Three Budgets
Consider a mid-sized manufacturing firm planning for the upcoming fiscal year:
-
Static Budget: The finance team sets a fixed budget for administrative expenses at $200,000, assuming no major changes.
-
Flexible Budget: For production costs, which vary with output, the team sets a variable cost of $15 per unit. If production increases, the budget adjusts accordingly.
-
Rolling Budget: The company updates its sales and expense forecasts monthly, adding a new month at the end of each month to maintain a 12-month outlook.
This integrated approach allows the firm to maintain control over fixed costs, adapt to production changes, and stay agile with continuous updates.
Key Takeaways
- Static Budgets are simple but inflexible.
- Flexible Budgets provide adaptability to actual activity levels.
- Rolling Budgets ensure continuous planning and responsiveness.
Selecting the right budgeting type depends on the organization’s industry, cost structure, and volatility of business conditions.
By mastering these budgeting types, accountants and financial analysts can enhance the accuracy and effectiveness of financial planning and analysis, ultimately supporting better decision-making and organizational performance.
2.2 Step-by-Step Guide to Creating an Effective Budget
Creating an effective budget is a foundational skill for accountants and financial analysts involved in financial planning and analysis. A well-constructed budget not only guides resource allocation but also serves as a benchmark for performance measurement.
Step 1: Define Budget Objectives and Scope
- Clarify the purpose of the budget (e.g., operational control, strategic planning, cash flow management).
- Determine the time frame (monthly, quarterly, annual).
- Identify departments or business units involved.
Example: A retail company sets an annual budget focused on controlling operating expenses and supporting a planned store expansion.
Step 2: Gather Historical Data and Market Insights
- Collect past financial statements, expense reports, and revenue data.
- Analyze trends, seasonality, and anomalies.
- Incorporate market conditions and economic forecasts.
Example: A manufacturing firm reviews the last three years of sales data and notes a seasonal dip in Q2, adjusting projections accordingly.
Step 3: Identify Key Assumptions
- Define assumptions for revenue growth, cost inflation, headcount changes, and capital expenditures.
- Ensure assumptions are realistic and aligned with strategic goals.
Example: An IT services company assumes a 5% revenue growth based on new client acquisitions and a 3% salary increase for staff.
Step 4: Develop Revenue Projections
- Break down revenue by product lines, services, or regions.
- Use bottom-up or top-down approaches.
- Validate projections with sales and marketing teams.
Example: A software company uses a bottom-up approach, aggregating expected sales from each sales representative.
Step 5: Estimate Operating Expenses
- Categorize expenses: fixed vs variable.
- Include salaries, rent, utilities, marketing, and other overheads.
- Factor in planned changes like new hires or cost-saving initiatives.
Example: A logistics company plans to reduce fuel expenses by 10% through route optimization.
Step 6: Prepare Capital Expenditure Budget
- Identify major investments in equipment, technology, or facilities.
- Schedule timing and expected costs.
- Assess impact on cash flow.
Example: A pharmaceutical company budgets $2 million for a new lab facility expected to be completed in Q3.
Step 7: Consolidate and Review Draft Budget
- Aggregate all components into a comprehensive budget.
- Review for consistency and alignment with strategic goals.
- Conduct variance analysis against prior budgets.
Example: The finance team consolidates departmental budgets and identifies a 5% increase in overall expenses, prompting a review of discretionary spending.
Step 8: Obtain Approvals and Communicate
- Present the budget to senior management and stakeholders.
- Incorporate feedback and finalize.
- Communicate budget details to relevant teams.
Example: After presenting the draft budget, the CFO requests adjustments to marketing spend, which are incorporated before final approval.
Step 9: Implement and Monitor
- Use the budget as a baseline for financial control.
- Track actual performance against budget regularly.
- Adjust forecasts as needed.
Example: Monthly variance reports highlight overspending in procurement, leading to corrective actions.
Summary Mind Map
By following these structured steps, financial professionals can create budgets that are realistic, aligned with business goals, and serve as powerful tools for financial management and decision-making.
2.3 Best Practice: Involving Cross-Functional Teams in Budgeting
Involving cross-functional teams in the budgeting process is a critical best practice that enhances accuracy, fosters collaboration, and aligns financial goals with operational realities. By engaging representatives from various departments such as sales, marketing, operations, HR, and IT, organizations can create more realistic budgets that reflect the true needs and constraints of the business.
Why Involve Cross-Functional Teams?
- Improved Accuracy: Different departments provide insights into their specific cost drivers and revenue opportunities.
- Enhanced Accountability: When teams contribute to the budget, they are more likely to take ownership of their targets.
- Better Alignment: Ensures that financial plans support strategic objectives across the organization.
- Early Identification of Risks: Cross-functional input helps uncover potential bottlenecks or resource constraints early.
Mind Map: Benefits of Cross-Functional Budgeting
How to Implement Cross-Functional Budgeting
- Identify Key Stakeholders: Include representatives from all major departments.
- Set Clear Objectives: Communicate the purpose and goals of the budgeting cycle.
- Facilitate Collaborative Workshops: Use meetings or virtual sessions to gather input.
- Use Collaborative Tools: Employ budgeting software or shared spreadsheets for transparency.
- Review and Consolidate Inputs: FP&A team consolidates departmental budgets into the master budget.
- Iterate and Adjust: Allow feedback loops to refine assumptions and targets.
Mind Map: Steps to Implement Cross-Functional Budgeting
Example: Cross-Functional Budgeting in Practice
Company: TechGear Inc., a mid-sized technology hardware manufacturer
Scenario: TechGear is preparing its annual budget. The FP&A team invites department heads from Sales, R&D, Manufacturing, and Customer Support to participate.
- Sales Team: Projects a 10% increase in sales volume based on new product launches.
- R&D Team: Requests increased budget for product innovation and prototyping.
- Manufacturing: Highlights capacity constraints and requests investment in new machinery.
- Customer Support: Anticipates higher support costs due to product complexity.
Process:
- The FP&A team organizes a budgeting workshop where each department presents their assumptions.
- Conflicts arise between Manufacturing’s capacity limits and Sales’ aggressive sales targets.
- Through discussion, Sales agrees to moderate growth expectations, and Manufacturing proposes phased machinery upgrades.
- The collaborative approach results in a balanced budget that reflects achievable targets and resource availability.
Outcome:
- Improved buy-in from all departments.
- Reduced risk of budget overruns.
- Clear understanding of interdependencies.
Mind Map: Example Workflow at TechGear Inc.
Tips for Success
- Encourage Open Communication: Create a safe environment for honest input.
- Document Assumptions: Keep track of all assumptions for transparency.
- Leverage Technology: Use collaborative platforms to streamline data collection.
- Schedule Regular Check-Ins: Maintain momentum and address issues promptly.
- Train Participants: Ensure all team members understand budgeting principles.
By embedding cross-functional collaboration into the budgeting process, organizations can create more robust financial plans that drive better business outcomes.
2.4 Example: Building a Departmental Budget with Realistic Assumptions
Building a departmental budget is a critical step in the financial planning process. It ensures that each department has a clear financial roadmap aligned with the company’s overall objectives. This example will walk you through creating a realistic departmental budget using practical assumptions and illustrate how to integrate best practices.
Step 1: Define the Budget Scope and Objectives
Before diving into numbers, clarify the purpose of the budget. For example, the Marketing Department aims to increase brand awareness and lead generation by 20% over the next fiscal year.
Key Questions:
- What are the department’s goals?
- What activities or projects will require funding?
- What constraints or limitations exist?
Step 2: Gather Historical Data and Analyze Trends
Review past budgets and actual expenditures to understand spending patterns.
Example:
- Last year, the Marketing Department spent $500,000.
- Major expenses included digital advertising (40%), events (30%), and content creation (20%).
Step 3: Identify Key Assumptions
Realistic assumptions are the foundation of a credible budget. These assumptions should be data-driven and validated with stakeholders.
Common Assumptions for Marketing Budget:
- Digital ad costs will increase by 5% due to market inflation.
- Planned events will increase from 3 to 4, with an average cost of $30,000 each.
- Content creation will require additional freelance support, increasing costs by 10%.
Step 4: Build the Budget Components
Break down the budget into categories with estimated costs based on assumptions.
Mind Map: Departmental Budget Components
Step 5: Validate and Adjust the Budget
Compare the total budget with the department’s financial targets and company guidelines.
Example:
- Total Budget = $210,000 + $120,000 + $110,000 + $10,000 = $450,000
- This is $50,000 less than last year’s spend, reflecting efficiency improvements.
If the budget exceeds limits, revisit assumptions or identify cost-saving opportunities.
Step 6: Document Assumptions and Rationale
Transparency is key for stakeholder buy-in.
Mind Map: Documenting Budget Assumptions
Step 7: Present the Budget
Use clear visuals and summaries to communicate the budget to stakeholders.
Example Table:
| Category | Previous Year Spend | Assumption | Budgeted Amount |
|---|---|---|---|
| Digital Advertising | $200,000 | +5% inflation | $210,000 |
| Events | $150,000 | Increase from 3 to 4 events | $120,000 |
| Content Creation | $100,000 | +10% freelance support | $110,000 |
| Miscellaneous | $50,000 | Cost-saving measures applied | $10,000 |
| Total | $500,000 | $450,000 |
Summary
Building a departmental budget with realistic assumptions involves:
- Setting clear objectives
- Leveraging historical data
- Making data-driven assumptions
- Breaking down costs into manageable components
- Validating and adjusting the budget
- Documenting assumptions for transparency
- Presenting the budget clearly
This approach not only improves accuracy but also fosters collaboration and accountability across the organization.
2.5 Common Budgeting Pitfalls and How to Avoid Them
Budgeting is a critical component of financial planning and analysis, but it is fraught with challenges that can undermine its effectiveness. Understanding common pitfalls and proactively addressing them can significantly improve the accuracy and usefulness of your budgets.
Common Budgeting Pitfalls
Unrealistic Assumptions
Problem: Budgets based on overly optimistic revenue forecasts or underestimated expenses often lead to shortfalls.
How to Avoid:
- Use historical data as a baseline.
- Incorporate conservative estimates and contingency buffers.
- Validate assumptions with cross-functional teams.
Example: A retail company projected a 20% sales increase without considering market saturation. By revisiting past sales trends and competitor analysis, they adjusted the forecast to a more realistic 8%, preventing over-allocation of resources.
Lack of Stakeholder Involvement
Problem: When budgeting is done in isolation by finance teams, it may miss critical insights from operational departments.
How to Avoid:
- Engage department heads early in the budgeting process.
- Facilitate workshops to gather input and align expectations.
Example: An IT department was allocated insufficient budget because finance was unaware of upcoming software license renewals. Including IT managers in the budgeting discussions ensured all costs were captured.
Inflexible Budgets
Problem: Static budgets that do not adapt to changing business conditions can quickly become obsolete.
How to Avoid:
- Implement rolling budgets or quarterly revisions.
- Use scenario planning to prepare for different outcomes.
Example: A manufacturing firm adopted a rolling budget updated every quarter, allowing them to respond quickly to raw material price fluctuations and adjust production costs accordingly.
Insufficient Data Analysis
Problem: Relying on outdated or incomplete data leads to inaccurate budgets.
How to Avoid:
- Regularly update data sources.
- Analyze historical trends and seasonality.
- Use data visualization tools to identify patterns.
Example: A service company initially budgeted without considering seasonal demand spikes. After analyzing two years of monthly revenue data, they adjusted staffing budgets to better match peak periods.
Over-Complexity
Problem: Budgets with too many line items can be difficult to track and manage.
How to Avoid:
- Simplify budget categories.
- Focus on key cost drivers.
- Use templates and standardized formats.
Example: A nonprofit organization reduced its budget line items from 150 to 50 by grouping similar expenses, improving clarity and ease of monitoring.
Lack of Monitoring and Follow-up
Problem: Without regular variance analysis, organizations miss opportunities to correct course.
How to Avoid:
- Establish monthly or quarterly budget reviews.
- Use dashboards to track key metrics.
- Adjust budgets dynamically based on performance.
Example: A logistics company implemented monthly variance reports comparing actuals to budget, enabling managers to identify overspending early and implement corrective actions.
Summary Mind Map
By recognizing these common pitfalls and applying the suggested best practices, accountants and financial analysts can create more reliable, actionable budgets that support strategic decision-making and drive organizational success.
3. Forecasting Techniques and Methodologies
3.1 Qualitative vs Quantitative Forecasting Methods
Financial forecasting is a critical component of Financial Planning and Analysis (FP&A), enabling organizations to anticipate future financial outcomes and make informed decisions. Forecasting methods generally fall into two broad categories: qualitative and quantitative. Understanding the differences, strengths, and appropriate applications of each method is essential for accountants and financial analysts.
Qualitative Forecasting Methods
Qualitative forecasting relies on expert judgment, intuition, and subjective inputs rather than numerical data. It is particularly useful when historical data is limited, unavailable, or when forecasting new products or markets.
Key Characteristics:
- Based on opinions, experience, and insights.
- Useful in uncertain or rapidly changing environments.
- Often used for long-term forecasting or strategic planning.
Common Techniques:
- Delphi Method: A panel of experts answers questionnaires in multiple rounds to reach a consensus forecast.
- Market Research: Surveys and focus groups to gauge customer preferences and demand.
- Executive Opinion: Senior management provides forecasts based on their knowledge.
- Scenario Writing: Developing narratives about possible future events.
Example: A company launching a new tech gadget with no historical sales data might use the Delphi Method, gathering input from industry experts to estimate demand.
Quantitative Forecasting Methods
Quantitative forecasting uses historical numerical data and statistical techniques to predict future outcomes. It is data-driven and often more objective.
Key Characteristics:
- Relies on past data trends and patterns.
- Suitable for short- to medium-term forecasting.
- Can be automated and integrated into financial models.
Common Techniques:
- Time Series Analysis: Using historical data points to identify trends, seasonality, and cycles.
- Moving Averages: Smoothing out fluctuations to identify trends.
- Exponential Smoothing: Giving more weight to recent observations.
- Regression Analysis: Examining relationships between variables to forecast.
Example: A retail company analyzing three years of monthly sales data applies exponential smoothing to forecast next quarter’s sales.
Mind Map: Overview of Forecasting Methods
Integrating Both Methods
Best practice in FP&A often involves combining qualitative and quantitative methods to leverage the strengths of both. For example, quantitative models can provide baseline forecasts, while qualitative insights can adjust forecasts to reflect market disruptions or strategic initiatives.
Example: A financial analyst uses regression analysis to forecast sales but adjusts the forecast based on qualitative feedback from the sales team about upcoming promotions.
Mind Map: Combining Forecasting Approaches
Summary Table: Qualitative vs Quantitative Forecasting
| Aspect | Qualitative Forecasting | Quantitative Forecasting |
|---|---|---|
| Data Requirement | Minimal or none (expert judgment) | Historical numerical data |
| Approach | Subjective, opinion-based | Objective, data-driven |
| Best Use Case | New products, uncertain environments | Stable environments with historical data |
| Time Horizon | Long-term | Short- to medium-term |
| Examples | Delphi Method, Executive Opinion | Moving Averages, Regression Analysis |
By understanding and applying both qualitative and quantitative forecasting methods, accountants and financial analysts can enhance the accuracy and relevance of their financial forecasts, ultimately supporting better strategic and operational decisions.
3.2 Best Practice: Using Historical Data to Improve Forecast Accuracy
Accurate forecasting is a cornerstone of effective Financial Planning and Analysis (FP&A). One of the most reliable ways to enhance forecast accuracy is by leveraging historical data. Historical data provides a factual basis to identify trends, seasonality, and patterns that can inform future projections.
Why Use Historical Data?
- Trend Identification: Recognize upward or downward movements over time.
- Seasonality Detection: Understand recurring fluctuations during specific periods.
- Anomaly Recognition: Spot outliers or irregular events that may skew forecasts.
- Data-Driven Decisions: Replace assumptions with evidence-based insights.
Mind Map: Leveraging Historical Data for Forecasting
Step-by-Step Approach to Using Historical Data
- Gather Relevant Data: Collect at least 2-3 years of historical financial and operational data.
- Clean the Data: Identify and adjust for anomalies such as extraordinary expenses or revenue spikes.
- Analyze Patterns: Use statistical tools to detect trends and seasonality.
- Select Appropriate Forecasting Models: Choose models that best fit the data characteristics.
- Generate Forecasts: Apply the models to predict future performance.
- Validate and Refine: Compare forecasts with actual results and adjust models accordingly.
Example: Improving Sales Forecast Accuracy Using Historical Data
Scenario: A retail company wants to forecast sales for the upcoming year.
- Step 1: Collect monthly sales data for the past 3 years.
- Step 2: Clean data by removing months affected by store renovations (one-time events).
- Step 3: Analyze data and identify a strong seasonal pattern with peaks during November and December.
- Step 4: Apply a moving average model combined with seasonal indices to capture both trend and seasonality.
- Step 5: Generate monthly sales forecasts for the next year.
- Step 6: After the first quarter, compare actual sales with forecasts and adjust seasonal indices if necessary.
This approach helps the company anticipate demand spikes and optimize inventory management.
Mind Map: Example Workflow for Sales Forecasting
Additional Tips
- Incorporate External Data: Combine historical internal data with market trends and economic indicators for richer forecasts.
- Use Rolling Forecasts: Update forecasts regularly with the latest data to improve accuracy.
- Visualize Data: Use charts and dashboards to spot trends and anomalies easily.
- Document Assumptions: Keep track of any adjustments made to historical data for transparency.
By systematically using historical data, FP&A professionals can significantly improve the reliability of their forecasts, enabling better strategic decision-making and resource allocation.
3.3 Example: Implementing a Sales Forecast Using Moving Averages
Sales forecasting is a critical component of Financial Planning and Analysis (FP&A), enabling organizations to predict future revenue and make informed decisions. One of the simplest yet effective quantitative methods is the Moving Average technique. This example will walk through how to implement a sales forecast using moving averages, complete with explanations, step-by-step calculations, and visual mind maps to clarify the process.
What is a Moving Average?
A moving average smooths out short-term fluctuations and highlights longer-term trends or cycles in data. It calculates the average of sales over a specific number of past periods and uses this average as the forecast for the next period.
Why Use Moving Averages?
- Easy to understand and implement
- Reduces noise from random sales fluctuations
- Useful for stable sales patterns without strong seasonality
Step-by-Step Example
Suppose a company has the following monthly sales data (in units) for the past 6 months:
| Month | Sales |
|---|---|
| Jan | 120 |
| Feb | 135 |
| Mar | 150 |
| Apr | 160 |
| May | 155 |
| Jun | 165 |
We want to forecast sales for July using a 3-month moving average.
Step 1: Choose the period for the moving average
- Here, we select 3 months.
Step 2: Calculate the moving average for each month starting from the 3rd month
- Mar forecast = average of Jan, Feb, Mar = (120 + 135 + 150) / 3 = 135
- Apr forecast = average of Feb, Mar, Apr = (135 + 150 + 160) / 3 = 148.33
- May forecast = average of Mar, Apr, May = (150 + 160 + 155) / 3 = 155
- Jun forecast = average of Apr, May, Jun = (160 + 155 + 165) / 3 = 160
Step 3: Forecast July sales
- July forecast = average of May, Jun, and July (unknown) → since July sales are unknown, we use the last 3 known months: Apr, May, Jun
- July forecast = (160 + 155 + 165) / 3 = 160
Visual Mind Map: Moving Average Sales Forecast Process
Example Calculation Table
| Month | Sales | 3-Month Moving Average Forecast |
|---|---|---|
| Jan | 120 | - |
| Feb | 135 | - |
| Mar | 150 | 135.00 |
| Apr | 160 | 148.33 |
| May | 155 | 155.00 |
| Jun | 165 | 160.00 |
| Jul | ? | 160.00 (Forecast) |
Best Practices When Using Moving Averages
- Select appropriate period length: Shorter periods respond faster to changes but are more volatile; longer periods smooth data more but may lag.
- Check for seasonality: Moving averages work best for non-seasonal data. For seasonal data, consider seasonal adjustment or other methods.
- Combine with other methods: Use moving averages alongside qualitative insights or other forecasting techniques for better accuracy.
Additional Mind Map: Considerations for Moving Average Forecasting
Summary
Implementing a sales forecast using moving averages is a straightforward, practical approach for accountants and financial analysts to predict near-term sales based on historical data. By smoothing out fluctuations, it provides a clearer picture of trends, helping organizations plan budgets, manage inventory, and allocate resources effectively.
This example demonstrated the calculation of a 3-month moving average forecast, supported by mind maps to visualize the process and considerations. Integrating these best practices ensures that moving averages serve as a valuable tool within the broader FP&A toolkit.
3.4 Scenario Planning and Sensitivity Analysis in Forecasting
Financial forecasting is inherently uncertain due to the dynamic nature of business environments. To better prepare for this uncertainty, two critical techniques are widely used in FP&A: Scenario Planning and Sensitivity Analysis. These methods help financial analysts and accountants understand potential outcomes and the impact of key variables on financial performance.
What is Scenario Planning?
Scenario Planning involves creating multiple plausible future states (scenarios) based on different assumptions about external and internal factors. It allows organizations to anticipate risks and opportunities by evaluating how different conditions could affect financial results.
Mind Map: Scenario Planning Components
Example: Retail Company Sales Forecast
A retail company forecasts sales for the next year. They develop three scenarios:
- Base Case: Sales grow by 5% based on historical trends.
- Best Case: Sales grow by 10% due to a new product launch and favorable market conditions.
- Worst Case: Sales decline by 3% due to increased competition and supply chain disruptions.
By comparing these scenarios, the company can plan inventory, staffing, and marketing budgets accordingly.
What is Sensitivity Analysis?
Sensitivity Analysis examines how changes in one or more input variables affect the output of a financial model. It helps identify which variables have the most influence on outcomes, enabling prioritization of focus areas.
Mind Map: Sensitivity Analysis Process
Example: Manufacturing Cost Sensitivity
A manufacturing firm wants to understand how changes in raw material costs affect profitability. They analyze:
- Raw material cost increases by 5%, 10%, and 15%.
- Corresponding impact on gross margin and net income.
Results show that a 10% increase in raw material costs reduces net income by 7%, highlighting the importance of supplier negotiations.
Integrating Scenario Planning and Sensitivity Analysis
Combining both techniques provides a robust framework for forecasting:
- Use Scenario Planning to outline broad possible futures.
- Apply Sensitivity Analysis within each scenario to test key assumptions.
Mind Map: Integrated Approach
Example: Tech Startup Revenue Forecast
A tech startup forecasts revenue under three scenarios:
- Base Case: Moderate user growth.
- Optimistic Case: Rapid user adoption.
- Pessimistic Case: Slow growth due to competition.
Within each scenario, sensitivity analysis is performed on:
- User acquisition cost
- Average revenue per user (ARPU)
This combined approach helps the startup prioritize marketing spend and product development.
Best Practices for Scenario Planning and Sensitivity Analysis
- Select Relevant Variables: Focus on drivers with the highest impact.
- Use Realistic Assumptions: Base scenarios on credible data.
- Visualize Results: Use charts and diagrams to communicate findings.
- Update Regularly: Revise scenarios as market conditions change.
- Collaborate Cross-Functionally: Involve stakeholders from sales, operations, and strategy.
By mastering scenario planning and sensitivity analysis, financial analysts and accountants can enhance the accuracy and resilience of their forecasts, ultimately supporting better strategic decisions.
3.5 Integrating Market Trends and External Factors into Forecasts
Financial forecasting is not just about analyzing internal data; it requires a comprehensive understanding of the external environment in which a business operates. Integrating market trends and external factors into forecasts enhances accuracy and provides a realistic view of future performance.
Why Integrate Market Trends and External Factors?
- Improves Forecast Accuracy: External factors often influence sales, costs, and overall business performance.
- Identifies Opportunities and Risks: Understanding market dynamics helps anticipate changes.
- Supports Strategic Decision-Making: Aligns forecasts with real-world conditions.
Key External Factors to Consider
- Economic Indicators: GDP growth, inflation rates, unemployment levels.
- Industry Trends: Market growth rates, technological advancements, regulatory changes.
- Competitive Landscape: New entrants, competitor strategies, pricing pressures.
- Consumer Behavior: Shifts in preferences, demographic changes.
- Geopolitical Events: Trade policies, political stability.
Mind Map: Integrating Market Trends and External Factors into Forecasts
Best Practice: Systematic Incorporation of External Data
- Identify Relevant External Factors: Tailor to your industry and business model.
- Source Reliable Data: Use government reports, industry publications, market research firms.
- Quantify Impact: Translate qualitative trends into quantitative adjustments.
- Scenario Analysis: Model best-case, worst-case, and base-case scenarios.
- Regular Updates: Continuously monitor and update forecasts as new data emerges.
Example: Forecasting Sales for a Consumer Electronics Company
Context: A company launching a new smartphone model wants to forecast sales for the next 12 months.
Step 1: Analyze Market Trends
- Industry reports show a 5% annual growth in smartphone sales.
- Emerging markets are growing faster than mature markets.
Step 2: Consider External Factors
- Economic slowdown predicted in key markets (GDP forecast reduced by 1%).
- Competitor just launched a similar product with aggressive pricing.
- Consumer preference shifting towards eco-friendly products.
Step 3: Quantify Adjustments
- Reduce base sales forecast by 3% to account for economic slowdown.
- Adjust pricing strategy to remain competitive.
- Increase marketing budget to highlight eco-friendly features.
Step 4: Scenario Planning
- Base Case: Incorporate all adjustments.
- Optimistic Case: Economic slowdown less severe, competitor pricing less aggressive.
- Pessimistic Case: Economic downturn worsens, competitor gains market share.
Step 5: Final Forecast
- Present forecast ranges to management with clear assumptions.
Mind Map: Example - Sales Forecasting with External Factors
Tips for Accountants and Financial Analysts
- Collaborate closely with marketing and sales teams to gather insights.
- Use data visualization tools to track external trends alongside internal metrics.
- Document assumptions clearly to maintain transparency.
- Continuously refine forecasting models based on actual outcomes versus forecasts.
Integrating market trends and external factors into financial forecasts is essential for creating robust, actionable plans. By systematically analyzing and quantifying these elements, financial professionals can provide valuable insights that drive smarter business decisions.
4. Financial Modeling for Decision Support
4.1 Fundamentals of Financial Modeling: Structure and Components
Financial modeling is a critical skill for accountants and financial analysts, enabling them to create a quantitative representation of a company’s financial performance. A well-structured financial model helps in decision-making, forecasting, budgeting, and valuation.
What is Financial Modeling?
Financial modeling involves building an abstract model that represents the financial performance of a business, project, or investment. It typically uses Excel or specialized software to simulate financial scenarios.
Core Structure of a Financial Model
A robust financial model generally consists of the following key components:
- Input Sheet: Where assumptions and variables are entered.
- Calculation Sheet(s): Where the core computations and logic take place.
- Output Sheet: Where results, summaries, and visualizations are presented.
Mind Map: Structure of a Financial Model
Detailed Components Explained
-
Inputs
- These are the assumptions driving the model.
- Examples include sales growth rates, cost inflation, tax rates, and interest rates.
- Best practice: Keep inputs centralized for easy updates and scenario testing.
-
Calculations
- This section applies formulas and logic to inputs to generate financial projections.
- Includes revenue calculations, cost breakdowns, working capital changes, and financing costs.
- Example: Calculating revenue as
Units Sold * Price per Unit.
-
Outputs
- Summarizes the financial statements and key metrics.
- Often includes charts and dashboards for quick interpretation.
- Example: A summarized income statement showing projected net income over 5 years.
Example: Simple Revenue Projection Model
| Year | Units Sold | Price per Unit | Revenue (Units Sold * Price) |
|---|---|---|---|
| 2024 | 10,000 | $50 | $500,000 |
| 2025 | 12,000 | $52 | $624,000 |
| 2026 | 14,000 | $54 | $756,000 |
- Input: Units sold and price per unit
- Calculation: Revenue = Units Sold * Price per Unit
- Output: Revenue figures used in further financial statements
Mind Map: Components of a Financial Model Calculation Sheet
Best Practices for Building Financial Models
- Clarity and Simplicity: Use clear labels, consistent formatting, and avoid unnecessary complexity.
- Modularity: Separate inputs, calculations, and outputs into distinct sheets or sections.
- Documentation: Add comments and notes to explain assumptions and formulas.
- Flexibility: Design models to easily accommodate changes and scenario analysis.
- Error Checking: Incorporate checks and balances to identify inconsistencies.
Example: Transparent Model Design
Imagine a financial analyst building a model for a new product launch. They create an Input Sheet where marketing provides sales volume estimates and finance provides cost assumptions. The Calculation Sheet uses these inputs to estimate revenues, costs, and cash flows. The Output Sheet then summarizes profitability and break-even points, allowing management to make informed decisions.
By mastering the fundamentals of financial modeling structure and components, accountants and financial analysts can deliver insightful, reliable, and actionable financial forecasts that support strategic business decisions.
4.2 Best Practice: Building Transparent and Flexible Models
Building transparent and flexible financial models is a cornerstone of effective Financial Planning and Analysis (FP&A). Transparent models ensure that all stakeholders can understand the assumptions, calculations, and outputs, while flexibility allows the model to adapt to changing business conditions and scenarios.
Why Transparency Matters
- Clarity for Stakeholders: Transparent models help accountants, financial analysts, and executives understand how figures are derived, increasing trust and facilitating better decision-making.
- Error Detection: When models are clear and well-documented, errors are easier to spot and correct.
- Collaboration: Transparency encourages collaboration across departments, as assumptions and methodologies are visible.
Why Flexibility is Essential
- Scenario Analysis: Flexible models allow quick adjustments to inputs for “what-if” scenarios.
- Scalability: As the business grows or changes, flexible models can be expanded or modified without rebuilding from scratch.
- Efficiency: Reduces time spent on rework and enables faster response to market changes.
Key Principles for Building Transparent and Flexible Models
Practical Steps to Build Transparent and Flexible Models
-
Use a Modular Layout:
- Separate inputs, calculations, and outputs into distinct worksheets or clearly defined sections.
- Example: Have an “Assumptions” tab where all key drivers like growth rates, cost percentages, and tax rates are entered.
-
Document Assumptions Clearly:
- Use cell comments or a dedicated assumptions sheet to explain the rationale behind each input.
- Example: Next to the revenue growth rate input, add a note: “Based on historical CAGR and market research Q1 2024.”
-
Employ Named Ranges:
- Instead of cell references like A1 or B2, use descriptive names like “Revenue_Growth_Rate” to improve formula readability.
-
Minimize Hardcoding:
- Avoid embedding numbers directly into formulas; reference input cells instead.
- Example: Instead of =B21.05, use =B2(1+Revenue_Growth_Rate).
-
Build in Scenario Analysis:
- Create separate tabs or input sections for different scenarios (e.g., Base, Optimistic, Pessimistic).
- Use dropdowns or data validation to switch between scenarios dynamically.
-
Incorporate Error Checks and Validation:
- Use conditional formatting or formulas to flag unusual or inconsistent values.
- Example: Highlight negative cash flow values in red.
-
Use Consistent Formatting and Naming Conventions:
- Consistent colors for inputs (e.g., blue), calculations (black), and outputs (green) help users navigate the model.
Example: Building a Transparent and Flexible Cash Flow Projection Model
Scenario: A financial analyst is tasked with creating a 12-month cash flow projection for a corporate client.
Step 1: Setup Inputs Tab
- Revenue growth rate, payment terms, operating expenses, capital expenditures, financing assumptions.
- Document each assumption with notes.
Step 2: Calculations Tab
- Use named ranges like
Revenue_Growth,Op_Expenses_Percentage. - Calculate monthly revenues by applying growth rates to prior months.
Step 3: Outputs Tab
- Summarize monthly cash inflows, outflows, and net cash position.
- Include charts for visual representation.
Step 4: Scenario Analysis
- Create dropdown to select scenarios: Base, Best Case, Worst Case.
- Link input assumptions to scenario selection.
Step 5: Validation
- Add conditional formatting to flag negative cash balances.
- Include a summary of key metrics with traffic light indicators.
Mind Map: Example Cash Flow Model Structure
Additional Tips
- Version Control: Keep track of model versions with dates and change logs.
- User Guide: Provide a brief guide or legend within the model to help new users understand structure and usage.
- Regular Reviews: Periodically review and update assumptions and model structure to maintain relevance.
By adhering to these best practices, FP&A professionals can create financial models that not only provide accurate insights but also foster confidence and agility across the organization.
4.3 Example: Creating a Cash Flow Projection Model for a New Project
Creating a cash flow projection model is a critical step in financial planning and analysis, especially when evaluating the viability of a new project. This example will guide you through building a simple yet effective cash flow projection model, highlighting best practices and providing mind maps to visualize the process.
Step 1: Define the Project Scope and Timeline
Before building the model, clearly define the project’s scope, duration, and key milestones. This helps in identifying the timing of cash inflows and outflows.
Example: A company plans to launch a new product with a 12-month development and launch phase.
Step 2: Identify Cash Inflows
Cash inflows typically include sales revenue, financing, and any other income related to the project.
- Sales Revenue: Estimate monthly sales based on market research.
- Financing: Include any loans or equity injections.
Example: Projected monthly sales start at $50,000 in month 7 and grow by 10% monthly.
Step 3: Identify Cash Outflows
Cash outflows include all expenses such as:
- Capital expenditures (CapEx)
- Operating expenses (OpEx)
- Marketing and sales costs
- Salaries
- Taxes
Example: Initial CapEx of $200,000 in month 1 for equipment; monthly operating expenses of $20,000 starting month 1.
Step 4: Build the Cash Flow Projection Table
Create a month-by-month table showing:
- Opening cash balance
- Cash inflows
- Cash outflows
- Net cash flow (inflows - outflows)
- Closing cash balance (opening balance + net cash flow)
Mind Map: Cash Flow Projection Model Structure
Step 5: Populate the Model with Data
| Month | Opening Balance | Cash Inflows | Cash Outflows | Net Cash Flow | Closing Balance |
|---|---|---|---|---|---|
| 1 | $0 | $0 | $220,000 | -$220,000 | -$220,000 |
| 2 | -$220,000 | $0 | $20,000 | -$20,000 | -$240,000 |
| 3 | -$240,000 | $0 | $20,000 | -$20,000 | -$260,000 |
| 4 | -$260,000 | $0 | $20,000 | -$20,000 | -$280,000 |
| 5 | -$280,000 | $0 | $20,000 | -$20,000 | -$300,000 |
| 6 | -$300,000 | $0 | $20,000 | -$20,000 | -$320,000 |
| 7 | -$320,000 | $50,000 | $20,000 | $30,000 | -$290,000 |
| 8 | -$290,000 | $55,000 | $20,000 | $35,000 | -$255,000 |
| 9 | -$255,000 | $60,500 | $20,000 | $40,500 | -$214,500 |
| 10 | -$214,500 | $66,550 | $20,000 | $46,550 | -$167,950 |
| 11 | -$167,950 | $73,205 | $20,000 | $53,205 | -$114,745 |
| 12 | -$114,745 | $80,525 | $20,000 | $60,525 | -$54,220 |
Step 6: Analyze the Results
- The project starts with a significant negative cash balance due to upfront CapEx.
- Positive net cash flow begins in month 7 as sales start.
- The closing balance remains negative at month 12, indicating the need for additional financing or cost optimization.
Mind Map: Analysis and Decision Points
Best Practice Tips:
- Use conservative estimates for sales and optimistic estimates for expenses to avoid cash shortfalls.
- Regularly update the model with actual data to improve accuracy.
- Incorporate scenario analysis to understand the impact of different sales growth rates or cost changes.
Additional Example: Scenario Analysis
If sales grow only 5% monthly instead of 10%, the cash inflows and closing balances will be lower, potentially extending the negative cash position.
| Month | Cash Inflows (5% growth) | Closing Balance |
|---|---|---|
| 7 | $50,000 | -$290,000 |
| 8 | $52,500 | -$257,500 |
| 9 | $55,125 | -$222,375 |
| 10 | $57,881 | -$183,494 |
| 11 | $60,775 | -$139,719 |
| 12 | $63,814 | -$90,905 |
This highlights the importance of sensitivity testing.
By following this structured approach, accountants and financial analysts can create robust cash flow projection models that support informed decision-making for new projects.
4.4 Using Models to Evaluate Investment Opportunities
Evaluating investment opportunities is a critical function of Financial Planning and Analysis (FP&A) professionals. Financial models provide a structured and quantitative framework to assess the potential returns, risks, and strategic fit of investments. This section explores how to effectively use financial models to evaluate investment opportunities, supported by practical examples and mind maps to visualize the process.
Understanding Investment Evaluation Models
Investment evaluation models typically focus on projecting cash flows, assessing profitability, and measuring risk. Common approaches include:
- Discounted Cash Flow (DCF) Analysis
- Net Present Value (NPV)
- Internal Rate of Return (IRR)
- Payback Period
- Profitability Index (PI)
Each model helps answer different questions about the viability and attractiveness of an investment.
Mind Map: Key Components of Investment Evaluation Models
Step-by-Step Example: Evaluating a New Product Launch
Scenario: A company is considering launching a new product. The initial investment is $2 million, with expected annual cash inflows of $600,000 for 5 years. The company’s discount rate is 10%.
Step 1: Project Cash Flows
| Year | Cash Flow ($) |
|---|---|
| 0 | -2,000,000 |
| 1 | 600,000 |
| 2 | 600,000 |
| 3 | 600,000 |
| 4 | 600,000 |
| 5 | 600,000 |
Step 2: Calculate NPV
Using the formula:
\[ NPV = \sum_{t=0}^{n} \frac{CF_t}{(1 + r)^t} \]
Where:
- \(CF_t\) = cash flow at time t
- \(r\) = discount rate (10%)
Calculations:
- Year 0: -2,000,000 / (1 + 0.10)^0 = -2,000,000
- Year 1: 600,000 / (1 + 0.10)^1 = 545,455
- Year 2: 600,000 / (1 + 0.10)^2 = 495,868
- Year 3: 600,000 / (1 + 0.10)^3 = 450,789
- Year 4: 600,000 / (1 + 0.10)^4 = 410,717
- Year 5: 600,000 / (1 + 0.10)^5 = 373,379
Total NPV = -2,000,000 + 545,455 + 495,868 + 450,789 + 410,717 + 373,379 = $275,208
Since NPV is positive, the investment is financially viable.
Step 3: Calculate IRR
The IRR is the discount rate that makes the NPV zero. Using financial software or Excel’s IRR function, the IRR is approximately 14.5%, which exceeds the company’s required rate of 10%, reinforcing the investment’s attractiveness.
Step 4: Payback Period
The payback period is the time to recover the initial investment:
- Year 1: $600,000 recovered
- Year 2: $1,200,000 recovered
- Year 3: $1,800,000 recovered
- Year 4: $2,400,000 recovered
Payback occurs between Year 3 and Year 4 (approximately 3.33 years).
Mind Map: Investment Evaluation Workflow
Best Practice: Incorporate Sensitivity and Scenario Analysis
Financial models should not rely on single-point estimates. Sensitivity analysis tests how changes in key assumptions (e.g., sales volume, costs, discount rate) affect outcomes.
Example: If annual cash inflows drop to $500,000, the NPV calculation changes:
- Year 1: 500,000 / 1.10 = 454,545
- Year 2: 500,000 / 1.21 = 413,223
- Year 3: 500,000 / 1.331 = 375,657
- Year 4: 500,000 / 1.4641 = 341,506
- Year 5: 500,000 / 1.6105 = 310,462
Total NPV = -2,000,000 + 454,545 + 413,223 + 375,657 + 341,506 + 310,462 = -$104,607 (negative)
This indicates the investment is not viable under this scenario.
Scenario analysis extends this by combining multiple variables to simulate best, base, and worst cases.
Example: Using Financial Models to Compare Two Investment Projects
| Metric | Project A | Project B |
|---|---|---|
| Initial Cost | $3,000,000 | $2,500,000 |
| NPV | $400,000 | $350,000 |
| IRR | 12% | 15% |
| Payback Period | 4 years | 3.5 years |
Decision: Although Project A has a higher NPV, Project B has a higher IRR and shorter payback period. The choice depends on the company’s strategic priorities (e.g., maximizing value vs. quicker returns).
Summary
Using financial models to evaluate investment opportunities enables FP&A professionals to:
- Quantify potential returns and risks
- Compare alternative projects objectively
- Support strategic decision-making with data-driven insights
- Communicate findings clearly to stakeholders
By integrating best practices such as sensitivity and scenario analysis, models become robust tools that improve the quality and reliability of investment evaluations.
4.5 Common Errors in Financial Modeling and How to Correct Them
Financial modeling is a critical skill for accountants and financial analysts, but even experienced professionals can make mistakes that compromise the accuracy and usefulness of their models. Understanding common errors and how to correct them ensures models are reliable decision-making tools.
Common Errors in Financial Modeling
Incorrect or Outdated Data
Issue: Using stale or inaccurate input data can lead to misleading results.
Correction: Always verify data sources and update inputs regularly. Use dynamic links to source data where possible.
Example: A sales forecast model using last year’s sales figures without adjusting for recent market changes will produce inaccurate projections.
Hardcoding Values in Formulas
Issue: Embedding fixed numbers directly into formulas makes updates difficult and error-prone.
Correction: Separate inputs from calculations. Place all assumptions and constants in clearly labeled input sections.
Example: Instead of writing =A1*0.05 directly, place 0.05 in an input cell named “Tax Rate” and reference it as =A1*Tax_Rate.
Broken or Inconsistent Formulas
Issue: Copy-pasting formulas without adjusting references or accidentally deleting parts can break calculations.
Correction: Use absolute and relative references appropriately. Regularly audit formulas using spreadsheet tools.
Example: A cash flow model where a formula references the wrong row due to improper dragging will distort the cash flow projections.
Circular References
Issue: Formulas that refer back to their own cell create circular references, causing errors or iterative calculations.
Correction: Identify and remove circular dependencies or enable iterative calculation with caution and clear documentation.
Example: A balance sheet model where retained earnings depend on net income, which in turn depends on retained earnings, can cause circularity.
Poor Model Layout and Lack of Modularity
Issue: Models that are cluttered or lack clear separation between inputs, calculations, and outputs are hard to understand and maintain.
Correction: Organize models into distinct sheets or sections: Inputs, Calculations, Outputs. Use consistent formatting and clear labels.
Example: A model mixing raw data, assumptions, and output charts on the same sheet can confuse users and increase error risk.
Unrealistic Assumptions
Issue: Overly optimistic or pessimistic assumptions can skew results.
Correction: Base assumptions on historical data, market research, and expert input. Document assumptions clearly.
Example: Assuming a 50% annual growth rate without market justification can mislead stakeholders.
Lack of Sensitivity Analysis
Issue: Not testing how changes in key assumptions affect outcomes limits understanding of model risks.
Correction: Incorporate sensitivity or scenario analysis to evaluate impact of varying inputs.
Example: Showing how net income changes if sales growth varies between 5% and 15% helps decision-makers understand risk.
No Error Checks or Flags
Issue: Models without built-in checks can produce unnoticed errors.
Correction: Add error flags, such as checks for balance sheet balancing, negative cash balances, or input range validations.
Example: A flag that alerts if total assets do not equal total liabilities plus equity helps maintain model integrity.
Summary Mind Map
By proactively addressing these common errors, financial analysts and accountants can build robust, transparent, and reliable financial models that support sound business decisions.
5. Variance Analysis and Performance Measurement
5.1 Understanding Variance: Types and Causes
Variance analysis is a critical component of Financial Planning and Analysis (FP&A) that helps organizations understand the differences between planned financial outcomes and actual results. By identifying and analyzing variances, accountants and financial analysts can pinpoint areas of concern, uncover opportunities for improvement, and make informed decisions to steer the company toward its financial goals.
What is Variance?
Variance is the difference between a budgeted, planned, or standard amount and the actual amount incurred or realized. It can be either favorable (positive impact on profit or cash flow) or unfavorable (negative impact).
Types of Variance
Mind Map: Types of Variance
-
Cost Variance: Difference between the actual cost and the budgeted cost.
- Example: If the budgeted cost for raw materials was $50,000 but actual cost was $55,000, the cost variance is $5,000 unfavorable.
-
Revenue Variance: Difference between actual revenue and budgeted revenue.
- Example: Budgeted sales were $200,000 but actual sales were $180,000, resulting in a $20,000 unfavorable revenue variance.
-
Profit Variance: Difference between actual profit and budgeted profit.
- Example: If expected profit was $40,000 but actual profit was $35,000, the profit variance is $5,000 unfavorable.
-
Efficiency Variance: Measures how efficiently resources were used compared to the standard.
- Example: If labor hours budgeted were 1,000 hours but actual hours were 1,200, the efficiency variance indicates inefficiency.
-
Mix Variance: Occurs when the proportion of different products or inputs varies from the plan.
- Example: A company planned to sell 60% product A and 40% product B but actually sold 50% product A and 50% product B, affecting overall profitability.
-
Yield Variance: Difference between expected output and actual output from a given input.
- Example: Expected production was 10,000 units from 5,000 kg of raw material, but actual production was 9,000 units.
Causes of Variance
Mind Map: Causes of Variance
-
Internal Factors
- Inefficient Operations: Delays, machine breakdowns, or poor workforce productivity can increase costs.
- Poor Cost Control: Lack of monitoring or unauthorized spending leads to cost overruns.
- Inaccurate Budgeting: Overly optimistic or pessimistic assumptions cause variances.
- Labor Issues: Overtime, absenteeism, or skill gaps affect labor costs and efficiency.
-
External Factors
- Market Demand Fluctuations: Changes in customer demand can cause sales volume variances.
- Price Changes: Unexpected increases in raw material prices impact cost variances.
- Supply Chain Disruptions: Delays or shortages can increase costs or reduce output.
- Regulatory Changes: New taxes or compliance costs can create unexpected expenses.
Example: Analyzing Variance in a Manufacturing Company
Scenario:
- Budgeted direct material cost: $100,000
- Actual direct material cost: $110,000
- Budgeted production: 5,000 units
- Actual production: 4,800 units
Step 1: Calculate Cost Variance
- Cost Variance = Actual Cost - Budgeted Cost = $110,000 - $100,000 = $10,000 (Unfavorable)
Step 2: Analyze Causes
- Material price increased due to supplier price hike.
- Production was lower than planned, causing less efficient use of materials.
Step 3: Breakdown Variance
Mind Map: Material Cost Variance Breakdown
Step 4: Action Plan
- Negotiate better supplier contracts to control price.
- Investigate production inefficiencies to reduce waste.
Summary
Understanding variance types and their causes enables FP&A professionals to:
- Identify where financial performance deviates from plans.
- Diagnose root causes of variances.
- Develop targeted corrective actions.
- Improve future budgeting and forecasting accuracy.
By integrating variance analysis into regular financial reviews, organizations can enhance accountability and drive continuous improvement.
5.2 Best Practice: Regular Variance Analysis to Drive Accountability
Variance analysis is a critical component of Financial Planning and Analysis (FP&A) that helps organizations understand the differences between planned financial outcomes and actual results. Conducting regular variance analysis fosters accountability by identifying performance gaps, enabling timely corrective actions, and promoting transparency across departments.
Why Regular Variance Analysis Matters
- Early Detection of Issues: Frequent reviews help spot deviations early, preventing minor issues from escalating.
- Informed Decision-Making: Understanding variances provides insights into operational efficiency and financial health.
- Accountability: Departments and managers become responsible for their financial performance.
- Continuous Improvement: Identifies areas for process optimization and cost control.
Key Steps in Conducting Regular Variance Analysis
Example: Monthly Variance Analysis in a Manufacturing Company
Scenario: The production department budgeted $500,000 for raw materials in March but spent $575,000.
Step 1: Calculate Variance
- Variance = Actual - Budget = $575,000 - $500,000 = $75,000 (Unfavorable)
Step 2: Analyze Causes
- Price increase from suppliers
- Higher volume of production than planned
Step 3: Categorize Variance
- Price Variance: $30,000
- Volume Variance: $45,000
Step 4: Report and Accountability
- Production manager reviews supplier contracts and negotiates better prices.
- Sales team adjusts forecasts to reflect increased demand.
Step 5: Follow-up
- Next month’s variance analysis checks if corrective actions reduced the unfavorable variance.
Best Practices for Driving Accountability Through Variance Analysis
Example: Using Dashboards to Enhance Accountability
A financial analyst creates a dashboard that highlights budget vs actual variances by department. Each variance is color-coded (green for favorable, red for unfavorable) and linked to responsible managers. During monthly review meetings, managers explain significant variances and propose action plans. This transparency encourages proactive management and accountability.
Tips for Effective Variance Analysis
- Automate Data Collection: Use FP&A tools to reduce manual errors.
- Standardize Variance Definitions: Ensure consistency across departments.
- Focus on Material Variances: Prioritize significant deviations to optimize time.
- Encourage Open Communication: Foster a blame-free culture focused on improvement.
Regular variance analysis is not just a reporting exercise but a strategic tool that drives accountability, improves financial discipline, and supports better business outcomes.
5.3 Example: Analyzing Budget vs Actuals for Operational Efficiency
Analyzing Budget vs Actuals is a critical step in Financial Planning and Analysis (FP&A) that helps organizations identify variances, understand their causes, and take corrective actions to improve operational efficiency. This example will guide you through the process of conducting a variance analysis with practical insights and mind maps to visualize the workflow.
Understanding the Basics
- Budget: The planned or expected financial figures for a specific period.
- Actuals: The real financial outcomes recorded during that period.
- Variance: The difference between Budget and Actuals, which can be favorable or unfavorable.
Step 1: Collect Data
Gather the budgeted figures and actual financial results for the period under review. This typically includes revenues, costs, and expenses.
Step 2: Calculate Variances
\[ Variance = Actuals - Budget \]
- Favorable Variance: Actuals better than budget (e.g., higher revenue, lower costs).
- Unfavorable Variance: Actuals worse than budget.
Step 3: Categorize Variances
- Revenue Variances
- Cost of Goods Sold (COGS) Variances
- Operating Expense Variances
Step 4: Analyze Causes
Investigate the reasons behind significant variances. This could involve:
- Market conditions
- Operational inefficiencies
- Pricing changes
- Unexpected expenses
Step 5: Take Corrective Actions
Based on the analysis, implement strategies to improve efficiency, such as cost control measures or process improvements.
Mind Map: Budget vs Actuals Analysis Workflow
Practical Example: Retail Company Monthly Analysis
Scenario: A retail company budgeted $500,000 in sales revenue and $300,000 in operating expenses for the month of March. The actual sales revenue was $450,000, and operating expenses were $320,000.
| Category | Budget ($) | Actual ($) | Variance ($) | Variance Type |
|---|---|---|---|---|
| Sales Revenue | 500,000 | 450,000 | -50,000 | Unfavorable |
| Operating Expenses | 300,000 | 320,000 | +20,000 | Unfavorable |
Analysis:
- Sales revenue fell short by $50,000, possibly due to lower foot traffic or increased competition.
- Operating expenses exceeded the budget by $20,000, potentially from higher utility costs or overtime wages.
Action Plan:
- Investigate marketing effectiveness and consider promotions to boost sales.
- Review expense categories to identify controllable costs and reduce waste.
Mind Map: Retail Company Variance Analysis
Tips for Effective Budget vs Actuals Analysis
- Frequency: Conduct variance analysis monthly or quarterly to stay proactive.
- Materiality: Focus on significant variances that impact business performance.
- Collaboration: Engage department heads to gain insights into variances.
- Documentation: Keep detailed records of variance explanations for future reference.
By systematically analyzing budget vs actuals, financial analysts and accountants can help their organizations identify inefficiencies, optimize resource allocation, and support strategic decision-making to enhance operational efficiency.
5.4 Using KPIs and Dashboards for Performance Monitoring
Effective performance monitoring is a cornerstone of Financial Planning and Analysis (FP&A). Key Performance Indicators (KPIs) and dashboards provide accountants and financial analysts with real-time insights and a clear view of financial health, enabling timely decision-making and strategic adjustments.
What are KPIs?
KPIs are quantifiable measures that help organizations track progress toward their financial and operational goals. They translate complex data into understandable metrics that reflect performance.
Common Financial KPIs Include:
- Revenue Growth Rate: Measures the increase in revenue over a period.
- Gross Profit Margin: Indicates profitability after direct costs.
- Operating Expense Ratio: Shows operational efficiency.
- Cash Conversion Cycle: Reflects liquidity and cash flow efficiency.
- Return on Investment (ROI): Evaluates profitability of investments.
What are Dashboards?
Dashboards are visual tools that consolidate KPIs and other relevant data into an interactive, easy-to-read format. They allow quick assessment of performance trends and highlight areas needing attention.
Mind Map: KPIs and Dashboards Overview
Best Practices for Using KPIs and Dashboards
-
Align KPIs with Strategic Objectives
- Choose KPIs that directly reflect the company’s goals.
- Example: If cost control is a priority, focus on Operating Expense Ratio.
-
Keep KPIs Actionable and Relevant
- Avoid overwhelming users with too many KPIs.
- Example: A manufacturing firm might track Inventory Turnover but not marketing KPIs.
-
Use Real-Time Data for Timely Decisions
- Dashboards should update frequently to reflect current performance.
-
Customize Dashboards for Different Stakeholders
- Executives may need high-level summaries; analysts require detailed data.
-
Incorporate Visual Cues
- Use colors and icons to highlight performance status (e.g., green for on target, red for below expectations).
Example 1: Sales Performance Dashboard
Scenario: A financial analyst at a retail company monitors monthly sales performance.
- KPIs Tracked: Total Sales, Sales Growth %, Average Transaction Value, Sales by Region
- Dashboard Features: Line graph showing sales trends, bar chart comparing regions, gauge for sales target achievement.
Insight: The dashboard reveals that while total sales are growing overall, the Northeast region is underperforming, prompting a deeper dive into regional strategies.
Mind Map: Sales Performance Dashboard Components
Example 2: Expense Monitoring Using Dashboards
Scenario: An accountant tracks monthly operating expenses to control costs.
- KPIs Tracked: Operating Expense Ratio, Expense Variance, Departmental Expenses
- Dashboard Features: Heat map showing expense variance by department, trend lines for monthly expenses, alerts for budget overruns.
Insight: The heat map highlights the marketing department exceeding its budget, triggering a review of marketing spend.
Mind Map: Expense Monitoring Dashboard
Integrating KPIs and Dashboards into FP&A Workflow
- Step 1: Define Objectives — Establish what financial goals the KPIs will measure.
- Step 2: Select KPIs — Choose metrics that provide meaningful insights.
- Step 3: Design Dashboards — Build dashboards with appropriate visualizations.
- Step 4: Monitor Regularly — Review dashboards frequently to detect trends.
- Step 5: Take Action — Use insights to inform budgeting, forecasting, and strategic decisions.
Summary
Using KPIs and dashboards effectively empowers accountants and financial analysts to monitor performance with clarity and precision. By selecting relevant KPIs, designing intuitive dashboards, and embedding them into regular FP&A activities, organizations can enhance financial visibility, improve accountability, and drive better business outcomes.
5.5 Linking Variance Analysis to Continuous Improvement Initiatives
Variance analysis is a powerful tool not only for identifying deviations between planned and actual financial performance but also for driving continuous improvement within an organization. By systematically linking variance analysis outcomes to improvement initiatives, companies can enhance operational efficiency, optimize resource allocation, and foster a culture of accountability.
Understanding the Link Between Variance Analysis and Continuous Improvement
Variance analysis highlights areas where performance did not meet expectations, signaling opportunities for corrective action. Continuous improvement initiatives use these insights to implement process enhancements, cost-saving measures, or strategic adjustments.
Mind Map: Linking Variance Analysis to Continuous Improvement
Step-by-Step Process to Link Variance Analysis with Continuous Improvement
- Conduct Variance Analysis: Regularly compare actual results against budgets or forecasts to identify variances.
- Perform Root Cause Analysis: Investigate the underlying reasons for variances using tools like the 5 Whys or Fishbone diagrams.
- Prioritize Variances: Focus on significant variances that impact financial performance or strategic goals.
- Develop Improvement Plans: Design targeted initiatives to address root causes, such as process redesign or staff training.
- Implement Initiatives: Execute improvement actions with clear ownership and timelines.
- Monitor and Measure: Track the impact of initiatives on subsequent variances and overall performance.
- Establish Feedback Loops: Use ongoing variance analysis to refine and sustain improvements.
Example: Manufacturing Company Reduces Material Cost Variance
Scenario: A manufacturing firm notices a consistent unfavorable variance in material costs compared to budget.
- Variance Analysis: Actual material costs are 8% higher than budgeted.
- Root Cause Analysis: Investigation reveals supplier price increases and inefficient inventory management.
- Improvement Initiative: The company negotiates better contracts with suppliers and implements a just-in-time inventory system.
- Outcome: Material cost variance reduces to 2% unfavorable within the next quarter, improving cost control.
Mind Map: Example Workflow for Material Cost Variance Improvement
Best Practices for Integrating Variance Analysis with Continuous Improvement
- Cross-Functional Collaboration: Engage finance, operations, and procurement teams to gain comprehensive insights.
- Data-Driven Decisions: Use accurate and timely data to support root cause analysis.
- Clear Accountability: Assign responsibility for implementing and monitoring improvement initiatives.
- Documentation: Maintain records of variances, analyses, and actions to track progress over time.
- Regular Reviews: Schedule periodic meetings to review variance trends and update improvement plans.
Additional Example: Service Company Improves Labor Efficiency
Scenario: A service company experiences unfavorable labor cost variances due to overtime.
- Variance Analysis: Overtime costs exceed budget by 15%.
- Root Cause: Inefficient scheduling and unexpected client demands.
- Improvement Initiative: Introduce workforce management software and cross-train employees.
- Outcome: Overtime costs decrease by 10% in the following quarter, improving profitability.
Mind Map: Service Company Labor Cost Improvement
By embedding variance analysis into a continuous improvement framework, finance professionals can transform financial insights into actionable strategies that drive sustainable business performance and operational excellence.
6. Strategic Financial Planning and Long-Term Analysis
6.1 Aligning Financial Plans with Corporate Strategy
Aligning financial plans with corporate strategy is a critical step in ensuring that an organization’s financial resources are effectively allocated to support its long-term goals and competitive positioning. This alignment helps create a cohesive roadmap that drives sustainable growth, optimizes capital usage, and enhances stakeholder value.
Why Alignment Matters
- Ensures financial resources support strategic priorities.
- Enhances decision-making by linking financial outcomes to strategic objectives.
- Improves communication across departments by providing a unified direction.
- Enables proactive risk management by anticipating financial impacts of strategic choices.
Key Steps to Align Financial Plans with Corporate Strategy
-
Understand the Corporate Strategy
- Review the company’s vision, mission, and strategic goals.
- Identify key growth drivers, market positioning, and competitive advantages.
-
Translate Strategy into Financial Objectives
- Define measurable financial targets (e.g., revenue growth, margin improvement, ROI).
- Prioritize initiatives based on strategic importance and financial impact.
-
Develop Financial Plans that Support Strategic Initiatives
- Allocate budgets to strategic projects.
- Forecast cash flows and capital requirements aligned with strategic timelines.
-
Integrate Strategic Metrics into Financial Reporting
- Incorporate KPIs that reflect strategic progress (e.g., market share, customer acquisition cost).
- Use dashboards to monitor alignment continuously.
-
Review and Adjust Plans Regularly
- Conduct periodic strategy reviews and update financial plans accordingly.
- Use scenario planning to anticipate changes in market or competitive landscape.
Mind Map: Aligning Financial Plans with Corporate Strategy
Example: Aligning Financial Plans in a Technology Company
Scenario: A mid-sized technology company aims to become a market leader in cloud computing services over the next five years. Their corporate strategy focuses on innovation, customer acquisition, and expanding global reach.
Step 1: Understand Strategy
- Vision: “To be the most trusted cloud service provider globally.”
- Strategic Goals: Increase market share by 15%, launch 3 new products, expand into 5 new countries.
Step 2: Translate into Financial Objectives
- Target revenue growth of 20% annually.
- Improve gross margin from 40% to 50%.
- Allocate 25% of budget to R&D.
Step 3: Develop Financial Plans
- Budget $10M annually for R&D aligned with product launches.
- Forecast increased marketing spend to support customer acquisition.
- Plan capital investments for data center expansion in target countries.
Step 4: Integrate Metrics
- Track customer acquisition cost (CAC) and lifetime value (LTV).
- Monitor R&D ROI and product launch timelines.
Step 5: Review & Adjust
- Quarterly reviews to assess progress against KPIs.
- Scenario planning for potential regulatory changes in new markets.
Additional Mind Map: Financial Planning Process Aligned with Strategy
Best Practice Tips
- Engage cross-functional teams early to ensure strategic and financial alignment.
- Use technology tools to link strategic plans with financial models dynamically.
- Communicate the strategic rationale behind financial targets to foster organizational buy-in.
- Regularly update financial assumptions based on strategic shifts and market feedback.
By embedding corporate strategy into every stage of financial planning, organizations can ensure their financial plans are not just numbers on a spreadsheet but a powerful tool driving strategic success.
6.2 Best Practice: Incorporating Competitive and Market Analysis
Incorporating competitive and market analysis into strategic financial planning is essential for creating realistic, actionable, and forward-looking financial plans. This practice helps organizations anticipate market shifts, understand competitor positioning, and identify growth opportunities or risks that could impact financial outcomes.
Why Incorporate Competitive and Market Analysis?
- Informed Decision-Making: Provides context beyond internal data, enabling smarter resource allocation.
- Risk Mitigation: Identifies external threats early, allowing proactive adjustments.
- Opportunity Identification: Reveals market gaps and emerging trends to capitalize on.
Key Components of Competitive and Market Analysis
Step-by-Step Approach to Incorporate Analysis into FP&A
- Gather Market Data: Collect data on industry size, growth rates, customer segments, and regulatory changes.
- Analyze Competitors: Evaluate competitor financials, product offerings, pricing, and market positioning.
- Perform SWOT Analysis: Identify internal strengths and weaknesses relative to external opportunities and threats.
- Translate Insights into Financial Metrics: Adjust revenue forecasts, cost assumptions, and capital expenditure plans based on analysis.
- Scenario Planning: Develop alternative financial scenarios reflecting different market and competitive conditions.
Example: Incorporating Competitive and Market Analysis in a 5-Year Financial Plan
Context: A consumer electronics company is planning to launch a new smart home device.
- Market Research: Reports indicate a 15% annual growth in smart home device adoption.
- Competitor Analysis: Key competitors are pricing aggressively and investing heavily in R&D.
- SWOT Insights: Strength in brand loyalty; weakness in distribution channels; opportunity in emerging markets; threat from low-cost competitors.
Financial Planning Adjustments:
- Revenue projections incorporate a 12% growth rate, slightly conservative due to competitive pricing pressure.
- Increased marketing and distribution costs budgeted to address channel weaknesses.
- Capital expenditure increased to fund R&D for product differentiation.
Mind Map: Translating Market & Competitive Insights into Financial Planning
Additional Example: Financial Analyst Perspective
A financial analyst at a manufacturing firm uses market analysis to adjust the cost of goods sold (COGS) forecast. Raw material prices are expected to rise due to new tariffs. By incorporating this insight, the analyst revises the cost assumptions upward, which impacts gross margin forecasts and informs pricing strategy discussions.
Tips for Effective Integration
- Use reliable data sources such as industry reports, government publications, and market intelligence platforms.
- Collaborate with marketing and sales teams to validate assumptions.
- Regularly update competitive and market analysis to reflect changing conditions.
- Leverage visual tools like dashboards and mind maps to communicate insights clearly.
In summary, incorporating competitive and market analysis into FP&A ensures that financial plans are grounded in reality and aligned with external business environments. This practice enhances the accuracy and strategic relevance of financial forecasts and budgets, ultimately supporting better business outcomes.
6.3 Example: Developing a 5-Year Financial Plan for Expansion
Developing a 5-year financial plan for expansion is a critical exercise that helps organizations strategically allocate resources, forecast growth, and manage risks over a medium-term horizon. This example will walk through the key steps, best practices, and illustrative mind maps to help accountants and financial analysts build a robust financial plan.
Step 1: Define Expansion Objectives and Scope
Before diving into numbers, clearly outline the goals of the expansion. This might include entering new markets, launching new products, increasing production capacity, or acquiring competitors.
Example Objective: Expand manufacturing capacity by 50% over 5 years to meet growing demand in the Asia-Pacific region.
Step 2: Conduct Market and Competitive Analysis
Understand the market potential, customer demand, and competitive landscape. This informs realistic revenue projections and investment needs.
Step 3: Project Revenue Growth
Estimate incremental revenues from the expansion, considering:
- Market size and growth rate
- Pricing strategies
- Sales channels
Example: Assume a 10% annual revenue growth driven by new product lines and geographic expansion.
Step 4: Estimate Capital Expenditures (CapEx)
Identify investments needed for:
- New equipment and facilities
- Technology upgrades
- Hiring and training
Example: $5 million upfront investment in new machinery in Year 1, followed by $1 million annual maintenance CapEx.
Step 5: Forecast Operating Expenses (OpEx)
Include costs such as:
- Raw materials
- Labor
- Marketing and sales
- Administrative expenses
Example: Operating expenses projected to increase by 8% annually due to expanded operations.
Step 6: Build Cash Flow Projections
Combine revenue, CapEx, and OpEx forecasts to project cash inflows and outflows. This helps assess funding needs and timing.
Step 7: Assess Financing Options
Determine how to fund the expansion:
- Internal cash reserves
- Debt financing
- Equity issuance
Example: Plan to finance 60% through debt and 40% through retained earnings.
Step 8: Perform Scenario and Sensitivity Analysis
Test how changes in key assumptions (e.g., sales growth, cost inflation) impact financial outcomes.
Mind Map: 5-Year Financial Plan for Expansion
Detailed Example: Year 1 Financial Snapshot
| Item | Amount (USD) |
|---|---|
| Revenue | $20,000,000 |
| Operating Expenses | $12,000,000 |
| Capital Expenditures | $5,000,000 |
| Net Cash Flow | $3,000,000 |
Explanation: Revenue is projected at $20M with 10% growth expected in subsequent years. Operating expenses are $12M, reflecting increased labor and raw materials. CapEx is $5M for new machinery. The resulting net cash flow is positive, indicating a healthy start.
Best Practices Embedded in This Example
- Align Financial Plan with Strategic Goals: The expansion targets a specific market and capacity increase.
- Use Conservative Assumptions: Revenue growth and expense increases are realistic, avoiding over-optimism.
- Incorporate Scenario Analysis: Prepare for uncertainties by modeling different outcomes.
- Integrate Financing Strategy Early: Knowing how to fund the plan avoids surprises.
- Regularly Update the Plan: As actual results come in, adjust forecasts to stay on track.
Additional Mind Map: Scenario Analysis Focus
By following this structured approach and leveraging these examples and mind maps, financial professionals can develop comprehensive 5-year financial plans that support sustainable expansion and informed decision-making.
6.4 Evaluating Capital Structure and Financing Options
Financial planning and analysis professionals play a critical role in evaluating a company’s capital structure and financing options to ensure optimal funding strategies that support growth, minimize cost of capital, and maintain financial flexibility. This section delves into the key concepts, best practices, and practical examples to help accountants and financial analysts make informed decisions.
Understanding Capital Structure
Capital structure refers to the mix of debt, equity, and hybrid instruments a company uses to finance its operations and growth. The right balance affects the company’s risk profile, cost of capital, and shareholder value.
Mind Map: Components of Capital Structure
Key Metrics to Evaluate Capital Structure
- Debt-to-Equity Ratio (D/E): Measures the relative proportion of debt and equity financing.
- Weighted Average Cost of Capital (WACC): Average rate a company is expected to pay to finance its assets.
- Interest Coverage Ratio: Ability to meet interest payments from operating income.
- Leverage Ratios: Assess financial risk and borrowing capacity.
Best Practice: Regularly benchmark these ratios against industry peers to maintain competitive and sustainable capital structures.
Financing Options Overview
Companies have multiple financing options, each with pros and cons:

Best Practice: Matching Financing Options to Business Needs
- Short-term needs: Use revolving credit lines or short-term loans.
- Long-term investments: Consider bonds or equity issuance.
- Preserving control: Prefer debt or convertible instruments over equity dilution.
- Cost efficiency: Evaluate interest rates, issuance costs, and tax implications.
Example 1: Evaluating Debt vs Equity for Expansion
A mid-sized manufacturing firm plans a $10 million expansion. The CFO considers two options:
- Option A: Issue $10 million in new equity.
- Option B: Take a $10 million long-term loan at 6% interest.
Analysis:
- Equity issuance dilutes existing shareholders but requires no fixed payments.
- Debt increases financial risk but interest is tax-deductible.
Using a simplified WACC calculation:
| Component | Amount ($M) | Cost (%) | Weighted Cost (%) |
|---|---|---|---|
| Debt | 10 | 6 | 0.6 |
| Equity | 40 | 10 | 4.0 |
| Total | 50 | 4.6% |
Adding $10 million debt increases leverage but may reduce WACC if debt cost is lower than equity cost.
Mind Map: Decision Factors for Financing Choice
Example 2: Using Convertible Bonds to Balance Risk and Control
A technology startup needs $5 million but wants to avoid immediate equity dilution. It issues convertible bonds with a 5-year maturity and conversion option.
- Advantages: Lower interest rates than traditional debt, deferred dilution, attractive to investors.
- Considerations: Potential future dilution, complexity in valuation.
This hybrid instrument helps balance the startup’s need for capital with preserving founder control.
Summary and Actionable Steps
- Analyze current capital structure: Calculate key ratios and benchmark.
- Identify financing needs: Short-term vs long-term, growth vs working capital.
- Evaluate financing options: Consider cost, control, flexibility, and tax impact.
- Model scenarios: Use financial models to project impact on cash flows and ratios.
- Engage stakeholders: Collaborate with management, investors, and lenders.
- Monitor and adjust: Continuously review capital structure as business evolves.
By systematically evaluating capital structure and financing options with these best practices and examples, FP&A professionals can optimize funding strategies that align with corporate objectives and market realities.
6.5 Risk Assessment and Mitigation in Strategic Planning
Strategic planning is essential for setting the long-term direction of an organization. However, it inherently involves uncertainty and exposure to various risks that can derail objectives if not properly managed. Effective risk assessment and mitigation ensure that potential threats are identified early, evaluated for impact, and addressed proactively to safeguard the company’s financial health and strategic goals.
Understanding Risk in Strategic Planning
Risk in strategic planning refers to any uncertain event or condition that, if it occurs, can negatively affect the achievement of business objectives. These risks can be internal (operational inefficiencies, resource constraints) or external (market volatility, regulatory changes).
Key types of risks include:
- Financial Risks
- Market Risks
- Operational Risks
- Regulatory and Compliance Risks
- Strategic Risks
- Reputational Risks
Mind Map: Types of Risks in Strategic Planning
Best Practice: Conducting a Comprehensive Risk Assessment
- Identify Risks: Engage cross-functional teams to brainstorm and list potential risks relevant to strategic objectives.
- Analyze Risks: Evaluate the likelihood and potential impact of each risk using qualitative or quantitative methods.
- Prioritize Risks: Rank risks based on their severity and probability to focus on the most critical ones.
- Develop Mitigation Strategies: Define actions to reduce the likelihood or impact of prioritized risks.
- Monitor and Review: Continuously track risk factors and update mitigation plans as conditions change.
Example: Risk Assessment for a 5-Year Expansion Plan
Scenario: A manufacturing company plans to expand into new international markets over the next five years.
-
Identified Risks:
- Currency exchange rate volatility impacting profit margins.
- Regulatory compliance challenges in foreign jurisdictions.
- Supply chain disruptions due to geopolitical tensions.
- Increased competition from local players.
-
Mitigation Strategies:
- Use hedging instruments to manage currency risk.
- Employ local legal experts to ensure compliance.
- Diversify suppliers to reduce dependency on any single region.
- Conduct market research to tailor products and pricing competitively.
Mind Map: Risk Mitigation Strategies
Integrating Risk Assessment into Strategic Planning
- Scenario Analysis: Develop multiple future scenarios considering different risk outcomes to test the robustness of strategic plans.
- Sensitivity Analysis: Assess how changes in key assumptions (e.g., sales growth, cost inflation) affect financial projections.
- Contingency Planning: Prepare alternative action plans to quickly respond if identified risks materialize.
Example: Sensitivity Analysis on Sales Forecast
A financial analyst models the impact of a 10%, 20%, and 30% drop in sales volume on profitability. This helps the leadership understand the financial resilience of the expansion plan and decide on acceptable risk thresholds.
Summary
Risk assessment and mitigation are critical components of strategic financial planning. By systematically identifying potential risks, analyzing their impact, and implementing targeted mitigation strategies, organizations can enhance decision-making, protect value, and increase the likelihood of achieving long-term objectives.
Remember: Risk management is an ongoing process, not a one-time event. Regular reviews and updates ensure that the strategic plan remains aligned with the evolving risk landscape.
7. Technology and Tools in FP&A
7.1 Overview of FP&A Software and Automation Tools
Financial Planning and Analysis (FP&A) software and automation tools have revolutionized how finance teams operate by streamlining data collection, improving forecasting accuracy, and enhancing reporting capabilities. These tools enable accountants and financial analysts to focus more on strategic decision-making rather than manual data processing.
Key Categories of FP&A Software and Automation Tools
Benefits of Using FP&A Software and Automation Tools
- Efficiency: Automate repetitive tasks such as data consolidation and report generation.
- Accuracy: Reduce human errors by using standardized templates and automated calculations.
- Real-time Data Access: Cloud-based tools provide up-to-date financial data accessible anywhere.
- Scenario Analysis: Easily create multiple financial scenarios to support strategic decisions.
- Collaboration: Enable multiple stakeholders to work simultaneously on budgets and forecasts.
Example: How a Financial Analyst Uses Automation Tools to Streamline Forecasting
Scenario: A financial analyst at a mid-sized manufacturing company needs to prepare monthly sales forecasts.
Traditional Approach: Manually collecting sales data from different departments via email, consolidating in Excel, and updating forecasts.
With Automation Tools:
- Use Alteryx to automate data extraction from ERP and CRM systems.
- Load data into Adaptive Insights for forecasting using built-in models.
- Generate dashboards in Power BI to visualize forecast vs actual sales.
Outcome: Time spent on data gathering reduced by 70%, forecast accuracy improved due to real-time data, and reporting became more interactive.
Mind Map: FP&A Software Selection Criteria
Best Practice: Combining Multiple Tools for Optimal FP&A
Many organizations find that no single tool meets all their FP&A needs. A best practice is to integrate specialized tools to leverage their strengths. For example:
- Use Anaplan for complex scenario planning and driver-based forecasting.
- Employ Power BI for rich data visualization and interactive dashboards.
- Automate data workflows with UiPath robotic process automation (RPA) bots.
This integrated approach ensures flexibility, accuracy, and efficiency.
Summary
FP&A software and automation tools are essential for modern finance teams aiming to enhance productivity and decision quality. By understanding the different categories, evaluating selection criteria, and leveraging real-world examples, accountants and financial analysts can better harness technology to drive business success.
7.2 Best Practice: Leveraging Cloud-Based Solutions for Collaboration
In today’s fast-paced corporate finance environment, collaboration is key to effective Financial Planning and Analysis (FP&A). Cloud-based solutions have revolutionized how finance teams work together, enabling real-time data sharing, seamless communication, and enhanced decision-making. This section explores best practices for leveraging cloud-based tools to maximize collaboration within FP&A teams, supported by practical examples and mind maps.
Why Cloud-Based Solutions Matter for FP&A Collaboration
- Real-Time Access: Cloud platforms allow multiple users to access and update financial data simultaneously, reducing delays and version control issues.
- Centralized Data Repository: A single source of truth ensures consistency and accuracy across budgeting, forecasting, and reporting.
- Enhanced Security: Modern cloud solutions offer robust security protocols, ensuring sensitive financial data is protected.
- Scalability: Cloud tools can easily scale with the organization’s growth and evolving FP&A needs.
Best Practices for Leveraging Cloud-Based Solutions
-
Choose the Right Platform
- Evaluate platforms based on integration capabilities with existing ERP and accounting systems.
- Prioritize user-friendly interfaces to encourage adoption among finance and non-finance stakeholders.
-
Establish Clear Collaboration Protocols
- Define roles and permissions to control data access and editing rights.
- Set guidelines for data entry, versioning, and commenting to maintain data integrity.
-
Promote Cross-Functional Collaboration
- Involve departments such as sales, operations, and HR in the planning process via shared cloud workspaces.
- Use collaborative features like shared dashboards and real-time chat to facilitate communication.
-
Leverage Automation and Workflow Features
- Automate routine data imports and report generation to reduce manual errors.
- Use workflow management to track approval processes and deadlines.
-
Continuous Training and Support
- Provide regular training sessions to keep teams updated on new features and best practices.
- Encourage feedback to improve collaboration workflows.
Mind Map: Leveraging Cloud-Based Solutions for FP&A Collaboration
Example 1: Collaborative Budgeting Using Cloud-Based FP&A Software
Scenario: A multinational corporation implements a cloud-based FP&A platform to streamline its annual budgeting process.
- Implementation: The finance team sets up a centralized budgeting workspace accessible to all regional managers.
- Collaboration: Regional managers input their budget data directly into the platform, which updates the master budget in real-time.
- Benefits: The CFO can monitor progress, identify discrepancies early, and communicate adjustments instantly.
- Outcome: The budgeting cycle time is reduced by 30%, and data accuracy improves significantly.
Example 2: Real-Time Forecasting with Cross-Departmental Input
Scenario: A technology firm uses a cloud-based forecasting tool to incorporate sales and operations data into financial forecasts.
- Implementation: Sales teams update pipeline data, while operations provide production capacity inputs within the shared cloud environment.
- Collaboration: FP&A analysts adjust financial forecasts dynamically based on the latest inputs.
- Benefits: Forecasts are more accurate and reflect current market conditions.
- Outcome: The company improves decision-making agility, enabling timely resource allocation.
Mind Map: Example Workflow for Cloud-Based FP&A Collaboration
Summary
Leveraging cloud-based solutions for FP&A collaboration enhances transparency, efficiency, and accuracy in financial planning processes. By adopting best practices such as selecting the right platform, defining collaboration protocols, encouraging cross-functional involvement, automating workflows, and providing ongoing training, finance teams can unlock the full potential of cloud technology. Real-world examples demonstrate how these practices translate into tangible business benefits, making cloud collaboration an indispensable part of modern FP&A.
7.3 Example: Using Business Intelligence Tools to Enhance Reporting
In today’s fast-paced corporate finance environment, Business Intelligence (BI) tools have become indispensable for Financial Planning and Analysis (FP&A) professionals. These tools help transform raw financial data into actionable insights, enabling better decision-making and more effective reporting.
What Are Business Intelligence Tools?
BI tools are software applications that collect, process, and visualize data to support business decisions. They integrate data from multiple sources, automate reporting, and provide interactive dashboards.
Why Use BI Tools in FP&A Reporting?
- Improved Data Accuracy: Automated data integration reduces manual errors.
- Real-Time Insights: Access up-to-date financial data anytime.
- Enhanced Visualization: Interactive charts and graphs make complex data easier to understand.
- Collaboration: Share reports easily across teams and stakeholders.
Example Scenario: Enhancing Monthly Financial Reporting with Power BI
Company Background: A mid-sized manufacturing company struggles with manual Excel-based monthly financial reports that are time-consuming and prone to errors. The FP&A team decides to implement Microsoft Power BI to streamline reporting.
Step 1: Data Integration
- Connect Power BI to ERP system, CRM, and Excel spreadsheets.
- Automate data refresh daily to ensure reports use the latest figures.
Step 2: Building Interactive Dashboards
- Create visualizations for revenue, expenses, profit margins, and cash flow.
- Use slicers to filter data by product line, region, and time period.
Step 3: Sharing and Collaboration
- Publish dashboards to Power BI Service.
- Set up scheduled email reports for senior management.
Outcome:
- Reporting time reduced from 5 days to 1 day.
- Management can drill down into data for deeper insights.
- Improved accuracy and transparency in financial reporting.
Mind Map: BI Tools Workflow in FP&A Reporting
Example: Using Tableau for Variance Analysis Reporting
Context: An FP&A team wants to improve variance analysis between budgeted and actual expenses across departments.
Implementation:
- Connect Tableau to financial data warehouse.
- Create a dashboard showing budget vs actuals with color-coded variances.
- Add filters for department, month, and expense category.
- Use tooltips to provide detailed variance explanations.
Result:
- Department heads can quickly identify overspending areas.
- FP&A team can focus on investigating significant variances.
- Enables proactive cost control measures.
Mind Map: Key Features of BI Tools for FP&A
Best Practices for Using BI Tools in FP&A Reporting
- Start with Clear Objectives: Define what insights the report should deliver.
- Ensure Data Quality: Clean and validate data before integration.
- Design for Usability: Use intuitive layouts and avoid clutter.
- Leverage Interactivity: Enable users to explore data dynamically.
- Train Users: Provide training to maximize tool adoption.
By integrating BI tools into FP&A reporting, finance professionals can significantly enhance the quality, speed, and impact of their financial insights, driving better strategic decisions across the organization.
7.4 Integrating ERP Systems with FP&A Processes
Enterprise Resource Planning (ERP) systems are the backbone of many corporate finance operations, providing a centralized platform for managing financial data, procurement, inventory, and more. Integrating ERP systems with Financial Planning and Analysis (FP&A) processes enhances data accuracy, streamlines workflows, and enables more insightful financial decision-making.
Why Integrate ERP with FP&A?
- Centralized Data Source: ERP systems consolidate financial and operational data, reducing data silos.
- Real-Time Data Access: FP&A teams gain access to up-to-date financial information for timely forecasting and budgeting.
- Improved Accuracy: Automated data flows minimize manual errors in financial reports.
- Efficiency Gains: Reduces redundant data entry and accelerates the FP&A cycle.
Key Integration Points
Best Practices for Integration
- Define Clear Objectives: Identify which FP&A processes will benefit most from ERP integration (e.g., budgeting, forecasting, reporting).
- Data Mapping & Standardization: Ensure consistent data definitions between ERP and FP&A tools to avoid discrepancies.
- Automate Data Transfers: Use APIs or middleware to enable seamless, scheduled data synchronization.
- Maintain Data Governance: Establish roles and controls to preserve data integrity and security.
- Train Users: Equip FP&A and finance teams with knowledge on how to leverage integrated systems effectively.
Example: Integrating SAP ERP with a Cloud-Based FP&A Tool
Scenario: A multinational corporation uses SAP ERP for its core financial transactions and a cloud-based FP&A platform for budgeting and forecasting.
- Step 1: Identify key data elements to transfer: general ledger balances, cost center expenses, sales data.
- Step 2: Develop an automated data pipeline using SAP’s API to extract monthly financial data.
- Step 3: Map SAP data fields to the FP&A tool’s data model, ensuring consistent account codes and dimensions.
- Step 4: Schedule nightly data synchronization to update FP&A models with the latest actuals.
- Step 5: Use the FP&A tool’s dashboards to perform variance analysis and update forecasts based on real-time data.
Outcome: The FP&A team reduces manual data reconciliation by 70%, improves forecast accuracy, and shortens the budgeting cycle by 20%.
Mind Map: Example Workflow of ERP-FP&A Integration
Challenges and Solutions
| Challenge | Solution | Example |
|---|---|---|
| Data Inconsistency | Standardize chart of accounts and master data | Aligning cost center codes across systems |
| Integration Complexity | Use middleware platforms like Dell Boomi or Mulesoft | Simplifies API management and data flows |
| User Resistance | Conduct training and communicate benefits | Workshops demonstrating time savings |
| Security and Compliance Risks | Implement role-based access and encryption | Restricting sensitive data access |
Final Thoughts
Integrating ERP systems with FP&A processes is not just a technical exercise but a strategic initiative that empowers finance teams to deliver more accurate, timely, and actionable insights. By following best practices and leveraging automation, organizations can transform their financial planning capabilities and support better business outcomes.
7.5 Future Trends: AI and Machine Learning in Financial Planning
Financial Planning and Analysis (FP&A) is undergoing a transformative shift with the integration of Artificial Intelligence (AI) and Machine Learning (ML). These technologies are not only automating routine tasks but also enhancing predictive accuracy, enabling deeper insights, and supporting strategic decision-making.
Understanding AI and ML in FP&A
- Artificial Intelligence (AI): The simulation of human intelligence processes by machines, especially computer systems.
- Machine Learning (ML): A subset of AI that enables systems to learn and improve from experience without explicit programming.
Key Applications of AI and ML in FP&A
Best Practices for Integrating AI and ML
- Start Small with Pilot Projects: Begin with automating repetitive tasks such as data consolidation or report generation to demonstrate value.
- Ensure Data Quality: High-quality, clean data is critical for effective AI/ML models.
- Collaborate with Data Scientists: FP&A professionals should work closely with data experts to build relevant models.
- Focus on Explainability: Models should be transparent to build trust among stakeholders.
- Continuously Monitor and Update Models: Regularly refine models based on new data and feedback.
Example 1: AI-Driven Sales Forecasting
A retail company implemented an ML model that analyzed historical sales data, seasonality, promotions, and external factors like weather and economic indicators. The model improved forecast accuracy by 20%, enabling better inventory management and reducing stockouts.

Example 2: Anomaly Detection in Expense Monitoring
A multinational corporation used ML algorithms to automatically detect unusual expense patterns across departments. The system flagged potential fraud and errors early, saving significant costs and improving compliance.
Future Outlook
- Augmented Analytics: AI will increasingly assist FP&A professionals by generating automated insights and recommendations.
- Real-Time Financial Planning: Integration of AI with real-time data streams will enable dynamic forecasting and rapid scenario analysis.
- Conversational AI: Chatbots and virtual assistants will facilitate easier access to financial data and analysis.
- Integration with Robotic Process Automation (RPA): Combining AI with RPA will further streamline end-to-end FP&A workflows.
Summary
AI and ML are revolutionizing FP&A by enhancing accuracy, efficiency, and strategic value. By embracing these technologies with best practices and real-world applications, finance professionals can unlock new opportunities to drive business growth and resilience.
8. Communication and Stakeholder Management
8.1 Best Practice: Tailoring Financial Reports for Different Audiences
Effective communication is a cornerstone of successful Financial Planning and Analysis (FP&A). Tailoring financial reports to meet the needs and understanding levels of different audiences ensures that insights are not only conveyed but also acted upon appropriately. This section explores best practices for customizing financial reports, supported by mind maps and practical examples.
Why Tailor Financial Reports?
- Different stakeholders have varying levels of financial literacy.
- The focus areas differ: executives may want strategic insights, while accountants need detailed transactional data.
- Clear, relevant communication drives better decision-making.
Key Audiences and Their Needs
Best Practices for Tailoring Reports
-
Understand the Audience’s Objectives and Knowledge Level
- Conduct stakeholder interviews or surveys.
- Identify what decisions they need to make based on the report.
-
Adjust the Level of Detail
- Use summaries and visuals for executives.
- Provide granular data and assumptions for analysts and accountants.
-
Use Appropriate Language and Terminology
- Avoid jargon for non-financial audiences.
- Use technical terms where appropriate for finance professionals.
-
Highlight Relevant KPIs and Metrics
- Customize KPIs to align with audience priorities.
-
Incorporate Visual Aids
- Use charts, graphs, and dashboards to simplify complex data.
-
Provide Context and Narrative
- Explain the ‘why’ behind the numbers.
- Link financial data to business outcomes.
-
Enable Interactivity Where Possible
- Use tools that allow users to drill down into data.
Mind Map: Tailoring Report Content
Example 1: Executive Summary Report
Scenario: The CFO needs a monthly financial summary to review company performance and make strategic decisions.
Tailoring Approach:
- Use a one-page dashboard highlighting revenue, profit margins, cash flow, and key variances.
- Include trend graphs showing performance over the last 6 months.
- Provide a brief narrative explaining significant changes.
Sample Extract:
| Metric | Current Month | Prior Month | % Change |
|---|---|---|---|
| Revenue | $5.2M | $4.8M | +8.3% |
| Gross Margin | 42% | 40% | +2 pts |
| Operating Income | $1.1M | $1.0M | +10% |
Note: Revenue growth driven by new product launch in Region A.
Example 2: Financial Analyst Detailed Report
Scenario: A financial analyst requires detailed data to perform variance analysis and forecasting.
Tailoring Approach:
- Provide detailed line-item budgets vs actuals.
- Include assumptions and drivers behind numbers.
- Use pivot tables and scenario comparison charts.
Sample Extract:
| Account | Budget Q1 | Actual Q1 | Variance | Variance % | Driver Explanation |
|---|---|---|---|---|---|
| Sales Revenue | $15M | $14.2M | -$0.8M | -5.3% | Lower sales volume in Region B |
| Marketing Expense | $1.5M | $1.3M | +$0.2M | +13.3% | Delayed campaign launch |
Example 3: Operational Manager Report
Scenario: Department heads need reports to manage budgets and operational efficiency.
Tailoring Approach:
- Focus on departmental budgets, actual spend, and variances.
- Highlight actionable insights and recommendations.
- Use simple charts and clear explanations.
Sample Extract:
| Department | Budget YTD | Actual YTD | Variance | Notes |
|---|---|---|---|---|
| Customer Support | $500K | $520K | -$20K | Increased overtime due to volume |
| IT | $750K | $700K | +$50K | Cost savings from vendor renegotiation |
Recommendation: Review overtime policies to control support costs.
Summary
Tailoring financial reports is not a one-size-fits-all approach. Understanding the audience’s needs, adjusting content complexity, and using appropriate visuals and narratives are essential to delivering impactful financial insights. By applying these best practices, FP&A professionals can enhance communication, foster better decision-making, and add greater value to their organizations.
8.2 Example: Presenting Financial Insights to Non-Financial Executives
Presenting financial insights to non-financial executives requires clarity, simplicity, and relevance. The goal is to translate complex financial data into actionable insights that support strategic decision-making without overwhelming the audience with jargon or excessive detail.
Key Principles for Effective Presentation
- Know Your Audience: Understand their priorities, concerns, and level of financial literacy.
- Focus on Business Impact: Link financial data to business outcomes and strategic goals.
- Use Visual Aids: Charts, graphs, and mind maps help illustrate points clearly.
- Tell a Story: Structure your presentation to guide the audience through the narrative.
- Be Concise: Highlight key takeaways and avoid unnecessary technical details.
Mind Map: Structuring Financial Insights Presentation
Example Scenario: Quarterly Financial Review for a Marketing Team
Context: You are presenting the quarterly financial performance to the marketing leadership team, who have limited financial background but are keen to understand budget utilization and ROI on campaigns.
Step 1: Identify Key Metrics Relevant to Marketing
- Marketing Budget vs Actual Spend
- Customer Acquisition Cost (CAC)
- Return on Marketing Investment (ROMI)
- Sales Growth Attributable to Marketing
Step 2: Simplify the Data
- Use percentages and visuals rather than raw numbers.
- Highlight variances and explain causes in simple terms.
Step 3: Visual Presentation
Visual Aid:
- Bar chart comparing planned vs actual budget and CAC
- Line graph showing sales growth trend
Mind Map: Explaining Financial Metrics to Marketing Team
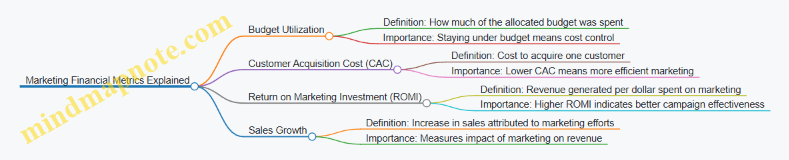
Step 4: Storytelling Approach
- Context: “This quarter, we aimed to optimize our marketing spend while increasing customer acquisition.”
- Insight: “We spent 5% less than budgeted, reduced our CAC by 10%, and achieved a ROMI of 3.5x, exceeding our target.”
- Impact: “These improvements contributed to a 10% sales growth, 2% higher than planned.”
- Recommendation: “Continue focusing on high-performing channels and explore further cost efficiencies.”
Additional Tips
- Use analogies familiar to the audience (e.g., “Think of ROMI like the interest you earn on a savings account – the higher, the better.”)
- Avoid acronyms without explanation.
- Provide a one-page summary with key takeaways.
- Encourage questions to clarify doubts.
By following these guidelines and using clear examples and visual tools, financial analysts and accountants can effectively communicate financial insights to non-financial executives, fostering better understanding and informed decision-making.
8.3 Building Effective FP&A Teams and Cross-Departmental Collaboration
Building an effective Financial Planning & Analysis (FP&A) team and fostering cross-departmental collaboration are critical success factors for driving accurate financial insights and supporting strategic decision-making. This section explores best practices, practical examples, and visual mind maps to help FP&A leaders and professionals create high-performing teams and seamless collaboration across functions.
Key Elements of an Effective FP&A Team
- Diverse Skill Sets: Combining financial expertise, data analytics, business acumen, and communication skills.
- Clear Roles & Responsibilities: Defining ownership for budgeting, forecasting, modeling, and reporting.
- Strong Leadership: Guiding the team with vision, motivation, and accountability.
- Continuous Learning: Encouraging upskilling in technology, regulations, and industry trends.
- Collaborative Culture: Promoting openness, knowledge sharing, and mutual support.
Mind Map: Building an Effective FP&A Team
Best Practices for Cross-Departmental Collaboration
- Establish Clear Communication Channels: Use regular meetings, shared platforms, and dashboards to keep everyone aligned.
- Define Shared Goals: Align FP&A objectives with departmental and corporate goals to foster a sense of joint ownership.
- Leverage Technology: Utilize collaborative tools like cloud-based FP&A software, project management apps, and BI platforms.
- Encourage Early Involvement: Engage departments early in budgeting and forecasting to incorporate frontline insights.
- Build Trust and Transparency: Share assumptions, data sources, and methodologies openly to reduce friction.
Mind Map: Cross-Departmental Collaboration Best Practices
Example: Collaborative Budgeting Process in a Manufacturing Company
Scenario: The FP&A team at a mid-sized manufacturing firm faced challenges with inaccurate budgets and delayed submissions due to siloed departmental work.
Approach:
- FP&A introduced monthly cross-functional workshops involving Sales, Operations, and Marketing.
- Used a cloud-based budgeting tool accessible to all stakeholders.
- Set shared KPIs aligned with company growth targets.
- Created a centralized dashboard displaying real-time budget progress and variances.
Outcome:
- Improved budget accuracy by 15%.
- Reduced budget cycle time by 25%.
- Enhanced trust and communication between departments.
Example: FP&A Team Structure for a Technology Company
| Role | Responsibilities | Collaboration Focus |
|---|---|---|
| FP&A Manager | Lead team, strategy alignment, stakeholder management | Coordinates with all departments |
| Financial Analyst | Data analysis, forecasting, variance analysis | Works closely with Sales and Marketing |
| Business Analyst | Process improvement, data integration | Liaises with IT and Operations |
| Reporting Specialist | Financial reporting, dashboard creation | Supports Finance and Executive teams |
This structure ensures specialized focus areas while promoting cross-functional teamwork.
Mind Map: FP&A Team Structure Example

Tips to Enhance Collaboration and Team Effectiveness
- Host Regular Cross-Functional Workshops: Facilitate knowledge exchange and problem-solving.
- Implement Feedback Loops: Encourage continuous improvement through feedback from stakeholders.
- Celebrate Collaborative Wins: Recognize joint achievements to build morale.
- Promote Transparency: Share financial insights in an understandable manner to non-finance teams.
- Invest in Team Development: Provide training on soft skills like communication and negotiation.
By intentionally building FP&A teams with complementary skills and fostering a culture of collaboration across departments, organizations can significantly enhance the accuracy, relevance, and impact of their financial planning and analysis efforts.
8.4 Managing Expectations and Driving Consensus
Effective financial planning and analysis (FP&A) requires not only technical expertise but also strong interpersonal and communication skills. Managing expectations and driving consensus among diverse stakeholders is critical to ensure alignment, smooth decision-making, and successful execution of financial strategies.
Understanding Stakeholder Expectations
Stakeholders in FP&A typically include senior management, department heads, investors, and sometimes external partners. Each group has different priorities and expectations:
- Senior Management: Focus on strategic alignment, risk management, and overall financial health.
- Department Heads: Concerned with operational budgets, resource allocation, and performance targets.
- Investors: Interested in profitability, growth, and return on investment.
Best Practice: Early and clear communication about what FP&A can deliver, timelines, and limitations helps set realistic expectations.
Mind Map: Managing Expectations
Techniques to Drive Consensus
-
Facilitate Collaborative Workshops: Bringing stakeholders together to discuss assumptions, constraints, and objectives fosters ownership and alignment.
-
Use Data-Driven Insights: Presenting clear, objective data reduces subjective disagreements.
-
Scenario Analysis: Demonstrating multiple possible outcomes helps stakeholders understand risks and trade-offs.
-
Prioritize Open Dialogue: Encourage questions and feedback to address concerns early.
-
Document Agreements: Summarize decisions and action points to avoid misunderstandings.
Mind Map: Driving Consensus
Example: Aligning Budget Expectations in a Corporate FP&A Setting
Scenario: The FP&A team at a technology company is preparing the annual budget. The R&D department expects a 20% increase in funding to accelerate product development, while senior management is cautious due to market uncertainties.
Approach:
- The FP&A team organizes a workshop including R&D leaders and senior executives.
- They present historical R&D spending, outcomes, and market forecasts.
- Using scenario analysis, they show the impact of different funding levels on product launch timelines and company profitability.
- Open discussions reveal R&D’s critical milestones and management’s risk concerns.
- Together, they agree on a phased funding plan tied to milestone achievements.
- The agreement is documented and communicated to all stakeholders.
Outcome: Expectations are aligned, reducing potential conflicts during budget execution.
Additional Tips
- Manage Emotional Dynamics: Recognize that financial discussions can be sensitive; approach disagreements with empathy.
- Leverage Visual Tools: Use charts, dashboards, and mind maps to clarify complex information.
- Follow Up: Regular check-ins post-agreement help maintain consensus as conditions evolve.
By proactively managing expectations and fostering consensus, FP&A professionals can enhance collaboration, improve financial decision-making, and contribute to organizational success.
8.5 Using Storytelling Techniques to Enhance Financial Presentations
Financial presentations often risk becoming dry, data-heavy sessions that fail to engage stakeholders effectively. Incorporating storytelling techniques can transform these presentations into compelling narratives that resonate, inform, and inspire action. Below is a detailed guide to using storytelling in financial presentations, complete with mind maps and practical examples.
Why Use Storytelling in Financial Presentations?
- Makes complex data accessible and memorable
- Engages diverse audiences, including non-financial stakeholders
- Builds emotional connection and trust
- Drives decision-making by illustrating impact and context
Key Elements of Storytelling in FP&A
Storytelling Elements Mind Map
Step-by-Step Approach to Storytelling in Financial Presentations
- Set the Context: Begin by framing the business environment or financial landscape.
- Introduce the Characters: Identify key stakeholders or departments involved.
- Present the Challenge: Highlight the financial problem or opportunity.
- Show the Data: Use visuals to support the narrative.
- Explain the Resolution: Describe the proposed financial strategy or solution.
- Conclude with a Call to Action: Clearly state what you want the audience to do.
Mind Map: Storytelling Flow in Financial Presentations
Example 1: Presenting a Budget Variance Analysis
Scenario: You are presenting a quarterly budget variance report to the executive team.
- Context: “In Q2, our company faced unexpected raw material cost increases due to supply chain disruptions.”
- Characters: “Our procurement and production teams were directly impacted.”
- Challenge: “This led to a 12% unfavorable variance in production costs.”
- Data: Show a bar chart comparing budgeted vs actual costs.
- Resolution: “We negotiated new supplier contracts and optimized production schedules to reduce costs moving forward.”
- Call to Action: “We recommend continuing supplier diversification and monthly variance reviews to stay ahead.”
This narrative helps the audience understand not just the numbers but the story behind them.
Example 2: Forecasting Sales Growth
- Context: “Our sales team has been expanding into new markets over the past year.”
- Characters: “Sales leadership and marketing teams collaborating closely.”
- Challenge: “Forecasting growth is complicated by market volatility and competitive pressures.”
- Data: Present a line graph showing historical sales and forecast projections.
- Resolution: “By applying scenario analysis, we have prepared for optimistic, base, and pessimistic outcomes.”
- Call to Action: “We propose quarterly forecast updates and agile marketing strategies to adapt quickly.”
Tips for Effective Storytelling in Financial Presentations
- Use simple, clear language avoiding jargon
- Incorporate visuals that support the narrative
- Connect data points to real business impacts
- Practice pacing to maintain audience engagement
- Encourage questions and interaction to deepen understanding
Mind Map: Visual Aids to Support Storytelling
By weaving storytelling techniques into your financial presentations, you can turn raw data into meaningful insights that drive better understanding and stronger decision-making among accountants, financial analysts, and all corporate stakeholders.
9. Regulatory Compliance and Ethical Considerations
9.1 Understanding Financial Regulations Impacting FP&A
Financial Planning and Analysis (FP&A) professionals operate in a complex regulatory environment that directly influences how financial data is prepared, analyzed, and reported. Understanding these regulations is critical to ensure compliance, maintain data integrity, and support strategic decision-making.
Key Financial Regulations Affecting FP&A
Accounting Standards: IFRS and GAAP
FP&A teams must prepare financial plans and analyses consistent with the accounting frameworks their organizations follow.
-
Example: A multinational corporation uses IFRS for consolidated reporting but GAAP for its U.S. subsidiary. FP&A analysts must reconcile differences in revenue recognition and lease accounting when preparing forecasts.
-
Best Practice: Maintain a clear mapping between different accounting standards to ensure consistency in budgeting and forecasting.
Securities Regulations and Sarbanes-Oxley Act (SOX)
Public companies are subject to SEC regulations and SOX compliance, which impact FP&A through requirements for internal controls and accuracy in financial reporting.
-
Example: The FP&A team implements controls to ensure that forecasts and financial reports are supported by documented assumptions and reconciled to the general ledger.
-
Best Practice: Regularly review internal control processes and document workflows to meet audit requirements.
Tax Regulations
Tax laws influence financial planning, especially in areas like deferred tax calculations, transfer pricing, and tax provisioning.
-
Example: An FP&A analyst incorporates anticipated changes in corporate tax rates into the long-term financial model to reflect potential impacts on net income.
-
Best Practice: Collaborate closely with tax specialists to integrate tax considerations into forecasts and budgets.
Data Protection and Privacy Regulations
With increasing data privacy laws, FP&A must ensure that financial data handling complies with regulations like GDPR and CCPA.
-
Example: When consolidating financial data from different regions, FP&A ensures that personally identifiable information (PII) is anonymized or handled according to privacy laws.
-
Best Practice: Implement data governance policies and restrict access to sensitive financial data.
Industry-Specific Regulations
Certain industries have additional financial regulations impacting FP&A.
-
Example: Banks must comply with Basel III capital requirements, so FP&A teams include capital adequacy ratios in their financial analysis.
-
Best Practice: Stay updated on industry-specific regulatory changes and incorporate them into financial models.
Anti-Money Laundering (AML) and Fraud Prevention
FP&A plays a role in detecting anomalies and ensuring compliance with AML regulations through robust internal controls.
-
Example: Variance analysis highlights unusual transactions that trigger further investigation.
-
Best Practice: Integrate fraud risk assessments into financial planning cycles.
Summary Mind Map
FP&A Regulatory Compliance Mind Map
Final Example: Navigating SOX Compliance in FP&A
A publicly traded company’s FP&A team must ensure that all financial forecasts and reports are traceable and auditable to comply with SOX Section 404. They implement a workflow where every assumption is documented, linked to source data, and reviewed by internal audit before finalizing reports. This practice not only ensures compliance but also improves forecast reliability and stakeholder confidence.
Understanding and integrating financial regulations into FP&A processes is essential for accuracy, compliance, and strategic value creation. By adopting best practices and learning from real-world examples, FP&A professionals can navigate the regulatory landscape effectively.
9.2 Best Practice: Ensuring Data Integrity and Transparency
Ensuring data integrity and transparency is a cornerstone of effective Financial Planning and Analysis (FP&A). Accurate, reliable, and transparent data enables finance professionals to make informed decisions, build trust with stakeholders, and comply with regulatory requirements. This section explores best practices to maintain data integrity and transparency, supported by practical examples and mind maps to visualize the concepts.
What is Data Integrity and Transparency?
- Data Integrity refers to the accuracy, consistency, and reliability of data throughout its lifecycle.
- Transparency means that data processes and sources are clear, accessible, and understandable to relevant stakeholders.
Maintaining both ensures that financial reports and analyses are credible and actionable.
Mind Map: Key Components of Data Integrity and Transparency
Best Practices to Ensure Data Integrity
-
Implement Robust Data Validation and Error Checking
- Use automated validation rules within FP&A tools to flag anomalies.
- Example: A financial analyst sets up rules that flag any revenue entries exceeding historical monthly averages by 30%, prompting review.
-
Standardize Data Formats and Definitions
- Create a data dictionary that defines key financial terms and formats.
- Example: Defining “Operating Expenses” consistently across departments avoids misclassification.
-
Maintain Version Control and Audit Trails
- Track changes in financial models and reports to identify who made what changes and when.
- Example: Using cloud-based FP&A software that logs every update, enabling rollback if errors are found.
-
Conduct Regular Data Audits and Reconciliations
- Schedule periodic reviews comparing FP&A data against source systems (e.g., ERP, accounting software).
- Example: Monthly reconciliation of budget figures with actuals to detect discrepancies early.
-
Secure Data Access and Protect Against Unauthorized Changes
- Implement role-based access controls and encryption.
- Example: Only senior financial analysts and controllers have edit rights to sensitive forecast models.
Best Practices to Promote Transparency
-
Document Data Sources and Assumptions Clearly
- Maintain detailed notes on where data originates and the assumptions used in forecasts.
- Example: A forecast model includes a dedicated tab listing assumptions such as expected market growth rates and inflation.
-
Use Audit Trails and Reporting Logs
- Provide stakeholders with access to change logs and data lineage.
- Example: A CFO reviews the audit trail before approving the quarterly financial forecast.
-
Communicate Findings and Limitations Openly
- Present not only results but also potential data limitations or uncertainties.
- Example: Financial analysts highlight that a forecast is sensitive to raw material price fluctuations and provide scenario analyses.
-
Encourage Cross-Functional Collaboration
- Engage data owners from different departments to validate and explain data.
- Example: Finance teams collaborate with sales and operations to verify revenue forecasts and expense assumptions.
Mind Map: Workflow for Ensuring Data Integrity and Transparency
Example Scenario: Ensuring Data Integrity and Transparency in Budget Reporting
Context: A corporate FP&A team prepares the annual budget for a multinational company.
Steps Taken:
- Data Collection: The team collects departmental budget requests using a standardized template with mandatory fields.
- Validation: Automated checks flag entries where requested expenses exceed prior year actuals by more than 20%, prompting follow-up.
- Documentation: Each department provides notes explaining assumptions behind their requests.
- Version Control: All budget versions are saved in a cloud-based system with tracked changes.
- Review: Cross-functional meetings are held to discuss assumptions and resolve discrepancies.
- Reporting: Final budget reports include an appendix detailing data sources, assumptions, and known limitations.
Outcome: This process ensures that the budget data is accurate, consistent, and transparent, facilitating executive buy-in and smoother approval.
Summary
Maintaining data integrity and transparency is essential for trustworthy FP&A outcomes. By implementing validation controls, standardizing data, securing access, documenting assumptions, and fostering open communication, finance professionals can build confidence in their analyses and support strategic decision-making effectively.
9.3 Example: Navigating Compliance During Budget Approvals
Navigating compliance during budget approvals is a critical step in the financial planning and analysis process. Ensuring that budgets align with regulatory requirements and internal policies helps prevent legal issues, financial penalties, and reputational damage. This section explores practical examples and mind maps to illustrate how FP&A professionals can effectively manage compliance throughout the budget approval cycle.
Understanding Compliance Requirements
Before diving into the budget approval process, it’s essential to identify the key compliance areas relevant to your organization. These typically include:
- Regulatory standards (e.g., SOX, GAAP, IFRS)
- Internal control policies
- Industry-specific financial regulations
- Corporate governance guidelines
Mind Map: Compliance Considerations During Budget Approvals
Example Scenario: A Manufacturing Company’s Budget Approval Process
Context: A mid-sized manufacturing company is preparing its annual budget. The FP&A team must ensure compliance with internal policies and external regulations before presenting the budget to the board.
Steps Taken:
-
Regulatory Review: The FP&A team reviews relevant accounting standards (GAAP) and ensures all budget assumptions comply with these standards.
-
Internal Controls: They implement a multi-level approval process where department heads submit budgets, which are then reviewed by finance managers and finally approved by the CFO.
-
Documentation: Each budget submission includes detailed justifications and supporting documents, creating a clear audit trail.
-
Compliance Checklist: A checklist is used to verify that all regulatory and internal policy requirements are met before final approval.
-
Training: The FP&A team conducts training sessions for department heads on compliance requirements and ethical budgeting practices.
Mind Map: Budget Approval Workflow with Compliance Checks
Practical Tips for Navigating Compliance
-
Automate Compliance Checks: Use budgeting software that integrates compliance rules to flag non-compliant entries automatically.
-
Maintain Clear Documentation: Keep detailed records of all budget versions, approvals, and communications.
-
Engage Compliance Officers Early: Collaborate with legal and compliance teams during budget preparation to identify potential issues.
-
Regular Training: Conduct periodic training sessions to keep all stakeholders updated on compliance requirements.
-
Use Scenario Analysis: Test budgets against different regulatory scenarios to ensure robustness.
Example: Using Software Tools to Enhance Compliance
A financial analyst at a corporate finance firm implemented an FP&A tool with built-in compliance workflows. When department budgets were uploaded, the system automatically checked for:
- Budget line items exceeding predefined thresholds
- Missing approval signatures
- Inconsistencies with prior year budgets
This automation reduced approval cycle time by 30% and minimized compliance errors.
Summary
Navigating compliance during budget approvals requires a structured approach combining regulatory knowledge, internal controls, clear documentation, and effective communication. By integrating best practices and leveraging technology, FP&A professionals can ensure budgets are compliant, transparent, and aligned with corporate governance standards.
9.4 Ethical Challenges in Financial Planning and How to Address Them
Financial planning and analysis (FP&A) professionals face a variety of ethical challenges that can impact the integrity of financial data, decision-making processes, and ultimately, the trust stakeholders place in the organization. Understanding these challenges and proactively addressing them is critical to maintaining ethical standards and ensuring sustainable business success.
Common Ethical Challenges in FP&A
Data Manipulation
Description: Altering financial data to present a more favorable picture than reality.
Example: An FP&A analyst inflates projected sales figures to secure additional budget for their department, which later leads to cash flow issues.
How to Address:
- Implement strong internal controls and audit trails.
- Foster a culture of transparency where accuracy is valued over short-term gains.
- Use automated systems that reduce manual data entry errors or intentional manipulation.
Conflict of Interest
Description: When personal interests interfere with professional duties.
Example: A financial analyst recommends investments in a company where they hold shares, without disclosing this to management.
How to Address:
- Require disclosure of potential conflicts.
- Establish clear policies and consequences.
- Rotate responsibilities to minimize risk.
Confidentiality Breaches
Description: Sharing sensitive financial information with unauthorized parties.
Example: An FP&A team member shares upcoming budget cuts with friends outside the company, leading to insider trading.
How to Address:
- Enforce strict access controls.
- Conduct regular training on data privacy.
- Use secure communication channels.
Pressure to Meet Targets
Description: Manipulating forecasts or budgets under pressure from management.
Example: A financial analyst is pressured to produce overly optimistic forecasts to satisfy investor expectations.
How to Address:
- Encourage realistic and data-driven forecasting.
- Promote open communication about risks and uncertainties.
- Protect analysts from retaliation when reporting concerns.
Misrepresentation of Information
Description: Providing incomplete or biased financial reports.
Example: Omitting potential risks in a financial model to secure project approval.
How to Address:
- Adopt standardized reporting frameworks.
- Include risk assessments and scenario analyses.
- Encourage peer reviews and cross-checks.
Mind Map: Strategies to Address Ethical Challenges
Summary
Ethical challenges in FP&A can undermine the credibility of financial information and damage stakeholder trust. By recognizing common pitfalls such as data manipulation, conflicts of interest, confidentiality breaches, pressure to meet targets, and misrepresentation, FP&A professionals can implement robust controls, foster ethical cultures, and maintain transparency. These practices not only safeguard the organization but also enhance the quality and reliability of financial planning and analysis.
Additional Example: Ethical Dilemma Scenario
Scenario: An FP&A manager discovers that the sales forecast has been deliberately inflated by the sales team to secure a higher budget. The manager faces pressure from senior leadership to overlook this and approve the budget.
Ethical Response: The manager documents the discrepancy, discusses concerns with leadership, and recommends revising the forecast based on realistic data. They also suggest implementing a review process to prevent future occurrences.
This example highlights the importance of courage, transparency, and adherence to ethical standards in FP&A roles.
9.5 Maintaining Confidentiality and Security in Financial Data
Maintaining confidentiality and security in financial data is paramount for any organization, especially within the Finance and Corporate sectors where sensitive information such as budgets, forecasts, salaries, and strategic plans are handled daily. Breaches or leaks can lead to financial loss, reputational damage, and legal consequences.
Key Principles of Financial Data Security
- Confidentiality: Ensuring that sensitive financial information is accessible only to authorized personnel.
- Integrity: Protecting data from unauthorized alteration to maintain accuracy and reliability.
- Availability: Ensuring that authorized users have timely access to data when needed.
Mind Map: Core Components of Financial Data Security
Best Practices for Maintaining Confidentiality and Security
-
Implement Role-Based Access Control (RBAC): Limit access to financial data strictly based on job roles. For example, junior accountants may only view certain reports, while senior analysts and executives have broader access.
-
Use Multi-Factor Authentication (MFA): Add an extra layer of security beyond passwords to prevent unauthorized access.
-
Encrypt Financial Data: Both data at rest (stored data) and data in transit (being transferred over networks) should be encrypted using strong encryption protocols.
-
Regularly Backup Data: Maintain secure backups to prevent data loss from cyberattacks or system failures.
-
Conduct Security Audits and Monitoring: Continuously monitor access logs and use anomaly detection tools to identify suspicious activities.
-
Train Employees: Conduct regular training sessions on security best practices, phishing awareness, and handling sensitive data.
-
Establish Clear Policies: Develop and enforce policies on data handling, sharing, and disposal.
-
Ensure Regulatory Compliance: Adhere to relevant financial and data protection regulations such as SOX (Sarbanes-Oxley Act) and GDPR.
Example 1: Role-Based Access Control in Practice
A multinational corporation implemented RBAC by categorizing employees into groups such as ‘Finance Analysts,’ ‘Accountants,’ ‘Finance Managers,’ and ‘Executives.’ Each group was assigned specific permissions:
- Finance Analysts: Access to detailed financial models and forecasts.
- Accountants: Access to transactional data and ledger entries.
- Finance Managers: Access to consolidated reports and budgeting tools.
- Executives: Access to high-level dashboards and strategic financial data.
This structure minimized the risk of unauthorized data exposure and ensured accountability.
Example 2: Encryption and Secure Data Transmission
A financial services firm adopted end-to-end encryption for all financial reports shared between departments and external auditors. They used VPNs and SSL/TLS protocols to secure data in transit and encrypted databases to protect stored data. This approach prevented interception and unauthorized access during data exchange.
Mind Map: Employee Training Focus Areas
Example 3: Incident Response and Continuous Improvement
An accounting department discovered an attempted phishing attack targeting financial staff. Thanks to prior training, the employee recognized the suspicious email and reported it immediately. The IT security team responded by blocking the sender, resetting passwords, and conducting a company-wide refresher training. This incident highlighted the importance of preparedness and continuous education.
Summary
Maintaining confidentiality and security in financial data requires a multi-layered approach combining technology, policies, and human factors. By implementing robust access controls, encryption, regular audits, and ongoing employee training, organizations can protect sensitive financial information and uphold trust with stakeholders.
For financial analysts and accountants, understanding and applying these best practices not only safeguards data but also enhances the credibility and reliability of financial planning and analysis activities.
10. Continuous Improvement and Professional Development in FP&A
10.1 Best Practice: Establishing a Culture of Continuous Learning
In the fast-evolving field of Financial Planning and Analysis (FP&A), establishing a culture of continuous learning is essential for maintaining a competitive edge, improving accuracy, and fostering innovation. Continuous learning encourages FP&A professionals to stay updated with the latest tools, methodologies, and industry trends, while also promoting adaptability and critical thinking.
Why Continuous Learning Matters in FP&A
- Rapid Market Changes: Financial markets and corporate environments change quickly; staying informed helps anticipate risks and opportunities.
- Technological Advancements: New software, automation, and AI tools require ongoing skill upgrades.
- Regulatory Updates: Compliance requirements evolve, necessitating regular training.
- Improved Decision-Making: Knowledge growth leads to better financial models, forecasts, and strategic insights.
Key Components to Establish a Culture of Continuous Learning
Practical Steps to Foster Continuous Learning
-
Create Structured Learning Programs: Develop regular training sessions tailored to FP&A skills such as financial modeling, forecasting techniques, and data analytics.
-
Encourage Cross-Functional Collaboration: Promote knowledge exchange between FP&A, accounting, sales, and operations teams to broaden perspectives.
-
Leverage Technology: Use e-learning platforms and LMS to provide on-demand courses and track progress.
-
Implement Mentorship Programs: Pair junior analysts with experienced professionals to facilitate hands-on learning.
-
Promote a Feedback Culture: Regularly review performance and encourage open discussions about learning needs and challenges.
-
Recognize and Reward Learning Efforts: Celebrate certifications, course completions, and innovative contributions to motivate continuous improvement.
Example: How a Corporate FP&A Team Established Continuous Learning
Background: A corporate FP&A team noticed increasing complexity in forecasting due to market volatility and new regulatory requirements.
Actions Taken:
- Launched monthly “FP&A Learning Hours” where team members present new tools or case studies.
- Subscribed to industry-specific financial analytics webinars.
- Introduced a mentorship program pairing senior analysts with new hires.
- Adopted an LMS platform offering courses on advanced Excel, Power BI, and financial regulations.
- Incorporated learning goals into annual performance reviews.
Outcome:
- Improved forecasting accuracy by 15% within one year.
- Enhanced team engagement and reduced turnover.
- Faster adoption of new technologies and methodologies.
Mind Map: Example Implementation Plan for Continuous Learning in FP&A
Additional Example: Cross-Training to Enhance FP&A Agility
A financial analyst was cross-trained in data visualization tools used by the marketing team. This enabled the FP&A team to create more insightful dashboards that combined financial and marketing data, improving the quality of strategic recommendations.
Summary
Establishing a culture of continuous learning within FP&A teams is not a one-time initiative but an ongoing commitment. By embedding structured learning opportunities, encouraging knowledge sharing, leveraging technology, and fostering leadership support, organizations can build resilient FP&A functions capable of navigating complex financial landscapes with confidence and agility.
10.2 Example: Implementing Feedback Loops to Enhance FP&A Processes
Feedback loops are essential mechanisms within Financial Planning and Analysis (FP&A) that enable continuous improvement by systematically capturing, analyzing, and acting upon insights from financial data, stakeholder inputs, and process outcomes. Implementing effective feedback loops helps FP&A teams refine budgeting, forecasting, and reporting processes, leading to more accurate financial plans and stronger alignment with business objectives.
What is a Feedback Loop in FP&A?
A feedback loop in FP&A is a cyclical process where outputs (such as forecasts, budgets, or reports) are reviewed and evaluated, and the insights gained are used to improve future financial planning activities. This iterative process fosters adaptability and responsiveness.
Mind Map: Components of an FP&A Feedback Loop
Step-by-Step Example: Implementing a Feedback Loop in a Quarterly Forecasting Process
-
Data Collection: After the quarter ends, the FP&A team gathers actual financial results and compares them against the forecast.
-
Analysis: The team performs variance analysis to identify significant deviations. For example, sales revenue was 8% below forecast due to delayed product launches.
-
Communication: Findings are shared in a cross-functional meeting involving sales, marketing, and operations to understand underlying causes.
-
Action: Based on insights, the FP&A team adjusts the forecasting assumptions for the next quarter, incorporating updated sales timelines.
-
Monitoring: The team tracks the accuracy of the revised forecast and documents lessons learned for future cycles.
Mind Map: Quarterly Forecast Feedback Loop Example
Additional Example: Enhancing Budget Accuracy Through Feedback Loops
-
Scenario: A corporate FP&A team noticed consistent overestimation of operating expenses in the annual budget.
-
Implementation: They introduced a feedback loop where department heads review actual expenses monthly and provide explanations for variances.
-
Outcome: This ongoing dialogue allowed the FP&A team to refine expense assumptions and improve the next budget cycle’s accuracy by 12%.
Mind Map: Budget Accuracy Feedback Loop
Best Practices for Implementing Feedback Loops in FP&A
- Establish Clear Metrics: Define KPIs to measure the effectiveness of financial plans and forecasts.
- Encourage Open Communication: Foster a culture where stakeholders feel comfortable sharing honest feedback.
- Use Technology: Leverage FP&A software to automate data collection and streamline analysis.
- Document Learnings: Maintain a repository of insights and improvements for institutional memory.
- Iterate Regularly: Schedule feedback sessions at consistent intervals (e.g., monthly, quarterly).
By embedding feedback loops into FP&A processes, finance professionals can create a dynamic environment that continuously adapts to business realities, enhances forecast accuracy, and supports strategic decision-making.
10.3 Leveraging Industry Benchmarks and Networking Opportunities
In the realm of Financial Planning and Analysis (FP&A), staying competitive and informed is crucial. Leveraging industry benchmarks and networking opportunities allows FP&A professionals to gain valuable insights, improve their processes, and build relationships that foster professional growth.
Understanding Industry Benchmarks
Industry benchmarks are standards or points of reference derived from the performance metrics of comparable companies within the same sector. These benchmarks help organizations evaluate their financial health, operational efficiency, and strategic positioning.
Benefits of Using Industry Benchmarks:
- Identify performance gaps
- Set realistic targets
- Inform budgeting and forecasting
- Support strategic decision-making
Example: A financial analyst at a retail company compares the company’s gross margin percentage against the industry average of 40%. If the company’s margin is 35%, this signals an opportunity to investigate cost control or pricing strategies.
Mind Map: Industry Benchmarks Utilization
How to Leverage Industry Benchmarks Effectively
- Identify Relevant Benchmarks: Choose metrics that align closely with your company’s business model and strategic goals.
- Source Reliable Data: Use reputable databases, industry reports, and financial publications.
- Analyze Variances: Understand why your company deviates from the benchmark.
- Integrate Findings: Incorporate insights into budgeting, forecasting, and strategic planning.
Example: A corporate FP&A team uses benchmarking data from a financial services association to compare their expense ratios. Discovering they are 5% higher than peers, they initiate a cost optimization project.
Networking Opportunities for FP&A Professionals
Networking is a powerful tool to exchange knowledge, discover best practices, and gain career advancement opportunities.
Types of Networking Opportunities:
- Industry Conferences and Seminars
- Professional Associations (e.g., AFP, CFA Institute)
- Online Communities and Forums
- Internal Cross-Functional Meetings
- Webinars and Workshops
Example: An accountant attends an annual FP&A conference where they learn about emerging forecasting tools and connect with peers who share successful implementation strategies.
Mind Map: Networking Opportunities
Best Practices for Networking
- Be Proactive: Reach out to peers and industry leaders.
- Prepare Your Elevator Pitch: Clearly communicate your role and interests.
- Follow Up: Maintain connections through emails or social media.
- Share Knowledge: Offer insights and assistance to others.
Example: A financial analyst joins a LinkedIn FP&A group, actively participates in discussions, and later collaborates with a peer on a benchmarking project that improves forecasting accuracy.
Integrating Benchmarks and Networking
Networking can enhance your ability to access and interpret industry benchmarks. Peers often share unpublished data, insights on trends, and practical advice on applying benchmarks.
Example: During a professional association meeting, an FP&A manager learns about a new benchmarking report tailored for the technology sector, which they then use to refine their company’s financial targets.
Summary
Leveraging industry benchmarks and networking opportunities empowers FP&A professionals to:
- Make informed, data-driven decisions
- Stay updated on industry trends and best practices
- Build valuable professional relationships
- Enhance their career growth and organizational impact
By systematically incorporating these practices, accountants and financial analysts can elevate the effectiveness and strategic value of their financial planning and analysis functions.
10.4 Certifications and Training for FP&A Professionals
Financial Planning & Analysis (FP&A) professionals operate in a dynamic environment that demands a strong blend of technical skills, business acumen, and strategic thinking. To stay competitive and effective, continuous education through certifications and training is essential. This section explores key certifications, training options, and how they enhance FP&A capabilities.
Key Certifications for FP&A Professionals
-
Certified Corporate FP&A Professional (FP&A)
- Offered by the Association for Financial Professionals (AFP).
- Focuses specifically on FP&A skills including budgeting, forecasting, financial modeling, and business partnering.
- Recognized globally as a standard for FP&A expertise.
-
Chartered Financial Analyst (CFA)
- Administered by the CFA Institute.
- Deep dive into investment analysis, portfolio management, and financial ethics.
- Valuable for FP&A professionals involved in strategic investment decisions.
-
Certified Management Accountant (CMA)
- Offered by the Institute of Management Accountants (IMA).
- Emphasizes management accounting, financial planning, analysis, control, and decision support.
- Highly relevant for FP&A professionals focusing on internal financial management.
-
Financial Modeling & Valuation Analyst (FMVA)
- Provided by the Corporate Finance Institute (CFI).
- Practical training on financial modeling, valuation, Excel skills, and scenario analysis.
- Ideal for FP&A professionals who build and use financial models regularly.
-
Project Management Professional (PMP)
- Offered by the Project Management Institute (PMI).
- Enhances skills in managing projects, timelines, and resources.
- Useful for FP&A professionals leading cross-functional financial initiatives.
Mind Map: Certifications Overview
Training Programs and Workshops
- In-House Training: Many corporations offer tailored FP&A training programs that focus on company-specific processes, tools, and strategic priorities.
- Online Courses: Platforms like Coursera, LinkedIn Learning, and Udemy provide flexible courses on financial analysis, Excel, data visualization, and forecasting.
- Workshops and Bootcamps: Intensive, hands-on sessions focusing on financial modeling, dashboard creation, and advanced Excel techniques.
Example: How Certification Transformed an FP&A Career
Sarah, a financial analyst at a mid-sized manufacturing firm, pursued the FP&A certification to deepen her budgeting and forecasting skills. After completing the program, she introduced rolling forecasts and scenario planning to her team. This led to a 15% improvement in forecast accuracy and earned her a promotion to FP&A Manager.
Mind Map: Training & Career Impact
Best Practices for Selecting Certifications and Training
- Align with Career Goals: Choose certifications that complement your current role and future aspirations.
- Consider Industry Relevance: Some certifications carry more weight in specific industries or regions.
- Evaluate Time and Cost: Balance the investment against potential career benefits.
- Leverage Employer Support: Many organizations sponsor certifications and training for their employees.
- Commit to Lifelong Learning: FP&A is evolving rapidly; continuous education is key to staying relevant.
Summary
Certifications and training are powerful tools for FP&A professionals to sharpen their skills, increase their value to organizations, and advance their careers. Whether through specialized FP&A credentials, broader financial certifications, or targeted training programs, investing in professional development pays dividends in accuracy, insight, and leadership.
10.5 Preparing for the Future: Adapting to Changing Business Environments
In the fast-paced world of finance and corporate sectors, preparing for the future is not just about forecasting numbers but also about adapting to evolving business environments. Financial Planning and Analysis (FP&A) professionals must develop agility, embrace innovation, and anticipate changes to remain relevant and drive business success.
Key Areas to Focus on for Future-Readiness
Embracing Agility in FP&A Processes
Best Practice: Adopt rolling forecasts and flexible budgeting to quickly respond to market shifts.
Example: A retail company faced sudden supply chain disruptions. By using rolling forecasts updated monthly instead of annual static budgets, the FP&A team quickly reallocated resources, adjusted inventory plans, and minimized financial impact.
Leveraging Technology and Automation
Best Practice: Integrate AI-driven analytics and cloud-based platforms to enhance forecasting accuracy and collaboration.
Example: A financial services firm implemented AI-powered predictive analytics to identify emerging market trends. This allowed their FP&A team to anticipate revenue fluctuations and advise leadership proactively.
Cultivating Continuous Learning and Skill Development
Best Practice: Encourage FP&A professionals to pursue certifications (e.g., CFA, FP&A Certification) and stay updated on industry trends.
Example: An FP&A team instituted quarterly knowledge-sharing sessions where members presented recent market developments and new tools, fostering a culture of continuous improvement.
Enhancing Strategic Thinking and Scenario Planning
Best Practice: Use comprehensive scenario planning to prepare for multiple potential futures, incorporating risk assessments and market dynamics.
Example: A manufacturing company developed three scenarios—optimistic, base, and pessimistic—considering factors like raw material costs and geopolitical risks. This enabled the FP&A team to recommend contingency plans aligned with each scenario.
Strengthening Collaboration and Communication
Best Practice: Foster strong relationships with cross-functional teams and tailor financial insights to diverse audiences.
Example: An FP&A analyst worked closely with marketing and operations to understand campaign impacts on sales, translating complex financial data into clear, actionable insights for non-financial managers.
Summary
Preparing for the future in FP&A means building agility, leveraging cutting-edge technology, committing to continuous learning, applying strategic foresight, and enhancing collaboration. By embedding these best practices into daily workflows, FP&A professionals can effectively navigate changing business landscapes and contribute to sustainable organizational success.