Financial Benchmarking for Accountants
1. Introduction to Financial Benchmarking
1.1 What is Financial Benchmarking?
Financial benchmarking is the process of comparing an organization’s financial metrics, performance indicators, and practices against those of peers, industry standards, or best-in-class companies. The goal is to identify areas of strength, uncover opportunities for improvement, and drive strategic decision-making to enhance financial health and operational efficiency.
At its core, financial benchmarking helps accountants and financial analysts understand how well their organization is performing relative to others, providing a data-driven foundation for continuous improvement.
Mind Map: Core Concept of Financial Benchmarking
Why is Financial Benchmarking Important?
- Performance Measurement: Understand where your company stands in terms of profitability, liquidity, efficiency, and solvency.
- Goal Setting: Establish realistic and competitive financial targets.
- Best Practice Identification: Learn from industry leaders and adopt proven financial strategies.
- Risk Management: Detect financial vulnerabilities early by comparing with stable peers.
Mind Map: Importance of Financial Benchmarking
Example 1: Comparing Profit Margins in Retail
Imagine a mid-sized retail company, “RetailCo,” wants to understand how its profitability compares to competitors. RetailCo calculates its net profit margin at 5%. By benchmarking against industry averages, which stand at 7%, RetailCo realizes there is room to improve operational efficiency or pricing strategies.
This insight prompts RetailCo’s finance team to analyze cost structures and identify areas to reduce expenses, such as renegotiating supplier contracts or optimizing inventory management.
Example 2: Liquidity Benchmarking for a Manufacturing Firm
A manufacturing company, “BuildIt,” monitors its current ratio (current assets divided by current liabilities) to ensure it can meet short-term obligations. BuildIt’s current ratio is 1.2, but the industry benchmark is 1.5.
This difference signals potential liquidity risk. The finance team investigates working capital management, focusing on accelerating receivables and managing payables more effectively.
Mind Map: Financial Benchmarking Process Overview
Summary
Financial benchmarking is a vital tool for accountants and financial analysts to objectively evaluate financial performance. By systematically comparing key financial metrics with relevant benchmarks, organizations can uncover actionable insights that lead to improved profitability, risk mitigation, and strategic growth.
This foundational understanding sets the stage for deeper exploration into benchmarking techniques, metrics, and best practices throughout this blog.
1.2 Importance of Benchmarking in Accounting and Finance
Financial benchmarking is a critical practice for accountants and financial analysts as it provides a structured approach to measuring performance, identifying gaps, and driving continuous improvement. Understanding its importance helps finance professionals leverage benchmarking to enhance decision-making, optimize financial health, and maintain competitive advantage.
Why Benchmarking Matters in Accounting and Finance
- Performance Measurement: Benchmarking allows organizations to compare their financial metrics against industry standards or competitors, revealing strengths and weaknesses.
- Goal Setting: It helps set realistic, data-driven financial targets aligned with market realities.
- Cost Control: Identifies areas where expenses exceed norms, enabling targeted cost reduction.
- Risk Management: Highlights financial vulnerabilities by contrasting with peers, aiding proactive risk mitigation.
- Strategic Planning: Informs long-term financial strategies by understanding where the company stands relative to competitors.
- Stakeholder Confidence: Demonstrates transparency and accountability to investors, auditors, and regulators.
Mind Map: Importance of Financial Benchmarking
Practical Example 1: Improving Profit Margins through Benchmarking
A mid-sized manufacturing company noticed its net profit margin was consistently below the industry average. By benchmarking against competitors, the finance team discovered that their cost of goods sold (COGS) was 15% higher due to inefficient supplier contracts.
Action Taken: Renegotiated supplier agreements and optimized inventory management.
Result: Reduced COGS by 10%, improving net profit margin closer to industry benchmarks.
Mind Map: Example - Profit Margin Improvement
Practical Example 2: Enhancing Liquidity Ratios
An accounting team at a retail chain benchmarked their current ratio against industry peers and found it significantly lower, indicating potential liquidity issues.
Action Taken: Implemented tighter credit control policies and accelerated receivables collection.
Result: Improved current ratio from 1.1 to 1.5, aligning with industry standards and reducing short-term liquidity risk.
Mind Map: Example - Liquidity Ratio Enhancement
Summary
Benchmarking in accounting and finance is indispensable for uncovering performance gaps, setting achievable goals, and driving financial excellence. By systematically comparing financial data with peers and industry standards, finance professionals can make informed decisions that enhance profitability, liquidity, and overall financial stability.
Incorporating benchmarking into regular financial analysis not only supports operational improvements but also builds trust with stakeholders by demonstrating a commitment to transparency and continuous improvement.
1.3 Types of Financial Benchmarks: Internal vs External
Financial benchmarking is a critical practice for accountants and financial analysts aiming to evaluate performance, identify improvement areas, and make informed decisions. Understanding the types of financial benchmarks is foundational to applying benchmarking effectively. Broadly, financial benchmarks fall into two categories: Internal and External. Each type serves distinct purposes and offers unique insights.
Internal Benchmarking
Internal benchmarking involves comparing financial metrics within the same organization across different periods, departments, business units, or product lines. This type of benchmarking helps organizations track progress over time, identify best practices internally, and promote consistency.
Key Characteristics:
- Uses historical data or data from different segments within the company.
- Focuses on continuous improvement by learning from internal successes.
- Helps in setting realistic targets based on past performance.
Example:
A manufacturing company compares its quarterly operating margins across three plants to identify which plant is performing best and why. Plant A has an operating margin of 15%, Plant B 12%, and Plant C 18%. By analyzing Plant C’s cost controls and process efficiencies, the company can replicate these practices elsewhere.
Mind Map: Internal Benchmarking
External Benchmarking
External benchmarking compares an organization’s financial performance against other companies, competitors, or industry standards. This approach helps identify where the company stands in the market, uncover competitive advantages or weaknesses, and adopt industry best practices.
Key Characteristics:
- Uses publicly available data, industry reports, or benchmarking databases.
- Helps set aspirational goals based on peer performance.
- Provides insights into market trends and competitive positioning.
Example:
A retail chain compares its inventory turnover ratio with the industry average of 8 times per year. The company’s ratio is 5 times, indicating slower inventory movement. This insight prompts the company to review its stock management and promotional strategies.
Mind Map: External Benchmarking
Combined Use of Internal and External Benchmarking
For a comprehensive financial analysis, accountants often combine both internal and external benchmarking. This dual approach enables organizations to understand their historical performance and competitive standing simultaneously.
Example:
A software company tracks its R&D expense as a percentage of revenue internally over five years (internal benchmarking) and compares it with the industry average (external benchmarking). If the company’s R&D spend is increasing but still below the industry average, it may decide to allocate more resources to innovation to remain competitive.
Mind Map: Integrated Benchmarking Approach
Summary Table of Internal vs External Benchmarking
| Aspect | Internal Benchmarking | External Benchmarking |
|---|---|---|
| Data Source | Company’s own historical or segment data | Competitors, industry reports, public data |
| Purpose | Track progress, improve internal processes | Understand market position, adopt best practices |
| Frequency | Regular (monthly, quarterly, yearly) | Periodic (annual, bi-annual) |
| Examples | Comparing departmental profit margins over time | Comparing debt-to-equity ratio with industry average |
| Benefits | Identifies internal strengths and weaknesses | Highlights competitive gaps and opportunities |
By mastering both internal and external financial benchmarking, accountants and financial analysts can provide richer insights, drive strategic improvements, and support sustainable growth.
1.4 Overview of Key Financial Metrics Used in Benchmarking
Financial benchmarking hinges on selecting the right metrics to evaluate and compare performance effectively. These metrics provide quantifiable insights into various aspects of a company’s financial health, efficiency, and profitability. Below is a detailed overview of the key financial metrics commonly used in benchmarking, accompanied by mind maps and practical examples.
Mind Map: Key Financial Metrics Categories
Profitability Ratios
These ratios measure a company’s ability to generate earnings relative to sales, assets, and equity.
- Gross Margin = (Revenue - Cost of Goods Sold) / Revenue
- Example: A company with $1,000,000 revenue and $600,000 COGS has a gross margin of 40%.
- Operating Margin = Operating Income / Revenue
- Example: Operating income of $150,000 on $1,000,000 revenue results in 15% operating margin.
- Net Profit Margin = Net Income / Revenue
- Example: Net income of $80,000 on $1,000,000 revenue results in 8% net margin.
Liquidity Ratios
Liquidity ratios assess a company’s ability to meet short-term obligations.
- Current Ratio = Current Assets / Current Liabilities
- Example: Current assets of $300,000 and current liabilities of $200,000 yield a current ratio of 1.5.
- Quick Ratio = (Current Assets - Inventory) / Current Liabilities
- Example: If inventory is $50,000, quick ratio = (300,000 - 50,000) / 200,000 = 1.25.
Efficiency Ratios
These ratios evaluate how well a company uses its assets and manages its liabilities.
- Asset Turnover = Revenue / Average Total Assets
- Example: Revenue of $1,000,000 and average assets of $500,000 results in asset turnover of 2.0.
- Inventory Turnover = Cost of Goods Sold / Average Inventory
- Example: COGS of $600,000 and average inventory of $150,000 results in inventory turnover of 4.0.
Leverage Ratios
Leverage ratios measure the extent of a company’s debt relative to equity and its ability to cover interest expenses.
- Debt to Equity Ratio = Total Debt / Total Equity
- Example: Total debt of $400,000 and equity of $600,000 results in 0.67 debt to equity ratio.
- Interest Coverage Ratio = EBIT / Interest Expense
- Example: EBIT of $120,000 and interest expense of $30,000 results in a coverage ratio of 4.0.
Market Value Ratios
These ratios provide insights into how the market values the company’s shares relative to earnings.
- Earnings Per Share (EPS) = (Net Income - Dividends on Preferred Stock) / Average Outstanding Shares
- Example: Net income of $80,000, no preferred dividends, and 40,000 shares outstanding results in EPS of $2.00.
- Price to Earnings Ratio (P/E) = Market Price per Share / Earnings Per Share
- Example: Market price of $40 per share and EPS of $2 results in a P/E ratio of 20.
Integrated Example: Benchmarking a Mid-Sized Company
| Metric | Company A | Industry Average | Interpretation |
|---|---|---|---|
| Gross Margin | 40% | 38% | Slightly better cost control |
| Current Ratio | 1.5 | 1.8 | Slightly less liquid than peers |
| Asset Turnover | 2.0 | 1.7 | More efficient asset utilization |
| Debt to Equity Ratio | 0.67 | 0.5 | Higher leverage, moderate risk |
| EPS | $2.00 | $1.80 | Stronger earnings per share |
This example shows how an accountant or financial analyst can use these metrics to identify strengths and weaknesses relative to industry benchmarks, guiding strategic decisions.
Summary
Understanding and utilizing key financial metrics is foundational to effective benchmarking. By combining profitability, liquidity, efficiency, leverage, and market value ratios, accountants can paint a comprehensive picture of financial health and performance relative to peers. Practical examples and mind maps help clarify these concepts and facilitate their application in real-world scenarios.
1.5 Common Challenges and Pitfalls in Financial Benchmarking
Financial benchmarking is a powerful tool for accountants and financial analysts to evaluate performance, identify gaps, and drive improvements. However, several challenges and pitfalls can undermine the effectiveness of benchmarking efforts if not properly addressed. This section explores these common issues with clear examples and mind maps to help you navigate them successfully.
Challenge 1: Inaccurate or Inconsistent Data
One of the biggest pitfalls in financial benchmarking is relying on inaccurate or inconsistent data. Benchmarking depends heavily on the quality of financial data collected both internally and from external peers.
- Example: Comparing revenue figures without adjusting for different fiscal year-ends or accounting policies can lead to misleading conclusions.
Mind Map: Data Accuracy Challenges
Challenge 2: Selecting Inappropriate Benchmarking Peers
Choosing the wrong companies or industries for comparison can skew benchmarking results and reduce relevance.
- Example: Benchmarking a small regional retailer against a multinational retail giant without adjusting for scale and market differences.
Mind Map: Peer Selection Pitfalls
Challenge 3: Overlooking Contextual Differences
Financial metrics don’t exist in a vacuum. Ignoring contextual factors such as economic conditions, regulatory environment, or company lifecycle stage can lead to incorrect interpretations.
- Example: A startup’s lower profitability compared to established firms might be normal due to heavy reinvestment phases.
Mind Map: Contextual Factors to Consider
Challenge 4: Focusing Solely on Quantitative Metrics
While financial ratios and numbers are critical, ignoring qualitative factors such as management quality, customer satisfaction, or innovation can provide an incomplete picture.
- Example: A company with strong profitability but poor customer retention might face long-term risks not visible in financial ratios alone.
Mind Map: Balancing Quantitative and Qualitative
Challenge 5: Misinterpreting Benchmarking Results
Misreading benchmarking data or jumping to conclusions without deeper analysis can lead to poor decision-making.
- Example: Seeing a lower asset turnover ratio and immediately deciding to cut assets without investigating underlying causes such as recent capital investments.
Mind Map: Common Misinterpretations
Challenge 6: Lack of Continuous Benchmarking
Treating benchmarking as a one-time exercise rather than an ongoing process limits its value.
- Example: Conducting benchmarking once a year and missing out on emerging trends or early warning signs.
Mind Map: Continuous Benchmarking Benefits
Summary Table of Challenges and Solutions
| Challenge | Description | Best Practice Example |
|---|---|---|
| Inaccurate Data | Poor data quality leads to unreliable benchmarks | Validate data sources; adjust for accounting differences |
| Inappropriate Peers | Comparing dissimilar companies or industries | Select peers with similar size, market, and business model |
| Ignoring Context | Missing economic or company-specific factors | Incorporate qualitative context in analysis |
| Quantitative Focus Only | Overlooking qualitative insights | Combine financial ratios with management and customer data |
| Misinterpretation | Drawing wrong conclusions without deeper analysis | Perform root cause analysis before decisions |
| One-Time Benchmarking | Not updating benchmarks regularly | Establish continuous benchmarking cycles |
By anticipating and addressing these common challenges, accountants and financial analysts can harness the full power of financial benchmarking to drive meaningful insights and strategic improvements.
2. Preparing for Financial Benchmarking
2.1 Defining Objectives and Scope of Benchmarking
Financial benchmarking is a powerful tool that helps accountants and financial analysts measure their organization’s performance against peers, industry standards, or historical data. However, the effectiveness of benchmarking depends heavily on clearly defining the objectives and scope before diving into data collection and analysis. This section will guide you through how to set precise objectives and determine the appropriate scope for your benchmarking project, supported by mind maps and practical examples.
Why Define Objectives and Scope?
- Focus: Clear objectives prevent scope creep and ensure efforts are targeted.
- Relevance: Ensures benchmarking aligns with strategic goals.
- Efficiency: Saves time and resources by concentrating on meaningful metrics.
Step 1: Identifying Benchmarking Objectives
Objectives are the ‘why’ behind your benchmarking exercise. They clarify what you want to achieve and guide the entire process.
Common Benchmarking Objectives:
- Improve profitability
- Enhance liquidity management
- Optimize operational efficiency
- Reduce costs
- Identify best practices
- Support budgeting and forecasting
- Manage financial risks
Mind Map: Benchmarking Objectives
Step 2: Defining the Scope of Benchmarking
Scope defines the boundaries of your benchmarking project — what will be included and excluded.
Key Considerations for Scope:
- Financial Areas: Which financial functions or metrics will be benchmarked? (e.g., profitability, liquidity, leverage)
- Time Frame: Are you benchmarking current performance, historical trends, or future projections?
- Peer Group: Which companies, industries, or internal departments will you compare against?
- Data Granularity: Will you use aggregated financial statements or detailed line-item data?
- Geographical Scope: Domestic, regional, or global benchmarking?
Mind Map: Benchmarking Scope
Step 3: Aligning Objectives and Scope with Business Strategy
The objectives and scope should directly support your organization’s strategic priorities. For example, if a company is focused on growth, benchmarking might emphasize revenue growth rates and R&D spend efficiency.
Practical Example 1: Mid-Sized Manufacturing Company
Objective: Improve operational efficiency and reduce costs.
Scope:
- Financial Areas: Efficiency ratios (asset turnover, inventory turnover), cost of goods sold
- Time Frame: Last 3 years
- Peer Group: Similar-sized manufacturers in the same region
- Data Granularity: Detailed line-item data
- Geography: Regional
This focus allows the company to identify where inefficiencies exist compared to peers and prioritize cost-saving initiatives.
Practical Example 2: Financial Services Firm
Objective: Enhance liquidity management and risk mitigation.
Scope:
- Financial Areas: Liquidity ratios (current ratio, quick ratio), leverage ratios
- Time Frame: Current year and forecast
- Peer Group: Top 10 competitors nationally
- Data Granularity: Aggregated financial statements
- Geography: National
This scope helps the firm monitor its short-term financial health and leverage position relative to competitors.
Tips for Defining Objectives and Scope
- Engage key stakeholders early to ensure alignment.
- Be specific and measurable with objectives.
- Limit scope to manageable areas to avoid overwhelming data collection.
- Revisit and adjust objectives and scope as you gather insights.
Summary
Defining clear objectives and scope is the foundation of a successful financial benchmarking project. It ensures that your efforts are purposeful, aligned with strategic goals, and focused on the most impactful financial areas. Using mind maps can help visualize and communicate these elements effectively within your team.
Next Step: With objectives and scope defined, you can confidently move to identifying relevant data sources and preparing for data collection.
2.2 Identifying Relevant Financial Data Sources
Financial benchmarking hinges on the quality and relevance of the data collected. For accountants and financial analysts, identifying the right financial data sources is a critical step to ensure meaningful comparisons and actionable insights. This section explores key data sources, how to evaluate their relevance, and practical examples to guide you.
Key Financial Data Sources
Below is a mind map illustrating the primary categories of financial data sources:
Internal Data Sources
Internal data is the foundation for benchmarking because it reflects your organization’s actual financial performance.
-
General Ledger: The detailed record of all financial transactions. It is the primary source for preparing financial statements.
-
Financial Statements: These include the income statement, balance sheet, and cash flow statement, which provide summarized financial data essential for benchmarking.
-
Management Reports: Customized reports such as departmental budgets, cost center reports, and variance analyses.
-
ERP Systems: Enterprise Resource Planning systems consolidate financial and operational data, enabling real-time access and integration.
Example:
A mid-sized manufacturing company uses its ERP system to extract monthly income statements and balance sheets. These reports are standardized to ensure consistency before being used to benchmark profitability ratios against industry peers.
External Data Sources
External data provides context and comparators for your internal financial data.
-
Industry Reports: Published by consulting firms, industry associations, or market research companies, these reports offer aggregated financial metrics.
-
Competitor Financials: Publicly available financial statements of competitors, especially for publicly traded companies.
-
Market Data Providers: Services like Bloomberg, S&P Capital IQ, and Thomson Reuters provide extensive financial data and analytics.
-
Regulatory Filings: Filings such as 10-K, 10-Q, and annual reports submitted to regulatory bodies.
-
Benchmarking Databases: Specialized databases that compile financial metrics across companies and industries.
Example:
An accounting team at a retail chain subscribes to a benchmarking database that provides average inventory turnover ratios by retail segment. They use this external data to compare their internal ratios and identify improvement opportunities.
Alternative Data Sources
Incorporating alternative data can enrich benchmarking by adding broader context.
-
Macroeconomic Indicators: GDP growth, inflation rates, and unemployment figures can affect financial performance.
-
ESG Reports: Environmental, social, and governance data increasingly influence financial assessments.
-
Customer and Supplier Data: Payment terms, sales trends, and supplier performance can impact financial ratios.
Example:
A financial analyst includes ESG scores from third-party providers to benchmark the company’s sustainability efforts alongside traditional financial metrics, helping align financial performance with stakeholder expectations.
Evaluating Data Relevance and Quality
When identifying data sources, consider:
- Timeliness: Is the data current and updated regularly?
- Accuracy: Has the data been audited or verified?
- Comparability: Are the data definitions and accounting policies consistent with your own?
- Granularity: Does the data provide the level of detail needed?
- Accessibility: Is the data readily available and cost-effective?
Practical Example: Selecting Data Sources for Benchmarking a Service Company
- Internal Data: Extract monthly profit & loss statements and cash flow reports from the accounting system.
- External Data: Obtain industry average operating margins from a benchmarking database focused on the service sector.
- Alternative Data: Review customer satisfaction scores and correlate with financial performance.
This multi-source approach ensures a comprehensive benchmarking analysis that is both relevant and actionable.
Summary
Identifying relevant financial data sources is a multi-faceted process that requires balancing internal accuracy with external comparability. By leveraging a combination of internal records, external benchmarks, and alternative data, accountants and financial analysts can build robust benchmarking frameworks that drive strategic financial insights.
2.3 Ensuring Data Accuracy and Consistency
Ensuring data accuracy and consistency is a cornerstone of effective financial benchmarking. Without reliable data, any comparison or analysis can lead to misleading conclusions and poor decision-making. This section explores best practices, common pitfalls, and practical examples to help accountants and financial analysts maintain high data integrity throughout the benchmarking process.
Why Data Accuracy and Consistency Matter
- Accurate data ensures that financial metrics truly reflect the company’s performance.
- Consistent data allows for meaningful comparisons across periods, departments, or peer companies.
- Errors or inconsistencies can distort ratios, trends, and ultimately strategic decisions.
Key Practices to Ensure Data Accuracy and Consistency
Mind Map: Ensuring Data Accuracy and Consistency
Practical Examples
Example 1: Source Verification and Reconciliation
A mid-sized manufacturing company prepares benchmarking data for its cost efficiency ratios. The accounting team pulls data from the general ledger but notices discrepancies between the ledger and the bank statements.
- Best Practice Applied: They perform a bank reconciliation to identify timing differences and errors.
- Result: Adjustments are made to correct the ledger balances, ensuring the cost data used in benchmarking is accurate.
Example 2: Standardizing Chart of Accounts Across Departments
A corporate finance team benchmarks operating expenses across multiple subsidiaries. Initially, each subsidiary uses different account codes and definitions.
- Best Practice Applied: The team implements a standardized chart of accounts with clear definitions.
- Result: This consistency allows for apples-to-apples comparison of expenses and more reliable benchmarking insights.
Example 3: Currency Conversion Consistency
A financial analyst benchmarks revenue growth for a multinational company with subsidiaries in different countries.
- Best Practice Applied: All financial data is converted to the parent company’s reporting currency using the same exchange rates for the benchmarking period.
- Result: This avoids distortions caused by fluctuating currency rates and ensures consistent comparison.
Common Pitfalls and How to Avoid Them
Mind Map: Common Pitfalls in Data Accuracy and Consistency
Summary
Ensuring data accuracy and consistency requires a combination of robust processes, clear standards, and the right technology. By verifying sources, standardizing data definitions, and maintaining thorough documentation, accountants and financial analysts can build a trustworthy foundation for financial benchmarking that drives insightful and actionable results.
2.4 Selecting Appropriate Benchmarking Peers and Industries
Selecting the right peers and industries for financial benchmarking is a critical step that directly influences the accuracy, relevance, and usefulness of your benchmarking analysis. This section will guide accountants and financial analysts through best practices for identifying appropriate benchmarking peers and industries, supported by clear examples and mind maps to visualize the decision-making process.
Why Selecting the Right Peers and Industries Matters
- Relevance: Benchmarks must reflect comparable business models, scale, and market conditions.
- Accuracy: Using inappropriate peers can lead to misleading conclusions.
- Actionability: Results should drive meaningful insights and improvement opportunities.
Key Criteria for Selecting Benchmarking Peers
-
Industry Alignment
- Choose companies operating in the same or closely related industries.
- Example: A retail apparel company should benchmark against other retail apparel or fashion companies, not manufacturing or tech firms.
-
Company Size and Scale
- Match peers by revenue, employee count, or asset size.
- Example: A mid-sized regional bank should benchmark against similar-sized banks rather than large multinational banks.
-
Geographic Location
- Consider economic, regulatory, and market differences by region.
- Example: A European manufacturing firm should prioritize European peers to account for regional cost structures and regulations.
-
Business Model Similarity
- Compare companies with similar revenue streams, cost structures, and customer bases.
- Example: A subscription-based SaaS company should benchmark against other subscription-based tech firms, not one-time license software providers.
-
Financial Health and Lifecycle Stage
- Benchmark against peers at similar growth or maturity stages.
- Example: A startup in rapid growth phase should avoid benchmarking against mature, stable companies.
Mind Map: Criteria for Selecting Benchmarking Peers
Mind Map: Process for Selecting Benchmarking Peers
Selecting Appropriate Industries
Sometimes, especially when direct peers are limited, benchmarking across related industries can provide valuable insights. Consider these approaches:
-
Horizontal Benchmarking: Compare similar functions or processes across different industries.
- Example: Comparing accounts receivable turnover between a retail company and a wholesale distributor.
-
Vertical Benchmarking: Compare companies within the same supply chain.
- Example: A component manufacturer benchmarking against an assembly company.
-
Best-in-Class Benchmarking: Identify top performers regardless of industry to adopt innovative practices.
- Example: A corporate finance team learning from tech industry cash flow management.
Example: Selecting Benchmarking Peers for a Mid-Sized Regional Bank
Scenario: A regional bank with $2 billion in assets wants to benchmark its financial performance.
Step 1: Define Objectives
- Improve profitability and asset utilization.
Step 2: Identify Potential Peers
- Other regional banks with assets between $1.5B and $3B.
- Banks operating in similar regulatory environments.
Step 3: Screen Peers
- Exclude banks with significantly different business models (e.g., investment banks).
- Prioritize banks with similar customer demographics.
Step 4: Validate Data
- Use publicly available financial statements and industry reports.
Result: A peer group of 5 regional banks in the same geographic area with comparable asset size and business models.
Example: Benchmarking a SaaS Company Using Related Industries
Scenario: A SaaS startup with limited direct peers wants to benchmark its financial metrics.
Approach:
- Include subscription-based companies in related tech sectors.
- Consider metrics from digital media subscription companies.
- Use best-in-class benchmarks from mature SaaS firms globally.
Outcome: A diversified peer group that provides actionable insights on churn rates, customer acquisition costs, and recurring revenue.
Summary Best Practices
- Start with clear benchmarking objectives.
- Use multiple criteria to select peers for balanced comparison.
- Validate data availability and quality before finalizing peers.
- Consider related industries when direct peers are scarce.
- Document the selection process for transparency and repeatability.
By carefully selecting appropriate benchmarking peers and industries, accountants and financial analysts can ensure their benchmarking exercises yield meaningful, accurate, and actionable insights that drive financial performance improvements.
2.5 Setting Up Benchmarking Teams and Roles
Effective financial benchmarking requires a well-structured team with clearly defined roles to ensure accuracy, efficiency, and actionable insights. This section explores best practices for assembling your benchmarking team, assigning responsibilities, and fostering collaboration.
Why Set Up a Dedicated Benchmarking Team?
- Ensures accountability and ownership of the benchmarking process.
- Leverages diverse expertise for comprehensive analysis.
- Facilitates clear communication and timely decision-making.
Key Roles in a Financial Benchmarking Team
Role Descriptions and Responsibilities
| Role | Responsibilities | Example in Practice |
|---|---|---|
| Project Sponsor | Executive who champions the benchmarking initiative, secures resources, and removes obstacles. | CFO endorses benchmarking to improve cost control and profitability. |
| Benchmarking Manager | Oversees the benchmarking process, coordinates team activities, and ensures deadlines are met. | Finance Manager schedules meetings, tracks progress, and reports status. |
| Data Analyst | Collects, cleans, and prepares financial data for analysis. | Extracts quarterly financial statements and normalizes data formats. |
| Data Quality Specialist | Ensures data accuracy, consistency, and completeness. | Validates data against source systems and flags discrepancies. |
| Financial Analyst | Performs ratio calculations, trend analysis, and interprets benchmarking results. | Compares liquidity ratios against industry peers and identifies gaps. |
| Accountant | Provides detailed accounting insights and ensures compliance with accounting standards. | Explains variances in expense accounts during benchmarking review. |
| BI Specialist | Implements and maintains benchmarking tools and dashboards. | Configures Power BI dashboards to visualize benchmarking KPIs. |
| ERP Administrator | Manages integration of ERP data with benchmarking systems. | Ensures real-time financial data feeds into benchmarking software. |
| Reporting Specialist | Prepares clear, concise reports and presentations for stakeholders. | Creates monthly benchmarking summary reports for the finance committee. |
| Stakeholder Liaison | Facilitates communication between the benchmarking team and other departments or external parties. | Coordinates feedback sessions with operations and sales teams. |
Example Mind Map: Responsibilities Breakdown
Best Practices for Team Setup
- Define Clear Objectives: Align team roles with specific benchmarking goals.
- Ensure Cross-Functional Representation: Include members from accounting, finance, IT, and operations.
- Establish Communication Protocols: Regular meetings, progress updates, and documentation.
- Provide Training: Equip team members with benchmarking methodologies and tools.
- Assign a Single Point of Contact: For streamlined communication and issue resolution.
Real-World Example: Setting Up a Benchmarking Team at a Mid-Sized Manufacturing Firm
Scenario: The finance department aims to benchmark cost efficiency and profitability against industry peers.
- Project Sponsor: CFO initiates the project to improve margins.
- Benchmarking Manager: Senior Financial Analyst appointed to lead.
- Data Analyst & Quality Specialist: Two accountants assigned to extract and validate financial data.
- Financial Analyst: Dedicated analyst to perform ratio and trend analysis.
- BI Specialist: IT team member configures dashboards.
- Reporting Specialist: Finance communications officer prepares reports.
- Stakeholder Liaison: Operations manager ensures alignment with production data.
Outcome: Clear role assignments led to timely data collection, insightful analysis, and actionable recommendations that improved cost controls by 8% within six months.
Summary
Setting up a dedicated benchmarking team with defined roles ensures a structured, efficient, and effective benchmarking process. By leveraging diverse expertise and fostering collaboration, accountants and financial analysts can generate meaningful insights that drive strategic financial improvements.
3. Key Financial Metrics and Ratios for Benchmarking
3.1 Profitability Ratios: Gross Margin, Operating Margin, Net Margin
Profitability ratios are essential financial metrics that help accountants and financial analysts evaluate a company’s ability to generate earnings relative to its revenue, operating costs, and overall expenses. These ratios provide insight into how efficiently a company is managing its resources and controlling costs to maximize profit.
Key Profitability Ratios
- Gross Margin
- Operating Margin
- Net Margin
Gross Margin
Definition: Gross Margin measures the percentage of revenue that exceeds the cost of goods sold (COGS). It reflects how efficiently a company produces or sources its products.
Formula:
Gross Margin = (Revenue - Cost of Goods Sold) / Revenue × 100%
Example:
A company has revenue of $500,000 and COGS of $300,000.
Gross Margin = (($500,000 - $300,000) / $500,000) × 100% = (200,000 / 500,000) × 100% = 40%
This means 40% of the revenue remains after covering the direct costs of production.
Mind Map:
Operating Margin
Definition: Operating Margin measures the percentage of revenue left after covering both COGS and operating expenses (like salaries, rent, utilities). It shows how well the company controls its operating costs.
Formula:
Operating Margin = Operating Income / Revenue × 100%
Where Operating Income = Revenue - COGS - Operating Expenses
Example:
Using the previous example, assume operating expenses are $100,000.
Operating Income = $500,000 - $300,000 - $100,000 = $100,000
Operating Margin = ($100,000 / $500,000) × 100% = 20%
This means 20% of revenue is left after covering production and operating costs.
Mind Map:
Net Margin
Definition: Net Margin shows the percentage of revenue remaining after all expenses, including taxes, interest, and non-operating costs, have been deducted. It reflects the company’s overall profitability.
Formula:
Net Margin = Net Income / Revenue × 100%
Example:
Continuing the example, assume interest and taxes total $30,000.
Net Income = Operating Income - Interest - Taxes = $100,000 - $30,000 = $70,000
Net Margin = ($70,000 / $500,000) × 100% = 14%
This means the company retains 14% of its revenue as profit after all expenses.
Mind Map:
Integrated Example: Profitability Ratios for ABC Corp
| Metric | Amount ($) | Calculation | Ratio (%) |
|---|---|---|---|
| Revenue | 500,000 | - | - |
| Cost of Goods Sold | 300,000 | - | - |
| Operating Expenses | 100,000 | - | - |
| Interest & Taxes | 30,000 | - | - |
| Gross Margin | 200,000 | (500,000 - 300,000) / 500,000 × 100% | 40 |
| Operating Income | 100,000 | 500,000 - 300,000 - 100,000 | - |
| Operating Margin | - | 100,000 / 500,000 × 100% | 20 |
| Net Income | 70,000 | 100,000 - 30,000 | - |
| Net Margin | - | 70,000 / 500,000 × 100% | 14 |
Best Practices for Accountants
- Use consistent time periods: Compare ratios across the same fiscal periods to ensure accuracy.
- Benchmark against industry peers: Understand what is typical for your sector to identify strengths and weaknesses.
- Analyze trends over time: Look at how margins evolve to spot improvements or deteriorations.
- Consider context: High margins may indicate pricing power or efficiency, but very high margins could also signal underinvestment.
Summary Mind Map
By mastering these profitability ratios, accountants and financial analysts can provide valuable insights into a company’s financial health and help guide strategic decision-making.
3.2 Liquidity Ratios: Current Ratio, Quick Ratio with Examples
Liquidity ratios are critical financial metrics that help accountants and financial analysts assess a company’s ability to meet its short-term obligations. These ratios provide insight into the firm’s financial health and operational efficiency.
What are Liquidity Ratios?
Liquidity ratios measure a company’s capacity to pay off its current liabilities with its current assets. They indicate the ease with which assets can be converted into cash to cover short-term debts.
Key Liquidity Ratios
Current Ratio
- Definition: The current ratio compares all current assets to current liabilities.
- Formula: \[ \text{Current Ratio} = \frac{\text{Current Assets}}{\text{Current Liabilities}} \]
- Interpretation: A ratio above 1 indicates that the company has more current assets than current liabilities, suggesting good short-term financial health.
Quick Ratio (Acid-Test Ratio)
- Definition: The quick ratio refines the current ratio by excluding inventory and other less liquid current assets.
- Formula: \[ \text{Quick Ratio} = \frac{\text{Current Assets} - \text{Inventory} - \text{Prepaid Expenses}}{\text{Current Liabilities}} \]
- Interpretation: This ratio provides a more stringent test of liquidity by focusing on assets that can be quickly converted to cash.
Mind Map: Liquidity Ratios Overview
Example 1: Calculating Current Ratio
Company ABC’s Balance Sheet Extract:
| Item | Amount (USD) |
|---|---|
| Cash | 50,000 |
| Accounts Receivable | 80,000 |
| Inventory | 70,000 |
| Prepaid Expenses | 10,000 |
| Current Liabilities | 100,000 |
Calculation:
\[ \text{Current Assets} = 50,000 + 80,000 + 70,000 + 10,000 = 210,000 \]
\[ \text{Current Ratio} = \frac{210,000}{100,000} = 2.1 \]
Interpretation: Company ABC has $2.10 in current assets for every $1 of current liabilities, indicating strong short-term liquidity.
Example 2: Calculating Quick Ratio
Using the same data from Company ABC:
\[ \text{Quick Assets} = 210,000 - 70,000 - 10,000 = 130,000 \]
\[ \text{Quick Ratio} = \frac{130,000}{100,000} = 1.3 \]
Interpretation: Excluding inventory and prepaid expenses, Company ABC still has $1.30 in liquid assets for every $1 of current liabilities, which is generally considered healthy.
Mind Map: Step-by-Step Calculation Process
Best Practices for Using Liquidity Ratios
- Use Industry Benchmarks: Liquidity norms vary by industry; compare ratios against peers.
- Analyze Trends Over Time: Look at liquidity ratios across multiple periods to identify improvements or deteriorations.
- Consider the Nature of Assets: Inventory may not be easily liquidated in some industries, so quick ratio provides a conservative view.
- Combine with Other Ratios: Use liquidity ratios alongside profitability and leverage ratios for a holistic view.
Example: Benchmarking Liquidity Ratios
Scenario: A financial analyst compares Company ABC’s liquidity ratios with industry averages.
| Ratio | Company ABC | Industry Average |
|---|---|---|
| Current Ratio | 2.1 | 1.8 |
| Quick Ratio | 1.3 | 1.2 |
Analysis: Company ABC is performing slightly better than the industry average, suggesting effective short-term financial management.
Summary
Liquidity ratios like the current ratio and quick ratio are essential tools for accountants and financial analysts to evaluate a company’s short-term financial stability. By understanding their calculation, interpretation, and benchmarking, professionals can provide actionable insights to improve financial health.
3.3 Efficiency Ratios: Asset Turnover, Inventory Turnover
Efficiency ratios are critical tools for accountants and financial analysts to assess how effectively a company utilizes its assets to generate sales and manage inventory. Two of the most widely used efficiency ratios are Asset Turnover and Inventory Turnover.
Asset Turnover Ratio
Definition: Asset Turnover Ratio measures how efficiently a company uses its total assets to generate revenue. It indicates the amount of sales generated for every dollar invested in assets.
Formula:
Asset Turnover = Net Sales / Average Total Assets
- Net Sales refers to the revenue from sales minus returns, allowances, and discounts.
- Average Total Assets is usually calculated as (Beginning Assets + Ending Assets) / 2.
Interpretation:
- A higher asset turnover ratio indicates efficient use of assets.
- A lower ratio may suggest underutilized assets or operational inefficiencies.
Example: A mid-sized manufacturing company reports net sales of $5,000,000 for the year. Its total assets at the beginning of the year were $3,000,000 and $3,500,000 at year-end.
Calculate the Asset Turnover:
Average Total Assets = (3,000,000 + 3,500,000) / 2 = 3,250,000
Asset Turnover = 5,000,000 / 3,250,000 = 1.54
This means the company generates $1.54 in sales for every dollar of assets.
Inventory Turnover Ratio
Definition: Inventory Turnover Ratio measures how many times a company sells and replaces its inventory over a period. It reflects inventory management efficiency.
Formula:
Inventory Turnover = Cost of Goods Sold (COGS) / Average Inventory
- COGS is the direct cost attributable to the production of goods sold.
- Average Inventory is (Beginning Inventory + Ending Inventory) / 2.
Interpretation:
- A higher inventory turnover indicates efficient inventory management and strong sales.
- A lower turnover may point to overstocking, obsolescence, or weak sales.
Example: A retail company has a COGS of $2,400,000 for the year. Its inventory was $400,000 at the start and $600,000 at the end of the year.
Calculate the Inventory Turnover:
Average Inventory = (400,000 + 600,000) / 2 = 500,000
Inventory Turnover = 2,400,000 / 500,000 = 4.8
This means the company sold and replenished its inventory nearly 5 times during the year.
Mind Maps
Asset Turnover Ratio Mind Map
Inventory Turnover Ratio Mind Map
Best Practices for Using Efficiency Ratios
- Use Industry Benchmarks: Compare ratios against industry averages to understand relative performance.
- Analyze Trends Over Time: Look at ratios across multiple periods to detect improvements or deteriorations.
- Combine with Other Ratios: Use alongside profitability and liquidity ratios for a comprehensive view.
- Adjust for Seasonality: Consider seasonal effects on sales and inventory levels.
- Normalize Data: Ensure consistent accounting policies when comparing with peers.
Integrated Example: Efficiency Ratios in Action
Consider a mid-sized electronics retailer evaluating its operational efficiency:
- Net Sales: $10,000,000
- Beginning Assets: $4,000,000
- Ending Assets: $4,500,000
- COGS: $6,000,000
- Beginning Inventory: $800,000
- Ending Inventory: $1,000,000
Calculations:
Average Assets = (4,000,000 + 4,500,000) / 2 = 4,250,000
Asset Turnover = 10,000,000 / 4,250,000 = 2.35

Average Inventory = (800,000 + 1,000,000) / 2 = 900,000
Inventory Turnover = 6,000,000 / 900,000 = 6.67
Interpretation:
- The asset turnover of 2.35 indicates the company generates $2.35 in sales per dollar of assets, which is strong compared to the industry average of 1.8.
- The inventory turnover of 6.67 suggests efficient inventory management, turning over stock more than six times a year.
This analysis helps the accountant identify that the company is effectively using its assets and managing inventory, supporting positive operational decisions.
By mastering efficiency ratios like Asset Turnover and Inventory Turnover, accountants and financial analysts can provide valuable insights into operational performance and help guide strategic financial decisions.
3.4 Leverage Ratios: Debt to Equity, Interest Coverage
Leverage ratios are critical financial metrics that help accountants and financial analysts understand the extent to which a company is using debt to finance its operations and growth. These ratios provide insight into the financial risk and stability of a business by measuring its debt levels relative to equity and its ability to meet interest obligations.
Key Leverage Ratios
- Debt to Equity Ratio (D/E): Measures the proportion of a company’s financing that comes from debt compared to shareholders’ equity.
- Interest Coverage Ratio: Indicates how easily a company can pay interest on its outstanding debt with its operating income.
Debt to Equity Ratio (D/E)
Formula:
\[ \text{Debt to Equity Ratio} = \frac{\text{Total Debt}}{\text{Total Equity}} \]
- Total Debt includes both short-term and long-term borrowings.
- Total Equity is the shareholders’ equity from the balance sheet.
Interpretation:
- A higher D/E ratio means more leverage and potentially higher financial risk.
- A lower D/E ratio indicates a more conservative capital structure.
Example:
Company A has:
- Total Debt = $500,000
- Total Equity = $1,000,000
\[ D/E = \frac{500,000}{1,000,000} = 0.5 \]
This means Company A uses 50 cents of debt for every dollar of equity.
Interest Coverage Ratio
Formula:
\[ \text{Interest Coverage Ratio} = \frac{\text{EBIT}}{\text{Interest Expense}} \]
- EBIT: Earnings Before Interest and Taxes (also called operating income).
- Interest Expense: Cost of debt financing.
Interpretation:
- A higher ratio indicates better ability to cover interest payments.
- A ratio below 1 suggests the company is not generating enough operating income to cover interest expenses, signaling financial distress.
Example:
Company B has:
- EBIT = $120,000
- Interest Expense = $30,000
\[ \text{Interest Coverage} = \frac{120,000}{30,000} = 4 \]
Company B can cover its interest expense 4 times over, indicating healthy debt servicing capacity.
Mind Map: Understanding Leverage Ratios
Mind Map: Calculating Debt to Equity Ratio
Mind Map: Interpreting Interest Coverage Ratio
Best Practices for Using Leverage Ratios
- Contextualize with Industry Benchmarks: Different industries have varying norms for acceptable leverage.
- Combine with Other Ratios: Use alongside liquidity and profitability ratios for a holistic view.
- Trend Analysis: Monitor leverage ratios over multiple periods to detect changes in financial risk.
- Adjust for Off-Balance Sheet Items: Consider leases or other obligations that may affect true leverage.
Integrated Example: Benchmarking Leverage Ratios for a Mid-Sized Manufacturing Firm
| Metric | Company X | Industry Average | Interpretation |
|---|---|---|---|
| Debt to Equity Ratio | 0.8 | 0.6 | Slightly higher leverage than average, indicating more debt reliance |
| Interest Coverage Ratio | 3.5 | 4.0 | Slightly below average, but still adequate to cover interest expenses |
Analysis: Company X has a moderately higher debt level compared to peers, which could increase financial risk if earnings decline. However, its interest coverage ratio suggests it currently manages debt servicing well. The company should monitor earnings closely and consider strategies to improve operating income or reduce debt to align with industry standards.
By mastering leverage ratios like Debt to Equity and Interest Coverage, accountants and financial analysts can provide valuable insights into a company’s financial health, risk exposure, and capital structure decisions.
3.5 Market Value Ratios: Earnings Per Share, Price to Earnings Ratio
Market value ratios are critical tools for accountants and financial analysts to evaluate a company’s financial health from the perspective of investors. These ratios help in understanding how the market values a company’s earnings and growth potential.
Earnings Per Share (EPS)
Definition: Earnings Per Share (EPS) measures the portion of a company’s profit allocated to each outstanding share of common stock. It is a direct indicator of a company’s profitability on a per-share basis.
Formula: \[ EPS = \frac{Net\ Income - Preferred\ Dividends}{Weighted\ Average\ Shares\ Outstanding} \]
Example: Imagine Company ABC reported a net income of $5,000,000 for the year. It paid $500,000 in preferred dividends and has 2,000,000 weighted average shares outstanding.
\[ EPS = \frac{5,000,000 - 500,000}{2,000,000} = \frac{4,500,000}{2,000,000} = 2.25 \]
So, Company ABC earned $2.25 per share.
Price to Earnings Ratio (P/E Ratio)
Definition: The Price to Earnings (P/E) ratio indicates how much investors are willing to pay per dollar of earnings. It reflects market expectations about a company’s future growth and risk.
Formula: \[ P/E = \frac{Market\ Price\ per\ Share}{Earnings\ Per\ Share} \]
Example: If Company ABC’s current market price per share is $45 and its EPS is $2.25 (from the previous example), then:
\[ P/E = \frac{45}{2.25} = 20 \]
This means investors are willing to pay 20 times the earnings per share for Company ABC’s stock.
Mind Maps
Mind Map 1: Earnings Per Share (EPS)
Mind Map 2: Price to Earnings Ratio (P/E Ratio)
Best Practices for Accountants and Financial Analysts
- Use Consistent Data: Always ensure net income and shares outstanding are from the same reporting period.
- Consider Dilution: Use diluted EPS when convertible securities might impact share count.
- Compare Within Industry: P/E ratios vary widely by sector; benchmark against peers.
- Look Beyond P/E: Combine with other ratios like PEG (Price/Earnings to Growth) for deeper insight.
- Adjust for One-Time Items: Exclude extraordinary gains/losses for normalized EPS.
Integrated Example: Evaluating Two Companies
| Metric | Company X | Company Y |
|---|---|---|
| Net Income | $10,000,000 | $8,000,000 |
| Preferred Dividends | $1,000,000 | $0 |
| Shares Outstanding | 4,000,000 | 2,000,000 |
| Market Price per Share | $60 | $50 |
Calculate EPS:
-
Company X: \[ EPS = \frac{10,000,000 - 1,000,000}{4,000,000} = \frac{9,000,000}{4,000,000} = 2.25 \]
-
Company Y: \[ EPS = \frac{8,000,000 - 0}{2,000,000} = 4.00 \]
Calculate P/E:
-
Company X: \[ P/E = \frac{60}{2.25} = 26.67 \]
-
Company Y: \[ P/E = \frac{50}{4.00} = 12.5 \]
Interpretation:
- Company X has a higher P/E ratio, indicating the market expects higher growth or perceives lower risk.
- Company Y has a higher EPS but lower P/E, possibly signaling undervaluation or higher risk.
This example highlights how EPS and P/E together provide a nuanced view of market valuation.
By mastering these market value ratios, accountants and financial analysts can better communicate company performance to investors and support strategic financial decisions.
3.6 Practical Example: Calculating and Comparing Ratios for a Mid-Sized Company
In this section, we will walk through a practical example of calculating key financial ratios for a mid-sized company, “ABC Manufacturing Ltd.”, and compare these ratios against industry benchmarks to assess the company’s financial health.
Company Overview:
- Name: ABC Manufacturing Ltd.
- Industry: Manufacturing
- Fiscal Year: 2023
- Key Financial Data:
- Revenue: $50,000,000
- Cost of Goods Sold (COGS): $30,000,000
- Operating Expenses: $10,000,000
- Net Income: $5,000,000
- Current Assets: $15,000,000
- Current Liabilities: $10,000,000
- Inventory: $4,000,000
- Total Assets: $60,000,000
- Total Debt: $20,000,000
- Shareholders’ Equity: $40,000,000
- Interest Expense: $1,000,000
- Number of Shares Outstanding: 1,000,000
- Market Price Per Share: $30
Step 1: Calculate Key Financial Ratios
Profitability Ratios
-
Gross Margin = (Revenue - COGS) / Revenue
- = ($50,000,000 - $30,000,000) / $50,000,000 = 0.40 or 40%
-
Operating Margin = (Revenue - COGS - Operating Expenses) / Revenue
- = ($50,000,000 - $30,000,000 - $10,000,000) / $50,000,000 = 0.20 or 20%
-
Net Margin = Net Income / Revenue
- = $5,000,000 / $50,000,000 = 0.10 or 10%
Liquidity Ratios
-
Current Ratio = Current Assets / Current Liabilities
- = $15,000,000 / $10,000,000 = 1.5
-
Quick Ratio = (Current Assets - Inventory) / Current Liabilities
- = ($15,000,000 - $4,000,000) / $10,000,000 = 1.1
Efficiency Ratios
-
Asset Turnover = Revenue / Total Assets
- = $50,000,000 / $60,000,000 = 0.83
-
Inventory Turnover = COGS / Inventory
- = $30,000,000 / $4,000,000 = 7.5
Leverage Ratios
-
Debt to Equity Ratio = Total Debt / Shareholders’ Equity
- = $20,000,000 / $40,000,000 = 0.5
-
Interest Coverage Ratio = EBIT / Interest Expense
- EBIT = Revenue - COGS - Operating Expenses = $50,000,000 - $30,000,000 - $10,000,000 = $10,000,000
- Interest Coverage = $10,000,000 / $1,000,000 = 10
Market Value Ratios
-
Earnings Per Share (EPS) = Net Income / Number of Shares Outstanding
- = $5,000,000 / 1,000,000 = $5.00
-
Price to Earnings (P/E) Ratio = Market Price Per Share / EPS
- = $30 / $5 = 6
Step 2: Compare Ratios to Industry Benchmarks
| Ratio | ABC Manufacturing | Industry Benchmark | Interpretation |
|---|---|---|---|
| Gross Margin | 40% | 38% | Slightly better profitability on production costs |
| Operating Margin | 20% | 18% | Efficient control of operating expenses |
| Net Margin | 10% | 9% | Healthy bottom-line profitability |
| Current Ratio | 1.5 | 1.8 | Adequate liquidity but slightly below ideal |
| Quick Ratio | 1.1 | 1.2 | Reasonable short-term liquidity |
| Asset Turnover | 0.83 | 0.9 | Slightly less efficient asset use |
| Inventory Turnover | 7.5 | 6.5 | Better inventory management |
| Debt to Equity Ratio | 0.5 | 0.6 | Conservative leverage |
| Interest Coverage | 10 | 8 | Strong ability to cover interest expenses |
| EPS | $5.00 | $4.50 | Higher earnings per share |
| P/E Ratio | 6 | 10 | Potential undervaluation or lower growth expectations |
Step 3: Visual Mind Map of Ratio Categories and Insights
Financial Ratios Mind Map
Step 4: Best Practices Illustrated
- Use Multiple Ratios for Holistic Analysis: Don’t rely on a single ratio; combining profitability, liquidity, efficiency, leverage, and market ratios gives a full picture.
- Compare Against Relevant Industry Benchmarks: Ensure benchmarks are from similar-sized companies in the same industry.
- Contextualize the Numbers: For example, a lower P/E ratio may indicate undervaluation or growth concerns.
- Track Trends Over Time: Ratios should be compared across multiple periods to identify improvements or deteriorations.
- Validate Data Accuracy: Always verify financial data before calculating ratios.
Summary
This example demonstrated how accountants and financial analysts can calculate and interpret key financial ratios for a mid-sized company. By comparing these ratios against industry benchmarks, professionals can identify strengths and weaknesses, enabling informed decision-making and strategic planning.
4. Benchmarking Methodologies and Best Practices
4.1 Quantitative vs Qualitative Benchmarking Approaches
Financial benchmarking is a powerful tool for accountants and financial analysts to evaluate performance, identify gaps, and drive improvements. Understanding the two primary approaches—quantitative and qualitative benchmarking—is essential for a comprehensive analysis.
What is Quantitative Benchmarking?
Quantitative benchmarking involves the use of numerical data and measurable financial metrics to compare performance against peers or standards. This approach focuses on hard data such as ratios, percentages, and absolute values.
Key Characteristics:
- Relies on financial statements and numerical indicators
- Enables objective comparison
- Often used for trend analysis and variance identification
Common Quantitative Metrics:
- Profit margins (gross, operating, net)
- Liquidity ratios (current ratio, quick ratio)
- Efficiency ratios (asset turnover, inventory turnover)
- Leverage ratios (debt to equity, interest coverage)
Example: A mid-sized manufacturing company compares its gross margin (40%) to the industry average (35%). The higher margin indicates better cost control or pricing power.
What is Qualitative Benchmarking?
Qualitative benchmarking focuses on non-numerical factors that influence financial performance. It involves evaluating processes, management practices, organizational culture, and other intangible elements.
Key Characteristics:
- Uses descriptive data, surveys, interviews, and observations
- Provides context behind the numbers
- Helps identify best practices and operational strengths or weaknesses
Common Qualitative Factors:
- Quality of financial reporting and controls
- Effectiveness of budgeting and forecasting processes
- Employee expertise and training
- Customer satisfaction and supplier relationships
Example: An accounting team conducts interviews to understand why a competitor has a faster month-end close process, revealing the use of automated reconciliation tools and cross-training staff.
Mind Map: Quantitative vs Qualitative Benchmarking
Integrating Quantitative and Qualitative Approaches
For a holistic benchmarking exercise, combining both approaches is best practice. Quantitative data highlights what is happening, while qualitative insights explain why.
Example: A retail company notices its inventory turnover ratio is below industry average (4 times vs 6 times). Quantitative benchmarking flags the issue. Qualitative benchmarking through staff interviews reveals outdated inventory management software and lack of supplier communication as root causes.
Best Practices for Using Both Approaches
- Start with quantitative benchmarking to identify key performance gaps.
- Use qualitative methods to explore underlying causes and contextual factors.
- Document findings in an integrated report combining metrics and narratives.
- Regularly update benchmarks to reflect changes in both data and practices.
Summary Table: Quantitative vs Qualitative Benchmarking
| Aspect | Quantitative Benchmarking | Qualitative Benchmarking |
|---|---|---|
| Data Type | Numerical, measurable | Descriptive, observational |
| Tools | Financial ratios, spreadsheets, BI tools | Surveys, interviews, process mapping |
| Purpose | Measure performance, identify gaps | Understand causes, identify best practices |
| Example Metric | Debt to Equity Ratio | Quality of internal controls |
| Typical Outcome | Performance scorecards | Recommendations for process improvements |
By mastering both quantitative and qualitative benchmarking approaches, accountants and financial analysts can deliver richer insights and more actionable recommendations, ultimately driving stronger financial performance and strategic decision-making.
4.2 Time-Series vs Cross-Sectional Benchmarking
Financial benchmarking is a powerful tool for accountants and financial analysts to evaluate performance, identify trends, and make informed decisions. Two fundamental approaches to benchmarking are Time-Series Benchmarking and Cross-Sectional Benchmarking. Understanding the differences, applications, and best practices of each is essential for effective financial analysis.
What is Time-Series Benchmarking?
Time-Series Benchmarking involves comparing a company’s financial metrics over different periods. This approach focuses on tracking performance trends within the same organization across multiple time frames, such as months, quarters, or years.
Purpose:
- Identify growth patterns or declines
- Detect seasonal effects
- Monitor the impact of strategic initiatives over time
Example: A company tracks its gross profit margin over the last five years:
| Year | Gross Profit Margin |
|---|---|
| 2019 | 40% |
| 2020 | 38% |
| 2021 | 42% |
| 2022 | 45% |
| 2023 | 43% |
From this, the accountant can observe an overall upward trend with a slight dip in 2023, prompting further investigation.
What is Cross-Sectional Benchmarking?
Cross-Sectional Benchmarking compares a company’s financial metrics against those of peer companies or industry standards at a single point in time.
Purpose:
- Assess relative competitive position
- Identify performance gaps compared to industry leaders
- Set realistic targets based on peer performance
Example: A financial analyst compares the current ratio of their company with three competitors in the same industry for the year 2023:
| Company | Current Ratio |
|---|---|
| Your Company | 1.5 |
| Competitor A | 1.8 |
| Competitor B | 1.3 |
| Competitor C | 1.6 |
This reveals that your company has a healthy liquidity position but lags slightly behind Competitor A.
Mind Map: Time-Series Benchmarking
Mind Map: Cross-Sectional Benchmarking
Combining Time-Series and Cross-Sectional Benchmarking
For a comprehensive analysis, accountants often combine both approaches:
- Use time-series to understand internal performance trends.
- Use cross-sectional to evaluate market position and competitive standing.
Example: A retail company notices declining inventory turnover over the last three years (time-series). Cross-sectional benchmarking reveals competitors maintain higher turnover rates, signaling inefficiencies in inventory management.
Best Practices for Both Approaches
- Ensure data comparability by standardizing accounting policies.
- Adjust for one-time events or extraordinary items.
- Use visual tools like trend lines and bar charts to communicate findings.
- Regularly update benchmarks to reflect current market conditions.
Summary Table
| Aspect | Time-Series Benchmarking | Cross-Sectional Benchmarking |
|---|---|---|
| Focus | Same company over multiple periods | Different companies at a single point in time |
| Purpose | Track trends, seasonality, internal changes | Assess competitive position, identify gaps |
| Common Metrics | Revenue growth, profit margins over time | Liquidity, leverage, efficiency ratios |
| Example | Gross margin trend over 5 years | Current ratio comparison among peers |
| Best Practice | Consistent data, inflation adjustment | Peer selection, data normalization |
By mastering both time-series and cross-sectional benchmarking, accountants and financial analysts can deliver richer insights, drive strategic decisions, and enhance financial performance management.
4.3 Using Industry Standards and Published Benchmarks
Financial benchmarking is most effective when accountants leverage established industry standards and published benchmarks. These benchmarks provide a reliable reference point, enabling organizations to gauge their financial performance against peers and industry norms.
What Are Industry Standards and Published Benchmarks?
- Industry Standards: Agreed-upon financial metrics and ratios commonly accepted within a specific sector.
- Published Benchmarks: Data sets or reports released by authoritative bodies, research firms, or industry associations that summarize typical financial performance indicators.
Why Use Industry Standards and Published Benchmarks?
- Consistency: Ensures comparisons are made on a level playing field.
- Credibility: Data from reputable sources increases confidence in analysis.
- Time Efficiency: Saves time compared to building benchmarks from scratch.
- Insightful: Highlights trends and best practices specific to the industry.
Sources of Industry Standards and Published Benchmarks
- Trade Associations: e.g., American Institute of CPAs (AICPA), National Retail Federation (NRF)
- Financial Data Providers: Bloomberg, S&P Capital IQ, Thomson Reuters
- Government Agencies: U.S. Securities and Exchange Commission (SEC), Bureau of Economic Analysis (BEA)
- Consulting Firms: Deloitte, PwC, McKinsey publish industry reports
- Industry Publications: Industry-specific journals and magazines
Mind Map: Using Industry Standards and Published Benchmarks
Best Practices for Using Published Benchmarks
- Select Relevant Benchmarks: Choose benchmarks that match your company’s size, geography, and sub-industry.
- Validate Data Currency: Use the most recent data to reflect current market conditions.
- Normalize Data: Adjust for accounting differences or extraordinary items to ensure comparability.
- Combine Multiple Benchmarks: Use a mix of sources to get a comprehensive view.
- Document Assumptions: Keep track of any adjustments or assumptions made during benchmarking.
Example: Benchmarking a Mid-Sized Manufacturing Company
Scenario: An accountant at a mid-sized manufacturing firm wants to benchmark the company’s profitability and efficiency.
Step 1: Identify relevant industry benchmarks from the National Association of Manufacturers (NAM) and S&P Capital IQ.
Step 2: Extract key ratios such as Gross Margin, Operating Margin, and Inventory Turnover.
| Metric | Company Value | NAM Benchmark | S&P Capital IQ Benchmark |
|---|---|---|---|
| Gross Margin | 32% | 30% | 31% |
| Operating Margin | 12% | 15% | 14% |
| Inventory Turnover | 5.2 | 6.0 | 5.8 |
Step 3: Analyze gaps — the company’s operating margin is below benchmarks, indicating potential cost control issues.
Step 4: Investigate further by reviewing expense categories and operational processes.
Mind Map: Example Benchmarking Process
Additional Example: Retail Sector Benchmarking
A financial analyst at a retail chain uses published benchmarks from the National Retail Federation (NRF) to compare sales per square foot and inventory turnover.
| Metric | Company Value | NRF Benchmark |
|---|---|---|
| Sales per Square Foot | $450 | $500 |
| Inventory Turnover | 8.5 | 9.0 |
The company’s sales per square foot is slightly below the industry benchmark, signaling opportunities to improve store layout or product mix.
Summary
Using industry standards and published benchmarks allows accountants and financial analysts to perform meaningful financial benchmarking with credible and relevant data. By carefully selecting, validating, and applying these benchmarks, finance professionals can identify performance gaps, support decision-making, and drive continuous improvement.
4.4 Incorporating Trend Analysis for Dynamic Benchmarking
Trend analysis is a powerful technique that enhances financial benchmarking by adding a temporal dimension to the evaluation process. Instead of comparing static snapshots of financial data, trend analysis examines how key financial metrics evolve over time, enabling accountants and financial analysts to identify patterns, detect early warning signs, and make proactive decisions.
What is Trend Analysis?
Trend analysis involves tracking financial ratios and metrics across multiple periods (months, quarters, years) to observe directional movements, cyclical patterns, or anomalies. This dynamic approach helps benchmark performance not only against peers but also against the company’s own historical data.
Why Incorporate Trend Analysis in Benchmarking?
- Early Detection of Performance Shifts: Identifies upward or downward trends before they become critical.
- Contextualizes Benchmark Comparisons: Helps differentiate between temporary fluctuations and sustained changes.
- Supports Strategic Forecasting: Provides a foundation for more accurate budgeting and forecasting.
Mind Map: Key Components of Trend Analysis in Financial Benchmarking
Step-by-Step Example: Using Trend Analysis to Benchmark Operating Margin
Scenario: A mid-sized manufacturing company wants to benchmark its operating margin over the past 5 years against the industry average to understand its competitive position and identify improvement opportunities.
- Collect Data:
- Company’s operating margin for each of the last 5 years.
- Industry average operating margin for the same period.
| Year | Company Operating Margin (%) | Industry Average Operating Margin (%) |
|---|---|---|
| 2019 | 12.5 | 14.0 |
| 2020 | 11.0 | 13.5 |
| 2021 | 13.0 | 14.2 |
| 2022 | 14.5 | 14.8 |
| 2023 | 15.0 | 15.0 |
- Visualize Trends:
Company vs Industry Operating Margin Trend
2019 | Company: 12.5% Industry: 14.0%
2020 | Company: 11.0% Industry: 13.5%
2021 | Company: 13.0% Industry: 14.2%
2022 | Company: 14.5% Industry: 14.8%
2023 | Company: 15.0% Industry: 15.0%
(Line graph showing company margin rising steadily from 11% to 15%, closing gap with industry average)
-
Analyze:
- The company’s operating margin dipped in 2020 but has shown a consistent upward trend since.
- The gap between the company and industry average narrowed from 2.5% in 2019 to 0% in 2023.
-
Interpretation:
- The upward trend indicates successful operational improvements.
- The company is now on par with the industry, suggesting competitive strength.
-
Actionable Insights:
- Continue initiatives that improved margins.
- Investigate 2020 dip causes to mitigate future risks.
Mind Map: Trend Analysis Workflow
Best Practices for Incorporating Trend Analysis
- Use Consistent Time Periods: Ensure data intervals align (monthly, quarterly, yearly) for valid comparisons.
- Normalize Data for Seasonality: Adjust for seasonal effects to avoid misleading conclusions.
- Combine with Peer Benchmarking: Compare trends against industry peers to contextualize performance.
- Leverage Visual Tools: Use dashboards and graphs to communicate trends effectively.
- Regularly Update Data: Maintain up-to-date trend data to support timely decision-making.
Additional Example: Detecting Liquidity Issues via Trend Analysis
A financial analyst tracks the company’s current ratio over 8 quarters:
| Quarter | Current Ratio |
|---|---|
| Q1 2022 | 2.1 |
| Q2 2022 | 1.9 |
| Q3 2022 | 1.7 |
| Q4 2022 | 1.5 |
| Q1 2023 | 1.3 |
| Q2 2023 | 1.1 |
| Q3 2023 | 0.9 |
| Q4 2023 | 0.8 |
Insight: The downward trend signals deteriorating liquidity, prompting an investigation into cash flow management and working capital optimization.
Incorporating trend analysis into financial benchmarking transforms static comparisons into dynamic, actionable insights, empowering accountants and financial analysts to drive continuous performance improvements and strategic agility.
4.5 Best Practice: Combining Financial and Non-Financial Metrics
Financial benchmarking traditionally focuses on quantitative financial data such as revenue, profit margins, and liquidity ratios. However, to gain a holistic and actionable insight into a company’s performance, it is essential to integrate non-financial metrics alongside financial ones. This combined approach helps accountants and financial analysts understand the underlying drivers of financial results and identify areas for sustainable improvement.
Why Combine Financial and Non-Financial Metrics?
- Broader Performance Insight: Financial metrics show outcomes, while non-financial metrics explain the processes and behaviors leading to those outcomes.
- Early Warning Signals: Non-financial indicators often reveal issues before they impact financial results.
- Balanced Scorecard Approach: Aligns financial goals with operational, customer, and employee perspectives.
Mind Map: Combining Financial and Non-Financial Metrics
Key Non-Financial Metrics to Consider
| Category | Example Metrics | Why It Matters |
|---|---|---|
| Customer | Net Promoter Score (NPS), Retention Rate | Customer loyalty impacts revenue stability |
| Employee | Turnover Rate, Training Hours | Employee satisfaction affects productivity |
| Operational | Cycle Time, Defect Rates | Operational efficiency drives cost control |
| Innovation | R&D Spend as % of Revenue, New Product Launches | Innovation fuels future growth |
Example: Retail Company Benchmarking
- Financial Metric: Gross Margin = 40%
- Non-Financial Metric: Customer Satisfaction Score = 75/100
Insight: While the gross margin is healthy, the customer satisfaction score is moderate. Benchmarking against peers shows top competitors have scores above 85, indicating potential risk to future sales. The company can prioritize improving customer experience to sustain financial performance.
Mind Map: Example - Retail Company Benchmarking
Best Practices for Integration
- Align Metrics with Strategic Objectives: Choose non-financial metrics that directly influence financial outcomes.
- Ensure Data Quality: Non-financial data should be collected systematically and consistently.
- Use Visualization Tools: Dashboards combining both metric types improve understanding and communication.
- Regular Review Cycles: Update benchmarks and metrics frequently to reflect changing business conditions.
Example: Manufacturing Firm
- Financial Metric: Operating Margin = 12%
- Non-Financial Metric: Defect Rate = 3%
By benchmarking defect rates against industry standards (typically 1-2%), the firm identifies quality issues impacting costs and customer satisfaction. Addressing defects leads to improved margins and competitive positioning.
Mind Map: Manufacturing Firm Example
Summary
Combining financial and non-financial metrics in benchmarking provides accountants and financial analysts with a comprehensive understanding of business performance. This integrated approach uncovers root causes behind financial results, enabling more informed decision-making and fostering sustainable growth.
4.6 Example: Benchmarking a Retail Company Using Multiple Methods
In this section, we will explore how a retail company can effectively use multiple benchmarking methods to gain comprehensive insights into its financial performance. We will combine quantitative and qualitative approaches, use time-series and cross-sectional benchmarking, and integrate financial and non-financial metrics.
Step 1: Define the Benchmarking Objectives
The retail company aims to:
- Assess profitability compared to industry peers
- Evaluate operational efficiency over time
- Understand customer satisfaction impact on financial results
Step 2: Select Benchmarking Methods
- Quantitative Benchmarking: Analyze financial ratios such as gross margin, inventory turnover, and operating margin.
- Qualitative Benchmarking: Review customer service ratings and employee satisfaction surveys.
- Time-Series Benchmarking: Compare the company’s financial metrics over the last 3 years.
- Cross-Sectional Benchmarking: Compare current year metrics against top 5 competitors.
Step 3: Collect Data
- Financial statements (income statement, balance sheet)
- Industry reports for competitor data
- Customer satisfaction scores from surveys
- Employee engagement results
Step 4: Analyze Quantitative Metrics
Financial Ratios Calculation Example (Current Year):
| Metric | Retail Company | Industry Average | Top Competitor |
|---|---|---|---|
| Gross Margin (%) | 42 | 45 | 47 |
| Inventory Turnover | 6 | 7 | 8 |
| Operating Margin (%) | 8 | 10 | 12 |
Interpretation:
- The company’s gross margin is slightly below industry average, indicating potential pricing or cost issues.
- Inventory turnover is lower, suggesting slower stock movement.
- Operating margin lags competitors, highlighting operational inefficiencies.
Step 5: Conduct Qualitative Benchmarking
- Customer satisfaction score: 78/100 (Industry average: 85)
- Employee engagement score: 70/100 (Industry average: 75)
Insight:
Lower customer and employee satisfaction may be contributing to weaker financial performance.
Step 6: Time-Series Benchmarking
Example: Operating Margin Over 3 Years
Insight:
Operating margin has improved steadily but still trails industry benchmarks, indicating progress but room for improvement.
Step 7: Cross-Sectional Benchmarking Mind Map
Step 8: Integrate Financial and Non-Financial Metrics
By combining financial ratios with customer and employee satisfaction scores, the company can pinpoint that improving service quality and workforce engagement could enhance profitability and efficiency.
Step 9: Actionable Recommendations
- Implement targeted training programs to boost employee engagement.
- Optimize inventory management to increase turnover.
- Enhance customer experience initiatives to raise satisfaction scores.
Summary Mind Map of Benchmarking Approach
This example demonstrates how using multiple benchmarking methods provides a 360-degree view of the retail company’s financial health and operational effectiveness, enabling accountants and financial analysts to develop well-rounded improvement strategies.
5. Tools and Technologies for Financial Benchmarking
5.1 Spreadsheet Models and Templates for Benchmarking
Financial benchmarking relies heavily on well-structured spreadsheet models and templates. These tools enable accountants and financial analysts to organize data, perform calculations, visualize trends, and compare performance metrics efficiently. In this section, we will explore best practices for building and using spreadsheet models for benchmarking, supported by mind maps and practical examples.
Why Use Spreadsheet Models for Benchmarking?
- Flexibility: Customize formulas, layouts, and data inputs.
- Transparency: Easy to audit and understand calculations.
- Accessibility: Widely available tools like Microsoft Excel and Google Sheets.
- Visualization: Built-in charting and conditional formatting.
Key Components of a Benchmarking Spreadsheet Model
Best Practices for Building Benchmarking Templates
-
Structured Data Input Sheets:
- Separate raw data from calculations.
- Use clear labels and consistent formats.
-
Automated Ratio Calculations:
- Predefine formulas for key financial ratios.
- Use named ranges for clarity.
-
Normalization Techniques:
- Adjust for currency, accounting policies, or company size.
- Example: Convert all figures to a common currency using exchange rates.
-
Dynamic Dashboards:
- Use pivot tables and charts to summarize data.
- Apply conditional formatting to highlight outliers.
-
Documentation and Instructions:
- Include a ‘Read Me’ tab explaining how to use the model.
- Track changes and version history.
Example: Simple Financial Benchmarking Template
Suppose you want to benchmark a company’s profitability ratios against industry averages.
| Metric | Company A | Industry Average | Variance (%) |
|---|---|---|---|
| Gross Margin (%) | 45 | 50 | -10 |
| Operating Margin (%) | 12 | 15 | -20 |
| Net Margin (%) | 8 | 10 | -20 |
Steps to build this in a spreadsheet:
- Input raw financial data (Revenue, COGS, Operating Expenses, Net Income).
- Calculate margins using formulas:
- Gross Margin = (Revenue - COGS) / Revenue * 100
- Operating Margin = Operating Income / Revenue * 100
- Net Margin = Net Income / Revenue * 100
- Input industry averages manually or import from external data.
- Calculate variance as ((Company - Industry) / Industry) * 100.
- Use conditional formatting to highlight negative variances in red.
Mind Map: Workflow for Using Spreadsheet Templates in Benchmarking
Advanced Example: Multi-Company Benchmarking Template
Imagine benchmarking multiple competitors across several financial metrics.
| Company | Revenue ($M) | Net Income ($M) | ROA (%) | Debt to Equity |
|---|---|---|---|---|
| Company A | 500 | 50 | 8 | 1.2 |
| Company B | 450 | 40 | 7 | 1.5 |
| Company C | 520 | 60 | 9 | 1.1 |
| Industry Avg. | 490 | 45 | 8 | 1.3 |
Features to include:
- Drop-down menus to select companies for comparison.
- Automated calculation of averages and variances.
- Graphical comparison using bar charts or radar charts.
- Scenario analysis by adjusting input assumptions.
Tips for Effective Spreadsheet Benchmarking Models
- Use data validation to prevent input errors.
- Protect formula cells to avoid accidental changes.
- Regularly update industry benchmark data.
- Keep models simple and intuitive for easy adoption.
- Document assumptions and sources clearly.
By mastering spreadsheet models and templates, accountants and financial analysts can streamline their benchmarking processes, improve accuracy, and deliver actionable insights to stakeholders.
5.2 Financial Benchmarking Software and Platforms
Financial benchmarking software and platforms have revolutionized how accountants and financial analysts perform comparative analyses. These tools streamline data collection, automate calculations, and provide visual insights, enabling more accurate and timely benchmarking.
Why Use Financial Benchmarking Software?
- Efficiency: Automates repetitive tasks like data normalization and ratio calculations.
- Accuracy: Reduces human error in computations and data handling.
- Data Integration: Connects with ERP, accounting, and BI systems for real-time data.
- Visualization: Offers dashboards and reports that simplify interpretation.
- Collaboration: Facilitates sharing insights across teams and stakeholders.
Key Features to Look For
Popular Financial Benchmarking Software and Platforms
| Software | Description | Example Use Case |
|---|---|---|
| Adaptive Insights | Cloud-based FP&A platform with benchmarking modules and real-time analytics | A retail company uses it to compare quarterly margins against industry peers. |
| Fathom | Financial analysis and management reporting tool with benchmarking features | A mid-sized manufacturing firm benchmarks efficiency ratios to optimize asset use. |
| KPI Fire | Performance management software with customizable benchmarking dashboards | A service company tracks liquidity ratios monthly to maintain healthy cash flow. |
| QuickBooks Advanced | Accounting software with built-in benchmarking reports and peer comparisons | Small businesses compare profitability ratios to similar-sized companies. |
| Domo | BI platform integrating financial data for benchmarking and visualization | A multinational uses Domo to benchmark across subsidiaries and regions. |
Example: Using Fathom to Benchmark a Manufacturing Firm
- Data Import: Connect Fathom to the firm’s accounting software to import financial statements.
- Select Metrics: Choose key ratios like asset turnover, gross margin, and debt to equity.
- Peer Group Setup: Define a peer group within the manufacturing industry.
- Dashboard Creation: Build a dashboard showing current performance vs. peers.
- Analysis: Identify underperforming metrics and drill down into root causes.
- Reporting: Generate a report to share with management highlighting improvement areas.
Best Practices When Using Benchmarking Software
- Ensure Data Quality: Regularly validate data inputs to maintain accuracy.
- Customize Benchmarks: Tailor peer groups and metrics to your specific industry and company size.
- Leverage Automation: Use automated alerts for significant deviations from benchmarks.
- Train Users: Provide training to maximize software capabilities.
- Integrate Continuously: Connect with other financial systems for up-to-date insights.
Summary
Financial benchmarking software and platforms empower accountants and financial analysts to perform sophisticated, data-driven comparisons with ease. By selecting the right tools and following best practices, finance teams can uncover actionable insights that drive strategic decision-making and continuous improvement.
5.3 Leveraging Business Intelligence and Analytics Tools
In today’s data-driven financial environment, Business Intelligence (BI) and analytics tools have become indispensable for accountants and financial analysts aiming to perform effective financial benchmarking. These tools enable the collection, integration, analysis, and visualization of large volumes of financial data, helping professionals uncover insights that drive better decision-making.
What Are Business Intelligence and Analytics Tools?
- Business Intelligence (BI) refers to technologies and strategies used to analyze business information.
- Analytics tools focus on examining data to identify trends, patterns, and anomalies.
Together, they help transform raw financial data into actionable insights.
Why Use BI and Analytics Tools for Financial Benchmarking?
- Automate data aggregation from multiple sources (ERP, accounting software, market data).
- Enhance data accuracy by reducing manual errors.
- Enable real-time monitoring of financial metrics.
- Provide interactive dashboards for easy interpretation.
- Facilitate scenario analysis and forecasting.
Mind Map: Core Benefits of BI & Analytics in Financial Benchmarking
Popular BI and Analytics Tools for Financial Benchmarking
| Tool | Key Features | Example Use Case |
|---|---|---|
| Microsoft Power BI | Custom dashboards, data connectors, AI insights | Benchmarking profitability across departments |
| Tableau | Interactive visualizations, drag-and-drop interface | Comparing liquidity ratios with industry peers |
| Qlik Sense | Associative data model, self-service analytics | Analyzing efficiency ratios over time |
| SAP Analytics Cloud | Integrated with SAP ERP, predictive analytics | Real-time benchmarking for multinational firms |
Example: Using Power BI to Benchmark Operating Margins
- Data Integration: Connect Power BI to the company’s ERP and accounting system to pull monthly financial statements.
- Data Preparation: Clean and normalize data to ensure comparability.
- Dashboard Creation: Build a dashboard displaying operating margin trends alongside industry benchmarks.
- Insights: Identify departments or business units underperforming relative to peers.
- Action: Recommend targeted cost control measures.
Mind Map: Steps to Implement BI Tools for Financial Benchmarking
Advanced Analytics Example: Predictive Benchmarking with Tableau
- Use historical financial data to build predictive models forecasting future profitability.
- Overlay predicted values with industry benchmarks to anticipate performance gaps.
- Example: A retail company uses Tableau’s forecasting features to predict next quarter’s gross margin and benchmark it against competitors, enabling proactive strategy adjustments.
Best Practices When Leveraging BI and Analytics Tools
- Ensure Data Quality: Garbage in, garbage out. Validate data before analysis.
- Choose Relevant KPIs: Focus on metrics that align with strategic goals.
- Train Users: Equip finance teams with skills to use BI tools effectively.
- Automate Reporting: Set up scheduled reports to maintain continuous benchmarking.
- Combine Quantitative and Qualitative Data: Enrich financial data with operational insights for holistic benchmarking.
Summary
Leveraging BI and analytics tools empowers accountants and financial analysts to perform comprehensive, accurate, and timely financial benchmarking. These tools not only streamline data management but also enhance the depth of analysis through visualization and predictive capabilities, ultimately supporting more informed financial decision-making.
5.4 Integrating ERP and Accounting Systems for Real-Time Benchmarking
Financial benchmarking is most effective when it leverages real-time, accurate data. Integrating Enterprise Resource Planning (ERP) systems with accounting software enables accountants and financial analysts to access up-to-date financial metrics, automate data collection, and perform continuous benchmarking without manual delays or errors.
Why Integrate ERP and Accounting Systems?
- Centralized Data Source: ERP systems consolidate financial, operational, and transactional data in one platform.
- Real-Time Data Access: Integration allows instant updates on financial performance metrics.
- Improved Accuracy: Reduces manual data entry errors and inconsistencies.
- Automation: Streamlines benchmarking workflows by automating data extraction and report generation.
- Enhanced Decision Making: Enables timely insights for faster corrective actions.
Mind Map: Benefits of ERP-Accounting Integration for Benchmarking
How Integration Supports Real-Time Benchmarking
-
Data Synchronization: ERP systems continuously update financial data such as revenue, expenses, inventory, and payroll. When integrated, accounting systems receive these updates instantly.
-
KPI Automation: Key financial ratios (e.g., current ratio, gross margin) can be automatically calculated as new data flows in.
-
Benchmark Data Feeds: Integration can include external benchmarking data feeds, allowing side-by-side comparison with industry peers.
-
Alerts and Notifications: Set up triggers for when benchmark thresholds are breached, enabling immediate attention.
Example: Real-Time Benchmarking in a Manufacturing Company
Scenario: A manufacturing firm uses SAP ERP integrated with QuickBooks Online.
- Step 1: As production costs and sales data enter SAP, they automatically sync with QuickBooks.
- Step 2: QuickBooks calculates updated financial ratios such as inventory turnover and operating margin.
- Step 3: These metrics feed into a Power BI dashboard that compares the company’s performance against industry benchmarks updated monthly.
- Step 4: When the operating margin drops below the benchmark, an alert is sent to the finance team.
This integration allows the finance team to spot inefficiencies immediately and collaborate with operations to reduce costs.
Mind Map: Workflow of Real-Time Benchmarking via ERP-Accounting Integration
Best Practices for Successful Integration
- Choose Compatible Systems: Ensure ERP and accounting software support seamless API or middleware integration.
- Data Mapping: Clearly define how data fields correspond between systems to maintain consistency.
- Security & Compliance: Protect sensitive financial data during transfer and storage.
- Regular Testing: Continuously validate data accuracy post-integration.
- User Training: Equip finance teams to leverage integrated tools effectively.
Additional Example: Retail Chain Using Oracle ERP and Xero
A retail chain integrates Oracle ERP with Xero accounting software to benchmark sales per store in real-time. As sales data is recorded in Oracle, it syncs with Xero, which calculates daily sales growth and compares it with regional benchmarks. Managers receive daily reports highlighting underperforming stores, enabling quick tactical decisions such as inventory adjustments or promotional campaigns.
Summary
Integrating ERP and accounting systems is a powerful enabler for real-time financial benchmarking. It streamlines data flow, enhances accuracy, and accelerates insight generation—empowering accountants and financial analysts to make informed, timely decisions that drive organizational performance.
5.5 Case Study: Using BI Tools to Benchmark a Manufacturing Firm
In this case study, we explore how a mid-sized manufacturing firm leveraged Business Intelligence (BI) tools to conduct comprehensive financial benchmarking. The goal was to identify performance gaps, optimize costs, and improve operational efficiency by comparing key financial metrics against industry peers.
Background
The manufacturing firm, “Acme Manufacturing Co.”, specializes in producing automotive components. Facing increased competition and margin pressure, the CFO decided to implement a BI-driven benchmarking process to gain actionable insights.
Step 1: Defining Benchmarking Objectives
- Identify cost inefficiencies in production
- Compare profitability ratios with industry standards
- Analyze asset utilization and working capital management
Step 2: Selecting BI Tools
The firm chose a BI platform with the following capabilities:
- Integration with ERP and accounting systems
- Customizable dashboards and reports
- Advanced data visualization
- Automated data refresh and alerts
Step 3: Data Collection and Integration
- Financial data (income statement, balance sheet, cash flow) imported from ERP
- Industry benchmark data sourced from a trusted financial database
- Operational data such as production volumes and inventory levels
Step 4: Building Benchmarking Dashboards
Using the BI tool, the team created interactive dashboards focusing on key metrics:
- Profitability Ratios: Gross Margin, Operating Margin, Net Margin
- Efficiency Ratios: Asset Turnover, Inventory Turnover
- Liquidity Ratios: Current Ratio, Quick Ratio
- Leverage Ratios: Debt to Equity
Mind Map: Key Metrics and Data Sources
BI-Driven Financial Benchmarking Mind Map
Step 5: Analysis and Insights
- Profitability: Acme’s gross margin was 32%, slightly below the industry average of 35%. Operating margin lagged by 3 percentage points.
- Efficiency: Inventory turnover was 4.2 times per year, compared to the industry benchmark of 5.0, indicating slower inventory movement.
- Liquidity: Current ratio stood at 1.5, healthy but below the industry median of 1.8.
- Leverage: Debt to equity ratio was higher than peers, signaling potential financial risk.
Step 6: Root Cause Identification
Using drill-down features in the BI dashboards, the team identified:
- Higher raw material costs impacting gross margin
- Excess inventory in certain product lines causing low turnover
- Longer accounts receivable cycles affecting liquidity
Step 7: Actionable Recommendations
- Negotiate better supplier contracts to reduce raw material costs
- Implement just-in-time inventory practices for slow-moving products
- Strengthen credit policies to improve receivables collection
- Explore refinancing options to optimize capital structure
Example Dashboard Snapshot (Visualization)
Acme Manufacturing Financial Benchmarking Dashboard
| Metric | Acme Value | Industry Benchmark | Variance |
|---|---|---|---|
| Gross Margin | 32% | 35% | -3% |
| Operating Margin | 8% | 11% | -3% |
| Inventory Turnover | 4.2x | 5.0x | -0.8x |
| Current Ratio | 1.5 | 1.8 | -0.3 |
| Debt to Equity | 1.2 | 0.9 | +0.3 |
Benefits Realized
- The BI tool enabled real-time monitoring of financial health against benchmarks.
- Visualization helped non-finance stakeholders understand key issues.
- Data-driven decisions led to a 5% improvement in gross margin within 6 months.
- Inventory turnover increased by 15% after process improvements.
Summary
This case study illustrates how integrating BI tools into financial benchmarking empowers accountants and financial analysts to uncover actionable insights efficiently. By combining accurate data, interactive dashboards, and industry benchmarks, manufacturing firms like Acme can drive continuous financial performance improvements.
6. Conducting Benchmarking Analysis Step-by-Step
6.1 Data Collection and Validation
Effective financial benchmarking begins with accurate and comprehensive data collection followed by rigorous validation. This foundational step ensures that all subsequent analysis is reliable and meaningful.
Why Data Collection and Validation Matter
- Accuracy: Incorrect data leads to misleading benchmarks.
- Consistency: Comparable data across periods and peers is essential.
- Completeness: Missing data can skew results or limit analysis.
Key Steps in Data Collection
-
Identify Required Financial Data
- Income statements
- Balance sheets
- Cash flow statements
- Key financial ratios
-
Source Data
- Internal accounting systems (ERP, accounting software)
- External databases (industry reports, financial data providers)
- Public filings (for benchmarking against competitors)
-
Gather Historical and Current Data
- Collect data for multiple periods to enable trend analysis
- Ensure data aligns with the benchmarking timeframe
-
Organize Data
- Use standardized templates or spreadsheets
- Categorize by financial statement type and metric
Data Validation Techniques
- Cross-Verification: Compare data from multiple sources to confirm accuracy.
- Reconciliation: Match financial data with general ledger and trial balance.
- Outlier Detection: Identify and investigate unusual values or sudden changes.
- Consistency Checks: Ensure consistent accounting policies and currency units.
- Completeness Checks: Confirm all required data points are present.
Mind Map: Data Collection and Validation Process
Example 1: Collecting Data for a Mid-Sized Retail Company
- Step 1: Extract income statement and balance sheet data from the company’s ERP system for the last 3 years.
- Step 2: Obtain industry average financial ratios from a reputable financial data provider.
- Step 3: Organize data in a spreadsheet with separate tabs for company data and industry benchmarks.
- Step 4: Validate by reconciling ERP data with the company’s audited financial statements.
- Step 5: Check for outliers such as an unusually high inventory turnover ratio and confirm with the inventory manager.
Example 2: Validating External Benchmark Data
- Scenario: Benchmarking against competitors using publicly available financial reports.
- Step 1: Download competitors’ annual reports.
- Step 2: Extract key financial metrics ensuring consistent accounting standards (e.g., IFRS vs GAAP).
- Step 3: Convert all figures to a common currency using average exchange rates for the period.
- Step 4: Cross-check extracted data with financial databases like Bloomberg or Capital IQ.
- Step 5: Document any adjustments or assumptions made during data preparation.
Best Practices
- Automate data extraction where possible to reduce manual errors.
- Maintain a data dictionary to ensure consistent definitions.
- Regularly update benchmarking data to reflect the latest financial periods.
- Engage cross-functional teams (accounting, finance, operations) for data validation.
By meticulously collecting and validating data, accountants and financial analysts set a strong foundation for insightful and actionable financial benchmarking.
6.2 Normalizing Financial Data for Comparability
Financial data normalization is a critical step in benchmarking, ensuring that data from different companies, periods, or accounting standards can be compared on a like-for-like basis. Without normalization, differences in accounting policies, currency, company size, or seasonality can distort benchmarking results.
Why Normalize Financial Data?
- Eliminate distortions: Adjust for differences in accounting methods or fiscal year-ends.
- Enable apples-to-apples comparison: Make financial metrics comparable across companies or time periods.
- Improve accuracy: Reduce bias caused by non-operational or one-time items.
Common Normalization Techniques
Accounting Adjustments
Different companies may use varying accounting policies that affect financial metrics.
Example:
- Company A uses straight-line depreciation; Company B uses accelerated depreciation.
- To compare operating expenses, adjust depreciation expense to a common basis.
Best Practice:
- Review accounting policies disclosed in financial statements.
- Adjust key line items to a consistent accounting method where possible.
Currency Conversion
When benchmarking multinational companies, financials must be converted into a common currency.
Example:
- Company X reports in USD; Company Y reports in EUR.
- Use average exchange rates for the period or closing rates for balance sheet items.
Mind Map:
Size Adjustments
To compare companies of different sizes, normalize financial figures by scaling.
Example:
- Comparing net income of a $10M revenue company vs a $100M revenue company.
- Normalize by calculating net income margin (Net Income / Revenue).
Best Practice:
- Use ratios or per-unit metrics (e.g., per employee, per asset dollar).
Time Period Alignment
Companies may have different fiscal year-ends or seasonal business cycles.
Example:
- Company A’s fiscal year ends December 31; Company B’s ends March 31.
- Align data by adjusting periods or using trailing twelve months (TTM) data.
Mind Map:
One-Time Items and Non-Recurring Events
Remove or adjust for extraordinary gains, restructuring costs, or litigation expenses.
Example:
- Company reports a $5M gain from asset sale.
- Exclude this gain to focus on operating performance.
Best Practice:
- Review notes to financial statements for such items.
- Adjust earnings and expenses accordingly.
Practical Example: Normalizing Financial Data for Benchmarking
| Metric | Company A (USD) | Company B (EUR) | Notes/Adjustments |
|---|---|---|---|
| Revenue | 120,000,000 | 100,000,000 | Convert EUR to USD at 1.1 exchange rate |
| Net Income | 15,000,000 | 12,000,000 | Adjust for one-time gain of 1,000,000 USD in Company B |
| Depreciation Expense | 5,000,000 | 6,000,000 | Company B uses accelerated depreciation; adjust to straight-line basis |
| Fiscal Year End | Dec 31 | Mar 31 | Use trailing twelve months for Company B |
Step-by-Step Normalization:
- Convert Company B’s EUR figures to USD.
- Remove one-time gain from Company B’s net income.
- Adjust depreciation expense for Company B to match Company A’s method.
- Use trailing twelve months data for Company B to align fiscal years.
- Calculate normalized net income margin for both companies.
Summary
Normalization is essential for reliable financial benchmarking. By systematically adjusting for accounting differences, currency, size, time periods, and one-time items, accountants can ensure meaningful and actionable comparisons.
Additional Resources
- IFRS and GAAP accounting policy comparison guides
- Currency conversion best practices from the International Monetary Fund (IMF)
- Seasonality adjustment techniques in financial analysis
6.3 Calculating Benchmark Metrics
Calculating benchmark metrics is a critical step in the financial benchmarking process. It involves deriving key financial ratios and indicators from your collected data to compare your organization’s performance against peers or industry standards. This section will guide you through the calculation process, using clear examples and mind maps to visualize the relationships between metrics.
Understanding Benchmark Metrics
Benchmark metrics typically include profitability, liquidity, efficiency, leverage, and market value ratios. Each metric provides insights into different aspects of financial health and operational effectiveness.
Step-by-Step Process to Calculate Benchmark Metrics
- Gather Financial Data: Collect accurate and comparable financial statements such as income statements, balance sheets, and cash flow statements.
- Select Relevant Metrics: Choose metrics that align with your benchmarking objectives and industry norms.
- Perform Calculations: Use standard formulas to compute each metric.
- Normalize Data: Adjust for differences in accounting policies or company size if necessary.
- Compare and Analyze: Benchmark your calculated metrics against peers or industry averages.
Mind Map: Overview of Benchmark Metrics Calculation
Key Financial Ratios and Their Calculation
Profitability Ratios
- Gross Profit Margin = (Gross Profit / Revenue) × 100
- Operating Profit Margin = (Operating Income / Revenue) × 100
- Net Profit Margin = (Net Income / Revenue) × 100
Example:
A company reports:
- Revenue = $1,000,000
- Cost of Goods Sold (COGS) = $600,000
- Operating Expenses = $200,000
- Net Income = $150,000
Calculate:
- Gross Profit = Revenue - COGS = $400,000
- Gross Profit Margin = (400,000 / 1,000,000) × 100 = 40%
- Operating Income = Gross Profit - Operating Expenses = 400,000 - 200,000 = $200,000
- Operating Profit Margin = (200,000 / 1,000,000) × 100 = 20%
- Net Profit Margin = (150,000 / 1,000,000) × 100 = 15%
Liquidity Ratios
- Current Ratio = Current Assets / Current Liabilities
- Quick Ratio = (Current Assets - Inventory) / Current Liabilities
Example:
- Current Assets = $300,000
- Inventory = $100,000
- Current Liabilities = $150,000
Calculate:
- Current Ratio = 300,000 / 150,000 = 2.0
- Quick Ratio = (300,000 - 100,000) / 150,000 = 200,000 / 150,000 = 1.33
Efficiency Ratios
- Asset Turnover = Revenue / Average Total Assets
- Inventory Turnover = COGS / Average Inventory
Example:
- Revenue = $1,000,000
- Average Total Assets = $500,000
- COGS = $600,000
- Average Inventory = $120,000
Calculate:
- Asset Turnover = 1,000,000 / 500,000 = 2.0
- Inventory Turnover = 600,000 / 120,000 = 5.0
Leverage Ratios
- Debt to Equity Ratio = Total Debt / Total Equity
- Interest Coverage Ratio = EBIT / Interest Expense
Example:
- Total Debt = $400,000
- Total Equity = $600,000
- EBIT (Earnings Before Interest and Taxes) = $180,000
- Interest Expense = $30,000
Calculate:
- Debt to Equity Ratio = 400,000 / 600,000 = 0.67
- Interest Coverage Ratio = 180,000 / 30,000 = 6.0
Market Value Ratios
- Earnings Per Share (EPS) = Net Income / Number of Outstanding Shares
- Price to Earnings (P/E) Ratio = Market Price per Share / EPS
Example:
- Net Income = $150,000
- Outstanding Shares = 50,000
- Market Price per Share = $30
Calculate:
- EPS = 150,000 / 50,000 = $3.00
- P/E Ratio = 30 / 3.00 = 10
Mind Map: Profitability Ratios Calculation Breakdown
Practical Example: Calculating and Benchmarking Metrics for a Mid-Sized Company
Scenario:
You have financial data for your company and two competitors. Calculate the key ratios and compare.
| Metric | Your Company | Competitor A | Competitor B |
|---|---|---|---|
| Revenue | $2,000,000 | $2,500,000 | $1,800,000 |
| Gross Profit | $800,000 | $1,000,000 | $720,000 |
| Operating Income | $400,000 | $450,000 | $360,000 |
| Net Income | $300,000 | $350,000 | $270,000 |
| Current Assets | $500,000 | $600,000 | $450,000 |
| Current Liabilities | $250,000 | $300,000 | $225,000 |
Calculate Gross Profit Margin for each:
- Your Company: (800,000 / 2,000,000) × 100 = 40%
- Competitor A: (1,000,000 / 2,500,000) × 100 = 40%
- Competitor B: (720,000 / 1,800,000) × 100 = 40%
Operating Profit Margin:
- Your Company: (400,000 / 2,000,000) × 100 = 20%
- Competitor A: (450,000 / 2,500,000) × 100 = 18%
- Competitor B: (360,000 / 1,800,000) × 100 = 20%
Net Profit Margin:
- Your Company: (300,000 / 2,000,000) × 100 = 15%
- Competitor A: (350,000 / 2,500,000) × 100 = 14%
- Competitor B: (270,000 / 1,800,000) × 100 = 15%
Current Ratio:
- Your Company: 500,000 / 250,000 = 2.0
- Competitor A: 600,000 / 300,000 = 2.0
- Competitor B: 450,000 / 225,000 = 2.0
Analysis: Your company matches or slightly outperforms competitors on profitability and liquidity metrics, indicating solid financial health.
Tips for Accurate Calculation
- Always use consistent accounting periods.
- Adjust for non-recurring items to avoid skewed ratios.
- Use averages for balance sheet items when calculating turnover ratios.
- Document assumptions and sources for transparency.
By mastering the calculation of benchmark metrics, accountants and financial analysts can provide actionable insights that drive performance improvements and strategic decision-making.
6.4 Identifying Performance Gaps and Variances
Identifying performance gaps and variances is a critical step in financial benchmarking. It helps accountants and financial analysts pinpoint where an organization is underperforming relative to its peers or internal targets, enabling targeted improvements.
What Are Performance Gaps and Variances?
- Performance Gap: The difference between actual performance and benchmarked or expected performance.
- Variance: The numerical value representing the deviation, which can be positive (outperformance) or negative (underperformance).
Why Identifying Gaps and Variances Matters
- Highlights areas needing attention or improvement.
- Supports strategic decision-making.
- Enables resource allocation to optimize financial health.
Step-by-Step Process to Identify Performance Gaps and Variances
- Collect Benchmark Data: Gather relevant financial metrics from peers, industry standards, or internal historical data.
- Calculate Actual Performance Metrics: Use your company’s financial statements to compute the same metrics.
- Compare Metrics: Subtract benchmark values from actual values to find variances.
- Analyze Variances: Determine if variances are favorable or unfavorable.
- Prioritize Gaps: Focus on significant gaps that impact strategic goals.
Mind Map: Identifying Performance Gaps and Variances
Example 1: Identifying a Profitability Gap
Scenario: A mid-sized manufacturing company benchmarks its Net Profit Margin against the industry average.
- Industry Net Profit Margin: 12%
- Company Net Profit Margin: 8%
Variance: 8% - 12% = -4%
Interpretation: The company is underperforming by 4 percentage points.
Action: Investigate cost structure or pricing strategies to close the gap.
Mind Map: Profitability Gap Analysis
Example 2: Variance in Liquidity Ratios
Scenario: A retail company compares its Current Ratio to the sector benchmark.
- Sector Current Ratio: 1.8
- Company Current Ratio: 1.2
Variance: 1.2 - 1.8 = -0.6
Interpretation: The company may face liquidity risks.
Action: Review working capital management and short-term liabilities.
Mind Map: Liquidity Variance Analysis
Tips for Effective Gap Identification
- Use visual tools like variance charts and dashboards.
- Consider seasonality and one-time events when analyzing variances.
- Engage cross-functional teams to understand root causes.
- Document findings and track progress over time.
Summary
Identifying performance gaps and variances through systematic comparison of actual financial metrics against benchmarks is essential for uncovering weaknesses and opportunities. Using mind maps and clear examples helps accountants and financial analysts structure their analysis and communicate findings effectively.
6.5 Root Cause Analysis of Benchmarking Results
Root Cause Analysis (RCA) is a critical step in the financial benchmarking process. After identifying performance gaps or variances through benchmarking, accountants and financial analysts must dig deeper to understand the underlying causes. This enables targeted corrective actions rather than superficial fixes.
What is Root Cause Analysis?
Root Cause Analysis is a systematic approach to identify the fundamental reasons why a problem or variance exists. In financial benchmarking, RCA helps uncover why a company’s financial metrics deviate from industry benchmarks or internal targets.
Why Perform Root Cause Analysis?
- To move beyond symptoms and address the actual issues.
- To prevent recurring financial inefficiencies or risks.
- To prioritize corrective actions based on impact.
- To improve decision-making and strategic planning.
Step-by-Step Approach to Root Cause Analysis in Financial Benchmarking
-
Define the Problem Clearly
- Example: “Our company’s operating margin is 5% lower than the industry average.”
-
Gather Relevant Data
- Collect detailed financial statements, operational data, and market information.
-
Identify Possible Causes
- Use brainstorming sessions with finance and operational teams.
-
Analyze Causes Using Tools
- Apply structured tools such as the Fishbone Diagram, 5 Whys, and Pareto Analysis.
-
Validate Root Causes
- Test hypotheses with additional data or pilot interventions.
-
Develop Action Plans
- Create targeted strategies to address root causes.
Mind Map: Root Cause Analysis Framework
Example: Root Cause Analysis Using the 5 Whys Technique
Problem: The company’s Days Sales Outstanding (DSO) is 15 days higher than the industry benchmark.
| Why | Explanation |
|---|---|
| 1. Why is DSO higher? | Customers are paying invoices late. |
| 2. Why are customers paying late? | Invoices are sent with delays. |
| 3. Why are invoices delayed? | The billing department has a backlog due to manual processes. |
| 4. Why is there a backlog? | Insufficient staff and outdated invoicing software. |
| 5. Why is staff insufficient and software outdated? | Budget constraints and lack of investment in automation. |
Root Cause: Budget constraints leading to underinvestment in billing automation and staffing.
Action: Propose investment in invoicing software and hire additional billing staff to reduce backlog and improve DSO.
Mind Map: 5 Whys Example for High DSO
Example: Fishbone Diagram for Low Operating Margin
Problem: Operating margin is 5% below industry average.
Fishbone Categories:
- Cost Structure: High raw material costs, inefficient procurement.
- Revenue: Lower sales volume, discounting practices.
- Processes: Inefficient production, high waste.
- People: Lack of training, low productivity.
- External: Increased competition, regulatory fees.
Best Practices for Root Cause Analysis in Financial Benchmarking
- Engage Cross-Functional Teams: Include finance, operations, sales, and procurement for diverse perspectives.
- Use Multiple Tools: Combine 5 Whys, Fishbone, and data analytics for robust analysis.
- Focus on Data-Driven Insights: Validate causes with quantitative data.
- Document Findings Thoroughly: Maintain clear records for transparency and future reference.
- Implement Continuous Monitoring: Track the effectiveness of corrective actions over time.
Summary
Root Cause Analysis transforms benchmarking insights into actionable intelligence. By systematically identifying and addressing the fundamental causes of financial performance gaps, accountants and financial analysts can drive sustainable improvements and add strategic value to their organizations.
6.6 Example Walkthrough: Benchmarking a Service Company’s Financial Health
In this section, we will walk through a practical example of benchmarking the financial health of a mid-sized service company, “ServicePro Inc.”, specializing in IT consulting. This example will demonstrate how to collect data, calculate key metrics, compare against benchmarks, and interpret the results to identify areas for improvement.
Step 1: Define the Benchmarking Objectives
- Understand ServicePro Inc.’s current financial position.
- Compare key financial ratios with industry peers.
- Identify strengths and weaknesses in profitability, liquidity, and efficiency.
Step 2: Collect Financial Data
We gather the latest financial statements (Income Statement and Balance Sheet) for ServicePro Inc. and obtain industry benchmark data from a reliable source such as IBISWorld or RMA Annual Statement Studies.
| Metric | ServicePro Inc. | Industry Benchmark (IT Consulting) |
|---|---|---|
| Revenue | $10,000,000 | $9,500,000 |
| Cost of Goods Sold (COGS) | $6,000,000 | $6,200,000 |
| Operating Expenses | $2,000,000 | $1,800,000 |
| Current Assets | $3,000,000 | $2,800,000 |
| Current Liabilities | $1,500,000 | $1,400,000 |
| Total Assets | $7,000,000 | $6,800,000 |
| Total Liabilities | $3,000,000 | $2,900,000 |
Step 3: Calculate Key Financial Ratios
Mind Map: Key Ratios to Calculate
Calculations:
- Gross Margin = (Revenue - COGS) / Revenue
ServicePro Inc.: (10,000,000 - 6,000,000) / 10,000,000 = 0.40 or 40%
Industry Benchmark: (9,500,000 - 6,200,000) / 9,500,000 = 0.347 or 34.7%
- Operating Margin = (Operating Income) / Revenue
Operating Income = Revenue - COGS - Operating Expenses
ServicePro Inc.: (10,000,000 - 6,000,000 - 2,000,000) / 10,000,000 = 0.20 or 20%
Industry Benchmark: (9,500,000 - 6,200,000 - 1,800,000) / 9,500,000 = 0.16 or 16%
- Current Ratio = Current Assets / Current Liabilities
ServicePro Inc.: 3,000,000 / 1,500,000 = 2.0
Industry Benchmark: 2,800,000 / 1,400,000 = 2.0
- Asset Turnover = Revenue / Total Assets
ServicePro Inc.: 10,000,000 / 7,000,000 = 1.43
Industry Benchmark: 9,500,000 / 6,800,000 = 1.40
Step 4: Analyze the Results
Mind Map: Interpretation of Results
Example Insight:
ServicePro Inc. demonstrates strong profitability and efficient asset use compared to its peers. However, operating expenses are slightly higher, suggesting potential for cost optimization.
Step 5: Presenting the Findings
Create a clear and concise report or dashboard summarizing the benchmarking outcomes.
Mind Map: Reporting Structure
Example Visual (Table):
| Ratio | ServicePro Inc. | Industry Benchmark | Interpretation |
|---|---|---|---|
| Gross Margin | 40% | 34.7% | Above average profitability |
| Operating Margin | 20% | 16% | Strong operational efficiency |
| Current Ratio | 2.0 | 2.0 | Healthy liquidity |
| Asset Turnover | 1.43 | 1.40 | Efficient asset utilization |
Step 6: Recommendations & Next Steps
- Conduct a detailed review of operating expenses to identify cost-saving opportunities.
- Implement regular benchmarking cycles (quarterly or bi-annually).
- Expand benchmarking to include cash flow metrics such as receivables turnover.
- Use benchmarking insights to support budgeting and forecasting processes.
This example walkthrough demonstrates how accountants and financial analysts can systematically benchmark a service company’s financial health using real data, clear calculations, and actionable insights.
7. Interpreting Benchmarking Results for Decision Making
7.1 Understanding Context and Industry Nuances
Financial benchmarking is not a one-size-fits-all exercise. To derive meaningful insights, accountants and financial analysts must deeply understand the context in which the financial data exists and the unique nuances of the industry they operate in. This section explores how context and industry-specific factors influence benchmarking results and how to interpret them effectively.
Why Context Matters in Financial Benchmarking
- Economic Environment: Macroeconomic conditions such as inflation, interest rates, and economic cycles can significantly impact financial metrics.
- Company Lifecycle Stage: Startups, growth-stage companies, mature firms, and those in decline have different financial profiles.
- Regulatory Environment: Industry-specific regulations can affect costs, revenue recognition, and capital structure.
- Geographical Factors: Regional market dynamics, currency fluctuations, and local tax policies influence financial performance.
Industry Nuances to Consider
| Industry | Key Financial Characteristics | Benchmarking Considerations |
|---|---|---|
| Retail | High inventory turnover, thin margins, seasonal sales | Focus on inventory turnover, gross margin, and working capital |
| Manufacturing | Capital intensive, long production cycles | Emphasize asset utilization, fixed costs, and operating leverage |
| Banking | Highly regulated, interest income driven | Prioritize capital adequacy ratios, NPL ratios, and ROE |
| Technology | High R&D spend, rapid growth | Benchmark R&D intensity, revenue growth, and customer acquisition costs |
| Non-Profit | Fund-driven, limited profit motive | Focus on expense ratios, program efficiency, and liquidity |
Mind Map: Factors Influencing Financial Benchmarking Interpretation
Example 1: Interpreting Liquidity Ratios in Retail vs Manufacturing
- Retail Company: A current ratio of 1.2 might be acceptable due to fast inventory turnover and frequent cash inflows.
- Manufacturing Company: The same current ratio might signal liquidity risk because of higher fixed assets and longer receivables cycles.
This shows why benchmarking a liquidity ratio without industry context can lead to misleading conclusions.
Mind Map: Industry-Specific Financial Metrics Focus
Example 2: Adjusting Benchmarks for Economic Cycles
During a recession, profitability benchmarks may decline across the board. For example, a manufacturing firm’s operating margin might drop from 15% to 8%. Comparing this to pre-recession benchmarks without context could falsely indicate poor performance. Instead, benchmarking should incorporate economic cycle adjustments.
Best Practice Tips
- Always segment benchmarking data by industry and company size.
- Use rolling averages or multi-year data to smooth out economic cycle effects.
- Consider qualitative factors such as management changes or strategic shifts.
- Collaborate with industry experts to interpret unusual variances.
Understanding context and industry nuances ensures that financial benchmarking is a powerful tool for actionable insights rather than a source of confusion. By integrating these considerations, accountants and financial analysts can provide more accurate, relevant, and strategic recommendations.
7.2 Prioritizing Areas for Improvement Based on Benchmarks
Financial benchmarking provides accountants and financial analysts with a clear view of where a company stands relative to its peers or industry standards. However, the true value lies in identifying which areas require immediate attention and improvement. Prioritizing these areas ensures efficient allocation of resources and drives impactful financial performance enhancements.
Why Prioritize?
- Resource Optimization: Focus limited time, budget, and personnel on the most critical issues.
- Strategic Alignment: Ensure improvements support broader business goals.
- Risk Mitigation: Address areas that pose the greatest financial or operational risks.
Step 1: Analyze Benchmark Gaps
Start by comparing your company’s key financial metrics against benchmarks to identify significant performance gaps.
Example:
- Your company’s Operating Margin is 8%, while the industry average is 15%.
- Inventory Turnover is 3 times per year, whereas top competitors achieve 6 times.
These gaps highlight potential inefficiencies or cost issues.
Step 2: Assess Impact and Feasibility
Evaluate each gap based on:
- Financial Impact: How much can improving this metric contribute to profitability or cash flow?
- Feasibility: How easily can the company implement changes? Consider time, cost, and complexity.
- Strategic Importance: Does this area align with company priorities (e.g., growth, cost leadership)?
Step 3: Create a Prioritization Matrix
Plot identified areas on a matrix to visualize which improvements offer the highest impact and feasibility.
Mind Map: Prioritization Matrix
Step 4: Develop an Action Plan
For high-priority areas, outline specific steps, responsible teams, timelines, and expected outcomes.
Example:
- Area: Improve Operating Margin
- Action: Analyze cost drivers, renegotiate supplier contracts, optimize pricing strategy
- Team: Finance and Procurement
- Timeline: 3 months
- Expected Outcome: Increase margin from 8% to 12%
Mind Map: Prioritizing Areas for Improvement
Practical Example: Prioritizing Improvement Areas for a Mid-Sized Retailer
Benchmark Findings:
- Gross Margin is 25% vs. industry average 35%
- Inventory Turnover is 4x vs. industry 7x
- Current Ratio is 1.2 vs. benchmark 1.5
Prioritization:
| Area | Impact | Feasibility | Priority | Notes |
|---|---|---|---|---|
| Gross Margin | High | Medium | High | Requires pricing review and cost control |
| Inventory Turnover | High | High | Highest | Quick wins by improving stock management |
| Current Ratio | Medium | Low | Medium | Needs working capital improvement, longer term |
Action:
- Focus first on inventory management improvements (quick wins).
- Simultaneously initiate pricing and cost control reviews.
- Plan working capital optimization as a medium-term goal.
Summary
Prioritizing areas for improvement based on benchmarking results is a structured process that balances impact, feasibility, and strategic alignment. Using tools like prioritization matrices and mind maps helps visualize and communicate priorities effectively, enabling finance professionals to drive meaningful performance improvements.
7.3 Communicating Findings to Stakeholders
Effective communication of financial benchmarking findings is crucial for driving informed decision-making and fostering alignment across the organization. Accountants and financial analysts must present complex data in a clear, concise, and actionable manner tailored to their audience.
Key Principles for Communicating Benchmarking Results
- Clarity: Use simple language and avoid jargon.
- Relevance: Tailor insights to stakeholder interests and priorities.
- Visualization: Employ charts, graphs, and mind maps to illustrate key points.
- Actionability: Highlight specific recommendations and next steps.
- Context: Provide industry and historical context to frame results.
Mind Map: Communicating Benchmarking Findings
Step-by-Step Guide with Examples
-
Know Your Audience
- Example: Presenting to the CFO requires focusing on strategic financial impacts, while a department manager may need operational cost insights.
-
Craft Clear Key Messages
- Example: “Our gross margin is 5% below industry average due to higher raw material costs, suggesting a need to renegotiate supplier contracts.”
-
Use Visual Aids
- Example: A bar chart comparing your company’s liquidity ratios against competitors quickly highlights areas of concern.
-
Provide Context and Interpretation
- Example: “While our current ratio is 1.2, slightly below the industry average of 1.5, this is due to recent investments in inventory, which should normalize next quarter.”
-
Recommend Actions
- Example: “To improve operating margin, consider optimizing production processes and reducing overhead costs.”
-
Encourage Dialogue and Feedback
- Example: Schedule a workshop to discuss findings and collaboratively develop improvement plans.
Mind Map: Example Messaging Structure for CFO Presentation
Example Communication Snippet
“After benchmarking our operating margin against industry leaders, we identified a 3% shortfall primarily driven by higher administrative expenses. By streamlining our administrative processes and adopting automation tools, we can target a 2% improvement within the next fiscal year. This will enhance our competitive positioning and profitability.”
Tips for Effective Communication
- Use storytelling to make data relatable.
- Avoid information overload; focus on key insights.
- Customize reports with executive summaries for quick reading.
- Leverage interactive dashboards for real-time exploration.
By integrating these best practices and examples, accountants and financial analysts can ensure their benchmarking findings resonate with stakeholders, driving meaningful financial improvements and strategic alignment.
7.4 Using Benchmarking Insights to Inform Budgeting and Forecasting
Financial benchmarking provides accountants and financial analysts with critical insights that can significantly enhance the accuracy and strategic value of budgeting and forecasting processes. By comparing a company’s financial performance against industry peers or historical data, professionals can identify realistic targets, uncover inefficiencies, and anticipate market trends.
Why Use Benchmarking Insights in Budgeting and Forecasting?
- Set Realistic Targets: Benchmarking helps establish achievable financial goals based on industry standards.
- Identify Cost-saving Opportunities: Highlight areas where expenses exceed peer averages.
- Improve Revenue Projections: Understand market positioning and growth potential.
- Risk Mitigation: Detect financial vulnerabilities early.
Mind Map: Integrating Benchmarking into Budgeting and Forecasting
Practical Example 1: Budgeting Using Benchmarking Insights
Scenario: A mid-sized manufacturing company is preparing its annual budget. By benchmarking its Cost of Goods Sold (COGS) ratio against industry peers, it finds its COGS is 5% higher than the average.
Action:
- The finance team investigates procurement and production inefficiencies.
- They set a budget target to reduce COGS by 3% over the next year.
- Forecasts are adjusted to reflect improved margins, increasing projected net profit.
Outcome: The company aligns its budgeting with realistic improvement goals, avoiding overly optimistic or conservative estimates.
Mind Map: Budget Adjustment Based on Benchmarking
Practical Example 2: Forecasting Sales Growth with Benchmarking
Scenario: A retail company forecasts sales growth for the next fiscal year. Benchmarking shows the average industry sales growth rate is 6%, but the company’s historical growth is 3%.
Action:
- The finance team uses the 6% growth rate as an optimistic scenario.
- They create a base case forecast at 4%, slightly above historical but below industry average, reflecting planned marketing initiatives.
- A conservative forecast at 2% is also prepared.
Outcome: The company develops a range of forecasts informed by benchmarking, enabling better strategic planning and risk management.
Mind Map: Forecasting Scenarios Using Benchmarking
Best Practices for Using Benchmarking in Budgeting and Forecasting
- Regularly Update Benchmarks: Use the latest industry data to keep budgets and forecasts relevant.
- Combine Multiple Benchmarks: Use both internal historical data and external industry benchmarks.
- Involve Cross-Functional Teams: Collaborate with operations, sales, and procurement for holistic insights.
- Document Assumptions: Clearly state how benchmarking data influences budget and forecast assumptions.
- Use Visual Tools: Mind maps, dashboards, and charts help communicate benchmarking impacts effectively.
Summary
Incorporating benchmarking insights into budgeting and forecasting empowers accountants and financial analysts to create more accurate, data-driven financial plans. By understanding where the company stands relative to peers and industry standards, finance professionals can set achievable goals, anticipate challenges, and support strategic decision-making with confidence.
7.5 Example: Presenting Benchmarking Outcomes to a CFO
Presenting financial benchmarking results to a CFO requires clarity, precision, and actionable insights. The goal is to translate complex data into a compelling narrative that supports strategic decision-making.
Step 1: Prepare the Presentation Structure
A well-organized presentation typically follows this flow:
- Introduction: Purpose and scope of benchmarking
- Key Findings: Highlight critical metrics and performance gaps
- Analysis: Explain reasons behind variances
- Recommendations: Suggest actionable steps
- Q&A: Address CFO’s questions
Step 2: Use Mind Maps to Organize Thoughts
Mind maps help visualize the structure and flow of your presentation.
Mind Map: Presenting Benchmarking Outcomes to CFO
Mind Map: Key Financial Metrics to Highlight
Step 3: Present Clear, Easy-to-Understand Examples
Example 1: Profitability Gap
- Our company’s net margin is 8%, while the industry average is 12%.
- This 4% gap translates to $2 million less profit annually on $50 million revenue.
- Root cause analysis shows higher operating expenses, particularly in SG&A.
Example 2: Liquidity Concern
- Current ratio of 1.2 is below the industry benchmark of 1.5.
- Indicates potential short-term liquidity risk.
- Recommendation: Improve working capital management by reducing inventory days.
Step 4: Use Visual Aids to Enhance Understanding
- Bar charts comparing company metrics vs industry benchmarks
- Trend lines showing performance over the last 3 years
- Heat maps highlighting areas of concern
Mind Map: Visual Aids for Presentation
Step 5: Recommendations with Impact and Feasibility
| Recommendation | Expected Impact | Feasibility |
|---|---|---|
| Reduce SG&A expenses by 10% | Increase net margin by 2% | Medium |
| Optimize inventory levels | Improve current ratio to 1.4 | High |
| Renegotiate debt terms | Lower debt to equity ratio | Medium |
Step 6: Anticipate CFO Questions
- How reliable is the benchmarking data?
- What are the risks if recommendations are not implemented?
- How do these findings align with strategic goals?
Mind Map: Anticipated CFO Questions
Final Tips:
- Keep language concise and jargon-free.
- Focus on insights, not just numbers.
- Use storytelling to connect data to business impact.
- Provide a one-page executive summary.
By following this structured approach, accountants and financial analysts can effectively communicate benchmarking outcomes to CFOs, driving informed decisions and fostering a culture of continuous financial improvement.
8. Integrating Benchmarking into Financial Planning and Analysis (FP&A)
8.1 Aligning Benchmarking with Strategic Financial Goals
Financial benchmarking is most effective when it directly supports an organization’s strategic financial goals. This alignment ensures that benchmarking efforts are purposeful, actionable, and contribute to long-term value creation. Below, we explore how accountants and financial analysts can integrate benchmarking into strategic planning, supported by illustrative mind maps and practical examples.
Understanding Strategic Financial Goals
Strategic financial goals typically include objectives such as revenue growth, cost reduction, profitability improvement, liquidity management, and capital structure optimization. Benchmarking helps measure progress toward these goals by comparing performance against peers or industry standards.
Mind Map: Aligning Benchmarking with Strategic Financial Goals
Step-by-Step Approach with Example
Step 1: Identify Strategic Financial Goals
Example: A mid-sized manufacturing company aims to improve profitability by increasing operating margins by 5% over the next fiscal year.
Step 2: Select Relevant Benchmarks
The company chooses to benchmark against top 10% performers in the manufacturing sector focusing on operating margin and cost of goods sold (COGS) percentages.
Step 3: Define Key Metrics
- Operating Margin (%)
- COGS as % of Revenue
Step 4: Collect and Validate Data
Gather financial statements from industry reports and internal accounting systems ensuring data comparability.
Step 5: Analyze Gaps and Opportunities
Benchmarking reveals the company’s operating margin is 12%, while top performers average 18%. COGS is 65% of revenue versus 55% for the best performers.
Step 6: Integrate Insights into Strategy
- Target initiatives to reduce COGS by optimizing supplier contracts and improving production efficiency.
- Adjust budget allocations to support process improvements.
- Set quarterly monitoring checkpoints to track margin improvements.
Mind Map: Example of Benchmarking Integration into Strategy
Best Practices for Alignment
- Link Benchmarks to Specific Goals: Avoid generic benchmarking; focus on metrics that directly impact strategic objectives.
- Use a Balanced Set of Metrics: Combine profitability, liquidity, and efficiency ratios to get a comprehensive view.
- Engage Cross-Functional Teams: Collaborate with operations, sales, and strategy teams to interpret benchmarking insights.
- Regularly Update Benchmarks: Industry dynamics change; keep benchmarks current to maintain relevance.
- Communicate Clearly: Present benchmarking results in the context of strategic goals to drive stakeholder buy-in.
Additional Example: Aligning Benchmarking with Liquidity Goals
A financial analyst at a retail company is tasked with improving liquidity. The strategic goal is to maintain a current ratio above 1.5.
- Benchmarking against retail industry averages shows a current ratio of 1.3.
- The analyst identifies inventory turnover as a key driver and benchmarks it.
- Insights lead to initiatives to reduce inventory levels and improve cash conversion cycles.
This example demonstrates how benchmarking specific financial metrics can directly support strategic liquidity management.
By systematically aligning benchmarking activities with strategic financial goals, accountants and financial analysts can transform raw data into actionable insights that drive sustainable business performance.
8.2 Using Benchmark Data for Scenario and Sensitivity Analysis
Financial benchmarking provides accountants and financial analysts with a powerful foundation to perform scenario and sensitivity analyses. These analyses help organizations anticipate the impact of various internal and external changes on their financial health, enabling more informed decision-making.
What is Scenario Analysis?
Scenario analysis involves evaluating the financial outcomes under different hypothetical situations or “scenarios.” By leveraging benchmark data, analysts can create realistic and relevant scenarios based on industry standards or peer performance.
What is Sensitivity Analysis?
Sensitivity analysis examines how changes in one or more input variables affect a financial outcome. Benchmark data helps identify which variables are most critical by comparing performance ranges across peers.
How Benchmark Data Enhances Scenario and Sensitivity Analysis
- Realistic Assumptions: Benchmark data provides actual performance ranges, ensuring scenarios are grounded in reality.
- Comparative Context: Understanding where your company stands relative to peers helps prioritize which variables to test.
- Risk Identification: Variances from benchmarks highlight vulnerabilities or strengths.
Mind Map: Using Benchmark Data for Scenario and Sensitivity Analysis
Step-by-Step Example: Scenario Analysis Using Benchmark Data
Context: A mid-sized manufacturing company wants to forecast its operating margin under different market conditions.
-
Gather Benchmark Data:
- Industry average operating margin: 12%
- Top quartile operating margin: 18%
- Bottom quartile operating margin: 6%
-
Define Scenarios:
- Best Case: Operating margin improves to 18% (top quartile)
- Most Likely: Operating margin remains at 12% (industry average)
- Worst Case: Operating margin drops to 6% (bottom quartile)
-
Model Financial Outcomes:
- Current revenue: $50 million
- Calculate operating income for each scenario:
- Best Case: $50M * 18% = $9M
- Most Likely: $50M * 12% = $6M
- Worst Case: $50M * 6% = $3M
-
Interpretation:
- The company can assess how changes in operational efficiency or market conditions might impact profitability.
Mind Map: Scenario Analysis Example
Step-by-Step Example: Sensitivity Analysis Using Benchmark Data
Context: The same manufacturing company wants to understand how sensitive its net profit is to changes in revenue growth and cost of goods sold (COGS) percentage.
-
Identify Key Variables and Benchmark Ranges:
- Revenue Growth Rate: Industry range 2% to 8%
- COGS as % of Revenue: Industry range 60% to 70%
-
Set Base Case:
- Revenue: $50M
- Revenue Growth: 5%
- COGS: 65% of revenue
-
Create Sensitivity Table:
| Revenue Growth \ COGS % | 60% | 65% | 70% |
|---|---|---|---|
| 2% | $7.6M | $6.9M | $6.2M |
| 5% (Base) | $7.9M | $7.2M | $6.5M |
| 8% | $8.2M | $7.5M | $6.8M |
(Net Profit calculated as: Revenue * (1 + Growth) * (1 - COGS%) * Profit Margin Assumption)
- Interpretation:
- Net profit is more sensitive to changes in COGS percentage than revenue growth within the benchmarked ranges.
Mind Map: Sensitivity Analysis Example
Best Practices for Using Benchmark Data in Scenario and Sensitivity Analysis
- Use Reliable and Relevant Benchmarks: Ensure benchmark data is current and from comparable companies or industries.
- Incorporate Multiple Variables: Consider how variables interact rather than analyzing them in isolation.
- Validate Assumptions: Cross-check assumptions with internal data and expert opinions.
- Visualize Results: Use charts and tables to communicate findings clearly.
- Iterate Regularly: Update analyses as new benchmark data or internal results become available.
Summary
Using benchmark data for scenario and sensitivity analysis empowers accountants and financial analysts to create realistic financial models, anticipate risks, and support strategic decision-making. By grounding assumptions in industry data and exploring variable impacts, organizations can better prepare for uncertainty and optimize financial performance.
8.3 Benchmarking as a Tool for Risk Management
Financial benchmarking is a powerful tool not only for performance evaluation but also for identifying, assessing, and mitigating risks within an organization. By comparing financial metrics against industry standards or peer groups, accountants and financial analysts can uncover vulnerabilities and areas of potential risk before they escalate.
Why Use Benchmarking for Risk Management?
- Early Warning Signals: Deviations from benchmarks may indicate emerging financial risks.
- Objective Assessment: Provides quantifiable data to support risk evaluation.
- Prioritization: Helps focus on the most critical risk areas based on financial impact.
- Continuous Monitoring: Enables ongoing risk tracking through periodic benchmarking.
Mind Map: Benchmarking in Risk Management
Key Financial Metrics Indicative of Risk
| Metric | Risk Indicated | Example Scenario |
|---|---|---|
| Debt-to-Equity Ratio | High leverage risk | Company A has a ratio of 3.5 vs industry average 1.2, indicating high financial risk. |
| Current Ratio | Liquidity risk | Company B’s current ratio is 0.8, below benchmark 1.5, signaling potential short-term liquidity issues. |
| Interest Coverage Ratio | Ability to meet interest obligations | Company C’s ratio is 1.2 vs benchmark 3.0, showing risk of default on debt payments. |
| Operating Cash Flow | Cash flow risk | Company D shows declining cash flow compared to peers, indicating operational inefficiencies. |
Example 1: Identifying Liquidity Risk through Benchmarking
A mid-sized manufacturing firm notices its current ratio has dropped to 0.9, while the industry benchmark is 1.8. By benchmarking this metric, the finance team identifies a liquidity risk that could impair the company’s ability to meet short-term obligations. This triggers a deeper investigation into accounts receivable and inventory management, leading to corrective actions such as tightening credit policies and optimizing inventory levels.
Mind Map: Steps to Use Benchmarking for Risk Management
Example 2: Mitigating Credit Risk via Benchmarking
A financial analyst benchmarks the Days Sales Outstanding (DSO) for a retail company and finds it is 75 days, whereas the industry average is 45 days. This higher DSO indicates a risk of delayed cash inflows and potential bad debts. The company responds by revising credit terms and enhancing collections processes, reducing DSO to 50 days within six months.
Integrating Benchmarking into Enterprise Risk Management (ERM)
Benchmarking can be embedded into the ERM framework by:
- Setting financial benchmarks as risk indicators.
- Using benchmarking results to update risk registers.
- Aligning risk appetite with benchmark performance thresholds.
- Reporting benchmarking insights in risk committee meetings.
Mind Map: Benchmarking within ERM Framework
Final Thoughts
Using financial benchmarking as a risk management tool empowers accountants and financial analysts to proactively detect financial vulnerabilities, prioritize risk mitigation efforts, and support strategic decision-making. By integrating benchmarking into regular financial reviews and ERM processes, organizations can enhance resilience and safeguard long-term financial health.
8.4 Continuous Improvement Cycles Using Benchmark Feedback
Continuous improvement cycles are essential for leveraging benchmarking insights to drive ongoing financial performance enhancements. By systematically using benchmark feedback, accountants and financial analysts can identify gaps, implement changes, monitor results, and refine strategies in a structured way.
What is a Continuous Improvement Cycle?
A continuous improvement cycle (often modeled as PDCA: Plan-Do-Check-Act) is a repetitive process used to enhance processes, products, or services. In financial benchmarking, it helps organizations use benchmark data to improve financial metrics continuously.
Why Use Benchmark Feedback in Continuous Improvement?
- Identify Performance Gaps: Benchmarking highlights where your organization lags behind peers or industry standards.
- Set Realistic Targets: Using external benchmarks helps set achievable and relevant improvement goals.
- Monitor Progress: Regular benchmarking allows tracking improvements over time.
- Encourage Accountability: Clear metrics and feedback loops motivate teams to act.
Mind Map: Continuous Improvement Cycle Using Benchmark Feedback
Step-by-Step Process with Examples
Plan
- Analyze Benchmark Data: Suppose your company’s operating margin is 5% below the industry average of 15%.
- Identify Performance Gaps: The gap indicates inefficiencies in cost management.
- Set Improvement Objectives: Aim to improve operating margin by 3% within 12 months.
- Develop Action Plans: Focus on reducing overhead costs and optimizing supply chain.
Do
- Implement cost-cutting initiatives such as renegotiating supplier contracts and automating manual processes.
- Assign responsibilities to finance and procurement teams.
- Communicate goals and timelines across departments.
Check
- After 6 months, measure the updated operating margin.
- Compare it against the original benchmark and target.
- Example: Operating margin improved by 1.5%, halfway to the goal.
Act
- Standardize successful cost-saving measures as best practices.
- Adjust action plans to address remaining gaps, such as exploring new technology investments.
- Prepare for the next benchmarking cycle to continue progress.
Mind Map: Example of Benchmark Feedback Integration
Practical Example: Quarterly Continuous Improvement Cycle
| Quarter | Activity | Outcome |
|---|---|---|
| Q1 | Collect benchmark data and analyze gaps | Identified low ROA compared to peers |
| Q2 | Implement asset utilization improvement plan | Increased asset turnover by 10% |
| Q3 | Measure impact and compare with benchmarks | ROA improved but still below target |
| Q4 | Adjust plan to focus on fixed asset management | Plan to dispose of underutilized assets |
Tips for Successful Continuous Improvement Using Benchmark Feedback
- Maintain Data Quality: Ensure benchmark data is accurate and timely.
- Engage Cross-Functional Teams: Collaboration between accounting, operations, and management enhances results.
- Set SMART Goals: Specific, Measurable, Achievable, Relevant, Time-bound targets.
- Document Learnings: Keep records of what worked and what didn’t for future cycles.
- Leverage Technology: Use dashboards and BI tools for real-time monitoring.
By embedding continuous improvement cycles into financial benchmarking practices, accountants and financial analysts can transform static data into dynamic strategies that drive sustained financial health and competitive advantage.
8.5 Example: Incorporating Benchmarking into Quarterly FP&A Reviews
Financial Planning & Analysis (FP&A) teams play a critical role in guiding an organization’s financial strategy and performance. Incorporating benchmarking into quarterly FP&A reviews enhances decision-making by providing context around performance, identifying gaps, and setting realistic targets.
Why Incorporate Benchmarking in Quarterly FP&A Reviews?
- Contextualize Performance: Understand how your company stacks up against peers and industry standards.
- Identify Improvement Areas: Pinpoint specific financial metrics where performance lags.
- Validate Forecasts: Use benchmarks to challenge assumptions and improve forecast accuracy.
- Drive Accountability: Set measurable targets aligned with industry best practices.
Step-by-Step Example: Incorporating Benchmarking into a Quarterly FP&A Review
Step 1: Select Relevant Benchmark Metrics
For a mid-sized manufacturing company, key metrics might include:
- Gross Margin %
- Operating Expense Ratio
- Inventory Turnover
- Return on Assets (ROA)
- Days Sales Outstanding (DSO)
Step 2: Gather Benchmark Data
Sources:
- Industry reports (e.g., Deloitte Manufacturing Benchmarking Report)
- Public financial statements of peer companies
- Internal historical data for trend comparison
Step 3: Prepare a Benchmarking Dashboard
Create a dashboard comparing your company’s quarterly results against benchmarks.
Benchmarking Dashboard Mind Map
Step 4: Analyze Variances and Identify Drivers
Example: Gross Margin for Q1 is 32%, while industry average is 38%.
- Investigate causes: higher raw material costs, pricing strategy, or inefficiencies.
- Use root cause analysis to pinpoint actionable areas.
Variance Analysis Mind Map
Step 5: Integrate Findings into Forecast and Budget
- Adjust revenue and cost assumptions based on benchmarking insights.
- Set realistic targets aligned with top-performing peers.
Example:
- Forecasted Operating Expense Ratio was 25%, benchmark suggests 22%.
- Revise budget to target 23% with a plan to reduce discretionary spend.
Step 6: Communicate Results to Stakeholders
- Present benchmarking insights alongside financial results.
- Use visual aids like charts and mind maps to clarify findings.
Communication Mind Map
Practical Example Summary
| Metric | Company Q1 | Industry Benchmark | Gap | Action Plan |
|---|---|---|---|---|
| Gross Margin % | 32% | 38% | -6% | Review pricing, reduce costs |
| Operating Expense Ratio | 25% | 22% | +3% | Cut discretionary expenses |
| Inventory Turnover | 4.5x | 5.2x | -0.7 | Improve inventory management |
| ROA | 7% | 9% | -2% | Asset utilization optimization |
| DSO | 45 days | 38 days | +7 | Enhance collections process |
Benefits Realized
- More accurate and competitive forecasting.
- Clearer understanding of operational inefficiencies.
- Enhanced stakeholder confidence through data-driven insights.
Final Notes
Incorporating benchmarking into quarterly FP&A reviews is not a one-time exercise but a continuous process. Over time, this practice builds a culture of performance excellence and strategic agility.
9. Case Studies: Real-World Financial Benchmarking Examples
9.1 Benchmarking in the Banking Sector: Profitability and Risk Metrics
Financial benchmarking in the banking sector is critical for understanding a bank’s performance relative to its peers and identifying areas for improvement. Given the highly regulated and competitive nature of banking, benchmarking focuses heavily on profitability and risk metrics to ensure both growth and stability.
Key Profitability Metrics in Banking
- Net Interest Margin (NIM): Measures the difference between interest income generated and interest paid out relative to earning assets.
- Return on Assets (ROA): Indicates how efficiently a bank uses its assets to generate profit.
- Return on Equity (ROE): Measures profitability relative to shareholders’ equity.
- Cost-to-Income Ratio: Reflects operational efficiency by comparing operating expenses to operating income.
Example: Calculating NIM
A bank has interest income of $150 million and interest expenses of $50 million. Its average earning assets are $3 billion.
\[ \text{NIM} = \frac{150M - 50M}{3B} = \frac{100M}{3B} = 3.33\% \]
This 3.33% NIM can then be benchmarked against peer banks to assess competitiveness.
Key Risk Metrics in Banking
- Non-Performing Loan (NPL) Ratio: Percentage of loans in default or close to being in default.
- Loan Loss Provisions to NPLs: Measures adequacy of reserves against bad loans.
- Capital Adequacy Ratio (CAR): Ensures banks have enough capital to absorb losses.
- Liquidity Coverage Ratio (LCR): Measures the ability to meet short-term obligations.
Example: NPL Ratio Calculation
If a bank has $500 million in loans and $25 million are non-performing:
\[ \text{NPL Ratio} = \frac{25M}{500M} = 5\% \]
A 5% NPL ratio can be compared to industry averages to evaluate credit risk management.
Mind Map: Profitability Metrics in Banking
Mind Map: Risk Metrics in Banking
Integrated Benchmarking Example: Profitability and Risk
Scenario:
Bank A wants to benchmark its profitability and risk metrics against the top 5 banks in its region.
| Metric | Bank A | Peer Average | Interpretation |
|---|---|---|---|
| Net Interest Margin | 3.33% | 3.50% | Slightly below peer average |
| Return on Assets | 1.2% | 1.5% | Needs improvement |
| Cost-to-Income Ratio | 55% | 50% | Higher operational costs |
| Non-Performing Loan Ratio | 5% | 3.5% | Higher credit risk |
| Capital Adequacy Ratio | 12% | 11.5% | Strong capital position |
Analysis:
- Bank A’s profitability metrics are slightly below peers, indicating potential inefficiencies or pricing issues.
- The higher NPL ratio signals elevated credit risk, which could impact future profitability.
- The strong CAR suggests the bank is well-capitalized to absorb potential losses.
Best Practice:
- Use benchmarking results to prioritize reducing NPLs through improved credit underwriting.
- Implement cost control measures to improve the cost-to-income ratio.
- Monitor NIM trends to adjust interest rate strategies.
Best Practices for Benchmarking in Banking Sector
- Use Peer Groups Carefully: Select banks with similar size, business models, and geographic focus to ensure relevant comparisons.
- Normalize Data: Adjust for one-time events or accounting differences to improve comparability.
- Combine Quantitative and Qualitative Insights: Understand regulatory changes, market conditions, and strategic initiatives behind the numbers.
- Regular Updates: Benchmark periodically to track trends and respond proactively.
Summary
Benchmarking profitability and risk metrics in the banking sector provides accountants and financial analysts with actionable insights to enhance performance and manage risks effectively. By combining clear metric definitions, practical calculations, and peer comparisons, finance professionals can drive continuous improvement and strategic decision-making.
9.2 Manufacturing Industry: Cost Efficiency and Asset Utilization
Financial benchmarking in the manufacturing industry is crucial for understanding how well a company manages its costs and utilizes its assets to generate revenue. This section delves into best practices and examples that accountants and financial analysts can apply to evaluate and improve cost efficiency and asset utilization.
Key Concepts in Manufacturing Benchmarking
- Cost Efficiency: Measures how effectively a company controls its production and operational costs relative to output.
- Asset Utilization: Assesses how well a company uses its fixed and current assets to generate sales or production.
Mind Map: Core Areas of Manufacturing Benchmarking
Best Practices for Cost Efficiency Benchmarking
-
Break Down Costs by Category:
- Separate direct materials, direct labor, and overhead to identify specific areas for improvement.
-
Use Cost per Unit as a Benchmark:
- Calculate the total production cost divided by units produced.
- Compare with industry averages or competitors.
-
Analyze Variance Over Time:
- Track cost trends monthly or quarterly to spot inefficiencies early.
-
Incorporate Activity-Based Costing (ABC):
- Assign overhead costs more accurately to products based on activities.
Example: Cost Efficiency Analysis
Company A produces 10,000 units monthly.
| Cost Category | Monthly Cost ($) | Cost per Unit ($) |
|---|---|---|
| Direct Materials | 150,000 | 15.00 |
| Direct Labor | 80,000 | 8.00 |
| Overhead | 70,000 | 7.00 |
| Total Cost | 300,000 | 30.00 |
Industry Benchmark: $27.50 per unit.
Insight: Company A’s cost per unit is $2.50 higher than the industry benchmark, indicating potential inefficiencies.
Mind Map: Cost Efficiency Improvement Steps
Best Practices for Asset Utilization Benchmarking
-
Calculate Fixed Asset Turnover Ratio:
- Formula: Net Sales / Average Fixed Assets
- Higher ratio indicates better utilization.
-
Measure Capacity Utilization Rate:
- Actual Output / Maximum Possible Output
- Helps identify underused production capacity.
-
Track Inventory Turnover:
- Cost of Goods Sold / Average Inventory
- Indicates how quickly inventory is sold and replaced.
-
Monitor Equipment Downtime:
- Track downtime hours and its impact on production.
- Benchmark against industry standards.
Example: Asset Utilization Metrics
Company B financials:
- Net Sales: $5,000,000
- Average Fixed Assets: $1,250,000
- Cost of Goods Sold: $3,000,000
- Average Inventory: $600,000
- Maximum Production Capacity: 50,000 units
- Actual Production: 40,000 units
- Equipment Downtime: 120 hours/month
Calculations:
- Fixed Asset Turnover = 5,000,000 / 1,250,000 = 4.0
- Capacity Utilization Rate = 40,000 / 50,000 = 80%
- Inventory Turnover = 3,000,000 / 600,000 = 5.0
Industry Benchmarks:
- Fixed Asset Turnover: 4.5
- Capacity Utilization: 85%
- Inventory Turnover: 6.0
Insights:
- Company B is slightly below benchmark in all three metrics, suggesting room for improvement in asset use and inventory management.
Mind Map: Asset Utilization Optimization Strategies
Integrated Example: Combining Cost Efficiency and Asset Utilization
Scenario:
Company C notices rising production costs and stagnant sales. By benchmarking:
- Cost per unit is 10% above industry average.
- Capacity utilization is at 70%, below the 85% benchmark.
- Equipment downtime is 150 hours/month, higher than peers.
Action Plan:
- Implement lean manufacturing to reduce waste and lower costs.
- Schedule regular maintenance to reduce downtime.
- Optimize production scheduling to increase capacity utilization.
- Negotiate better material prices.
Expected Outcome:
- Reduce cost per unit by 8% within 6 months.
- Increase capacity utilization to 80%.
- Decrease equipment downtime by 40%.
Summary
Financial benchmarking in manufacturing focusing on cost efficiency and asset utilization provides actionable insights to improve profitability and operational effectiveness. Accountants and financial analysts should leverage detailed cost breakdowns, asset turnover metrics, and industry benchmarks to identify gaps and drive continuous improvement.
By integrating these practices with real-world examples and mind maps, finance professionals can better communicate findings and support strategic decision-making in manufacturing organizations.
9.3 Retail Sector: Inventory and Sales Performance Benchmarks
Financial benchmarking in the retail sector focuses heavily on inventory management and sales performance, as these are critical drivers of profitability and operational efficiency. Accountants and financial analysts must understand key metrics, best practices, and how to interpret benchmarking data to optimize retail operations.
Key Inventory Benchmarks in Retail
- Inventory Turnover Ratio: Measures how many times inventory is sold and replaced over a period.
- Days Inventory Outstanding (DIO): Average number of days inventory is held before being sold.
- Stockout Rate: Percentage of times items are out of stock when demanded.
- Gross Margin Return on Investment (GMROI): Profitability of inventory relative to its cost.
Key Sales Performance Benchmarks
- Sales per Square Foot: Revenue generated per square foot of retail space.
- Same-Store Sales Growth: Year-over-year sales growth for stores open at least one year.
- Conversion Rate: Percentage of store visitors who make a purchase.
- Average Transaction Value (ATV): Average amount spent per customer transaction.
Mind Map: Inventory Performance Metrics
Mind Map: Sales Performance Metrics
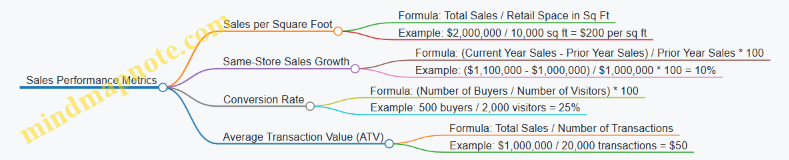
Best Practices for Retail Benchmarking
- Use Comparable Peers: Benchmark against retailers of similar size, product mix, and market.
- Segment by Product Category: Different categories have varied turnover and margin profiles.
- Adjust for Seasonality: Retail sales and inventory fluctuate seasonally; normalize data accordingly.
- Combine Financial and Operational Data: Integrate POS, inventory management, and financial systems for comprehensive analysis.
- Regularly Update Benchmarks: Retail dynamics change rapidly; update benchmarks quarterly or biannually.
Example: Benchmarking Inventory Turnover for a Mid-Sized Apparel Retailer
Scenario:
- Cost of Goods Sold (COGS): $3,600,000
- Average Inventory: $900,000
Calculation:
- Inventory Turnover Ratio = $3,600,000 / $900,000 = 4 times per year
- Days Inventory Outstanding = 365 / 4 = 91.25 days
Interpretation:
- The retailer turns over its inventory 4 times annually, holding inventory for about 91 days.
- Industry benchmark for apparel is typically 6-8 times turnover, indicating this retailer may be overstocked or slow-moving.
Actionable Insight:
- Review slow-moving SKUs and optimize purchasing.
- Implement promotions or s to reduce excess inventory.
Example: Sales Performance Benchmarking for a Grocery Store
Scenario:
- Total Sales: $5,000,000
- Retail Space: 20,000 sq ft
- Prior Year Sales: $4,500,000
- Number of Visitors: 50,000
- Number of Buyers: 15,000
- Number of Transactions: 18,000
Calculations:
- Sales per Square Foot = $5,000,000 / 20,000 = $250
- Same-Store Sales Growth = ($5,000,000 - $4,500,000) / $4,500,000 * 100 = 11.11%
- Conversion Rate = (15,000 / 50,000) * 100 = 30%
- Average Transaction Value = $5,000,000 / 18,000 = $277.78
Interpretation:
- Sales per square foot of $250 is strong compared to industry average of $200.
- Positive same-store sales growth indicates healthy performance.
- Conversion rate of 30% suggests good customer engagement.
- High ATV reflects effective upselling or premium product mix.
Actionable Insight:
- Continue marketing efforts that drive foot traffic.
- Analyze customer purchase patterns to further increase ATV.
Integrating Benchmarking Insights
Retail accountants and financial analysts should use these benchmarks to:
- Identify operational inefficiencies.
- Support inventory optimization strategies.
- Inform pricing and promotional decisions.
- Guide capital allocation for store expansions or remodels.
By weaving benchmarking into regular financial reviews, retail businesses can maintain competitiveness and improve profitability.
Summary
Financial benchmarking in the retail sector, particularly focusing on inventory and sales performance, provides actionable insights that help optimize working capital and drive revenue growth. Using clear metrics, real-world examples, and best practices ensures accountants and analysts can effectively support retail management decisions.
9.4 Technology Firms: R&D Spend and Growth Metrics
Financial benchmarking in technology firms often centers around innovation-driven metrics, with Research & Development (R&D) spend and growth indicators being critical for assessing competitive positioning and long-term sustainability. This section explores best practices for benchmarking these metrics, supported by clear examples and mind maps to aid understanding.
Understanding R&D Spend in Technology Firms
R&D spend represents the investment a technology company makes towards developing new products, improving existing technologies, and driving innovation. Benchmarking R&D spend helps accountants and financial analysts evaluate whether a firm is investing adequately compared to its peers and industry standards.
Key points:
- R&D intensity is often expressed as a percentage of revenue.
- High R&D spend can indicate aggressive innovation but may impact short-term profitability.
- Benchmarking helps balance innovation investment with financial health.
Example: Company A, a mid-sized software firm, spends $50 million on R&D with annual revenues of $500 million, resulting in an R&D intensity of 10%. Comparing this to industry peers who average 12% helps identify if Company A is under-investing.
Growth Metrics Relevant to Technology Firms
Growth metrics provide insight into how effectively a technology firm is scaling its business and capitalizing on innovation.
Common growth metrics include:
- Revenue Growth Rate: Year-over-year increase in sales.
- User or Customer Growth: Especially relevant for SaaS and platform companies.
- Market Share Growth: Changes in the company’s portion of the market.
- Gross Margin Expansion: Indicates improving operational efficiency.
Example: Company B reports a 25% revenue growth rate over the past year, while the industry average is 18%. This suggests Company B is outperforming peers in scaling its business.
Mind Map: Key Components of R&D Spend Benchmarking
Mind Map: Growth Metrics for Technology Firms
Integrated Example: Benchmarking a Technology Firm
Scenario: TechCo is a publicly traded technology firm specializing in cloud computing. The finance team wants to benchmark their R&D spend and growth metrics against competitors.
Step 1: Collect Data
- TechCo’s R&D spend: $120 million
- Revenue: $1 billion
- R&D intensity: 12%
- Revenue growth: 20%
Competitor A:
- R&D intensity: 15%
- Revenue growth: 18%
Competitor B:
- R&D intensity: 10%
- Revenue growth: 22%
Step 2: Analyze
- TechCo’s R&D intensity is between Competitor A and B.
- Revenue growth is strong but slightly below Competitor B.
Step 3: Insights
- TechCo might consider increasing R&D investment to match Competitor A’s innovation pace.
- Alternatively, TechCo’s current R&D spend is efficiently supporting solid growth.
Step 4: Action
- Finance team recommends monitoring R&D ROI closely.
- Suggests quarterly benchmarking updates to track trends.
Best Practices for Accountants and Financial Analysts
- Normalize R&D Spend: Adjust for company size and business model to ensure apples-to-apples comparisons.
- Use Multi-Year Data: Avoid conclusions based on a single year’s figures due to volatility.
- Correlate R&D with Outcomes: Link spend to product launches, patents, or revenue growth to assess effectiveness.
- Combine Quantitative and Qualitative Data: Include market positioning and innovation pipeline insights.
- Communicate Clearly: Present benchmarking results with visual aids like charts and mind maps for stakeholder clarity.
By integrating these best practices and examples, accountants and financial analysts can provide valuable insights that help technology firms optimize their R&D investments and drive sustainable growth.
9.5 Non-Profit Organizations: Financial Sustainability Benchmarks
Financial sustainability is critical for non-profit organizations (NPOs) to continue delivering on their mission over the long term. Unlike for-profit entities, NPOs rely heavily on donations, grants, and fundraising activities, making their financial benchmarking unique. This section explores key financial sustainability benchmarks tailored for non-profits, practical examples, and mind maps to help accountants and financial analysts understand and apply these concepts effectively.
Key Financial Sustainability Benchmarks for Non-Profits
- Operating Reserve Ratio: Measures how many months an organization can continue operating using its unrestricted net assets without additional income.
- Program Expense Ratio: Percentage of total expenses spent directly on program services versus administrative and fundraising costs.
- Fundraising Efficiency: Amount spent to raise each dollar of contributions.
- Revenue Diversification Index: Degree to which revenue streams are diversified to reduce dependency on a single source.
- Liquidity Ratio: Ability to cover short-term obligations with liquid assets.
- Debt to Asset Ratio: Measures financial leverage and risk.
Mind Map: Financial Sustainability Benchmarks for Non-Profits
Practical Example: Benchmarking a Mid-Sized Non-Profit
Organization Profile:
- Annual Budget: $2 million
- Unrestricted Net Assets: $500,000
- Monthly Expenses: $160,000
- Program Expenses: $1.6 million
- Fundraising Expenses: $150,000
- Contributions Raised: $1.5 million
- Cash & Equivalents: $300,000
- Current Liabilities: $250,000
- Total Liabilities: $400,000
- Total Assets: $1.8 million
Calculations:
- Operating Reserve Ratio = $500,000 / $160,000 = 3.13 months
- Program Expense Ratio = $1,600,000 / $2,000,000 = 80%
- Fundraising Efficiency = $150,000 / $1,500,000 = 10%
- Liquidity Ratio = $300,000 / $250,000 = 1.2
- Debt to Asset Ratio = $400,000 / $1,800,000 = 22.2%
Interpretation:
- The organization maintains a healthy reserve covering over 3 months of expenses.
- Program expense ratio is strong, indicating focus on mission-related activities.
- Fundraising efficiency is within acceptable range.
- Liquidity is sufficient to cover short-term liabilities.
- Debt levels are moderate, indicating manageable financial risk.
Mind Map: Steps to Implement Financial Benchmarking in Non-Profits
Best Practices for Financial Benchmarking in Non-Profits
- Use Unrestricted Funds for Reserve Calculations: Only unrestricted net assets should be considered to ensure funds are available for general operations.
- Benchmark Against Similar Organizations: Compare with peers of similar size, mission, and geography for relevant insights.
- Incorporate Non-Financial Metrics: Include program outcomes and impact measures to complement financial data.
- Regularly Update Benchmarks: Financial environments change; update benchmarks annually or quarterly.
- Communicate Transparently: Share benchmarking results with boards, donors, and management to build trust.
Example: Communicating Benchmark Results to a Non-Profit Board
“Our analysis shows that our operating reserve covers just over 3 months of expenses, aligning with the recommended minimum of 3 months. However, to increase financial resilience, we should aim to build this reserve to 6 months over the next two years. Our program expense ratio is strong at 80%, reflecting efficient use of funds toward our mission. Fundraising efficiency at 10% is acceptable, but there is room to optimize costs further. We recommend diversifying revenue streams to reduce reliance on grants, which currently make up 40% of our income. Overall, our liquidity and debt levels indicate a stable financial position, but proactive measures will enhance sustainability.”
10. Advanced Topics in Financial Benchmarking
10.1 Benchmarking for Mergers and Acquisitions Due Diligence
Financial benchmarking plays a critical role in the due diligence process during mergers and acquisitions (M&A). It helps accountants and financial analysts assess the target company’s financial health, identify risks, and validate valuation assumptions by comparing key financial metrics against industry standards and peer companies.
Why Benchmarking is Essential in M&A Due Diligence
- Validate Financial Performance: Confirm the target’s reported financial metrics are in line with industry norms.
- Identify Red Flags: Spot unusual variances or outliers that may indicate financial distress or aggressive accounting.
- Assess Synergies and Risks: Understand where operational efficiencies or cost savings may be realized.
- Support Valuation: Benchmark multiples such as EBITDA or revenue multiples to ensure fair pricing.
Key Areas to Benchmark in M&A Due Diligence
Step-by-Step Benchmarking Process in M&A
- Collect Target Company Financials: Obtain audited financial statements, management reports, and forecasts.
- Select Benchmark Peers: Identify comparable companies in the same industry, size, and geography.
- Normalize Data: Adjust for non-recurring items, accounting differences, and one-time events.
- Calculate Key Metrics: Compute profitability, liquidity, efficiency, and valuation ratios.
- Compare and Analyze: Identify gaps, strengths, and weaknesses relative to peers.
- Report Findings: Summarize insights to support negotiation and integration planning.
Example: Benchmarking a Target Company in the Manufacturing Sector
| Metric | Target Company | Industry Median | Analysis |
|---|---|---|---|
| EBITDA Margin | 12% | 18% | Below median; investigate cost structure |
| Revenue Growth (3yr) | 5% | 8% | Slower growth; check market conditions |
| Current Ratio | 1.8 | 1.5 | Strong liquidity; positive sign |
| Debt to Equity | 1.2 | 0.9 | Higher leverage; assess debt servicing risks |
| EV/EBITDA Multiple | 6.5x | 7.0x | Slightly undervalued; potential negotiation point |
Best Practice: Adjust EBITDA for one-time restructuring costs to get a normalized margin.
Mind Map: Common Pitfalls in M&A Benchmarking

Integrating Benchmarking Insights into M&A Decision Making
- Use benchmarking results to adjust purchase price or deal structure.
- Highlight operational areas for post-merger integration focus.
- Identify potential financial risks that require mitigation.
- Support board and investor communications with objective data.
Summary
Benchmarking during M&A due diligence equips accountants and financial analysts with a structured approach to evaluate the target company’s financial standing against industry norms. By combining quantitative metrics with qualitative insights, professionals can make informed decisions that reduce risk and maximize value creation.
For further reading, consider exploring benchmarking tools tailored for M&A, and case studies highlighting successful integration driven by thorough financial benchmarking.
10.2 Using Machine Learning to Enhance Benchmarking Accuracy
Financial benchmarking traditionally relies on historical data analysis and manual comparison of financial ratios and metrics. However, the integration of Machine Learning (ML) techniques can significantly enhance the accuracy, depth, and predictive power of benchmarking processes. This section explores how ML can be leveraged by accountants and financial analysts to improve benchmarking outcomes.
What is Machine Learning in Financial Benchmarking?
Machine Learning is a subset of artificial intelligence that enables systems to learn from data, identify patterns, and make decisions with minimal human intervention. In financial benchmarking, ML algorithms can analyze vast datasets, uncover hidden relationships, and predict future performance benchmarks more accurately than traditional methods.
Mind Map: Machine Learning Applications in Financial Benchmarking
Key Machine Learning Techniques for Benchmarking
-
Regression Analysis
- Used to predict continuous financial metrics such as revenue growth or profit margins based on historical data.
- Example: Predicting next quarter’s gross margin benchmark for a retail company based on past sales trends and economic indicators.
-
Clustering
- Groups similar companies or financial periods to identify peer groups or benchmark clusters.
- Example: Segmenting companies by size, industry, and financial health to create more relevant benchmarking groups.
-
Anomaly Detection
- Identifies unusual financial performance or outliers that may indicate errors or exceptional events.
- Example: Detecting an unexpected spike in operating expenses that deviates significantly from peer benchmarks.
-
Classification
- Categorizes financial data into predefined classes, such as risk levels or performance tiers.
- Example: Classifying companies into ‘high’, ‘medium’, or ‘low’ profitability groups for benchmarking purposes.
Mind Map: Machine Learning Workflow for Financial Benchmarking
Practical Example: Using ML Regression to Predict Profit Margin Benchmarks
Scenario: An accountant wants to benchmark the net profit margin of a mid-sized manufacturing company against industry peers and predict future benchmarks.
Steps:
-
Data Collection: Gather historical financial data (net profit margin, revenue, cost of goods sold, operating expenses) from the company and peer firms over 5 years.
-
Feature Engineering: Create features such as revenue growth rate, cost ratios, and macroeconomic indicators.
-
Model Training: Use a supervised regression algorithm (e.g., Random Forest Regressor) to learn the relationship between features and net profit margin.
-
Prediction: Input current financial data to predict the expected net profit margin benchmark for the upcoming fiscal year.
-
Analysis: Compare predicted benchmarks with actual performance to identify gaps and improvement areas.
Outcome: The ML model predicts a 12% net profit margin benchmark, while the company currently operates at 9%. This insight helps the finance team focus on cost optimization and revenue enhancement strategies.
Benefits of Machine Learning in Financial Benchmarking
- Enhanced Accuracy: ML models can capture complex, nonlinear relationships in financial data.
- Scalability: Ability to process and analyze large volumes of data quickly.
- Dynamic Benchmarking: Models can be retrained regularly to reflect the latest market conditions.
- Reduced Bias: Automated analysis minimizes subjective judgment errors.
Challenges and Considerations
- Data Quality: ML models require clean, comprehensive datasets.
- Interpretability: Complex models may be difficult to explain to stakeholders.
- Resource Intensive: Requires technical expertise and computational resources.
Final Thoughts
Machine Learning is transforming financial benchmarking by providing accountants and financial analysts with powerful tools to enhance accuracy and insight. By integrating ML into benchmarking workflows, finance professionals can move beyond static comparisons to predictive, dynamic, and actionable benchmarking strategies.
Additional Resources
- “Hands-On Machine Learning for Finance” by Saurav Singla
- Online courses on ML for finance (Coursera, edX)
- Open-source ML libraries: Scikit-learn, TensorFlow, PyTorch
10.3 Cross-Border Benchmarking: Handling Currency and Regulatory Differences
Cross-border financial benchmarking introduces unique complexities that accountants and financial analysts must carefully navigate. Differences in currency valuations, exchange rate volatility, and diverse regulatory frameworks can significantly impact the accuracy and comparability of benchmarking results. This section explores best practices and practical examples to effectively manage these challenges.
Understanding the Challenges
- Currency Fluctuations: Exchange rates can fluctuate daily, affecting the valuation of financial metrics when converted.
- Regulatory Variations: Different countries have varying accounting standards, tax laws, and disclosure requirements.
- Economic Environment: Inflation rates, interest rates, and economic policies differ and influence financial performance.
Best Practices for Handling Currency Differences
Use a Consistent Base Currency
- Select a single reporting currency for all benchmarking data.
- Example: A US-based company benchmarking European peers converts all figures to USD using a consistent exchange rate.
Choose Appropriate Exchange Rates
- Spot Rate: Use for transactions on a specific date.
- Average Rate: Use for income statement items over a period.
- Closing Rate: Use for balance sheet items at period end.
Adjust for Inflation and Purchasing Power Parity (PPP)
- Normalize financials to account for inflation differences.
- Use PPP adjustments to reflect true economic value.
Document Currency Conversion Methods
- Maintain transparency on exchange rates and conversion dates.
Best Practices for Handling Regulatory Differences
Understand Local Accounting Standards
- IFRS vs GAAP differences impact revenue recognition, asset valuation, etc.
- Example: Lease accounting under IFRS 16 vs US GAAP ASC 842.
Normalize Financial Statements
- Adjust financials to a common accounting framework where possible.
- Example: Reclassify certain expenses or revenue items for comparability.
Consider Tax Regimes and Incentives
- Tax rates and incentives affect net profitability.
- Example: A company in a low-tax jurisdiction may report higher net margins.
Stay Updated on Regulatory Changes
- Regularly review changes in reporting requirements.
Mind Map: Cross-Border Benchmarking Key Considerations
Example 1: Currency Conversion in Benchmarking
A Canadian company is benchmarking its financial performance against a UK competitor. The Canadian company reports in CAD, while the UK competitor reports in GBP.
- The analyst chooses USD as the base currency.
- For the income statement, the analyst uses the average exchange rate for the year: 1 GBP = 1.35 USD, 1 CAD = 0.80 USD.
- For the balance sheet, the closing exchange rate is used: 1 GBP = 1.40 USD, 1 CAD = 0.82 USD.
- After conversion, the analyst adjusts for inflation differences between Canada and the UK to ensure comparability.
This approach ensures apples-to-apples comparison despite currency differences.
Example 2: Adjusting for Regulatory Differences
A US company benchmarking against a German firm notices differences in lease accounting impacting operating expenses.
- The US company follows US GAAP, recognizing leases differently than the German firm using IFRS.
- The analyst adjusts the German firm’s financials to reflect US GAAP lease treatment.
- This normalization allows a fair comparison of operating margins.
Summary
Cross-border benchmarking requires meticulous adjustments for currency and regulatory differences to ensure meaningful insights. By adopting consistent currency conversion methods, normalizing financial statements, and understanding local regulations, accountants and financial analysts can overcome these challenges and leverage benchmarking as a powerful tool for global financial analysis.
10.4 ESG (Environmental, Social, Governance) Metrics in Financial Benchmarking
Introduction
Environmental, Social, and Governance (ESG) metrics have become essential components in financial benchmarking, reflecting a company’s sustainability and ethical impact alongside traditional financial performance. For accountants and financial analysts, integrating ESG metrics into benchmarking provides a more holistic view of organizational health and long-term value creation.
Why ESG Matters in Financial Benchmarking
- Investor Demand: Increasingly, investors seek companies with strong ESG practices.
- Risk Management: ESG factors help identify non-financial risks that could impact financial outcomes.
- Regulatory Compliance: Many jurisdictions require ESG disclosures.
- Reputation & Brand Value: Positive ESG performance can enhance market positioning.
Key ESG Metrics in Financial Benchmarking
| ESG Dimension | Common Metrics | Description | Example |
|---|---|---|---|
| Environmental | Carbon Emissions (Scope 1, 2, 3) | Measures direct and indirect greenhouse gas emissions | Company A reduced Scope 1 emissions by 15% YoY |
| Energy Consumption | Total energy used in operations | Company B improved energy efficiency by 10% | |
| Water Usage | Volume of water consumed | Company C implemented water recycling saving 20% water | |
| Social | Employee Turnover Rate | Percentage of employees leaving annually | Company D reduced turnover from 12% to 8% |
| Diversity & Inclusion | % of diverse employees in workforce/leadership | Company E achieved 40% female leadership representation | |
| Community Engagement | Investments or volunteer hours in community projects | Company F donated 5% of profits to local causes | |
| Governance | Board Independence | % of independent directors on board | Company G has 75% independent board members |
| Executive Compensation Alignment | Link between pay and performance | Company H ties 30% of bonuses to ESG goals | |
| Ethics & Compliance | Number of violations or whistleblower reports | Company I reported zero compliance breaches last year |
Mind Map: ESG Metrics Breakdown
Integrating ESG into Financial Benchmarking Process
- Identify Relevant ESG Metrics: Tailor ESG KPIs to industry and company strategy.
- Collect Reliable Data: Use verified sources, sustainability reports, and third-party audits.
- Normalize ESG Data: Adjust for company size, geography, and sector differences.
- Combine ESG with Financial Metrics: Create composite scores or dashboards.
- Analyze Trends and Gaps: Compare against peers and industry standards.
- Report & Communicate: Present ESG benchmarking results alongside financial insights.
Example: Benchmarking ESG Performance of Two Retail Companies
| Metric | Company X | Company Y | Industry Average |
|---|---|---|---|
| Carbon Emissions (tons) | 12,000 | 15,000 | 13,500 |
| Energy Consumption (MWh) | 50,000 | 45,000 | 48,000 |
| Employee Turnover (%) | 10 | 18 | 14 |
| Female Leadership (%) | 35 | 25 | 30 |
| Board Independence (%) | 80 | 60 | 70 |
Insights:
- Company X leads in carbon emissions and employee retention.
- Company Y is more energy efficient but lags in governance.
- Both companies have room to improve female leadership representation.
Mind Map: ESG Benchmarking Workflow
Best Practices for ESG Financial Benchmarking
- Align ESG Metrics with Business Strategy: Ensure relevance and impact.
- Use Standardized Frameworks: GRI, SASB, TCFD for consistency.
- Engage Cross-Functional Teams: Finance, sustainability, HR, and compliance.
- Leverage Technology: Use ESG data platforms and analytics tools.
- Regularly Update Benchmarks: Reflect evolving regulations and market expectations.
Conclusion
Incorporating ESG metrics into financial benchmarking equips accountants and financial analysts with a comprehensive toolset to evaluate company performance beyond traditional financial indicators. This integration supports better decision-making, risk management, and value creation aligned with sustainable business practices.
10.5 Future Trends: Automation and AI in Financial Benchmarking
Financial benchmarking is rapidly evolving with the integration of automation and artificial intelligence (AI). These technologies are transforming how accountants and financial analysts collect data, analyze performance, and generate actionable insights. This section explores the future trends in automation and AI within financial benchmarking, supported by mind maps and practical examples.
The Role of Automation in Financial Benchmarking
Automation streamlines repetitive and time-consuming tasks, enabling finance professionals to focus on strategic analysis. Key automation applications include:
- Data Collection & Integration: Automatically gathering financial data from multiple sources such as ERP systems, accounting software, and market databases.
- Data Cleaning & Normalization: Using automated scripts to detect anomalies, correct errors, and standardize data for accurate comparisons.
- Report Generation: Auto-creating benchmarking reports and dashboards with up-to-date metrics.
Example: A mid-sized manufacturing company uses an automated data pipeline that extracts monthly financial statements from their ERP, cleans the data, and updates benchmarking dashboards in real time. This reduces manual effort by 70% and accelerates decision-making.
AI-Powered Financial Benchmarking: Capabilities and Benefits
AI enhances benchmarking by enabling deeper insights through advanced analytics, pattern recognition, and predictive modeling.
- Machine Learning for Pattern Detection: AI algorithms identify trends and anomalies in financial ratios that may not be obvious through traditional analysis.
- Predictive Benchmarking: Forecasting future performance benchmarks based on historical data and market conditions.
- Natural Language Processing (NLP): Automating the interpretation of qualitative data such as earnings call transcripts or market news to complement quantitative benchmarks.
- Anomaly Detection: AI flags unusual financial results that warrant further investigation.
Example: A financial analyst uses an AI-driven benchmarking tool that predicts next quarter’s profitability benchmarks for retail clients by analyzing past financials, competitor data, and economic indicators. The tool also highlights outliers, helping the analyst prioritize focus areas.
Mind Map: Automation and AI in Financial Benchmarking
Practical Applications and Use Cases
-
Real-Time Benchmarking Dashboards: Automation combined with AI enables continuous benchmarking with live data feeds. Accountants can monitor KPIs such as liquidity ratios or cost efficiency in real time and receive AI-generated insights or warnings.
-
Scenario Analysis and Forecasting: AI models simulate different financial scenarios, helping organizations understand how changes in market conditions or internal operations might affect their benchmark standings.
-
Cross-Industry Benchmarking: AI can normalize and compare financial data across industries with differing accounting standards, currencies, and regulatory environments, providing a broader perspective.
-
Fraud Detection and Compliance: Anomaly detection algorithms flag suspicious financial patterns during benchmarking, supporting compliance and audit functions.
Example: A multinational corporation employs an AI-powered benchmarking platform that integrates data from subsidiaries worldwide. The system normalizes currency fluctuations and regulatory differences, providing executives with a unified view of financial performance against global peers.
Challenges and Considerations
- Data Privacy and Security: Automation and AI require access to sensitive financial data, necessitating robust security protocols.
- Model Transparency: Understanding AI decision-making processes is critical for trust and regulatory compliance.
- Skill Requirements: Finance teams need training to effectively use and interpret AI-driven benchmarking tools.
Summary
Automation and AI are set to revolutionize financial benchmarking by enhancing data accuracy, accelerating analysis, and uncovering deeper insights. Accountants and financial analysts who embrace these technologies will be better equipped to drive strategic decisions and maintain competitive advantage.
Additional Mind Map: Benefits vs Challenges

11. Developing a Benchmarking Culture within Finance Teams
11.1 Training and Skill Development for Benchmarking Competency
Financial benchmarking is a critical skill for accountants and financial analysts aiming to drive performance improvements and strategic decision-making. Developing competency in benchmarking requires a structured approach to training and skill enhancement. This section explores key training areas, practical examples, and mind maps to guide learning.
Key Training Areas for Benchmarking Competency
-
Understanding Financial Metrics and Ratios
- Learn how to calculate and interpret key financial ratios.
- Example: Training on calculating liquidity ratios like Current Ratio and Quick Ratio using real company data.
-
Data Collection and Validation Techniques
- Techniques to gather accurate, relevant financial data.
- Example: Workshop on validating data from ERP systems and external databases.
-
Analytical Skills Development
- Enhancing ability to analyze benchmarking results and identify performance gaps.
- Example: Case study analysis on identifying root causes of low profitability.
-
Use of Benchmarking Tools and Software
- Hands-on training with Excel models, BI tools, and specialized benchmarking platforms.
- Example: Guided session on using Power BI to visualize benchmarking data.
-
Communication and Reporting Skills
- Training on how to present benchmarking insights effectively to stakeholders.
- Example: Role-playing exercise presenting benchmarking findings to a CFO.
-
Continuous Learning and Industry Updates
- Encouraging participation in webinars, certifications, and industry forums.
- Example: Enrolling in a Certified Management Accountant (CMA) course module on performance measurement.
Mind Map: Core Competencies for Financial Benchmarking Training
Mind Map: Training Program Structure for Benchmarking Skills
Practical Example: Training Session on Liquidity Ratios
Objective: Equip accountants with the ability to calculate and benchmark liquidity ratios.
Step 1: Provide financial statements of two companies in the same industry.
Step 2: Guide participants to calculate Current Ratio and Quick Ratio.
Step 3: Compare results against industry benchmarks.
Step 4: Discuss implications of the findings on company liquidity and operational efficiency.
Outcome: Participants understand how to apply liquidity ratios in benchmarking and interpret results to inform financial decisions.
Practical Example: Using Power BI for Benchmarking Visualization
Objective: Develop skills in visualizing benchmarking data for clear insights.
Step 1: Import financial benchmarking data into Power BI.
Step 2: Create visualizations such as bar charts for profitability ratios and line charts for trend analysis.
Step 3: Build interactive dashboards to filter data by period, company, or metric.
Step 4: Present dashboards to peers and gather feedback.
Outcome: Participants gain hands-on experience with BI tools, enhancing their ability to communicate benchmarking results effectively.
Tips for Effective Skill Development
- Encourage cross-functional learning by involving finance, accounting, and operations teams.
- Use real company data where possible to increase relevance.
- Incorporate quizzes and interactive exercises to reinforce learning.
- Provide access to online resources and communities for ongoing support.
- Schedule regular refresher sessions to keep skills updated.
By investing in structured training and skill development, finance professionals can build strong benchmarking competencies that empower them to deliver actionable insights and drive organizational performance.
11.2 Encouraging Data-Driven Decision Making
Data-driven decision making (DDDM) is a critical best practice for accountants and financial analysts aiming to enhance accuracy, transparency, and strategic impact within their organizations. Encouraging a data-driven culture involves fostering an environment where decisions are consistently supported by reliable data and insightful analysis rather than intuition or anecdotal evidence.
Why Encourage Data-Driven Decision Making?
- Improves Accuracy: Reduces errors caused by assumptions or biases.
- Enhances Transparency: Provides clear rationale behind financial decisions.
- Supports Strategic Planning: Enables forecasting and scenario analysis based on real data.
- Increases Accountability: Data-backed decisions can be tracked and evaluated.
Mind Map: Components of Data-Driven Decision Making
Best Practices to Encourage Data-Driven Decision Making
-
Leadership Advocacy:
- Leaders must champion the use of data in financial decisions.
- Example: CFO regularly shares benchmarking insights during monthly financial reviews to highlight data’s role.
-
Accessible Data Infrastructure:
- Provide easy access to clean, organized financial data.
- Example: Implement a centralized financial dashboard that updates in real-time.
-
Training and Skill Building:
- Offer workshops on data literacy, financial modeling, and analytics tools.
- Example: Quarterly training sessions on Excel advanced functions and Power BI for financial teams.
-
Standardized Reporting and KPIs:
- Define clear metrics aligned with business goals.
- Example: Use standardized profitability and liquidity ratios across departments for consistent benchmarking.
-
Encourage Collaborative Analysis:
- Promote cross-functional teams to interpret data and validate assumptions.
- Example: Finance and operations jointly review cost variance reports to identify root causes.
-
Celebrate Data-Driven Wins:
- Recognize teams or individuals who successfully use data to improve outcomes.
- Example: Award program for best data-driven cost-saving initiative.
Example Scenario: Transitioning to Data-Driven Budgeting
Context: A mid-sized manufacturing company traditionally uses last year’s budget plus a fixed percentage increase.
Data-Driven Approach:
- Collect historical financial data and benchmark against industry peers.
- Analyze cost drivers and revenue trends using time-series analysis.
- Use predictive analytics to forecast sales under different scenarios.
- Present findings in a dashboard highlighting key variances and risks.
Outcome:
- More accurate budgets aligned with market conditions.
- Identified unnecessary expenses leading to 5% cost reduction.
- Enhanced stakeholder confidence due to transparent, data-backed assumptions.
Mind Map: Steps to Foster a Data-Driven Culture in Finance Teams
By embedding these practices and mindsets into daily workflows, accountants and financial analysts can transform their organizations into truly data-driven entities, improving decision quality and driving sustainable financial performance.
11.3 Establishing Benchmarking KPIs and Incentives
Establishing clear Key Performance Indicators (KPIs) and incentives is a critical step in embedding financial benchmarking into the culture of finance teams. KPIs help quantify progress and success, while incentives motivate team members to actively participate and strive for continuous improvement.
Understanding Benchmarking KPIs
Benchmarking KPIs are specific, measurable financial and operational metrics that reflect how well an organization is performing relative to its peers or internal targets. These KPIs should align with the company’s strategic goals and provide actionable insights.
Key characteristics of effective benchmarking KPIs:
- Relevant: Directly tied to business objectives and benchmarking outcomes.
- Measurable: Quantifiable with clear data sources.
- Achievable: Realistic targets based on benchmarking data.
- Time-bound: Defined periods for evaluation.
Mind Map: Establishing Benchmarking KPIs
Examples of Benchmarking KPIs for Finance Teams
| KPI Name | Description | Example Target | Benchmark Source |
|---|---|---|---|
| Operating Margin | Measures operating efficiency | 15% (industry average 14%) | Industry financial reports |
| Days Sales Outstanding (DSO) | Average time to collect receivables | 30 days (benchmark 28 days) | Peer company data |
| Return on Equity (ROE) | Profitability relative to shareholder equity | 12% (industry benchmark 10%) | Published sector benchmarks |
| Cost per Invoice Processed | Efficiency metric for accounts payable process | $3.50 per invoice (benchmark $4.00) | Internal historical data |
Designing Incentives to Drive Benchmarking Success
Incentives encourage finance professionals to engage with benchmarking activities and use insights to improve performance. Incentives can be monetary or non-monetary and should be aligned with the KPIs.
Types of Incentives:
- Monetary Bonuses: Linked to achieving or exceeding benchmarking targets.
- Recognition Programs: Awards, shout-outs, or certificates for top performers.
- Professional Development: Opportunities for training or conferences.
- Team-Based Rewards: Encourages collaboration and shared goals.
Mind Map: Incentive Structures for Benchmarking
Example: Implementing KPIs and Incentives in a Finance Team
Scenario: A mid-sized manufacturing company wants to improve its accounts receivable performance using benchmarking.
- Set KPI: Reduce Days Sales Outstanding (DSO) from 40 days to 30 days, matching industry benchmarks.
- Communicate Target: Share benchmarking data and explain the importance of DSO reduction.
- Incentive Plan: Offer a quarterly bonus to the accounts receivable team if average DSO falls below 32 days.
- Recognition: Monthly shout-outs for individuals who collect the highest percentage of overdue invoices.
- Monitor Progress: Use dashboards to track DSO weekly and provide feedback.
Outcome: The team is motivated by clear targets and rewards, resulting in a DSO reduction to 29 days within six months.
Tips for Successful KPI and Incentive Implementation
- Ensure Transparency: Clearly communicate how KPIs are measured and how incentives are awarded.
- Align with Company Goals: KPIs and incentives should support broader financial and strategic objectives.
- Keep It Simple: Avoid overly complex KPIs that are hard to track or understand.
- Regularly Review: Adjust KPIs and incentives based on evolving business needs and benchmarking results.
- Encourage Collaboration: Design incentives that promote teamwork rather than competition.
By thoughtfully establishing benchmarking KPIs and aligning them with meaningful incentives, finance teams can foster a culture of continuous improvement and data-driven decision-making that drives superior financial performance.
11.4 Collaboration Between Accounting, Finance, and Operations
Effective financial benchmarking requires seamless collaboration between accounting, finance, and operations teams. Each department brings unique insights and data that, when integrated, provide a holistic view of organizational performance. This collaboration ensures that benchmarking results are accurate, actionable, and aligned with operational realities.
Why Collaboration Matters
- Accounting provides precise historical financial data and ensures compliance.
- Finance analyzes data to forecast, budget, and strategize.
- Operations offers insights into day-to-day processes, resource utilization, and efficiency.
Together, these teams can identify performance gaps, validate assumptions, and implement improvements based on benchmarking results.
Mind Map: Key Collaboration Areas
Best Practices for Collaboration
-
Establish Clear Communication Channels
- Regular cross-departmental meetings (weekly or monthly).
- Shared digital platforms (e.g., collaborative dashboards, cloud spreadsheets).
-
Define Roles and Responsibilities
- Accounting ensures data accuracy and compliance.
- Finance leads analysis and interpretation.
- Operations validates findings against real-world processes.
-
Create Integrated Benchmarking Dashboards
- Combine financial metrics with operational KPIs.
- Enable real-time data updates accessible to all teams.
-
Use Joint Workshops for Root Cause Analysis
- Facilitate brainstorming sessions when variances or performance gaps appear.
-
Align Goals and Incentives
- Set shared objectives that encourage collaboration rather than siloed performance.
Example: Collaborative Benchmarking in a Manufacturing Company
Scenario: A manufacturing firm notices its operating margin is below industry benchmarks.
- Accounting provides detailed cost breakdowns, highlighting rising raw material expenses.
- Finance analyzes margin trends and projects future impacts.
- Operations investigates production inefficiencies and supplier performance.
Collaboration Outcome:
- Operations identifies a bottleneck causing overtime labor costs.
- Finance models cost-saving scenarios by optimizing shift schedules.
- Accounting verifies the financial impact of proposed changes.
Together, they implement process improvements that reduce costs, improving the operating margin closer to benchmark levels.
Mind Map: Collaborative Problem Solving Workflow
Tips for Accountants and Financial Analysts
- Engage operations early in the benchmarking process to understand contextual factors.
- Use visual tools like flowcharts and dashboards to bridge communication gaps.
- Promote a culture of transparency and shared accountability.
- Document assumptions and decisions collaboratively to maintain clarity.
By fostering strong collaboration between accounting, finance, and operations, organizations can leverage financial benchmarking not just as a reporting tool but as a driver of continuous operational and financial improvement.
11.5 Example: Building a Benchmarking Dashboard for Continuous Monitoring
A benchmarking dashboard is an essential tool for accountants and financial analysts to continuously monitor financial performance against key benchmarks. It consolidates data, visualizes trends, and highlights areas requiring attention, enabling proactive decision-making.
Step 1: Define the Purpose and Key Metrics
Before building the dashboard, clearly define what you want to monitor. Typical purposes include tracking profitability, liquidity, efficiency, and leverage against industry benchmarks.
Key Metrics to Include:
- Gross Profit Margin
- Operating Margin
- Current Ratio
- Debt to Equity Ratio
- Inventory Turnover
- Earnings Per Share (EPS)
Step 2: Data Collection and Integration
Gather financial data from internal accounting systems and external benchmark sources (industry reports, financial databases).
Ensure data is:
- Accurate
- Timely
- Comparable (normalized for size, currency, accounting standards)
Step 3: Dashboard Design and Layout
Design the dashboard to be intuitive and actionable. Use a mix of charts, tables, and color-coded indicators.
Example Layout Mind Map:
Step 4: Visualization Best Practices
- Use color coding to indicate performance: green (meets/exceeds benchmark), yellow (near benchmark), red (below benchmark).
- Include trend lines to show progress over time.
- Use interactive filters to view data by period, business unit, or region.
Step 5: Example Dashboard Walkthrough
Imagine a mid-sized manufacturing company wants to monitor its financial health against industry peers.
- Gross Profit Margin: Current value 38%, industry benchmark 35% → Green indicator.
- Current Ratio: Company at 1.2, benchmark 1.5 → Yellow indicator, signaling liquidity improvement needed.
- Debt to Equity Ratio: Company at 0.8, benchmark 0.6 → Red indicator, prompting review of leverage.
The dashboard highlights these insights immediately, allowing the finance team to prioritize actions.
Step 6: Continuous Monitoring and Updates
- Automate data refreshes monthly or quarterly.
- Set alerts for metrics that deviate beyond thresholds.
- Regularly review and update benchmarks to reflect market changes.
Mind Map: Continuous Benchmarking Monitoring Cycle
Additional Example: Using Excel to Build a Simple Benchmarking Dashboard
- Data Sheet: Input company financials and benchmark data side-by-side.
- Calculation Sheet: Compute ratios and variance percentages.
- Dashboard Sheet: Use Excel charts (gauges, bar charts, sparklines) linked to calculations.
- Conditional Formatting: Apply color scales to highlight performance.
- Slicers/Filters: Enable filtering by time periods or departments.
This approach is accessible for many accounting teams without advanced BI tools.
Summary
Building a benchmarking dashboard empowers finance professionals to maintain continuous oversight of financial performance relative to industry standards. By combining clear objectives, accurate data, effective visualization, and regular updates, the dashboard becomes a vital tool for driving financial excellence and informed decision-making.
12. Conclusion and Next Steps
12.1 Recap of Key Benchmarking Concepts and Best Practices
Financial benchmarking is a critical tool for accountants and financial analysts to measure performance, identify gaps, and drive continuous improvement. This section revisits the core concepts and best practices discussed throughout the blog, reinforced with mind maps and practical examples.
Mind Map: Core Financial Benchmarking Concepts
Key Concepts Recap
-
Purpose of Financial Benchmarking:
- To evaluate financial health and operational efficiency by comparing key financial metrics against peers or historical data.
- Example: A mid-sized manufacturing company compares its operating margin to industry averages to identify cost-saving opportunities.
-
Types of Benchmarking:
- Internal: Comparing divisions or periods within the same company.
- External: Comparing against competitors or industry standards.
- Example: An accounting firm benchmarks its client billing rates internally across offices, then externally against industry averages.
-
Critical Financial Metrics:
- Profitability Ratios (e.g., Net Margin)
- Liquidity Ratios (e.g., Current Ratio)
- Efficiency Ratios (e.g., Inventory Turnover)
- Leverage Ratios (e.g., Debt to Equity)
- Market Value Ratios (e.g., P/E Ratio)
-
Benchmarking Methodologies:
- Quantitative approaches focus on numerical data.
- Qualitative approaches assess processes and strategies.
- Time-series benchmarking tracks performance over time.
- Cross-sectional benchmarking compares across companies or units.
-
Tools and Technologies:
- Spreadsheets remain foundational for calculations and visualization.
- Business Intelligence (BI) tools enable dynamic dashboards and real-time insights.
- ERP systems integration facilitates seamless data flow.
-
Best Practices:
- Ensure data accuracy and consistency to maintain credibility.
- Select relevant and comparable peers to avoid misleading conclusions.
- Combine financial and non-financial metrics for a holistic view.
- Use benchmarking as part of a continuous improvement cycle rather than a one-time exercise.
Mind Map: Best Practices in Financial Benchmarking
Practical Example: Applying Best Practices
A financial analyst at a retail company wants to benchmark inventory turnover against competitors.
- Step 1: Collect accurate inventory and sales data from internal ERP systems.
- Step 2: Select peers of similar size and market focus within the retail sector.
- Step 3: Calculate inventory turnover ratio (Cost of Goods Sold / Average Inventory).
- Step 4: Compare results and identify that the company’s turnover is 15% lower than peers.
- Step 5: Conduct root cause analysis revealing slower stock movement in certain product categories.
- Step 6: Present findings with clear visuals to management, recommending targeted inventory management improvements.
- Step 7: Set up quarterly benchmarking reviews to track progress.
Summary
Financial benchmarking empowers accountants and financial analysts to make informed, data-driven decisions. By mastering key concepts, applying best practices, and leveraging appropriate tools, professionals can unlock valuable insights that drive organizational success.
Remember, effective benchmarking is an ongoing process—commitment to accuracy, relevance, and continuous refinement is essential for sustained impact.
12.2 Creating an Action Plan for Implementing Benchmarking
Implementing financial benchmarking effectively requires a well-structured action plan. This ensures that the process is systematic, measurable, and aligned with your organization’s goals. Below, we outline a step-by-step approach to creating an actionable benchmarking plan, complemented by mind maps and practical examples.
Step 1: Define Clear Objectives
Start by identifying what you want to achieve with benchmarking. Objectives should be specific, measurable, achievable, relevant, and time-bound (SMART).
Example:
- Improve gross margin by 5% within 12 months by identifying cost inefficiencies compared to industry peers.
Mind Map:
Step 2: Select Benchmarking Metrics and Peers
Choose relevant financial metrics that align with your objectives. Select benchmarking peers that are comparable in size, industry, and geography.
Example:
- Metrics: Operating margin, current ratio, inventory turnover
- Peers: Top 5 competitors in the mid-market retail sector
Mind Map:
Step 3: Collect and Validate Data
Gather financial data from internal systems and external sources. Ensure data accuracy and consistency for meaningful comparisons.
Example:
- Internal: ERP system financial reports
- External: Industry reports, public filings
Mind Map:
Step 4: Analyze and Interpret Results
Calculate benchmarking metrics and compare against peers. Identify performance gaps and root causes.
Example:
- Finding: Inventory turnover is 20% lower than industry average
- Root cause: Inefficient stock management processes
Mind Map:
Step 5: Develop Improvement Initiatives
Based on insights, design targeted initiatives to close performance gaps.
Example:
- Initiative: Implement just-in-time inventory system to improve turnover
Mind Map:
Step 6: Implement and Monitor Progress
Execute initiatives and track progress against benchmarks regularly.
Example:
- Monthly review meetings to assess inventory turnover improvements
Mind Map:
Step 7: Review and Refine Benchmarking Process
Continuously improve the benchmarking approach based on lessons learned.
Example:
- Incorporate new financial metrics or peers based on evolving business needs
Mind Map:
Comprehensive Mind Map: Action Plan Overview
Practical Example: Implementing a Benchmarking Action Plan for a Mid-Sized Manufacturing Firm
Objective: Improve operating margin by 3% within 9 months.
- Define Objectives: Target operating margin improvement tied to cost control.
- Select Metrics & Peers: Operating margin, cost of goods sold percentage; peers are similar-sized manufacturers in the region.
- Data Collection: Extract financials from ERP; gather industry data from trade associations.
- Analyze: Identify that raw material costs are 10% higher than peers.
- Develop Initiatives: Negotiate supplier contracts and optimize procurement.
- Implement & Monitor: Monthly cost reviews; track margin improvements.
- Review: Adjust procurement strategies based on results; explore additional benchmarks like labor efficiency.
This structured approach ensures benchmarking is actionable, measurable, and drives continuous financial performance improvement.
12.3 Resources for Ongoing Learning and Benchmarking Updates
Financial benchmarking is a dynamic field that evolves with changes in industry standards, technology, and regulatory environments. To stay ahead and continuously improve your benchmarking practices, it’s essential to leverage a variety of resources for ongoing learning and updates.
Professional Organizations and Industry Bodies
Joining professional organizations provides access to the latest research, webinars, conferences, and benchmarking reports.
- Examples:
- AICPA (American Institute of CPAs): Offers benchmarking guides and continuing professional education (CPE) courses.
- CFA Institute: Provides resources on financial analysis and benchmarking best practices.
- IMA (Institute of Management Accountants): Focuses on management accounting and benchmarking techniques.
Online Learning Platforms
Continuous education through online courses helps sharpen skills and stay updated on new benchmarking tools and methodologies.
- Examples:
- Coursera: Courses like “Financial Analysis and Decision Making” and “Data-Driven Decision Making”.
- LinkedIn Learning: Tutorials on Excel for financial modeling and benchmarking.
- edX: Financial accounting and corporate finance courses from top universities.
Benchmarking Software and Tools Updates
Regularly updating and exploring new features in benchmarking software ensures you utilize the latest technology.
- Examples:
- Tableau and Power BI: Follow their blogs and release notes for new analytics features.
- Adaptive Insights: Updates on FP&A benchmarking capabilities.
- QuickBooks and Xero: For small business financial benchmarking features.
Industry Reports and Publications
Reading industry-specific benchmarking reports helps contextualize your data and compare against relevant peers.
- Examples:
- Deloitte’s CFO Survey: Insights on financial performance benchmarks.
- PwC’s Financial Benchmarking Reports: Sector-specific financial metrics.
- S&P Global Market Intelligence: Comprehensive financial data and benchmarking analytics.
Financial and Accounting Blogs and Forums
Engaging with community discussions and expert blogs can provide practical tips and real-world examples.
- Examples:
- Accounting Today: Articles on benchmarking trends.
- The Finance Storyteller: Practical insights on financial analysis.
- Reddit r/Accounting and r/FinancialAnalysis: Peer discussions and Q&A.
Mind Map: Resources for Ongoing Learning and Benchmarking Updates
Books and Reference Materials
Classic and contemporary books offer deep dives into benchmarking theory and application.
- Examples:
- Financial Statement Analysis and Security Valuation by Stephen Penman
- Benchmarking: A Signpost to Excellence in Quality and Productivity by Robert C. Camp
- Financial Analysis and Modeling Using Excel and VBA by Chandan Sengupta
Webinars and Conferences
Participating in live events allows interaction with experts and networking with peers.
- Examples:
- AFP Annual Conference: Focus on treasury and finance benchmarking.
- Gartner Finance Symposium: Emerging trends in financial analytics.
- Webinars by Financial Benchmarking Firms: Regular sessions on best practices.
Example: Creating a Personal Learning Plan for Benchmarking
- Subscribe to newsletters from AICPA and PwC to receive monthly benchmarking updates.
- Enroll in a Coursera course on financial analysis every quarter.
- Set up alerts for software updates on Tableau and Power BI.
- Join LinkedIn groups focused on financial benchmarking and participate in discussions.
- Attend at least one industry conference annually to network and learn.
By systematically leveraging these resources, accountants and financial analysts can maintain a cutting-edge understanding of financial benchmarking, ensuring their analyses remain relevant, accurate, and insightful.
12.4 Final Example: Roadmap for a Successful Benchmarking Initiative
Implementing a successful financial benchmarking initiative requires a structured approach that aligns with your organization’s goals, ensures data accuracy, and drives actionable insights. Below is a detailed roadmap, complete with mind maps and practical examples, to guide accountants and financial analysts through this process.
Step 1: Define Objectives and Scope
- Identify the purpose: Are you benchmarking profitability, liquidity, efficiency, or a combination?
- Set clear goals: For example, “Improve operating margin by 5% within 12 months.”
- Determine scope: Internal benchmarking (against past performance) or external (against industry peers).
Example: A mid-sized manufacturing firm wants to benchmark its operating margin against industry leaders to identify cost-saving opportunities.
Step 2: Identify and Collect Relevant Data
- Select financial metrics: Choose key ratios like Gross Margin, Current Ratio, Debt to Equity.
- Gather data sources: Internal financial statements, industry reports, public databases.
- Ensure data quality: Validate accuracy and consistency.

Example: The accounting team collects the last three years of financial statements and subscribes to an industry benchmarking database for peer comparison.
Step 3: Select Benchmarking Peers
- Choose relevant companies: Similar size, industry, geography.
- **Consider financial health and business model.
- **Use published benchmarks if direct peers unavailable.
Example: The firm selects five competitors with similar revenue and market presence in the same region.
Step 4: Analyze and Normalize Data
- Normalize for comparability: Adjust for accounting differences, currency, seasonality.
- **Calculate ratios and metrics.
- **Identify performance gaps.
Example: Adjust inventory turnover ratios to account for different fiscal year-ends among peers.
Step 5: Interpret Results and Identify Improvement Areas
- Contextualize findings: Understand industry trends and company strategy.
- **Prioritize gaps based on impact and feasibility.
- **Develop actionable recommendations.
Example: The firm discovers its operating margin lags due to higher raw material costs and prioritizes supplier renegotiations.
Step 6: Communicate Findings and Implement Changes
- **Prepare clear reports and presentations.
- **Engage stakeholders: CFO, operations, procurement.
- **Set timelines and responsibilities.
Example: A dashboard highlighting key benchmarking metrics is shared with the executive team, and a cross-functional task force is created.
Step 7: Monitor Progress and Refine Benchmarking
- **Establish KPIs for ongoing tracking.
- **Schedule regular benchmarking reviews.
- **Adjust approach based on feedback and changing conditions.
Example: Quarterly reviews reveal improvement in operating margin; the team expands benchmarking to include customer satisfaction metrics.
Summary Mind Map: Roadmap Overview
Final Thoughts
A successful benchmarking initiative is iterative and collaborative. By following this roadmap, accountants and financial analysts can ensure their benchmarking efforts lead to meaningful insights and measurable improvements.
Additional Example: Quick Snapshot
| Step | Action | Example Outcome |
|---|---|---|
| Define Objectives & Scope | Improve liquidity ratios | Target current ratio > 1.5 |
| Data Collection | Gather last 2 years’ balance sheets | Accurate, comparable data |
| Select Peers | Choose 3 competitors in same sector | Relevant benchmarks |
| Analyze & Normalize | Adjust for currency differences | Comparable ratios |
| Interpret Results | Identify low quick ratio | Focus on receivables management |
| Communicate & Implement | Present to finance & operations teams | Action plan for collections improvement |
| Monitor & Refine | Monthly KPI tracking | Steady improvement in liquidity |
This example illustrates how a focused benchmarking initiative can drive targeted financial improvements.